biomass reaction operations on metabolic models: an …€¦ · · 2013-12-08biomass reaction...
TRANSCRIPT
Biomass Reaction Operations On Metabolic Models: an
application to aid the curation of genome-scale metabolic
models.
V. Fairclough & Dr J. W. Pinney
Theoretical Systems Biology group, Imperial College London
December 8, 2013
Contents
1 Overview 2
1.1 Introduction to BROOMM . . . . . . . . . . . . . . . . . . . . . . . . . . . 2
1.2 Functionality and uses . . . . . . . . . . . . . . . . . . . . . . . . . . . . . . 2
2 Installation 4
3 Using the application 6
3.1 Overview . . . . . . . . . . . . . . . . . . . . . . . . . . . . . . . . . . . . . 6
3.2 User input . . . . . . . . . . . . . . . . . . . . . . . . . . . . . . . . . . . . . 10
3.2.1 Transfer mode . . . . . . . . . . . . . . . . . . . . . . . . . . . . . . 10
3.2.2 Edit mode . . . . . . . . . . . . . . . . . . . . . . . . . . . . . . . . . 11
3.3 Output . . . . . . . . . . . . . . . . . . . . . . . . . . . . . . . . . . . . . . 12
4 Example 13
4.1 Setting up . . . . . . . . . . . . . . . . . . . . . . . . . . . . . . . . . . . . . 13
4.2 Transfer mode . . . . . . . . . . . . . . . . . . . . . . . . . . . . . . . . . . 15
4.3 Edit mode . . . . . . . . . . . . . . . . . . . . . . . . . . . . . . . . . . . . . 18
4.4 Gene essentiality assessment and flux balance analysis . . . . . . . . . . . . 19
4.4.1 Defining the growth medium . . . . . . . . . . . . . . . . . . . . . . 19
4.4.2 Cull metabolites blocking flux . . . . . . . . . . . . . . . . . . . . . . 20
4.5 Results . . . . . . . . . . . . . . . . . . . . . . . . . . . . . . . . . . . . . . . 21
4.6 Conclusion . . . . . . . . . . . . . . . . . . . . . . . . . . . . . . . . . . . . 21
1

Chapter 1
Overview
1.1 Introduction to BROOMM
Genome-scale metabolic models can now be generated semi-automatically using informa-tion in certain online databases, such as KEGG, Model SEED and MetaCyc [1, 2, 3, 4].However, they contain only a generic biomass reaction with incorrect stoichiometries (dis-cussed further in chapter 4), which causes quantitative analyses of them to be inaccurate.Therefore, the user must curate this reaction, based on current knowledge of the cell typebeing modelled. This process of curating metabolic models is time consuming [5] and chal-lenging because of the inevitable errors that are often introduced when manually editingfiles in XML format. The key motivation for developing the application is to allow expertsin the field of molecular and cellular biology to curate existing metabolic models with-out needing to directly access the XML files. Biomass Reaction Operations on MetabolicModels (BROOMM) is a desktop application providing a graphical user interface that al-lows easy curation of biomass reactions within genome-scale metabolic models. By aidingcollaboration between systems biologists and wet-lab scientists, we hope that this softwarewill allow the development of more accurate genome-scale metabolic models.
The application has been implemented entirely in Python and requires the installationof the libSBML, wxPython, NumPy and matplotlib packages [6, 7, 8, 9, 10]. libSBMLwas used for parsing the XML files and manipulating the models, wxPython was used tocreate the graphical user interface and matplotlib and NumPy were used to generate thegraphics.
1.2 Functionality and uses
The software application carries out two main functions, referred to as the Transfer modeand Edit mode.
2
Transfer mode
This mode allows the user to transfer information from a curated model (henceforth re-ferred to as the template model) to the model being curated (henceforth referred toas the target model). The template model should be a curated model of a cell that isexpected to have a similar biomass composition to that of the target model (e.g. a closelyrelated cell).
It is highly unlikely that the biomass reaction of the target cell will be exactly the sameas that of the template cell; therefore, the user has the option to select specific subsets ofmetabolites to transfer from the template biomass reaction. The process of transferringmetabolite information from the template model to the target model is helped by organ-ising the reactants into seven different categories (Protein, Carbohydrates, Lipids, Nu-cleic acids, Inorganic ions, Growth-associated maintenance/Non-growth-associated main-tenance (GAM/NGAM) and Other) according to the ChEBI ontology for classification ofchemical entities [11]. The broad composition of each biomass reaction (template andtarget reactions) can be compared by referring to stacked bar plots (biomass compo-sition diagrams) that were produced to show the relative contribution of each of thesecategories to the biomass.
Edit mode
This mode allows the user to edit the stoichiometries of metabolites within the biomassreaction of their target model. It should be noted that the user cannot add metabolites tothe reaction, unlike in the transfer mode. The broad composition of each biomass reaction(template and target reactions) can be compared by referring to their stacked barplots, as in the transfer mode.
Summary of terminology
Target model – the model requiring curation.Target (biomass) reaction – the selected biomass reaction within the target model.Template model – a curated model with an accurate biomass reaction.Template (biomass) reaction – the selected biomass reaction within the templatemodel.ID type – the ID type used to specify metabolites within the model (KEGG, Model SEEDor Other).Biomass composition diagram – stacked bar plots produced to show the relative masscontributions of the seven ChEBI metabolite categories to the biomass.
3
Chapter 2
Installation
The BROOMM software can be downloaded from www.theosysbio.bio.ac.uk/broomm. Itscontents should be extracted in the location desired by the user. Formal installation isnot required – the program is run without installation from the command line (see section3.1 for more information).
All of the required Python packages must be installed in order for the software to function.All packages used are shown in table 2.1
Non-standard requirements: libSBML, wxPython, NumPy, matplotlib
BROOMM has been tested and works with the following versions on the following plat-forms:
• Linux: Python v2.7.2, libSBML v5.0.0, wxPython v2.8.10.1, NumPy v1.6.1, mat-plotlib v1.1.0 on the Linux system.
• Microsoft Windows: Enthought distribution of Python (Enthought Canopy v1.1.0.1371)which also contains the Numpy library. This was used alongside libSBML v5.9.0 forWindows, matplotlib v1.3.1 for Windows and wxPython v2.8 for Windows.
4

Table 2.1: Summaries of the packages used to implement the graphical user interface.
Package Contribution to GUI functionality
libSBML Used for parsing the XML files, manipulating the models andsaving them.
wxPython Used to create the graphical user interface.
matplotlib Used to generate the mass distribution graphics.
os Used for file navigation.
re Used for identifying database IDs using regular expressions basedupon ID formats.
NumPy Used in the production of the mass distribution graphics.
5

Chapter 3
Using the application
3.1 Overview
Running the software
The program is run from the command line; the user must navigate via the command lineto the expanded BROOMM directory and then to the ‘src’ directory contained within it.Once within the ‘src’ directory, the following command should be entered to open anddisplay the graphical user interface:
python broomm.py
Selecting the Transfer or Edit mode
Once the window has opened, the user should select the ‘Tabs’ button in the menu barand then select either the Transfer or Edit option.
Loading the models
Each input file (.xml file) must contain only one metabolic model and its contents mustfollow the standard formatting required for SBML files. To load a model file in BROOMM,click on the button provided to select the file using a pop-up file navigation window.
6

Selecting format of metabolite IDs
The ID type used within the model must be selected (i.e. KEGG IDs, Model SEED IDs orOther). When using models that use non-standard IDs (i.e. Other, not KEGG or ModelSEED IDs), the user must supply a tab-delimited flat file for converting the model IDsto ChEBI IDs. The files must be formatted in two columns separated by a single tab, asfollows:
ModelID1 ChEBI
ID2 01234
ID3 12345
ID4 23456
... ...
The tab-delimited flat-files must be saved under the following names:
• other id type Template.txt Conversion file for ‘Template’ model (Transfermode only)
• other id type Target.txt Conversion file for ‘Target’ model (Transfer andEdit mode)
An example ID conversion file can be found in the \example file provided with the softwarewith the filename other id type Template example.txt.
Selecting and displaying reaction information
Once the model is loaded, the reaction IDs are parsed from the model and displayed withina list box where the user can select the biomass reaction. Alternatively, they can type itinto the text control box provided. The user must verify this selection using the selectbutton provided.
Reactant categories
The reactants of the biomass reaction are classified according to the ChEBI ontology andare assigned to one of the seven groups described in section 1.2 above. This is done byutilising the ChEBI ontology flat files to classify the reactants according to their ‘ancestors’and/or ‘descendants’ within the hierarchical classification system.
Reactants within a given category may be visualised by selecting the relevant button on theleft hand side of the panel. A new window is displayed showing the following information:
• Model IDs – metabolite IDs, as seen within the model
• ChEBI IDs – ChEBI IDs, identified by using an ID conversion dictionary (see below)
• Metabolite name – metabolite names from within the model
• Stoichiometry – The metabolite stoichiometries within the selected reaction.
• The template model within the transfer mode will also contain a column of tickboxes to allow the user to select which metabolites should be transferred from thetemplate to the target model.
7
Biomass composition diagram
A stacked bar plot is used to show the composition of biomass according to the relativemasses of the ChEBI categories (e.g. Proteins, Carbohydrates). This diagram is updatedwhenever any changes are made or a new reaction is selected. An example can be seen infigure 4.1.
Converting IDs
ID conversion dictionaries taken from BioDB are included and used within the software tomatch up the ID types within the template and target models [12]. Conversion dictionariesare included for the standard IDs (KEGG, Model SEED and ChEBI).
Saving the output
Once the user has finished editing/altering a target model, the altered model can be savedto a new file in XML format by selecting the ‘Save altered model’ button in the bottomright hand side of the screen. This brings up a pop-up file navigation window for savingthe file with a filename of their choice. Note that the filename must also include the ‘.xml’file extension.
Creating a new reaction (Transfer mode only)
If the target model does not already contain a biomass reaction, the user can create one.There are boxes for the user to enter a unique reaction ID, its compartment within themodel, the flux upper bound, flux lower bound and the flux value. There is also a drop-boxto select the units for these flux variables as well as a tick-box to allow the user to set theobjective coefficient of the new biomass reaction to 1. If this box is selected, the objectivecoefficient of all other reactions within the model will be set to 0.
Transferring metabolites (Transfer mode only)
Once the target and template models have been loaded into the two panels, the user cantransfer reactant/product information uni-directionally from the template model to thetarget model. To transfer reactants, the user must select the relevant category (e.g. Pro-tein, Carbohydrate or Lipid etc.) to view a pop-up window containing all metaboliteswithin that category. Within this window, the user can select and transfer the metabo-lite(s) with their stiochiometric values. Similarly, product metabolites can be transferreddirectly below the reactant categories by selecting the required tick boxes.
8

Editing metabolite stoichiometries (Edit mode only)
Once the target model has been loaded, the user can select the biomass reaction and editits reactant/product stoichiometries. To edit reactant stoichiometries, the user must selectthe relevant category (e.g. Protein, Carbohydrate or Lipid etc.) to view a pop-up windowcontaining all metabolites within that category. Within this window, the user can edit thestoichiometric values of the metabolites individually. Similarly, product stoichiometriescan be edited directly within the panels situated below the reactant categories.
9
3.2 User input
3.2.1 Transfer mode
Input files
The transfer window provides two panels – one for loading the template model (left panel)and the other for the target model (right panel).
Required input: modifying an existing biomass reaction
Biomass reaction ID: The user can supply the biomass reaction for eachmodel by typing the IDs directly into the associated text control boxes (onefor each model) or they can select from the associated list of all reaction IDscontained within each model.
Species ID type: The ID type can be selected from a drop-down list (onefor each model). Note that if ‘Other’ is selected as the ID type, the user mustprovide an ID conversion dictionary as a flat file – refer to section 3.1 forformatting requirements.
Required input: creating a new biomass reaction
Species ID type: As above.
New biomass reaction ID: The user must type the desired new biomassreaction ID directly into the associated text control box.
Compartment: The user must select the reaction compartment from thedrop-down list provided.
Upper bound: The user must type the upper bound value (numbers only)into the associated text control box.
Lower bound: The user must type the lower bound value (numbers only) intothe associated text control box.
Flux value: The user must type the flux value (numbers only) into the asso-ciated text control box.
Flux units: The user must select the flux units from the drop-down listprovided.
Objective coefficient: If the user ticks this box, the objective coefficientof their new reaction will be set to 1 and all other reactions will have their
10
objective coefficients set to 0. Alternatively, if the user chooses to leave thisbox un-ticked, the objective coefficient of their new reaction will be set to 0 andthe objective coefficient of all other reactions will be left as they were withinthe original model.
3.2.2 Edit mode
Input file
In the transfer mode, the user must load one model: a target model.
Required input
Biomass reaction ID: This is the same process as required for the transfermode (refer to section 3.2.1).
Species ID type: This is the same process as required for the transfer mode(refer to section 3.2.1).
11
3.3 Output
Transient output
The biomass composition diagram is updated whenever a new reaction is selected orchanges are made to an existing reaction.
Saved output
Both modes of function allow the user to save the altered model to a new XML file,which can be viewed within a text editor. The output file follows standard SBML formatand contains all of the changes made to the original model. It can also be loaded intoBROOMM for further changes at a later date or, if the biomass equation is complete, itcan be used for constraint-based analyses such as flux balance analysis (FBA) [13].
12
Chapter 4
Example
4.1 Setting up
We have transferred information from a curated template model of E. coli (iJO1366) us-ing non-standard IDs and a semi-automatically generated E. coli target model downloadedfrom the BioModels database (BMID000000140222) that uses KEGG IDs ([4], [14], [15]).The flat-file for converting the IDs in iJO1366 was created using the conversion file pro-vided with the model and conversion dictionaries obtained from BioDB ([12], [14]). Acopy of this file has been provided as an example conversion flat-file under the name ofother id type Template example.txt. Both models are also provided with the softwareas an example to users.
BMID000000140222 contains only one biomass equation with ‘biomass reaction’ as itsID. iJO1366 has two biomass equations – we utilised the reaction with the followingID: ‘R Ec biomass iJO1366 WT 53p95M’. Here we present the results from transferringinformation from iJO1366 to BMID000000140222.
The biomass reaction within the target model is typical of semi-automatically generatedmetabolic models created using the SuBliMinaL Toolbox [4]. These models contain ageneric biomass reaction containing a standard list of reactants and products, all of whichhave a stoichiometry of 1 (refer to table 4.1 for all reactants and table 4.2 for all products).These biomass reactions require curation in order to generate accurate results from quanti-tative analyses. The process of curation involves providing accurate stoichiometric valuesas well as adding or removing metabolites to reflect the requirements of the individual cellbeing modelled.
13

Table 4.1: The reactants within the target biomass reaction before the transfer of information,showing KEGG IDs, metabolite names and ChEBI categories.
Metabolite ID Metabolite name Category
C00025 L-glutamate Protein
C00037 Aminoacetic acid Protein
C00148 L-proline Protein
C00123 L-leucine Protein
C00082 L-tyrosine Protein
C00152 L-asparagine Protein
C00073 L-methionine Protein
C00135 L-histidine Protein
C00062 L-arginine Protein
C00065 L-serine Protein
C00064 L-glutamine Protein
C00041 L-alanine Protein
C00079 Phenylalanine Protein
C00407 L-isoleucine Protein
C00188 L-threonine Protein
C00078 L-tryptophan Protein
C00047 L-lysine Protein
C00049 L-aspartate Protein
C00183 L-valine Protein
C00097 L-cysteine Protein
C00002 ATP GAM/NGAM
C00459 dTTP Nucleic acids
C00131 dATP Nucleic acids
C00458 dCTP Nucleic acids
C00286 dGTP Nucleic acids
a8dc8dc1 b8b0 4206 b692 6f114244bbb8 Other (Unidentified lipid)
14
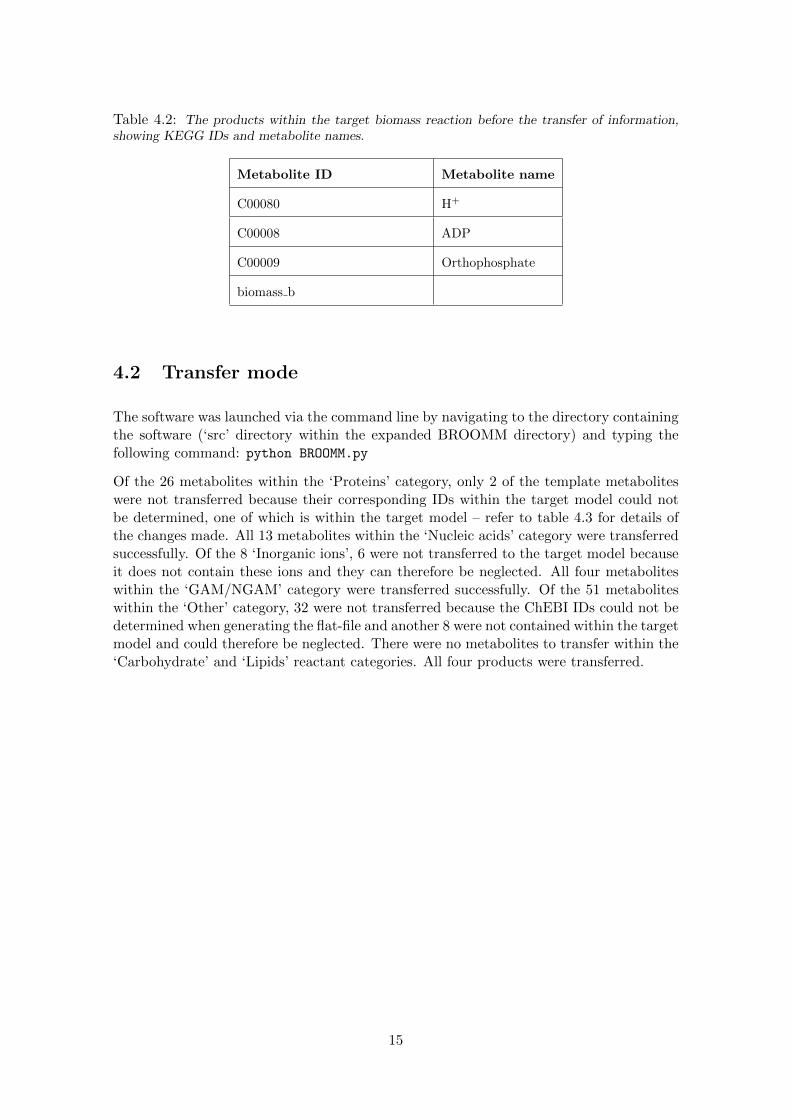
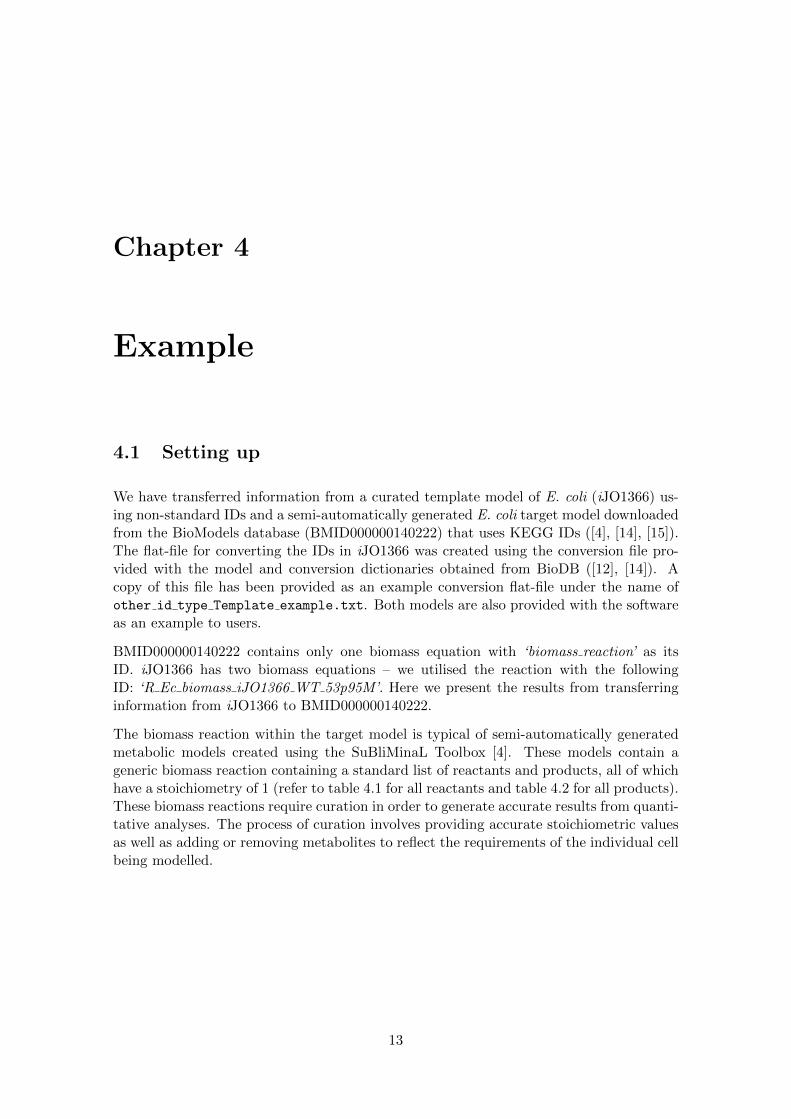
Table 4.2: The products within the target biomass reaction before the transfer of information,showing KEGG IDs and metabolite names.
Metabolite ID Metabolite name
C00080 H+
C00008 ADP
C00009 Orthophosphate
biomass b
4.2 Transfer mode
The software was launched via the command line by navigating to the directory containingthe software (‘src’ directory within the expanded BROOMM directory) and typing thefollowing command: python BROOMM.py
Of the 26 metabolites within the ‘Proteins’ category, only 2 of the template metaboliteswere not transferred because their corresponding IDs within the target model could notbe determined, one of which is within the target model – refer to table 4.3 for details ofthe changes made. All 13 metabolites within the ‘Nucleic acids’ category were transferredsuccessfully. Of the 8 ‘Inorganic ions’, 6 were not transferred to the target model becauseit does not contain these ions and they can therefore be neglected. All four metaboliteswithin the ‘GAM/NGAM’ category were transferred successfully. Of the 51 metaboliteswithin the ‘Other’ category, 32 were not transferred because the ChEBI IDs could not bedetermined when generating the flat-file and another 8 were not contained within the targetmodel and could therefore be neglected. There were no metabolites to transfer within the‘Carbohydrate’ and ‘Lipids’ reactant categories. All four products were transferred.
15
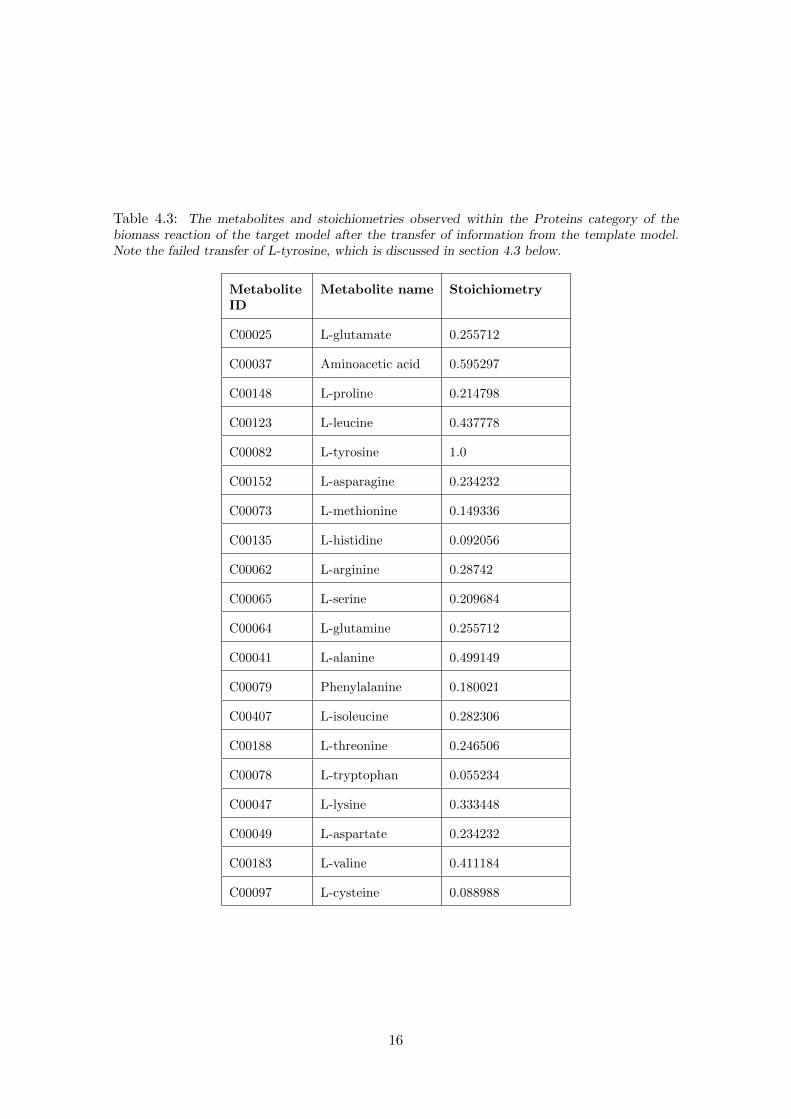
Table 4.3: The metabolites and stoichiometries observed within the Proteins category of thebiomass reaction of the target model after the transfer of information from the template model.Note the failed transfer of L-tyrosine, which is discussed in section 4.3 below.
MetaboliteID
Metabolite name Stoichiometry
C00025 L-glutamate 0.255712
C00037 Aminoacetic acid 0.595297
C00148 L-proline 0.214798
C00123 L-leucine 0.437778
C00082 L-tyrosine 1.0
C00152 L-asparagine 0.234232
C00073 L-methionine 0.149336
C00135 L-histidine 0.092056
C00062 L-arginine 0.28742
C00065 L-serine 0.209684
C00064 L-glutamine 0.255712
C00041 L-alanine 0.499149
C00079 Phenylalanine 0.180021
C00407 L-isoleucine 0.282306
C00188 L-threonine 0.246506
C00078 L-tryptophan 0.055234
C00047 L-lysine 0.333448
C00049 L-aspartate 0.234232
C00183 L-valine 0.411184
C00097 L-cysteine 0.088988
16
(a)
(b) (c)
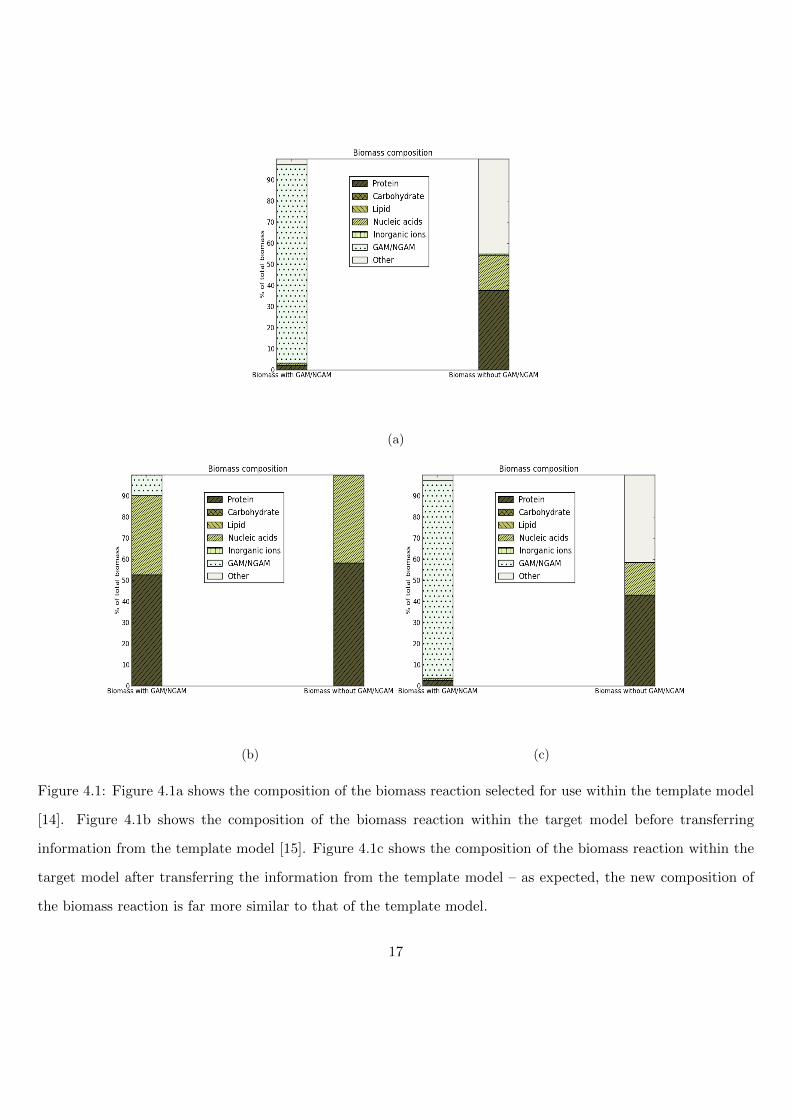
Figure 4.1: Figure 4.1a shows the composition of the biomass reaction selected for use within the template model
[14]. Figure 4.1b shows the composition of the biomass reaction within the target model before transferring
information from the template model [15]. Figure 4.1c shows the composition of the biomass reaction within the
target model after transferring the information from the template model – as expected, the new composition of
the biomass reaction is far more similar to that of the template model.
17
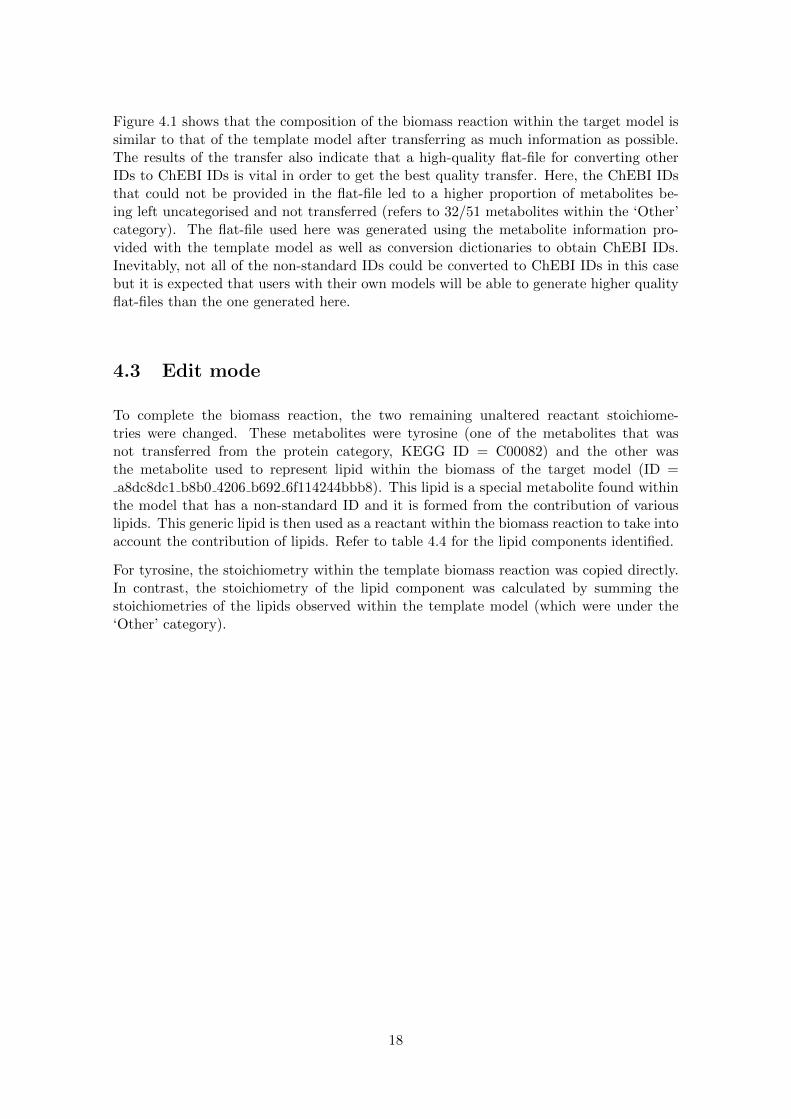
Figure 4.1 shows that the composition of the biomass reaction within the target model issimilar to that of the template model after transferring as much information as possible.The results of the transfer also indicate that a high-quality flat-file for converting otherIDs to ChEBI IDs is vital in order to get the best quality transfer. Here, the ChEBI IDsthat could not be provided in the flat-file led to a higher proportion of metabolites be-ing left uncategorised and not transferred (refers to 32/51 metabolites within the ‘Other’category). The flat-file used here was generated using the metabolite information pro-vided with the template model as well as conversion dictionaries to obtain ChEBI IDs.Inevitably, not all of the non-standard IDs could be converted to ChEBI IDs in this casebut it is expected that users with their own models will be able to generate higher qualityflat-files than the one generated here.
4.3 Edit mode
To complete the biomass reaction, the two remaining unaltered reactant stoichiome-tries were changed. These metabolites were tyrosine (one of the metabolites that wasnot transferred from the protein category, KEGG ID = C00082) and the other wasthe metabolite used to represent lipid within the biomass of the target model (ID =a8dc8dc1 b8b0 4206 b692 6f114244bbb8). This lipid is a special metabolite found within
the model that has a non-standard ID and it is formed from the contribution of variouslipids. This generic lipid is then used as a reactant within the biomass reaction to take intoaccount the contribution of lipids. Refer to table 4.4 for the lipid components identified.
For tyrosine, the stoichiometry within the template biomass reaction was copied directly.In contrast, the stoichiometry of the lipid component was calculated by summing thestoichiometries of the lipids observed within the template model (which were under the‘Other’ category).
18
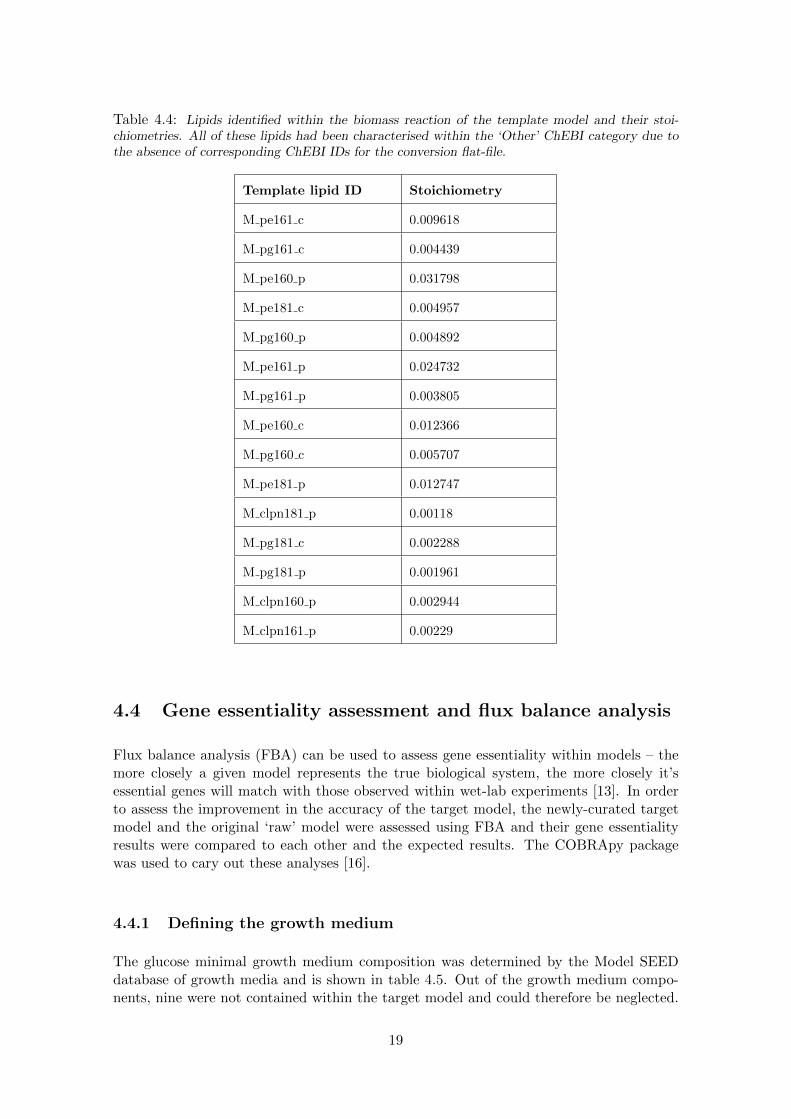
Table 4.4: Lipids identified within the biomass reaction of the template model and their stoi-chiometries. All of these lipids had been characterised within the ‘Other’ ChEBI category due tothe absence of corresponding ChEBI IDs for the conversion flat-file.
Template lipid ID Stoichiometry
M pe161 c 0.009618
M pg161 c 0.004439
M pe160 p 0.031798
M pe181 c 0.004957
M pg160 p 0.004892
M pe161 p 0.024732
M pg161 p 0.003805
M pe160 c 0.012366
M pg160 c 0.005707
M pe181 p 0.012747
M clpn181 p 0.00118
M pg181 c 0.002288
M pg181 p 0.001961
M clpn160 p 0.002944
M clpn161 p 0.00229
4.4 Gene essentiality assessment and flux balance analysis
Flux balance analysis (FBA) can be used to assess gene essentiality within models – themore closely a given model represents the true biological system, the more closely it’sessential genes will match with those observed within wet-lab experiments [13]. In orderto assess the improvement in the accuracy of the target model, the newly-curated targetmodel and the original ‘raw’ model were assessed using FBA and their gene essentialityresults were compared to each other and the expected results. The COBRApy packagewas used to cary out these analyses [16].
4.4.1 Defining the growth medium
The glucose minimal growth medium composition was determined by the Model SEEDdatabase of growth media and is shown in table 4.5. Out of the growth medium compo-nents, nine were not contained within the target model and could therefore be neglected.
19
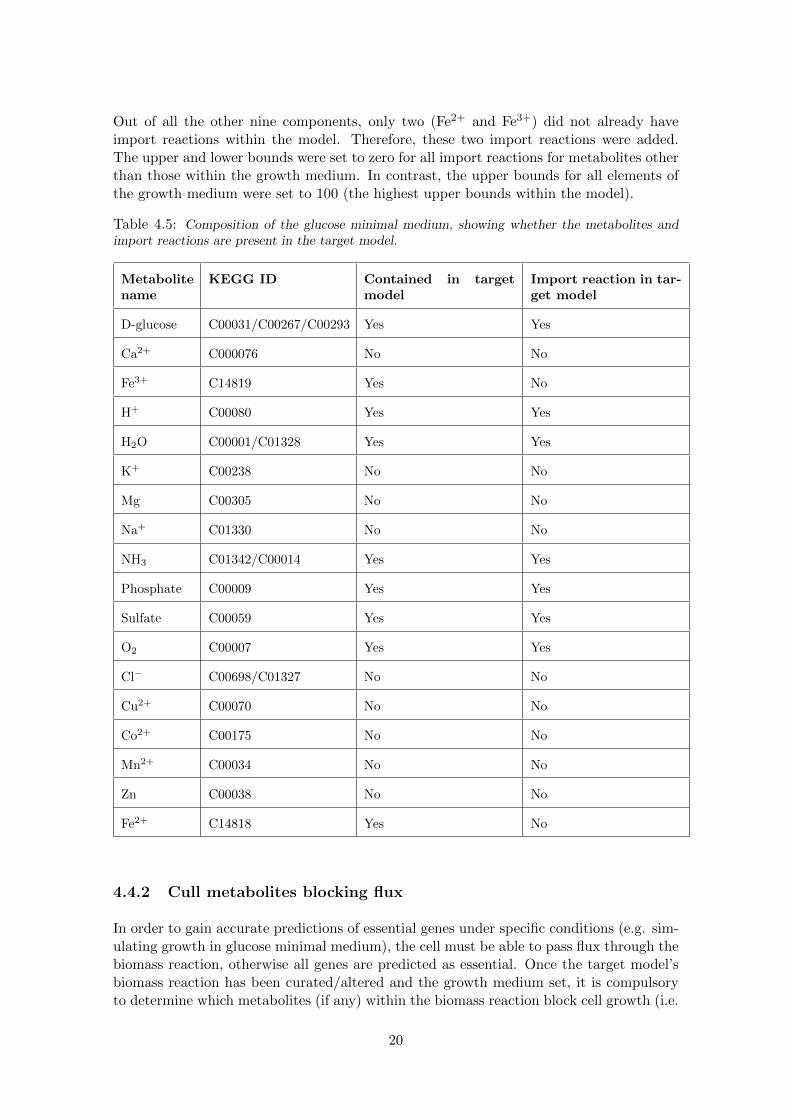
Out of all the other nine components, only two (Fe2+ and Fe3+) did not already haveimport reactions within the model. Therefore, these two import reactions were added.The upper and lower bounds were set to zero for all import reactions for metabolites otherthan those within the growth medium. In contrast, the upper bounds for all elements ofthe growth medium were set to 100 (the highest upper bounds within the model).
Table 4.5: Composition of the glucose minimal medium, showing whether the metabolites andimport reactions are present in the target model.
Metabolitename
KEGG ID Contained in targetmodel
Import reaction in tar-get model
D-glucose C00031/C00267/C00293 Yes Yes
Ca2+ C000076 No No
Fe3+ C14819 Yes No
H+ C00080 Yes Yes
H2O C00001/C01328 Yes Yes
K+ C00238 No No
Mg C00305 No No
Na+ C01330 No No
NH3 C01342/C00014 Yes Yes
Phosphate C00009 Yes Yes
Sulfate C00059 Yes Yes
O2 C00007 Yes Yes
Cl− C00698/C01327 No No
Cu2+ C00070 No No
Co2+ C00175 No No
Mn2+ C00034 No No
Zn C00038 No No
Fe2+ C14818 Yes No
4.4.2 Cull metabolites blocking flux
In order to gain accurate predictions of essential genes under specific conditions (e.g. sim-ulating growth in glucose minimal medium), the cell must be able to pass flux through thebiomass reaction, otherwise all genes are predicted as essential. Once the target model’sbiomass reaction has been curated/altered and the growth medium set, it is compulsoryto determine which metabolites (if any) within the biomass reaction block cell growth (i.e.
20
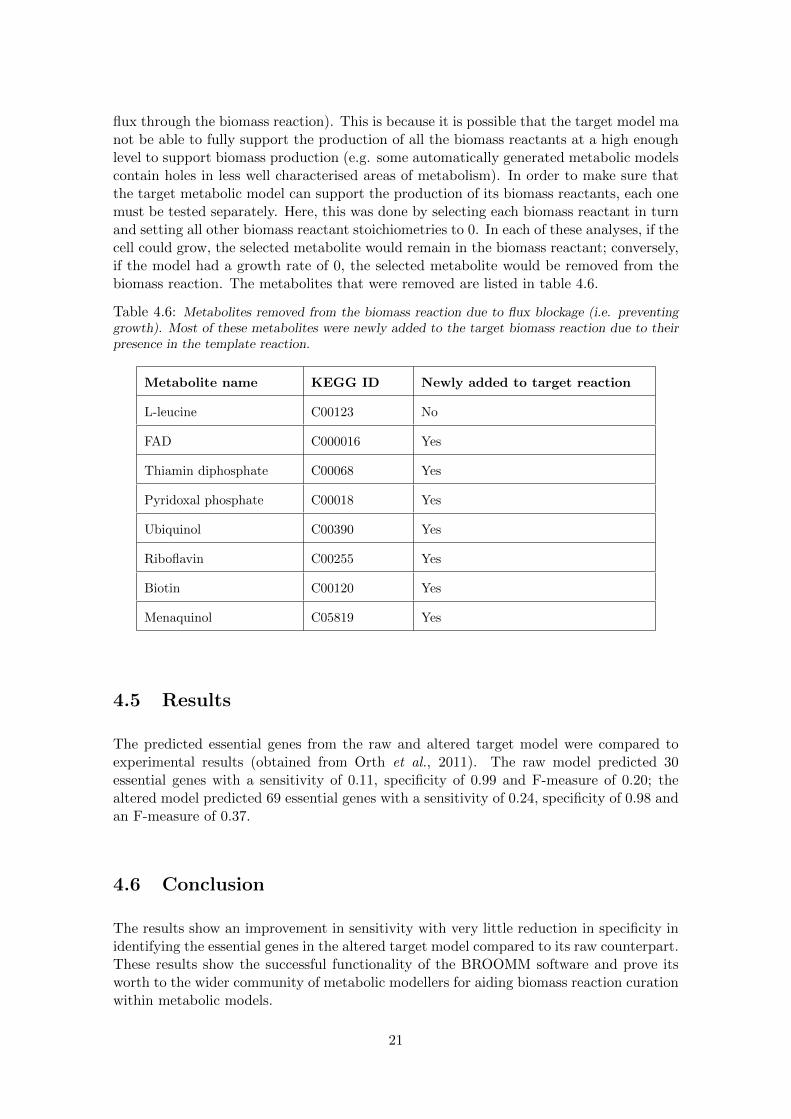
flux through the biomass reaction). This is because it is possible that the target model manot be able to fully support the production of all the biomass reactants at a high enoughlevel to support biomass production (e.g. some automatically generated metabolic modelscontain holes in less well characterised areas of metabolism). In order to make sure thatthe target metabolic model can support the production of its biomass reactants, each onemust be tested separately. Here, this was done by selecting each biomass reactant in turnand setting all other biomass reactant stoichiometries to 0. In each of these analyses, if thecell could grow, the selected metabolite would remain in the biomass reactant; conversely,if the model had a growth rate of 0, the selected metabolite would be removed from thebiomass reaction. The metabolites that were removed are listed in table 4.6.
Table 4.6: Metabolites removed from the biomass reaction due to flux blockage (i.e. preventinggrowth). Most of these metabolites were newly added to the target biomass reaction due to theirpresence in the template reaction.
Metabolite name KEGG ID Newly added to target reaction
L-leucine C00123 No
FAD C000016 Yes
Thiamin diphosphate C00068 Yes
Pyridoxal phosphate C00018 Yes
Ubiquinol C00390 Yes
Riboflavin C00255 Yes
Biotin C00120 Yes
Menaquinol C05819 Yes
4.5 Results
The predicted essential genes from the raw and altered target model were compared toexperimental results (obtained from Orth et al., 2011). The raw model predicted 30essential genes with a sensitivity of 0.11, specificity of 0.99 and F-measure of 0.20; thealtered model predicted 69 essential genes with a sensitivity of 0.24, specificity of 0.98 andan F-measure of 0.37.
4.6 Conclusion
The results show an improvement in sensitivity with very little reduction in specificity inidentifying the essential genes in the altered target model compared to its raw counterpart.These results show the successful functionality of the BROOMM software and prove itsworth to the wider community of metabolic modellers for aiding biomass reaction curationwithin metabolic models.
21
Bibliography
[1] Kanehisa, M. et al. (2012) KEGG for integration and interpretation of large-scalemolecular data sets. Nucleic Acids Research, 40, D109–D114.
[2] Henry, C.S. et al. (2010) High-throughput generation, optimization and analysis ofgenome-scale metabolic models. Nature Biotechnology, 28, 977–982.
[3] Caspi, R. et al. 2012, The MetaCyc database of metabolic pathways and enzymes andthe BioCyc collection of pathway/genome databases. Nucleic Acids Research 40, D742– D753.
[4] Swainston, N. et al. The SuBliMinaL Toolbox: automating steps in the reconstructionof metabolic networks. Journal of Integrative Bioinformatics 8 (2).
[5] Thiele, I. & Palsson, B. O. 2010, A protocol for generating a high-quality genome-scalemetabolic reconstruction. Nature Protocols 5 (1), 93 – 121.
[6] van Rossum, G. and Drake F.L. (eds), Python Reference Manual, PythonLabs, Vir-ginia, USA, 2001. Available at http://www.python.org.
[7] Bornstein, B. et al. (2008) LibSBML: An API Library for SBML. Bioinformatics 24,880 – 881.
[8] wxPython, 2012. wxPython. [online] Available at: http://www.wxpython.org [Accessed12 August 2013]
[9] NumPy, 2013. NumPy. [online] Available at: http://www.numpy.org [Accessed 12 Au-gust 2013]
[10] Hunter, J.D. (2007) Matplotlib: A 2D graphics environment. Computing In Science& Engineering, 9 (3), 90–95.
[11] Hastings, J. et al. (2013) The ChEBI reference database and ontology for biologicallyrelevant chemistry: enhancements for 2013. Nucleic acids research, 41(Database issue),D45663. doi:10.1093/nar/gks1146.
[12] Imanishi, T., & Nakaoka, H. (2009). Hyperlink Management System and ID ConverterSystem: enabling maintenance-free hyperlinks among major biological databases. Nu-cleic acids research, 37(Web Server issue), W1722. doi:10.1093/nar/gkp355.
[13] Orth, J. D., Thiele, I. & Palsson, B. O. 2010, What is flux balance analysis? NatureBiotechnology 28 (3), 245 – 248.
22

[14] Orth, J.D. et al. (2011) A comprehensive genome-scale reconstruction of Escherichiacoli metabolism–2011. Molecular Systems Biology, 7, 535.
[15] Li, C. et al. (2010) BioModels Database: An enhanced, curated and annotated re-source for published quantitative kinetic models. BMC Systems Biology, 4, 92.
[16] Schellenberger, J. et al. 2011, Quantitative prediction of cellular metabolism withconstraint-based models: the COBRA Toolbox v2.0. Nature Protocols 6 (9), 1290 –1307.
23