biomass report - murdoch university
TRANSCRIPT

FISHERIES RESEARCH REPORT NO. 170, 2008
Biomass and commercial catch estimates for abalone stocks in areas proposed as
sanctuary zones for the Capes Marine Park
A. Hesp1, N. Loneragan1, N. Hall1, H. Kobryn1, A. M. Hart2, F. P. Fabris2 and J. Prince3
Fisheries Research DivisionWestern Australian Fisheries and Marine Research Laboratories
PO Box 20 NORTH BEACHWestern Australia 6920
1 Centre for Fish and Fisheries Research, Murdoch University, South St, Murdoch, WA 61502 Research Division, Department of Fisheries, PO Box 20, North Beach WA 6120
3 Biospherics Pty Ltd, PO Box 168, South Fremantle WA 6162
Biospherics P/L

2 Fisheries Research Report [Western Australia] No. 170, 2008
Fisheries Research Reports
Titles in the Fisheries Research Report series present technical and scientific information for use in management processes. Research Reports are subject to full internal refereeing by senior scientists of the Fisheries Research Division, and in many cases, elements of the work are published in the international scientific literature.
Correct citation:
Hesp, A., Loneragan, N., N. Hall, Kobryn, H., Hart, A.M., Fabris, F. P. and Prince, J. 2008. Biomass and commercial catch estimates for abalone stocks in areas proposed as sanctuary zones for the Capes Marine Park. Fisheries Research Report No. 170, Department of Fisheries, Western Australia, 52p.
Enquiries:
WA Fisheries and Marine Research Laboratories, PO Box 20, North Beach, WA 6920Tel: +61 8 9203 0111 Email: [email protected]: www.fish.wa.gov.auABN: 55 689 794 771
A complete list of Fisheries Research Reports is available online at www.fish.wa.gov.au
© Department of Fisheries, Western Australia. March 2008. ISSN: 1035-4549 ISBN: 1 921258 16 0

Fisheries Research Report [Western Australia] No. 170, 2008 3
Contents
Biomass and commercial catch estimates for abalone stocks in areas proposed as sanctuary zones for the Capes Marine Park ........................................ 5
Executive Summary ................................................................................................ 5
Biomass and catch ................................................................................................... 6
Acknowledgements ................................................................................................. 6
1.0 Background ............................................................................................................ 7
1.1 Background on commercial abalone fisheries in the Capes region ................ 11
2.0 Methods .................................................................................................................. 12
2.1 Identification of sampling areas within the proposed sanctuaries of the Capes region through fisher knowledge ................................................... 12
2.2 Sampling for Roei ............................................................................................ 12
2.3 Sampling for Greenlip and Brownlip .............................................................. 14
2.4 Preliminary analyses for determining the required number of samples ........ 14
2.5 Length-weight relationships for the three abalone species ............................. 14
2.6 Analyses for determining abalone biomass within the proposed sanctuaries . 152.6.1 Assumptions in the estimation of biomass in the proposed sanctuaries ............................................................................................. 16
2.7 Adjustment of biomass estimates for abalone removed by commercial fishing during the 2006/07 season ................................................................... 17
2.8 Estimates of current catch based on estimates of fishing mortality ................ 18
2.9 Estimates of biologically sustainable catch based on reference point analyses ................................................................................................... 18
3.0 Results..................................................................................................................... 19
3.1 Preliminary parametric sample size analysis ................................................... 19
3.2 Length-weight relationships ............................................................................ 19
3.3 Length compositions of the three abalone species in the proposed sanctuaries ........................................................................................ 19
3.4 Biomass per unit area of Roei, Greenlip and Brownlip in the proposed sanctuaries ........................................................................................ 23
3.5 Estimates of biomass of abalone in the proposed sanctuaries ........................ 263.5.1 Roei ........................................................................................................ 263.5.2 Greenlip and Brownlip .......................................................................... 26
3.6 Estimates of biologically sustainable catch and current annual commercial catch ............................................................................................. 30
3.6.1 Roei ........................................................................................................ 303.6.2 Greenlip and Brownlip .......................................................................... 32
4.0 Discussion ............................................................................................................... 36
4.1 Preliminary sample size analyses .................................................................... 36
4.2 Sampling design ............................................................................................... 36

4 Fisheries Research Report [Western Australia] No. 170, 2008
4.2.1 Identification of sampling areas through commercial fisher knowledge ................................................................................... 364.2.2 Prioritisation of sampling areas ............................................................. 374.2.3 Rationale for sampling methodology for Roei ...................................... 374.2.4 Rationale for sampling methodology for Greenlip and Brownlip ........ 38
4.3 Implications of the biomass estimates for the three abalone species .............. 384.3.1 Comparisons between biomass estimates determined with and without commercial catch ..................................................................... 384.3.2 Biomass estimates for Roei ................................................................... 394.3.3 Biomass estimates for Greenlip and Brownlip ..................................... 39
4.4 Interpretation of the results of the catch estimates based on harvest fishing mortality and reference point analyses ................................................ 39
4.5 Considerations for further research ................................................................. 40
5.0 References .............................................................................................................. 41
6.0 Appendices ............................................................................................................. 43
Appendix 1. Preliminary analyses for determining required number of samples .. 43A1.1 Data of other abalone stocks employed for the analysis ...................... 43A1.2 Analysis ................................................................................................. 43
Appendix 2. Determination of available abalone biomass within commercially-fished areas of the proposed sanctuaries.......................................... 44
A2.1 Biomass available to fishers .................................................................. 44A2.2 Estimates of abalone biomass from scientific surveys led by DoF ...... 44A2.3 Rationale for assuming a delta-log distribution for producing biomass estimates from the survey data ................................................ 45A2.4 Biomass estimates from survey data and commercial catch information .................................................................................. 46
Appendix 3. Estimation of biologically sustainable catch biomass from the proposed sanctuaries ................................................................. 47
Appendix 4. Estimates of the current annual biomass of catches taken from the sanctuaries ..................................................................... 49
Appendix 5. Roles of people involved in the project ............................................. 50
Fisheries Research Report [Western Australia] No. 170, 2008 5
Biomass and commercial catch estimates for abalone stocks in areas proposed as sanctuary zones for the Capes Marine Park
A. Hesp1, N. Loneragan1, N. Hall1, H. Kobryn1, A. M. Hart2, F. P. Fabris2 and J. Prince3
Western Australian Fisheries and Marine Research LaboratoriesPO Box 20, North Beach WA 69201 Centre for Fish and Fisheries Research, Murdoch University, South St, Murdoch, WA 61502 Research Division, Department of Fisheries, PO Box 20, North Beach WA 61203 Biospherics Pty Ltd, PO Box 168, South Fremantle WA 6162
Executive Summary
This study was undertaken to estimate the biomasses, biologically sustainable catches and current average annual commercial catches of three fished species of abalone, Haliotis roei (Roei), Haliotis laevigata (Greenlip) and Haliotis conicopora (Brownlip) in the proposed sanctuaries of the Capes Marine Park, south-western Australia. The current annual, catch estimates represent the catches that would be foregone by commercial fishers if the sanctuaries are implemented and will be used to evaluate the potential compensation to fishers (not part of this study). The biomass and catch estimates for each species in the proposed sanctuaries were estimated from a combination of scientific survey data and commercial catch information (provided by fishers) for the proposed sanctuaries. It should be noted that the design, field surveys, analyses of data and writing of this report had to be completed in less than a year, which limited the scope of this study.
Commercial abalone fishers who operate in the Capes area were consulted to identify areas where commercial quantities of abalone were known to occur within the proposed sanctuaries. Of the 12 proposed sanctuaries, three were identified as containing commercial stocks of Roei, with one of those zones, i.e. Cape Naturaliste, having two optional configurations. Four sanctuaries were identified with commercial stocks of both Greenlip and Brownlip. Roei, which occur over intertidal and shallow, subtidal reefs, were sampled using 0.5 m2 quadrats along 34 transect lines (136 quadrats) set perpendicular to the shore. Greenlip and Brownlip, which are found in deeper waters over reefs, were sampled using 30 m2 transects (2 transects per site) at 116 randomly selected sites (232 transects) within the areas identified by commercial fishers. The numbers and shell lengths of all abalone were recorded, and length-weight (total and bled meat weight) relationships were determined for each species from sub-samples taken from a range of sites, which thereby enabled estimation of the weights of all individual abalone recorded in the surveys.
For all three abalone species of abalone, industry harvests abalone at lengths above the minimum legal length (MLL) for capture. The minimum size at which Roei is harvested commercially in the Capes region is 70 or 75 mm, depending on location within the region (cf. 60 mm MLL); minimum sizes for Greenlip and Brownlip in the region range from 150 to 153 mm (cf. 140 mm MLL for Greenlip and Brownlip). Between 15 and 39% of Roei measured in the proposed sanctuaries surveyed were above the respective minimum size at which it is harvested commercially in those areas. In comparison, nearly half of the Greenlip and Brownlip in the proposed sanctuaries were above the minimum size at which these species are harvested in those areas.
6 Fisheries Research Report [Western Australia] No. 170, 2008
Biomass and catchThe data from the surveys were used to produce biomass estimates for each species which were subsequently adjusted for the catches reported by fishers from the proposed sanctuaries during the 2006/07 fishing season. The point estimates of biomass for Roei above the minimum size at which it is harvested (harvest biomass, HB), i.e. > 70 at Cape Naturaliste options 1 and 2 and Wyadup, > 75 mm at Cape Leeuwin, adjusted for catches (kg, total body wt), in all sanctuaries surveyed were 17,777 kg, excluding Cape Naturaliste option 2, and 14,149 kg, excluding Cape Naturaliste option 1. The proposed sanctuaries with the highest estimated HB of Roei were Wyadup (9,881 kg – a relatively low density of animals above the minimum size it is commercially harvested, distributed over a large area) and Cape Naturaliste option 1 (7,186 kg – a high density population in a small area). The estimated HB of Roei for Cape Naturaliste option 1 was far greater than for Cape Naturaliste option 2 (3,558 kg).
The total estimated HB adjusted for catches for Greenlip and Brownlip abalone (kg, bled meat wt) in the proposed sanctuaries were 3,252 kg and 2,260 kg, respectively. The highest estimated HB were from Cape Leeuwin for both species (1,591 and 1,463 kg for Greenlip and Brownlip, respectively). The associated 95% confidence intervals for those estimates, determined through re-sampling, were relatively broad.
The current annual commercial catch for each species was estimated by applying values of fishing mortality, natural mortality to the estimates of HB. On the basis of the HB estimates which had been adjusted for catches, for Roei, the overall estimate was 5,579 kg for all sanctuaries excluding Cape Naturaliste option 2 and 4,470 kg for all sanctuaries excluding Cape Naturaliste option 1. The overall estimated annual commercial catches for Greenlip and Brownlip (kg, bled meat wt) were 993 and 557 kg, respectively.
The reference point analyses indicated that all three species in the Capes region are currently at, or close to full biological exploitation. We believe that the estimates of current annual catch in the proposed sanctuaries determined by applying values of fishing mortality to our estimates of harvest biomass, adjusted for commercial catches, provide the most appropriate estimation of annual catch foregone.
AcknowledgementsThe authors are grateful to the commercial abalone industry, particularly, David Sutcliffe, Darren Adams, John Lashmar, Ian Taylor and Terry Adams and all commercial fishers who operate in the Capes region and willingly provided information on the locations of abalone stocks in the proposed sanctuaries and on the catches they had taken from these areas during the 2006/07 season. Many thanks to the sampling team of the Department of Fisheries, including Frank Fabris, Jamin Brown, Lachlan Strain, David Murphy, Fiona Parker and Mark Davidson, and to Peter Coulson of Murdoch University for their great dedication to the surveys undertaken in the study. Thanks to all staff at the Department of Environment and Conservation with whom we have had discussions regarding the project, and particularly to Peter Dans, Chris Simpson, John Lloyd, Judy Davidson and Fran Stanley. Thanks to Nick Caputi and Andrew Hill of the Department of Fisheries for discussions and advice. Thanks also to Jessica Meeuwig (University of WA) for her advice on sampling design.
We thank Rick McGarvey of the South Australian Research and Development Institute (SARDI) for providing an external review of this report, and for his very constructive comments and criticisms.
Funding for the project was provided by the Departments of Environment and Conservation and Fisheries.

Fisheries Research Report [Western Australia] No. 170, 2008 7
1.0 Background
The Western Australian Government is committed to establishing a marine park in the Capes Region (i.e. Cape Naturaliste to Cape Leeuwin). The Department of Environment and Conservation (formerly, Department of Conservation and Land Management – CALM) undertook a community consultation process in 2003/2004 to develop a draft indicative management plan for the proposed park. This draft included a zoning plan, which consists of a number of sanctuaries where commercial fishing, including that for abalone, will be prohibited (Figures 1.1 to 1.3). Fishers are entitled to apply for compensation under the Fisheries and Related Industries (Marine Sanctuaries) Compensation Act 1997 where they have been impacted by the creation of a marine park. Accordingly, it is likely that claims will be submitted following the creation of the proposed Geographe Bay/Leeuwin-Naturaliste/Hardy Inlet Marine Park (“the Capes Marine Park”).
An external economist employed as a consultant by the Department of Fisheries (DoF) previously prepared estimates of the potential compensation to commercial abalone fishers for the potential loss of income resulting from the exclusion of commercial fishers from the proposed sanctuaries. Compensation was estimated from commercial abalone log book catch data (held by DoF), and from information supplied by the abalone industry. However, there was a large discrepancy between these estimates of compensation.
Monthly catch data for commercial abalone is typically reported in 60 x 60 nm (nautical mile) blocks, but finer scale data based on 10 by 10 nm blocks is also provided daily as part of a quota return. However, the latter data are still not precise enough to accurately determine the proportion of abalone taken from the proposed sanctuaries. To facilitate determination of fair and appropriate compensation payments when the marine park is established, information was required that could be used to estimate more reliably the likely loss of abalone product to commercial fishers as a result of implementing sanctuaries in the Capes region. Such data may also be used to amend the proposed zoning of the sanctuaries in the Capes Marine Park, to minimise the loss of product to industry and the compensation liability to Government. “Benchmark information” on abalone stocks located in the sanctuaries of the park would enable future assessments to be made of the changes in abalone populations as a result of the closures.

8 Fisheries Research Report [Western Australia] No. 170, 2008
Figure 1.1 Map 2 of brochure entitled: “Proposed Geographe Bay/Leeuwin-Naturaliste/Hardy Inlet: have your say”. Department of Environment and Conservation and Marine Parks and Reserves Authority.

Fisheries Research Report [Western Australia] No. 170, 2008 9
Figure 1.2 Map 3 of brochure entitled “Proposed Geographe Bay/Leeuwin-Naturaliste/Hardy Inlet: have your say”. Department of Environment and Conservation and Marine Parks and Reserves Authority.

10 Fisheries Research Report [Western Australia] No. 170, 2008
Figure 1.3 Map 4 of brochure entitled “Proposed Geographe Bay/Leeuwin-Naturaliste/Hardy Inlet: have your say”. Department of Environment and Conservation and Marine Parks and Reserves Authority.

Fisheries Research Report [Western Australia] No. 170, 2008 11
The main aim of this study was to estimate the average, current annual commercial catch of each of the three abalone species within the proposed sanctuaries of the Capes Marine Park. The approach adopted was to determine those areas within the proposed sanctuaries that are currently commercially fished (through consulting commercial abalone fishers). The biomass of each commercially-harvested abalone species within the commercially-fished areas of the proposed sanctuaries was then estimated from scientific surveys and also taking into account data provided by commercial fishers on their catches from these zones in the 2006/2007 season (November to the end of the surveys in June). For each species in each proposed sanctuary in which commercially important stocks were identified, biomass estimates were made for abalone of all sizes, and above the size at which they attain maturity, legal size and commercial, harvest size (as, for all three species, the minimum size at which they are commercially harvested is greater than their respective minimum legal size). The calculation of appropriate levels of compensation for commercial abalone fishers was not part of this project.
1.1 Background on commercial abalone fisheries in the Capes region
The commercial fishery for abalone in Western Australia currently targets three species, namely Roe’s abalone (Haliotis roei), Greenlip abalone (Haliotis laevigata) and Brownlip abalone (Haliotis conicopora) (Metzner et al. 2001). The management areas for the commercial fishery for Roei differ to those for Greenlip and Brownlip in Western Australia; there are six different management areas for Roei and three for Greenlip and Brownlip. The management of Roei in the Capes region falls within the Department of Fisheries’ management area 6, which extends from Cape Bouvard to Cape Leeuwin (Augusta) and has 12 license holders (Mitchell and Baba, 2006). Data in log books for commercial catches of abalone show that, over the last 10 years, essentially all of the total allowable catch (TAC) of 12,000 kg whole weight (Mitchell and Baba, 2006) for Roei in management area 6 comes from the Capes region i.e. between Cape Leeuwin and Cape Naturaliste. The commercial log book data also show that most of the Roei catch in the Capes region is taken north of the Cape Freycinet proposed sanctuary (Figures 1.1 to 1.3).
The commercial fishery for Greenlip and Brownlip in the Capes region falls within management area 3 for these species, which extends between Busselton and Shoal Cape (east of Esperance), with 7 license holders (and 8 licences) (A. Hart, pers comm.). The commercial log book data show that approximately half of the annual Greenlip and Brownlip catch for management area 3 (TAC = about 32,000 kg for Greenlip and 7,500 kg for Brownlip, Hart and Fabris, 2005), comes from the Capes region, even though this region constitutes a relatively small proportion of the overall area of the zone. In contrast to Roei, most of the commercial Greenlip and Brownlip catch from the Capes region is taken south of the Cape Freycinet proposed sanctuary zone.
The minimum shell lengths at which, for management area 6, Roei are commercially harvested, are 70 or 75 mm, depending on the location within this management area, which are thus well above the minimum legal shell length of 60 mm for this species (Hart and Fabris, 2005; personal communication, Abalone Industry Meeting July 2007). Likewise, fishers in management area 3 for Greenlip and Brownlip harvest these species at lengths well above the minimum legal shell length of 140 mm, i.e. at 150 or 153 mm, depending on the growth rates of the abalone in the different fishing grounds (Hart and Fabris, 2005).
12 Fisheries Research Report [Western Australia] No. 170, 2008
2.0 Methods
2.1 Identification of sampling areas within the proposed sanctuaries of the Capes region through fisher knowledge
The proposed sanctuaries in the Capes Marine Park cover a large area and, given the limited time and resources available for the project, it was not feasible to sample the sanctuaries systematically in their entirety. However, commercial fishers focus their fishing activities in areas where the quantities of abalone are large enough for commercial fishing to be viable. Therefore, the biomass of abalone that will no longer be accessible to fishers is that which lies in the areas of the sanctuaries that are currently fished. We thus focused on those areas within the proposed sanctuaries where commercially viable abundances of abalone are known to commercial fishers, who are currently fishing in the Capes region (these areas are referred to as strata throughout the report).
Commercial abalone fishers with key knowledge of locations of abalone stocks within the proposed sanctuaries of the Capes Marine Park were identified at an industry meeting in February 2007. Five of these fishers, who fish mainly for Roei, and three, who fish mainly for Greenlip and Brownlip (including one fisher who no longer currently fishes for abalone), were interviewed. During those interviews, fishers were asked to draw on the maps the areas where they know of significant numbers of abalone. Other information offered by fishers in those interviews, such as the depths and habitats at those locations, was also noted. In the case of Roei, one fisher kindly assisted DoF on a two day field trip to identify and map areas of significant Roei stocks within the sanctuaries. For Greenlip and Brownlip, two of the fishers acknowledged by other fishers as having the most current knowledge of these stocks, kindly provided GPS positions of their fishing locations (44 locations) for these species within the proposed sanctuaries.
Surveys for the three species were completed between the 4th March and 18th June 2007.
2.2 Sampling for Roei
The areas for Roei visited with the commercial fisher were marked using GPS. The GPS areas were then plotted in ArcMap 9.0 and overlaid on a 0.5 m aerial photo mosaic (taken in 2004) of each sanctuary. On the digital image, polygons were drawn around the recorded GPS positions to mark those areas containing significant abalone locations. The sketches and information provided by the other Roei fishers were cross-checked and, where necessary, some adjustments were made to the GIS coverage to accommodate the information provided by those other fishers. The surface area and perimeter of each polygon were extracted from ArcMap 9.0 and exported to Microsoft ExcelTM for use in other analyses. Twelve strata in the proposed sanctuaries were identified, based on the extent of the Roei populations (Table 2.1).
Roei were counted and measured in four quadrats (0.5 m2 in area), 1.5 m apart (equally spaced), along a 6 m long transect line, laid perpendicular to the shore within each strata. Previous studies have shown that distance from shore is a major source of variability in Roei density (Hancock, 2004). A total of 34 transects and 136 quadrats were sampled in three proposed sanctuaries (including option 1 and 2 of Cape Naturaliste, Wyadup and Cape Leeuwin (Figs 1.1 to 1.3, Table 2.1). Both the total numbers of Roei and the maximum shell length (to the nearest 1 mm) of each individual were recorded for each quadrat.

Fisheries Research Report [Western Australia] No. 170, 2008 13
Two strata at Cape Naturaliste Option 1 and one at Cape Leeuwin, which can only be sampled in very low swell conditions, were not sampled because of poor weather. As preliminary dives with a commercial Roei fisher in these strata indicated that they contained far higher numbers of abalone than in the other strata, existing data (for 15 quadrats) for similar habitat with high densities of Roei in the Perth metropolitan region (provided by DoF), were used as a surrogate for these three strata. Advice that, of the available data, the Perth data were likely to be most representative of Roei in those strata not able to be sampled was provided to us at a meeting with industry, Anthony Hart and Jeremy Prince in March, 2007.
Table 2.1 The area of the strata and number of transects and quadrats sampled to estimate the biomass of Roei within the proposed sanctuaries of the Capes Marine Park. Strata refer to those areas within the sanctuaries listed in the table that, through consultation with industry, were identified as containing commercially important stocks of abalone. * refers to strata that were not sampled and for which data from the Perth metropolitan region have been used.
Strata name Area m2 (GIS) No. of transects No. of quadrats
Cape Naturaliste (Option 2)
A 2,700 3 12
BA 4,200 3 12
BB 11,000 4 16
Sanctuary total 17,900 10 40
Cape Naturaliste (Option 1)
BC 3,100 3 12
C 5,000 4 16
D 320 1* 4*
E 2,000 2* 7*
Sanctuary total (excluding metropolitan data)
10,420 7 28
Wyadup
GA 33,000 8 32
GB 15,700 3 12
GC 160 1 4
Sanctuary total 48,860 12 48
Cape Leeuwin
HA 430 5 20
HB 320 1* 4*
Sanctuary total (excluding metropolitan data)
750 5 20
Total sampled (excluding Cape Naturaliste Option 1)
50,030 30 108
Total sampled (excluding Cape Naturaliste Option 2)
57,510 27 96

14 Fisheries Research Report [Western Australia] No. 170, 2008
2.3 Sampling for Greenlip and Brownlip
The sampling areas (strata) for Greenlip and Brownlip were determined using a combination of the GPS locations and hand-drawn sketches on the aerial photographs of the sanctuaries that were provided by fishers and represented areas that they considered to contain significant abalone stocks. The GPS locations provided by fishers were plotted in ArcMap 9.0 and overlaid with a 0.5 m aerial photo mosaic (2004) of each sanctuary. Polygons encompassing areas within the sanctuaries identified by fishers as housing significant abalone stocks were created on digital aerial photographs by tracing an area around the digitally-transferred GPS points provided by fishers, and also by transferring onto the digital photographs polygons representing the areas sketched out by the fishers.
Sampling for Greenlip and Brownlip was completed in four of the proposed sanctuaries (Flinders Island, Cape Leeuwin, Cosy Corner and Cape Freycinet, Table 2.2). 40 GPS locations were assigned to each of the above sanctuaries using the Hawths GIS tool for stratified sampling (http://www.spatialecology.com/htools/tooldesc.php). For each sanctuary, the 40 GPS locations were distributed among the strata in that sanctuary according to an assigned priority level. Most of the computer generated sampling sites were assigned to those identified using fisher GPS points (termed “High priority strata”). Areas identified using sketches from fishers and no fisher GPS points (“Low priority strata”) and presumed less likely to be currently fished, were allocated fewer sampling sites. The surface area and perimeter of each polygon and all GPS coordinates were extracted from ArcMap 9.0 and exported to Microsoft ExcelTM for use in other analyses.
At each of 116 of the total of 160 computer-generated sampling locations (the maximum number of sites that could be sampled within the time available), two 30 x 1 m long transects were surveyed in opposite directions along bearings of 0° and 180°, without searching or movement away from the GPS location before the transects were laid (Table 2.2). This method is a modification of the method of McGarvey et al. (in press), as outlined in Carlson et al. (2006). The main modifications are that for the current study, the transect length was reduced from 100 to 30 m, the locations were randomly, not systematically selected and the divers swam in opposite directions, not in the same direction. For the analysis, the two 30 m transects at each site, (as they are not independent), were pooled.
2.4 Preliminary analyses for determining the required number of samples
Prior to sampling, preliminary analyses were completed using existing DoF data for other Roei (from near Perth) and Greenlip stocks (from Hopetoun), to explore the relationship between the number of samples and estimates of mean density and variation in the mean. The results of those preliminary analyses were used to determine the number of samples that would be allocated to each of the strata to obtain the required precision. See Appendix 1 for a detailed description of the data, their appropriateness, and for these preliminary analyses.
2.5 Length-weight relationships for the three abalone species
Subsamples of 80 Roei, 53 Greenlip and 50 Brownlip, and which covered essentially the full size ranges of each species recorded during the surveys, were taken from sites at two or more of the proposed sanctuaries. They were placed on ice before measuring their shell lengths, whole
Fisheries Research Report [Western Australia] No. 170, 2008 15
weights and bled meat weight. The data were used to determine length-weight relationships for each of the three species.
2.6 Analyses for determining abalone biomass within the proposed sanctuaries
Estimates of biomass and its precision were made for each species in the proposed sanctuaries using the following procedure:
1. estimating the weight of each abalone by converting its recorded length to a weight using the appropriate length-weight relationship (see above);
2. calculating the biomass of abalone in each quadrat for Roei and transect for Greenlip and Brownlip in the following categories:
a. all visible (non-cryptic) abalone i.e. total biomass,
b. all abalone above estimates of the size at maturity. Roei = 45 mm (Keesing, 1984), Greenlip = 95 mm (Hart et al., 2000), Brownlip = 125 mm (Wells and Mulvay, 1992).
c. all legal sized abalone. Minimum Legal Lengths (MLL) are: Roei = 60 mm, Greenlip and Brownlip = 140 mm.
d. all abalone above the size at which they are harvested in the proposed sanctuaries by commercial fishers (for Roei, 70 mm at Cape Naturaliste options 1 and 2 and Wyadup, 75 mm at Cape Leeuwin; for Greenlip and Brownlip, 150 mm).
3. for each strata in each sanctuary, calculating the mean biomass (of a-d above) per m2 and then extrapolating to the biomass for the overall area of each strata;
4. summing the biomasses for all strata in each sanctuary;
5. estimating the variance for each strata and then calculating the overall variance in biomass for all strata in each sanctuary.
A more detailed description of the process for calculating the biomass estimates from the survey data is provided in Appendix 2.
16 Fisheries Research Report [Western Australia] No. 170, 2008
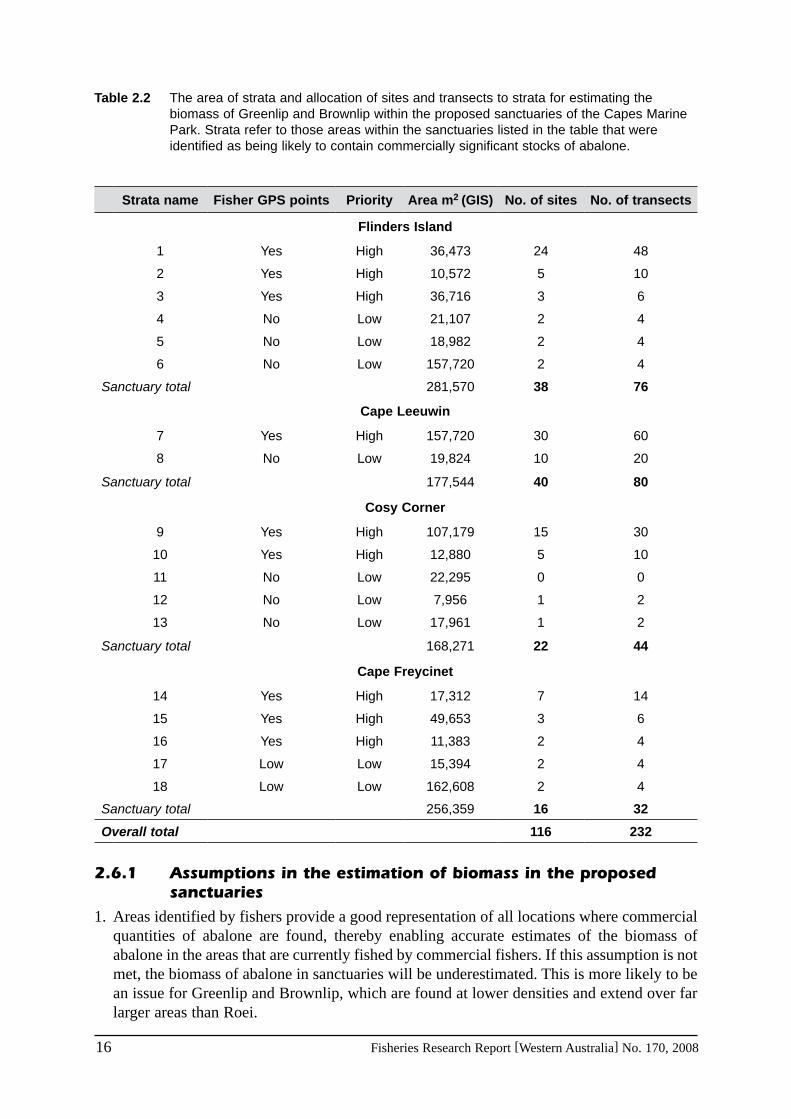
Table 2.2 The area of strata and allocation of sites and transects to strata for estimating the biomass of Greenlip and Brownlip within the proposed sanctuaries of the Capes Marine Park. Strata refer to those areas within the sanctuaries listed in the table that were identified as being likely to contain commercially significant stocks of abalone.
Strata name Fisher GPS points Priority Area m2 (GIS) No. of sites No. of transects
Flinders Island
1 Yes High 36,473 24 48
2 Yes High 10,572 5 10
3 Yes High 36,716 3 6
4 No Low 21,107 2 4
5 No Low 18,982 2 4
6 No Low 157,720 2 4
Sanctuary total 281,570 38 76
Cape Leeuwin
7 Yes High 157,720 30 60
8 No Low 19,824 10 20
Sanctuary total 177,544 40 80
Cosy Corner
9 Yes High 107,179 15 30
10 Yes High 12,880 5 10
11 No Low 22,295 0 0
12 No Low 7,956 1 2
13 No Low 17,961 1 2
Sanctuary total 168,271 22 44
Cape Freycinet
14 Yes High 17,312 7 14
15 Yes High 49,653 3 6
16 Yes High 11,383 2 4
17 Low Low 15,394 2 4
18 Low Low 162,608 2 4
Sanctuary total 256,359 16 32
Overall total 116 232
2.6.1 Assumptions in the estimation of biomass in the proposed sanctuaries
1. Areas identified by fishers provide a good representation of all locations where commercial quantities of abalone are found, thereby enabling accurate estimates of the biomass of abalone in the areas that are currently fished by commercial fishers. If this assumption is not met, the biomass of abalone in sanctuaries will be underestimated. This is more likely to be an issue for Greenlip and Brownlip, which are found at lower densities and extend over far larger areas than Roei.

Fisheries Research Report [Western Australia] No. 170, 2008 17
2. The counts of the scientific divers provide an accurate estimate of the abundance of abalone. The DoF divers have extensive experience in surveying abalone over a wide geographic area, and the initial field trip for Roei, undertaken with a commercial fisher, provided a level of confidence that this assumption is valid. The larger abalone, which are of most concern in this study, are less likely to be missed.
3. The method of taking into account the catch of abalone removed by fishing relies on the accuracy of information provided by fishers on their catches from the proposed sanctuaries during the 2006/07 fishing season. This assumption was verified partly by comparing reported catches with the logbook data, and through checking the consistency of the reported catches against the estimates of biomass determined from the survey data.
4. The estimate of natural mortality, M = 0.25 year-1, is a good estimate for each species. Uncertainty in M was taken into account by re-sampling values of this parameter from a broad distribution, rather than using just the point estimate of 0.25 year-1.
5. The biomass of abalone in sanctuaries in 2007 is representative of the average biomass over a number of years.
6. It is assumed, according to information provided by commercial fishers at an Abalone Industry Meeting held in July, 2007, that the harvest size for Roei is 70 mm at Cape Naturaliste options 1 and 2 and Wyadup, and 75 mm at Cape Leeuwin. Greenlip and Brownlip are assumed to be harvested commercially at 150 mm in the four sanctuaries surveyed.
2.7 Adjustment of biomass estimates for abalone removed by commercial fishing during the 2006/07 season
To adjust the estimates produced from the surveys for any commercial catches of abalone from the sanctuaries, fishers were contacted and asked to provide details of their catches taken during the 2006/07 fishing season, from 1/11/2006 to 18/6/2007. These dates were chosen to account for catches taken from the proposed sanctuaries in the period leading up to and during the surveys, and thus also account for impacts of commercial fishing for abalone on the survey biomass estimates. As the commencement date for the inclusion of catches was, to some extent, arbitrary, two catches reported for Roei taken at the end of October in 2006 were also included in the analyses. For each catch, the date, biomass (total weight for Roei and bled meat weight for Greenlip and Brownlip), species taken and name of proposed sanctuary were recorded. A detailed description of the methods used to adjust the survey biomass estimates for the catches reported by commercial fishers is provided in Appendix 2. The log book data held by DoF (10 x 10 nm blocks) were analysed to verify that the catches reported from the reserves were within the bounds that would be expected, based on those data.
Catches for Roei were reported between the end of October and the end of March. Greenlip and Brownlip catches were reported in January, February and June. Most catches reported by fishers were provided as a “beach weight” rather than “market weight”. Differences in beach and market weight of abalone were not accounted for in the biomass and catch estimates presented in this report. Data held by DoF indicate that the percentage weight reduction from beach to market weight of abalone is 3.6% for Roei, 5.8% for Greenlip and 7.5% for Brownlip.

18 Fisheries Research Report [Western Australia] No. 170, 2008
2.8 Estimates of current catch based on estimates of fishing mortality
Estimates of the current annual commercial catch taken from the proposed sanctuaries of the Capes region were determined by applying estimates of fishing mortality provided by DoF to the biomass estimates for each of the three species above the respective minimum sizes at which they are commercially harvested. Fishing mortality was determined from using growth information for the three species and catch curve analysis. Catch was estimated using the Baranov catch equation (see Appendix 4 for details).
2.9 Estimates of biologically sustainable catch based on reference point analyses
A reference point analysis was employed to determine the biologically sustainable catch that could be taken annually from the proposed sanctuaries. This analysis could also provide an estimate of the current annual catch taken by commercial fishers from the proposed sanctuaries, provided the stock is fully exploited (biologically). Biologically sustainable levels of catch were determined from the level of fishing of the available biomass according to the limit reference point of F = M (e.g. Thomson, 1993) and target reference points of either F = 0.6Flimit (Perry et al., 1999) or F = 0.75Flimit (Restrepo et al., 1998). Natural mortality was represented by a normal distribution with a mean of 0.25 year-1 and standard deviation of 0.05, and thus was within the range of ~0.2-0.35 year-1 reported in the literature for a number of abalone species (e.g. Shepherd et al., 1982). The sustainable catch was calculated as that at which the probability of being within 10% of the target reference point was maximised, but the probability of exceeding the limit reference point was less than 20%. Full details of the methods for determining initial biomass, available biomass and sustainable levels of catch are provided in Appendix 3.

Fisheries Research Report [Western Australia] No. 170, 2008 19
3.0 Results
3.1 Preliminary parametric sample size analysis
The preliminary sample size analyses for Roei indicated that the relative standard error (RSE) for the mean number of abalone per quadrat would decline substantially from ~50 to 30% as the number of quadrats increased from 4 to ~20 quadrats, but that the RSE would decline by only a further 5% if the number of quadrats were doubled from 20 to 40 (Figure 3.1). Likewise, for Greenlip, the preliminary sample size analyses indicated that the RSE would decline from ~40 to ~22% with an increase in the number of transects from 4 to 20, but decline only marginally with further increases in the number of transects sampled (Figure 3.1).
3.2 Length-weight relationships
The relationships between the natural logarithms (ln) of shell length (L) and total body weight (W) and bled meat weight (MW) were:
Roei
lnW = 3.048L – 8.905 (n = 80, R2 = 0.99, mean square = 0.019)
lnMW = 3.071L – 9.941 (n = 80, R2 = 0.98, mean square = 0.036)
Greenlip
lnW = 3.344L – 10.513 (n = 53, R2 = 0.98, mean square = 0.023)
lnMW = 3.363L – 11.590 (n = 53, R2 = 0.97, mean square = 0.035)
Brownlip
lnW = 2.922L – 8.311 (n = 50, R2 = 0.77, mean square = 0.017)
lnMW = 2.630L – 7.853 (n = 50, R2 = 0.74, mean square = 0.019).
The relationships between L and both W and MW were fitted well by power curves, which had been derived by back log-transforming the estimates of W and MW at each L, and correcting for bias (for equations, see Beauchamp and Olson, 1973) (Figure 3.2).
3.3 Length compositions of the three abalone species in the proposed sanctuaries
Between 15 and 39% of the individuals of Roei in the proposed sanctuaries surveyed were above the minimum size at which this species is currently commercially harvested in those areas (i.e. 70 mm at Cape Naturaliste options 1 and 2 and Wyadup, 75 mm at Cape Leeuwin) (Figure 3.3). The lowest proportion of harvest size animals was recorded at Wyadup (15%).

20 Fisheries Research Report [Western Australia] No. 170, 2008
Number of quadratrs
0 10 20 30 40 50
Rel
ativ
e st
anda
rd e
rro
r
0
10
20
30
40
50
60
Number of transects
0 10 20 30 40 50
Rel
ativ
e st
anda
rd e
rror
0
10
20
30
40
50
60
Roei
Greenlip
Figure 3.1 Preliminary analysis showing the relationship between relative standard error and sample size for densities of Roei and Greenlip, derived using data that existed for other stocks of these species, provided by the Department of Fisheries, Western Australia.

Fisheries Research Report [Western Australia] No. 170, 2008 21
Length (mm)
0 50 100 150 200
Ble
d m
eat w
eigh
t (g)
0
100
200
300
400
500
Length (mm)
0 50 100 150 200
Wei
ght (
g)
0
300
600
900
1200
1500
0 50 100 150 200
Ble
d m
eat
wei
ght (
g)
0
100
200
300
400
500
0 50 100 150 200
We
ight
(g)
0
200
400
600
800
1000
1200
0 20 40 60 80 100
Wei
ght (
g)
0
20
40
60
80
100
120
140
160
0 20 40 60 80 100
Ble
d m
eat
wei
ght (
g)
0
10
20
30
40
50
60Roei Roei
Greenlip Greenlip
Brownlip Brownlip
n = 80 n = 80
n = 53 n = 53
n = 50 n = 50
Figure 3.2 Relationships between length and the total wet weight and bled meat weight for the three species of abalone. The curves were produced by fitting linear regressions to the natural logarithms of the individual shell lengths and weights, back-transforming the weights predicted by the linear regression equations and a bias correction. n = number of abalone.

22 Fisheries Research Report [Western Australia] No. 170, 2008
0 20 40 60 80 100
0
10
20
30
40
0 20 40 60 80 100
Num
ber
of a
balo
ne
0
20
40
60
80
100
120
140
0 20 40 60 80 100
Num
ber
of a
balo
ne
0
10
20
30
40
50
60
0 20 40 60 80 100
0
10
20
30
40
50
60Cape Naturaliste Opt. 1 Cape Naturaliste Opt. 2
Wyadup Cape Leeuwin
n = 211
36% > 70 mm
n = 320
23% > 70 mm
n =148
39% > 75 mm
n = 710
15% > 70 mm
Length (mm)
0 20 40 60 80 100
Num
ber
of a
balo
ne
0
20
40
60
80
100
120Perth high density sites
n = 512
26% > 70 mm
Figure 3.3 Length-frequency histograms for Roei measured during the surveys in the proposed sanctuaries of the Capes region for which significant, currently commercially fished stocks were identified, and for Roei in high density areas near Perth, which were used to represent two strata for Cape Naturaliste Option 1 and one strata for Cape Leeuwin that could not be sampled. Roei above 75 mm (harvest size) are highlighted in black. n refers to sample size.

Fisheries Research Report [Western Australia] No. 170, 2008 23
The length frequency data for the Perth metropolitan area for sites containing high Roei densities and which were used to represent the three strata in the proposed sanctuaries that could not be sampled, had a similar proportion (26%) of animals above the minimum size that is commercially-harvested (70 mm) to that for Roei at Cape Naturaliste Option 2.
Almost half of the Greenlip in the proposed sanctuaries at Flinders Island, Cape Leeuwin, and Cosy Corner and Cape Freycinet (data combined for the latter two areas due to low sample sizes) were above the minimum size at which this species is commercially harvested (150 mm) (44, 42 and 46%, respectively, Figure 3.4). A similar situation was recorded for Brownlip, with about half (49%) of the individuals being of harvestable size (Figure 3.4). Note that that no weighting has been applied for pooling of data.
3.4 Biomass per unit area of Roei, Greenlip and Brownlip in the proposed sanctuaries
The mean biomass (kg / 100 m2) have been calculated for each species of abalone above their respective sizes at maturity and minimum sizes at which they are commercially harvested. The mean biomass (mean kg total body weight / 100 m2) for mature (> 45 mm) Roei was highest at Cape Leeuwin (142), followed by Cape Naturaliste Option 1 (125), Wyadup (67) and Cape Naturaliste Option 2 (56) (Figure 3.5). The mean biomass for commercial harvest-sized Roei (> 70 mm at Cape Naturaliste options 1 and 2 and Wyadup, 75 mm at Cape Leeuwin) was substantially higher at Cape Leeuwin (95) than at all other sanctuaries and was far higher for Cape Naturaliste Option 1 (53) than for Cape Naturaliste Option 2 (18) and Wyadup (16). The relative difference between the estimates of mature and harvest biomass 100 m2 of Roei was least at Cape Leeuwin and greatest at Wyadup. Note that the estimated densities for two strata at Cape Naturaliste Option 1 and one at Cape Leeuwin were taken from data for the Perth metropolitan region.
The mean biomasses (kg bled meat weight / 100 m2) for mature Greenlip (> 95 mm) were far higher at Cape Leeuwin (1.6) and Flinders Island (1.4), than at Cape Freycinet (0.6) and Cosy Corner (0.3) (Figure 3.5). The biomasses of commercial harvest-sized Greenlip (> 150 mm) were also higher at Flinders Island (0.8) and Cape Leeuwin (0.7) than at Cape Freycinet (0.5) and Cosy Corner (0.2). The biomasses of mature and commercial harvest-sized Greenlip were very low and nil, respectively in the low priority strata.

24 Fisheries Research Report [Western Australia] No. 170, 2008
Length (mm)
0 40 80 120 160 200 240
0
5
10
15
20
25
30
Length (mm)
0 40 80 120 160 200 240
Num
ber
of a
balo
ne
0
10
20
30
40
0 40 80 120 160 200 240
Num
ber
of a
balo
ne
0
10
20
30
40
0 40 80 120 160 200 240
0
10
20
30
40
50
60
70
Flinders Island - Greenlip Cape Leeuwin - Greenlip
Cosy Corner and Cape Freycinet - Greenlip Sites combined - Brownlip
n = 178
44% > 150 mm
n = 284
42% > 150 mm
n = 189
46% > 150 mm
n = 144
49% > 150 mm
Figure 3.4 Length-frequency histograms for Greenlip and Brownlip measured during the surveys in the proposed sanctuaries of the Capes region for which currently fished, commercial stocks were identified. Data have been pooled for sanctuaries with low sample sizes of each species. Abalone above 150 mm (harvest size) are highlighted in black. n refers to sample size.

Fisheries Research Report [Western Australia] No. 170, 2008 25
Sanctuary
FICL
CC CF L
Mea
t w
eig
ht
(kg
100
m2 )
0
1
2
3
FICL
CC CF L
Mea
t wei
ght
(kg
100
m2)
0
1
2
3
4
5
CN2CN1 W CL
Tot
al b
ody
wei
ght
(kg
100
m2
)
0
50
100
150
200
250
300Roei
Greenlip
Brownlip
Figure 3.5 Mean biomass (kg 100 m2) and upper 95% confidence intervals for mature (white bars) and harvest-sized (black bars) Roei, Greenlip and Brownlip, determined from the biomass estimates calculated using the survey data and applying a delta-log transformation. CN2, Cape Naturaliste Option 2; CN1, Cape Naturaliste Option 1; W, Wyadup; CL, Cape Leeuwin; CC, Cosy Corner; CF, Cape Freycinet; FI, Flinders Island; L, Low priority strata for Greenlip and Brownlip. Estimates for Roei in CN1 and CL have been adjusted using data for high Roei density sites near Perth.

26 Fisheries Research Report [Western Australia] No. 170, 2008
The mean biomass (kg bled meat weight / 100 m2) for mature (> 125 mm) and commercial harvest-sized (> 150 mm) Brownlip was greatest at Cape Leeuwin (0.8 and 0.7, respectively) and Cape Freycinet (0.5 and 0.4, respectively) and very low for the remaining sanctuaries and low priority strata (Figure 3.5).
3.5 Estimates of biomass of abalone in the proposed sanctuaries
For each species, estimates of total, mature, legal and commercial harvest biomass have been derived from (1) using the survey data alone and (2) using the survey data, and commercial catch data provided by fishers for the 2006/07 fishing season (Tables 3.1 to 3.3). The estimates of mature and harvest biomass are discussed below, as they provide the basis for calculating the biologically sustainable catch biomass and current annual catch.
3.5.1 Roei
The respective point estimates for mature and commercial harvest biomass of Roei in the proposed sanctuaries (in kg, total weight) from survey data alone were highest at Wyadup (32,574 and 7,965), followed by Cape Naturaliste Option 1 (12,975 and 5,490), Cape Naturaliste Option 2 (10,019 and 3,164) and Cape Leeuwin (1,064 and 710) (Table 3.1). The respective estimates were slightly higher for the combination of all sanctuaries surveyed excluding Cape Naturaliste Option 2, i.e. 46,613 and 14,165 than for all sanctuaries excluding Cape Naturaliste Option 1, i.e. 43,657 and 11,839 (Table 3.1). When catches were taken into account, the estimates of mature and commercial harvest biomass increased substantially for Cape Naturaliste Option 1 (15,458 and 7,186) and Wyadup (37,043 and 9,881) and slightly for Cape Naturaliste Option 2 (11,386 and 3,558). Overall, the estimates of mature and harvest biomass were 53,565 and 17,777, respectively, for all sanctuaries surveyed excluding Cape Naturaliste Option 2 and 49,493 and 14,149, respectively, for all sanctuaries excluding Cape Naturaliste Option 1 (Table 3.1). The 95% confidence intervals for biomass estimates were broad (Table 3.1).
3.5.2 Greenlip and Brownlip
From the survey data alone, the estimates of mature and commercial harvest biomass in the four sanctuaries surveyed for Greenlip and Brownlip (in kg, bled meat weight) were highest for Greenlip at Cape Leeuwin (3,000 and 1,181), followed by Flinders Island (983 and 574), Cape Freycinet (500 and 355) and Cosy Corner (355 and 232) (Table 3.2, 3.3). No commercial harvest

Fisheries Research Report [Western Australia] No. 170, 2008 27
Tab
le 3
.1
Est
imat
es,
deriv
ed f
rom
the
sur
vey
data
, of
tot
al,
mat
ure
(> 4
1 m
m s
hell
leng
th,
SL)
, le
gal (
> 6
0 m
m S
L) a
nd h
arve
st (
> 7
0 m
m S
L in
all
sanc
tuar
ies
exce
pt 7
5 S
L m
m f
or C
ape
Leeu
win
) bi
omas
s (in
kg,
tot
al w
eigh
t) f
or R
oei i
n (i)
eac
h of
the
str
ata
of t
he p
ropo
sed
Cap
e N
atur
alis
te,
Wya
dup
and
Cap
e Le
euw
in s
anct
uarie
s, (
ii) f
or a
ll st
rata
(±
95%
con
fiden
ce in
terv
als)
in e
ach
of t
hose
san
ctua
ries,
and
(iii
) su
m o
f th
e po
int
estim
ates
for
eac
h sa
nctu
ary,
exc
ludi
ng o
ne o
f ei
ther
of
the
two
optio
ns f
or C
ape
Nat
ural
iste
. B
iom
ass
estim
ates
adj
uste
d fo
r co
mm
erci
al
catc
hes
take
n fr
om t
he p
ropo
sed
sanc
tuar
ies
in t
he 2
006/
07 f
ishi
ng s
easo
n ar
e pr
ovid
ed f
or e
ach
sanc
tuar
y zo
ne,
and
for
all s
anct
uarie
s,
excl
udin
g on
e of
eith
er o
f th
e tw
o op
tions
for
Cap
e N
atur
alis
te.
***
Den
otes
str
ata
that
cou
ld n
ot b
e sa
mpl
ed a
nd f
or w
hich
bio
mas
s es
timat
es
wer
e pr
oduc
ed u
sing
dat
a fr
om t
he P
erth
met
ropo
litan
reg
ion.
Bio
mas
s es
tim
ates
fro
m s
urv
ey d
ata
on
lyB
iom
ass
esti
mat
es f
rom
su
rvey
an
d c
atch
dat
a
Str
ata
Str
ata
area
Tota
lM
atu
reL
egal
Har
vest
Tota
lM
atu
reL
egal
Har
vest
Cap
e N
atu
ralis
e O
pti
on
2A
2,70
03,
139
3,03
82,
219
1,00
7
BA
4,20
02,
017
1,93
11,
237
537
BB
11,0
005,
052
4,92
73,
546
1,37
5
Tota
ls17
,900
10,3
9010
,019
7,25
33,
164
11,7
7611
,386
8,13
03,
558
± 95
% C
Is6,
621-
17,4
916,
248-
16,5
194,
494-
11,9
591,
666-
6,29
47,
145-
20,3
626,
939-
19,2
795,
179-
14,1
612,
085-
7,43
5
Cap
e N
atu
ralis
te O
pti
on
1
BC
3100
7,58
12,
142
2,13
556
1
C50
0019
,186
3,30
73,
528
1,95
3
D**
*32
091
888
165
729
7
E**
*20
006,
504
6,40
25,
482
2,50
5
Tota
ls10
,420
36,5
4212
,975
12,2
115,
490
43,1
4915
,458
14,4
347,
186
± 95
% C
Is16
,967
-126
,497
9,98
4-18
,869
8,77
9-19
,831
3,70
4-10
,141
18,8
91-1
23,6
8911
,779
-21,
703
10,7
77-2
4,60
05,
123-
13,2
03
Wya
du
p
GA
3300
031
,083
26,6
5217
,527
5,61
2
GB
1570
06,
788
4,91
24,
185
2,20
5
GC
160
640
683
558
64
Tota
ls48
,860
38,4
7832
,574
22,4
027,
965
45,0
5137
,043
26,2
029,
881
± 95
% C
Is25
,013
-58,
658
22,1
91-4
8,42
815
,110
-33,
546
5,16
9-14
,001
30,2
21-6
8,03
426
,148
-56,
739
17,6
45-3
7,20
76,
424-
16,1
04
Cap
e L
eeu
win
HA
430
406
336
321
154
HB
***
320
748
718
617
521
Tota
ls75
01,
152
1,06
494
471
01,
152
1,06
494
471
0
± 95
% C
Is68
6-1,
934
642-
1,86
252
6-1,
818
337-
1,29
168
6-1,
934
642-
1,86
252
6-1,
818
337-
1,29
1
All
san
ctu
arie
s ex
clu
din
g C
ape
Nat
ura
liste
Op
tio
n 2
Su
m o
f sa
nct
uar
y p
oin
t es
tim
ates
76,1
7246
,613
35,5
5714
,165
89,3
5253
,565
41,5
8017
,777
All
san
ctu
arie
s ex
clu
din
g C
ape
Nat
ura
liste
Op
tio
n 1
Su
m o
f sa
nct
uar
y p
oin
t es
tim
ates
50,0
2043
,657
30,5
9911
,839
57,9
7949
,493
35,2
7614
,149

28 Fisheries Research Report [Western Australia] No. 170, 2008
Tab
le 3
.2.
E
stim
ates
(±
95%
con
fiden
ce in
terv
als)
of
tota
l, m
atur
e (>
95
mm
she
ll le
ngth
, S
L),
lega
l (>
140
mm
SL)
and
har
vest
(>
150
mm
SL)
bio
mas
s (in
kg,
ble
d m
eat
wei
ght)
for
Gre
enlip
, de
rived
fro
m (
i) th
e su
rvey
dat
a an
d (ii
) su
rvey
dat
a ad
just
ed u
sing
info
rmat
ion
prov
ided
by
com
mer
cial
fis
hers
on
thei
r ca
tche
s ta
ken
from
the
pro
pose
d sa
nctu
arie
s be
twee
n Ja
nuar
y an
d Ju
ne o
f 20
07.
For
eac
h sa
nctu
ary,
bio
mas
s es
timat
es h
ave
been
poo
led
for
all h
igh
prio
rity
stra
ta (
i.e.
thos
e de
term
ined
usi
ng G
PS
loca
tions
pro
vide
d by
fis
hers
). L
ow p
riorit
y st
rata
(i.e
. th
ose
dete
rmin
ed
with
out
GP
S lo
catio
ns p
rovi
ded
by f
ishe
rs)
have
bee
n po
oled
for
all
sanc
tuar
ies.
Su
rvey
bio
mas
s es
tim
ates
Est
imat
es a
dju
sted
fo
r ca
tch
Str
ata
area
Tota
lM
atu
reL
egal
Har
vest
Tota
lM
atu
reL
egal
Har
vest
Flin
der
s Is
lan
d -
hig
h p
rio
rity
str
ata
Est
imat
es71
,922
1,13
698
377
157
41,
447
1,21
497
075
5
± 95
% C
Is54
0-2,
343
478-
1,94
740
6-1,
648
298-
1,30
172
3-3,
052
640-
2,29
555
9-1,
875
434-
1,44
4
Cap
e L
eeu
win
- h
igh
pri
ori
ty s
trat
a
Est
imat
es17
7,54
53,
558
3,00
01,
876
1,18
14,
277
3,60
42,
380
1,59
1
± 95
% C
Is1,
574-
7,75
71,
516-
6,62
41,
046-
4,29
961
2-2,
989
2,22
7-10
,158
1,85
2-7,
810
1,34
2-4,
776
970-
3,15
9
Co
sy C
orn
er -
hig
h p
rio
rity
str
ata
Est
imat
es12
0,05
966
935
526
423
292
464
756
455
1
± 95
% C
Is20
6-2,
093
159-
925
117-
785
93-8
4546
1-2,
569
414-
1,33
044
4-1,
013
444-
1,11
3
Cap
e F
reyc
inet
- h
igh
pri
ori
ty s
trat
a
Est
imat
es78
,347
714
500
402
355
714
500
402
355
± 95
% C
Is21
7-2,
388
177-
1,30
112
7-1,
206
103-
1,01
321
7-2,
388
177-
1,30
112
7-1,
206
103-
1,01
3
Lo
w p
rio
rity
str
ata
- al
l sa
nct
uar
ies
Est
imat
es42
4,02
229
729
718
10
297
297
181
0
± 95
% C
Is14
8-2,
077
148-
2,07
71,
264
0-0
148-
2,07
714
8-2,
077
1,26
40-
0
All
san
ctu
arie
s
Su
m o
f p
oin
t es
tim
ates
6,37
45,
135
3,49
42,
342
7,65
96,
262
4,49
73,
252

Fisheries Research Report [Western Australia] No. 170, 2008 29
Tab
le 3
.3
Est
imat
es (
± 95
% c
onfid
ence
inte
rval
s) o
f to
tal,
mat
ure
(> 1
25 m
m s
hell
leng
th,
SL)
, le
gal (
> 1
40 m
m S
L) a
nd h
arve
st (
> 1
50 m
m S
L) b
iom
ass
(in k
g, b
led
mea
t w
eigh
t) f
or B
row
nlip
aba
lone
, de
rived
fro
m (
i) th
e su
rvey
dat
a an
d (ii
) su
rvey
dat
a ad
just
ed u
sing
info
rmat
ion
prov
ided
by
com
mer
cial
fis
hers
on
thei
r ca
tche
s ta
ken
from
the
pro
pose
d sa
nctu
arie
s be
twee
n Ja
nuar
y an
d Ju
ne o
f 20
07.
For
eac
h sa
nctu
ary,
bio
mas
s es
timat
es h
ave
been
poo
led
for
all h
igh
prio
rity
stra
ta (
i.e.
thos
e de
term
ined
usi
ng G
PS
loca
tions
pro
vide
d by
fis
hers
). L
ow p
riorit
y st
rata
(i.e
. th
ose
dete
rmin
ed w
ithou
t G
PS
loca
tions
pro
vide
d by
fis
hers
) ha
ve b
een
pool
ed f
or a
ll sa
nctu
arie
s.
Su
rvey
bio
mas
s es
tim
ates
Est
imat
es a
dju
sted
fo
r ca
tch
Str
ata
area
Tota
lM
atu
reL
egal
Har
vest
Tota
lM
atu
reL
egal
Har
vest
Flin
der
s Is
lan
d -
hig
h p
rio
rity
str
ata
Est
imat
es71
,922
148
115
110
102
180
139
124
125
± 95
% C
Is52
-573
43-5
5341
-570
38-2
7466
-578
60-6
7555
-268
50-4
21
Cap
e L
eeu
win
- h
igh
pri
ori
ty s
trat
a
Est
imat
es17
7,54
51,
431
1,38
61,
253
1,16
81,
799
1,71
91,
639
1,46
3
± 95
% C
Is65
3-4,
003
590-
3,98
655
6-3,
418
485-
3,81
388
3-5,
007
813-
3,92
084
9-4,
308
767-
4,13
3
Co
sy C
orn
er -
hig
h p
rio
rity
str
ata
Est
imat
es12
0,05
916
413
913
910
322
319
619
515
5
± 95
% C
Is82
-1,6
4366
-1,3
9166
-1,3
9152
-1,0
3312
7-1,
918
113-
1647
114-
1,64
997
-1,2
28
Cap
e F
reyc
inet
- h
igh
pri
ori
ty s
trat
a
Est
imat
es78
,347
395
377
289
285
395
377
289
285
± 95
% C
Is14
7-1,
068
138-
1,04
111
7-74
910
5-75
714
7-1,
068
138-
1,04
111
7-74
910
5-75
7
Lo
w p
rio
rity
str
ata
- al
l sa
nct
uar
ies
Est
imat
es42
4,02
227
823
223
223
227
823
223
223
2
± 95
% C
Is97
-1,5
1597
-1,5
1597
-1,5
1597
-1,5
1597
-1,5
1597
-1,5
1597
-1,5
1597
-1,5
15
All
san
ctu
arie
s
Su
m o
f p
oin
t es
tim
ates
2,41
62,
249
2,02
31,
890
2,87
52,
663
2,47
92,
260

30 Fisheries Research Report [Western Australia] No. 170, 2008
biomass was recorded for Greenlip in samples taken from the low priority areas. The mature and commercial harvest biomass of Brownlip were highest at Cape Leeuwin, i.e. 1,386 and 1,168, but low (< 400 total and harvest biomass) in all other sanctuaries surveyed. The overall estimates for mature and commercial harvest biomass, excluding catch, were 5,135 and 2,342, respectively, for Greenlip and 2,249 and 1,890, for Brownlip. When reported catches were taken into account, the respective estimates of mature and commercial harvest biomass for Greenlip had increased to 1,214 and 755 for Flinders Island, 3,604 and 1,591 for Cape Leeuwin and 647 and 551 for Cosy Corner. For Brownlip, these had increased to 139 and 125 for Flinders Island, 1,719 and 1,463 for Cape Leeuwin and 196 and 155 for Cosy Corner. The overall estimates of mature biomass, taking catch into account increased by about 1,000 kg for Greenlip (to 6,262 and 3,252 kg) and by about 400 kg for Brownlip (2,663 and 2,260 kg, Tables 3.2, 3.3).
The proportion of commercial harvest biomass to mature biomass in the proposed sanctuaries was lower for Roei than for both Greenlip and Brownlip (Tables 3.1 to 3.3). Thus, for example, from the biomass estimates alone, the ratio of harvest biomass to mature biomass for Roei in all sanctuaries sampled excluding either Cape Naturaliste Option 1, or Cape Naturaliste Option 2 was 0.30 : 1, and 0.29 : 1, respectively, but was 0.46 : 1 for Greenlip and as high as 0.84 : 1 for Brownlip (for all sanctuaries sampled for Greenlip and Brownlip).
3.6 Estimates of biologically sustainable catch and current annual commercial catch
For each species, estimates are provided for the levels within the proposed sanctuaries of 1.) biologically sustainable catch, i.e. based on reference point analyses and 2.) average current annual catch, i.e. based on estimates of fishing mortality. The calculations for biologically sustainable catch and current catch estimates have been undertaken for both the survey biomass estimates alone, and these estimates, taking catch into account.
3.6.1 Roei
For Roei, the estimates of biologically sustainable catch were similar but mostly slightly higher than those of the current catch (Table 3.4). Thus, for example, if Ftarget = 0.6Flimit, and on the basis of the biomass estimates derived taking catch into account, the estimates of biologically sustainable catch and current catch were 6,590 and 5,579, respectively, for all sanctuaries combined, excluding Cape Naturaliste Option 2, and 5,770 and 4,770, respectively, for all sanctuaries combined, excluding Cape Naturaliste Option 1. The values determined for biologically sustainable

Fisheries Research Report [Western Australia] No. 170, 2008 31
Tab
le 3
.4.
E
stim
ates
(kg
, to
tal w
eigh
t),
for
Roe
i in
the
prop
osed
san
ctua
ries,
of
sust
aina
ble
catc
h bi
omas
s, a
s de
rived
fro
m t
he r
efer
ence
poi
nt a
naly
ses,
an
d av
erag
e an
nual
cat
ch,
as d
eter
min
ed b
y ap
plyi
ng a
n es
timat
e of
F o
n ha
rves
t bi
omas
s (e
stim
ate
of F
pro
vide
d by
DoF
). B
oth
anal
yses
as
sum
e M
= 0
.25
year
-1 a
nd w
ere
perf
orm
ed o
n bo
th t
he b
iom
ass
estim
ates
der
ived
fro
m t
he s
urve
y da
ta o
nly,
and
on
the
biom
ass
estim
ates
ad
just
ed f
or c
omm
erci
al c
atch
es r
epor
ted
from
the
pro
pose
d sa
nctu
arie
s zo
nes
durin
g th
e 20
06/0
7 fis
hing
sea
son.
Con
fiden
ce in
terv
als
have
be
en e
stim
ated
usi
ng r
e-sa
mpl
ing
to t
ake
into
acc
ount
unc
erta
inty
in t
he e
stim
ates
of
biom
ass,
M a
nd F
. N
ote
that
the
est
imat
es o
f su
stai
nabl
e bi
omas
s do
not
tak
e in
to a
ccou
nt t
he e
cono
mic
s of
har
vest
ing
abal
one
of d
iffer
ent
size
s.
Est
imat
es d
eriv
ed u
sin
g s
urv
ey d
ata
on
lyE
stim
ates
der
ived
usi
ng
su
rvey
dat
a an
d i
nfo
rmat
ion
on
co
mm
erci
al c
atch
es
Est
imat
es o
f bi
olog
ical
ly
sust
aina
ble
catc
hE
stim
ates
of
biom
ass
of
curr
ent
catc
hE
stim
ates
of
biol
ogic
ally
su
stai
nabl
e ca
tch
Est
imat
es o
f bi
omas
s of
cur
rent
cat
ch
Fta
rge
t = 0
.6 F
limit
or =
0.7
5 F
limit
F =
0.3
4-0.
54 y
ear-1
Fta
rge
t = 0
.6 o
r 0.
75 F
limit
F =
0.3
4-0.
54 y
ear-1
Cap
e N
atu
ralis
e O
pti
on
2
Est
imat
e1,
140
or 1
,430
999
1,24
0 or
1,6
701,
164
± 95
% C
Is54
3-2,
012
636-
2,25
4
Cap
e N
atu
ralis
te O
pti
on
1
Est
imat
e1,
650
or 2
,040
1,77
42,
060
or 2
,360
2,27
3
± 95
% C
Is1,
123-
3,45
31,
523-
4,14
5
Wya
du
p
Est
imat
e4,
250
or 4
,550
2,
522
4,40
0 or
5,5
503,
083
± 95
% C
Is1,
566-
4,48
82,
007-
5,19
8
Cap
e L
eeu
win
Est
imat
e13
0 or
150
223
130
or 1
5022
3
± 95
% C
Is12
3-44
012
3-44
0
All
san
ctu
arie
s ex
clu
din
g C
ape
Nat
ura
liste
Op
tio
n 2
Su
m o
f es
tim
ates
6,03
0 o
r 6,
740
4,51
96,
590
or
8,16
05,
579
All
san
ctu
arie
s ex
clu
din
g C
ape
Nat
ura
liste
Op
tio
n 1
Su
m o
f es
tim
ates
5,52
0 o
r 6,
130
3,74
45,
770
or
7,37
04,
470

32 Fisheries Research Report [Western Australia] No. 170, 2008
catch and current catch were greatest when catch was taken into account, and were highest at Wyadup, followed by Cape Naturaliste Option 1, Cape Naturaliste Option 2 and Cape Leeuwin (Table 3.4; Figure 3.6).
3.6.2 Greenlip and Brownlip
As with Roei, the estimates of biologically sustainable catch were similar to those derived by applying fishing mortality for Greenlip, but the former was less for Brownlip (Tables 3.5, 3.6). For example, if Ftarget = 0.6Flimit, and on the basis of the biomass estimates (kg, bled meat weight) derived by taking catch into account, the estimates of biologically sustainable catch and current catch in all sanctuaries combined were 730 and 993, respectively, for Greenlip and 300 and 557, respectively, for Brownlip (Table 3.5,3.6). The values for biologically sustainable catch and current catch were slightly greater when catch was taken into account, and were greatest for both species in the proposed sanctuary at Cape Leeuwin.

Fisheries Research Report [Western Australia] No. 170, 2008 33
Figure 3.6 Sustainable biomass (figures on the left), calculated from reference point analyses, and estimated annual catch (figures on right), as determined from estimates of fishing mortality and biomass, for Roei (tones, total weight) in the proposed sanctuaries of the Capes region. Trends in this figure are based on the biomass estimates employing both survey and catch data. Solid and dotted lines refer to the probability (expressed as a percentage), respectively, of each level of catch exceeding the limit reference point (F=M) and falling with 10% of the target reference point (F=0.6*Limit reference point). Arrows are used to highlight point estimates of sustainable catches and estimated annual catches.

34 Fisheries Research Report [Western Australia] No. 170, 2008
Tab
le 3
.5
Est
imat
es (
kg,
bled
mea
t w
eigh
t),
for
Gre
enlip
in t
he p
ropo
sed
sanc
tuar
ies,
of
sust
aina
ble
catc
h bi
omas
s, a
s de
rived
fro
m t
he r
efer
ence
poi
nt
anal
yses
, an
d av
erag
e an
nual
cat
ch,
as d
eter
min
ed b
y ap
plyi
ng a
n es
timat
e of
F o
n ha
rves
t bi
omas
s (e
stim
ate
of F
pro
vide
d by
DoF
). B
oth
anal
yses
ass
ume
M =
0.2
5 ye
ar-1
and
wer
e pe
rfor
med
on
both
the
bio
mas
s es
timat
es d
eriv
ed f
rom
the
sur
vey
data
, an
d bi
omas
s es
timat
es
adju
sted
for
com
mer
cial
cat
ches
rep
orte
d fr
om t
he p
ropo
sed
sanc
tuar
ies
durin
g th
e 20
06/0
7 fis
hing
sea
son.
Con
fiden
ce in
terv
als
have
bee
n es
timat
ed u
sing
re-
sam
plin
g to
tak
e in
to a
ccou
nt u
ncer
tain
ty in
the
est
imat
es o
f bi
omas
s, M
and
F.
Not
e th
at t
he e
stim
ates
of
sust
aina
ble
biom
ass
do n
ot t
ake
into
acc
ount
the
eco
nom
ics
of h
arve
stin
g ab
alon
e of
diff
eren
t si
zes.
Est
imat
es d
eriv
ed u
sin
g s
urv
ey d
ata
on
lyE
stim
ates
der
ived
usi
ng
su
rvey
dat
a an
d i
nfo
rmat
ion
on
co
mm
erci
al c
atch
es
Est
imat
es o
f bi
olog
ical
ly
sust
aina
ble
catc
hE
stim
ates
of
biom
ass
of c
urre
nt
catc
hE
stim
ates
of
biol
ogic
ally
su
stai
nabl
e ca
tch
Est
imat
es o
f bi
omas
s of
cur
rent
cat
ch
Fta
rge
t =
0.6
Flim
it or
= 0
.75
Flim
itF
= 0
.34-
0.49
yea
r-1F
targ
e t =
0.6
or
0.75
Flim
itF
= 0
.34-
0.49
yea
r-1
Flin
der
s Is
lan
d
Est
imat
e13
0 or
130
174
140
or 1
6022
8
± 95
% C
Is89
-356
129-
431
Cap
e L
eeu
win
Est
imat
e35
0 or
410
356
440
or 5
1049
5
± 95
% C
Is19
3-79
227
7-98
0
Co
sy C
orn
er
Est
imat
e30
or
3074
80 o
r 90
169
± 95
% C
Is31
-243
128-
330
Cap
e F
reyc
inet
Est
imat
e50
or
5010
150
or
5010
1
± 95
% C
Is30
-303
30-3
03
Lo
w p
rio
rity
Est
imat
e20
or
200
20 o
r 20
0
± 95
% C
Is
All
san
ctu
arie
s
Sum
of
estim
ates
580
or
640
705
730
or
830
993
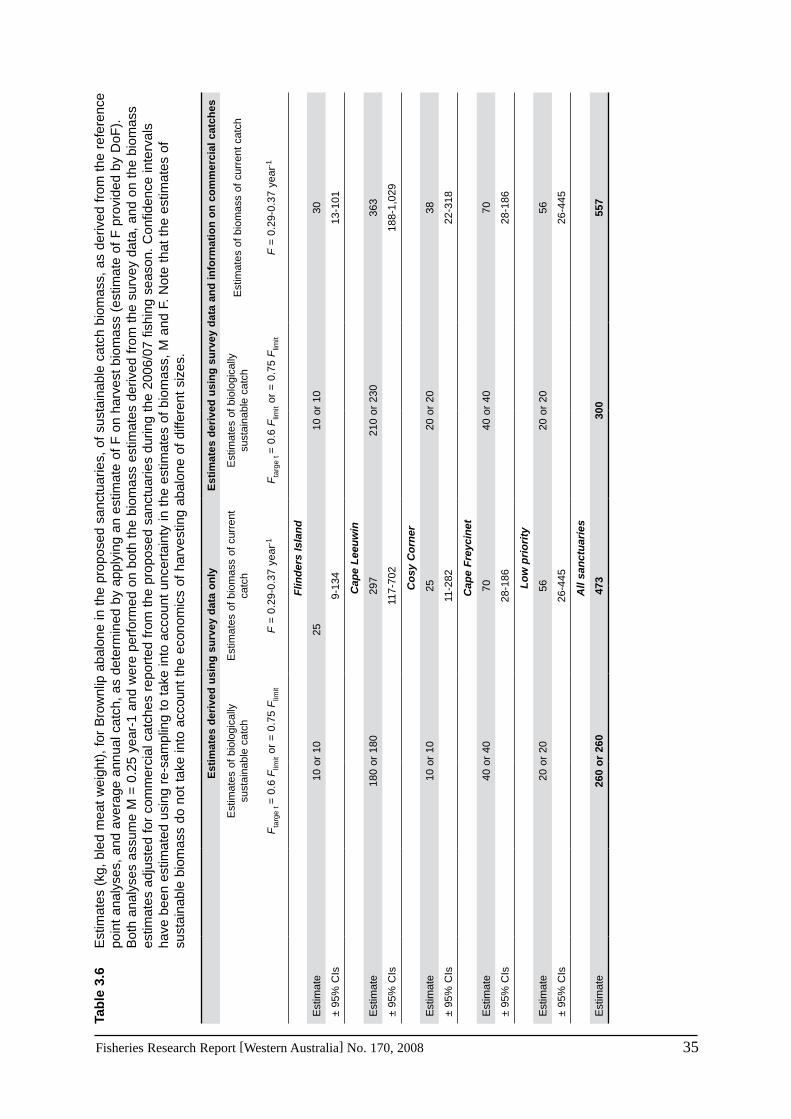
Fisheries Research Report [Western Australia] No. 170, 2008 35
Tab
le 3
.6
Est
imat
es (
kg,
bled
mea
t w
eigh
t),
for
Bro
wnl
ip a
balo
ne in
the
pro
pose
d sa
nctu
arie
s, o
f su
stai
nabl
e ca
tch
biom
ass,
as
deriv
ed f
rom
the
ref
eren
ce
poin
t an
alys
es,
and
aver
age
annu
al c
atch
, as
det
erm
ined
by
appl
ying
an
estim
ate
of F
on
harv
est
biom
ass
(est
imat
e of
F p
rovi
ded
by D
oF).
B
oth
anal
yses
ass
ume
M =
0.2
5 ye
ar-1
and
wer
e pe
rfor
med
on
both
the
bio
mas
s es
timat
es d
eriv
ed f
rom
the
sur
vey
data
, an
d on
the
bio
mas
s es
timat
es a
djus
ted
for
com
mer
cial
cat
ches
rep
orte
d fr
om t
he p
ropo
sed
sanc
tuar
ies
durin
g th
e 20
06/0
7 fis
hing
sea
son.
Con
fiden
ce in
terv
als
have
bee
n es
timat
ed u
sing
re-
sam
plin
g to
tak
e in
to a
ccou
nt u
ncer
tain
ty in
the
est
imat
es o
f bi
omas
s, M
and
F.
Not
e th
at t
he e
stim
ates
of
sust
aina
ble
biom
ass
do n
ot t
ake
into
acc
ount
the
eco
nom
ics
of h
arve
stin
g ab
alon
e of
diff
eren
t si
zes.
Est
imat
es d
eriv
ed u
sin
g s
urv
ey d
ata
on
lyE
stim
ates
der
ived
usi
ng
su
rvey
dat
a an
d i
nfo
rmat
ion
on
co
mm
erci
al c
atch
es
Est
imat
es o
f bi
olog
ical
ly
sust
aina
ble
catc
hE
stim
ates
of
biom
ass
of c
urre
nt
catc
hE
stim
ates
of
biol
ogic
ally
su
stai
nabl
e ca
tch
Est
imat
es o
f bi
omas
s of
cur
rent
cat
ch
Fta
rge
t =
0.6
Flim
it or
= 0
.75
Flim
itF
= 0
.29-
0.37
yea
r-1F
targ
e t =
0.6
Flim
it or
= 0
.75
Flim
itF
= 0
.29-
0.37
yea
r-1
Flin
der
s Is
lan
d
Est
imat
e10
or
1025
10 o
r 10
30
± 95
% C
Is9-
134
13-1
01
Cap
e L
eeu
win
Est
imat
e18
0 or
180
297
210
or 2
3036
3
± 95
% C
Is11
7-70
218
8-1,
029
Co
sy C
orn
er
Est
imat
e10
or
1025
20 o
r 20
38
± 95
% C
Is11
-282
22-3
18
Cap
e F
reyc
inet
Est
imat
e40
or
4070
40 o
r 40
70
± 95
% C
Is28
-186
28-1
86
Lo
w p
rio
rity
Est
imat
e20
or
2056
20 o
r 20
56
± 95
% C
Is26
-445
26-4
45
All
san
ctu
arie
s
Est
imat
e26
0 o
r 26
047
330
055
7

36 Fisheries Research Report [Western Australia] No. 170, 2008
4.0 Discussion
The procedures to estimate the levels of catch in the proposed sanctuaries involve many steps and assumptions. The overall approach and important assumptions are discussed before the estimates of catches foregone in the proposed sanctuaries are documented and interpreted in sections 4.3 and 4.4.
4.1 Preliminary sample size analyses
As the preliminary analyses for sample size, based on the existing DoF data for Roei and Greenlip, demonstrated that the RSE for mean density declined substantially as the number of replicate samples increased from 4 to 20, but declined only marginally with further increases in sample size, ~20 replicates is likely to be a sufficient sample size for these two species. In the case of Roei, for which between 20 to 48 replicate quadrats were able to be sampled in each sanctuary zone, the RSE values (as determined using untransformed survey data for mean density of all sizes – data not shown) ranged between 17 and 29. For Greenlip, for which between 16 and 38 replicate transects (pooled data for the two 30 x 1m transects at each site) were recorded for each sanctuary zone, the RSE values ranged between 27 and 41. It is likely that the higher RSE values for Greenlip than Roei are due to greater natural variability in Greenlip densities in the proposed sanctuaries.
The RSE values for Brownlip, which were sampled at the same sites and times as Greenlip, were often higher than for Greenlip, probably because of the lower abundances and more patchy distribution of Brownlip in the proposed sanctuaries than Greenlip. It should also be noted that the RSE values for all species are lower than those reported when derived using transformed data (as we used for the biomass analyses) than untransformed data.
4.2 Sampling design
4.2.1 Identification of sampling areas through commercial fisher knowledge
Due to the short time line for our study (approximately 9 months to design and undertake the surveys, and to analyse the results), it was not feasible to undertake a rigorous, systematic approach to survey for abalone stocks in each of the proposed sanctuaries of the Capes marine park, as was undertaken by Carlson et al. (2006). In our study, we thus identified those locations within the sanctuaries that house abalone in commercial quantities through approaching those fishers with knowledge of those locations. The information provided to us independently by different fishers on the locations of abalone stocks within the proposed sanctuaries was very consistent, which provides us with some confidence that the areas identified in this way contained the most important abalone stocks. We thus consider that our approach of employing fisher knowledge in a study such as ours was very effective.
Although there is a possibility that, in some circumstances, there may be disincentives for certain fishers to provide accurate information on the location of abalone stocks in areas proposed as future sanctuaries, we believe the biomass estimates produced in this study point very strongly to the conclusion that the areas within the proposed sanctuaries identified by commercial fishers were indeed those which contained the most important abalone stocks. In this context, it is relevant that the previous estimates provided by industry of loss of product

Fisheries Research Report [Western Australia] No. 170, 2008 37
through implementing the proposed sanctuaries in the Capes region were higher than those derived by DoF based on the commercial log book data.
4.2.2 Prioritisation of sampling areas
As outlined in section 2.1, we have prioritised our sampling in those areas which, on the basis of the consensus of information provided by the commercial fishers, were considered to be currently commercially-fished. All areas identified by the commercial fishers were sampled for Roei, except for 1) two strata at Cape Naturaliste Option 1 and at Cape Leeuwin, which were unable to be sampled due to weather conditions and for which data from the metropolitan region were used as a surrogate (see methods) and 2) Cowaramup Bay, a recreation zone, which thus would not be accessible to commercial fishers operating in the Capes Marine Park. Although the Roei fishers interviewed mostly indicated that this area has been left by the commercial abalone industry to recreational fishers, and that it has not been fished commercially for a number of years, there was a view put forward that at least one commercial fisher still operates in Cowaramup Bay.
The decision to target our sampling for Greenlip and Brownlip largely towards those (high priority) areas identified by fishers through the provision of GPS positions was based on our view that these are the locations that are most likely to be currently fished. As GPS data were not provided for those sanctuaries in the northern part of the Capes region and for which the commercial log book data clearly show that almost no Greenlip and Brownlip have been taken from these areas over the last 10 years, those northern zones were not sampled. We acknowledge that those areas identified only from fishers’ sketches (low priority areas) were not sampled intensively and thus the biomass estimates for those areas are far less reliable than those for the high priority areas.
4.2.3 Rationale for sampling methodology for Roei
The method used to sample Roei followed the standard methodology employed by DoF to survey this species, i.e. systematic sampling using quadrats placed at equally-spaced intervals along transect lines (e.g. Hancock, 2004). We decided to use systematic sampling for Roei, as this method was likely to enable more quadrats to be sampled during the short time available in the project for sampling, i.e. less moving between sampling locations, and as DoF staff routinely use this methodology in their Roei stock monitoring programs in the Perth metropolitan region. There is some debate as to whether it is more appropriate to use random sampling (or stratified random sampling) rather than systematic sampling. If neighbouring sampling units are not independent, it is not as statistically appropriate to assess error (Bourdeau, 1954). However, some workers argue for systematic sampling due to its ease of applicability in the field and their belief that such sampling is more likely to include the variations of the population throughout the habitat, and in some cases, this has been demonstrated to be true (see Bourdeau, 1954). A major determinant of the variability in Roei density and size is the offshore habitat gradient (Hancock, 2004). As, in the Capes region, Roei typically occur over a very narrow band along shore (~ 6 m wide), systematic sampling would have helped ensure the habitats were sampled adequately. We acknowledge the potential that our samples were not completely statistically-independent. If this was the case, the estimates of error for the calculated values of biomass will be underestimated. There would also be value in comparing various other statistical approaches for determining abundance or biomass of Roei, e.g. kriging.

38 Fisheries Research Report [Western Australia] No. 170, 2008
4.2.4 Rationale for sampling methodology for Greenlip and Brownlip
Our sampling approach for Greenlip and Brownlip has been adapted from that of McGarvey et al. (in press) (outlined in Carlson et al., 2006) and proved a very time efficient method of sampling these species. In developing the sampling design, an alternate approach was discussed, where patches of abalone were identified, mapped and the biomass of each patch estimated. The latter approach was not considered feasible, primarily due to the short time constraints of the project. However, if future surveys are undertaken, habitat maps and distribution maps for abalone would be valuable.
4.3 Implications of the biomass estimates for the three abalone species
4.3.1 Comparisons between biomass estimates determined with and without commercial catch
As demonstrated by the results of the biomass analyses, all three species occur in commercial quantities in the proposed sanctuaries. Estimates of biomass have been determined using the survey data only and by using both the survey data and reported catches from the proposed sanctuaries. The biomass method from survey data alone assumes that the stock is in equilibrium under the processes of growth, recruitment and fishing mortality, and thus the estimates of biomass derived by this method represent the biomass available at the mid-point of the survey. In contrast, the biomass estimate taking catch into account, assumes that the period from the start of the fishing season to the mid-point of the survey was of such a short duration that growth was negligible (and thus growth had minimal influence on the biomass estimates), the population was closed to recruitment and migration, and that the survey estimate of biomass represents the survival of abalone from both fishing and natural mortality (see appendix 3 for more detail). As the abalone season in the Capes region for the three species concentrated at certain periods of the year, we consider the approach which takes into account commercial catches is the most appropriate method for estimating biomass. The commercial abalone fishers also believe strongly that information on their catches needs to be included in the biomass estimates.
A major difference between the two methods is that the estimate that takes catch into account relies on the accuracy of the reported values of commercial catches taken from the proposed sanctuaries. Although it is not possible to validate completely the reported commercial catch values, they are, as far as can be compared, consistent with the fisher log book data held by DoF. Furthermore, the catch information is entirely consistent with the estimates of biomass derived using the survey data, both overall (1,487 kg whole weight for Roei, and 525.5 and 195 kg bled meat weight, respectively, for Greenlip and Brownlip) and for each proposed sanctuary, i.e. estimates were only reported for those sanctuaries that were surveyed (with one exception, a catch of 253 kg of Roei reported from the Injidup sanctuaries, was not included as we have assumed the Injidup sanctuary begins 200 m offshore, as according to the maps of the “Have Your Say” brochure), and the values were almost invariably substantially less than the estimates of harvest biomass calculated using the survey data. Thus, we conclude that the estimates derived by taking catch into account should be used for deriving any estimates of compensation and the results using this estimate are discussed below.

Fisheries Research Report [Western Australia] No. 170, 2008 39
4.3.2 Biomass estimates for Roei
The results from this study highlight that there is substantial harvest biomass of Roei at Wyadup, Cape Naturaliste (at both of the proposed two options) and to a lesser extent, also at Cape Leeuwin. The harvest biomass of Roei (taking catch into account) was greater in the first than second of the proposed options for Cape Naturaliste, i.e. 7,186 vs 3,558 kg. Furthermore, as the overall area of the strata in which Roei are found at Cape Naturaliste Option 1 (10,420 m2) is substantially less than at Cape Naturaliste Option 2 (17,900 m2) (see Table 3), the harvest biomasses per unit area are greater at Cape Naturaliste Option 1 (Figure 5). For the above reasons, Cape Naturaliste Option 1 would be of far more value to commercial Roei fishers than Cape Naturaliste Option 2.
Although the estimate of harvest biomass for Roei was highest at Wyadup (9,881 kg), the overall area in which Roei are found at Wyadup (48,860 m2) is far larger than, for example, at Cape Naturaliste Option 1. The harvest biomasses per unit area are thus lower for Roei at Wyadup than at Cape Naturaliste Option 1 and the length-frequencies demonstrate that the proportion of Roei above harvest size is far higher at Cape Naturaliste Option 1 (36% harvest size) than at Wyadup (15% harvest size). Thus, the proposed sanctuary at Cape Naturaliste Option 1 may be of greater value to commercial Roei fishers than that at Wyadup.
4.3.3 Biomass estimates for Greenlip and Brownlip
In terms of harvest biomass (taking catch into account), Cape Leeuwin was by far the most important of the proposed sanctuaries for both Greenlip and Brownlip, although the densities of harvest size animals were slightly higher in the areas sampled for Greenlip at Flinders Island than at Cape Leeuwin. Substantial biomass > 200 kg (bled meat weight) of Greenlip was also found in the proposed sanctuaries at Flinders Island, Cosy Corner and Cape Freycinet, and for Brownlip at Flinders Island and Cosy Corner.
4.4 Interpretation of the results of the catch estimates based on harvest fishing mortality and reference point analyses
Two methods have been employed that may potentially provide estimates of the average current annual catch of each abalone species from the proposed sanctuaries. The first employs estimates of fishing mortality for harvest size animals (provided by DoF) and the second employs a reference point analysis. The validity of using the former method depends on the accuracy of the available estimates of fishing mortality, natural mortality, and of harvest biomass. In comparison, the validity of using the reference point method for estimating current annual catch depends on the accuracy of the estimates for natural mortality and mature biomass, on the appropriate choice of reference points (i.e. values of F corresponding to the limit and target catch), and on the assumption that the stock is fully-exploited (biologically).
The fact that the catch values produced using the two different methods were similar, in the case of Roei and Greenlip indicate that these two species in the proposed sanctuaries are currently harvested close to, or at full biological exploitation. In the case of Brownlip, the estimates of catch produced by the reference point analyses were higher than those derived by applying the DoF estimates of fishing mortality for harvest size animals (which would indicate over-harvesting), but the data for Brownlip were far less than for the other two species and insufficient to draw a reliable conclusion as to its current level of biological exploitation.

40 Fisheries Research Report [Western Australia] No. 170, 2008
Although both the method of applying F on harvest biomass and the reference point based analysis could potentially be used to provide estimates of catch foregone, we consider the estimates of catch forgone derived from the former method are most appropriate. This conclusion is based on our view that use of the reference point analysis for estimating catch forgone should require 1) a sound knowledge of the current levels of biological exploitation of each of the three abalone species in the proposed sanctuaries (which we do not have), and 2) determination, through consultation with all stakeholders, of the most appropriate choice of reference point, as the objectives associated with the choice of reference point are likely to differ between stakeholders.
4.5 Considerations for further research1. The time line for the current project was very short (i.e. ~9 months to design the sampling
regime, undertake the analyses and interpret the results). As growth of abalone can be highly variable between locations, it would have been ideal to derive the estimates of mortality used for the subsequent analyses more directly by using age composition data for abalone in the areas in question, or at least, from using growth data derived for abalone from the proposed sanctuaries (see also discussion in appendix 4).
2. The results of many of the analyses in this report are dependant on estimates of natural mortality and fishing mortality that were taken from the literature or from data in other areas. If the proposed sanctuaries are implemented, these would provide an ideal opportunity for further work on to estimate natural mortality for each of the three species in the region, which would be valuable for a variety of purposes.

Fisheries Research Report [Western Australia] No. 170, 2008 41
5.0 ReferencesBeauchamp, J.J. and Olson, J.O. (1973). Corrections for bias in regression estimates after logarithmic
transformation. Ecology 54, 1403-1407.
Bourdeau, P.F. (1953). A test of random versus systematic ecological sampling. Ecology 34, 499-512.
Carlson, I.J., Mayfield, S., McGarvey, R. and Dixon, C.D. (2006). Exploratory fishing and population biology of greenlip abalone (Haliotis laevigata) off Cowell. SARDI Aquatic Sciences Publication No. RD04/0223-2. SARDI Research Report Series No. 127.
Folmer, O. and Pennington, M. (2000). A statistical evaluation of the design and precision of the shrimp trawl survey off West Greenland. Fisheries Research 49, 165-178.
Hancock, B.T. (2004). The biology and fishery for Roe’s abalone Haliotis roei in south-western Australia with emphasis on the Perth fishery. PhD Thesis. University of Western Australia.
Hart, A. and Fabris, F. (2005). Greenlip Brownlip abalone managed fishery status report. In. State of the Fisheries Report 2006/2007 (eds W.J. Fletcher and F. Head). Department of Fisheries, Western Australia.
Hart, A.M., Syers, C. and Hall, N. (2000). Stock assessment and modeling for management of the WA greenlip abalone fishery. Final Report to Fisheries Research and Development Corporation. Project No: 95/143.
Hart, A. Fabris, F. and Kennedy, J. (2005). Roe’s abalone managed fishery status report. In. State of the Fisheries Report 2004/2005 (eds W.J. Fletcher and F. Head) Department of Fisheries, Western Australia.
Hilborn, R. and Walters, C.J. (1992) Quantitative Fisheries Stock Assessment: Choice Dynamics and Uncertainty. New York: Chapman & Hall, 570 pp.
Keesing J (1984). Reproductive biology of the abalone Haliotis roei Gray, 1827, in south-western Australia. Honours Thesis. Murdoch University, Western Australia. 99 pp.
Lo, N.C.H., Jacobson, L.D. and Squire, J.L. (1992). Indices of relative abundance from fish spotter data based on delta-lognormal models. Canadian Journal of Fisheries and Aquatic Sciences 49, 2515-2526.
Madrid-Vera, J., Amezcua, F. and Morales-Bojórquez, E. (2007). An assessment approach to estimate biomass of fish communities from bycatch data in a topical shrimp-trawl fishery. Fisheries Research 83, 81-89.
McGarvey, R., Mayfield, S. and Feenstra, J. (2005). Biomass of greenlip (Haliotis laevigata) and blacklip (H. rubra) abalone in Waterloo Bay, South Australia. Report to PIRSA Fisheries. SARDI Research Report Series No. 114. Publication No. RD 05/0024-1.
McGarvey, R., (in press). Assessing survey methods for greenlip in South Australia. Final Report to the Fisheries Research and Development Corporation: Project 2001/076 (as cited in Carlson et al., 2006).
Metzner, R., Crowe, F.M. and Borg, N.J. (2001). Intial allocation of ITQS in the Western Australia abalone fishery. In. Case studies on the allocation of transferable quota rights in fisheries. (ed. Shottom, R). FAO Fisheries Technical Paper. No. 411. Rome, FAO. 373 pp.
Mitchell, R. and Baba, O. (2006). Multi-sector resource allocation and integrated management of abalone stocks in Western Australia: review and discussion of management strategies. Fisheries Science 72, 278-288.
Myers, R.A. and Pepin, P. (1990). The robustness of lognormal-based estimators of abundance. Biometrics 46, 1185-1192.

42 Fisheries Research Report [Western Australia] No. 170, 2008
Otriz, M., Legault, C.M. and Ehrhardt, N.M. (2000). An alternative method for estimating bycatch from the U.S. shrimp trawl fishery in the Gulf of Mexico, 1972-1995. Fishery Bulletin 98, 583-599.
Pauly, D. (1984). Fish population dynamics in tropical waters: a manual for use with programmable calculators. (ICLARM) Studies and Reviews 8. 325 pp.
Pennington, M. (1991). On testing the robustness of lognormal-based abundance estimators. Biometrics 47, 717-723.
Pennington, M. (1996). Estimating the mean and variance from highly skewed marine data. Fishery Bulletin 94, 498-505.
Perry, R.I., Walters, C.J. and Boutillier J.A. (1999). A framework for providing scientific advice for the management of new and developing invertebrate fisheries. Reviews in Fish Biology and Fisheries 9, 125-150
Restrepo, V.R, Thompson, G.G., Mace, P.M., Gabriel, W.L., Low, L.L., MacCall, A.D., Methot, R.D., Powers, J.E., Taylor, B.L., Wade P.R., and Witzig, J.F. (1998). Technical Guidance on the Use of Precautionary Approaches to Implementing National Standard 1 of the Magnuson-Stevens Fishery Conservation and Management Act. NOAA Technical Memorandum NMFS-F/SPO-31. 54 p.
Ricker, W.E. (1975). Computations and interpretation of biological statistics of fish populations. Fisheries Research Board of Canada, Bulletin 191. 382 pp.
Shepherd, S.A., Kirkwood, G.P. and Sandland, R.L. (1982). Studies on southern Australian abalone (Genus Haliotis). III* Mortality of two exploited species. Australian Journal of Marine and Freshwater Research 33, 265-272.
Smith, S.J. (1990). Use of statistical methods for estimation of abundance from groundfish trawl survey data. Canadian Journal of Fisheries and Aquatic Sciences 47, 894-903.
Thompson, G.G. (1993). A proposal for a threshold stock size and maximum fishing mortality rate. In (eds S.J. Smith, J.J. Hunt and D. Rivard), Risk evaluation and biological reference points for fisheries management, Canadian Special Publications in Fisheries and Aquatic Science 120, 303-320.
Wells F.E. and Mulvay, P. (1992). Reproduction and growth of the greenlip abalone Haliotis laevigata on the south coast of Western Australia. Unpublished report to the Western Australian Department of Fisheries.117 pp.
Fisheries Research Report [Western Australia] No. 170, 2008 43
6.0 Appendices
Appendix 1. Preliminary analyses for determining required number of samples
A1.1 Data of other abalone stocks employed for the analysis
The available data for Roei were collected by DoF in 2006 from the inner and mid-platform habitats of the Perth metropolitan area. These habitats are most similar to those where Roei are found in the Capes region. The Greenlip data were a subset of the data that had been collected by DoF from Hopetoun in 2003. The decision to use data from Hopetoun, rather than from the Capes region, was based on the fact that the type of sampling used to produce the data subset from Hopetoun was most similar to that employed in this study. In the absence of data from the Capes region, we assumed that the sampling intensity required to achieve a specified relative precision in the estimates of mean abundance for each species would be the same in the Capes Region as in the regions from which the data were drawn. No data were available for Brownlip stocks. It should be noted that, while the analysis guides the design of the sampling protocol, the actual precision of the estimates of abundance would be determined by the distribution of abalone, in combination with the sampling protocol and would be calculated when the resultant data were analysed.
A1.2 Analysis
Using the above data sets, a parametric approach (see Hilborn and Walters, 1992) was used to determine, for both Roei and Greenlip, the relationship between level of uncertainty in estimates of mean density of a species (expressed as relative standard error (RSE), i.e. standard error divided by the mean x 100) and sample size. The corresponding density data for Roei and Greenlip were loge(X+1) transformed (so that the transformed data were now approximately normally distributed), and the mean and standard deviation then calculated. The “RAND” and “NORMSINV” functions in Microsoft ExcelTM were used to draw random loge-transformed values for samples of abalone density from a normal distribution, as defined by the values calculated for the mean and standard deviation for each species. The randomly drawn values were then back-transformed, and the mean and RSE values calculated for each species with different numbers of samples. The procedure was repeated 500 times by re-sampling from the normal distribution for each species and the median values for the resultant 500 mean and RSE estimates calculated and plotted. The optimal number of samples for a species was selected to be the number of samples where the RSE had declined to a value of 0.2-0.3, i.e. 20-30% of the mean.

44 Fisheries Research Report [Western Australia] No. 170, 2008
Appendix 2. Determination of available abalone biomass within commercially-fished areas of the proposed sanctuaries
A2.1 Biomass available to fishers
We have assessed the total biomass available to fishers, BAvailable, using the survey data only, and using the survey data after adjusting for catches taken from the proposed sanctuaries during the 2006/07 fishing season. It would be appropriate to determine BAvailable from the survey data only if the stock was in equilibrium under the processes of growth, recruitment and fishing mortality. As the survey was carried out over a period of time, the biomass estimates produced from the survey results represent estimates of the average total biomass during the survey period. Thus, the biomass values determined from the above analysis provide an estimate of the biomass of abalone in the commercially-fished areas of the proposed sanctuaries at the midpoint of the survey. Therefore, if the assumption that the stock is in equilibrium under
fishing is true, BAvailable may calculated as: BB =Available , where B is survey biomass estimate (= biomass at the midpoint of the survey).
A2.2 Estimates of abalone biomass from scientific surveys led by DoF
For each category of each of the three abalone species, i.e. abalone that were visible (non-cryptic), above mature, legal and minimum harvest size, the mass of each individual abalone whose length was measured during the study was determined using the appropriate length-weight relationship for that species. The biomasses were then summed for all individuals within the category, in each 0.5 m2 quadrat, in the case of Roei, and for the two pooled 30 x 1 m2 transects at each site (i.e. equivalent of one 60 m transect at each site), in the case of Greenlip and Brownlip. (It should be noted that we have based our calculations for estimating biomass of Roei on data for individual quadrats. This assumes that quadrats along a transect line are independent, and if this is not true, the confidence intervals for the values of biomass have been underestimated).
For each category of each species of abalone, the biomass within each of the areas of the
reserves identified as containing significant stocks of abalone ( iB , i.e. the biomass of the ith
stratum) was determined as ( )aAxpB iiii )1( −= , where ip is the probability that a quadrat (or pooled 60 m transect for Greenlip and Brownlip) within this stratum contains zero biomass,
ix is the average biomass in each quadrat of the ith stratum that contains non-zero biomass,
iA is the area of the ith stratum (estimated using computer GIS software) and a is the area of each quadrat sampled within the stratum. The values of biomass recorded for the quadrats within the stratum are assumed to have a delta log-normal distribution. Thus the mean value
of biomass in each quadrat of the ith stratum for those quadrats with non-zero biomass ix is estimated by back-transforming the mean of the logarithmically-transformed values of
the non-zero biomasses iy and correcting for the bias resulting from the transformation,
i.e. ( )25.0expiyii syx += , where
iys is the standard deviation of the log-transformed values of the non-zero biomasses within the quadrats for that stratum. The overall biomass of each category of each species in the reserves of the Capes Marine Park was determined as the sum
of the biomasses calculated for all strata, i.e. ∑=
N
iiB
1 and N is the number of strata.

Fisheries Research Report [Western Australia] No. 170, 2008 45
For greenlip and brownlip, the “high priority” strata in each proposed sanctuary and “low priority” strata across all proposed sanctuaries sampled were pooled for the biomass calculations. We pooled the similar strata for the biomass calculations to increase the precision of the biomass estimates, a strategy which follows that suggested by Pennington (1996) in cases when the lognormal model is used and sample sizes are low. We did not consider it appropriate to combine the strata for the biomass calculations for Roei as differences in the habitats of the strata, i.e. level of exposure, are known to be an important factor affecting the localised abundance/biomass of this species.
Estimates of the confidence limits for the estimate of total biomass for each category of abalone of each species were calculated by drawing random estimates of the biomass within each stratum from the associated delta log-normal distributions and summing these to produce
1000 estimates of total biomass. For the ith stratum, randomly-selected values of ip and iy were drawn from the distributions of the estimated values of these parameters and combined, as described above, to derive each random estimate of the biomass within each stratum. For this calculation, it was assumed that the observed number of quadrats with zero biomass in the sampled number of quadrats for each stratum represents a sample from a binomial
distribution. Values of iy were drawn from the normal distribution for the mean of the log-transformed biomass in quadrats with non-zero biomass, where the standard error of this mean
was calculated by dividing iys by the square root of the number of such quadrats. The point
estimate and 95% confidence intervals were taken as the median and 2.5 and 97.5 percentiles, respectively, of the 1,000 estimates of biomass of abalone.
A2.3 Rationale for assuming a delta-log distribution for producing biomass estimates from the survey data
A preliminary inspection of the biomasses recorded for each species in the survey samples demonstrated that, as is often the case for marine survey data (Pennington, 1996), these data were highly skewed to the right. A common problem in the interpretation and analyses for such skewed data is that the mean is extremely sensitive to extreme large values. However, these large values reflect the spatial distribution of the species and are thus not outliers that can be discarded (e.g. McConnaugher and Conquest, 1992, Pennington, 1996). For marine data, the distribution of the non-zero values is often well approximated by a lognormal distribution (Pennington, 1996), and this model has been used for a range of marine abundance data (e.g. Ortiz et al., 2000; Folmer and Pennington, 2000; Lo et al., 1992; Madrid-Vera et al., 2007). Preliminary plots constructed of the transformed non zero values demonstrated that they conformed, at least approximately, to a lognormal distribution, i.e. the distributions were far more symmetrical.
It should be pointed out that some authors have argued against the use of the lognormal model. Smith (1990) argued that the lognormal model may be incorrect or not robust for small populations, but Pennington (1996) has pointed out that the sort of bias that Smith (1990) was considering is not a concern for marine surveys, where the population size (i.e. potential number of samples that may be taken) is very large. Pennington (1991) showed that the argument of Myers and Pepin (1990) that lognormal estimators are not robust as they are sensitive to undetectable deviations from lognormality, was based on simulations in which lognormal distributions were simply contaminated with small values. These small values result in large negative values on the log scale, which cause extreme instability of the lognormal

46 Fisheries Research Report [Western Australia] No. 170, 2008
estimators. As pointed out by Pennington (1996), an examination of the raw data shows whether there are values very close to zero and thus whether the data are appropriate for using a lognormal distribution. Our inspection of the raw biomass data indicated that the estimates of harvest biomass (from which catch forgone was determined) would not have been biased by any values of biomass close to zero.
A2.4 Biomass estimates from survey data and commercial catch information
Our method described below for determining BAvailable by adjusting the survey biomass estimates for commercial catches taken during the 2006/07 fishing season from the proposed sanctuaries assumes that growth was negligible during the period from the start of the fishing season to the midpoint of the survey, that the population was closed to recruitment and migration, and that the survey estimate of biomass represents the survival of abalone from both fishing and natural mortality. According to this method, BAvailable represents an estimate of the
abalone biomass within the sanctuaries at the beginning of the 2007 fishing season, i.e. 2007B .
Thus, 2007Available BB = .
B2007 was calculated from the average survey biomass for that sanctuary and species at the
midpoint of the survey, B. B2007 was determined as: )exp( 20072007 TZBB = , where B is the estimate of the average survey biomass at the midpoint of the survey, T is the period (years)
from the start of the 2007 fishing season to the midpoint of the survey period, and 2007Z is
the instantaneous rate of total mortality during 2007, where 20072007 FMZ += and 2007F is the instantaneous rate of fishing mortality during the 2007 fishing season. From the Baranov equation, assuming growth is negligible, we can express the catch of each abalone species from
the beginning of the year, 2007C , as
( )[ ] 200720072007
20072007 exp1 BTZ
ZF
C −−= ,
Substituting for 2007B and 2007Z , this may be re-written as
( )[ ]{ } ( )[ ]TFMBTFMFM
FC 20072007
2007
20072007 expexp1 ++−−
+= ,
which, given values of 2007C , B and M, may be solved numerically to determine an estimate of
2007F . This estimate may then be used with the values of B and M to estimate 2007B using the
earlier equation, )exp( 20072007 TZBB = .
In short, we first estimate 2007F from the values of 2007C , B and M, and then determine 2007B
from the values of 2007F , B and M.

Fisheries Research Report [Western Australia] No. 170, 2008 47
Appendix 3. Estimation of biologically sustainable catch biomass from the proposed sanctuaries
In estimating the biologically sustainable catch biomass for the three species (which, if the fishery was fully biologically exploited, would provide an estimate of current annual catch taken from the proposed sanctuaries), we have assumed that, had the sanctuaries not been introduced, the Department of Fisheries would have imposed appropriate controls on the level of exploitation. This would have ensured that fishing mortality would have been set at an appropriate target level, which would have been less than the limit reference point for fishing mortality, where the latter reference point is determined by the biological characteristics of the stock. Moreover, consistent with accepted standards of fisheries practice in well-managed fisheries elsewhere in the world, uncertainty in parameter estimates would have been taken into account by requiring that the probability of the fishing mortality exceeding the limit reference point is less than a specified value, e.g. limit reference point is exceeded less that 20% of the time.
The limit reference point for fishing mortality is typically set at MSYF , the fishing mortality associated with Maximum Sustainable Yield. For fisheries where this value can not be assessed, a proxy calculated from the instantaneous rate of natural mortality is typically used. We have selected to use the limit reference point of F=M in the abalone assessment (e.g. Thompson, 1993). We have arbitrarily selected 20% as an appropriately low probability, and have thus undertaken our assessment on the basis that, given the uncertainty of our estimate of the survey biomass and of the instantaneous rate of natural mortality, the allowable catch should be such that the probability of F exceeding the limit reference point should be less than 20%.
The fishing mortality that would be appropriate as the target mortality has been set at 0.75Flimit (Restrepo et al., 1998) and for an additional and more conservative estimate, 0.6Flimit (Perry, 1999).
For a given level of available biomass of abalone, the theoretical catches that would be produced by the target and limit fishing mortalities may be calculated using the Baranov catch equation, i.e.
( )[ ]{ } Availableexp1 BFMFM
FC +−−
+=
The algorithm that we use to determine the appropriate level of annual catch then uses the following steps. For each of a number of values of catch over the range of possible catches:
1. Draw a random value of survey biomass from the distribution of estimates of this value
2. Calculate the available biomass for the species
3. Draw a random value of the instantaneous rate of natural mortality from a distribution of values of M.
4. Use the value of M to estimate the limit and target fishing mortalities
5. Calculate the theoretical limit and target catches associated with the available biomass, the estimate of M and the respective fishing mortality
6. Compare the selected value of catch with the limit catch and score 1 if the selected catch exceeds the theoretical limit catch, otherwise score zero, accumulating the resulting scores for the limit reference point

48 Fisheries Research Report [Western Australia] No. 170, 2008
7. Compare the selected value of catch with the theoretical target catch and score 1 if the selected catch lies within 10% of the target catch, otherwise zero, and accumulate the resulting scores for the target reference point
8. Repeat 1000 times, then calculate and record the percentages of occasions on which the selected value of catch exceeded that associated with the limit reference point, and on which the selected catch was within 10% of the target catch.
Repeat for each of the range of selected values, then plot the curves. The resultant value of catch derived from this analysis as the appropriate level of annual sustainable catch should be that which maximises the probability of falling within 10% of the target catch, yet for which the probability of exceeding the catch associated with the limit reference point is less than 20%. The estimates produced using this method are based on our estimates of mature biomass.
Fisheries Research Report [Western Australia] No. 170, 2008 49
Appendix 4. Estimates of the current annual biomass of catches taken from the sanctuaries
Estimates of biomass of the current annual commercial catch, C, taken from the proposed sanctuaries of the Capes region were determined from the Baranov catch equation, i.e.
( )[ ] HarvBZZF
C −−= exp1 (Ricker, 1975), where BHarv is the estimate of harvest biomass (as determined from the biomass analyses, for either Assumption A or B), F is the fishing mortality (year-1) and Z is total mortality (year-1). The estimates of F (year-1) provided by DoF (A. Hart, unpublished data) were 0.34-0.54 for Roei, 0.34-0.49 for Greenlip and 0.29-0.37 for Brownlip. To enable incorporation of uncertainty in the estimates of catch, the estimates of F for each species were represented by normal distributions, where the 95% confidence intervals for these normal distributions approximated the upper and lower bounds of the estimates provided by DoF. Specifically, the distributions for F are described by a mean and standard deviation, respectively, of 0.44 and 0.05 for Roei, 0.42 and 0.04 for Greenlip and 0.33 and 0.03 for Brownlip.
The F estimates produced by DoF had been determined using length-converted catch curve analysis (Pauly, 1984, pp. 60-61) using data for the three species from the Capes region, i.e. the survey length-composition data for Roei (the only existing commercial length data for Roei in the region) and commercial catch size composition data for Greenlip and Brownlip. The DoF analyses for determining F are based on growth information for the three species, as described by Gompertz growth curves: Roei, L∞ = 83 mm, k (or g) = 0.45 year-1, Greenlip L∞ = 185 mm, k (or g) = 0.30 year-1, Brownlip L∞ = 200 mm, k (or g) = 0.30 year-1. As is consistent with other analyses in this study, the DoF estimates of F are calculated assuming M = 0.25 year-1. The analyses for estimating current catch and the DoF analyses for estimating F both assumed M = 0.25 year-1. Confidence intervals for current catch estimates were produced by resampling from distributions produced in this study for the estimates of biomass in the proposed sanctuaries, and from those for F and M (mean and standard deviation for distribution for M = 0.25 and 0.05, respectively).
We acknowledge that it would have been preferable to base the catch curve analyses for estimating mortality on direct age estimates, if such data were available. For future related studies, if direct age estimates were not available, alternative length-based approaches which might provide more robust estimates of mortality than that outlined by Pauly (1984) should be investigated.

50 Fisheries Research Report [Western Australia] No. 170, 2008
Appendix 5. Roles of people involved in the project
Murdoch University (Alex Hesp, Neil Loneragan, Norm Hall, Halina Kobryn and Peter Coulson) provided overall co-ordination for the project, including liaising with industry, developing the sampling design, assisting with field sampling, analysing the data and producing the final report. The sampling design was developed with advice from Anthony Hart and Frank Fabris of the Department of Fisheries WA Research Division (DoF), and Jeremy Prince of Biospherics. Feedback on a draft of the materials and methods of the report was provided by Ian Taylor (WA commercial abalone industry). Because of their experience in sampling abalone, knowledge of the Capes area and staff with the appropriate diving qualifications, the Department of Fisheries (Frank Fabris, Jamin Brown, Anthony Hart, Lachlan Strain, David Murphy, Fiona Parker and Mark Davidson) completed the field sampling. Spatial analysis using GIS software was undertaken by Frank Fabris of DoF (for Roei) and Halina Kobryn of Murdoch University (for Greenlip and Brownlip abalone). Useful comments and discussion were provided by Peter Dans, Chris Simpson, John Lloyd, Judy Davidson and Fran Stanley of the Department of Environment and Conservation (DEC), Nick Caputi and Andrew Hill (DoF), and Jessica Meeuwig (University of WA), who has worked with the WA abalone industry and was involved with the planning process for the Capes Marine Park, kindly offered advice on sampling design.
Jeremy Prince is an internationally-recognised expert in abalone biology and fisheries resource assessment. His role in the study was to provide advice on all aspects of the project. Jeremy has previously fished commercially for abalone in New Zealand and currently works on an FRDC project with the abalone industry of Victoria. He has worked with the WA abalone industry in the past.
Rick McGarvey (SARDI) provided an external review of this report.
The project was joint funded by DEC and DoF, with Murdoch University receiving its funding through DoF.

Fisheries Research Report [Western Australia] No. 170, 2008 51

52 Fisheries Research Report [Western Australia] No. 170, 2008