biomass sector review for the carbon trust · biomass sector review for the carbon trust. contents...
TRANSCRIPT

Biomass sector review for the Carbon Trust

Contents
Foreword 01
Executive summary 02
Introduction 06
Section 1. Fuel resource 08
Section 2. Project economics 12
Section 3. Barriers to development 19
Section 4. Carbon savings 22
Section 5. Implications for Policy and the Carbon Trust 25
Appendices 29
This report has been prepared by Paul Arwas Associates for the Carbon Trust.

The biomass sector is very complex and varied with amultitude of different end-uses, technologies and potentialfuel combinations. Recognising this complexity the CarbonTrust commissioned Paul Arwas Associates and Black & VeatchLtd to carry out this study to better inform future CarbonTrust activity in relation to biomass.
The project’s main objectives were to:
Develop a robust fact base on the economics and impactof existing biomass technology
Assess the realistic carbon saving potential of biomass in the UK
Identify the main barriers (policy and market) to thefurther development of the biomass sector in the UK
Identify where the Carbon Trust could help to delivercarbon savings by accelerating the development of the sector.
The Carbon Trust allocates resource to maximise carbonsaving over time per pound invested. This approach wasused in the early stages of this work to help select specificareas of biomass for further detailed analysis andultimately to help focus future potential Carbon Trustactivity. The study has taken a more “here and now”approach to the technologies and markets than some paststudies, which have often looked at longer term potentialand emerging technologies. Given the availability ofbiomass resource in the UK the Carbon Trust wasparticularly interested in identifying potential activity thatcould help to stimulate supply chains and associatedinfrastructure today using existing technology.
The Carbon Trust has placed the results of this study in thepublic domain to help inform the policy debate over howthe carbon saving potential of biomass can be capturedmost cost effectively.
Key findingsBiomass has the potential to deliver material carbonsavings today. Using UK resources alone carbon savings of up to 5.6 MtC per annum could be delivered
Using biomass for heating via combustion and displacingfuel oil gives the most cost-effective carbon savings andis the closest use to being economic without subsidy at the present time
Liquid biofuels can represent a commercially attractiveapplication of biomass resources in certain situationsgiven current government incentives (as evidenced byactivity in this area). However, they are not the mostresource-efficient use of biomass (both in terms of the“cost of carbon” and the total volume of carbon saved)using current technology
When used for electricity conversion, biomass offerslower total carbon savings and higher cost of carbondelivered than for heat only or CHP (via combustion)
Lack of confidence in a reliable fuel supply chain is oneof the most significant barriers to the more widespreaduptake of biomass generally, although there are a complexrange of other barriers
There are several policy options that have the potentialto stimulate growth in the biomass sector, including capitalgrants, the EU-ETS, CCL and a renewable heat obligation.For any support mechanism to be effective, however, it must have longevity so as to encourage confidence in the market and to thus stimulate wider uptake
The Carbon Trust is now beginning to scope out a projectseeking to accelerate the development of biomass in the UK based on the experience it has gained in similarprojects (e.g. the Marine Energy Challenge). The biomassproject will focus on heating but will work to drawinsights about linking supply and demand and managingrisk that will be relevant for the whole sector.
Foreword 01
Foreword

Biomass is an important part of the UK’s renewable energysupply and, including landfill gas and waste combustion, it currently represents 85% of total UK renewable energysupply and 1.4% of total UK energy supply. Biomass hasconsiderable untapped resource potential and so it couldplay an increasingly important role in helping the UK tomeet its Kyoto Treaty targets and national carbon-emissionreduction targets.
In order to focus its own efforts and to contribute to thepolicy debate on biomass the Carbon Trust commissioned a review of the biomass sector focusing on the present daycosts, resources and carbon savings associated with biomass.The objectives of the review were to:
Develop a robust fact base on the economics and impactof existing biomass technology
Assess the realistic carbon saving potential of biomass in the UK
Identify the main barriers (policy and market) to thefurther development of the biomass sector in the UK
Identify where the Carbon Trust could help to delivercarbon savings by accelerating the development of the sector.
This review started from fundamentals. The first phaseconsisted of a high level screening of all the potentialbiomass chains1 in the UK, identifying those key chains withthe greatest potential for carbon saving at lowest cost.This first phase screening also took into consideration theCarbon Trust’s ability to have a material effect on the rateof deployment of biomass in a particular area. The secondphase involved a more detailed economic and carbonreduction assessment of the key biomass chains, evaluationof the barriers to development of biomass projects anddrew a number of observations on future policy options for biomass.
The review covered all UK biomass resource with a numberof exceptions such as peat, hospital waste and municipalsolid waste.
Biomass sector review02
Executive summary
1A Biomass “Chain” refers to a particular combination of resource, conversion technology and end-use, e.g. cereals via hydrolysis & fermentation into bioethanol (liquid transport fuel). A very large number of these combinations or “chains” were studied as part of this review.

The review drew on an extensive number of sources,including a detailed literature survey, in-house references,questionnaires and interviews with trade associations,industry participants and industry observers.
The policy observations that were drawn from the review,together with the results of the analysis itself, weresubject to a detailed peer review with leading industryparticipants, observers and academics. The team thatcarried out the review worked closely with the Government’sBiomass Taskforce to ensure our fact base and conclusionswere considered as part of the Taskforce’s work. Thisdocument is a synthesis of a large volume of detailedanalysis. The purpose of this document is to place theresults of this analysis in the public domain and to ensurethat it is available to those interested in developing thebiomass sector in the UK.
Biomass can be drawn from a very large number of sources.Our screening of the available biomass resource in the UKhighlighted four key biomass fuels: forestry crops, dryagricultural residue, waste wood and woody energy crops.All of these have both significant carbon saving potentialand relatively low cost of carbon if used in suitable chains.The four fuels could have a material impact on UK energysupply when used for heat and power. Currently they havethe potential to supply up to an additional 41TWh/yr orabout 1.5% of UK energy supply. In the future this couldrise to c.80TWh/yr, mainly through expansion in the supplyof woody energy crops and/or dry agricultural residue.
If available resources are used for biofuels the level ofpotential carbon saving decreases significantly comparedwith providing heat or electricity due to lower conversionefficiency. The cost of carbon for biofuels is much higherthan for heat and electricity (without Governmentincentives). Consequently, biofuels are not covered in depthin this report although they were analysed in detail duringPhase 1.
Although the UK has a considerable amount of biomassresource, gaining access to it is not always viable fordevelopers and end-users as the UK currently has a relativelyundeveloped biomass fuel supply infrastructure.
Just as biomass can be drawn from a number or sources, it can be converted to useful energy through a number of processes and delivered to a variety of markets. Ourscreening of biomass conversion processes demonstratedthat currently combustion represents the best area of focus.Combustion is a proven, established conversion process and the lowest cost option available today. Except in nicheapplications, all the other conversion processes are eitherhigher cost (e.g. anaerobic digestion and fermentation), not yet sufficiently commercially mature (e.g. gasificationand pyrolysis), or generate limited carbon savings at thistime (Fischer-Tropsch and trans-esterification).
Co-firing was not analysed in great depth as the potentialfor the Carbon Trust to be material in this area is limited.However, given current government incentives, it appearedthat co-firing biomass in coal plants is economic andrelatively attractive from a carbon-saving and cost ofcarbon saved point of view2.
Executive summary 03
2Source: B&V.
Our review suggested a focus (from a cost-effective carbonreduction point of view) on very small scale (c.0.2MW) toindustrial scale (c.30MW) units generating heat and power.The cost of carbon in domestic-scale applications wasfound to be very high.
Within combustion processes, heat applications, especiallysmall heat (e.g. around 2MW), have the most attractiveand robust plant economics, excluding government incentives.When replacing oil-fired boilers, small heat plant have themost favourable investment returns of all the applicationsexamined (which included large and small CHP, large andsmall electricity only). The oil price is the main driver of heat plant economics. At our medium crude oil pricescenario ($30/bbl), small heat is the only application witha positive IRR (c.5%) for all biomass fuels. At our high oilprice scenario ($50/bbl), small heat plant returns are highenough to attract investment (c.20%). Large heat (around30MW) and very small heat (around 0.2MW) generatepositive returns for all fuels, but are probably too low forinvestment (i.e. c.10%). The most attractive of the otherapplications is large CHP, which at $50/bbl has positivereturns for all of the key fuels.
With current Government incentives, large biomass CHPbecomes attractive for investment, generating returns ofbetween 15-20% at $30/bbl. Electricity-only plants havemodest returns due to a poor ratio of capital cost to revenue.
Despite the potential economic viability of certain biomassplant, relatively little construction is underway. In part thisis due to the significant barriers to development that biomassfaces throughout all stages of development. Four mainbarriers affect all developers. These barriers increase therisk of investing in biomass (thereby increasing the cost of capital), and increase operating costs. Together thesereduce the economic viability of biomass developments.The four main barriers are:
Market information (Project Initiation): The lack of fuelmarket information makes identification and coordinationof large scale supplies difficult to achieve. The need tocontract without reference prices and terms increasesnegotiating and contracting costs
Fuel supply risks: The absence of major counterpartiesresults in credit risk. In addition, the lack of significanttrading of the major fuels means that supply risks (quality,price or volume) cannot be hedged
Planning: Public opposition to large biomass plant can bestrong and, above a certain size, the Environment Agencyis involved, adding complexity to the planning process
Policy costs: For power generation plant the uncertaintyinherent in the Renewables Obligation mechanism reducesthe value of the Renewable Obligation Certificates (ROCs)received by non-integrated suppliers.
In addition, smaller developers are affected by a number of other barriers including lack of awareness andunderstanding of biomass by end-users/customers whichleads to a perception of higher risk, poor availability oftechnical expertise (installation and maintenance) and lack of access to debt funding.
Biomass sector review04
In a good fit with the economic analysis, heat applicationsface fewer barriers than CHP or electricity-only plant asthey avoid issues related to the Renewables Obligation,debt financing and, in many cases, planning.
Replacement of oil-fired heat plant by biomass-fired systemsis the most attractive from a carbon saving point of view,due to their high conversion efficiency and the high levelof emissions from the displaced oil. Replacing all suitableoil-fired boilers with biomass-fired boilers would save c. 2.5MtC/yr and use almost 90% of the currently availablebiomass, or 45% of the currently and potentially availablebiomass (i.e. where energy crops are included). Theremaining biomass could be used in large CHP plant or co-firing potentially saving up to a further 2.7MtC/yr.
Small and large heat are the only two applications with a low cost of carbon; c. £25/tC and c. £30/tC respectively at $30/bbl crude. Through deployment at scale andstandardisation, small heat has the potential for significantcost reduction (c.25% of project costs). Large heat technologyis mature and offers more limited opportunity for costsavings. None of the other biomass applications currentlyoffers sufficient cost reduction opportunity to achievethese low costs of carbon; however, this situation shouldbe reviewed periodically.
From a purely carbon perspective, therefore, the UK shouldexploit the largely untapped potential of heat applications,particularly small heat. To do so will require long-termfinancial support (possibly through the EU-ETS or aRenewable Heat Obligation and/or a capital grant scheme)and targeted action to address the key barriers to biomassdevelopment. This should include investment in large scale supply chain/technology demonstration programmes,education and information programmes, and ensuring the recent changes to the planning system are effective.However, in shaping the overall policy framework forbiomass (including CHP, electricity and biofuels), theGovernment will need to take into account the otherbenefits of biomass (e.g. energy security, employment,despatchable electricity generation, etc).
The Carbon Trust is now beginning to scope out a projectseeking to accelerate the development of biomass in theUK based on the experience it has gained in similar projects(e.g. the Marine Energy Challenge). The biomass projectwill focus on the use of biomass for heating at the smallscale as a replacement for oil-fired boilers as this sub-sectoroffers the most cost-effective carbon savings at the presenttime and the Carbon Trust could have a material impact.While focusing on heat, the project will build a fact basethat will facilitate the development of the biomass sectoras a whole. A key objective will be to build a betterunderstanding of the risks in development and how best to mitigate these across the entire biomass value chain,particularly the supply side.
Executive summary 05
BackgroundBiomass involves using biologically derived products such aswood, straw or sewage sludge to generate heat, electricityor motive power. If the biomass source is sustainable, such as wood from a forest where new trees are planted to replace felled ones, then biomass is a source of lowcarbon renewable energy.
Biomass is unique among renewable energy sources. Firstly,it has a complex supply chain (from biomass resource todelivered service), whereas all other renewable sources,like wind or wave energy, have much simpler supply chains.There are many biomass sources including waste wood,specifically grown ‘energy crops’, and residues fromforestry, agriculture and food manufacture. These biomasssources typically go through two stages of conversion: thefirst to generate a fuel by biological, thermal or chemicalmeans; the second to generate useful energy through, say,a boiler which gives a delivered service (heat, electricityor biofuels for transport). This leads to a large number of possible combinations of sources, conversion processesand technologies and delivered services, and over 80 suchcombinations (or ‘chains’) were evaluated in this study.
Secondly, unlike wind or wave, biomass has a fuel cost.The prices of biomass fuels are set by market forces and aresusceptible to sharp variations due to weather conditionsand changes in demand from other industries that draw onbiomass sources such as food, furniture and paper.
This poses difficult questions for both policy-makers andcompanies wishing to exploit biomass energy. For example,which of the large numbers of biomass chains are economic?Which generate material carbon savings and other non-financial benefits? Will future fuel price changes alterthe relative economic attractiveness of the biomass chains,and will technological developments significantly alter the picture?
These are important questions, all the more so as biomassis one of only a limited number of renewable energy sourcesthat the UK is relying upon to help meet its Kyoto targetsand national targets for greenhouse gas and carbon emissionsreduction. Biomass represented 85% of total UK renewableenergy supply and 1.4% of total UK energy supply3 in 2004.There is untapped biomass potential in the UK: othercountries, including Austria and Finland, have shown thatbiomass can play an important role in reducing carbonemissions. Furthermore, biomass can generate otherimportant benefits such as diversification of income for the rural economy and improvements in energy security.
The Carbon TrustThe Carbon Trust is a business-focused, independent company,funded by Government, set up in 2001 with a remit to:
Help UK business and the public sector meet ongoingtargets for carbon dioxide emissions
Increase business competitiveness through resourceefficiency
Support the development of a UK low carbon sector.
The Carbon Trust is already actively involved in the biomasssector, most notably through its funding of several innovativebiomass research, development and demonstration projects.
In order to focus its own efforts and to contribute to thepolicy debate on biomass the Carbon Trust has commissioneda review of the biomass sector.
Biomass sector studies have been undertaken in the past,usually examining one element of biomass, either a specificpart of the supply chain (e.g. resource availability) or aparticular topic (e.g. future technology development).
By way of contrast this review covers the present daycosts, resources and carbon savings associated with biomass.The objectives of the project were to:
Develop a robust fact base on the economics and impactof existing biomass technology
Assess the realistic carbon saving potential of biomass in the UK
Identify the main barriers (policy and market) to thefurther development of the biomass sector in the UK
Identify where the Carbon Trust could help to delivercarbon savings by accelerating the development of the sector.
Biomass sector review06
Introduction
3Source: DTI, percentages include landfill gas and waste combustion.

Scope and approachIn line with the Carbon Trust’s remit, the study focused on how to accelerate the development of those biomasschains which generate the greatest carbon saving at thelowest cost. The study also took into consideration theCarbon Trust’s ability to have a material effect on the rateof deployment of biomass in a particular area. Althoughthe other benefits of biomass were recognised (e.g. energysecurity, employment, despatchable electricity supply,etc.), they were not part of the formal analysis conductedas part of this study and would clearly need to be takeninto account in developing the policy framework.
This study covered all major UK biomass resources apartfrom peat, hospital waste and municipal solid waste. Peat was not considered because of the potentially severeecological damage caused by peat extraction. Hospital wasteis governed by tight health and safety regulations andtherefore was not considered. Municipal solid waste wasnot considered in detail as part of this study as waste fallsoutside of the remit of the Carbon Trust and a number ofother organisations including WRAP (Waste & ResourcesAction Programme) are taking a lead in this area. It isestimated4, however, that the potential energy supply in 2020 from the biodegradable portion of municipal solid waste is c.40TWh/yr.
In line with the Carbon Trust’s objective to support thedevelopment of a UK low carbon sector, this study focusedprimarily on the UK’s biomass resource.
The study started from fundamentals. In Phase 1, Black & Veatch Limited (B&V) conducted a high-level screeningof all the potential biomass chains in the UK, identifyingthose key chains with the most potential for carbon saving at the lowest cost. A large number of interviews and questionnaires with the biomass industry were alsoundertaken in this phase and the barriers to biomassproject development identified. In Phase 2, PAA (Paul ArwasAssociates), together with B&V, conducted a detailedeconomic and carbon reduction assessment of the keybiomass chains, evaluated the barriers to development of biomass projects, and drew a number of observations on the future of policy for biomass.
At the start of Phase 1, B&V identified all possible biomassresources and conversion technologies and quantified theirpotential. Those resources below a threshold of 3TWh/yrgross were eliminated from further investigation as not beingmaterial. B&V then reviewed all the possible combinationsof the remaining resources, conversion technologies anddelivered services (heat, electricity or biofuel for transportuse) and identified those that were technically feasible.
Each of the resulting technically feasible chains was analysedover a range of applications from co-firing in a utility sizedpower station down to log-burning domestic stoves. Someof these permutations were eliminated as being impractical.For each of the remaining chains the potential carbonsaving and the cost of that saving with and withoutGovernment incentives was calculated. The objective wasto identify those technically feasible and practical chainswhich exhibit the highest potential carbon saving at thelowest cost of carbon.
To conduct Phase 1 of the study, B&V drew on an extensivearray of literature sources and a large number of interviewsand questionnaires.
In Phase 2, PAA built a detailed cash flow and emissionsmodel of the key biomass chains identified in Phase 1. Thiscalculated the Net Present Value (NPV), Internal Rate ofReturn (IRR), carbon saving and cost of carbon for typicalprojects in each of the key biomass chains, either with orwithout Government incentives. The input to the modelwas developed by further literature surveys, and interviewswith trade associations, industry participants and industryobservers, together with the outputs of Phase 1. This modelwas used to assess 28 biomass chains on the basis ofeconomic attractiveness and carbon savings.
The interviews and questionnaires from Phases 1 and 2were used to identify 35 barriers to the development ofbiomass. These were then grouped into three types: thoseaffecting project initiation; project development; and thefuel supply chain. Finally all the barriers were rankedagainst each plant type, resource type and developer size.
The policy observations that were drawn from the Phase 2analysis, together with the results of Phases 1 and 2, were subjected to a detailed peer review process withleading industry participants, observers and academics (see Appendix 1).
Introduction 07
4B&V analysis of ‘Quantification of the Potential Energy from Residuals (EfR) in the UK’, by Oakdene and Hollins for the ICE and RPA, March 2005.

SummaryBiomass can be drawn from a very large number of sources.Our screening of the available biomass resource in the UK highlighted four key biomass fuels: forestry crops, dryagricultural residue, waste wood and woody energy crops.All of these have both significant carbon savings potentialand relatively low cost of carbon if used in suitable chains.These four fuels could have a material impact on UK energysupply when used for heat and power. Currently they havethe potential to supply a further 41TWh/yr or about 1.5% of UK energy supply. In the future this could rise toc.80TWh/yr, mainly through expansion in the supply of woodyenergy crops and/or dry agricultural residue. If used for biofuels the level of potential carbon savings dropssignificantly due to lower conversion efficiency. Althoughthe UK has a considerable amount of biomass resource,gaining access to it is not always possible for developersand end-users as the UK currently has an undevelopedbiomass fuel supply infrastructure.
Key biomass fuelsBiomass is organic matter and there is a wide range ofpotential biomass fuels5. Many biomass fuels are wastes or residues, but some biomass fuels are grown especiallyfor use in biomass plant. There are five main groups ofbiomass fuels: virgin wood, energy crops, agriculturalresidues, food waste and industrial waste.
Virgin wood includes roundwood, cutting residues (brash),bark, sawdust, crowns, needles and residue of tree surgery
Energy crops include woody energy crops like shortrotation forestry, willow, eucalyptus, poplar, miscanthus,hemp, and also sugar crops (sugar beet), starch crops(wheat, barley, maize/corn), oil crops (rape, linseed,sunflower) and even hydroponics (lake weed, kelp, algae)
Agricultural residue can be wet (pig and cattle slurry,sheep manure, grass silage) or dry (for example, poultrylitter, wheat or barley straw, corn stover)
Food waste can be wet or dry (from meat/fish, dairy anddistillery wastes, etc.), or it can come from distributionor post-consumer waste (hotels and restaurants, cookingoils, surplus fruit and vegetables)
Finally, industrial waste includes wet and dry textiles and paper wastes, wastes from sawmills, construction,furniture manufacturing, chipboard industries, pallets,and sewage sludge.
Many of these resources are not suitable for use in biomassplant at a large scale because their total energy yield istoo small, or processing them would be too costly, or thepotential carbon savings would be too small. In order toselect the most suitable biomass resources for use at alarge scale B&V quantified the current and potential energyyield for each individual resource. Those with a total energyyield of less than 3TWh/yr gross were eliminated fromfurther investigation as not being material. The remainingfuel resources were combined with all conversiontechnologies and delivered services (heat, electricity orbiofuel for transport) and the technically viable combinationswere taken further for analysis. Such a combination offuel, conversion technology and delivered service is knownas a chain; for example, waste wood (fuel) being combusted(conversion technology), in a small CHP plant (application)to produce electricity and heat (delivered service).
For each chain the total potential carbon saving wascalculated (in Mt C/yr) for the various conversiontechnologies and delivered services, as well as the cost of saving a tonne of carbon (in £/t C). Figure 1 shows thepotential carbon saving for the various biomass resourcesassuming, for illustrative purposes, they are used in heat applications to replace oil. Dry Paper, Dry and WetAgricultural Residues, Wet Food Waste, Woody Energy Cropsand Waste Wood, and are clearly the most significantresources. Forestry was carried through for further analysisas it can easily be used with other woody material. Sewagesludge, dry food waste and textiles were eliminated fromfurther investigation due to low carbon savings (less than0.2% of the UK's carbon emissions). The dry paper, wetfood, and wet agricultural resources were not taken furtherdue to their materially higher costs of subsidy (required for economic viability) compared with the other resources.
The review of biofuel end-use chains showed that, in theshort term, they all have more limited carbon-savingpotential than heat and electricity (see Biofuels box) and were, therefore, not taken further in this study.
Dry Agricultural Residue, Woody Energy Crops (assumed in this analysis to be grown on 680,000 hectares of set-asideland), Waste Wood and Forestry Crops used in heat andelectricity chains are, therefore, the most attractive groupsof biomass fuels in terms of carbon saving potential.
Biomass sector review08
Section 1. Fuel resource
5Unless stated otherwise the term ‘biomass fuels’ refers to solid biomass fuel, as opposed to liquid biofuels, like bio-ethanol or bio-diesel.

Section 1. Fuel resource 09
0Papersludge
Sewagesludge
Textiles ForestryWetfood
Drypaper
Wastewood
Wetagri-
culture
Dryagri-
culture
Woodenergycrops
Dry foodwaste
e.g. 0.35Mt of carbon/yr is equal to 0.2% of UK’scarbon emissions
2
1
Carb
on s
avin
gs (
Mt
of c
arbo
n/yr
) 3
Figure 1 Carbon savings for UK biomass resources — replacing oil in heating
Biofuels
As part of the high-level screening, B&V reviewed 24different biofuel chains. The biomass sources included:wood (both farmed and waste), sugar beet, rapeseed,sunflower, wheat and straw. The fuels were: ethanol,Fatty Acid Methyl Ester (FAME), SynDiesel, methanol, Di-Methyl-Ether (DME) and hydrogen.
In line with the present day emphasis of the study, B&Vfocused on nine short-term biofuel chains (i.e. thoseproducing ethanol and FAME with wood, sugar beet,wheat, rapeseed and straw as the biomass source asappropriate). Hydrogen chains are longer term as theyrely on the development of a new fuel infrastructure andthe successful commercialisation of fuel cells. SynDiesel,methanol and DME require further technical development,in particular linking the Fischer Tropsch process withbiomass gasification. In addition, sunflower was notconsidered further as a source as it is not a major UK crop.
The carbon savings from using biomass resource as abiofuel were compared with alternative use in heat andpower applications. The wood-based biofuels chain (wood to ethanol via acid hydrolysis and fermentation)shows carbon saving potential 2-3 times lower than that
available from using wood in CHP plant. Similarly, allsugar beet, rapeseed and straw-based chains have carbonsavings potential at or below 6500kgCO2/ha/yr which arewell below the worst case carbon savings for energy cropsas fuel for CHP plant of 10,000kgCO2/ha/yr. The morelimited carbon-saving potential is mainly due to lowoverall conversion efficiency of the economically viableshort-term chains, exacerbated, in some cases, by thelow yields of the crop resources themselves.
The cost of carbon was also assessed. This showed thatthe short-term biofuel chains have a cost of carbon of£800-5000/tC (without Government incentives). By wayof comparison, the worst case cost of carbon for energycrops used as fuel for CHP plant is £350-550/tC.
As biofuel generates lower carbon saving at a higher cost(without Government incentives) than heat and electricityapplications, it was not considered further in this study.However, we do recognise that biofuels meet a numberof other policy objectives including security of supplyand that a number of schemes are coming forward on a commercially viable basis with government incentives.
Source: B&V
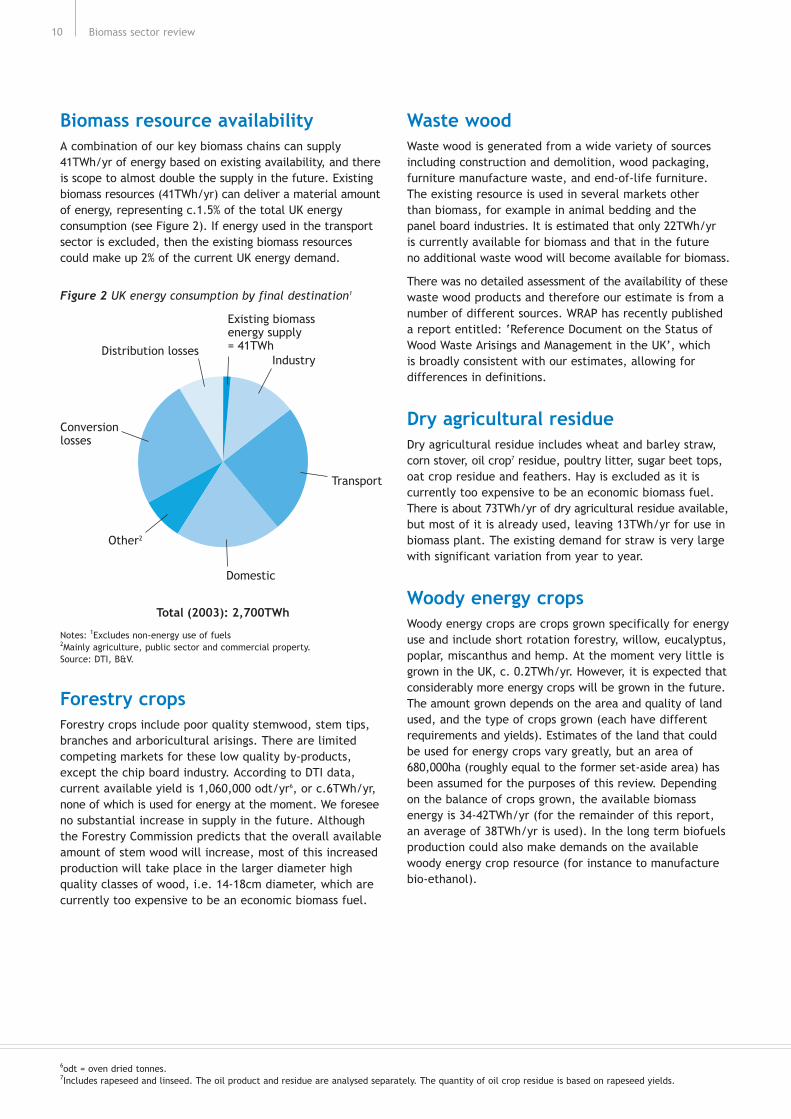
Biomass resource availabilityA combination of our key biomass chains can supply41TWh/yr of energy based on existing availability, and thereis scope to almost double the supply in the future. Existingbiomass resources (41TWh/yr) can deliver a material amountof energy, representing c.1.5% of the total UK energyconsumption (see Figure 2). If energy used in the transportsector is excluded, then the existing biomass resourcescould make up 2% of the current UK energy demand.
Forestry cropsForestry crops include poor quality stemwood, stem tips,branches and arboricultural arisings. There are limitedcompeting markets for these low quality by-products,except the chip board industry. According to DTI data,current available yield is 1,060,000 odt/yr6, or c.6TWh/yr,none of which is used for energy at the moment. We foreseeno substantial increase in supply in the future. Althoughthe Forestry Commission predicts that the overall availableamount of stem wood will increase, most of this increasedproduction will take place in the larger diameter highquality classes of wood, i.e. 14-18cm diameter, which arecurrently too expensive to be an economic biomass fuel.
Waste woodWaste wood is generated from a wide variety of sourcesincluding construction and demolition, wood packaging,furniture manufacture waste, and end-of-life furniture.The existing resource is used in several markets other than biomass, for example in animal bedding and the panel board industries. It is estimated that only 22TWh/yr is currently available for biomass and that in the future no additional waste wood will become available for biomass.
There was no detailed assessment of the availability of thesewaste wood products and therefore our estimate is from anumber of different sources. WRAP has recently publisheda report entitled: ‘Reference Document on the Status ofWood Waste Arisings and Management in the UK’, which is broadly consistent with our estimates, allowing fordifferences in definitions.
Dry agricultural residueDry agricultural residue includes wheat and barley straw,corn stover, oil crop7 residue, poultry litter, sugar beet tops,oat crop residue and feathers. Hay is excluded as it iscurrently too expensive to be an economic biomass fuel.There is about 73TWh/yr of dry agricultural residue available,but most of it is already used, leaving 13TWh/yr for use inbiomass plant. The existing demand for straw is very largewith significant variation from year to year.
Woody energy cropsWoody energy crops are crops grown specifically for energyuse and include short rotation forestry, willow, eucalyptus,poplar, miscanthus and hemp. At the moment very little isgrown in the UK, c. 0.2TWh/yr. However, it is expected thatconsiderably more energy crops will be grown in the future.The amount grown depends on the area and quality of landused, and the type of crops grown (each have differentrequirements and yields). Estimates of the land that couldbe used for energy crops vary greatly, but an area of680,000ha (roughly equal to the former set-aside area) hasbeen assumed for the purposes of this review. Dependingon the balance of crops grown, the available biomassenergy is 34-42TWh/yr (for the remainder of this report,an average of 38TWh/yr is used). In the long term biofuelsproduction could also make demands on the availablewoody energy crop resource (for instance to manufacturebio-ethanol).
Biomass sector review10
6odt = oven dried tonnes.7Includes rapeseed and linseed. The oil product and residue are analysed separately. The quantity of oil crop residue is based on rapeseed yields.
Existing biomass energy supply = 41TWh
Industry
Transport
Domestic
Total (2003): 2,700TWh
Conversion losses
Distribution losses
Other2
Figure 2 UK energy consumption by final destination1
Notes: 1Excludes non-energy use of fuels 2Mainly agriculture, public sector and commercial property.Source: DTI, B&V.

The currently existing and potentially available amount ofenergy from biomass in the UK is summarised in Figure 3. It shows that the total amount of currently available energyfrom biomass in the UK is 41TWh/yr, with the potential toincrease it to almost 80TWh/yr.
The 80TWh/yr figure for total biomass energy assumes thatwoody energy crops are grown on a land area of 680,000ha.If instead a mixture of food crops was grown on this land,and the residue used for biomass energy then we estimatethat this would result in a reduction of the available biomassenergy attributable to this land area from 38TWh/yr to 12TW/yr.
Fuel infrastructureThe UK currently has an undeveloped biomass fuel supply infrastructure.
There are few active fuel supply intermediaries in the UK,so biomass plant operators often need to contract directlywith fuel suppliers:
Waste wood suppliers are the largest, typically they areable to supply c.50,000t/yr — based on their infrastructureto collect waste wood for the panel industry
The supply of forestry crops is dominated by ForestEnterprise (of the Forestry Commission). The privatesupply market is relatively fragmented and a typicalsupplier of forestry crops could supply about 20,000t/yr
Dry agricultural residues (such as straw) are produced as seasonal by-products. Some market intermediaries do exist, but large suppliers typically supply 15,000t/yr,although large intermediaries such as Anglian Straw havebeen created
The estimated current supply capacity of woody energycrop producers is small, maybe 5,000t/yr. In the future,typical amounts of regional/local supply could reasonablybe 50,000t/yr per supplier.
The current supplier base, therefore, could serve a smallheat or small CHP plant (though there are other supplychain difficulties — see Section 3). For example, a small,2MWe CHP plant would need about 18,000 wet t/yr fuel,which could readily be supplied by a few suppliers.
A large, 30MWth heat plant would require around 60,000wet t/yr of fuel, which could be met either by one majorsupplier or, more likely, from a range of smaller suppliers.
However, a large CHP plant would stretch the supply base.For example, a 30MWe plant would require around 250,000wet t/yr of fuel which would require the full output ofabout 15 typical suppliers.
Section 1. Fuel resource 11
Wastewood
Large CHP
Typical plant demand
Large heat
Small CHPSmall heat
StrawForestrycrops
Energycrops
Typi
cal s
uppl
ier
capa
city
(’0
00t/
yr) 200
150
100
50
0
Figure 4 Typical supplier capacity and plant demand
Forestrycrops
Dryagriculturalresidue (DA)
Wastewood
Woodenergy
crops (WE)
Ener
gy (
TWh/
yr)
40
35
30
25
20
15
10
5
0
Potential additional DA supply, total 12TWhPotential additional WE supply, total 38TWhExisting available supply, total 41 TWh
Figure 3 Existing and potential energy supply from UKbiomass resources
Source B&V
Source PAA

SummaryJust as biomass can be drawn from a number of sources, it can be converted to useful energy through a number of processes and delivered to a variety of markets. Ourscreening of biomass conversion processes demonstratedthat currently combustion represents the best area of focus.Combustion is a proven, established conversion process and the lowest cost option available today. All the otherconversion processes are either higher cost except inniches (e.g. anaerobic digestion and fermentation), do notyet have sufficient market maturity (e.g. gasification andpyrolysis), or generate limited carbon savings at this stage(Fischer-Tropsch and trans-esterification). Our review ofmarkets, which excluded biofuels because of the focus oncombustion, suggested a focus, for cost-effective emissionreduction, on very small scale (c.0.2MW) to industrial scale(c.30MW) units generating heat and power. Co-firing was notconsidered in detail because of low Carbon Trust materialityin this area; also the cost of carbon in domestic-scalemarkets was found to be very high.
Within combustion processes, heat applications, especiallysmall heat (e.g. around 2MW), have the most attractiveand robust plant economics, excluding Governmentincentives. When replacing oil-fired boilers, small heatplant have the most favourable investment returns of allthe applications examined (which included large and smallCHP, large and small electricity only). The oil price is themain driver of heat plant economics. At $30/bbl crude,small heat is the only application with a positive IRR (c.5%)for all biomass fuels. At $50/bbl, small heat plant returnsare high enough to attract investment (c.20%). Large heat(around 30MW) and very small heat (around 0.2MW) generatepositive returns for all fuels, but are probably too low forinvestment (i.e. 10%). The most attractive of the otherapplications is large CHP, which at $50/bbl has low positivereturns for two of the key fuels.
With current Government incentives large biomass CHPbecomes attractive for investment, generating returns ofbetween 15-20%. Electricity only plants have modest returnsdue to a poor ratio of capital cost to revenue.
Conversion process Biomass can be used to provide energy in many ways. The conversion is typically done in two stages. There arethree main types of first-stage processes, which convertbiomass into intermediate products:
Biological processes, which include anaerobic digestionand fermentation and deliver biogas and ethanol
Thermal processes, which include gasification, pyrolysisand combustion. Products can be char, oil and (hot) gas
Chemical processes, which include Fischer-Tropsch andtrans-esterification and deliver ethanol and bio-diesel.
The outputs of these processes are then fed into the secondstage, which converts the intermediate products into energy.The seven conversion technologies considered in this projectwere boilers, steam turbines, steam engines, gas turbines,gas/liquid reciprocating engines, Stirling engines and fuelcells. Not all of these technologies can be combined witheach conversion process. For example, you cannot use thehot gas produced by combustion to power a fuel cell.
Of the first stage processes, combustion currently representsthe best area of focus for the Carbon Trust. Combustion isa proven, established conversion process and the lowestcost option available today (see Section 1). The products of combustion may be passed to steam or hot water boilers.Steam generated may be passed to steam turbine or steamengine driven generators for the production of electricity.
All the other first-stage processes have at least one major limitation.
Anaerobic digestion, which produces biogas, was not takenforward for further analysis. Although it has reasonablepotential for carbon reduction, its costs are high at present,except in certain niches. This is due to high capital costsand low conversion rates. In the UK, the main feed foranaerobic digestion — wet agricultural waste — is mainlytreated in open tanks until it can be spread on the landand therefore the current cost of disposal is very low.
Fermentation produces liquid biofuels (e.g. ethanol fromsugar or starch). Fischer-Tropsch and trans-esterificationprocesses also produce liquid biofuels (e.g. biodiesel fromvegetable oil). Although these chains can be cost effectiveunder current Government incentives, the cost of savingcarbon through biofuels is relatively high compared toother potential routes (although this is strongly dependenton the fossil-oil price). These biofuels were not studiedfurther because their potential total carbon savings arelimited and the cost of carbon is high (see Section 1).
Biomass sector review12
Section 2. Project economics

Gasification and pyrolysis produce a mixture of gaseous,liquid and solid products, depending on factors includingpressure and temperature. The only end-use in which they are cost-effective, when compared to combustion, is electricity-only generation. However, as we will showlater, electricity-only plant are not considered attractivecompared to heat and CHP. Furthermore they are relativelyearly-stage technologies which are not yet sufficientlydeveloped for full commercial use.
MarketsThere are four end-user markets for biomass emerging in the UK:
Co-firing of biomass with coal in large-scale coal firedelectricity generation plants. Power plant operatorsreceive Renewable Obligation Certificates (ROCs) for the portion of their output that is biomass-fuelled. These generate a significant economic incentive for co-firing and many coal plants are currently co-firing
Industrial scale units providing around 30MW electricityand/or heat to industrial sites. There are a number ofsites being developed in the UK (e.g. Sembcorp, PeninsulaPower, Lockerbie, Rothes)
Small-scale (around 2MW) to Very Small-scale (around0.2MW) units for commercial sites, schools, hospitals,nursing homes, etc, providing heat and/or electricity for off-grid and independent applications. Communityheating is also possible at these scales, but has not been considered in detail during this study. Communityheating, irrespective of the fuel source, has only limitedpenetration. In part this is due to the shortness of thedomestic heating season in the UK (about 1,200 hoursper year). In countries such as Austria or Finland wherecommunity heating has been developed much further, theheating season is much longer
Biofuel derived from vegetable oil, sugar/starch or woodycrops. This transport fuel (bio-diesel/bio-ethanol) supplantsfossil-diesel and fossil-petrol supplies respectively.Markets are growing across the EU due to the EU BiofuelsDirective and Government incentives.
Of these four, only the industrial and small-scale marketswere studied further. Although co-firing is competitive inthe current policy and business environment it was notconsidered further because of low Carbon Trust materialityin this area.
Biofuels were not considered further because the potentialcarbon saving is much lower, and their costs of savingcarbon are higher, than for biomass heating and CHP.
Both domestic scale (10-50 kWth) biomass-fired heatingboilers and stoves were investigated. The economics of suchsystems were found to be significantly worse than for theother biomass markets, primarily due to lower load factors.Therefore, as with co-firing and biofuels, these were notcarried forward for further analysis.
Plant economicsAfter selection of the most suitable biomass fuels,conversion processes and end-user markets, 28 chainsremained. They consist of seven plant types, all usingcombustion, with four fuels. Definitions for the seven plant types are given in Table 1.
The four fuels were: forestry crops, dry agricultural residue(straw), energy crops and a 40% waste wood/60% forestrycrop mixture. Instead of considering waste wood as a single fuel type, we have used a mixture of 40% waste woodand 60% forestry crops when assessing plant economics, as the Waste Incineration Directive (WID) allows such aplant to be treated as a co-incinerator. A plant running on 100% waste wood would be treated as an incinerator,and hence it would incur additional costs and face greaterplanning constraints.
In order to compare the economic competitiveness of the28 chains we calculated the Internal Rate of Return (IRR)for each chain. The modelling was based on a 15-year cashflow forecast, with simplifying economic assumptions andsuitable assumptions for the development of fuel prices (bothbiomass and fossil fuels), electricity prices and Governmentincentives (e.g. EU-ETS, ROC prices and capital grants).
Section 2. Project economics 13
Size Displaced Fuel
LH = Large heat = 30MW th Heavy fuel oil
LE = Large electric = 30MW e Gas
LCHP = Large CHP = 30MW e Gas
SH = Small heat = 2MW th Light fuel oil
VSH = Very small heat = 0.2MW th Light fuel oil
SE = Small electric = 2MW e Gas
SCHP = Small CHP = 2MW e Gas
Table 1 Definition of plant types
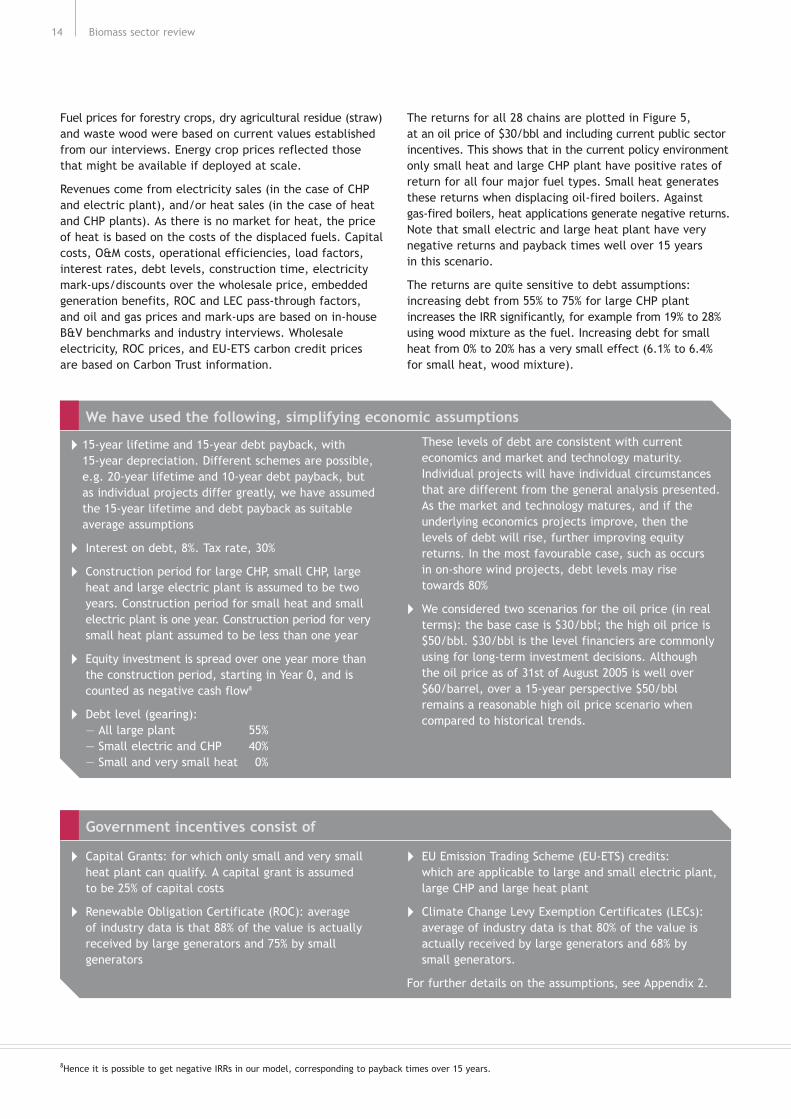
Fuel prices for forestry crops, dry agricultural residue (straw)and waste wood were based on current values establishedfrom our interviews. Energy crop prices reflected thosethat might be available if deployed at scale.
Revenues come from electricity sales (in the case of CHPand electric plant), and/or heat sales (in the case of heatand CHP plants). As there is no market for heat, the priceof heat is based on the costs of the displaced fuels. Capitalcosts, O&M costs, operational efficiencies, load factors,interest rates, debt levels, construction time, electricitymark-ups/discounts over the wholesale price, embeddedgeneration benefits, ROC and LEC pass-through factors,and oil and gas prices and mark-ups are based on in-houseB&V benchmarks and industry interviews. Wholesaleelectricity, ROC prices, and EU-ETS carbon credit prices are based on Carbon Trust information.
The returns for all 28 chains are plotted in Figure 5, at an oil price of $30/bbl and including current public sectorincentives. This shows that in the current policy environmentonly small heat and large CHP plant have positive rates ofreturn for all four major fuel types. Small heat generatesthese returns when displacing oil-fired boilers. Against gas-fired boilers, heat applications generate negative returns.Note that small electric and large heat plant have verynegative returns and payback times well over 15 years in this scenario.
The returns are quite sensitive to debt assumptions:increasing debt from 55% to 75% for large CHP plantincreases the IRR significantly, for example from 19% to 28%using wood mixture as the fuel. Increasing debt for smallheat from 0% to 20% has a very small effect (6.1% to 6.4%for small heat, wood mixture).
Biomass sector review14
8Hence it is possible to get negative IRRs in our model, corresponding to payback times over 15 years.
We have used the following, simplifying economic assumptions
15-year lifetime and 15-year debt payback, with 15-year depreciation. Different schemes are possible,e.g. 20-year lifetime and 10-year debt payback, but as individual projects differ greatly, we have assumedthe 15-year lifetime and debt payback as suitableaverage assumptions
Interest on debt, 8%. Tax rate, 30%
Construction period for large CHP, small CHP, largeheat and large electric plant is assumed to be twoyears. Construction period for small heat and smallelectric plant is one year. Construction period for verysmall heat plant assumed to be less than one year
Equity investment is spread over one year more thanthe construction period, starting in Year 0, and iscounted as negative cash flow8
Debt level (gearing):— All large plant 55%— Small electric and CHP 40%— Small and very small heat 0%
These levels of debt are consistent with currenteconomics and market and technology maturity.Individual projects will have individual circumstancesthat are different from the general analysis presented.As the market and technology matures, and if theunderlying economics projects improve, then thelevels of debt will rise, further improving equityreturns. In the most favourable case, such as occurs in on-shore wind projects, debt levels may risetowards 80%
We considered two scenarios for the oil price (in realterms): the base case is $30/bbl; the high oil price is$50/bbl. $30/bbl is the level financiers are commonlyusing for long-term investment decisions. Although the oil price as of 31st of August 2005 is well over$60/barrel, over a 15-year perspective $50/bblremains a reasonable high oil price scenario whencompared to historical trends.
Government incentives consist of
Capital Grants: for which only small and very smallheat plant can qualify. A capital grant is assumed to be 25% of capital costs
Renewable Obligation Certificate (ROC): average of industry data is that 88% of the value is actuallyreceived by large generators and 75% by smallgenerators
EU Emission Trading Scheme (EU-ETS) credits: which are applicable to large and small electric plant,large CHP and large heat plant
Climate Change Levy Exemption Certificates (LECs):average of industry data is that 80% of the value isactually received by large generators and 68% by small generators.
For further details on the assumptions, see Appendix 2.

The returns are less sensitive to assumptions about conversionefficiencies. All types of heat plant are assumed to haveheat conversion efficiencies of 85%. A 5% increase in heatconversion efficiency causes a 0.5% increase in the plantIRR and vice versa. However, increasing the electricalconversion efficiency for a large electric plant by 2% resultsin an increase in IRR of roughly 5% (although this does notaccount for the more expensive conversion equipment thatwould be required). For small electric plants it makes nocalculable difference, as the payback times remain wellover 15 years.
When the returns are modelled in an environment withoutGovernment incentives it becomes clear that the economicsof electric and CHP plant are strongly dependent on theRenewables Obligation, since ROCs make up about half ofthe electricity revenue. As can be seen in Figure 6, onlyheat applications have positive rates of return withoutGovernment incentives in the $30/bbl scenario. Very smalland large heat plant generate positive returns only in thehigh oil price scenario.
Section 2. Project economics 15
Verysmallheat
SmallCHP
Smallelec-tricity
Smallheat
LargeCHP
Largeelec-tricity
Largeheat
25%
20%
15%
10%
5%
0%
-5%
-10%
Wood mixture (40% waste wood, 60% forestry crops)Dry agricultural wasteWoody energy cropsForestry cropsAbsent bars indicate very negative returns
Oil price $30/barrel
25%
20%
15%
10%
5%
0%
-5%
-10%
Wood mixture (40% waste wood, 60% forestry crops)Dry agricultural wasteWoody energy cropsForestry cropsAbsent bars indicate very negative returns
Verysmallheat
SmallCHP
Smallelec-tricity
Smallheat
Oil price $50/barrel
LargeCHP
Largeelec-tricity
Largeheat
25%
20%
15%
10%
5%
0%
-5%
-10%
Figure 5 Internal rate of return by plant type — currentpublic sector incentives and oil at $30/bbl
Figure 6 IRR by plant type — no government incentives
Source PAA
Source PAA
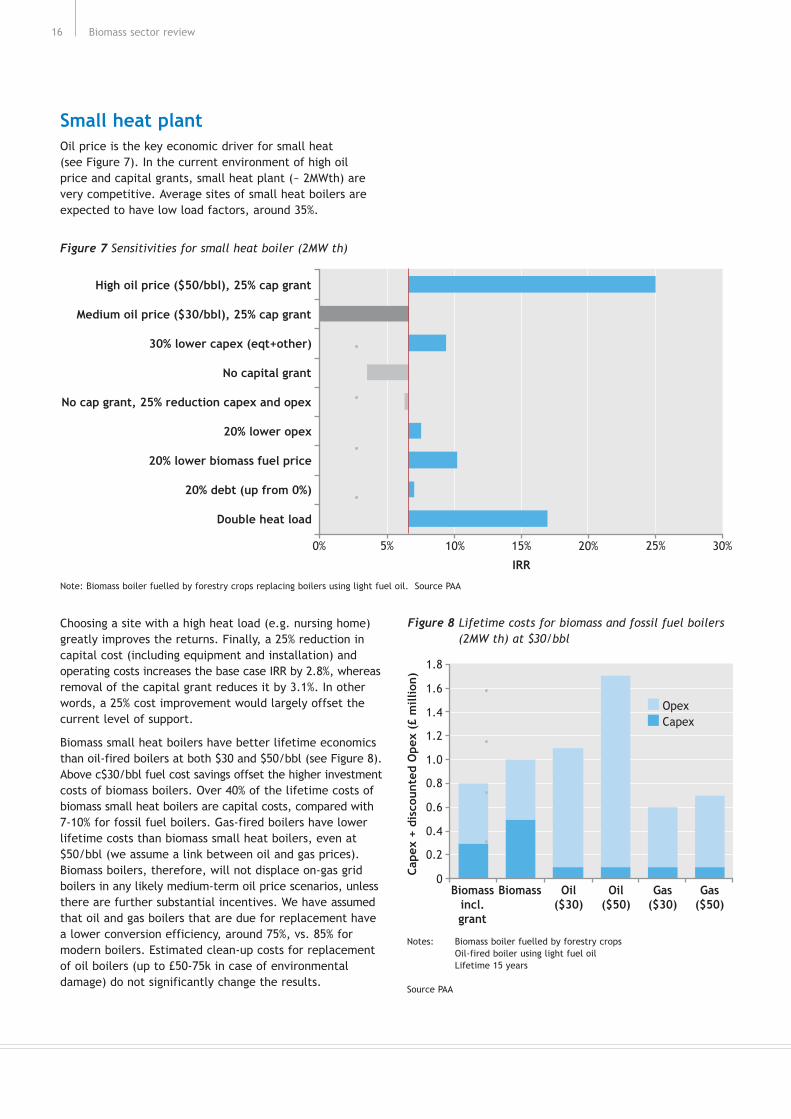
Choosing a site with a high heat load (e.g. nursing home)greatly improves the returns. Finally, a 25% reduction incapital cost (including equipment and installation) andoperating costs increases the base case IRR by 2.8%, whereasremoval of the capital grant reduces it by 3.1%. In otherwords, a 25% cost improvement would largely offset thecurrent level of support.
Biomass small heat boilers have better lifetime economicsthan oil-fired boilers at both $30 and $50/bbl (see Figure 8).Above c$30/bbl fuel cost savings offset the higher investmentcosts of biomass boilers. Over 40% of the lifetime costs ofbiomass small heat boilers are capital costs, compared with7-10% for fossil fuel boilers. Gas-fired boilers have lowerlifetime costs than biomass small heat boilers, even at$50/bbl (we assume a link between oil and gas prices).Biomass boilers, therefore, will not displace on-gas gridboilers in any likely medium-term oil price scenarios, unlessthere are further substantial incentives. We have assumedthat oil and gas boilers that are due for replacement havea lower conversion efficiency, around 75%, vs. 85% formodern boilers. Estimated clean-up costs for replacementof oil boilers (up to £50-75k in case of environmentaldamage) do not significantly change the results.
Small heat plantOil price is the key economic driver for small heat (see Figure 7). In the current environment of high oil price and capital grants, small heat plant (~ 2MWth) arevery competitive. Average sites of small heat boilers areexpected to have low load factors, around 35%.
Biomass sector review16
Biomassincl.grant
Biomass Oil($30)
Oil($50)
Gas($30)
Gas($50)
Cap
ex +
dis
coun
ted
Ope
x (£
mill
ion)
1.6
1.8
1.4
1.0
1.2
0.8
0.4
0.6
0.2
0
OpexCapex
Figure 8 Lifetime costs for biomass and fossil fuel boilers(2MW th) at $30/bbl
IRR
30%25%20%15%10%5%0%
High oil price ($50/bbl), 25% cap grant
Medium oil price ($30/bbl), 25% cap grant
30% lower capex (eqt+other)
No capital grant
No cap grant, 25% reduction capex and opex
20% lower opex
20% lower biomass fuel price
20% debt (up from 0%)
Double heat load
Figure 7 Sensitivities for small heat boiler (2MW th)
Note: Biomass boiler fuelled by forestry crops replacing boilers using light fuel oil. Source PAA
Notes: Biomass boiler fuelled by forestry cropsOil-fired boiler using light fuel oilLifetime 15 years
Source PAA
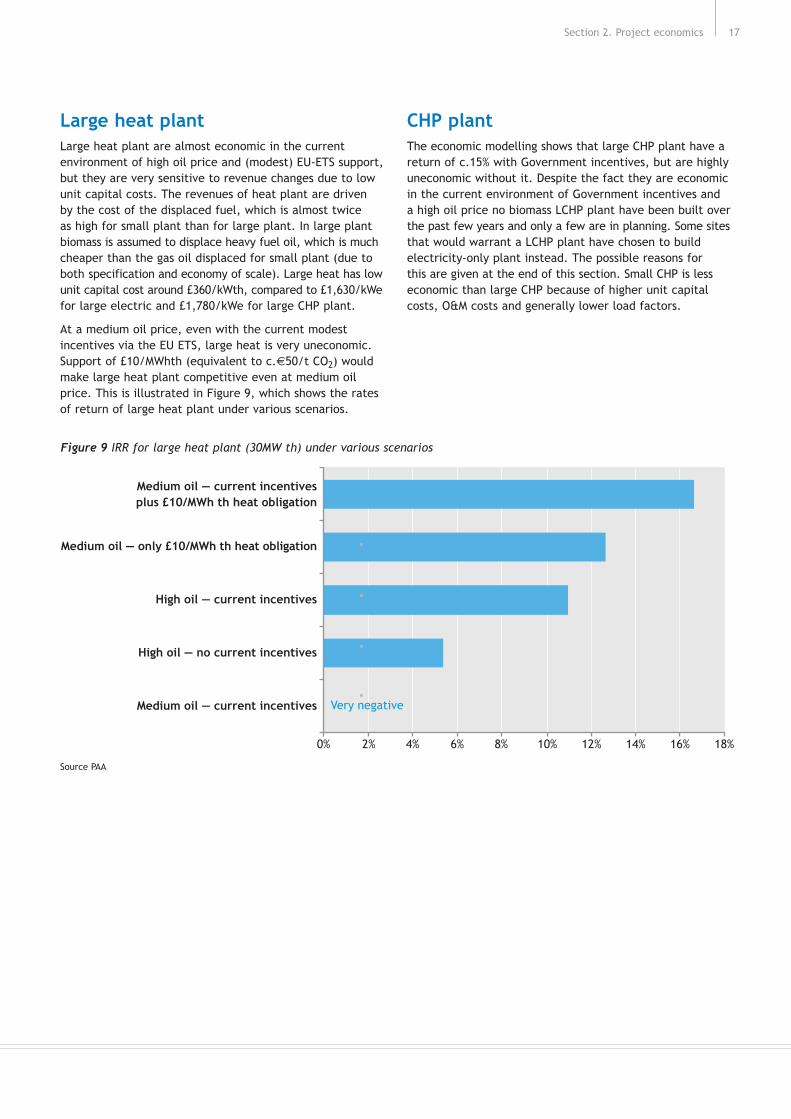
Large heat plantLarge heat plant are almost economic in the currentenvironment of high oil price and (modest) EU-ETS support,but they are very sensitive to revenue changes due to lowunit capital costs. The revenues of heat plant are driven by the cost of the displaced fuel, which is almost twice as high for small plant than for large plant. In large plantbiomass is assumed to displace heavy fuel oil, which is muchcheaper than the gas oil displaced for small plant (due toboth specification and economy of scale). Large heat has lowunit capital cost around £360/kWth, compared to £1,630/kWefor large electric and £1,780/kWe for large CHP plant.
At a medium oil price, even with the current modestincentives via the EU ETS, large heat is very uneconomic.Support of £10/MWhth (equivalent to c.€50/t CO2) wouldmake large heat plant competitive even at medium oilprice. This is illustrated in Figure 9, which shows the ratesof return of large heat plant under various scenarios.
CHP plantThe economic modelling shows that large CHP plant have areturn of c.15% with Government incentives, but are highlyuneconomic without it. Despite the fact they are economicin the current environment of Government incentives and a high oil price no biomass LCHP plant have been built overthe past few years and only a few are in planning. Some sitesthat would warrant a LCHP plant have chosen to buildelectricity-only plant instead. The possible reasons for this are given at the end of this section. Small CHP is lesseconomic than large CHP because of higher unit capitalcosts, O&M costs and generally lower load factors.
Section 2. Project economics 17
0% 2% 4% 6% 8% 10% 12% 14% 16% 18%
Very negative
Medium oil — current incentives plus £10/MWh th heat obligation
Medium oil — only £10/MWh th heat obligation
High oil — current incentives
High oil — no current incentives
Medium oil — current incentives
Figure 9 IRR for large heat plant (30MW th) under various scenarios
Source PAA
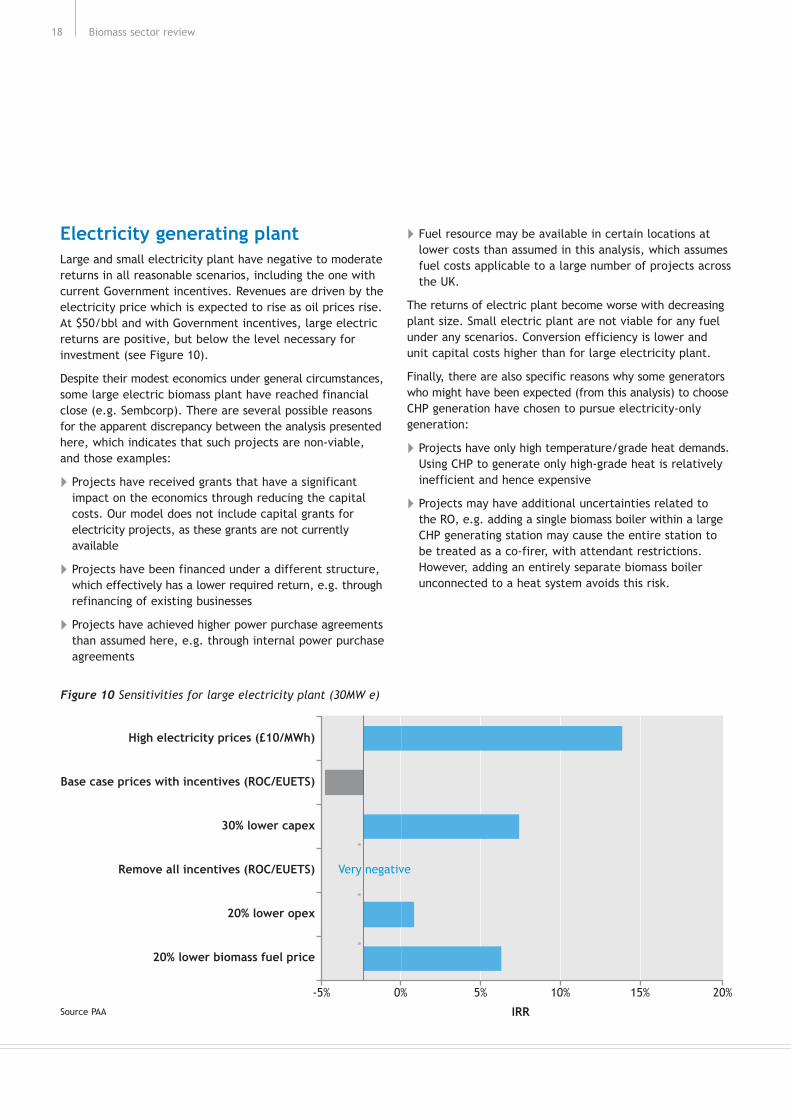
Electricity generating plantLarge and small electricity plant have negative to moderatereturns in all reasonable scenarios, including the one withcurrent Government incentives. Revenues are driven by theelectricity price which is expected to rise as oil prices rise.At $50/bbl and with Government incentives, large electricreturns are positive, but below the level necessary forinvestment (see Figure 10).
Despite their modest economics under general circumstances,some large electric biomass plant have reached financialclose (e.g. Sembcorp). There are several possible reasonsfor the apparent discrepancy between the analysis presentedhere, which indicates that such projects are non-viable,and those examples:
Projects have received grants that have a significantimpact on the economics through reducing the capitalcosts. Our model does not include capital grants forelectricity projects, as these grants are not currentlyavailable
Projects have been financed under a different structure,which effectively has a lower required return, e.g. throughrefinancing of existing businesses
Projects have achieved higher power purchase agreementsthan assumed here, e.g. through internal power purchaseagreements
Fuel resource may be available in certain locations atlower costs than assumed in this analysis, which assumesfuel costs applicable to a large number of projects acrossthe UK.
The returns of electric plant become worse with decreasingplant size. Small electric plant are not viable for any fuelunder any scenarios. Conversion efficiency is lower andunit capital costs higher than for large electricity plant.
Finally, there are also specific reasons why some generatorswho might have been expected (from this analysis) to chooseCHP generation have chosen to pursue electricity-onlygeneration:
Projects have only high temperature/grade heat demands.Using CHP to generate only high-grade heat is relativelyinefficient and hence expensive
Projects may have additional uncertainties related to the RO, e.g. adding a single biomass boiler within a largeCHP generating station may cause the entire station tobe treated as a co-firer, with attendant restrictions.However, adding an entirely separate biomass boilerunconnected to a heat system avoids this risk.
Biomass sector review18
High electricity prices (£10/MWh)
Base case prices with incentives (ROC/EUETS)
30% lower capex
Remove all incentives (ROC/EUETS)
20% lower opex
20% lower biomass fuel price
IRR
-5% 0% 5% 10% 15% 20%
Very negative
Figure 10 Sensitivities for large electricity plant (30MW e)
Source PAA

SummaryDespite the potential economic viability of certain biomassplant, relatively little construction is underway. In part thisis due to the significant barriers to development that biomassfaces throughout all stages of development. Four mainbarriers affect all developers; lack of market informationon fuels, fuel supply risk, planning and policy costs. Thesebarriers increase the risk of investing in biomass (therebyincreasing the cost of capital), and increase operating costs.Together these reduce the economic viability of biomassdevelopments. In addition, smaller developers are affectedby a number of other barriers including lack of awarenessand understanding of biomass by end-users/customers,poor availability of technical expertise (installation andmaintenance) and lack of access to debt funding.
In a good fit with the economic analysis, heat applicationsface fewer barriers than CHP or electricity-only plant asthey avoid issues related to the Renewables Obligation,debt financing and, in many cases, planning.
Barriers within the stages of biomass developmentInterviews, literature surveys and peer review have allconfirmed the existence of a substantial number of barriersthat impede the development of biomass at every stage.When a developer is involved (typically when a new plantis built on a greenfield site, often with high levels of debtfinance) development comprises three stages, the last twooccurring in parallel:
Project initiation: Where the site and customers areidentified, and planning and permitting are undertaken.In general the key problem at this stage is to convincecustomers and the local population of the merits of the project
Project development: Where the project is financed andthe permitted project is built. The key problems hereare the high project costs due to lack of scale (in generaleach project is unique) and high complexity
Supply chain development: Where fuel supply contractsare negotiated and then executed. The key problem is to secure supplies which are bankable from an investor’spoint of view.
The development process is simpler at small scale (i.e. verysmall heat) and when biomass is replacing existing heat plant(e.g. replacement of an oil boiler by a wood chip fuelled
boiler), which often involves a package of equipment,installation, maintenance and fuel supply contract.
Project initiation barriersThe barriers affecting the project initiation stage can be grouped into five areas; credit, financial market gap,market information, planning and end-user misalignment:
Credit
Many, typically smaller, developers do not have a strongcreditworthiness record. This is important for electricityplants, as lack of creditworthiness prevents a developerentering into discussions with an electricity supply companyon a Power Purchase Agreement (PPA). In turn, a PPA isnecessary to raise debt-based finance. The electricitysupply company will only do business with a generator whocan demonstrate a low level of counterparty risk. Lack ofcreditworthiness is much less of a barrier in heat applicationsas no PPA is required although if the developer is alsosupplying the fuel he will need to be able to demonstratelong-term reliability.
Financial market gap
Typically it is advantageous to finance projects above smallscale with a high level of debt, say above 50%, as this reducestax charges and increases return on equity. However, smalldevelopers who seek to finance small-scale projects one ata time often find their debt needs are below the thresholdrequired to gain the interest of most lenders (usually banks).Thus finance may not be available at all, or fees and interestrates may be substantially increased over usual levels,reducing the viability of the project.
Market information
In order to get preliminary interest from the planningauthorities and financial institutions, project developersneed to demonstrate the availability of fuel supplies inconsiderable detail. This includes identifying the primarysuppliers and secondary suppliers as back-up to covercontingencies such as poor weather and crop failure. In the case of CHP or heat projects, developers must also identify suitable heat demand from creditworthycustomers. Both the biomass fuel and heat markets areopaque. Market information is often not collected and very rarely published. This means that projects aredifficult to identify and/or place unnecessary marketinformation costs on developers.
Section 3. Barriers to development 19
Section 3. Barriers to development

Planning
Local opposition, inexperience and lack of resources inplanning authorities, lack of coordination, and lengthy and unclear planning procedures can substantially increaseproject risk. For example, there is no standard planningtemplate for biomass projects. Planning is an issue for all schemes at and above small scale and is particularlyonerous for plant using waste (e.g. waste wood) as a fuel.
End-user misalignment
A variety of barriers relating to end-users of biomass energyprevent users from taking what, on the face of it, is therational decision to invest in biomass energy. This seems to affect small and very small-scale biomass schemesparticularly.
Often energy is a non-core activity for the end-user (e.g. a supermarket, leisure centre or hotel) where, for non-energy intensive industries, the cost of energy is typically 1-2% of turnover. Investment in biomass may be seen as unattractive, despite a positive NPV, as:
The initial capital cost is often higher than fossil fuelalternatives and companies often have constrained capital
The payback period (10+ years) is far longer than thetypical payback of 1-4 years for non-core investments.
Users are often poorly informed about the risks and benefitsof biomass. For example, industrial heat loads are ideal for biomass as they have a high utilisation. However,unfamiliarity with both biomass technology and fuel supplychains can lead to a perception of high operating risk whichis highly undesirable in an industrial situation where energydisruption would lead to severe impacts including loss of production, and loss of customers and market share.Furthermore, it appears the environmental benefits ofbiomass may not be widely appreciated by potential end-users.
Overall the barriers at the project initiation stage aretypically of the ‘go/no-go’ variety, preventing potentiallyviable projects from starting. They impact very small heatprojects the least, as these do not usually require eitherdetailed planning permission, debt finance, or a developerwith a strong track record of creditworthiness. Small heatand large CHP schemes are affected by most of the barriers,although small heat is not affected by the credit barrierand large CHP is not affected by the financial market gapbarrier (undertaken by large developers). Small CHP isaffected by all the project initiation barriers.
Project development barriersAt the project development stage, there are three mainbarriers that increase the costs of a biomass scheme in ways that could be avoided in the future. These are:
Policy costs
The current policy framework creates cost burdens forbiomass schemes in two key areas. Firstly, there is a lackof availability of long-term PPAs, and inherent uncertaintyin the Renewable Obligation mechanism for developers whoare not part of an integrated electricity supply company.This barrier is common to almost all renewable power andhas been well documented elsewhere9. This is translatedinto discounts on electricity and ROCs as high as 25% andincreases the need for secure and inexpensive fuel suppliers.Secondly, where it is relevant, the Waste IncinerationDirective (WID) imposes emission control costs that can make the difference between survival and closure for somebiomass generators, whereas the risk of dioxin emissionsfrom biomass generators is relatively low10. This iscompounded by the broad definition of waste used in WID,covering all by-products. Clearly these policy costs affectthose biomass projects which generate power and thosewhich use waste as a fuel.
Costs of finance
The financial market gap indicated earlier in this reportleads, in the development stage, to high costs of financebecause of higher equity requirements and higher interestrates and fees. This is compounded by the perception of ahigh degree of risk and the high individual project assessmentcosts, as biomass projects are not well understood by lenders.
Project costs
All biomass developments have a variety of ancillary projectcosts such as legal costs and installation costs, includingcivil engineering costs and grid connections. In a biomassproject the legal costs are particularly high because of the complex contractual obligations. The installation costs can be high, and access to the grid, as with many otherrenewable power technologies, is a lengthy process andfinancially risky. These costs affect all the biomass chainsapart from very small heat, which has a simpler projectstructure and no need for grid connections.
All these costs have been included in our modelling used to generate the project economics presented in Section 2.The impact of addressing these barriers would, therefore,be to improve the economic viability of biomassdevelopments.
In addition there is a specific market gap for very smallheat, due to a lack of availability of expertise and training.This means there is a pressing shortage of installation skills,which substantially hampers the roll-out of (very) smallheat boilers.
Biomass sector review20
9DTI; Renewables Innovation Review.10House of Lords Select Committee on Science and Technology; “Renewable Energy: Practicalities”.

As in the project initiation stage, very small heat is affectedby the fewest barriers overall (only the market gap inexpertise and training). All other applications are affectedby policy cost, costs of finance and project costs barriers,although small heat is less affected by policy costs (i.e. noissues around PPAs/ROCs).
Finally, there are a number of costs which are currently highbut will reduce as the biomass sector grows. They are notbarriers in the sense of market failures or inappropriatecost, but they will benefit from any incentives whichaccelerate the growth of biomass in general. These include:
Maintenance costs
The costs of performance guarantees, indemnities and insurance.
Supply chain barriersThe principal barrier in the supply chain is fuel supply risk, which has two key elements: contracting risk andproduction variation.
A developer or end-user needs to be able to agree fuelsupply contracts with creditworthy and reliable suppliers in order to run their operation and access debt finance(the supply contracts need to be ‘bankable’, i.e. be verylow risk). There is a lack of such suppliers in the UK.Individual farmers or foresters are usually too small to be creditworthy and are sometimes regarded by creditorsas unreliable debtors. Biomass fuels usually have alternativeuses (e.g. in the paper or furniture industry) and, if pricesin these markets exceed biomass fuel prices, the productcould be sold to these alternative uses, leaving the biomassplant idle due to lack of feedstock. Furthermore there islittle supply infrastructure, i.e. fuel intermediaries thatare creditworthy and have a variety of contracts thatenable them to mitigate climatic, price and other risks.This is not an absolute barrier as some creditworthycounterparties exist (e.g. in waste wood, and forestrycontractors and organisations such as Forestry Enterprise),but at present these account for a small minority of theavailable biomass resource in the UK.
As biomass is a natural product there can be considerablevariation both in quality (e.g. moisture content or level of contamination) and quantity (e.g. yield variations forenergy crops). Again, due to a lack of a supply infrastructure(e.g. a liquid market where price or quantity risk can be hedged), this risk must be managed directly by thedeveloper. In addition, the current policy frameworkcompounds fuel supply risk by narrowly defining energycrops and placing restriction on the transportation of fuel for grant-funded plant.
Fuel supply risk affects all the key applications of biomass,although smaller-scale developments find the risk easier to manage as their demand is better suited to the supplier structure.
Barriers from a developer’s point of viewExamining the barriers from the developer’s point of view,rather than from the application-type point of view, we seethat large developers face four main barriers which increaserisk, thereby increasing the cost of capital and increasingoperating costs. Together these reduce the economicviability of biomass developments. The four barriers are:
Market information (Project Initiation): The lack of fuelmarket information makes identification and coordinationof large-scale supplies difficult to achieve. The need tocontract without reference to standard prices and termsincreases negotiating and contracting costs
Fuel supply risks: The absence of major counterpartiesresults in credit risk. In addition, the lack of significanttrading of the major fuels means that supply risks (quality,price or volume) cannot be hedged
Planning: Public opposition to large biomass plant can be strong, and the complexity of the planning processincreases with plant size
Policy costs: For power generation plant, the uncertaintyinherent in the RO mechanism reduces the value of theROCs received by non-integrated suppliers.
Small developers face all the above barriers although fuelsupply risks are often more manageable at a smaller scale.They face, moreover, a number of additional barriers:
Credit: Without credit, some small developers are unableto negotiate a PPA
Financial market gap: Owing to the financial market gap,small developers may be unable to raise investment.Project finance is not viable for small projects, and smalldevelopers are not sufficiently capitalised
Cost of finance: As a result of the higher equityrequirement and higher interest rates/fees, the final costof finance is generally higher than for large developers
End-user misalignment: Lack of awareness of biomassboilers, and the non-core nature of energy, leads tolower than expected investment by end-users
Market gap: Lack of expertise and training
Project costs: Ancillary costs for smaller developers are higher.
In general, very small heat faces the fewest barriers. As theprojects are far simpler, planning and financial barriers arelow and RO issues are avoided.
For the latter reason, small and large heat applications facefewer barriers than CHP or electricity-only applications.
Section 3. Barriers to development 21
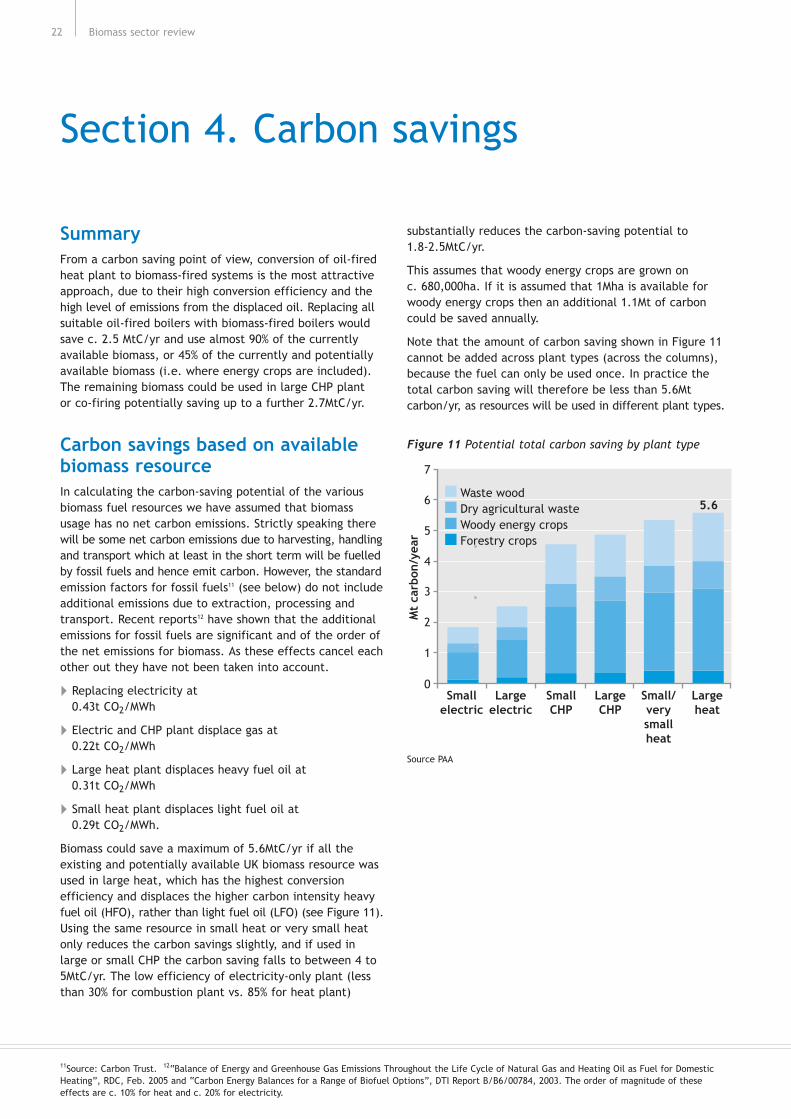
SummaryFrom a carbon saving point of view, conversion of oil-firedheat plant to biomass-fired systems is the most attractiveapproach, due to their high conversion efficiency and thehigh level of emissions from the displaced oil. Replacing allsuitable oil-fired boilers with biomass-fired boilers wouldsave c. 2.5 MtC/yr and use almost 90% of the currentlyavailable biomass, or 45% of the currently and potentiallyavailable biomass (i.e. where energy crops are included).The remaining biomass could be used in large CHP plant or co-firing potentially saving up to a further 2.7MtC/yr.
Carbon savings based on availablebiomass resourceIn calculating the carbon-saving potential of the variousbiomass fuel resources we have assumed that biomassusage has no net carbon emissions. Strictly speaking therewill be some net carbon emissions due to harvesting, handlingand transport which at least in the short term will be fuelledby fossil fuels and hence emit carbon. However, the standardemission factors for fossil fuels11 (see below) do not includeadditional emissions due to extraction, processing andtransport. Recent reports12 have shown that the additionalemissions for fossil fuels are significant and of the order ofthe net emissions for biomass. As these effects cancel eachother out they have not been taken into account.
Replacing electricity at 0.43t CO2/MWh
Electric and CHP plant displace gas at 0.22t CO2/MWh
Large heat plant displaces heavy fuel oil at 0.31t CO2/MWh
Small heat plant displaces light fuel oil at 0.29t CO2/MWh.
Biomass could save a maximum of 5.6MtC/yr if all theexisting and potentially available UK biomass resource wasused in large heat, which has the highest conversionefficiency and displaces the higher carbon intensity heavyfuel oil (HFO), rather than light fuel oil (LFO) (see Figure 11).Using the same resource in small heat or very small heatonly reduces the carbon savings slightly, and if used inlarge or small CHP the carbon saving falls to between 4 to5MtC/yr. The low efficiency of electricity-only plant (lessthan 30% for combustion plant vs. 85% for heat plant)
substantially reduces the carbon-saving potential to 1.8-2.5MtC/yr.
This assumes that woody energy crops are grown on c. 680,000ha. If it is assumed that 1Mha is available forwoody energy crops then an additional 1.1Mt of carboncould be saved annually.
Note that the amount of carbon saving shown in Figure 11cannot be added across plant types (across the columns),because the fuel can only be used once. In practice thetotal carbon saving will therefore be less than 5.6Mtcarbon/yr, as resources will be used in different plant types.
Biomass sector review22
Section 4. Carbon savings
11Source: Carbon Trust. 12“Balance of Energy and Greenhouse Gas Emissions Throughout the Life Cycle of Natural Gas and Heating Oil as Fuel for DomesticHeating”, RDC, Feb. 2005 and “Carbon Energy Balances for a Range of Biofuel Options”, DTI Report B/B6/00784, 2003. The order of magnitude of theseeffects are c. 10% for heat and c. 20% for electricity.
Smallelectric
Largeelectric
SmallCHP
LargeCHP
5.6
Small/verysmallheat
Largeheat
Mt
carb
on/y
ear
6
7
5
4
3
2
1
0
Waste woodDry agricultural wasteWoody energy cropsForestry crops
Figure 11 Potential total carbon saving by plant type
Source PAA
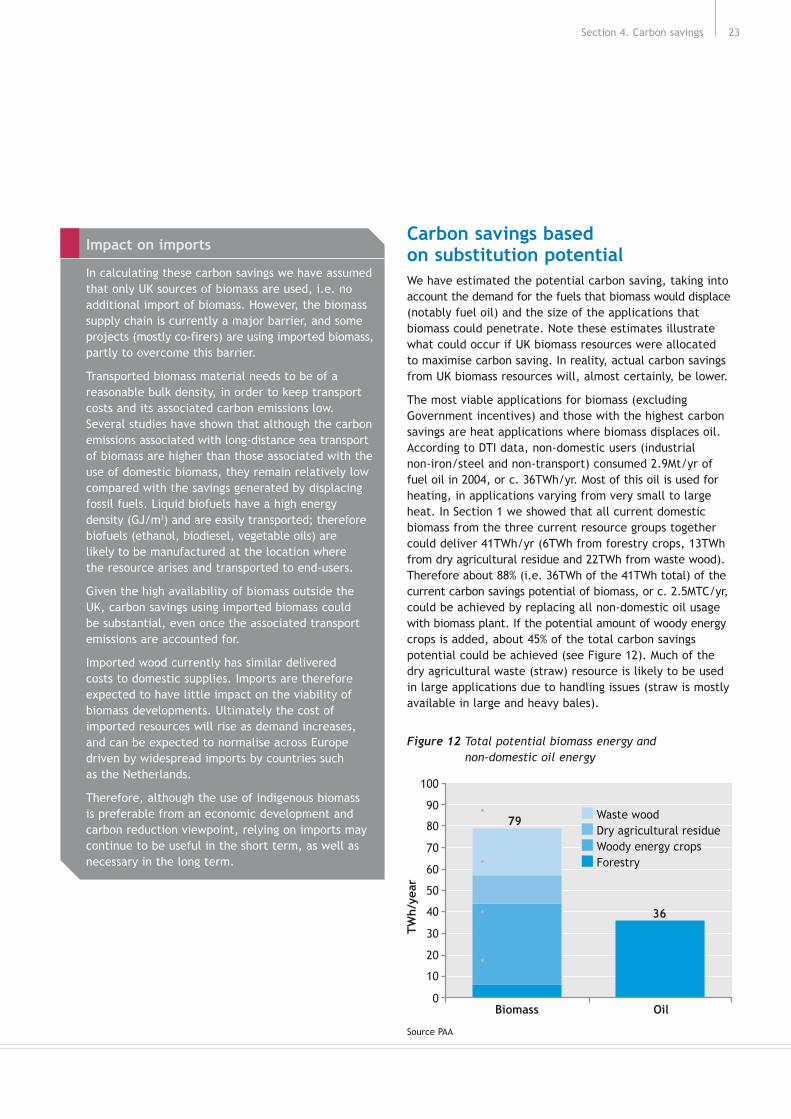
Carbon savings based on substitution potentialWe have estimated the potential carbon saving, taking intoaccount the demand for the fuels that biomass would displace(notably fuel oil) and the size of the applications thatbiomass could penetrate. Note these estimates illustratewhat could occur if UK biomass resources were allocatedto maximise carbon saving. In reality, actual carbon savingsfrom UK biomass resources will, almost certainly, be lower.
The most viable applications for biomass (excludingGovernment incentives) and those with the highest carbonsavings are heat applications where biomass displaces oil.According to DTI data, non-domestic users (industrial non-iron/steel and non-transport) consumed 2.9Mt/yr offuel oil in 2004, or c. 36TWh/yr. Most of this oil is used forheating, in applications varying from very small to largeheat. In Section 1 we showed that all current domesticbiomass from the three current resource groups togethercould deliver 41TWh/yr (6TWh from forestry crops, 13TWhfrom dry agricultural residue and 22TWh from waste wood).Therefore about 88% (i.e. 36TWh of the 41TWh total) of thecurrent carbon savings potential of biomass, or c. 2.5MTC/yr,could be achieved by replacing all non-domestic oil usagewith biomass plant. If the potential amount of woody energycrops is added, about 45% of the total carbon savingspotential could be achieved (see Figure 12). Much of thedry agricultural waste (straw) resource is likely to be usedin large applications due to handling issues (straw is mostlyavailable in large and heavy bales).
Section 4. Carbon savings 23
Impact on imports
In calculating these carbon savings we have assumedthat only UK sources of biomass are used, i.e. noadditional import of biomass. However, the biomasssupply chain is currently a major barrier, and someprojects (mostly co-firers) are using imported biomass,partly to overcome this barrier.
Transported biomass material needs to be of areasonable bulk density, in order to keep transportcosts and its associated carbon emissions low.Several studies have shown that although the carbonemissions associated with long-distance sea transportof biomass are higher than those associated with theuse of domestic biomass, they remain relatively lowcompared with the savings generated by displacingfossil fuels. Liquid biofuels have a high energydensity (GJ/m3) and are easily transported; thereforebiofuels (ethanol, biodiesel, vegetable oils) are likely to be manufactured at the location where the resource arises and transported to end-users.
Given the high availability of biomass outside theUK, carbon savings using imported biomass could be substantial, even once the associated transportemissions are accounted for.
Imported wood currently has similar delivered costs to domestic supplies. Imports are thereforeexpected to have little impact on the viability ofbiomass developments. Ultimately the cost ofimported resources will rise as demand increases,and can be expected to normalise across Europedriven by widespread imports by countries such as the Netherlands.
Therefore, although the use of indigenous biomass is preferable from an economic development andcarbon reduction viewpoint, relying on imports maycontinue to be useful in the short term, as well asnecessary in the long term.
Biomass
36
79
Oil
TWh/
year
90
100
70
60
50
30
20
0
40
80
10
Waste woodDry agricultural residueWoody energy cropsForestry
Figure 12 Total potential biomass energy and non-domestic oil energy
Source PAA

The remaining biomass resource totalling 43TWh/yr(5TWh/yr of currently available biomass, and 38TWh/yrpotentially available biomass) is likely to be used in twofurther markets:
Large CHP plant substituting gas. In the current policyenvironment large CHP is competitive and the next mosteconomically attractive use after heat if Governmentincentives are ignored. A study for the Carbon Trust13
estimated that the unexploited technical potential inindustrial applications for gas-fired large CHP plant isroughly 6.7GWe. Exploiting less than half of that potentialwould use all the remaining 43TWh/yr of potentialbiomass energy in CHP plant and would save c. 2.7Mt/yrof carbon per year
Co-firing. This was not analysed in great depth as thepotential for the Carbon Trust to be material in this areais limited. However, it was concluded that co-firingbiomass in coal plants is economic and relatively attractivefrom a carbon-saving and cost of carbon-saved point ofview14. If it is assumed that on average coal stations use3% biomass then in total in the UK co-firing would use c. 10TWh/yr of biomass fuel and could save c. 0.7MTC/yr.Note that this would only be valid for the short tomedium-term future, as the Government is planning tophase out co-firing support on the longer term.
Finally, there may also be two other markets into whichbiomass could (eventually) be used. Firstly, in the domesticheating sector, which used about 2.4 Mt fuel oil in 200415.Due to the low load factor (around 15% in the UK) andrelatively high unit capital costs this sector is currently not competitive. However, some wood boiler suppliers are reporting a growing interest from the domestic sector,especially as the oil price continues to rise. Secondly, there is the use of petroleum gases16 in the industrial non-iron/steel, non-transport, and domestic sectors, whichcould be replaced by biomass.
Overall, we estimate that about 5MTC/yr could be saved inthe UK by using all current and potentially available biomass.Half could be saved by replacing the oil used for heating inthe industrial non-iron/steel and non-transport sector andthe remainder in large CHP or co-firing applications.
Biomass sector review24
13AEAT: “Study of the Carbon Savings and Economics of CHP Schemes”.14Source B&V.
15Source DTI.16Includes ethane, propane, butane and other petroleum gases.

SummarySmall and large heat are the only two applications modelledthat presently have a low cost of carbon17; c.£25/tC and c.£30/tC respectively at $30/bbl crude. Throughstandardisation and deployment at scale, small heat hasthe potential for significant cost reduction (c.25% of projectcosts). Large heat technology is mature and offers morelimited opportunity for cost savings. None of the otherbiomass applications currently offer sufficient cost reductionopportunity to achieve these low costs of carbon; however,this situation should be regularly reviewed.
On a cost-of-carbon basis, therefore, the UK shouldconsider exploiting the largely untapped potential of heatapplications, particularly small heat. To do so will requirelong-term support (e.g. through the EU-ETS or a RenewableHeat Obligation and/or a capital grant programme) andtargeted action to address the key barriers to biomassdevelopment. This should include investment in large scalesupply chain/technology demonstration programmes,education and information programmes, and ensuring therecent changes to the planning system are effective.However, in shaping the overall policy framework for
biomass (including CHP, electricity and biofuels), its non-carbon benefits will need to be considered (e.g. energysecurity, employment opportunities, non-intermittentelectricity supply, etc).
Costs of carbonWhereas all the biomass applications which we have studiedin detail have considerable scope to save carbon, only heatapplications can do so cost effectively at present.
We have estimated the current cost of carbon for each ofthe major biomass applications (defined as cost per tonneof carbon saved to bring the NPV of an investment to zero at a discount rate of 15% without any governmentincentives). This shows that two heat applications, small heatand large heat, have the potential to deliver cost-effectivecarbon savings. Using our base case of $30/bbl, both havea cost of carbon below £35/tC, the bottom of the currentrange of the Social Cost of Carbon. The range of costs ofcarbon is £23-29/tC for small heat and £27-34/tC for large heat (see Figure 13) depending on the type of fuel. At $50/bbl, the costs of carbon for small heat becomenegative, and those for large heat are very low at £5-15/tC.
Section 5. Implications for Policy and the Carbon Trust 25
Section 5. Implications for Policy and the Carbon Trust
17Cost of carbon has been defined as the cost of bringing the NPV of a biomass project up to zero at a discount rate of 15% without any current policy support,per tonne of carbon saved.
0
100
200
300
400
500
Small heat Very smallheat
Large CHP Largeelectricity
Small CHP Smallelectricity
Large heat
Social cost ofcarbon range£35-140/tC
£/to
nne
C
SE range£587-£639
Forestry cropsWoody energy cropsDry agricultural wasteWW 40%/FC 60%
Figure 13 Cost of carbon per type of biomass plant
Notes: 1 Assuming $30/barrel oil, excluding any existing Government incentives Sources: UK Government Economic Service/PAA
Two further applications, very small heat and large CHP,deliver carbon savings within the range of social costs ofcarbon, £35-140/tC. At $30/bbl, very small heat has a costof carbon of between £86-97/tC dropping to £40-52/tC at$50/bbl. Large CHP has a cost of carbon between £94-131/tCat $30/bbl, dropping to £62-121/tC at $50/bbl.
All the other applications, large and small electricity andsmall CHP, have costs of carbon well above £140/tC (theupper limit of the social cost of carbon) at $30/bbl and$50/bbl, and so can not deliver cost-effective carbonsavings at present.
In general for heat, CHP and power applications, thelowest cost of carbon is generated by dry agriculturalwaste and the highest by forestry crops, although thedifference is marginal in terms of policy conclusions, noting that in general dry agricultural waste is more suitable for large-scale applications.
The case for Government support —small heatThe case for Government support for small heat is strong.In addition to the lowest current costs of carbon, smallheat has the potential to further reduce its cost of carbon.
At present, small boilers are sized for specific applicationsand sold in low volumes, with high marketing and distributioncosts. Equipment costs are not greatly affected by the lowscale in the UK as most small boilers are manufacturedoutside the UK and at high volume. Increasing penetrationcould lead to a reduction of 20-30% in final project coststhrough economies of scale and a higher level ofstandardisation.
A cost reduction of 25% in small heat projects reduces thecost of carbon from c. £25/tC to £18/tC. In high load factorapplications, such as residential care homes and buildingswhere both heating and cooling are required, it is likelythat small heat would be fully competitive at $30/bbl.
Despite its favourable cost of carbon and the potential for further cost reductions, small heat currently receiveslimited long-term Government assistance. For example,small heat plant is too small for Phase 1 of the EU-ETS andthe Climate Change Levy (CCL) provides no incentive forapplications that would otherwise use fuel oil as this isexempt from the CCL.
There are a great many potential applications for biomassat an intermediate size between small and very small heat.Many of these intermediate-sized applications are likely tohave similar characteristics to small heat and thereforewill have the same case for Government support.
As part of this review we have not quantitatively evaluatedthe alternative ways in which the Government mightintervene. However, our analysis would suggest that toreduce carbon emissions using biomass, intervention shouldseek to encourage investment in small heat. This shoulddrive down costs and establish robust fuel supply chainswhich will in turn have wider benefits for other biomassapplications. Achieving this will probably require someform of financial support to underpin future oil priceuncertainty, and action to address the key barriers to the development of biomass.
We have not conducted a detailed appraisal of biomasspolicy mechanisms, as that is part of the wider remit ofthe Government Biomass Taskforce. However, based on our interviews and analysis, we have briefly examined fivedifferent potential financial support measures: capital grants,EU-ETS, CCL, Renewable Heat Obligation (RHO) and otherfiscal measures. Although no scheme is ideal, the mostpromising measures appear to be the EU-ETS and the RHO and, potentially, capital grants if the current scheme is re-thought.
Inclusion of small heat into the EU-ETS has a number ofadvantages. It is a long-term scheme which taxes carbonemissions directly, and the current price of carbon providessufficient support. On the other hand, the administrativecosts of the EU-ETS may be too high for small developments,the new entrant reserve is limited and, as the EU-ETS is a market-based scheme, the future price of carbon is uncertain.
Creation of an RHO has been subject to considerable debatein policy circles and we will not seek to replicate existingargument here. However, from the biomass point of view,an RHO could provide a long-term framework within whichsupport levels could vary according to, among other factors,the variation in oil prices. However an RHO maybe verydifficult to set up in practice.
Biomass sector review26

As currently established, capital grants have been ineffective.Our interviews have highlighted three main problems: the temporary nature of grants (and therefore the lack ofcertainty needed to stimulate infrastructure investment),the distortions in the boiler market caused by grants andthe high level of bureaucracy involved in applying for agrant. It may be possible to re-structure the capital grantscheme to overcome these problems, but no concretesuggestions were made as part of our interviews.
The other potential support measures seem unlikely to be effective. Industry believe that the CCL will not continue,and this undermines its impact on investment decisions.Other fiscal measures (e.g. ECAs and reduced VAT) are likelyto have limited impact, either because the subsidy level is low or because coverage is poor (i.e. VAT which onlyeffects non-business applications). However, in the lattercase there is some indication that VAT on biomass boilers is a significant hurdle for very small users.
In addition to providing financial support, Government maywell have a role in addressing 5 out of the 10 key barriersto the development of biomass identified in this report:
Market information: The provision of information onresource, in this case biomass fuel, is a public good thatGovernment could ensure is readily available, as it doesin other areas.
Fuel supply risks: Fuel supply will not be fully availableuntil biomass projects are in place to create a demand.On the other hand, biomass projects will not bedeveloped until fuel supply is available. Government can have a role to play in addressing this systemicmarket failure by encouraging the development of a fuel supply infrastructure e.g. by setting up supply chain demonstration programmes
End-user misalignment: This barrier covers a variety of market failures including lack of awareness, splitincentives (e.g. the landlord/tenant split) and systemicfailure (e.g. externally imposed budget constraints). It is clearly legitimate for Government to address marketfailures e.g. by enhancing support activities such asinformation provision
Market gap: As the key provider of skills in the UK, theGovernment has a role in addressing the lack of expertisein certain heat applications
Planning: Government clearly has a role in aligning theplanning process to its objectives.
The above include all the major barriers to heat schemesin the project initiation stage which prevent the start-upof biomass developments, as well as the key supply-chainbarrier and the non-cost project development barriers. We expect that successfully addressing these barriers wouldhave a material impact on the development of biomass asa whole.
We have not assessed in detail the ways in which to addressthese barriers. However, solutions could include:
Large-scale demonstration projects to establish regionalsupply chains and drive down costs. As part of thisdemonstration project, fuel and heat demand availabilitycould be mapped and published
Support programmes (e.g. education, information andtraining) to help deal with end-user misalignment andthe expertise/market gap
Monitoring of the impact of PPS22 to establish if itprovides a suitable planning framework for biomass.
The case for Government support —large heatThe case for Government support of large heat is much less strong.
At high oil prices ($50/bbl), large heat is almost economic,and with a modest level of support (e.g. £3/MWth) wouldbe economically viable. However, large heat returns arevery sensitive to changes in oil prices, more so than smallheat. Large heat plant IRR drops from 11% to very negativeon reducing oil prices to $30/bbl (see Figure 9). In contrastsmall heat IRR drops from 25% to 7% on reducing oil pricesfrom $50/bbl to $30/bbl. Therefore, investors will have toexpect that oil prices will remain consistently high for thelong term (say 10-15 years) before being convinced of theviability of large heat. Even at current high oil prices, thislong-term expectation has not been established.
Furthermore, large heat plant technology is very matureand expected cost improvements are small. Unlike smallheat, therefore, there is little prospect of being able tophase out Government incentives, unless oil prices stayhigh long term.
Section 5. Implications for Policy and the Carbon Trust 27
The case for Government support —other applications/technologiesAt present the other biomass applications we reviewed haverelatively high costs of carbon starting at over £80/tC. At present they do not offer the scope for improvementrequired to be economic without Government support.Consequently, from a carbon perspective, the case forGovernment support is much less clear than for small heat. However, in shaping the overall policy framework for all biomass (including CHP, electricity and biofuels), the Government will need to take into account the otherbenefits of biomass (e.g. energy security, employment,despatchable electricity generation, etc).
Large CHP and large electric are mature technologies with,therefore, limited scope for improvement and cost reduction.However, through the advent of new technology, smallelectric has the potential for cost reduction. In order to be economically viable, however, it would require veryconsiderable cost reductions, of the order of 80% in bothcapital and operating costs, which is well beyond the scopecurrently envisaged. Small and very small CHP are theapplications where technology is likely to have the biggestimpact in terms of cost reduction. Successful developmentof technologies such as combustion/gasification feedingStirling engines or turbines/fuel cells could reduce costs by up to 50%. However, at $30/bbl, a reduction of c. 70% is required to be economic without Government support.Clearly, this situation should be monitored in future, as technology may open up greater scope for cost reduction,or long-term oil price expectations may increase markedly.
Next steps for the Carbon TrustThe Carbon Trust is now beginning to scope out a project,seeking to accelerate the development of biomass in theUK based on the experience it has gained in similar projects(e.g. the Marine Energy Challenge). The biomass projectwill focus on the use of biomass for heating at the smallscale as a replacement for oil-fired boilers as this sub-sectoroffers the most cost-effective carbon savings at the presenttime and the Carbon Trust could have a material impact.While focusing on heat, the project will build a fact basethat will facilitate the development of the biomass sectoras a whole. A key objective will be to build a betterunderstanding of the risks of development and how best to mitigate these across the entire biomass value chain,particularly the supply side.
Biomass sector review28

1. Peer review participantsTable 2 Peer review participants
Appendices 29
Appendices
Name Title/Organisation
David Clayton Secretary to the Biomass Task Force
Anna Briggs Group Commercial Manager, Bronzeoak
Andrew Wood Director, Bronzeoak
David Williams Managing Director, Eco2 Limited
Dr. Robert Rippengal Commercial Director, Econergy Limited
Peter Webster Director, The Energy Crops Company Limited
Melville Haggard Executive Chairman, Impax Capital
Gaynor Hartnell Director of Policy, Renewable Power Association
Peter Billins Advisor, Renewable Power Association
Steve Lavery Timber Operations Director, Tilhill Forestry Limited
Dr. Patricia Thornley Research Fellow, University of Manchester
2: Modelling assumptions and referencesTable 3 Sources of forecasts for renewable energy Government support
Renewable support type Source of forecast
Renewables Obligation Oxera, ‘Economic analysis of the design, cost and performance of the UKCertificate (ROC) prices Renewables Obligation and capital grants scheme’, Report prepared for the
National Audit Office, January 2005
European Emissions Trading The Carbon Trust Scheme (EU-ETS) support
Biomass emission credits Taken as portion of EU-ETS, according to B&V benchmarking data

Small heat plant will typically heat nursing homes,swimming pools, etc, where a higher heat load could beassumed. However, applications like schools may havelower heat loads. Hence the capacity factor is assumed to be 35%, as a reasonable average. Note that the economicsof a plant are very sensitive to the heat load assumption:
a 10% increase (decrease) in heat load will lead to roughlya 5% increase (decrease) in IRR.
Very small heat plant (Table 6) typically heat stately homes,small office clusters, etc, where an assumed capacity factorof 30% is a reasonable average.
Biomass sector review30
Plant Rationale or source
Size MW th 30 Assumption for large plant
Capacity factor % 80% B&V industry benchmark
Electrical conversion efficiency % -
Heat conversion efficiency % 85% B&V industry benchmark
New-build capital costs
TOTAL, includes equipment, installation (civils, MEICA1), and other (legal, financial, EIA, planning) £/kW th 360 B&V industry benchmark
Operation costs
Total operating and maintenance cost £/MWh th 2.00 Derived from B&V CHP industry benchmark
Revenue
Replacement heat price £/MWh th Forecast based on use of heavy fuel oil, with boiler efficiency of 85%2
EU Emission Trading Scheme £/MWh th The only heat plant that are eligible for large heat plant for part of ETS
Table 4 Large heat plant
Plant Rationale or source
Size MW th 2 Assumption for small plant
Capacity factor % 35% B&V industry benchmark
Electrical conversion efficiency % -
Heat conversion efficiency % 85% B&V industry benchmark
New-build capital costs
TOTAL, includes equipment, installation (civils, MEICA1), and other (legal, financial, EIA, planning) £/kW th 225 B&V industry benchmark
Operation costs
Total operating and maintenance cost £/MWh th 2.50 PAA interviews
Revenue
Replacement heat price £/MWh th Forecast based on use of gas oil, with boiler efficiency of 85%2
Table 5 Small heat plant
1Mechanical, Electrical, Instrumental, Control and Automation. 2Source: B&V.
1Mechanical, Electrical, Instrumental, Control and Automation. 2Source: B&V

Appendices 31
Plant Rationale or source
Size MW th 0.2 Assumption for small plant
Capacity factor % 30% B&V industry benchmark
Electrical conversion efficiency % -
Heat conversion efficiency % 85% B&V industry benchmark
New-build capital costs
TOTAL, includes equipment, installation (civils, MEICA1), and other (legal, financial, EIA, planning) £/kW th 410 B&V industry benchmark
Operation costs
Total operating and maintenance cost £/MWh th 4.50 PAA interviews
Revenue
Replacement heat price £/MWh th Forecast based on use of gas oil, with boiler efficiency of 85%2
Table 6 Very small heat plant
Plant Rationale or source
Size MW e 30 Assumption for large plant
Capacity factor % 85% B&V industry benchmark
Electrical conversion efficiency % 28% B&V industry benchmark
Heat conversion efficiency % -
New-build capital costs
TOTAL, includes equipment, installation (civils, MEICA1), and other (legal, financial, EIA, planning) £/kW 1,630 B&V industry benchmark
Operation costs
Total operating and maintenance cost £/MWh e 10.70 B&V industry benchmark
Revenue
Wholesale electricity price £/MWh CT earlier project data, forecast to 2020
Embedded benefit £/MWh 2.57 CT earlier project data, averaged over three regions
Emission Trading Scheme for large £/MWh Based on €7/t CO2 up to 2008, then linear electric plant increase to €25/t CO2 by 2020. Assumed 50%
pass through to customers2
88% of Renewables Obligation £/MWh e Average of industry data is that 88% of the Certificate value is actually received3
80% of Levy Exemption Certificate £/MWh e 3.36 Average of industry data is that 80% of the value is actually received3
Table 7 Large electric plant
1Mechanical, Electrical, Instrumental, Control and Automation. 2Source: B&V
1Mechanical, Electrical, Instrumental, Control and Automation. 2Source: CT 3Source: B&V

Biomass sector review32
Plant Rationale or source
Size MW e 2 Assumption for small plant
Capacity factor % 60% B&V industry benchmark
Electrical conversion efficiency % 20% B&V industry benchmark
Heat conversion efficiency % -
New-build capital costs
TOTAL, includes equipment, installation (civils, MEICA1), and other (legal, financial, EIA, planning) £/kW 2,431 B&V industry benchmark
Operation costs
Total operating and maintenance cost £/MWh e 17.90 B&V industry benchmark
Revenue
85% of wholesale electricity price £/MWh CT earlier project data, forecast to 2020. 15% reduction compared to large electricity due to low negotiating power
80% of embedded benefit £/MWh 2.06 CT earlier project data, averaged over three regions
85% of Emission Trading Scheme £/MWh Based on €7/t CO2 up to 2008, then linear for large electric plant increase to €25/t CO2 by 2020. Assumed 50%
pass through to customers2
85% of LE ROC value £/MWh e 2.86 15% reduction compared to large electricity due to lower negotiating power
Table 8 Small electric plant
1Mechanical, Electrical, Instrumental, Control and Automation.2Source: CT.

Appendices 33
Plant Rationale or source
Size MW e 30 Assumption for large plant
Capacity factor % 85% B&V industry benchmark
Electricity conversion efficiency % 24% B&V industry benchmark
Heat conversion efficiency % 56% B&V industry benchmark
New-build capital costs
TOTAL, includes equipment, installation (civils, MEICA1), and other (legal, financial, EIA, planning) £/kW 1,780 B&V industry benchmark
Operation costs
Total operating and maintenance cost £/MWh e 10.70 B&V industry benchmark
Revenue
75% electricity import price £/MWh CT earlier project data+ 25% electricity export price
Emission Trading Scheme for large £/MWh Based on €7/t CO2 up to 2008, then linear electric plant increase to €25/t CO2 by 2020
88% of Renewables Obligation £/MWh e Average of industry data is that 88% of the Certificate value is actually received2
Replacement heat price £/MWh th Forecast based on use of gas, with boiler efficiency of 85% and ratio of “large industrial user price to wholesale price”2
Table 9 Large CHP plant
1Mechanical, Electrical, Instrumental, Control and Automation.2Source: B&V.
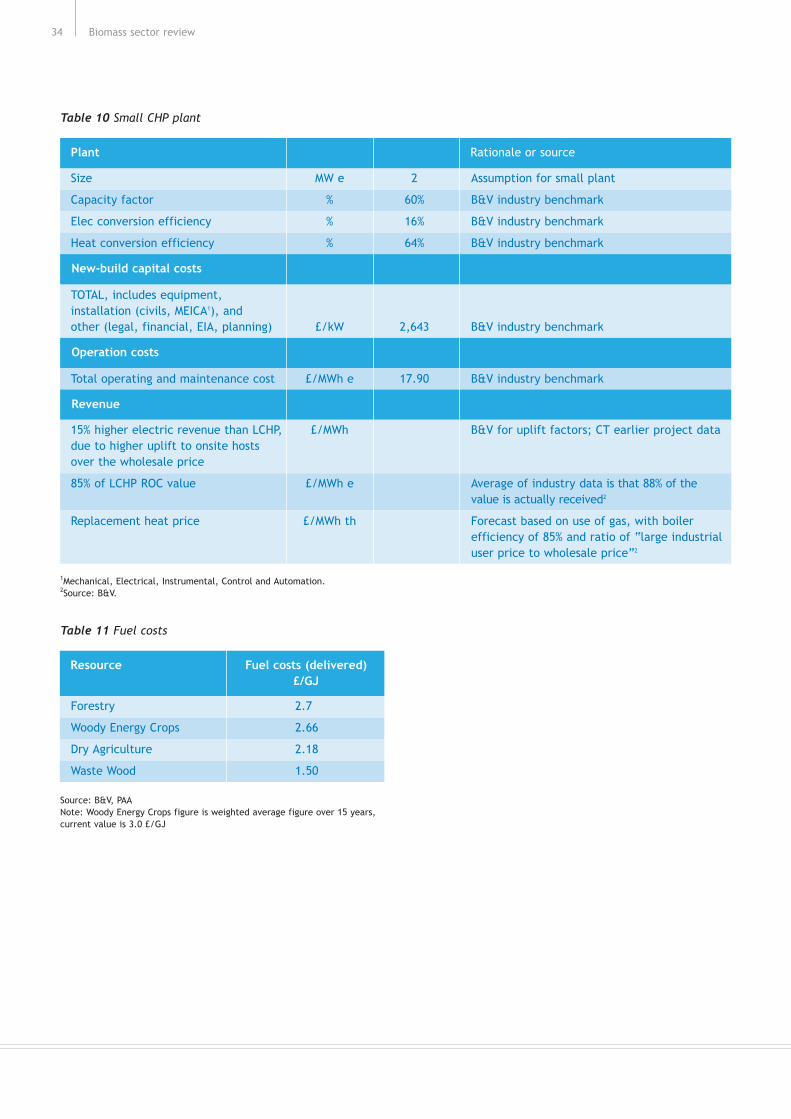
Biomass sector review34
Plant Rationale or source
Size MW e 2 Assumption for small plant
Capacity factor % 60% B&V industry benchmark
Elec conversion efficiency % 16% B&V industry benchmark
Heat conversion efficiency % 64% B&V industry benchmark
New-build capital costs
TOTAL, includes equipment, installation (civils, MEICA1), and other (legal, financial, EIA, planning) £/kW 2,643 B&V industry benchmark
Operation costs
Total operating and maintenance cost £/MWh e 17.90 B&V industry benchmark
Revenue
15% higher electric revenue than LCHP, £/MWh B&V for uplift factors; CT earlier project datadue to higher uplift to onsite hosts over the wholesale price
85% of LCHP ROC value £/MWh e Average of industry data is that 88% of the value is actually received2
Replacement heat price £/MWh th Forecast based on use of gas, with boiler efficiency of 85% and ratio of “large industrial user price to wholesale price”2
Table 10 Small CHP plant
Table 11 Fuel costs
Resource Fuel costs (delivered) £/GJ
Forestry 2.7
Woody Energy Crops 2.66
Dry Agriculture 2.18
Waste Wood 1.50
1Mechanical, Electrical, Instrumental, Control and Automation.2Source: B&V.
Source: B&V, PAANote: Woody Energy Crops figure is weighted average figure over 15 years,current value is 3.0 £/GJ

Biomass sector review 35
Notes

Biomass sector review36
Notes


The Carbon Trust works with business and the public sector to cut carbon emissions and capture the commercialpotential of low carbon technologies.
An independent company set up by the Government to help the UK meet its climate change obligations throughbusiness-focused solutions to carbon emission reduction, the Carbon Trust is grant funded by the Department for Environment, Food and Rural Affairs, the Scottish Executive, the Welsh Assembly Government and InvestNorthern Ireland.
Whilst the Carbon Trust, Paul Arwas Associates and Black & Veatch Ltd. have taken reasonable steps to ensure thatthe information contained in this Report/Publication is correct, they give no warranty and make no representationas to its accuracy and accept no liability for any errors or omissions. Neither the Carbon Trust, Paul ArwasAssociates nor Black & Veatch Ltd. are providing investment advice in this report and you must take your ownview on the merits of, and the risks attached to, any investment decision you may undertake. You may wish toobtain professional advice.
Nothing in this publication is intended to be, or should be interpreted as, an endorsement of or recommendationfor any supplier, service or product.
Any trademarks, service marks or logos used in this publication are the property of the Carbon Trust and copyrightis licensed to the Carbon Trust. Nothing in this publication shall be construed as granting any licence or right touse or reproduce any of the trademarks, service marks, logos, copyright or any proprietary information in any waywithout the Carbon Trust’s prior written permission. The Carbon Trust enforces infringements of its intellectualproperty rights to the full extent permitted by law.
The Carbon Trust is a company limited by guarantee and registered in England and Wales under Company number 4190230 with its Registered Office at: 8th Floor, 3 Clement’s Inn, London WC2A 2AZ.
Printed on paper containing a minimum of 75% de-inked post-consumer waste.
Published in the UK: October 2005.
© The Carbon Trust 2005. All rights reserved. CTC512
www.thecarbontrust.co.uk0800 085 2005