biomechanical response of varicose veins to elastic ... · biomechanical response of varicose veins...
TRANSCRIPT
HAL Id: hal-00801291https://hal.archives-ouvertes.fr/hal-00801291
Submitted on 15 Mar 2013
HAL is a multi-disciplinary open accessarchive for the deposit and dissemination of sci-entific research documents, whether they are pub-lished or not. The documents may come fromteaching and research institutions in France orabroad, or from public or private research centers.
L’archive ouverte pluridisciplinaire HAL, estdestinée au dépôt et à la diffusion de documentsscientifiques de niveau recherche, publiés ou non,émanant des établissements d’enseignement et derecherche français ou étrangers, des laboratoirespublics ou privés.
Biomechanical response of varicose veins to elasticcompression: A numerical study.
Pierre-Yves Rohan, Pierre Badel, Bertrand Lun, Didier Rastel, Stéphane Avril
To cite this version:Pierre-Yves Rohan, Pierre Badel, Bertrand Lun, Didier Rastel, Stéphane Avril. Biomechanical re-sponse of varicose veins to elastic compression: A numerical study.. Journal of Biomechanics, Elsevier,2013, 46 (3), pp.599-603. <10.1016/j.jbiomech.2012.10.043>. <hal-00801291>
1
1
Biomechanical response of varicose veins to 2
elastic compression: a numerical study 3
4
Rohan C.P-Y.1, Badel P.1, Lun B.2, Rastel D.3, Avril S.1 5
1 Ecole Nationale Supérieure des Mines de Saint-Etienne, CIS-EMSE, CNRS:UMR5307, LGF, F-42023 Saint 6
Etienne, France 7
2 Sigvaris Research and Development Center, Saint-Just-Saint-Rambert, France 8
3 Vascular physician, Grenoble, France 9
10
Corresponding author: 11
Christian Pierre-Yves Rohan 12
Center for Health Engineering 13
Ecole Nationale Supérieure des Mines 14
158 cours Fauriel 15
42023 SAINT-ETIENNE CEDEX 2 France 16
Phone: +33477426609 17
Fax: +33477499755 18
Email: [email protected] 19
20
Keywords: Varicose veins; trans-mural pressure; Finite Element Updating; Medical Compression 21
Stockings 22
23
Word count (introduction through conclusion): 1 988 24
25
2
Abstract 26
A patient-specific Finite-Element (FE) model of the human leg is developed to model the stress 27
distribution in and around a vein wall in order to determine the biomechanical response of varicose veins 28
to compression treatment. The aim is to investigate the relationship between the local pressure on (the) 29
soft tissues induced by wearing the compression garment and the development and evolution of varicose 30
veins and various skin-related diseases such as varicose veins and ulcers. Because experimental data on 31
the mechanical properties of healthy superficial veins and varicose veins are scarce in literature, 32
ultrasound images of in vivo varicose veins are acquired and analysed to extract the material constants 33
using Finite Element Model Updating. The decrease in trans-mural pressure, which conditions the 34
effectiveness of compressive treatments, is computed from the simulation results. This constitutes the 35
original added value of the developed model as decreases in trans-mural pressures cannot be assessed 36
experimentally by any other means. Results show that external compression is effective in decreasing the 37
trans-mural pressure, thereby having a positive effect in the control and treatment of vein-related 38
diseases. 39
40
3
Introduction 41
Compression therapy by Medical Compression Stockings (MCS), which is considered as the “gold 42
standard” therapy for venous insufficiency, has been a topic of important research for 30 years. The 43
following effects or actions of MCS have gained a special interest: 44
- hemodynamic effects: (Mayberry et al., 1991), (Ibegbuna et al., 2003), (Guesdon et al., 2007), (Downie et 45
al., 2008) and (Wang et al., 2012), in continuation of pioneer studies on collapsible tubes: (Katz et al., 46
1969), (Moreno et al., 1970) and (Kamm and Shapiro, 1979); 47
- clinical and post-surgery effects: (Nehler et al., 1992), (Nehler et al., 1993)(Kern et al., 2007), 48
(Villavicencio, 2009) and (Hamel-Desnos et al., 2010); 49
- skin and deep tissue compression: (Wildin et al., 1998), (Agu et al., 1999), (Best et al., 2000), , (Yeung et 50
al., 2004), (Liu et al., 2005), (Gaied et al., 2006), (Liu et al., 2006), (Dai et al., 2007), (Lee and Han, 2010), 51
(Martinez et al., 2010), (Avril et al., 2010) and (Dubuis et al., 2012). 52
53
However, some of the mechanisms by which MCS act(s) are still not clearly understood. The present study 54
aims at addressing the effect of MCS on varicose veins by adopting a finite-element modelling approach. 55
56
4
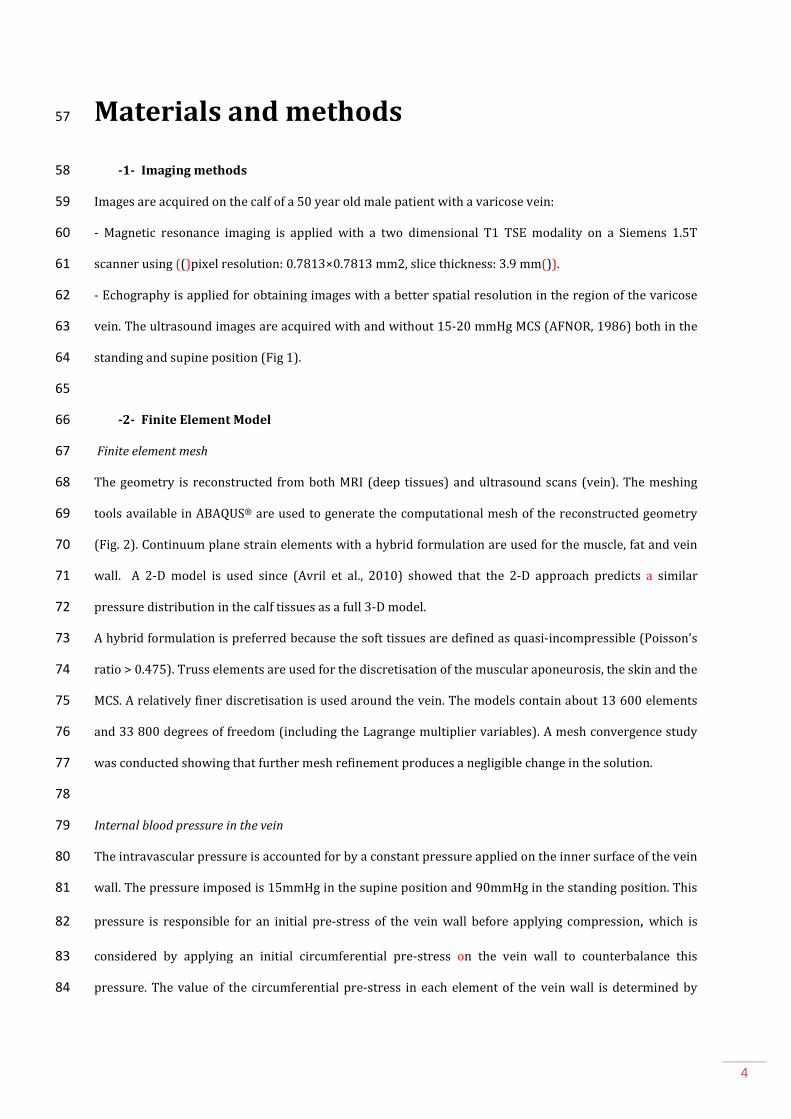
Materials and methods 57
-1- Imaging methods 58
Images are acquired on the calf of a 50 year old male patient with a varicose vein: 59
- Magnetic resonance imaging is applied with a two dimensional T1 TSE modality on a Siemens 1.5T 60
scanner using (()pixel resolution: 0.7813×0.7813 mm2, slice thickness: 3.9 mm()). 61
- Echography is applied for obtaining images with a better spatial resolution in the region of the varicose 62
vein. The ultrasound images are acquired with and without 15-20 mmHg MCS (AFNOR, 1986) both in the 63
standing and supine position (Fig 1). 64
65
-2- Finite Element Model 66
Finite element mesh 67
The geometry is reconstructed from both MRI (deep tissues) and ultrasound scans (vein). The meshing 68
tools available in ABAQUS® are used to generate the computational mesh of the reconstructed geometry 69
(Fig. 2). Continuum plane strain elements with a hybrid formulation are used for the muscle, fat and vein 70
wall. A 2-D model is used since (Avril et al., 2010) showed that the 2-D approach predicts a similar 71
pressure distribution in the calf tissues as a full 3-D model. 72
A hybrid formulation is preferred because the soft tissues are defined as quasi-incompressible (Poisson's 73
ratio > 0.475). Truss elements are used for the discretisation of the muscular aponeurosis, the skin and the 74
MCS. A relatively finer discretisation is used around the vein. The models contain about 13 600 elements 75
and 33 800 degrees of freedom (including the Lagrange multiplier variables). A mesh convergence study 76
was conducted showing that further mesh refinement produces a negligible change in the solution. 77
78
Internal blood pressure in the vein 79
The intravascular pressure is accounted for by a constant pressure applied on the inner surface of the vein 80
wall. The pressure imposed is 15mmHg in the supine position and 90mmHg in the standing position. This 81
pressure is responsible for an initial pre-stress of the vein wall before applying compression, which is 82
considered by applying an initial circumferential pre-stress on the vein wall to counterbalance this 83
pressure. The value of the circumferential pre-stress in each element of the vein wall is determined by 84
5
applying the Laplace law. A 1 kPa pre-stress is also defined on the skin in the circumferential direction 85
(Flynn et al., 2011). 86
87
Boundary conditions 88
The tibia and fibula are fixed in this model. 89
90
Contact pressure on the skin. 91
The interaction between the skin and the sock is enforced using the default ABAQUS® parameters in the 92
normal direction (Tab. 1) and using a penalty method in the tangential direction. A skin-to-textile friction 93
coefficient of 0.3 is used for the tangential direction, as reported in the literature (Gerhardt et al., 2009). 94
95
Constitutive equations 96
A summary is given in Tab 2. A linearized model is preferred for the vein because (i) the developed 97
biomechanical model is used to simulate the deformation of the leg between two states of loading 98
(compressed and uncompressed) which are very close one to the other, and (ii) we do not need to know 99
the stress-free state of our leg as (it) is the case with nonlinear material behaviour models. The Poisson’s 100
ratio is fixed (to) at 0.49 (Wells and Liang, 2011) and two different stiffness values are identified, in supine 101
and standing positions respectively, as the diameter reduction of the vein lumen, due to a 15-20 mmHg 102
class compression sock, is (of) 10% in the supine and (of) 3% in the standing position. 103
104
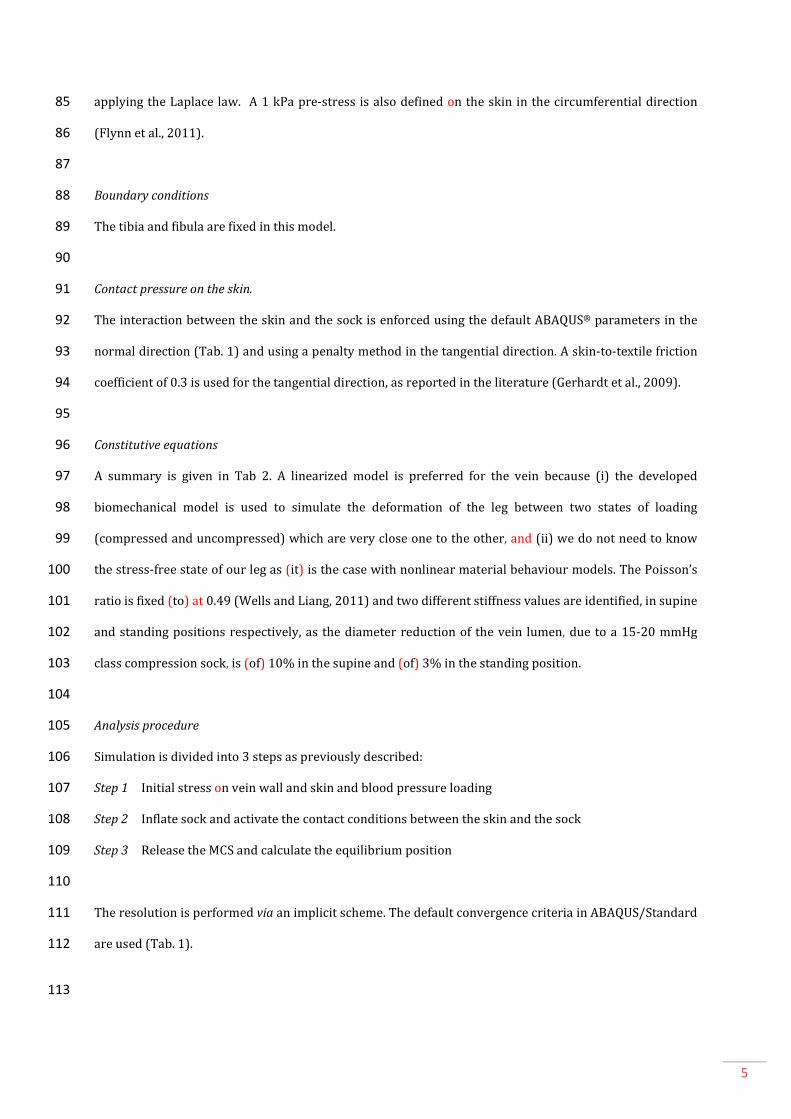
Analysis procedure 105
Simulation is divided into 3 steps as previously described: 106
Step 1 Initial stress on vein wall and skin and blood pressure loading 107
Step 2 Inflate sock and activate the contact conditions between the skin and the sock 108
Step 3 Release the MCS and calculate the equilibrium position 109
110
The resolution is performed via an implicit scheme. The default convergence criteria in ABAQUS/Standard 111
are used (Tab. 1). 112
113
6
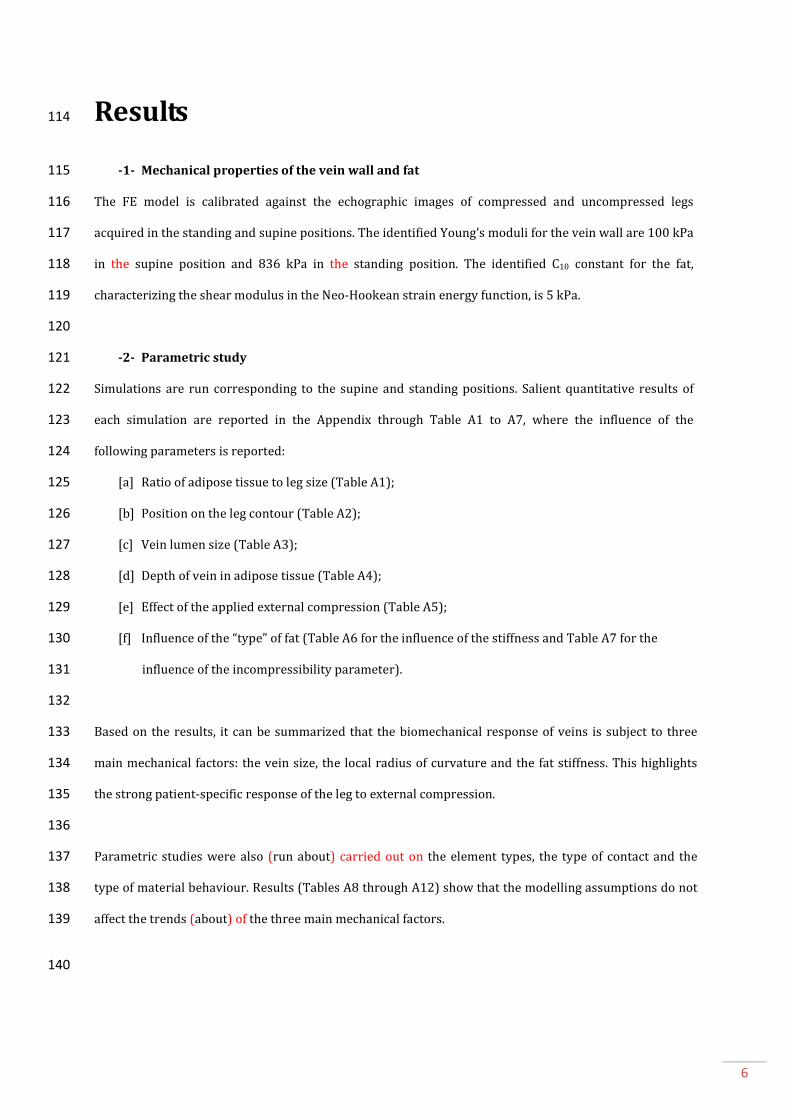
Results 114
-1- Mechanical properties of the vein wall and fat 115
The FE model is calibrated against the echographic images of compressed and uncompressed legs 116
acquired in the standing and supine positions. The identified Young’s moduli for the vein wall are 100 kPa 117
in the supine position and 836 kPa in the standing position. The identified C10 constant for the fat, 118
characterizing the shear modulus in the Neo-Hookean strain energy function, is 5 kPa. 119
120
-2- Parametric study 121
Simulations are run corresponding to the supine and standing positions. Salient quantitative results of 122
each simulation are reported in the Appendix through Table A1 to A7, where the influence of the 123
following parameters is reported: 124
[a] Ratio of adipose tissue to leg size (Table A1); 125
[b] Position on the leg contour (Table A2); 126
[c] Vein lumen size (Table A3); 127
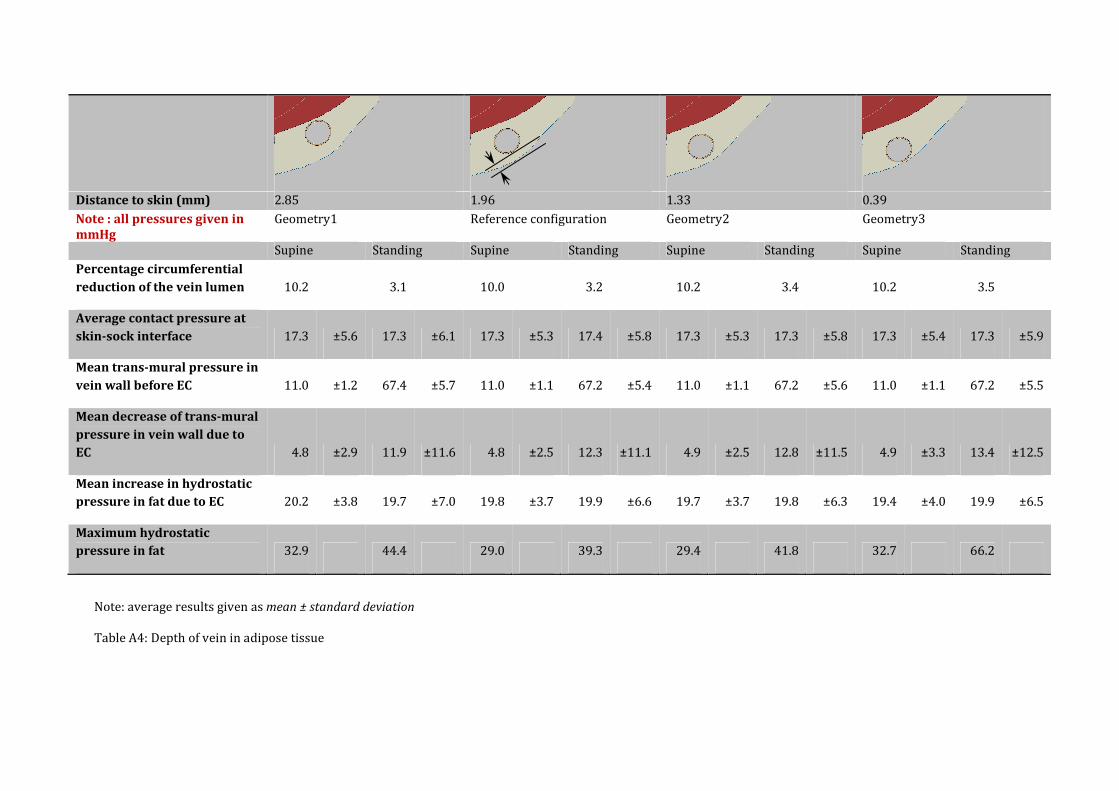
[d] Depth of vein in adipose tissue (Table A4); 128
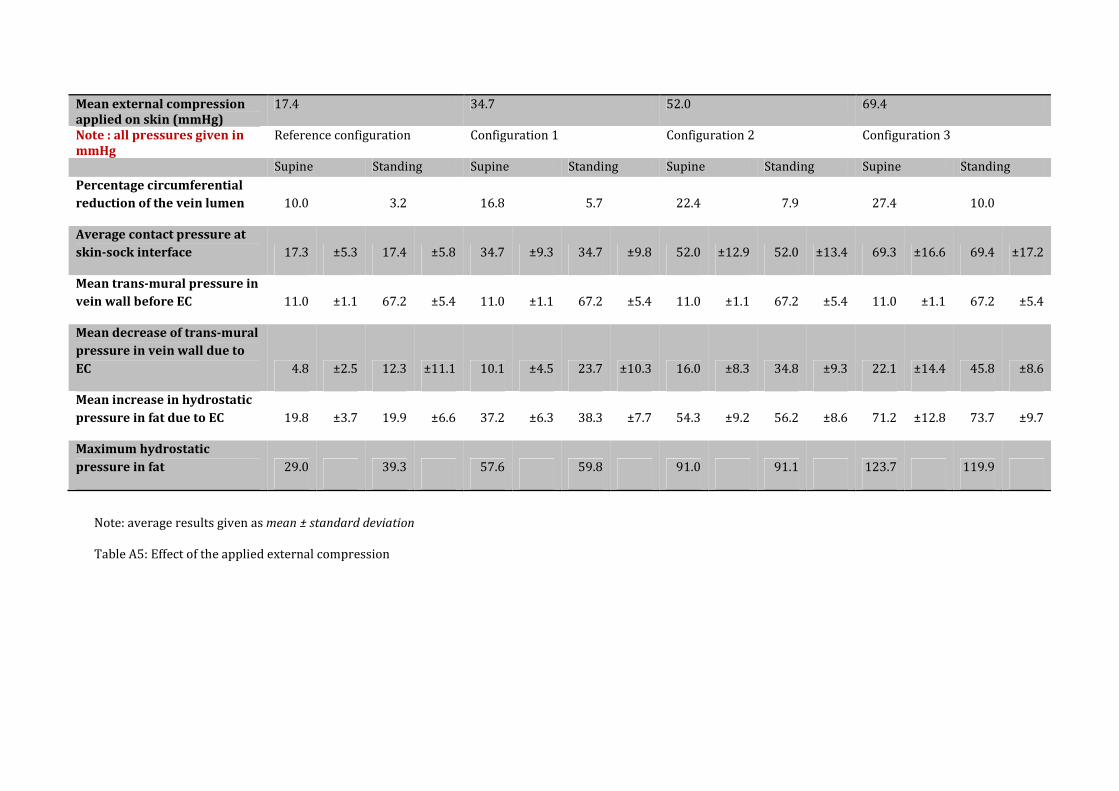
[e] Effect of the applied external compression (Table A5); 129
[f] Influence of the “type” of fat (Table A6 for the influence of the stiffness and Table A7 for the 130
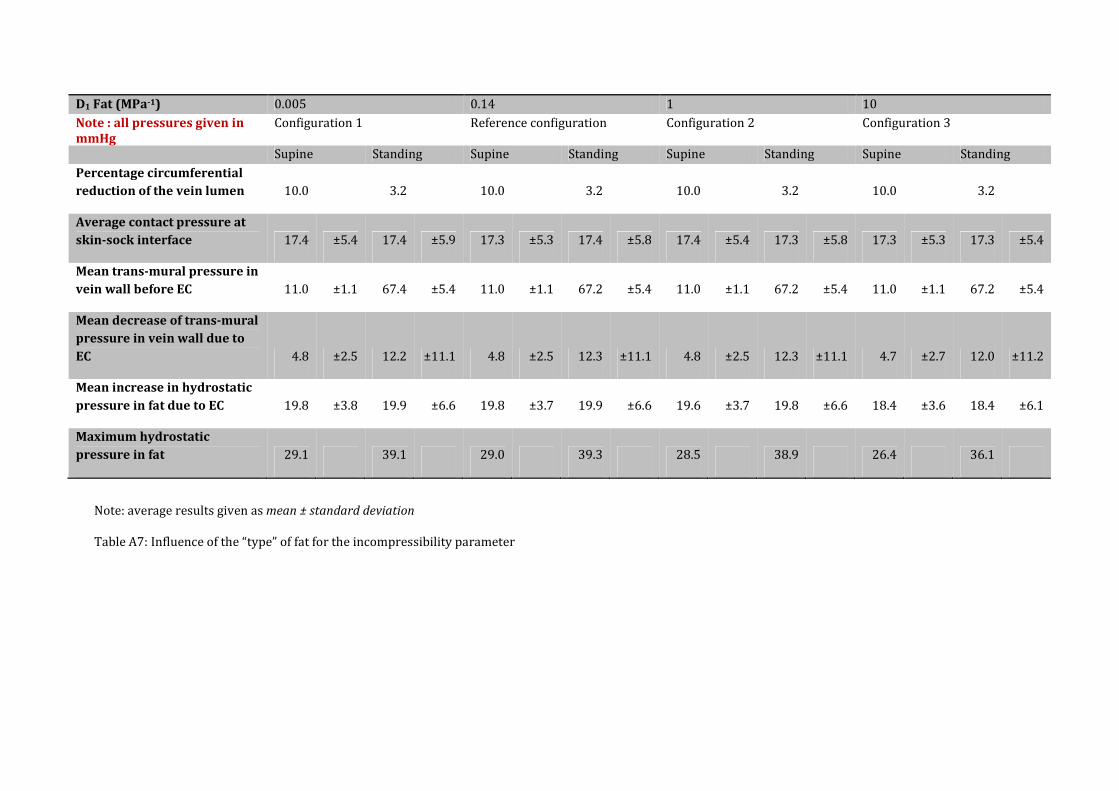
influence of the incompressibility parameter). 131
132
Based on the results, it can be summarized that the biomechanical response of veins is subject to three 133
main mechanical factors: the vein size, the local radius of curvature and the fat stiffness. This highlights 134
the strong patient-specific response of the leg to external compression. 135
136
Parametric studies were also (run about) carried out on the element types, the type of contact and the 137
type of material behaviour. Results (Tables A8 through A12) show that the modelling assumptions do not 138
affect the trends (about) of the three main mechanical factors. 139
140
7
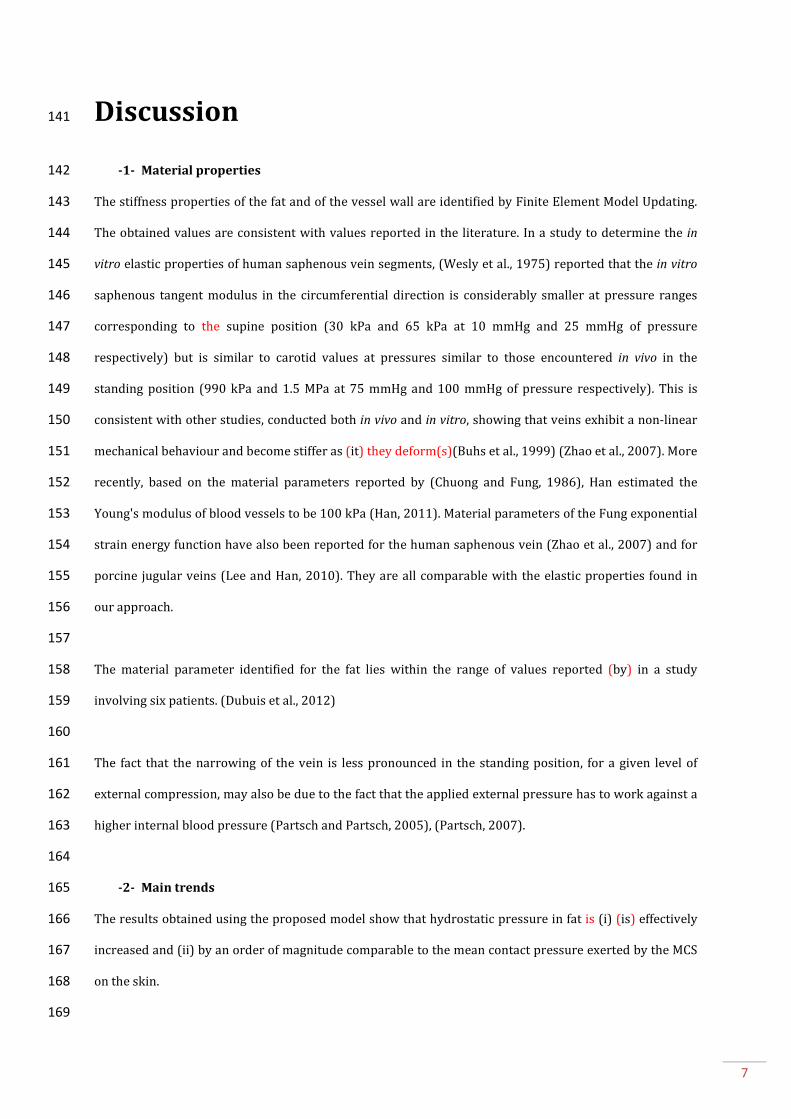
Discussion 141
-1- Material properties 142
The stiffness properties of the fat and of the vessel wall are identified by Finite Element Model Updating. 143
The obtained values are consistent with values reported in the literature. In a study to determine the in 144
vitro elastic properties of human saphenous vein segments, (Wesly et al., 1975) reported that the in vitro 145
saphenous tangent modulus in the circumferential direction is considerably smaller at pressure ranges 146
corresponding to the supine position (30 kPa and 65 kPa at 10 mmHg and 25 mmHg of pressure 147
respectively) but is similar to carotid values at pressures similar to those encountered in vivo in the 148
standing position (990 kPa and 1.5 MPa at 75 mmHg and 100 mmHg of pressure respectively). This is 149
consistent with other studies, conducted both in vivo and in vitro, showing that veins exhibit a non-linear 150
mechanical behaviour and become stiffer as (it) they deform(s)(Buhs et al., 1999) (Zhao et al., 2007). More 151
recently, based on the material parameters reported by (Chuong and Fung, 1986), Han estimated the 152
Young's modulus of blood vessels to be 100 kPa (Han, 2011). Material parameters of the Fung exponential 153
strain energy function have also been reported for the human saphenous vein (Zhao et al., 2007) and for 154
porcine jugular veins (Lee and Han, 2010). They are all comparable with the elastic properties found in 155
our approach. 156
157
The material parameter identified for the fat lies within the range of values reported (by) in a study 158
involving six patients. (Dubuis et al., 2012) 159
160
The fact that the narrowing of the vein is less pronounced in the standing position, for a given level of 161
external compression, may also be due to the fact that the applied external pressure has to work against a 162
higher internal blood pressure (Partsch and Partsch, 2005), (Partsch, 2007). 163
164
-2- Main trends 165
The results obtained using the proposed model show that hydrostatic pressure in fat is (i) (is) effectively 166
increased and (ii) by an order of magnitude comparable to the mean contact pressure exerted by the MCS 167
on the skin. 168
169
8
The computed hydrostatic pressure in the fat is essential to understanding how the pressure is transmited 170
through the superficial soft tissues. Moreover the increase in tissue pressure is regarded as a crucial 171
mechanism (to the) in compressive treatments (Bergan, 2007). Clearly, appreciating how geometric and 172
material parameters affect the transmission of pressure is an important step to understanding both the 173
modes of action of EC treatment and the rationales behind its efficacy. 174
175
Other research teams have reported satisfactory results for the measurement of vein deformation under 176
compression (Partsch et al., 2010) but have not used these results for quantifying the trans-mural 177
pressures. The results of our model indicate that 15-20 mmHg MCS are effective in decreasing the trans-178
mural pressure on vein walls. The values predicted are twice as high in the standing position than in the 179
supine position. This trend corroborates that reported in vitro by (Gardon-Mollard and Ramel, 2008). 180

9
181
-3- Clinical relevance 182
From a clinical perspective, an increase of the trans-mural pressure on varicose vein walls exacerbates the 183
disease and the underlying Chronic Venous Insufficiency (CVI). The goal of compression therapy is to 184
restore a trans-mural pressure which is as normal as possible, by increasing the perivenous tissue 185
pressure (Gardon-Mollard and Ramel, 2008). The results reported here confirm the idea that MCS work 186
towards reducing the trans-mural pressure. In addition, trans-mural pressure is known to be related to 187
the tension of the vein wall according to the Laplace law (Gusic et al., 2005). Reduction of the tension 188
implies a smaller number of alterations in the vein wall associated with various pathologies. Another 189
consequence is a greater stability with respect to axial buckling and tortuosity development (Han, 190
2007)(Han, 2009)(Han, 2012). 191
192
The action of MCS may also affect the remodelling of the vein. (Travers et al., 1996) (have) observed that 193
varicose saphenous veins contained significantly higher amounts of collagen in all layers of the vein wall 194
and that these collagen fibres were seen to invade and break up regular muscle layers of the media in 195
varicosis. Reduction of the tension in the vein wall under the action of MCS is prone to hinder these 196
effects. 197
198
Another important clinical (important) aspect concerns the evolution of CVI more generally: because CVI 199
is both progressive and irreversible, clinical symptoms associated with venous insufficiency increase in 200
severity with time (Suzuki et al., 2009). Important efforts are still necessary to predict numerically the 201
long-term action of MCS in preventing the progression of venous stasis and the apparition of associated 202
symptoms such as oedema, pigmentation, and ulcers on the skin. 203
204
10
Conclusion 205
In this study, a FE model of a human leg with a varicose vein has been developed to compute the stress 206
distribution in and around the vein wall and analyse the biomechanical response of varicose veins to 207
external compression in terms of trans-mural pressures. Experimental data on the mechanical properties 208
of healthy superficial veins and varicose veins being scarce in literature, ultrasound images of in vivo 209
varicose veins have been acquired and analysed to extract the material constants of the vein wall and that 210
of the fat, using Finite Element Model Updating. 211
212
The model (brings)provides a new insight on MCS mechanical action and its possible benefits. The results 213
confirm the idea that MCS work towards reducing (the) trans-mural pressure and are effective in 214
narrowing leg veins, which is important for the clinical consequences. 215
216
Future developments include a validation of the proposed approach and of its medical outcomes using 217
clinical studies. 218
219
Acknowledgement 220
None 221
Conflict of interest 222
None 223
224

11
References 225
AFNOR, 1986. NF G30-102. Article de bonneterie - Détermination de la pression de contention. 226
Agu, O., Hamilton, G., Baker, D., 1999. Graduated compression stockings in the prevention of venous 227
thromboembolism. British Journal of Surgery 86, 992–1004. 228
Avril, S., Bouten, L., Dubuis, L., Drapier, S., Pouget, J.-F., 2010. Mixed Experimental and Numerical Approach 229
for Characterizing the Biomechanical Response of the Human Leg Under Elastic Compression. Journal of 230
Biomechanical Engineering 132, 31006–31014. 231
Bergan, J.J., 2007. The Vein Book. Academic Press. 232
Best, A.J., Williams, S., Crozier, A., Bhatt, R., Gregg, P.J., Hui, A.C.W., 2000. Graded compression stockings in 233
elective orthopaedic surgery. J Bone Joint Surg Br 82-B, 116–118. 234
Buhs, C.L., Bendick, P.J., Glover, J.L., 1999. The effect of graded compression elastic stockings on the lower 235
leg venous system during daily activity. Journal of Vascular Surgery 30, 830–835. 236
Chuong, C.J., Fung, Y.C., 1986. On Residual Stresses in Arteries. Journal of Biomechanical Engineering 108, 237
189–192. 238
Dai, X., Liu, R., Li, Y., Zhang, M., Kwok, Y., 2007. Computational Textile, in: Studies in Computational 239
Intelligence. Springer Berlin / Heidelberg, pp. 301–309. 240
Downie, S.P., Raynor, S.M., Firmin, D.N., Wood, N.B., Thom, S.A., Hughes, A.D., Parker, K.H., Wolfe, J.H.N., Xu, 241
X.Y., 2008. Effects of Elastic Compression Stockings on Wall Shear Stress in Deep and Superficial Veins of 242
the Calf. Am J Physiol Heart Circ Physiol 294, H2112–H2120. 243
Dubuis, L., Avril, S., Debayle, J., Badel, P., 2012. Identification of the material parameters of soft tissues in 244
the compressed leg. Computer Methods in Biomechanics and Biomedical Engineering 15, 3–11. 245
Flynn, C., Taberner, A., Nielsen, P., 2011. Mechanical characterisation of in vivo human skin using a 3D 246
force-sensitive micro-robot and finite element analysis. Biomechanics and Modeling in Mechanobiology 247
10, 27–38. 248
Gaied, I., Drapier, S., Lun, B., 2006. Experimental assessment and analytical 2D predictions of the stocking 249
pressures induced on a model leg by Medical Compressive Stockings. Journal of Biomechanics 39, 3017–250
3025. 251
Gardon-Mollard, Ramel, 2008. La compression médicale. Elsevier Masson. 252
Gerhardt, L. -c, Lenz, A., Spencer, N.D., Münzer, T., Derler, S., 2009. Skin–textile friction and skin elasticity 253
in young and aged persons. Skin Research and Technology 15, 288–298. 254
Guesdon, P., Fullana, J.-M., Flaud, P., 2007. Experimental study of muscular draining. Comptes Rendus 255
Mécanique 335, 207–212. 256
Gusic, R.J., Petko, M., Myung, R., William Gaynor, J., Gooch, K.J., 2005. Mechanical properties of native and 257
ex vivo remodeled porcine saphenous veins. Journal of Biomechanics 38, 1770–1779. 258
Hamel-Desnos, C.M., Guias, B.J., Desnos, P.R., Mesgard, A., 2010. Foam Sclerotherapy of the Saphenous 259
Veins: Randomised Controlled Trial with or without Compression. European Journal of Vascular and 260
Endovascular Surgery 39, 500–507. 261
12
Han, H.-C., 2007. A biomechanical model of artery buckling. Journal of Biomechanics 40, 3672–3678. 262
Han, H.-C., 2009. Blood vessel buckling within soft surrounding tissue generates tortuosity. Journal of 263
Biomechanics 42, 2797–2801. 264
Han, H.-C., 2011. Determination of the Critical Buckling Pressure of Blood Vessels Using the Energy 265
Approach. Ann Biomed Eng 39, 1032–1040. 266
Ibegbuna, V., Delis, K.T., Nicolaides, A.N., Aina, O., 2003. Effect of elastic compression stockings on venous 267
hemodynamics during walking. Journal of Vascular Surgery 37, 420–425. 268
Kamm, R.D., Shapiro, A.H., 1979. Unsteady Flow in a Collapsible Tube Subjected to External Pressure or 269
Body Forces. Journal of Fluid Mechanics 95, 1–78. 270
Katz, A.I., Chen, Y., Moreno, A.H., 1969. Flow through a Collapsible Tube: Experimental Analysis and 271
Mathematical Model. Biophysical Journal 9, 1261–1279. 272
Kern, P., Ramelet, A.-A., Wütschert, R., Hayoz, D., 2007. Compression after sclerotherapy for telangiectasias 273
and reticular leg veins: A randomized controlled study. Journal of Vascular Surgery 45, 1212–1216. 274
Lee, A., Han, H.-C., 2010. A Nonlinear Thin-Wall Model for Vein Buckling. Cardiovascular Engineering and 275
Technology 1, 282–289. 276
Liu, R., Kwok, Y.-L., Li, Y., Lao, T.-T., Zhang, X., Dai, X., 2006. A three-dimensional biomechanical model for 277
numerical simulation of dynamic pressure functional performances of graduated compression stocking 278
(GCS). Fibers and Polymers 7, 389–397. 279
Liu, R., Kwok, Y.L., Li, Y., Lao, T.T.H., Zhang, X., Dai, X.Q., 2005. Objective Evaluation of Skin Pressure 280
Distribution of Graduated Elastic Compression Stockings. Dermatologic Surgery 31, 615–624. 281
Martinez, R., Fierro, C., Shireman, P., Han, H.-C., 2010. Mechanical Buckling of Veins Under Internal 282
Pressure. Annals of Biomedical Engineering 38, 1345–1353. 283
Mayberry, J.C., Moneta, G.L., De Frang, R.D., Porter, J.M., 1991. The influence of elastic compression 284
stockings on deep venous hemodynamics. Journal of Vascular Surgery 13, 91–100. 285
Moreno, A.H., Katz, A.I., Gold, L.D., Reddy, R.V., 1970. Mechanics of Distension of Dog Veins and Other Very 286
Thin-Walled Tubular Structures. Circulation Research 27, 1069–1080. 287
Nehler, M.R., Moneta, G.L., Chitwood, R.W., Porter, J.M., 1992. The Lower Extremity Venous System Part III: 288
Nonoperative Treatment of Chronic Venous Insufficiency. PERSPECT VASC SURG ENDOVASC THER 5, 289
100–114. 290
Nehler, M.R., Moneta, G.L., Woodard, D.M., Defrang, R.D., Harker, C.T., Taylor Jr., L.M., Porter, J.M., 1993. 291
Perimalleolar subcutaneous tissue pressure effects of elastic compression stockings. Journal of Vascular 292
Surgery 18, 783–788. 293
Partsch, B., Partsch, H., 2005. Calf compression pressure required to achieve venous closure from supine 294
to standing positions. Journal of Vascular Surgery 42, 734–738. 295
Partsch, H., 2007. Chapter 10 - Mechanism and effects of compression therapy, in: The Vein Book. 296
Academic Press, Burlington, pp. 103–109. 297
Partsch, H., Mosti, G., Mosti, F., 2010. Narrowing of leg veins under compression demonstrated by 298
magnetic resonance imaging (MRI). Int Angiol 29, 408–410. 299
13
Suzuki, M., Unno, N., Yamamoto, N., Nishiyama, M., Sagara, D., Tanaka, H., Mano, Y., Konno, H., 2009. 300
Impaired lymphatic function recovered after great saphenous vein stripping in patients with varicose 301
vein: Venodynamic and lymphodynamic results. Journal of Vascular Surgery 50, 1085–1091. 302
Travers, J.P., Brookes, C.E., Evans, J., Baker, D.M., Kent, C., Makin, G.S., Mayhew, T.M., 1996. Assessment of 303
wall structure and composition of varicose veins with reference to collagen, elastin and smooth muscle 304
content. European Journal of Vascular and Endovascular Surgery 11, 230–237. 305
Villavicencio, J., 2009. Sclerotherapy in the management of varicose veins of the extremities., in: Handbook 306
of Venous Disorders: Guidelines of the American Venous Forum. Gloviczki, P. and Yao J., London, pp. 366–307
379. 308
Wang, Y., Pierce, I., Gatehouse, P., Wood, N., Firmin, D., Xu, X.Y., 2012. Analysis of flow and wall shear stress 309
in the peroneal veins under external compression based on real-time MR images. Medical Engineering & 310
Physics 34, 17–27. 311
Wells, P.N.T., Liang, H.-D., 2011. Medical Ultrasound: Imaging of Soft Tissue Strain and Elasticity. J. R. Soc. 312
Interface 8, 1521–1549. 313
Wesly, R.L., Vaishnav, R.N., Fuchs, J.C., Patel, D.J., Greenfield, J.C., 1975. Static Linear and Nonlinear Elastic 314
Properties of Normal and Arterialized Venous Tissue in Dog and Man. Circulation Research 37, 509–520. 315
Wildin, C.J., Hui, A.C.W., Esler, C.N.A., Gregg, P.J., 1998. In vivo pressure profiles of thigh-length graduated 316
compression stockings. British Journal of Surgery 85, 1228–1231. 317
Yeung, K.W., Li, Y., Zhang, X., 2004. A 3D Biomechanical Human Model for Numerical Simulation of 318
Garment–Body Dynamic Mechanical Interactions During Wear. Journal of the Textile Institute 95, 59–79. 319
Zhao, J., Jesper Andreasen, J., Yang, J., Steen Rasmussen, B., Liao, D., Gregersen, H., 2007. Manual pressure 320
distension of the human saphenous vein changes its biomechanical properties—implication for coronary 321
artery bypass grafting. Journal of Biomechanics 40, 2268–2276. 322
323
14
324
List of figures 325
Figure 1 Acquisition of Echographic images both in the standing and supine position (1a and
1b). A special precaution was taken as illustrated in figure 1c.
Figure 2
Finite element mesh of the 2D patient specific mesh. It consists of continuum plane
strain elements for the muscle, fat and vein wall and truss elements for the muscular
aponeurosis, skin and MCS. A relatively finer discretisation is used in the vicinity of
the vein wall. The thickness-to-radius ratio of the vein is taken as 0.1, as reported in
the literature.
326
List of tables 327
Table 1 Material properties of the different constitutive parts of the model
Table 2 Default ABAQUS parameters used for the simulation (Hibbitt, 2009)
328
329

15
APPENDIX 330
331
Table A1
Influence of the ratio of adipose tissue to leg size. The thickness of the adipose tissue
has been modified during the segmentation step to account for different
morphologies of subcutaneous adipose tissue (Reference configuration and
geometries 1, 2 and 3 hereunder). The results show that the amount of adipose
tissue has a negligible influence both on the decrease in the vein cross-section and on
the decrease in trans-mural pressure.
Table A2
Influence of the position of the vein on the leg contour. The vein is placed at different
positions on the leg contour (Reference configuration and geometries 1, 2 and 3
hereunder). The maximum values of decrease in trans-mural pressure, percentage
circumferential stretch ratio and increase in hydrostatic pressure in fat, are obtained
when the radius of curvature is the smallest. These results confirm that the
performance of the MCS is correlated to the local radius of curvature of the leg.
Table A3
Influence of the cross-sectional area of the vein. Different veins are generated from
the segmented geometry of the vein in vivo by doing a dilation of the semi-minor and
semi-major axes respectively. The centre of dilation is taken as the centre of the vein
and the scaling factor as 0.7, 0.5 and 0.2 respectively (Reference configuration and
geometries 1, 2 and 3 hereunder). The results show that MCS have a slightly more
important effect as the cross section decreases, but overall the numerical values are
very close. A more pronounced effect is obtained in the supine position.
Table A4
Influence of the depth of the vein in the adipose tissue. New geometries are obtained
by translating the vein in the direction of the skin or, on the contrary, closer to the
muscular aponeurosis (Reference configuration and geometries 1, 2 and 3
hereunder). Almost no effect is obtained in the supine position. In the standing
position, however, the benefit on the decrease in trans-mural pressure due to
external compression, slightly but steadily increases (as) when the vein is closer to
the skin.
Table A5
Influence of the external compression applied. The stiffness of the sock used in the
reference model is multiplied by a constant of proportionality (i.e. 1, 2 and 3). The
mean contact pressure delivered for each case is reported below. Results show a fine
linear relationship between the mean contact pressure and the response of the leg.
We observe moreover that the response is different in the standing and supine
position, except for the mean increase in hydrostatic pressure in fat.
Table A6
Influence of the stiffness of the fat. Different “types” of fat are modelled by changing
C10. The values are taken in the range 3-8 kPa C10. Results are reported hereunder.
The main result is the significant influence of this parameter on the percentage
compression of the vein in the supine position and the quasi-insignificant influence
in the standing position.
Table A7
Influence of the compressibility of the fat. Different “types” of fat are modelled by
changing D1. The values are taken in the range 0.005-10 MPa-1. Results are reported
hereunder. Almost no effect is obtained either in the supine or standing positions.
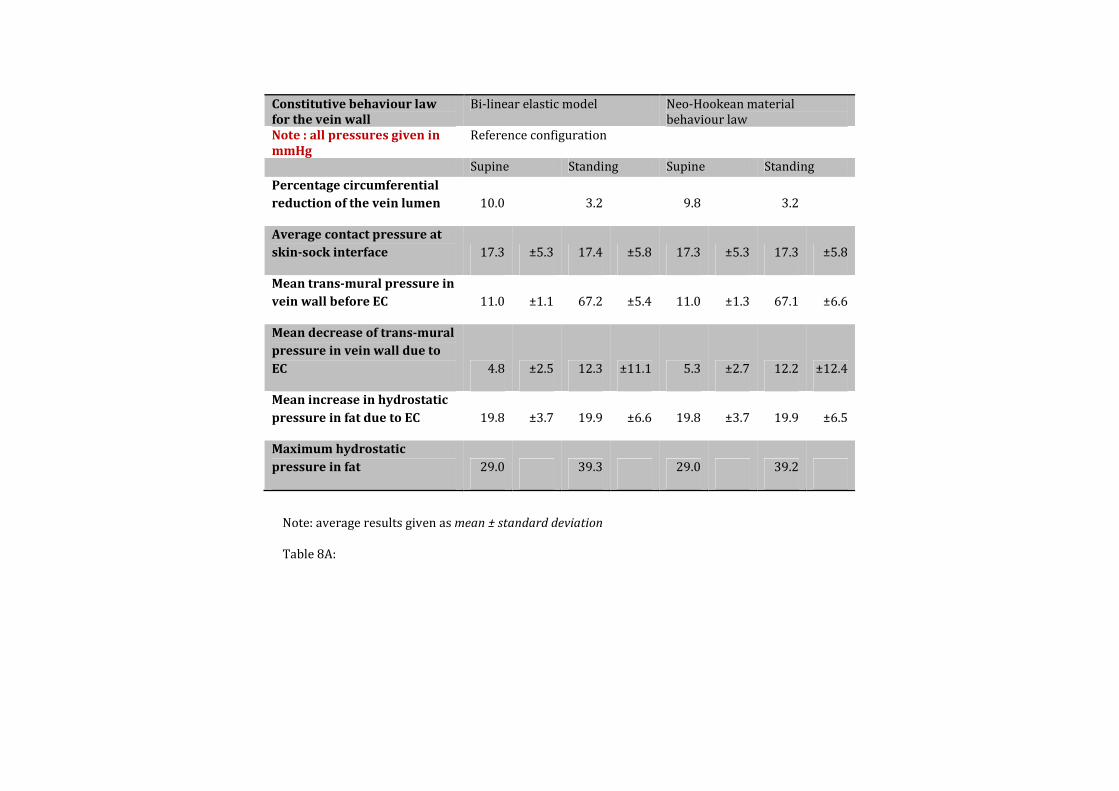
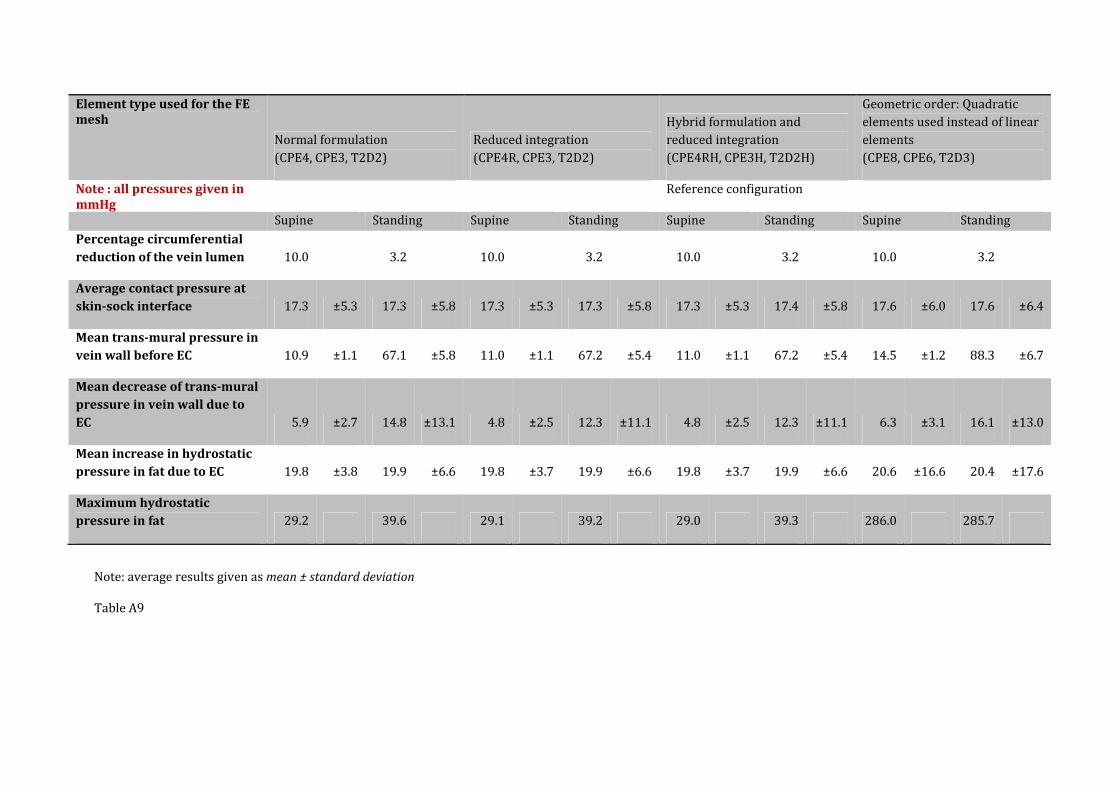
Table A8
Influence of the constitutive behaviour law used to model the vein wall. Two types of
behaviour laws were compared (i) bi-linear elastic and (ii) Neo-Hookean
hyperelastic material model. Only weak differences are observed in the results.
Table A9
Influence of the element type used for the Finite Element mesh. Three aspects were
considered (i) hybrid formulation of the elements (ii) reduced integration of these
and (iii) geometric order (linear/quadratic). Results show that the choice of element
formulation does not affect key conclusions of the study derived from the modelling
16
results.
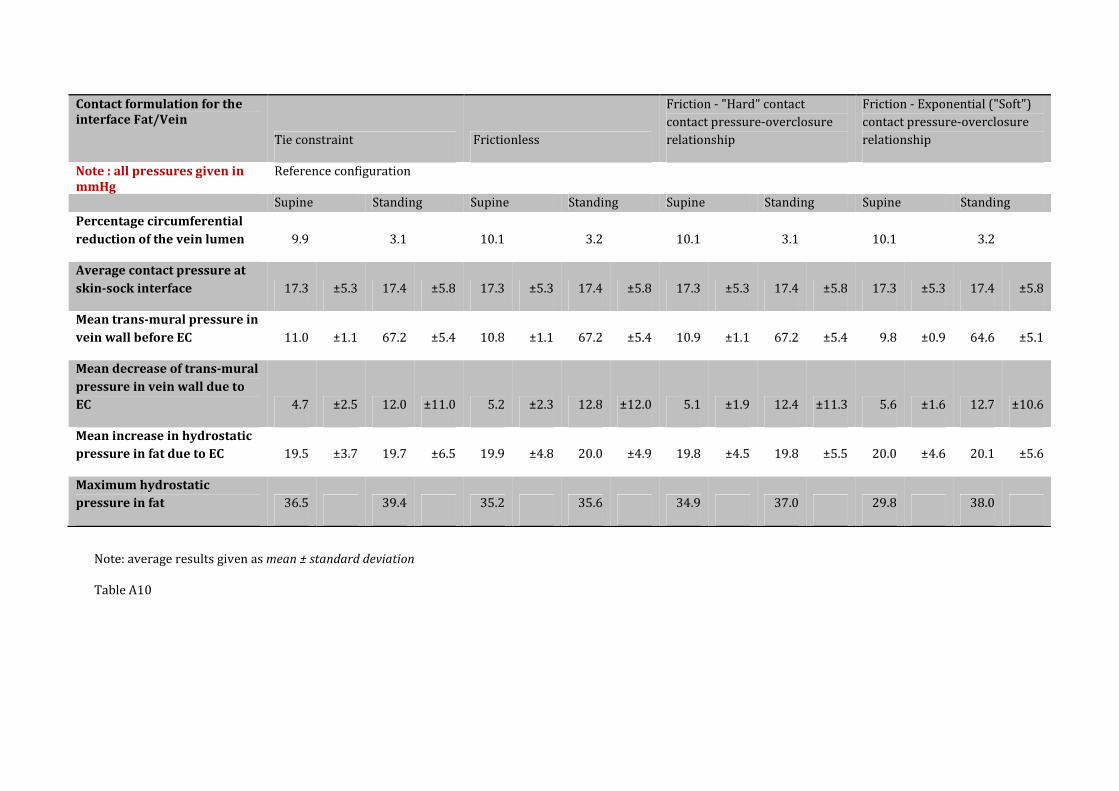
Table A10
Influence of the contact formulation for the Fat/Vein interface (Fat/Vein). Two
aspects of the contact specifications were considered: (i) normal and (ii) tangential
behaviour of the contact interaction properties. Both “hard” and “soft” constraint
methods were investigated for enforcing the contact pressure-overclosure
relationship (normal direction). Furthermore, a tie constraint (each node on the
slave surface is constrained to have the same motion as the point on the master
surface to which it is closest) was also investigated in place of the contact interaction.
Results show minor changes.
Table A11 Influence of the contact formulation for the Fat/Muscle interface (Fat/Muscle). The
same contact conditions were investigated. Very little change was observed.
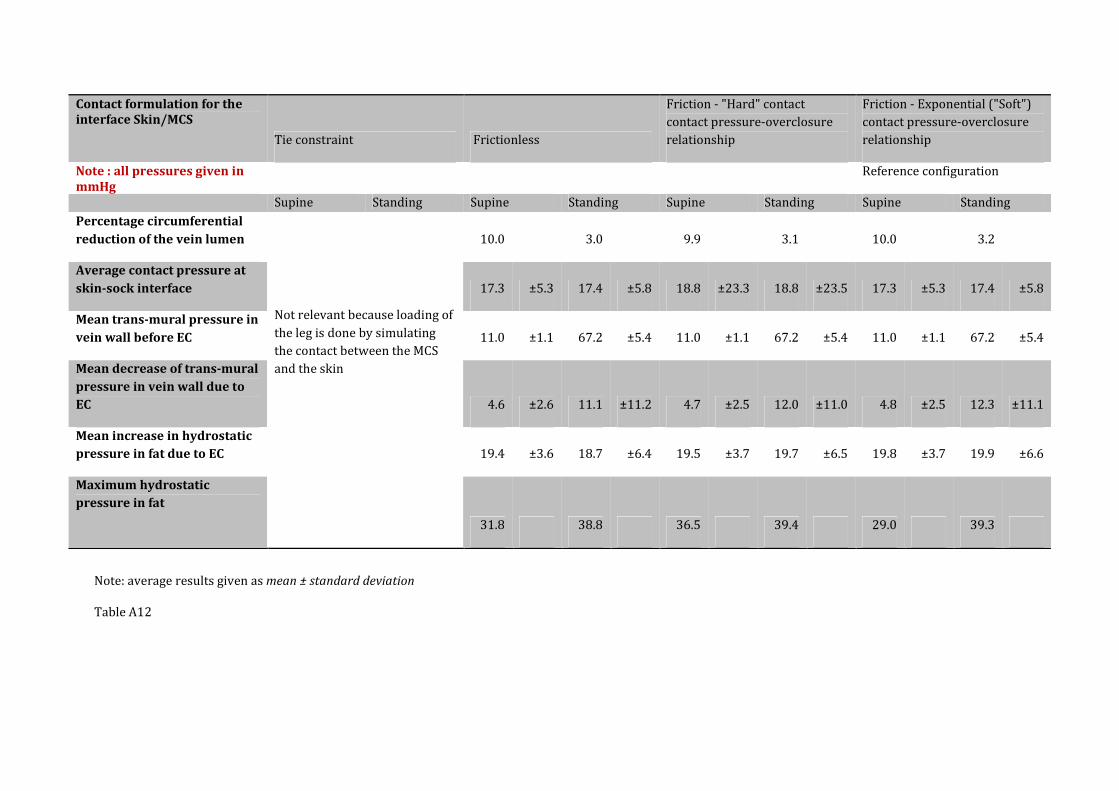
Table A12
Influence of the contact formulation for the Skin/MCS interface (Skin/MCS). Results
show that the “softened” contact algorithms available in ABAQUS/Standard (and
subsequently retained as a constraint method for enforcing the contact pressure-
overclosure relationship) performed better than the “hard” contact algorithms. The
main advantage of the “softened” contact algorithms is that clearance is calculated
from surface to surface instead of from node to surface. As a consequence, the
contact load is evenly distributed along the interacting surfaces.
332
333
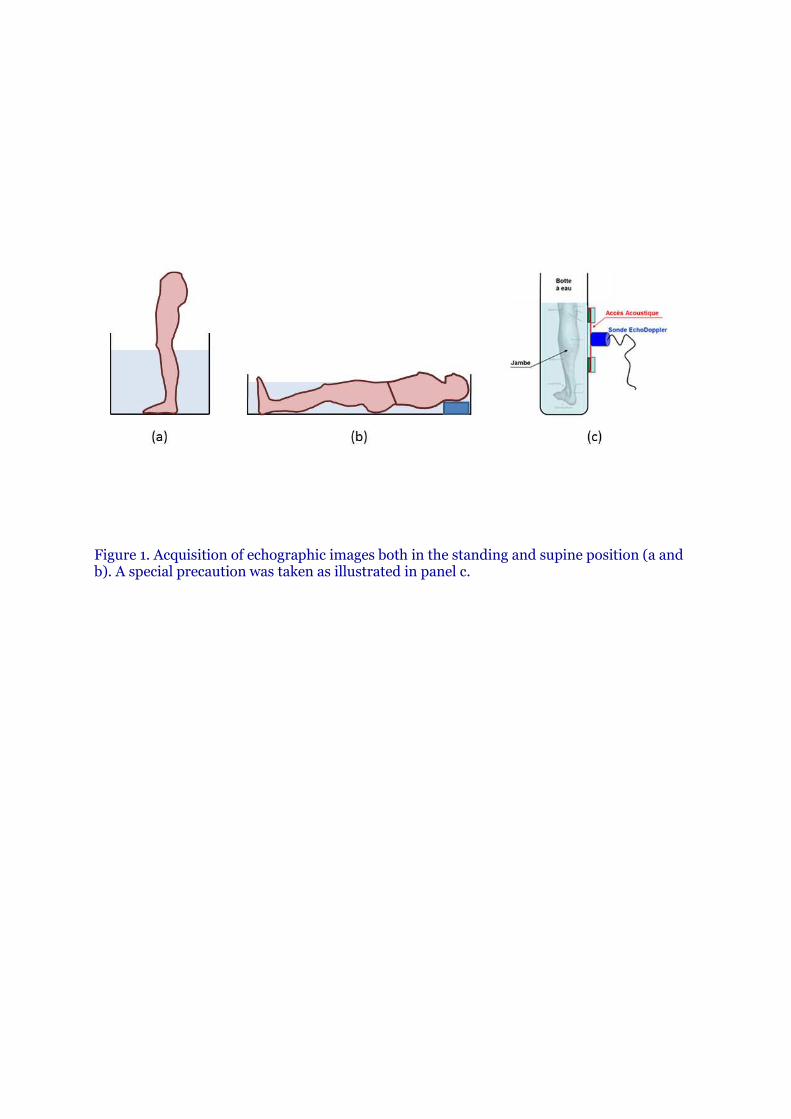
Figure 1. Acquisition of echographic images both in the standing and supine position (a and b). A special precaution was taken as illustrated in panel c.
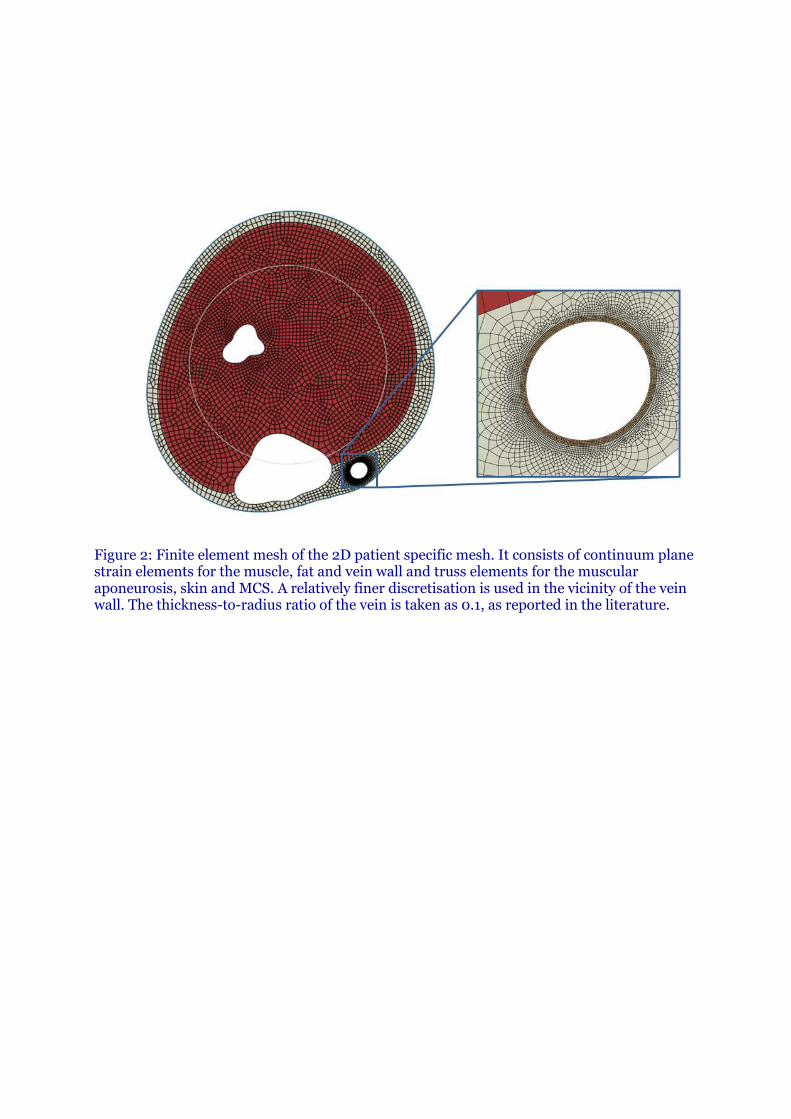
Figure 2: Finite element mesh of the 2D patient specific mesh. It consists of continuum plane strain elements for the muscle, fat and vein wall and truss elements for the muscular aponeurosis, skin and MCS. A relatively finer discretisation is used in the vicinity of the vein wall. The thickness-to-radius ratio of the vein is taken as 0.1, as reported in the literature.
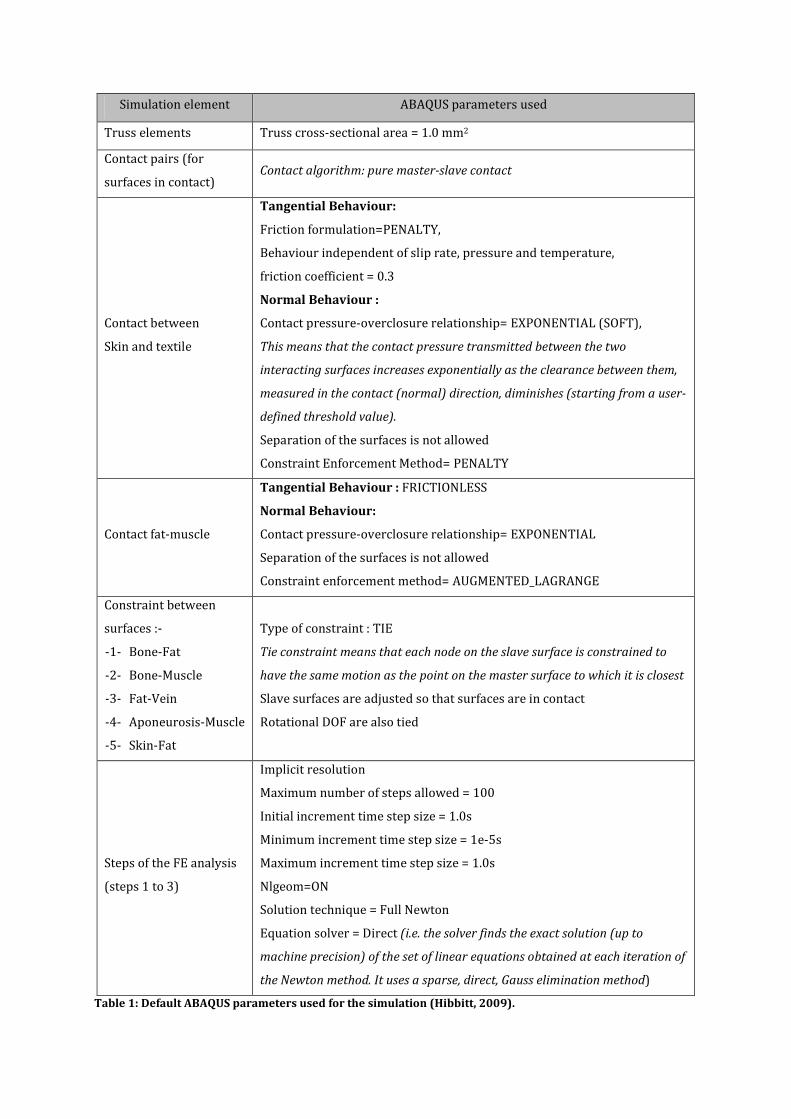
Simulation element ABAQUS parameters used
Truss elements Truss cross-sectional area = 1.0 mm2
Contact pairs (for
surfaces in contact) Contact algorithm: pure master-slave contact
Contact between
Skin and textile
Tangential Behaviour:
Friction formulation=PENALTY,
Behaviour independent of slip rate, pressure and temperature,
friction coefficient = 0.3
Normal Behaviour :
Contact pressure-overclosure relationship= EXPONENTIAL (SOFT),
This means that the contact pressure transmitted between the two
interacting surfaces increases exponentially as the clearance between them,
measured in the contact (normal) direction, diminishes (starting from a user-
defined threshold value).
Separation of the surfaces is not allowed
Constraint Enforcement Method= PENALTY
Contact fat-muscle
Tangential Behaviour : FRICTIONLESS
Normal Behaviour:
Contact pressure-overclosure relationship= EXPONENTIAL
Separation of the surfaces is not allowed
Constraint enforcement method= AUGMENTED_LAGRANGE
Constraint between
surfaces :-
-1- Bone-Fat
-2- Bone-Muscle
-3- Fat-Vein
-4- Aponeurosis-Muscle
-5- Skin-Fat
Type of constraint : TIE
Tie constraint means that each node on the slave surface is constrained to
have the same motion as the point on the master surface to which it is closest
Slave surfaces are adjusted so that surfaces are in contact
Rotational DOF are also tied
Steps of the FE analysis
(steps 1 to 3)
Implicit resolution
Maximum number of steps allowed = 100
Initial increment time step size = 1.0s
Minimum increment time step size = 1e-5s
Maximum increment time step size = 1.0s
Nlgeom=ON
Solution technique = Full Newton
Equation solver = Direct (i.e. the solver finds the exact solution (up to
machine precision) of the set of linear equations obtained at each iteration of
the Newton method. It uses a sparse, direct, Gauss elimination method)
Table 1: Default ABAQUS parameters used for the simulation (Hibbitt, 2009).

Material Model Material parameters Source
Fat Hyper-elastic
Neo-Hookean
C10
= 0.005 MPa
D1 = 0.14 MPa-1
Inverse identification
(Dubuis et al., 2011)
(Avril et al., 2010)
Muscle Hyper-elastic
Neo-Hookean
C10
=0.003 MPa
D1 = 0.14MPa-1
(Dubuis et al., 2011)
(Avril et al., 2010)
Skin Hyper-elastic
Neo-Hookean
C10
= 0.1 MPa
D1 = 0.14 MPa-1
(Iivarinen et al., 2011)
(Hendriks et al., 2006)
Muscular
aponeurosis
Hyper-elastic
Neo-Hookean
C10
= 10 MPa
D1 = 80 MPa-1 (Wu, 2007)
Vein wall
Linearized (in
standing and
resting positions
respectively)
ν = 0.49 (fixed) Inverse identification
MCS Linear elastic E = 0.39
ν = 0.49
SIGVARIS tensile test on 15-
20 mmHg MCS and based
on the French norm NF-
G30-102 (AFNOR, 1986)
Table 2: Material properties of the different constitutive parts of the model.
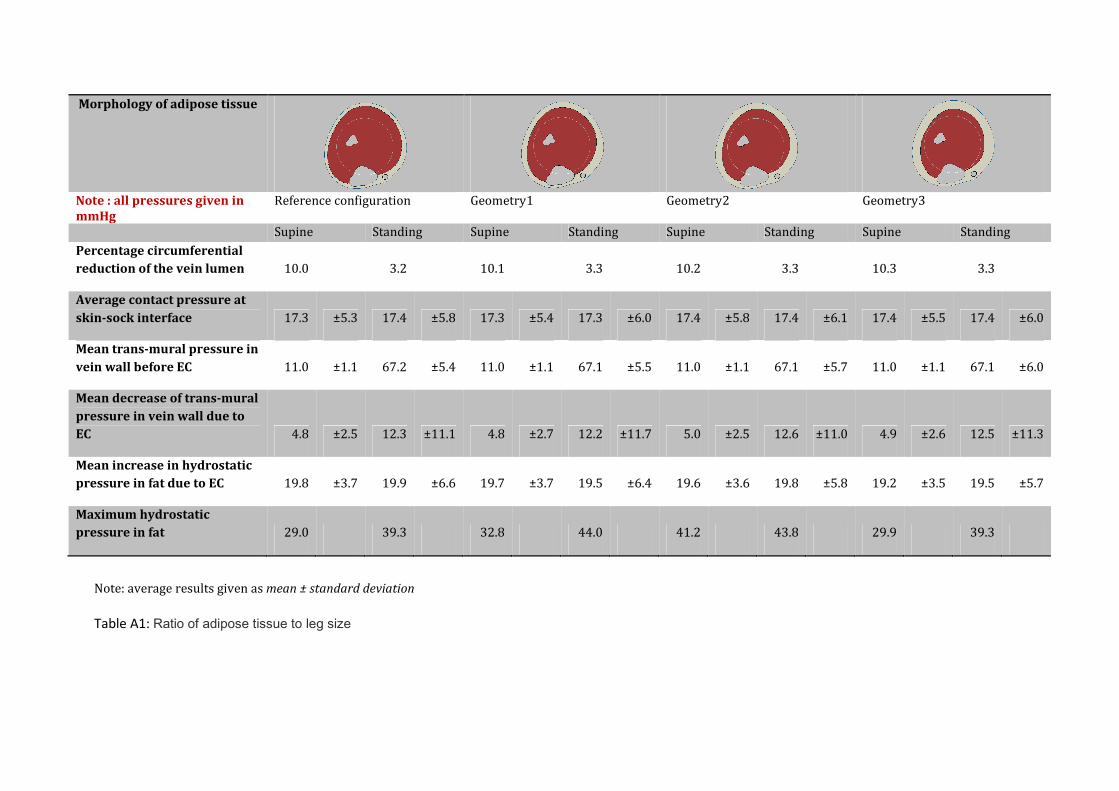
Morphology of adipose tissue
Note : all pressures given in
mmHg
Reference configuration Geometry1 Geometry2 Geometry3
Supine Standing Supine Standing Supine Standing Supine Standing
Percentage circumferential
reduction of the vein lumen 10.0 3.2 10.1 3.3 10.2 3.3 10.3 3.3
Average contact pressure at
skin-sock interface 17.3 ±5.3 17.4 ±5.8 17.3 ±5.4 17.3 ±6.0 17.4 ±5.8 17.4 ±6.1 17.4 ±5.5 17.4 ±6.0
Mean trans-mural pressure in
vein wall before EC 11.0 ±1.1 67.2 ±5.4 11.0 ±1.1 67.1 ±5.5 11.0 ±1.1 67.1 ±5.7 11.0 ±1.1 67.1 ±6.0
Mean decrease of trans-mural
pressure in vein wall due to
EC 4.8 ±2.5 12.3 ±11.1 4.8 ±2.7 12.2 ±11.7 5.0 ±2.5 12.6 ±11.0 4.9 ±2.6 12.5 ±11.3
Mean increase in hydrostatic
pressure in fat due to EC 19.8 ±3.7 19.9 ±6.6 19.7 ±3.7 19.5 ±6.4 19.6 ±3.6 19.8 ±5.8 19.2 ±3.5 19.5 ±5.7
Maximum hydrostatic
pressure in fat 29.0 39.3 32.8 44.0 41.2 43.8 29.9 39.3
Note: average results given as mean ± standard deviation
Table A1: Ratio of adipose tissue to leg size
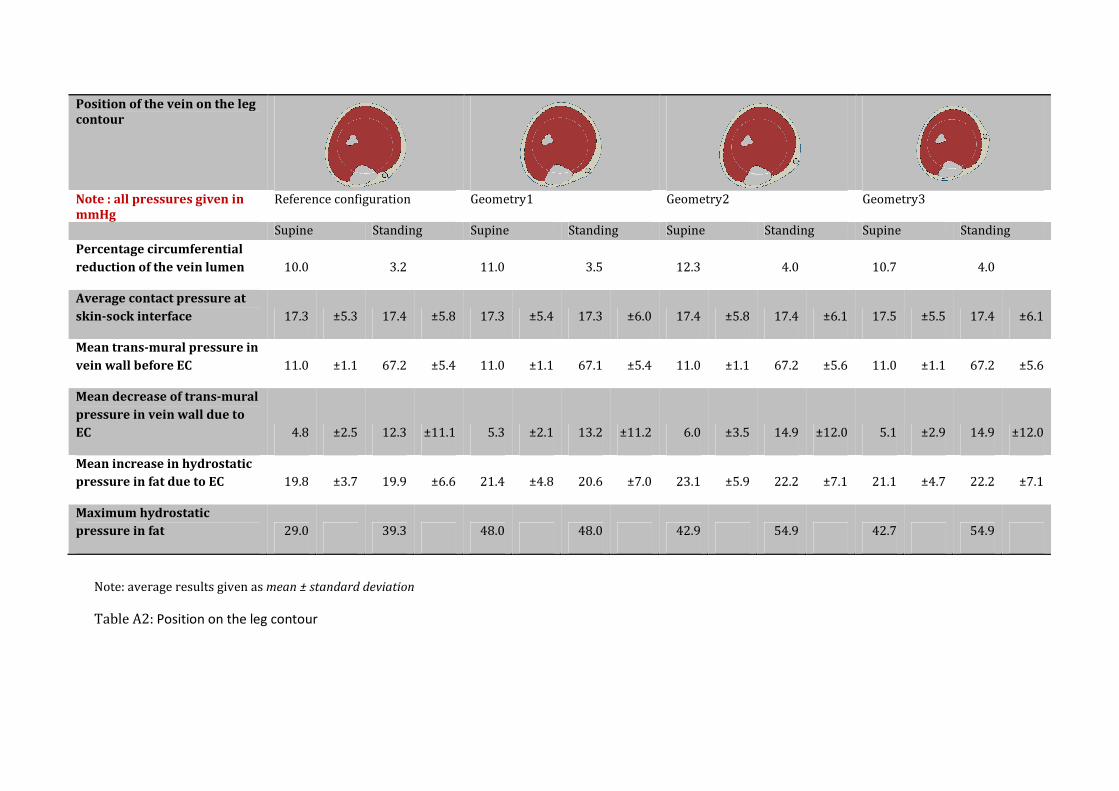
Position of the vein on the leg
contour
Note : all pressures given in
mmHg
Reference configuration Geometry1 Geometry2 Geometry3
Supine Standing Supine Standing Supine Standing Supine Standing
Percentage circumferential
reduction of the vein lumen 10.0 3.2 11.0 3.5 12.3 4.0 10.7 4.0
Average contact pressure at
skin-sock interface 17.3 ±5.3 17.4 ±5.8 17.3 ±5.4 17.3 ±6.0 17.4 ±5.8 17.4 ±6.1 17.5 ±5.5 17.4 ±6.1
Mean trans-mural pressure in
vein wall before EC 11.0 ±1.1 67.2 ±5.4 11.0 ±1.1 67.1 ±5.4 11.0 ±1.1 67.2 ±5.6 11.0 ±1.1 67.2 ±5.6
Mean decrease of trans-mural
pressure in vein wall due to
EC 4.8 ±2.5 12.3 ±11.1 5.3 ±2.1 13.2 ±11.2 6.0 ±3.5 14.9 ±12.0 5.1 ±2.9 14.9 ±12.0
Mean increase in hydrostatic
pressure in fat due to EC 19.8 ±3.7 19.9 ±6.6 21.4 ±4.8 20.6 ±7.0 23.1 ±5.9 22.2 ±7.1 21.1 ±4.7 22.2 ±7.1
Maximum hydrostatic
pressure in fat 29.0 39.3 48.0 48.0 42.9 54.9 42.7 54.9
Note: average results given as mean ± standard deviation
Table A2: Position on the leg contour
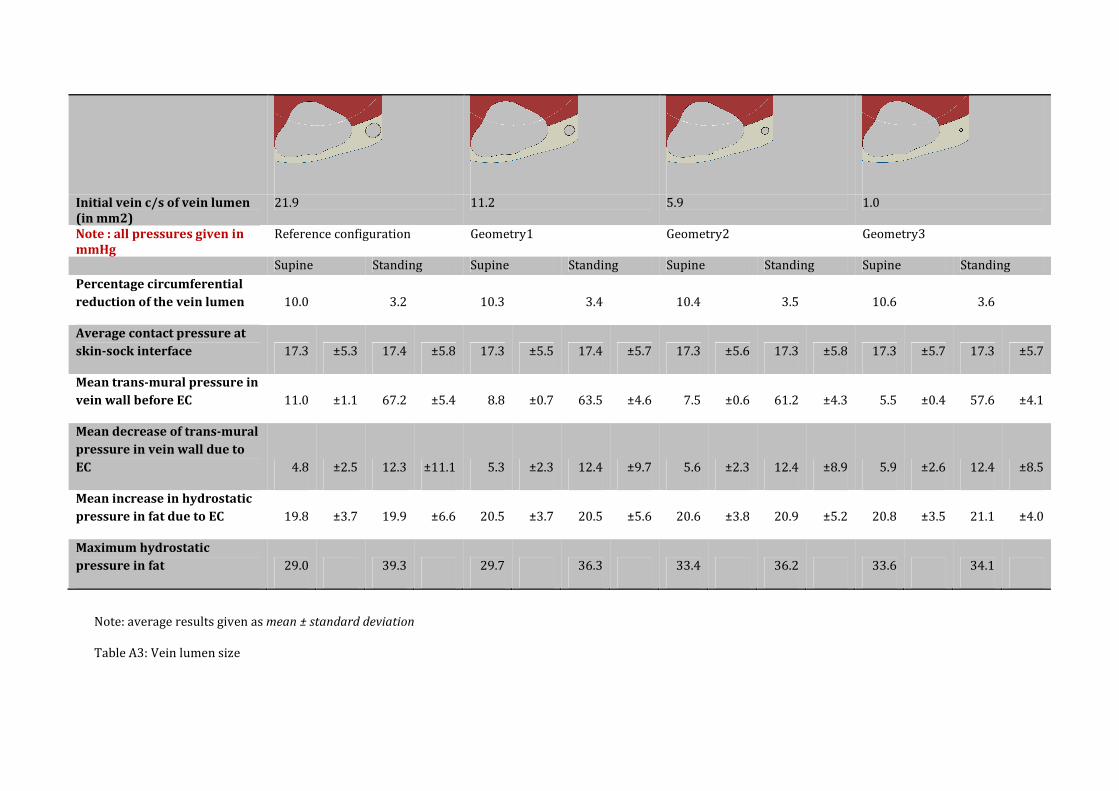
Initial vein c/s of vein lumen
(in mm2)
21.9 11.2 5.9 1.0
Note : all pressures given in
mmHg
Reference configuration Geometry1 Geometry2 Geometry3
Supine Standing Supine Standing Supine Standing Supine Standing
Percentage circumferential
reduction of the vein lumen 10.0 3.2 10.3 3.4 10.4 3.5 10.6 3.6
Average contact pressure at
skin-sock interface 17.3 ±5.3 17.4 ±5.8 17.3 ±5.5 17.4 ±5.7 17.3 ±5.6 17.3 ±5.8 17.3 ±5.7 17.3 ±5.7
Mean trans-mural pressure in
vein wall before EC 11.0 ±1.1 67.2 ±5.4 8.8 ±0.7 63.5 ±4.6 7.5 ±0.6 61.2 ±4.3 5.5 ±0.4 57.6 ±4.1
Mean decrease of trans-mural
pressure in vein wall due to
EC 4.8 ±2.5 12.3 ±11.1 5.3 ±2.3 12.4 ±9.7 5.6 ±2.3 12.4 ±8.9 5.9 ±2.6 12.4 ±8.5
Mean increase in hydrostatic
pressure in fat due to EC 19.8 ±3.7 19.9 ±6.6 20.5 ±3.7 20.5 ±5.6 20.6 ±3.8 20.9 ±5.2 20.8 ±3.5 21.1 ±4.0
Maximum hydrostatic
pressure in fat 29.0 39.3 29.7 36.3 33.4 36.2 33.6 34.1
Note: average results given as mean ± standard deviation
Table A3: Vein lumen size
Distance to skin (mm) 2.85 1.96 1.33 0.39
Note : all pressures given in
mmHg
Geometry1 Reference configuration Geometry2 Geometry3
Supine Standing Supine Standing Supine Standing Supine Standing
Percentage circumferential
reduction of the vein lumen 10.2 3.1 10.0 3.2 10.2 3.4 10.2 3.5
Average contact pressure at
skin-sock interface 17.3 ±5.6 17.3 ±6.1 17.3 ±5.3 17.4 ±5.8 17.3 ±5.3 17.3 ±5.8 17.3 ±5.4 17.3 ±5.9
Mean trans-mural pressure in
vein wall before EC 11.0 ±1.2 67.4 ±5.7 11.0 ±1.1 67.2 ±5.4 11.0 ±1.1 67.2 ±5.6 11.0 ±1.1 67.2 ±5.5
Mean decrease of trans-mural
pressure in vein wall due to
EC 4.8 ±2.9 11.9 ±11.6 4.8 ±2.5 12.3 ±11.1 4.9 ±2.5 12.8 ±11.5 4.9 ±3.3 13.4 ±12.5
Mean increase in hydrostatic
pressure in fat due to EC 20.2 ±3.8 19.7 ±7.0 19.8 ±3.7 19.9 ±6.6 19.7 ±3.7 19.8 ±6.3 19.4 ±4.0 19.9 ±6.5
Maximum hydrostatic
pressure in fat 32.9 44.4 29.0 39.3 29.4 41.8 32.7 66.2
Note: average results given as mean ± standard deviation
Table A4: Depth of vein in adipose tissue
Mean external compression
applied on skin (mmHg)
17.4 34.7 52.0 69.4
Note : all pressures given in
mmHg
Reference configuration Configuration 1 Configuration 2 Configuration 3
Supine Standing Supine Standing Supine Standing Supine Standing
Percentage circumferential
reduction of the vein lumen 10.0 3.2 16.8 5.7 22.4 7.9 27.4 10.0
Average contact pressure at
skin-sock interface 17.3 ±5.3 17.4 ±5.8 34.7 ±9.3 34.7 ±9.8 52.0 ±12.9 52.0 ±13.4 69.3 ±16.6 69.4 ±17.2
Mean trans-mural pressure in
vein wall before EC 11.0 ±1.1 67.2 ±5.4 11.0 ±1.1 67.2 ±5.4 11.0 ±1.1 67.2 ±5.4 11.0 ±1.1 67.2 ±5.4
Mean decrease of trans-mural
pressure in vein wall due to
EC 4.8 ±2.5 12.3 ±11.1 10.1 ±4.5 23.7 ±10.3 16.0 ±8.3 34.8 ±9.3 22.1 ±14.4 45.8 ±8.6
Mean increase in hydrostatic
pressure in fat due to EC 19.8 ±3.7 19.9 ±6.6 37.2 ±6.3 38.3 ±7.7 54.3 ±9.2 56.2 ±8.6 71.2 ±12.8 73.7 ±9.7
Maximum hydrostatic
pressure in fat 29.0 39.3 57.6 59.8 91.0 91.1 123.7 119.9
Note: average results given as mean ± standard deviation
Table A5: Effect of the applied external compression

C10 Fat (kPa) 3 5 6 7.5
Note : all pressures given in
mmHg
Configuration 1 Reference configuration Configuration 2 Configuration 3
Supine Standing Supine Standing Supine Standing Supine Standing
Percentage circumferential
reduction of the vein lumen 12.2 3.3 10.0 3.2 9.2 3.1 8.3 3.0
Average contact pressure at
skin-sock interface 17.3 ±4.9 28.7 ±10.0 17.3 ±5.3 17.4 ±5.8 17.4 ±5.5 17.4 ±5.9 17.4 ±5.7 17.3 ±6.2
Mean trans-mural pressure in
vein wall before EC 11.0 ±1.1 67.3 ±5.4 11.0 ±1.1 67.2 ±5.4 11.0 ±1.1 67.2 ±5.4 11.0 ±1.1 67.2 ±5.4
Mean decrease of trans-mural
pressure in vein wall due to
EC 6.4 ±2.4 12.9 ±10.9 4.8 ±2.5 12.3 ±11.1 4.3 ±2.6 11.9 ±11.1 3.7 ±2.6 11.4 ±11.2
Mean increase in hydrostatic
pressure in fat due to EC 18.7 ±3.0 19.1 ±5.9 19.8 ±3.7 19.9 ±6.6 20.3 ±4.1 20.2 ±6.8 20.9 ±4.7 20.5 ±7.1
Maximum hydrostatic
pressure in fat 27.6 36.1 29.0 39.3 29.9 40.4 32.1 42.4
Note: average results given as mean ± standard deviation
Table A6: Influence of the “type” of fat for the stiffness
D1 Fat (MPa-1) 0.005 0.14 1 10
Note : all pressures given in
mmHg
Configuration 1 Reference configuration Configuration 2 Configuration 3
Supine Standing Supine Standing Supine Standing Supine Standing
Percentage circumferential
reduction of the vein lumen 10.0 3.2 10.0 3.2 10.0 3.2 10.0 3.2
Average contact pressure at
skin-sock interface 17.4 ±5.4 17.4 ±5.9 17.3 ±5.3 17.4 ±5.8 17.4 ±5.4 17.3 ±5.8 17.3 ±5.3 17.3 ±5.4
Mean trans-mural pressure in
vein wall before EC 11.0 ±1.1 67.4 ±5.4 11.0 ±1.1 67.2 ±5.4 11.0 ±1.1 67.2 ±5.4 11.0 ±1.1 67.2 ±5.4
Mean decrease of trans-mural
pressure in vein wall due to
EC 4.8 ±2.5 12.2 ±11.1 4.8 ±2.5 12.3 ±11.1 4.8 ±2.5 12.3 ±11.1 4.7 ±2.7 12.0 ±11.2
Mean increase in hydrostatic
pressure in fat due to EC 19.8 ±3.8 19.9 ±6.6 19.8 ±3.7 19.9 ±6.6 19.6 ±3.7 19.8 ±6.6 18.4 ±3.6 18.4 ±6.1
Maximum hydrostatic
pressure in fat 29.1 39.1 29.0 39.3 28.5 38.9 26.4 36.1
Note: average results given as mean ± standard deviation
Table A7: Influence of the “type” of fat for the incompressibility parameter
Constitutive behaviour law
for the vein wall
Bi-linear elastic model Neo-Hookean material
behaviour law
Note : all pressures given in
mmHg
Reference configuration
Supine Standing Supine Standing
Percentage circumferential
reduction of the vein lumen 10.0 3.2 9.8 3.2
Average contact pressure at
skin-sock interface 17.3 ±5.3 17.4 ±5.8 17.3 ±5.3 17.3 ±5.8
Mean trans-mural pressure in
vein wall before EC 11.0 ±1.1 67.2 ±5.4 11.0 ±1.3 67.1 ±6.6
Mean decrease of trans-mural
pressure in vein wall due to
EC 4.8 ±2.5 12.3 ±11.1 5.3 ±2.7 12.2 ±12.4
Mean increase in hydrostatic
pressure in fat due to EC 19.8 ±3.7 19.9 ±6.6 19.8 ±3.7 19.9 ±6.5
Maximum hydrostatic
pressure in fat 29.0 39.3 29.0 39.2
Note: average results given as mean ± standard deviation
Table 8A:
Element type used for the FE
mesh
Normal formulation
(CPE4, CPE3, T2D2)
Reduced integration
(CPE4R, CPE3, T2D2)
Hybrid formulation and
reduced integration
(CPE4RH, CPE3H, T2D2H)
Geometric order: Quadratic
elements used instead of linear
elements
(CPE8, CPE6, T2D3)
Note : all pressures given in
mmHg
Reference configuration
Supine Standing Supine Standing Supine Standing Supine Standing
Percentage circumferential
reduction of the vein lumen 10.0 3.2 10.0 3.2 10.0 3.2 10.0 3.2
Average contact pressure at
skin-sock interface 17.3 ±5.3 17.3 ±5.8 17.3 ±5.3 17.3 ±5.8 17.3 ±5.3 17.4 ±5.8 17.6 ±6.0 17.6 ±6.4
Mean trans-mural pressure in
vein wall before EC 10.9 ±1.1 67.1 ±5.8 11.0 ±1.1 67.2 ±5.4 11.0 ±1.1 67.2 ±5.4 14.5 ±1.2 88.3 ±6.7
Mean decrease of trans-mural
pressure in vein wall due to
EC 5.9 ±2.7 14.8 ±13.1 4.8 ±2.5 12.3 ±11.1 4.8 ±2.5 12.3 ±11.1 6.3 ±3.1 16.1 ±13.0
Mean increase in hydrostatic
pressure in fat due to EC 19.8 ±3.8 19.9 ±6.6 19.8 ±3.7 19.9 ±6.6 19.8 ±3.7 19.9 ±6.6 20.6 ±16.6 20.4 ±17.6
Maximum hydrostatic
pressure in fat 29.2 39.6 29.1 39.2 29.0 39.3 286.0 285.7
Note: average results given as mean ± standard deviation
Table A9
Contact formulation for the
interface Fat/Vein
Tie constraint Frictionless
Friction - "Hard" contact
contact pressure-overclosure
relationship
Friction - Exponential ("Soft")
contact pressure-overclosure
relationship
Note : all pressures given in
mmHg
Reference configuration
Supine Standing Supine Standing Supine Standing Supine Standing
Percentage circumferential
reduction of the vein lumen 9.9 3.1 10.1 3.2 10.1 3.1 10.1 3.2
Average contact pressure at
skin-sock interface 17.3 ±5.3 17.4 ±5.8 17.3 ±5.3 17.4 ±5.8 17.3 ±5.3 17.4 ±5.8 17.3 ±5.3 17.4 ±5.8
Mean trans-mural pressure in
vein wall before EC 11.0 ±1.1 67.2 ±5.4 10.8 ±1.1 67.2 ±5.4 10.9 ±1.1 67.2 ±5.4 9.8 ±0.9 64.6 ±5.1
Mean decrease of trans-mural
pressure in vein wall due to
EC 4.7 ±2.5 12.0 ±11.0 5.2 ±2.3 12.8 ±12.0 5.1 ±1.9 12.4 ±11.3 5.6 ±1.6 12.7 ±10.6
Mean increase in hydrostatic
pressure in fat due to EC 19.5 ±3.7 19.7 ±6.5 19.9 ±4.8 20.0 ±4.9 19.8 ±4.5 19.8 ±5.5 20.0 ±4.6 20.1 ±5.6
Maximum hydrostatic
pressure in fat 36.5 39.4 35.2 35.6 34.9 37.0 29.8 38.0
Note: average results given as mean ± standard deviation
Table A10

Contact formulation for the
interface Fat/Muscle
Tie constraint Frictionless
Friction - "Hard" contact
contact pressure-overclosure
relationship
Friction - Exponential ("Soft")
contact pressure-overclosure
relationship
Note : all pressures given in
mmHg
Reference configuration
Supine Standing Supine Standing Supine Standing Supine Standing
Percentage circumferential
reduction of the vein lumen 9.9 3.2 10.0 3.0 9.9 3.1 10.0 3.2
Average contact pressure at
skin-sock interface 17.3 ±5.3 17.4 ±5.8 17.3 ±5.3 17.4 ±5.8 17.3 ±5.3 17.4 ±5.8 17.3 ±5.3 17.4 ±5.8
Mean trans-mural pressure in
vein wall before EC 11.0 ±1.1 67.3 ±5.4 11.0 ±1.1 67.2 ±5.4 11.0 ±1.1 67.2 ±5.4 11.0 ±1.1 67.2 ±5.4
Mean decrease of trans-mural
pressure in vein wall due to
EC 4.8 ±2.5 12.3 ±11.1 4.6 ±2.6 11.1 ±11.2 4.7 ±2.5 12.0 ±11.0 4.8 ±2.5 12.3 ±11.1
Mean increase in hydrostatic
pressure in fat due to EC 19.6 ±4.3 20.0 ±7.0 19.4 ±3.6 18.7 ±6.4 19.5 ±3.7 19.7 ±6.5 19.8 ±3.7 19.9 ±6.6
Maximum hydrostatic
pressure in fat 39.7 39.5 31.8 38.8 36.5 39.4 29.0 39.3
Note: average results given as mean ± standard deviation
Table A11
Contact formulation for the
interface Skin/MCS
Tie constraint Frictionless
Friction - "Hard" contact
contact pressure-overclosure
relationship
Friction - Exponential ("Soft")
contact pressure-overclosure
relationship
Note : all pressures given in
mmHg
Reference configuration
Supine Standing Supine Standing Supine Standing Supine Standing
Percentage circumferential
reduction of the vein lumen
Not relevant because loading of
the leg is done by simulating
the contact between the MCS
and the skin
10.0 3.0 9.9 3.1 10.0 3.2
Average contact pressure at
skin-sock interface 17.3 ±5.3 17.4 ±5.8 18.8 ±23.3 18.8 ±23.5 17.3 ±5.3 17.4 ±5.8
Mean trans-mural pressure in
vein wall before EC 11.0 ±1.1 67.2 ±5.4 11.0 ±1.1 67.2 ±5.4 11.0 ±1.1 67.2 ±5.4
Mean decrease of trans-mural
pressure in vein wall due to
EC 4.6 ±2.6 11.1 ±11.2 4.7 ±2.5 12.0 ±11.0 4.8 ±2.5 12.3 ±11.1
Mean increase in hydrostatic
pressure in fat due to EC 19.4 ±3.6 18.7 ±6.4 19.5 ±3.7 19.7 ±6.5 19.8 ±3.7 19.9 ±6.6
Maximum hydrostatic
pressure in fat
31.8 38.8 36.5 39.4 29.0 39.3
Note: average results given as mean ± standard deviation
Table A12