biomedical applications of nanotechnology || color plates
TRANSCRIPT

Color-plate JWBK002-Labhasetwar June 24, 2007 17:39 Char Count=
* ****
*
nucleus
plasma membrane
coated pit
endosome
endosome
coated pit
nuclear membrane
A
B
C
H+
H+
Figure 2.1. Viral entry into cells, schematic overview. Viruses bind to cell surfaces via
receptor–ligand interactions. Many virus species are taken up into cells by endocytosis, like
adenovirus (A) or membrane-coated viruses such as influenza virus (C). Other membrane-
coated viruses such as retroviruses (B) directly fuse their membranes with the plasma mem-
brane. Endocytosis proceeds via segregation of membrane-surrounded vesicles (endosomes)
from the plasma membrane. A proton pump in the endosomal membrane mediates the acid-
ification of the endosomal lumen. This pH change triggers conformational rearrangements
of viral proteins, which then by interaction with the endosomal membrane can lead to the
disruption of endosomes (like in the case of adenoviruses) or to the fusion of endosomal and
viral membranes (like in the case of influenza virus). These membrane disruption/fusion events
are essential parts of viral entry into cells, which ultimately leads to uptake/transport of viral
genetic information into the cell nucleus.
1
Color-plate JWBK002-Labhasetwar June 24, 2007 17:39 Char Count=
application
receptor binding
nuclear transport biocompatibility
endocytosis endosome lysis
DNA compaction
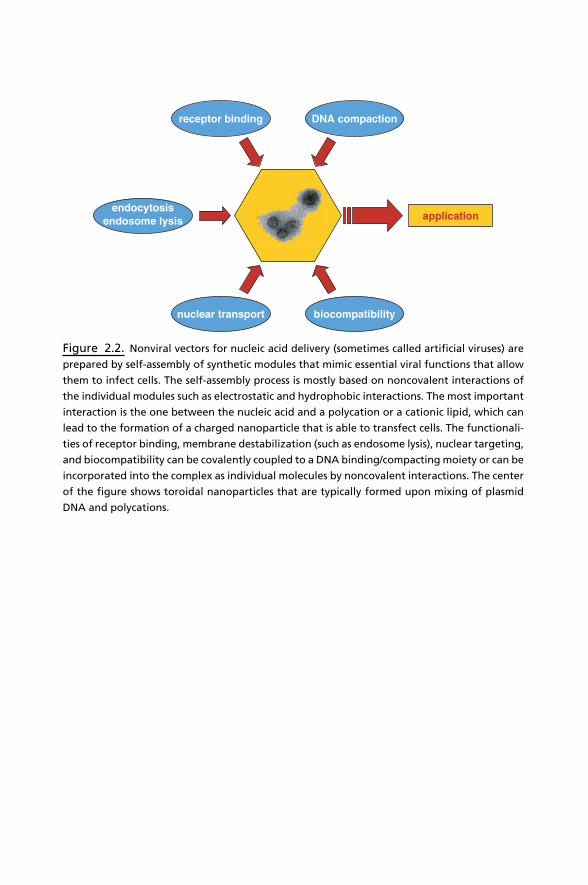
Figure 2.2. Nonviral vectors for nucleic acid delivery (sometimes called artificial viruses) are
prepared by self-assembly of synthetic modules that mimic essential viral functions that allow
them to infect cells. The self-assembly process is mostly based on noncovalent interactions of
the individual modules such as electrostatic and hydrophobic interactions. The most important
interaction is the one between the nucleic acid and a polycation or a cationic lipid, which can
lead to the formation of a charged nanoparticle that is able to transfect cells. The functionali-
ties of receptor binding, membrane destabilization (such as endosome lysis), nuclear targeting,
and biocompatibility can be covalently coupled to a DNA binding/compacting moiety or can be
incorporated into the complex as individual molecules by noncovalent interactions. The center
of the figure shows toroidal nanoparticles that are typically formed upon mixing of plasmid
DNA and polycations.
2

Color-plate JWBK002-Labhasetwar June 24, 2007 17:39 Char Count=
Organ
Cell
DNA
Tablet
Microspheres
Dendrimer
Figure 5.1. Progress of drug delivery from “macro” systems that interact at the organ level
to “micro” systems that interact at the cellular level to “nano” systems that interact at the
cellular level. Length scale has a significant influence on drug delivery in terms of reaching the
target site, modifying the biodistribution of the drug, and enhancing the efficacy of the drug.
(a) (b)
(c) (d)
Figure 5.6. Confocal images showing lung epithelial cells. (a) Under phase contrast. (b) Local-
ization of FITC-labeled PAMAM G4 hydroxyl terminated dendrimer in the cytoplasm. (c) Local-
ization of lysosomal marker (lysotracker) in the lysosomes. (d) Co-localization of FITC-labeled
dendrimer and lysostracker in the lysosomes. Images were captured 30 min after treatment.
3

Color-plate JWBK002-Labhasetwar June 24, 2007 17:39 Char Count=
00
200 400
FL1-H
(a)
(b)
Cou
nts
600 800 1000
500
400
300
200
100
Figure 5.7. (a) Flow cytometry analysis of lung epithelial cells treated with FITC-labeled
ibuprofen–PAMAM G4 OH dendrimer conjugate at different time points. The shift in intra-
cellular fluorescence intensity indicates the rapid cellular uptake of the conjugate. Key: Red,
0 min; green, 5 min; black, 30 min; blue, 60 min; brown, 240 min (b) Confocal image showing
the localization of FITC-labeled ibuprofen–dendrimer conjugate in the cytoplasm after 2 hr of
treatment.
4

Color-plate JWBK002-Labhasetwar June 24, 2007 17:39 Char Count=
Figure 6.5. Poly(ethyleneimine) cross-linked poly(ethylene oxide) nanogel. (Reproduced
with permission from Ref. 71, Figure 6.1. Copyright 2005, Elsevier Ltd.)
Figure 6.9. Y-shaped copolymer self-assembly to give micelle structures. (Reproduced with
permission from Ref. 113, Figure 6.8. Copyright 2006, John Wiley & Sons, Inc.)
Figure 6.10. Internal structural variation in micelle gels. (Reproduced with permission from
Ref. 117, Figure 6.1. Copyright 2001, Elsevier, Ltd.)
5

Color-plate JWBK002-Labhasetwar June 24, 2007 17:39 Char Count=
Figure 6.11. Schematic representation of CHP nanogel preparation by physical cross-linking
(self-assembly). (Reproduced with permission from Ref. 128, Figure 6.1. Copyright 2004,
Elsevier, Ltd.)
(a)
(b)
Figure 6.14. Classical emulsion polymerization technique for nanogel preparation.
6

Color-plate JWBK002-Labhasetwar June 24, 2007 17:39 Char Count=
High polymer concentration and low
dose
(a)
Low polymer concentration and high
dose
(b)
Figure 6.16. Radiation mechanism for (a) bulk/micro gel and (b) nanogel formation. (Repro-
duced with permission from Ref. 203, Figure 6.2. Copyright 2003, American Chemical Society.)
with nanocageswithout nanocages
320
OC
T s
igna
l (a.
u.)
340Depth (µm)
360 380
0.9
0.8
0.7
0.6
0.5
0.4
0.3
(a) (b)
Figure 7.3. (a) OCT image of a gelatin phantom embedded with TiO2, and the concentration
of TiO2 was controlled at 1 mg/mL to nimic the background scattering of soft tissues. The right
portion of the phantom contained 1 nM of gold nanocages while the left portion did not
contain any gold nanocages. (b) Plots of the OCT signals on a log scale as a function of depth.
Note that the OCT signal recorded from the portion of phantom with gold nanocages decays
faster than the portion without nanocages. (Reprinted with permission from Nano Lett. 5 (3),
473–477, 2005. Copyright c© 2006 American Chemical Society.)
7

Color-plate JWBK002-Labhasetwar June 24, 2007 17:39 Char Count=
Figure 7.5. (a) Schematic illustration of tumor targeting and surface attachment of nanopar-
ticles. (b) Gold nanoparticles mediated tumor therapeutic modalities.
8