biomedical research 2017; 28 (12): 5187- · pdf filepulse based sensor design for wrist pulse...
TRANSCRIPT
Pulse based sensor design for wrist pulse signal analysis and health diagnosis.
Krittika Goyal*, Ravinder Agarwal
Department of Electrical and Instrumental Engineering, Thapar University, Punjab, India
Abstract
Pulse diagnosis is a common non-invasive method for measurement of health of person in Ayurveda.According to Ayurveda, the root cause of the disease is imbalance of three doshas i.e. vat, pit and kaph.The health status of the person is examined by Ayurvedic physician by feeling palpation from threefingers (index, middle and ring) placed on the radial artery for vat, pit and kaph respectively.Examination of the pulse (Nadi Parikshan) requires a lot of experience in pulse reading. It depends uponthe perception of the practitioner, hence there is a need to develop pulse diagnosis system to obtainaccurate diagnosis of disease. In present research work the design and development of the pulsediagnosis system was carried out, in which sensor MPXM2053D sensor from FREESCALE was used tosense the wrist pulse signals from 42 subjects. Thereafter, the signal conditioning circuit was designedusing instrumentation amplifier. Real time monitoring was performed using myRIO DAQ card inLabVIEW myRIO 2014 and filtering was performed in Matlab. Frequency domain analysis using powerspectrum was carried out and features such as band energy ratio were extracted. An interpretation ofuseful features to distinguish between healthy and unhealthy subject using statistical ANOVA analysisalong with t test was carried out. Different classifiers were used to classify healthy and unhealthy subjectand results were obtained with high accuracy, sensitivity and specificity. Thus wrist pulse acquisitionsystem developed for pulse diagnosis will be a helpful tool for diagnosis of healthy and unhealthy person.
Keywords: Pulse diagnosis, Wrist pulse signal, Band energy ratio, DAQ card.Accepted on October 24, 2016
IntroductionPulse diagnosis means an examination of pulse and inAyurveda, it is known as Nadi Parikshan. Examination of thepulse as a diagnostic tool was recognized by Indian physiciansin twelfth century A.D. [1]. Sarangadhara Sanhita, an authenticbook of Ayurveda states that the pulse at the wrist signifies thepresence of life. The physician should recognize health and illhealth of person from the activities of the pulse at wrist [2].Ayurvedic physician use the pulse to determine heart rate aswell as feel the patterns of vibration that represent the status ofthe body and mind at a specific time. Ayurvedic practitionerplaces three fingers 2 cm up the wrist with index finger placednear the thumb on radial artery corresponding to each of thethree doshas as shown in Figure 1. The index finger senses thevat pulse, the middle finger senses the pit pulse and the ringfinger senses the kaph pulse. The different characteristics ofthe pulses have been indicated in Table 1. When dominance ofany dosha or combination of doshas is observed disease isfound through proper examination of pulse. Since it is a non-invasive method so it should be used to know the health statusof subject. It requires a lot of experience to learn pulsediagnosis technique so an acquisition device needs to bedeveloped for novice practioners.
To develop pulse diagnosis acquisition systems, a lot of efforthas been made worldwide. A wrist pulse signal is produced by
cardiac contraction and relaxation of heart and it is related tocentral aortic pressure waveform [3]. Pulse is felt at radialartery and the fluctuations are felt. Different types of sensorsworking on different principle have been used to measure thepressure exerted by blood in radial artery. Sensor based onstrain gauge was used and time series data acquired gavereproducible waveforms [4]. Portable prototype was madeusing sensor working on principle of photoplethysmographyand validation of the device performed using neural network[5]. Bulkiness of the device for wrist pulse acquisitionremained a challenge in this field [6]. Sensor working onultrasonic frequency was utilized for capturing of wrist signaland t test statistical analysis performed [7]. Device named NadiYantra was developed and acquiring of signals was performedusing Biopac 150 data acquisition system [8]. Along withhardware implementations a lot of research have been done inanalysis of wrist pulse signal in time and frequency domainand pulse classifiers. Wrist pulse signal analysis have beenperformed involving power spectrum estimate of pulse signalfor identifying the frequency of pulse in healthy and unhealthysubject [9,10]. An architecture designed using three mainsensors and subsensors as well as pressure adjustment moduleand classification with SVM classifier was an attractivedevelopment [3]. The irregularities associated with unhealthyand healthy subject and reduced features were classified byusing support vector machine [11]. Acquiring of the wrist pulse
ISSN 0970-938Xwww.biomedres.info
Biomed Res- India 2017 Volume 28 Issue 12 5187
Biomedical Research 2017; 28 (12): 5187-5195

signal can be performed by using acquisition systems such asNIcDAQ9174 chassis and analog DAQ card (NI9129) [12],Biopac data acquisition system and many more. Replicatingfingers of physician in pulse diagnosis is a big challenge, theproper design of hardware along with significant featureextraction and classification may lead to a non invasive devicewhich can eliminate human error performed manually byIndian practitioners in the disease diagnosis.
Figure 1. Standard positions to obtain pulse.
Table 1. Characteristics of pulses.
VAT PIT KAPH
Location Index Finger Middle Finger Ring Finger
Movement Spiral Jumping Symmetrical
Speed Irregular Fast Slow
Volume Low Full Full
Design of Experimental SetupThe basic building blocks of wrist pulse acquisition system aredepicted in Figure 2. The system was used to build a singlechannel wrist pulse acquisition experimental setup consistingof a piezoresistive sensor MPXM2053D, instrumentationamplifier INA128, and DAQ card myRIO for data acquisition.
Figure 2. Block diagram for wrist pulse acquisition system.
Wrist pulse is a pressure signal; hence a pressure sensor wasused to acquire a pulse signal. There are number of pressuresensors available with a different principle, e.g., piezoelectricand strain gauge based sensors. Both the sensors can be usedfor human pulse detection but both have different advantagesand disadvantages. Both strain gauge and piezoelectric meetthe requirement but in present research, piezoresistive pressuresensor was used because piezoelectric sensor requiresshielding. Also, piezoresistive sensors provide both static and
dynamic response. Hence, piezoresistive sensor MPXM2053Dfrom FREESCALE of suitable size and sensitive to variation inpressures was used. It has the dimensions of of 9.1 mm ×7 mm,dimensions of the sensor are suitable as they are similar to thatof surface area covered by a finger tip. It provides a wide rangefor measurement i.e., 0 to 50 kPa or 0 to 375 mm of Hg [13]. Itis highly suitable for biomedical applications since systolicblood pressure ranges from 140 mm of Hg to 190 mm of Hgand diastolic pressure ranges from 90 mm of Hg to 100 mm ofHg. Since, MPXM2053D was available in form of a surfacemounted device as shown in Figure 3, after proper soldering itwas connected to dual in line package devices. The sensor wasplaced in suitable position i.e., 2 cm up the wrist to sensewaveform. To hold the sensor in its position a wrist band wasused to apply a suitable amount of pressure so that diaphragmof the sensor was in contact with radial artery at the wrist andthe pressure or vibration of blood flow could be sensed. Thesignal was picked up by the sensor and transmitted toamplifier.
Figure 3. Soldered SMD MPXM2053D sensor.
Instrumentation amplifier INA128, was used to amplify thedifferential output of the sensor. It has high common moderejection ratio, which helps in removing common mode signalthat is noise. It provides high bandwidth even at high gain.Simulation was performed using Multisim software as shownin Figure 4. Function generator was given as an input tooperational amplifier. The output of operational amplifier wasobserved on an oscilloscope. The pin configuration of INA128and AD620 is similar so AD620 was available in multisim andthus used for simulation. After performing simulation circuitwas implemented on hardware. Signal obtained from sensorwas mV signal so wrist pulse signal was amplified with gain of100. Value of the gain resistor was decided according toformula as mentioned in the datasheet [14].���� = 1 + 50��� �Here, RF is 500 Ω, So Gain is equal to 100.
Goyal/Agarwal
5188 Biomed Res- India 2017 Volume 28 Issue 12

For capturing signal, NI myRIO DAQ card was used, DAQdevice is essentially an analog to digital convertor [15]. Signalacquired was very low in amplitude and full of common modenoise so the myRIO DAQ card was found suitable choice forthis work as it provides differential mode of operation. Thehardware required for myRIO device is adapter, USB cable andmyRIO Card as shown in Figure 5. Software required tooperate myRIO device are LabVIEW, LabVIEW Real timemodule, LabVIEW myRIO toolkit. In the present researchwork single channel wrist pulse acquisition system wasdesigned in which single piezoresistive sensor was used tosense wrist pulse signal which was amplified usinginstrumentation amplifier and collected through myRIO DAQcard. The connections are as shown in circuit diagram inFigures 6 and 7.
Figure 4. Simulation using Multisim.
Figure 5. myRIO device with USB cable and adaptor.
The sensor produced differential output, which was given toinverting and non inverting pins of the instrumentationamplifier as input. Ground and positive power supply wereprovided with the myRIO DAQ card. MPXM2053D sensorrequired power supply of the order of 10 to 16 V andinstrumentation amplifier required power supply of the order of2.5 to 18 V. Also, the sensor and instrumentation amplifierrequired three terminal power supply that is positive, negative
and ground. Initially, power supply with three terminals wasdesigned but there was a problem of discharging of batterieswith time and maximum power supplied was that of 9 V atwhich sensor did not work properly. So, this power wasextracted from the myRIO DAQ card as it is capable ofproviding +15 V, -15 V and ground. Hence, proper connectionswere made and addressed properly in software to performinterfacing of device with a computer.
Figure 6. Circuit diagram of single channel system.
Figure 7. Experimental setup of hardware.
Figure 8. Experimental setup for acquiring a pulse signal.
Pulse based sensor design for wrist pulse signal analysis and health diagnosis
Biomed Res- India 2017 Volume 28 Issue 12 5189

Figure 9. Flowchart for processing of data.
MethodologyForty Two (42) Subjects information was collected, consistingof 28 healthy and 14 unhealthy subjects for recording wristpulse signal. The subject was requested to fill a consent formconsisting basic information of the subject regarding acute orchronic diseases. Thereafter, the subject was made to relax andseated with his or her elbow in resting position. Data wascollected at the same time between 7 am to 9 am for all
subjects at normal room temperature according to comfort ofsubject. Data was obtained for 5 min of each subject atsampling rate of 1000 Hz. Sampling rate of DAQ device wasset by using timed loop in Labview myRIO 2014. About 1minute data, 60000 samples were left in the beginning of eachsubject to ensure circuit stabilization. The data was acquired inLabview myRIO 2014 as shown in Figure 8 and samples wereexported and stored in excel sheets. A Matlab program wasmade to plot power spectrum. Filtering was performed inMatlab using low pass butterworth filter of order 2. The wholeprocess of the recording and analysis is given in flow chart inFigure 9.
Results and DiscussionWrist pulse signal was acquired using designed wrist pulseacquisition system. The wrist pulse signal was acquired usingDAQ device in LabVIEW and graphical user interface made toobserve and perform real time monitoring as shown in Figure10. Waveform of the pulse signal was obtained as desired andfound a good match with the literature waveform [16]. RawSignal of healthy and unhealthy subject is shown in Figures 11and 12 respectively. Waveforms obtained were noisy, so inorder to know the difference, filtering was performed. Wristpulse signal is an low frequency signal, so to know the cut offfrequency for filtering power spectrum analysis wasperfromed. Power spectrum provided information that all thefrequency components were contained in 0 Hz to 30 Hz asshown in Figure 13.
Figure 10. Real time monitoring with GUI.
The energy increase beyond 5 Hz in the unhealthy subjectwhich can be used as a distinguishing feature for healthy andunhealthy subject as shown in Figure 14. Low passButterworth filter of order 2 was designed in Matlab andfiltered waveforms of healthy and unhealthy subject wereobtained are shown in Figures 15 and 16 respectively. It wasobserved that the waveform of unhealthy subject was littleundistorted and broadened as compared to the waveform ofhealthy subjects. It was observed that the waveform of
unhealthy subject was little undistorted and broadened ascompared to the waveform of healthy subjects. Frequencydomain analysis was carried out and features such as bandenergy ratio was calculated to determine the energydistribution in the range of 0-30Hz. Band energy ratio refers topercentage energy in the particular band divided by totalenergy within that band [17]. It can be determined by using thefollowing formula:
BER (n)=(En/ET)*100
Goyal/Agarwal
5190 Biomed Res- India 2017 Volume 28 Issue 12
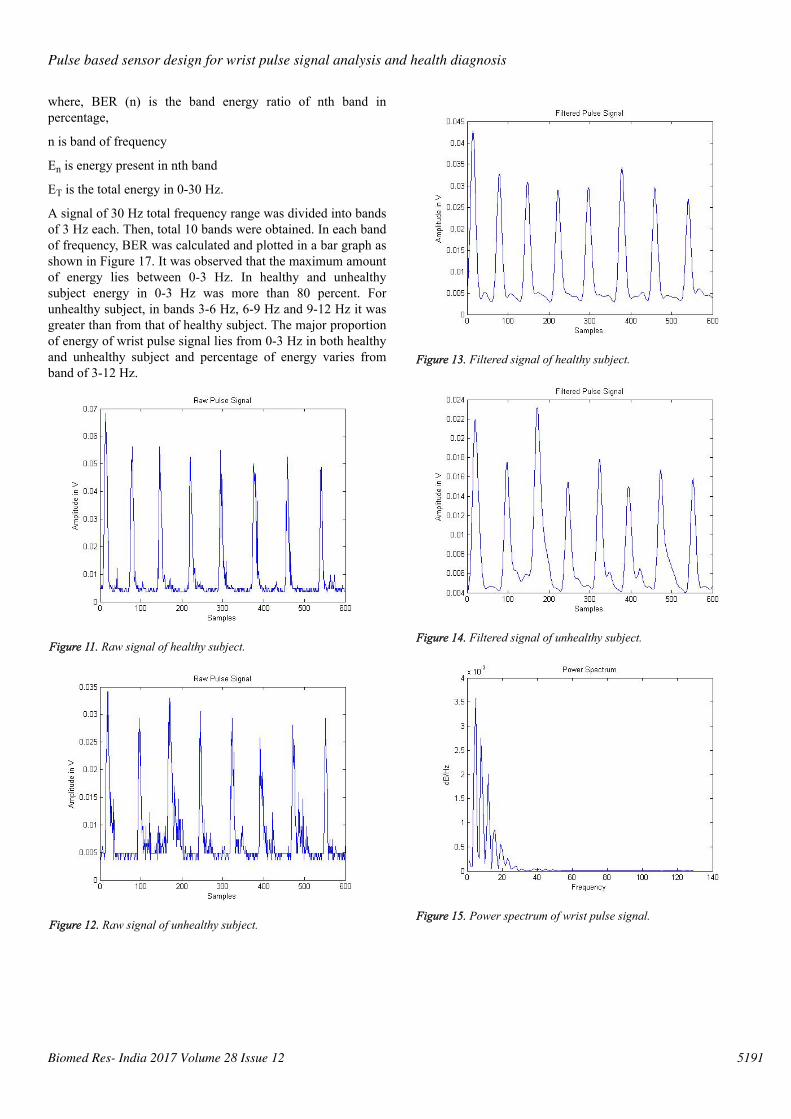
where, BER (n) is the band energy ratio of nth band inpercentage,
n is band of frequency
En is energy present in nth band
ET is the total energy in 0-30 Hz.
A signal of 30 Hz total frequency range was divided into bandsof 3 Hz each. Then, total 10 bands were obtained. In each bandof frequency, BER was calculated and plotted in a bar graph asshown in Figure 17. It was observed that the maximum amountof energy lies between 0-3 Hz. In healthy and unhealthysubject energy in 0-3 Hz was more than 80 percent. Forunhealthy subject, in bands 3-6 Hz, 6-9 Hz and 9-12 Hz it wasgreater than from that of healthy subject. The major proportionof energy of wrist pulse signal lies from 0-3 Hz in both healthyand unhealthy subject and percentage of energy varies fromband of 3-12 Hz.
Figure 11. Raw signal of healthy subject.
Figure 12. Raw signal of unhealthy subject.
Figure 13. Filtered signal of healthy subject.
Figure 14. Filtered signal of unhealthy subject.
Figure 15. Power spectrum of wrist pulse signal.
Pulse based sensor design for wrist pulse signal analysis and health diagnosis
Biomed Res- India 2017 Volume 28 Issue 12 5191

Figure 16. Comparison between power spectrum of healthy andunhealthy subject.
Figure 17. Comparison between BER of healthy and unhealthysubject.
Statistical analysis and classificationTen feature values obtained for detection of a healthy andunhealthy person increase complexity. To reduce the number offeatures and determine useful and significant features, theywere analyzed statistically for finding the best feature orcombination of features for distinguishing between healthy andunhealthy subject. Analysis of variance using Anova techniquewas performed and features were named 1 to 10 according tobands. On applying ANOVA: single factor on all the features,F4, F1 and F7 features having P value less than 0.05 (P<0.05)were obtained. So, these were analysed as significant featuresfrom 10 features which could be used for distinguishingbetween healthy and unhealthy person as shown in Table 2.
Classifier is the algorithm that helps in identification of theclassification process. In the present study two classes arehealthy and unhealthy and different classifiers were used toidentify subjects belonging to two classes. Classification wasdone by using various classifiers such as K- nearest neighbour(KNN), support vector machine (SVM), linear discriminantanalysis (LDA), Quadratic discriminant analysis (QDA),Decision tree (DT). To check the reliability of classifier,validation was performed by K-fold cross and Leave-one-outvalidation procedures. Also parameters such as accuracy,sensitivity, specificity were calculated to indicate performanceof the classifier. They are described as follows:
Confusion matrix: It refers to a table that describes theperformance of classifier given by�� ���� ��Accuracy: Accuracy refers to the number of correctpredictions made divided by the total number of predictionsmade [16].%��� �������� = ��+ ����+ ��+ ��+ �� * 100Sensitivity: Sensitivity refers to the fraction of positives thatare actually identified as such. It is the true positive rate of test[16].%��� ����������� = ����+ �� * 100Specificity: Sensitivity refers to the fraction of negatives thatare actually identified. It is the true negative rate of test [16].%��� ����������� = ����+ �� * 100where, TP is True positive, Tn is True negative, Fp is Falsepositive and Fn is False negative.
For the significant features calculated using ANNOVA in Table2, accuracy was calculated by using two validation techniques.Thus, in terms of accuracy (inverse of P value) maximumaccuracy was obtained in features F4, F1, F7 which wereinferred as significant features. Accuracy achieved for F4having highly significant P=0.00019 was found to bemaximum from all other features in all the classifiers.Accuracy achieved for F1 with P value as 0.009 had accuracygreater than other features but less than F4, since P value of F4was less than P value of F1 as per single factor ANOVA test.So, F4 was found to have least P value and hence the mostaccuracy. Tables 2 and 3 show analysis of variance usingAnova for K-fold and Leave-one-out respectively. Similarresults were found with both the validation approach.
Table 2. Analysis of Variance using ANOVA for K-fold.
K-Fold
Feature P value acc_KNN acc_SVM acc_LDA acc_QDA acc_DT
F4 0.00019 96.03 92.32 89.94 93.38 96.03
F1 0.009 95.55 66.66 75.55 80 75.55
F7 0.03 93.38 78.3 68.78 69.04 76.19
F3 0.09 93.33 37.77 62.22 42.22 80
F2 0.28 93.33 80 71.11 75.55 84.44
F6 0.3 89.41 72.22 57.14 62.43 66.67
F8 0.33 88.89 71.11 66.66 69.44 68.88
F9 0.35 88.88 60 57.777 57.77 73.33
Goyal/Agarwal
5192 Biomed Res- India 2017 Volume 28 Issue 12
F5 0.54 86.66 71.11 68.8 71.11 80
F10 1 80 53.33 60 60 62.2
Table 3. Analysis of Variance using ANOVA for Leave-one-out.
Leave one out
Feature P value acc_KNN acc_SVM acc_LDA acc_QDA acc_DT
F4 0.00019 96.29 93.38 87.56 93.38 96.2
F1 0.009 92.59 75.39 74.33 78.57 84.12
F7 0.03 92.32 72.75 74.33 70.37 71.42
F3 0.09 92.06 59.52 73.5 74.8 79.62
F2 0.28 91.53 76.45 65.34 65.87 74.8
F6 0.3 91.2 48.9 60.58 48.94 75.66
F8 0.33 90.74 64.02 62.4 60.05 73.5
F9 0.35 90.2 64.5 65.34 63.22 66.9
F5 0.54 89.68 46.82 62.16 62.16 73.2
F10 1 86.7 60.05 66.66 68.25 65.87
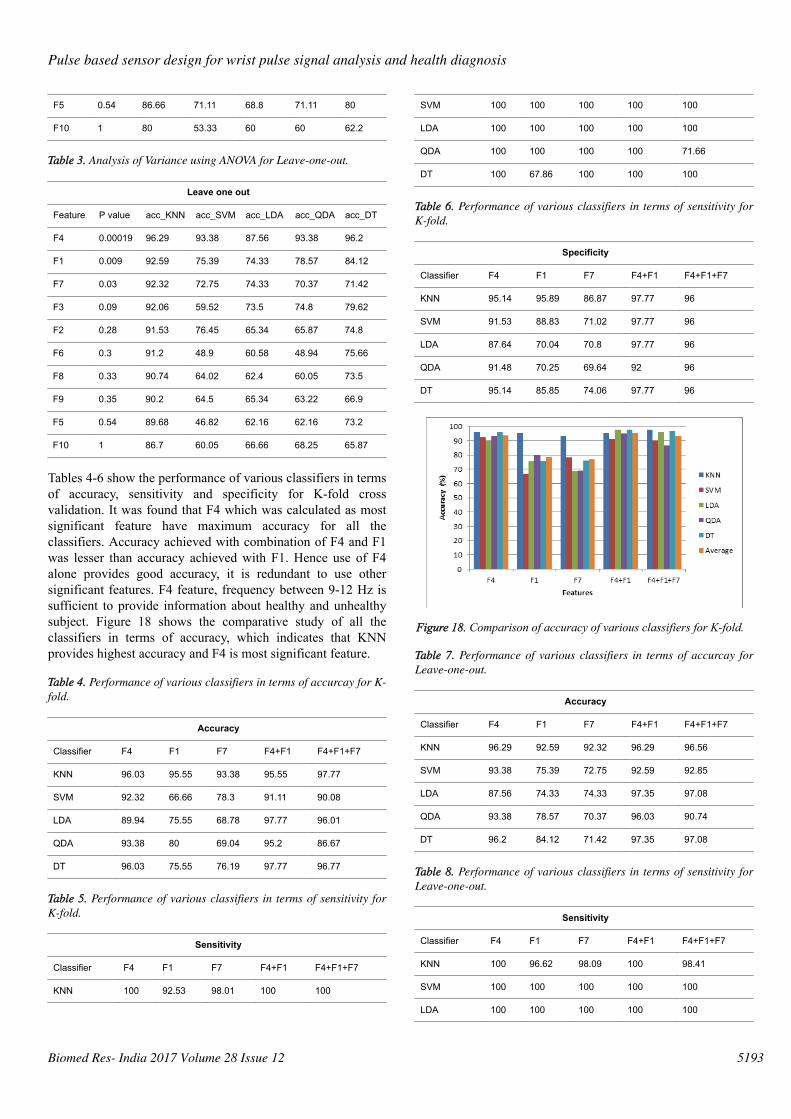
Tables 4-6 show the performance of various classifiers in termsof accuracy, sensitivity and specificity for K-fold crossvalidation. It was found that F4 which was calculated as mostsignificant feature have maximum accuracy for all theclassifiers. Accuracy achieved with combination of F4 and F1was lesser than accuracy achieved with F1. Hence use of F4alone provides good accuracy, it is redundant to use othersignificant features. F4 feature, frequency between 9-12 Hz issufficient to provide information about healthy and unhealthysubject. Figure 18 shows the comparative study of all theclassifiers in terms of accuracy, which indicates that KNNprovides highest accuracy and F4 is most significant feature.
Table 4. Performance of various classifiers in terms of accurcay for K-fold.
Accuracy
Classifier F4 F1 F7 F4+F1 F4+F1+F7
KNN 96.03 95.55 93.38 95.55 97.77
SVM 92.32 66.66 78.3 91.11 90.08
LDA 89.94 75.55 68.78 97.77 96.01
QDA 93.38 80 69.04 95.2 86.67
DT 96.03 75.55 76.19 97.77 96.77
Table 5. Performance of various classifiers in terms of sensitivity forK-fold.
Sensitivity
Classifier F4 F1 F7 F4+F1 F4+F1+F7
KNN 100 92.53 98.01 100 100
SVM 100 100 100 100 100
LDA 100 100 100 100 100
QDA 100 100 100 100 71.66
DT 100 67.86 100 100 100
Table 6. Performance of various classifiers in terms of sensitivity forK-fold.
Specificity
Classifier F4 F1 F7 F4+F1 F4+F1+F7
KNN 95.14 95.89 86.87 97.77 96
SVM 91.53 88.83 71.02 97.77 96
LDA 87.64 70.04 70.8 97.77 96
QDA 91.48 70.25 69.64 92 96
DT 95.14 85.85 74.06 97.77 96
Figure 18. Comparison of accuracy of various classifiers for K-fold.
Table 7. Performance of various classifiers in terms of accurcay forLeave-one-out.
Accuracy
Classifier F4 F1 F7 F4+F1 F4+F1+F7
KNN 96.29 92.59 92.32 96.29 96.56
SVM 93.38 75.39 72.75 92.59 92.85
LDA 87.56 74.33 74.33 97.35 97.08
QDA 93.38 78.57 70.37 96.03 90.74
DT 96.2 84.12 71.42 97.35 97.08
Table 8. Performance of various classifiers in terms of sensitivity forLeave-one-out.
Sensitivity
Classifier F4 F1 F7 F4+F1 F4+F1+F7
KNN 100 96.62 98.09 100 98.41
SVM 100 100 100 100 100
LDA 100 100 100 100 100
Pulse based sensor design for wrist pulse signal analysis and health diagnosis
Biomed Res- India 2017 Volume 28 Issue 12 5193

QDA 100 100 100 100 88.61
DT 100 100 63.65 100 100
Table 9. Performance of various classifiers in terms of sensitivity forLeave-one-out.
Specificity
Classifier F4 F1 F7 F4+F1 F4+F1+F7
KNN 94.19 90.3 91.21 96.85 95.79
SVM 90.7 81.94 71.47 95.46 91.91
LDA 83.34 65.13 71.78 96.46 95.58
QDA 90.57 65.1 71.39 97.85 94.09
DT 94.19 82.18 78.9 96.8 95.79
Figure 19. Comparison of accuracy of various classifiers for Leave-one-out.
Table 7-9 shows the performance of various classifiers in termsof accuracy, sensitivity and specificity for Leave-one-out crossvalidation. Similar results were found with Leave-one-out asthat of K-fold cross validation.
t-Test paired two sample for means (P (T ≤ t) one -tail) for bothK-fold and leave-one-out was performed in order to furthervalidate the results as it compares two dependent sets of testdata and helps to determine if the means are different fromeach other. In the present study, value of P (T ≤ 0.05) wascalculated between different combinations of features. It wasfound that values coloured grey in Tables 10 and 11 were lessthan 0.05 and hence were different from each other. F4, F1 andF7 were different while their combination of features withrespect to individual feature was not found to be different.Hence F4 plays the role of most significant feature (Figure 19).
Table 10. T-Test paired two sample for means(P(T<=t) one -tail) for K–fold.
F4 F1 F7 F4+F1 F4+F1+F7
F4 - 0.012 0.0063 0.144 0.48
F1 0.012 - 0.355 0.009 0.013
F7 0.0063 0.355 - 0.009 0.006
F4+F1 0.144 0.009 0.009 - 0.158
F4+F1+F7 0.48 0.013 0.006 0.158 -
Table 11. t-Test paired two sample for means(P(T<=t) one -tail) forLeave-one-out.
F4 F1 F7 F4+F1 F4+F1+F7
F4 - 0.003 0.005 0.124 0.25
F1 0.003 - 0.063 0.0048 0.005
F7 0.005 0.063 - 0.0042 0.0037
F4+F1 0.124 0.0048 0.0042 - 0.187
F4+F1+F7 0.25 0.005 0.0037 0.187 -
ConclusionWrist Pulse signals present an interesting solution for diagnoseof healthy and unhealthy subjects based on non-invasivemethod of pulse diagnosis with the help of wrist pulseacquisition system. Piezoresistive sensor, MPXM2053D gavethe satisfactory pulse waveform and provided wrist pulsesignal. Band energy ratio provided information about energy ofsignal in 0-30 Hz band. After performing ANOVA statisticalanalysis on different features, it is concluded that F4, that is3Hz to 12 Hz is best suited frequency band to distinguishbetween healthy and unhealthy subject. Also the comparativestudy performed by various classifiers for K- fold and leave-one-out validation approach provides accuracy range forclassifier design achieving maximum accuracy of 96.29% withKNN. Further t- test provides information and validation of thedifference in significant features. The design of wrist pulseacquisition system and knowledge of significant band offrequency as done in this paper will act as helping tool for theresearchers in understanding wrist pulse signal.
AcknowledgementThe authors express their thanks to Dr. B.P Kaushik and Dr.N.K. Sharma of Government Ayurvedic College and Hospital,Patiala for providing useful information to carry out thisresearch work. This research work has been carried out inBiomedical Research Lab at Thapar University, Patiala,Punjab.
References1. Frawley D. The Biological Humors, The Dynamics of the
Life-Force. Ayurvedic Healing: A Comprehensive Guide.Lotus Press, New Delhi, 2000.
2. Murthy KRS. Examination of Pulse. Sarngadhara- Samhita:A Treatise on Ayurveda. Chaukhamba Orientalia, NewDelhi, 1997.
3. Wang P, Zuo W, Zhang D. A Compound Pressure SignalAcquisition System for Multichannel Wrist Pulse SignalAnalysis. IEEE Transact Instrument Measurement 2014;63: 1556-1565.
Goyal/Agarwal
5194 Biomed Res- India 2017 Volume 28 Issue 12

4. Kalange AE, Mahale BP, Aghav ST, Gangal SA. NadiParikshan Yantra and Analysis of Radial Pulse. 1stInternational Symposium on Physics and Technology ofSensors, Pune, 2012.
5. Roopini N, Roopini MS, Shridhar D. Design &Development of a System for Nadi Pariksha. Int J Eng ResTechnol 2015; 4: 465-470.
6. Begum MS. Nadi Aridhal: A Pulse Based AutomatedDiagnostic System. 3rd International Conference onElectronics Computer Technology, Kanyakumari, India,2011.
7. Kalange AE, Mahale BP, Aghav ST, Gangal SA. NadiParikshan Yantra and Analysis of Radial Pulse. 1stInternational Symposium on Physics and Technology ofSensors, Pune, 2012.
8. Sareen M, Kumar M, Santhosh J, Salhan A, Anand S. NadiYantra: a robust system design to capture the signals fromthe radial artery for assessment of the automatic nervoussystem non-invasively. J Biomed Sci Eng 2009; 2: 471-479.
9. Che X, Xu X, Sun J, Xu H. Research on Pulse PowerSpectrum calculation method based on TCM. IEEEInternational Conference on Communication Software andNetworks, Chengdu, 2015.
10. Thakker B, Vyas AL. Frequency Domain Analysis ofRadial Pulse in Abnormal Health Conditions. Proc IEEE-
EMBS Conference on Biomedical Engineering & SciencesIEEE Press, Kuala Lumpur, 2010.
11. Thakkar B, Vyas AL. Support Vector Machine forAbnormal Pulse Classification. Int J Comput Appl 2011;22: 13-19.
12. Baisware A, Joshi SN. Design of Non Invasive Pulse RateDetector using LabVIEW. Int J Emerg Trends Eng Technol2015; 3: 71-75.
13. http://www.nxp.com/assets/documents/data/en/data-sheets/MPXV2050.pdf
14. http://www.ti.com/lit/ds/symlink/ina128.pdf15. http://www.ni.com/pdf/manuals/376047a.pdf16. Thakkar S, Thakker B. Wrist Pulse Acquisition and
Recording System. Commun Appl Electron 2015; 1: 20-24.17. Parekh K, Thakker B. Wrist Pulse Classification System for
Healthy and Unhealthy Subjects. Int J Comput Appl 2015;124: 1-5.
*Correspondence toKrittika Goyal
Department of Electrical and Instrumental Engineering
Thapar University
India
Pulse based sensor design for wrist pulse signal analysis and health diagnosis
Biomed Res- India 2017 Volume 28 Issue 12 5195