biomethane market overview - october 2013
DESCRIPTION
ÂTRANSCRIPT

Biomethane Market Overview 10th October 2013
John Baldwin
Managing Director CNG Services Ltd
www.cngservices.co.uk
07831 241217

Biomethane Market Overview
1. CNG Services Ltd 2. Project Review 3. Market potenKal 4. Conclusions

CNG SERVICES LTD

CNG Services Ltd
• Supports projects to inject biomethane into the gas grid – Didcot, Adnams, Poundbury,
Vale Green, Stockport, Doncaster, Minworth
• Bio-‐CNG as a fuel for trucks – Own UK’s largest CNG filling
staKon – Sell Bio-‐CNG (20% biomethane) – SupporKng Qatar’s move to
CNG by 2022
We are independent from all makers of plant, vehicles, clean-‐up, compression....we help clients get the best soluKon for their projects

Our Biomethane Projects Team
• Biomethane Projects – Iain Ward, Lee Firth, Alison Cartwright, Terry Williamson, Rob
McKeon, Greg Lee • Pipelines and Compression Project
– Ian Roughley, Bob Ingmire, Mick Beddows (LTS), Phil Winnard, Tony Pym
• Commercial (RHI, NEA etc) – Peter Rayson
• Project Support – Angela Bagshaw, Chris Toase, ChrisKne Venables, Lauren Hamer
We support Biomethane Projects

PROJECT REVIEW

Didcot – UK’s First BtG Project
Biogas upgrader
Propane Storage Gas bag
Energy & quality Measurement
Propane Injector
Telemetry
H2S and
Siloxane filters
Flow of biogas -‐ 100 m3/hr First gas to grid on 3rd Oct 2010
Anaerobic
Digesters
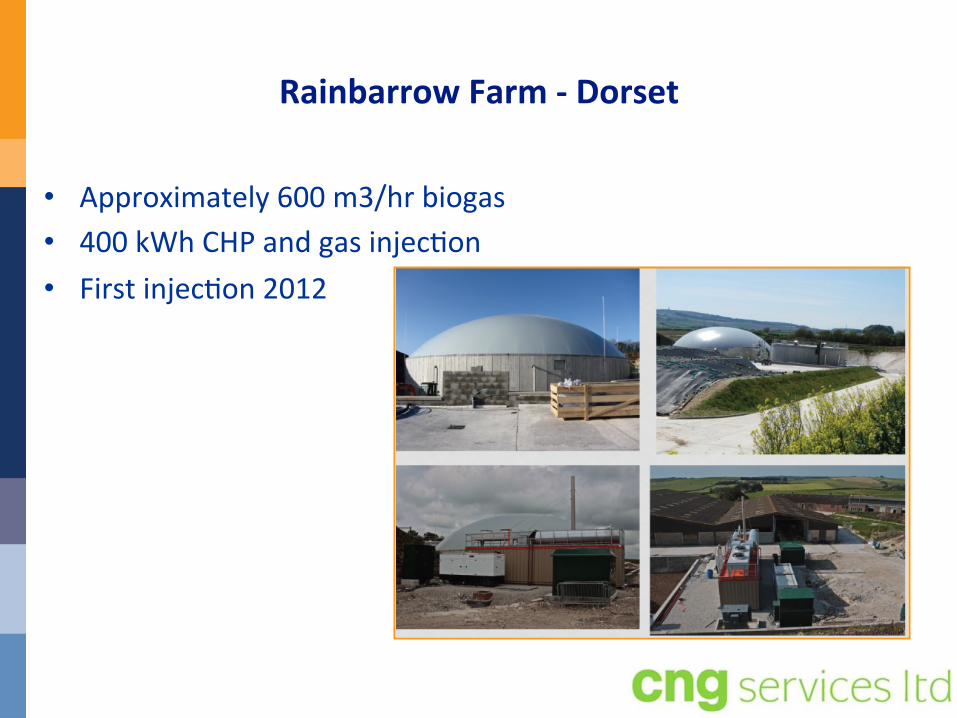
Rainbarrow Farm -‐ Dorset
• Approximately 600 m3/hr biogas • 400 kWh CHP and gas injecKon • First injecKon 2012

Springhill (Vale Green) near Evesham • Approximately 600 m3/hr biogas • 490 kWh CHP • Live from August 2013

Future Biogas -‐ Doncaster
• Agricultural • Approximately 900 m3/hr biogas to biomethane • 499 kWh CHP • Go live Q4 2013

BioCore -‐ Beccles
• Agricultural • Approximately 2,000 m3/hr biogas • Go live Q2 2014

Severn Trent Water -‐ Minworth
• Sewage derived biogas • Approximately 1200 m3/hr biogas • ExisKng 9 MWh CHP • Go live Q2 2014

ReFood -‐ Widnes
• Food waste • Approximately 2,000 m3/hr biogas • Go live 2014

MARKET FORECAST AND CONCLUSIONS

Annual Biomethane to Grid and RHI for 2012-‐2015
£0
£10,000,000
£20,000,000
£30,000,000
£40,000,000
£50,000,000
£60,000,000
£70,000,000
0.000 0.100 0.200 0.300 0.400 0.500 0.600 0.700 0.800 0.900 1.000
2012 2013 2014 2015
RHI
Total TW to
Grid
BtG and RHI Trend
2012 2013 2014 2015
Total Therms to Grid per annum 305,476 9,558,138 26,644,951 31,584,558
Total TW per annum 0.009 0.280 0.781 0.926
RHI per annum £632,335 £19,785,346 £55,155,049 £65,380,035

Feedstock Categories
Projects were also categorised according to sectors determined by the EU Green Gas Grids Project:
1. Sewage Sludge 2. Agricultural
a. Animal manure (slurry) b. Agricultural by-‐products and residues c. Crops for Energy d. Agricultural biomass is modelled as one sub-‐group as projects will oien contain
elements of all 3 streams
3. Industrial Food Processing waste 4. Food Waste (commercial, domesKc, local authority) 5. Biodegradable waste (e.g. from an MBT plant or garden waste collected by
local authority)

Percentage of Projects by Biogas Flow Rate
0 -‐ 400
400 -‐ 800
800 -‐ 1200
1200 +
0 5
10 15 20 25 30 35 40 45 50
0 -‐ 400 400 -‐ 800 800 -‐ 1200 1200 +
Biogas flow rate category (m3/hr)
Number of Projects by Biogas flow rate
scmh Biogas Number of Projects % 0 -‐ 400 15 20% 400 -‐ 800 45 61% 800 -‐ 1200 6 8% 1200 + 8 11% Total Projects 74
Projects by biogas flow-‐rate

Propor_on of Projects in Each Feedstock Category Propor_on of Projects in each Feedstock Category
Sewage Sludge
Agricultural
Food Waste
Industrial Food Processing
Biodegradable
GGG Feedstock Category Number projects in Category % Sewage Sludge 12 16% Agricultural 31 42% Food Waste 17 23% Industrial Food Processing 7 9% Biodegradable 7 9% Total Projects 74

Propor_on of Projects for Each Gas Distribu_on Network (GDN)
Number of Projects by GDN
NG SGN WWU NGN
LDZ Total Number of Projects % East of England 22 30% Wales and West 12 16% Southern 16 22% North England 8 11% West Midlands 4 5% North West 5 7% Scotland 6 8% North London 1 1% Total Projects 74

Biomethane to Grid Conclusions
• It has taken 6 years but the regime looks good: • Over 20 projects in next 18 months is possible, all technologies
• Majority of biomethane from waste feedstock • Need to focus on reducing capital costs • Green Gas CerKficates • CNG for trucks and buses and CHP/District HeaKng for new housing • REAL not for profit GGCS scheme is helping to facilitate biomethane projects
The biomethane market is set to grow, delivering significant benefits and helping meet 2020 renewable energy targets