bioprocesses controlled by ft-ir...
TRANSCRIPT

Bioprocesses controlled by FT-IR spectroscopy
Determination of recombinant protein and nutrients
FT-IR spectroscopy in combination with a microtiter plate reader module has enabled the quantification of important cell culture parameters like glucose, glutamine, lactate, ammonium as well as the recombinant product in a sample volume of 8µl. As all these cell culture parameters have been determined by only one analysis method, it represents a decisive time advantage over other analytical techniques. Hence, using a 96-well microtiter plate, important informa-tion for the bioprocess development can be obtained. These information contribute to a fast optimization of the process. In addition, the FT-IR measurement system with a coupling of automatic pipetting machine and microplate stacker is well-suited for high-throughput-screenings so that compre-hensive as well as time- and cost-saving screenings of the cell culture parameters can be performed.
AF # 400E
Table 1: Comparison of analysis methods for the quantification of important bioprocess parameters.
determined and interpreted right from the beginning. Conventional analysis methods, however, do not meet this requirement as the individual analyses and analysis methods require an enormous expenditure of time and personnel (see table 1). The ideal analysis method used for the process characterization should require less time and only a small amount of the substrate utilized. Moreover, the method should be cost efficient, include a wide range of possible parameters and allow for automation. All these requirements are met by spectroscopic sensors. If a suitable spectral range is selected, several substances can be measured simultaneously in a small volume. As the actual measurement system consists of solids and often no consumables are required, the spectroscopic sensors can be operated over a long time period and with minimum maintenance expenses [1]. A disadvantage of the conventional spectrometers, however, is the restriction to only one sample compartment which is not suitable for high-throughput-screenings. A promising solution to this problem is the combination of microtiter plate technology and Fourier Transformation Infrared (FT-IR) spectroscopy.
Cell culture experiments have been conducted with a stably transfected pCytTS cell line [2] which expresses a recombinant protein after the induction. All experiments have been carried out in serum-free cell culture media. At different times aliquots have been withdrawn from the liquid cell culture and the cells have been centrifuged off. From the supernatant of each sample, 8µl have been applied on three sample positions of a 96-well microtiter plate for IR-spectroscopic measurements. With regard to the sample positions, the IR microtiter plate looks alike the 96-well and 384-microtiter plates made of polypropylene or polystyrene, respectively. The IR microtiter plate (figure 1), however, is made of silicon (IR-transparent!) and has no cavities. Before analysing the samples on the microtiter plate, the samples have been dried (approx. 10 min, at room temperature), as otherwise the water would absorb too much IR-light. After drying the samples, the micro plate is inserted in the IR reader module HTS-XT (Bruker Optik GmbH, figure 1) connected to the FT-IR spectrometer TENSOR 27 (Bruker Optik GmbH). After
Materials and Methods
Introduction
The development of bioprocesses for the production of recombi-nant and therapeutically active proteins in cell cultures is an important time and expense factor in the 'time-to-market' balance. To reduce the development time and expenses for bioprocesses, all important process parameters should be
Life Science www.brukeroptics.com
Martin H. Rhiel, Cytos Biotechnology AG; Wagistraße 25; CH-8952 Zürich-SchlierenMatthias Boese, Bruker Optik GmbH; Rudolf-Plank-Str. 27; D-76275 Ettlingen
Figure 1

measurement, the multivariate evaluation of the spectra for the quantification of the different cell culture parameters and the recombinant protein has been performed using the OPUS QUANT software (Bruker Optik GmbH). The calibration model has been established using 18 samples. As reference method for the determination of the glucose, lactate, glutamine and ammonium concentrations the NOVA BioProfile 100 of the NOVA Biomedical (Laborsysteme Flükiger, Menzigen, Switzerland) has been used. To determine the product concentration, an ELISA (enzyme-linked immunosorbent assay) has been performed.
The culture medium used for the expansion of the cells contains, among other sub-stances, important nutrients which have to be optimized. Of particular importance are the substrates glucose and glutamine which have to be available in sufficient quantity during the growing process of the cell culture. Just as important for the process development are also the by-products of the glucose and glutamine metabolism, especially lactate and ammonium. All the substances mentioned above have characteristic IR-absorption spectra that represent the molecular vibrations [3].
The multivariate analysis enables the extraction of analyte-specific information from overlapping spectra. The calibration model has been established using the spectra of 18 samples acquired at different times during the growing process of the cell culture. On the basis of these IR-spectra, the concentrations of glucose, glutamine, lactate, ammonium as well as the recombi-nant product have been determined!
A comparison of the concentration values for glucose, glutamine, lactate and ammonium quantified by the spectra with the concentration values obtained by an established reference method shows a good match during the growing process of the cell culture [figure 2]. It is apparent that glucose and glutamine have been exhausted in the course of time while lactate and ammonium have accumulated. For the acquisition of each IR-spectrum a sample volume of only 8µl has been needed. Due to the small sample volume
Results and Discussion
required for spectroscopic analysis, the cells can be cultivated on a 96-well microplate (sample volume ca. 200µl) to work more cost-efficient. In contrast to this, the reference methods require a sample volume of 500µl each time, which makes cultivation on a 96-well mircoplate impossi-ble.
In addition to the important metabolite concentrations, also the recombinant product has been determined using the acquired IR-spectra. Figure 3 shows a typical product formation profile of the pCytTSTM expression system developed by Cytos Biotechnology AG. During the growth phase at a temperature of 37°C no product is expressed. At this temperature the system is 'closed' and the cells have optimal growth conditions. Lowering the temperature to 29°C induces the product formation and leads to an increase in the product concentration. The reference method for the quantification of the product concentration has been an ELISA specific to the recombinant protein. In figure 3 it is evident that the product concentrations determined on the basis of the IR spectra are very similar to the concentrations values determined using the ELISA.
[1] Rhiel, M. et al.: Biotech. Bioeng.77, 174-185 (2002)
[2] Boorsma, M. et al.: Nature Biotech18, 429-432 (2000)
[3] Rhiel, M. et al.: Anal. Chem.74, 5227-5236 (2002)
Bioprocess Analytics, FT-IR Spectroscopy, Parameter Screening
Literature
Keywords
Figure 3: Product formation progress of the pCytTS system before and after the induction.
Figure 2: Metabolite-profile during the batch-growth of a cell culture.
thinkforward
FT-NIR
USABruker Optics Inc+ 1 978 439 [email protected]
EuropeBruker Optik GmbH+ 49 7243 504 [email protected]
For more information contact us:
AsiaBruker Optics Asia Pacific Ltd.+ 852 2796 [email protected]
FT-NIR

FT-IR
AF # 402E
Bruker Optics now offers FT-IR spectroscopy solutions for effective species classifi-cation and identification of bacteria.
Infrared Spectroscopic BacterialIdentification System
www.brukeroptics.com
Experimental
Typically two platinum loops of bacteria or two colonies harvested from an agar plate provide sufficient material for the standard infrared analysis of bacteria based on film technology using the infrared microplate reader HTS-XT. The bacteria are grown overnight on agar plates and then trans-ferred into a small volume of water. From these suspensions only a small aliquot is taken and prepared on reusable microplates designed in the standard 96 or 384 well microplate format. The samples are then dried in a desiccator until films have formed on the microplate. The automatic measurement and evaluation of these films is done by a userfriendly software. Applying this procedure several hundred samples can be measured and analyzed every day.
methods often applied are cellular fatty acid analysis, protein profiling, PCR and 16S rRNA gene sequencing, total DNA G+C content, high-resolution gas/liquid chromatography, and microscopy to determine cell morphology due to different shapes and appearances. All of the methods mentioned above have in common that they use only a specific marker of the bacteria for classification. In contrast, FT-IR spectroscopy detects all biomolecules present in a bacterial cell simultaneously, since almost every biomolecules absorbs infrared radiation. The resulting spectral information from this interaction between infrared radiation and biomolecules reflects all cellular compo-nents and can thereby be utilized as a nearly complete phenotypical description of the bacteria analyzed. This note illustrates the capabilities of FT-IR spectros-copy in the field of bacterial identification and demonstrates the simplicity of its application.
+
+
+
+
+
+
+
Easy to handle and to apply
Fast identification of bacteria based on reference databases
Effective classification of strains wit-hin species
Simple sample preparation
Easy system maintenance
Phenotypical classification
Strain control in culture collection fa-cilities
There exist many different analysis techniques for bacterial classification and identification, however, many of those are based on specific biochemical that need to be extracted, modified and recognized. Most commonly applied are test systems that describe the properties and enzyme activities of bacteria (bile solubility, catalase, coagulase, DNase, motility, toxins, optochin, streptex, oxidase, Gram stain, Ziehl Neelsen stain, spores, cap-sules, fermentation abilities, etc.). Other
Reusable sample plates ensure cost-effectiveness. No consumables and reagents required.
The powerful and userfriendly OPUS-Lab software for the automatic measurement and evaluation of the bacteria.
Infrared technology applied on bacteria, filamentous fungi and yeasts has no limitations typical for assay methods.
The microplate reader HTS-XT measures different plates in the standard microplate format.
Escherichia
Bacillus
Synechococcus
Chloroflexus
Thermotoga
Pyrodictium
Thermoproteus
ThermococcusMethanococcus
Methanobacterium
Methanomicrobium
Halobacterium
Homa
Zoa
SaccharomycesParamecium
Trypanosoma
Vairmorpha
Bacteria
Crenarchaeota
Euryarchaeota
Archaea
Eucarya
thinkforward
FT-NIR
USABruker Optics Inc+ 1 978 [email protected]
EuropeBruker Optik GmbH+ 49 7243 [email protected]
For more information contact us:
AsiaBruker Optics Asia Pacific Ltd.+ 852 [email protected]
FT-NIR
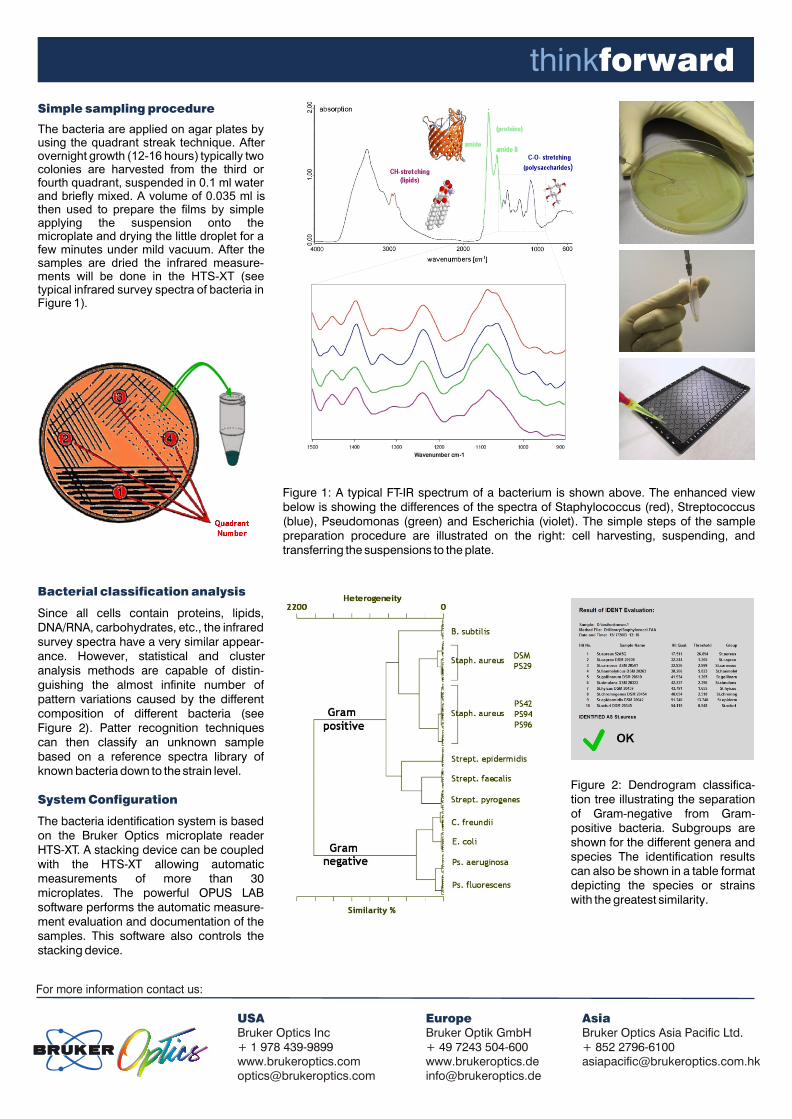
Simple sampling procedure
The bacteria are applied on agar plates by using the quadrant streak technique. After overnight growth (12-16 hours) typically two colonies are harvested from the third or fourth quadrant, suspended in 0.1 ml water and briefly mixed. A volume of 0.035 ml is then used to prepare the films by simple applying the suspension onto the microplate and drying the little droplet for a few minutes under mild vacuum. After the samples are dried the infrared measure-ments will be done in the HTS-XT (see typical infrared survey spectra of bacteria in Figure 1).
Bacterial classification analysis
System Configuration
Since all cells contain proteins, lipids, DNA/RNA, carbohydrates, etc., the infrared survey spectra have a very similar appear-ance. However, statistical and cluster analysis methods are capable of distin-guishing the almost infinite number of pattern variations caused by the different composition of different bacteria (see Figure 2). Patter recognition techniques can then classify an unknown sample based on a reference spectra library of known bacteria down to the strain level.
The bacteria identification system is based on the Bruker Optics microplate reader HTS-XT. A stacking device can be coupled with the HTS-XT allowing automatic measurements of more than 30 microplates. The powerful OPUS LAB software performs the automatic measure-ment evaluation and documentation of the samples. This software also controls the stacking device.
Figure 2: Dendrogram classifica-tion tree illustrating the separation of Gram-negative from Gram-positive bacteria. Subgroups are shown for the different genera and species The identification results can also be shown in a table format depicting the species or strains with the greatest similarity.
Figure 1: A typical FT-IR spectrum of a bacterium is shown above. The enhanced view below is showing the differences of the spectra of Staphylococcus (red), Streptococcus (blue), Pseudomonas (green) and Escherichia (violet). The simple steps of the sample preparation procedure are illustrated on the right: cell harvesting, suspending, and transferring the suspensions to the plate.

Bruker Optics
Application Note AN # 405E
Infrared Spectroscopic Bacterial Spore Detection
The formation of endospores is one of the most effective survival strategies that have been discovered by microor-ganisms over eons. Vegetative cells start dividing asymmet-rically after receiving a trigger pulse whereby the smaller part of the cell develops into forespore. The final endospore body is build of a special protective coating (the cortex) and contains a high concentration of calcium-dipicolinate as well as a low quantity of water providing a chemical environment that guaranties survival under extreme conditions. Mainly two genera of Gram-positive bacteria have perfected the mechanism of spore formation under unfavorable growth conditions: Bacillus and Clostridium. Genetic profiling using PCR techniques is commonly applied to identify charac-teristic DNA fragments from genes encoding a sporulation function in spore forming bacteria.
Microscopic methods are also among the most often used detection and analysis tools ranging from classifications of visibly altered cell shapes to specific spore fluorescence.
FT-IR spectroscopy does not only provide an easy and fast detection capability of spores and spore-formation, it also allows the classification of bacterial strains involved based on the infrared spectral profiles of the cells. This technique can be applied to spores, bacteria, and spore-containing bacteria as well as to their microcolonies. In cases where spores have been ‘weaponized’, FT-IR spectroscopy can easily identify the matrix used for this process such as clays or silica powders. This note illustrates the capabilities of FT-IR spectroscopy in the field of spore analysis.
ExperimentalTwo platinum loops of bacteria or two colonies harvested from an agar plate provide sufficient material for the stan-dard infrared analysis of bacteria based on film technology using the microplate reader HTS-XT.
Optionally very small quantities of dried material (such as spores or stored powders of bacteria) can either be placed on a dedicated sample holder based on ATR design or under an infrared microscope.
Qualitative analysisThe significant chemical alteration in bacterial cells during spore formation is the production of high quantities of dip-icolinic acid. This spore protective substance has a unique vibrational signature, which can easily be identified in the infrared spectra of bacteria. Marker bands allow the moni-
gEasy to handle and to applygFast identification of spore formationgEffective classification of sporeforming strainsgSimple sample preparationgEasy system maintenancegMarker bands of dipicolinic acid quantifiable

Figure 2: Dendrogram representation of the classification of Bacillus and Clostridium strains under conditions preventing and causing sporulation. The classification allows the separation of the two genera, however, during the sporulation process the dominance of dipicolinic acid can be used to roughly quantify the state of the spore development. On the right a typical infrared spectrum is shown il-lustrating the biochemical differences between Clostridium with and without spore. The background images display the different types of spore formation - terminal, central and sub-terminal.
toring of the sporulation process (see Figure 1). During the formation of a spore inside the bacterium the concentration of dipicolinic acid increases over time, which can be seen in the infrared spectra of the intact bacteria. Multivariate statistics and/or cluster analysis can qualify the alterations that occur during the process of sporulation (see Figure 2). If the is no spore present the infrared spectra can be utilized to identify the bacterial species or strain. In case the onset of sporulation has already occurred, a classification of the infrared spectra can provide a more quantitative picture. Infrared spectra of bacteria with lower and higher spore con-tent can be identified. Even dried cell material or spores can be investigated, since the infrared technology can obtain chemical information from freeze-dried powders.
Quantitative analysisThe sporulation process can also be monitored and quanti-fied by simply following the relative intensities of the marker bands for dipicolinic acid. In liquid cultures aliquots can be obtained in time intervals and investigated for sporulation. It is also possible to test sensitivity of the bacteria towards external triggers in similar environments. Substances known to act as inhibitors of the spore forming process, can be tested and a reaction of the bacteria directly be observed due to the infrared detection of the chemical alteration in the cells.
System ConfigurationThe bacteria identification system is based on the Bruker Optics microplate reader HTS-XT. A stacking device can be coupled with the HTS-XT allowing automatic measurements of more than 30 microplates. The powerful OPUS LAB soft-ware performs the automatic measurement, evaluation and documentation of the spectra. This software also controls the stacking device.
Figure 1: FT-IR survey spectra of Bacillus (blue) and Clostridium (green) without and during sporulation (red, orange). The enhanced view on the right illustrates the presence of marker bands for dip-icolinic acid in the infrared spectrum of the entire bacteria indicating spore formation.
www.brukeroptics. com Bruker Optik GmbH
Ettlingen · GermanyPhone +49 (7243) 504-600 Fax +49 (7243) 504-698 [email protected]
Bruker Optics Inc.
Billerica, MA · USAPhone +1 (978) 439-9899 Fax +1 (978) 663-9177 [email protected]
Bruker Optik Asia Pacific Ltd.
Hong KongPhone +852 2796-6100 Fax +852 2796-6109 [email protected]
Bruker Optics is continually improving its products and reserves the right to change specifications without notice. © 2007 Bruker Optics BOPT-071130

Bruker Optics
Application Note AN # 406E
Identification of Yeasts and Bacteria in Food Microbiology
GeneralMicroorganisms are not only essential for the production of food like dairy products, bread, beer and wine but they play also a major role in modern industrial processes such as the fermentation of enzymes, pigments, antioxidants etc. and increase the digestibility and stability of food. However microorganisms can cause serious problems in the produc-tion process like spoilage or even poisoning. An effective microbial quality management is essential for the safety of the product. The reliable identification of microorganisms allows to optimize production processes and to track down sources of contaminations.
MethodThe Fourier-Transform-Infrared (FT-IR)-Spectroscopy is already established as a fast and cost-efficient method in many areas of food analysis. Qualitative tests like the control of raw materials, as well as quantitative evaluation of complex compositions are possible using this technique. In the field of microbiology a FT-IR spectrum reveals a finger-print from microorganisms. Its pattern comprises the vibra-tional characters of the cell constituents as mainly proteins, lipids, DNA/RNA and carbohydrates (Fig. 1). Therefore a FT-IR spectrum is like a characteristic fingerprint from an organism. The high sensitivity and accuracy of the measure-ment facilitates microorganisms to be identified even on strain level.
Sample Preparation and MeasurementOnly a few hours of training are needed to master the sample preparation and only a few seconds to prepare each sample for the measurement.
The sample preparation consists of three steps. Pure cul-tures of microorganisms are grown typically for 24 h under standardized conditions. Some colonies are picked from the agar plate and suspended in distilled water. This suspen-sion is then loaded on special reusable microplates in the 96 or 384 well format (Fig. 2). In contrast to other methods
Fig. 1: Typical FT-IR spectrum of a bacterium. Spectral ranges that are dominated by bands of certain cell constituents are indicated.

Fig. 4: For each identification result a hit list will be generated show-ing the species or strains with the greatest similarities.
no further time consuming cultivation step is necessary. After drying (ca. 15 minutes) the plate is inserted into the microplate reader HTS-XT. No reagents or consumables are required for the measurement. The data acquisition as well as the data evaluation and data reporting is performed automatically (Fig. 3). One sample is measured and identi-fied within about one minute. The microplates can be easily cleaned and reused very often. The identification results are summarized in a table format showing the identified strain or species as well as the hit quality. This value allows to judge the result easily (Fig. 4 and 5).
DatabasesThe quality of data bases is of fundamental importance for the reliable identification. The spectrum of each unknown microorganism is compared against all spectra from this data base. Therefore, a complete library has to cover all relevant species, but also the spectral variances of differ-ent strains from one species. This allows to identify micro-organisms even below species level. In the existing data bases of food-relevant microorganisms not only strains from
reference stocks are included but also microorganisms from different production sites. By adding samples from product specific habitats the method was further improved for its robustness and reliability. All microorganisms were identi-fied by reliable reference methods before adding them into the libraries.
The existing data bases were built up and validated by theTechnical University Munich, Zentralinstitut für Ernährungs- und Lebensmittel-forschung Weihenstephan (ZIEL, Munich, Germany), Department of Microbiology (Prof. Dr. Scherer).
They are used here for routine identification for several years. (Complete library list see Fig.6).
Results are documented in a convenient table format. The sys-tem software also allows to depict the similarities of spectra of different microorganisms graphically in form of a dendrogram.
Further applicationsIn food producing companies the analysis and character-ization of microbial populations is an important part of the quality management. The ease of use and its cost efficiency combined with quick and reliable results as well as the possibility to differentiate down to strain level makes the method an effective tool to monitor the house flora of any production plant. This specific house flora library may help for:
gTracking down routes of microbial contaminationsg Specific control of culturesgEarly recognition of changes in the floragImproved troubleshooting (detection of the source/
responsibilities of a contamination)gImproved hygiene monitoring
Fig. 3: The OPUS Lab software facilitates automatic measurement, data quality testing, data evaluation and data documentation.
Fig. 2: Sample plates are available in the standarized 96 and 384 well format. The plates are easy to clean and can be reused very often.
www.brukeroptics. com Bruker Optik GmbH
Ettlingen · GermanyPhone +49 (7243) 504-600 Fax +49 (7243) 504-698 [email protected]
Bruker Optics Inc.
Billerica, MA · USAPhone +1 (978) 439-9899 Fax +1 (978) 663-9177 [email protected]
Bruker Optik Asia Pacific Ltd.
Hong KongPhone +852 2796-6100 Fax +852 2796-6109 [email protected]
Bruker Optics is continually improving its products and reserves the right to change specifications without notice. © 2007 Bruker Optics BOPT-071130
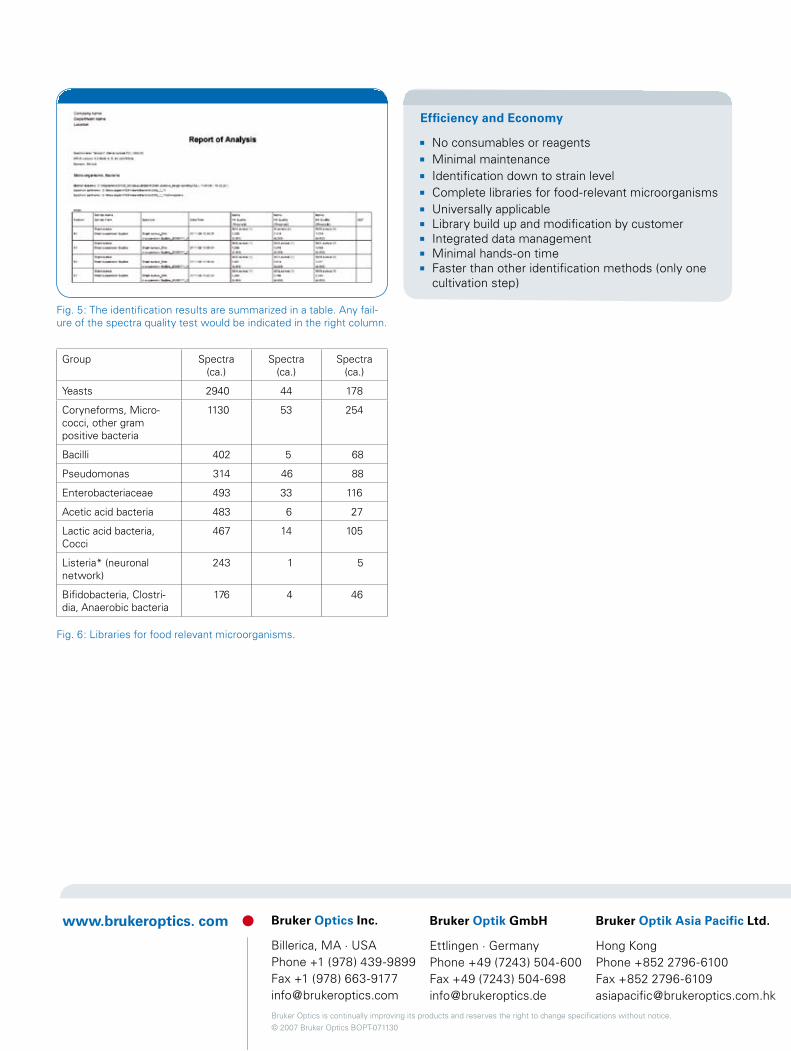
Efficiency and Economy
gNo consumables or reagentsgMinimal maintenancegIdentification down to strain levelgComplete libraries for food-relevant microorganismsgUniversally applicablegLibrary build up and modification by customergIntegrated data managementgMinimal hands-on timegFaster than other identification methods (only one
cultivation step)
Group Spectra (ca.)
Spectra (ca.)
Spectra (ca.)
Yeasts 2940 44 178
Coryneforms, Micro-cocci, other gram positive bacteria
1130 53 254
Bacilli 402 5 68
Pseudomonas 314 46 88
Enterobacteriaceae 493 33 116
Acetic acid bacteria 483 6 27
Lactic acid bacteria, Cocci
467 14 105
Listeria* (neuronal network)
243 1 5
Bifidobacteria, Clostri-dia, Anaerobic bacteria
176 4 46
Fig. 6: Libraries for food relevant microorganisms.
Fig. 5: The identification results are summarized in a table. Any fail-ure of the spectra quality test would be indicated in the right column.

Bruker Optics
Product Note B13-08/08
IR-SpectroscopicIdentification of Microorganisms I:Methodology
think forward FT-IR
Microbiology in today’s applied research and clinical environ-ments requires new methodologies that enable scientists and clinicians to identify microorganisms quickly and reli-ably. For example more and more bacteria found in patients in hospitals show resistance to many known antibiotics. A therapy with suitable antibiotics must be started as soon as possible, to prevent long-term treatment or worse outcome. FT-IR spectroscopy can provide rapid results for many kinds of microorganisms and allows identification at the species or even strain level by comparing unknown spectra with spectra of a reference library. This new methodology may enable clinicians to make quicker decisions for instance how a bacterial infection should be treated.
The ideaInfrared spectroscopy applied to microbiology takes ad-vantage of the fact that all biological molecules in cells can be excited to vibrate by absorbing infrared radiation. Since single bonds are exited in these molecules and all molecules vary in structure, a specific fingerprint-like absorption pattern (spectrum) can be obtained for each molecule. Although bacteria represent a very complex system of many different kinds of molecules, they vary significantly in structure, func-tion and composition. The principle of expressing specific spectral patterns, as known for single molecules, should also be valid for different types of bacteria. For this reason, the specific composition and presence of biomolecules in bacte-ria should generate specific spectral fingerprints, which can be used for classification and identification purposes.
The three challengesIn order to develop the methodology three major aspects of the technology have to be analyzed, assessed, developed and incorporated:
g Devising suitable growth conditions and a preparation procedure for many microorganisms;
g Development of optimal FT-IR measurement techniques for microorganisms;
g Establishing correct data evaluation procedures for the identification of microorganisms based on infrared spectra.
Solutions for all three aspects of the methodology were found and are introduced in the following sections:
1 - Sampling microorganismsSince many microorganisms grow very reproducibly on agar plates, the first step was to find the correct growth condi-tions. The simple and very common technique of growing cells on agar plates allows an easy sample preparation. For example, very reliable results were achieved with bacteria confluently grown on agar plates for 16-24 hours. The key for the success of the method was discovered to be the stan-dardization of the harvesting conditions and the consistency of bacterial growth on the agar plates. Modifications (for example liquid cultures and different cultivation time / tem-perature) are possible. However it has to be considered that all measurements of the microorganisms have to be made under the same conditions in order to achieve reliable results.

Typical spectrum of a microorganism
Reference database
2 - Measurement techniques of bacteriaIn infrared spectroscopy, many different sample preparation techniques exist, which are typically applied to chemicals; some are simple and others are more complex. The most suitable technique for the identification of microorganisms needs to be simple and very reproducible. Microbial cells create solid biofilms when a microbial cell suspension is slowly dried (e.g. at 40°C). The optimization of this effect led to a sample preparation procedure that is easy to use and could be perfected to the high reproducibility necessary for the infrared measurements. Infrared light penetrates the biofilm and is partially absorbed by the different molecules present in the cells, generating a specific chemical finger-print typical for each strain measured.
3 - Data evaluation proceduresAnalysis of the spectral information of each measured strain requires sophisticated mathematical algorithms for compari-son of complex fingerprint-like spectral patterns. Fortunate-ly, different regions in infrared spectra contain information on different functional groups, thus permitting the distinc-tion of different biomolecules by selecting regions repre-senting lipids, proteins and carbohydrates. The combination of many of those significant spectral regions can be used to construct a database of known bacterial strains. In order to classify and identify unknown bacteria, the spectral infor-mation is compared with the reference database of known bacteria. The result is presented as a “hit-list” showing the microorganisms whose spectral pattern match that of the unknown strain. Alternatively similarities of the spectra of different microorganisms can also be depicted graphically in form of a dendrogram.
General applicationMicrobial strains which are identified by reliable reference methods (e.g. 16S rRNA) are transferred onto the medium chosen for the reference database (such as endo, peptone, blood or McConkey) and grown under standardized conditions (for example 24 hours at 36 °C). Then, the cells are harvested from the agar plate and transferred to a water-containing Ep-pendorf tube. A certain amount of the suspension is placed on the infrared-transparent microplate and briefly dried. Multiple infrared measurements of the microbial films then guarantee that statistical variations are taken into account. Af-ter creating a small reference spectra database of the relevant microbial strains, identification of an unknown sample can already be performed by comparing the spectra with those in the database. With time, each measurement of known strains will increase the reference database and therefore the preci-sion of the determination within this specific database.
ReferencesHelm D, Labischinski H, Naumann D, J. Microbiol. Methods 14:127-142, 1991. Naumann D, Helm D, Labischinski H, Nature 351:81-82, 1991. Schultz C & Naumann D, FEBS Letters 294:43-46, 1991.Nau-mann D, Helm D, Schultz C, in: Bacterial Diversity and Systematics (eds. Priest FG, Ramos-Cormenzana A, Tindall BJ), Plenum Press, NY, p.67-85, 1994. Naumann D, Schultz CP, Helm D, in: Infrared Spec-troscopy of Molecules (eds. Mantsch HH, Chapman D), John Wiley & Sons, NY, p.279-310, 1996.
www.brukeroptics. com Bruker Optics
Dendogramm
Ident report
Fig.: General comparison of a spectrum of an unknown bacterial strain with a databaseIn the dendrogram the spectrum of the unknown bacterium is showing a high similarity to the Pseudomonas spectra. For identification the spectrum of the unknown bacteria can be compared against an existing library showing the similari-ties as hit values. The small values for the Hit Quality for the two Pseudomonas species confirms the identification as a Pseudomonas strain. The Hit Quality value for Pseudomo-nas fluorescens is below the Threshold Value for this group. This is indicating that the unknown strain belongs to the species Pseudomonas fluorescens. For further identification on the strain level, the unknown Pseudomonas strain should be compared with a reference database containing only spectra of Pseudomonas strains (sublibrary).

Bruker Optics
which are always present in colonies. For most clinically relevant strains, the optimal incubation time was observed to be 16-24 hours and the most common growth tempera-ture applicable to bacteria is 35 - 37°C. Sample material can be directly harvested from the middle of the cell lawn by using a calibrated 1mm diameter platinum loop.
Suspending the cellsIn order to create homogeneous biofilms, the cells are transferred and suspended in water. The suspension must be homogeneous in order to obtain a good homogeneity
Harvesting the colonies Suspending the microorganisms
Formation of the microbial films
Product Note B14-08/08
IR-SpectroscopicIdentification of Microorganisms II:Sample Preparation
think forward
The key to success in identifying microorganisms down to the strain level with FT-IR spectroscopy is the reproducibili-ty of the infrared measurement. The following three aspects are critical for the methodology:
g the growth conditionsg the correct preparation of the biofilmsg the appropriate measurement of the spectra
The standard procedures described in the following were tested on many different microorganisms guaranteeing excellent reproducibility for most measurements of microor-ganisms.
Growing bacteria on agar platesMicroorganisms are very sensitive to changes in growth conditions such as different media, temperatures, nutrients, changes in gas supply (oxygen or others), humidity and many others. These factors can induce changes in cell com-position and metabolism, which would be detected by the very sensitive infrared technique. The standardized proce-dure introduced here is based on growing microorganisms on agar plates. The cell material of a pure single colony is spread on the agar plate using a spatula to generate a con-fluent growth. This technique enables collection of cells in a very reproducible mixture of the different growth phases,
FT-IR

of the film. Normally, shaking the reaction vial is sufficient to suspend the bacteria, but in some cases the application of a Vortex or even a weak ultrasonic treatment is advised. For the final measurement, an aliquot of the suspension is transferred to a microplate and dried to a biofilm.
Creating bacterial biofilmsDrying complex biological material for infrared spectroscopy presents challenges that require empirical experimental testing of the preparation conditions necessary for high spectral quality. Once the technique has been established for a particular type of biofilm the standardization of the sampling procedure is simple. The previous two sections describe typical sampling conditions that successfully produce reproducible results (infrared spectra of microor-ganisms). However, the properties of the suspension and the preparation of the samples are also critical. The IR-transparent microplates contain 96 or 384 circular sampling positions, one of which always remains free for background measurements. The suspensions containing the bacteria are placed within the sampling region, covering the entire area by completely touching the edges. This guarantees that the biofilms will be created in a way that they cover the whole area defined for the measurement. The used sample volume as well as the homogeneity of the suspension and the concentration of the cells is important to create useful biofilms. Typically drying of the samples on the microplate is performed in a drying oven at 40°C.
Preparation artifacts can be introduced in many ways by not following the standard procedures, but can also eas-ily be recognized by visual or spectral inspection. Most commonly, the biofilms created do not cover the entire measurement area allowing the infrared beam to penetrate the sampling area without passing through the sample. This introduces spectroscopic artifacts into the measurements, thereby causing a bad reproducibility and problems with the identification. Films prepared from inhomogeneous cell suspensions or broken sample films due to excessive drying generate similar problems. Very concentrated suspensions may produce distortions in biofilms such as moon crater-like structures or hill formations in the center of the biofilm. The correct thickness as well as several other features of the quality of the film is checked in the spectrum quality test in the OPUS software.
In summary, if the procedures developed for a particu-lar type of microorganism are followed, the technique of measuring infrared spectra of microbial cells is simple and straightforward. In routine laboratories several 100 samples could easily be measured and analyzed every day.
www.brukeroptics. com Bruker Optics

FT-IR Spectrometers
TENSOR Series
Innovation with IntegrityF T-IR

Designed to provide
versatility and high
performance, TENSOR
series sets new standards
in FT-IR analysis, offering
multitude of automated
features and easy
operation.
Highest sensitivity with 24-bit dynamic range ADC
Robust and permanently aligned patented RockSolidTM interferometer, 10-year interferometer warranty
Sealed and desiccated optical bench
Near IR, Mid IR and Far IR spectral range
Largest sample compartment in its class for full sampling flexibility
Output beam port for advanced FT-IR analysis using external accessories
Rapid Scan kinetic measurements
Validation

Ready for Today & Tomorrow
TENSOR series incorporate an innova-tive instrument concept and high quality components, that results in superior performance today and tomorrow.
The TENSOR helps reduce cost and time per analysis and provides accurate and precise results for your daily quality control or research work.
Reliable Performance
The TENSOR series have a network of intelligent functions such as recognition of sampling accessories and optical com-ponents, automatic setup and verification of measurement parameters, to ensure easy and reliable analytical work with high sample throughput.
The TENSOR series are equipped with an Internal Validation Unit (IVU), an auto-mated filter wheel which houses tracable standards for instrument performance verification and validation. The software automatically evaluates the instrument performance and determines if the instru-ment is operating within specifications.
Optional system validation manual, is a complete resource even for the toughest validation and regulatory compliance. The qualification routines (IQ/OQ/PQ) meet ASTM, US-FDA, Japanese and European Pharmacopeia guidelines.
TENSOR Series FT-IR Spectrometers
analyze
verify
quantify
identify
Ok��

Commitment to quality
Engineered with unprecedented quality, our dedication to product excellence is a benefit we offer to all our customers.
Compare today’s FT-IR spectrometers and you’ll discover that often, you must sacrifice performance and features for affordability. We believe that quality optics and high performance should be available even in an instrument designed for routine use.
Highest Quality for Highest Performance
Digital Data Acquisition
The TENSOR utilizes fully digital electronics to ensure optimum interferometer control, highest sensitivity and long-term stability. Bruker‘s DigiTectTM detector system guar-antees low noise, making the TENSOR a powerful routine FT-IR spectrometer with the performance of a research spectrom-eter.
The data acquisition is based on unique dual-channel delta-sigma ADC’s with true 24-bit dynamic range which are integrated into the detector preampli-fier electronics. This technology allows outstanding signal-to-noise-ratio without any disturbing “spikes” results.
TENSOR with Platinum ATR Accessory
The Platinum ATR is a single reflection diamond ATR accessory that is designed to significantly ease your daily routine. The ergonomic one-finger clamp mechanism simplifies the infrared analysis of solid and liquid samples. The robust diamond crystal allows to analyze all kind of liquid and solid samples for near, mid- and far Infrared.

Why S/N is important?
The signal-to-noise ratio of an FT-IR spectrometer is the measure of performance for the time that is needed to accumulate a good IR spectrum. In FT-IR spectroscopy, multiple scans are accumulated to result in a final spectrum. The acquisition time that is needed depends on the sample and sampling technique, but it always depends on the performance of the FT-IR spectrometer. The better the signal-to-noise performance will result in shorter measurements. But due to statistical reasons the measurement time is proportional to the square of the noise ratio. In other words; if one wants to improve the S/N by a factor of 3, one has to measure 9 times longer. Compare the Bruker to other manufacturers’ FT-IRs, and you will find that TENSOR provides the most out of your infrared analysis.
The TENSOR Series offers an achievable signal-to- noise ratio of better than 8000:1 peak-to-peak using 5-second acquisition time conditions (Test 1) and better than 45,000 : 1 peak-to-peak using 1-minute measurement conditions (Test 2). Superior sensitivity faster and more accurate analysis allows you to get the most out of your infrared analysis using either internal or external accessories.
Better than 45,000:1 SNR = 9.7*10-6 Abs. noise
256 background scans 1 minute sample measurement (73 scans) 4cm-1 ResolutionBlackman-Harris ApodizationKBr beamsplitter, room temperature detector and
air-cooled MIR sourcePeak-to-Peak Noise from 2200 - 2100cm-1
Get the Most Out of Your Infrared Analysis
Cube Corner mirrors are immune to mirror tilt. By design incoming and reflected lightbeam are exactly parallel. This is the fundamental principle of Bruker Optics’ permanently aligned RockSolidTM interferometer.
High Performance Interferometer
Bruker has led the development for many of today’s most important FT-IR innovations and prides itself not only on a high level of customer support but also on technical achievements. The interferometer is the heart of an FT-IR spectrometer and is one of the main reasons for the superior per-formance of Bruker spectrometers. Cube corner interferometers are widely used for laboratory and process applications and have some unique characteristics. Unlike flat mirrors, cube corners are practically immune to mirror tilt (i.e. angular movement of the mirror). This is an important con-sideration since the light returning to the beamsplitter must be precisely recombined or a reduction in the stability, resolution, and spectral quality will occur. The RockSolidTM interferometer incorporates dual retro reflecting cube corner mirrors in an inverted double pendulum arrangement. A wear-free pivot mechanism is located at the center of mass. This patented design optically elimi-nates mirror tilt and mechanically prevents mirror shear. It is also resistant to vibration and thermal effects. The wear-free nature of the bearing in the RockSolidTM interfer-ometer ensures exceptional stability and reliability even in harsh environments. The high throughput design delivers the highest possible signal-to-noise ratio, resulting in the fastest and most accurate results pos-sible.

TENSOR System Design
Internal Accessories
The TENSOR has a large sample compartment to accommodate virtually any FT-IR sampling accessory from any vendor. Sampling accessories are mounted and pre-aligned on Bruker’s QuickLock baseplate for fast, easy and reproducible exchange. Immediately after the sampling accessory is inserted, it is automatically recognized by the IntelliSense coding. Existing commer-cial and custom made accessories can be retro-fit to the Automatic Accessory Recognition (AAR) system, includ-ing the firmware.
Extend your Sampling Capabilities
TENSOR with HYPERION Series FT-IR Microscope
Large sample compartment with QuickLock baseplate for easy exchange of sampling accessories
“Platinum ATR“ diamond ATR sampling accessory
TENSOR FT-IR Spectrometer
sealed 5 chamber design user exchangeable components large and flexible sample compartment optional external beam
Flexibility
The source and the detector of the TENSOR Series can easily can be exchanged by the operator. Necessary settings are adjusted automatically. Electronically coded sources, detectors, and beamsplitters are recognized by the instrument, and the experimental parameters are immediately reconfigured by Bruker Automatic Compo-nent Recognition (ACR) system.
External Accessories
Sampling capabilities of the TENSOR can be expanded by adding an optional external beam port. This allows the attachment of one or more external accessories. In addition, various sample changers are available to increase sample throughput.
HYPERION Series FT-IR Microscope HYPERION 3000 FT-IR Imaging System HTS-XT High Throughput Screening
eXTension IMAC Focal Plane Array Macro
Imaging Accessory TGA-coupling PMA 50 Polarization Modulation
Accessory for VCD and PM-IRRAS External sample compartment;
evacuable or purgeable Fiber optic coupling unit with MIR- or NIR-
fiber probes for solids and liquids External vacuum tight UHV-chamber
adaptation Integrating sphere Liquid auto samplers

Expandability
The TENSORTM 37 allows the user to easily exchange the optical components and convert the system into a powerful near infrared spectrometer and vice versa. The NIR capabilities of the TENSORTM 37 open up a new realm of sampling possibilities. NIR has several distinct differences from Mid-IR, especially useful for QA/QC analysis. Bands in the NIR are less intense than those in the Mid-IR, thus samples can be measured without dilution.
User exchangeable sources(MIR/FIR and NIR)
Automatic aperture wheel
Instrument status indicator
Internal Validation Unit (IVU)for automated OQ,PQ tests
Optional external beam forexternal accessories; microscope, TG-coupling, etc.
Sealed interferometer chamber
Patented RockSolidTM interferometer
Removable sample compartment cover
Exchangeable detectors with integrated 24-bit dynamic range electronics
User replaceable HeNe laser
User exchangeable and rechargeable desiccant (high capacity molecular sieve for water and CO2 reduction)
www.brukeroptics.com Bruker Optics Inc.
Billerica, MA · USAPhone +1 (978) 439-9899Fax +1 (978) [email protected]
Bruker Optik GmbH
Ettlingen · GermanyPhone +49 (7243) 504-2000 Fax +49 (7243) [email protected]
Bruker Hong Kong Ltd.
Hong KongPhone +852 2796-6100Fax +852 [email protected]
Bruker Optics is continually improving its products and reserves the right to change any specifications without notice. © 2011 Bruker Optics BOPT-4000075-01
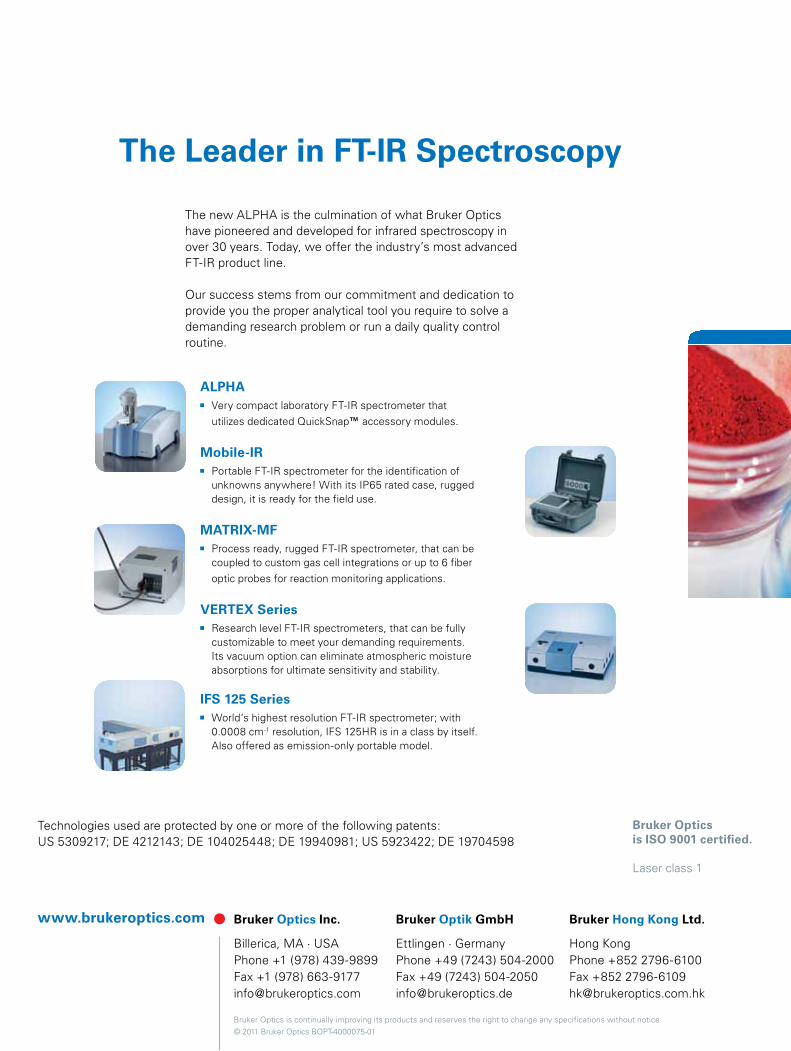
The Leader in FT-IR Spectroscopy
ALPHA Very compact laboratory FT-IR spectrometer that
utilizes dedicated QuickSnap™ accessory modules.
Mobile-IR Portable FT-IR spectrometer for the identification of
unknowns anywhere! With its IP65 rated case, rugged design, it is ready for the field use.
MATRIX-MF Process ready, rugged FT-IR spectrometer, that can be
coupled to custom gas cell integrations or up to 6 fiber optic probes for reaction monitoring applications.
VERTEX Series Research level FT-IR spectrometers, that can be fully
customizable to meet your demanding requirements. Its vacuum option can eliminate atmospheric moisture absorptions for ultimate sensitivity and stability.
IFS 125 Series World‘s highest resolution FT-IR spectrometer; with
0.0008 cm-1 resolution, IFS 125HR is in a class by itself. Also offered as emission-only portable model.
Technologies used are protected by one or more of the following patents:US 5309217; DE 4212143; DE 104025448; DE 19940981; US 5923422; DE 19704598
The new ALPHA is the culmination of what Bruker Optics have pioneered and developed for infrared spectroscopy in over 30 years. Today, we offer the industry’s most advanced FT-IR product line. Our success stems from our commitment and dedication to provide you the proper analytical tool you require to solve a demanding research problem or run a daily quality control routine.
Bruker Opticsis ISO 9001 certified.
Laser class 1