bioremediation of organophosphate contaminated
TRANSCRIPT

BIOREMEDIATION OF ORGANOPHOSPHATE
CONTAMINATED AGRICULTURAL SOILS
USING INDIGENOUS BACTERIA
By
Samina Ambreen
Fatima Jinnah Women University
Rawalpindi, Pakistan
2020
BIOREMEDIATION OF ORGANOPHOSPHATE
CONTAMINATED AGRICULTURAL SOILS USING
INDIGENOUS BACTERIA
By
Samina Ambreen
Registration No: 2014-Ph.D-Env.Sci-004
A dissertation submitted to the
Fatima Jinnah Women University
Rawalpindi.
In partial fulfilment of the requirement for THE DEGREE OF DOCTOR OF PHILOSOPHY IN
ENVIRONMENTAL SCIENCES
August 2020
Author’s Declaration
I Samina Ambreen, hereby state that my PhD thesis titled “Bioremediation of
Organophosphate contaminated agricultural soils using indigenous bacteria” is
my own work and has not been submitted previously by me for taking any degree
from Fatima Jinnah Women University, Rawalpindi, or anywhere else in the
country/world. At any time, if my statement is found to be incorrect even after my
graduate, the university has the right to withdraw my Ph.D degree.
Samina Ambreen
Reg. No: 2014-Ph.D-Env.Sci-004
Plagiarism Undertaking
I solemnly declare that research work presented in the thesis entitled
“Bioremediation of Organophosphate contaminated agricultural soils using
indigenous bacteria” is solely my research work with no significant contribution
from any other person. Small contribution/help wherever taken has been duly
acknowledged and that complete thesis has been written by me. I understand the zero
tolerance policy of the HEC and Fatima Jinnah Women University, Rawalpindi
towards plagiarism. Therefore, I as an Author of the above titled thesis declare that no
portion of my thesis has been plagiarized and any material used as reference is
properly referred/ cited.
I undertake that if I am found guilty of any formal plagiarism in the above titled thesis
at any time even after award of Ph.D degree, the university reserves the rights to
withdraw/revoke my Ph.D degree and that HEC and the university has the right to
publish my name on the HEC/university website on which names of students are
placed who submitted plagiarized thesis.
Student/Author Signature: _________________
Name: Samina Ambreen
CERTIFICATE
It is certified that this Ph.D dissertation entitled “Bioremediation of
Organophosphate contaminated agricultural soils using indigenous bacteria”
submitted by Samina Ambreen, Reg No: 2014-Ph.D-Env.Sci-004 is an original work
and has not been presented for a degree wholly or partially in any other university. All
sources, references and literature used or excerpted during elaboration of this work
are properly cited and mentioned the due source.
Prof. Dr. Azra Yasmin
Supervisor
Table of Contents
Contents Page No
List of Abbreviations and Acronyms i
List of Figures v
List of Tables xvi
Acknowledgements xix
Summary xx
Chapter 1: Introduction 1
1.1 Pesticides in Pakistan 3
1.2 Organophosphate pesticides 4
1.2.1 The toxicity of OP compounds and inhibition of Acetyl
Cholinestrase (AChE) 7
1.3 Chlorpyrifos (CPF) 9
1.3.1 Mode of Action 10
1.3.2 Acute toxicity of CPF to non-target organisms 10
1.3.3 Microbial Degradation of CPF 12
1.3.4 Metabolic products of CPF 13
1.4 Triazophos (TAP) 14
1.4.1 Biodegradation of TAP 15
1.4.2 Metabolites of Triazophos 16
1.5 Dimethoate (DM) 16
1.5.1 Toxicological effects of Dimethoate 17
1.5.2 Environmental fate of Dimethoate 18
1.5.3 Microbial degradation of DM 18
1.5.4 Metabolites of Dimethoate 20
1.6 Microbial organophosphate degrading enzymes 20
1.7 Modern Analytical methods for the analyses of Pesticides 22
1.8 Aims and Objectives 22
Chapter 2: Materials and Methods
2.1 Preparation of solutions and media
24
24
2.2 Sampling Site and Soil Sampling 32
2.3 Physicochemical Analysis of Soil 32
2.3.1 Measurement of the soil pH 32
2.3.2 Electrical Conductivity (EC) 32
2.3.3 Soil organic matter 33
2.3.4 Soil texture 33
2.3.5 Soil moisture Content 34
2.4 Isolation of bacteria from the soil samples 34
2.4.1 Colony Counting (CFU/ml) 35
2.4.2 Single colony streaking (bacterial culture purification) 35
2.5 Screening for OP pesticide tolerance 35
2.6 Screening for 3, 5, 6-Trichloropyridinol (TCP) tolerance 35
2.7 Morphological characterization of OP pesticide degrading
bacterial isolates
36
2.7.1 Colony morphology 36
2.7.2 Cell morphology 36
2.7.2.1 Gram’s staining 36
2.7.2.2 Capsule staining 37
2.7.2.3 Spore staining 37
2.7.2.4 Motility test 38
2.8 Biochemical characterization 38
2.8.1 Oxidation Fermentation Test 38
2.8.2 Oxidase Test 39
2.8.3 Catalase Test 40
2.8.4 Other biochemical/enzyme Tests 40
2.9 Physiological Characterization 41
2.9.1 pH Optimization for Bacterial Growth 41
2.9.2 Effect of temperature on the growth of bacterial isolates 41
2.10 Heavy Metal Resistance Profile 42
2.11 Tolerance against different organic pollutants 43
2.12 Bacterial Inoculum and Consortium Preparation 43
2.13 Analysis of OP pesticide degradation using UV-VIS
Spectrophotometer
44
2.14 Qualitative and Quantitative Analysis for OP pesticide
degradation using GC-MS and HPLC
44
2.14.1 Extraction of pesticide residues from M-9 Culture Broth 44
2.14.2 Extraction of Trichloropyridinol (TCP) residues from M-
9 Culture Broth
45
2.14.3 Extraction from soil slurry for OP pesticide degradation
analysis
46
2.14.4 Extraction from soil microcosm for OP pesticide
degradation analysis
46
2.14.5 GC-MS conditions used for the analyses of CPF, TCP,
TAP and DM biotransformation
47
2.14.6 HPLC conditions used for the analyses of CPF, TCP,
TAP and DM degradation
47
2.15 Optimization for OP pesticide biodegradation 49
2.15.1 pH Optimization for OP pesticide biodegradation 49
2.15.2 Temperature Optimization for OP pesticide
biodegradation
50
2.15.3 Effect of Shaking and Static conditions for OP pesticide
biodegradation
50
2.16 Molecular Studies 50
2.16.1 DNA Extraction 50
2.16.2 Polymerase Chain Reaction (PCR) 51
2.16.3 Gel Electrophoresis 51
2.16.4. Reagents for DNA Extraction 52
2.17 Enzyme studies for Organophosphorus phosphatase (OPP)
Enzyme
53
2.17.1 Screening for phosphate Solubilization potential of
bacterial isolates
53
2.17.2 Screening of Extracellular Organophosphorus
phosphatase (OPP) and Enzyme Assay
54
2.17.3 Screening of intracellular Organophosphorus
phosphatase (OPP)
55
2.17.4 Factors effecting the production of Organophosphorus
phosphatase (OPP) Enzyme
55
2.17.4a Effect of pH on OPP production 55
2.17.4b Effect of temperature on Organophosphorus
phosphatase (OPP) production
56
2.17.4c Effect of incubation time on Organophosphorus
phosphatase (OPP) enzyme production
56
2.17.5 Factors affecting Organophosphorus phosphatase
enzyme Activity
56
2.17.5a Effect of temperature on Organophosphorus
phosphatase enzyme Activity
56
2.17.5b Effect of chemicals on Organophosphorus
phosphatase enzyme Activity
56
2.17.5c Effect of metals on Organophosphorus phosphatase
enzyme Activity
57
2.17.5d Effect of Substrate concentration on
Organophosphorus phosphatase enzyme Activity
57
2.17.5e Effect of incubation period on Organophosphorus
phosphatase enzyme Activity
57
2.17.6 Metal bioprecipitation by Organophosphorus phosphatase
enzyme
57
2.17.7 Substrate specificity determination of Organophosphorus
phosphatase enzyme against OP pesticides (CPF, TAP and DM)
58
RESULTS Chapter 3: Isolation, characterization and screening
of organophosphate degrading soil bacterial isolates
59
3.1 Soil Sampling and Physical and Chemical properties of Soil 61
3.2 Isolation and purification of soil bacteria 62
3.3 Screening experiments against OP pesticides (Chlorpyrifos,
Triazophos and Dimethoate
62
3.3.1 Screening against Chlorpyrifos 63
3.3.2 Screening against Triazophos 63
3.3.3 Screening against Dimethoate 63
3.2.4 Screening experiments with Trichloropyridinol (TCP)
(Major metabolite of CPF)
64
3.2 Morphological characterization of OP degrading bacterial
isolates
65
3.3 Biochemical characterization 66
3.4 Physiological characterization 68
3.4.1 Screening Experiments against Heavy metals 68
3.4.2 Screening Experiments against other Organic Pollutants 68
3.4.3 Effect of pH on the growth of bacterial isolates 68
3.4.4 Temperature optimization for the growth of bacterial
isolates
69
3.5 Quantitative analysis of Chlorpyrifos degradation by bacterial
isolates
70
3.6 Genetic Analyses 73
3.6.1 Extraction of genomic DNA 73
3.6.2 PCR 73
3.6.3 Bacterial strain Identification 73
Chapter 4: Bacterial degradation/transformation of
Chlorpyrifos and its metabolite 3, 5, 6-Trichloropyridinol
76
4.1 Optimization of environmental parameters (pH, temperature,
shaking and static incubation conditions) for CPF degradation
78
4.1.1 Growth pattern and optimization for CPF degradation at
different pHs by bacterial isolates and their consortia
78
4.1.2 Effect of temperature on growth and CPF degradation by
bacterial isolates and their consortia
80
4.1.3 Effect of shaking versus static conditions on growth and
CPF degradation by four isolates (MB490, MB497, MB498 and
MB504) and seven consortia (A, B, C, D, E, F, and G) after 24hrs of
incubation
82
4.1.4 Biotransformation and degradation of Chlorpyrifos in the
presence of TAP
83
4.2 Degradation of Chlorpyrifos by the bacterial isolates and their
consortia in M-9 broth
85
4.3 Degradation of Chlorpyrifos (CPF) by the bacterial isolates and
their consortia in the soil slurry
88
4.4 Degradation of Chlorpyrifos (CPF) by the 4 isolates and the 7
consortia in the soil microcosm
91

4.5 Degradation and transformation experiments with 3, 5, 6-
trichloropyridinol (TCP)
94
4.5.1 Effect of incubation period and concentration of TCP on
the growth (OD600) and degradation of Trichloropyridinol (TCP)
by the 4 isolates in the bacterial culture broth
94
4.6 Quantitative analysis through HPLC to determine
biodegradation of Chlorpyrifos (CPF) and its metabolite 3, 5, 6-
Trichloropyridinol (TCP)
97
4.6.1 Effect of pH on CPF degradation by isolates and
consortia
97-108
4.6.2 Effect of temperature on CPF degradation by isolates and
consortia
108-119
4.6.3 Degradation of 3, 5, 6-Trichloropyridinol (14mg/l) by
four isolates after 72hrs incubation
119
4.7 Qualitative analysis through GCMS to detect metabolites of
Chlorpyrifos (CPF) by the 4 isolates and their consortia in the M-9
broth, soil slurry and soil microcosm
121
4.8 Biotransformation of 3, 5, 6 Trichloropyridinol (TCP) by the 4
bacterial isolates in M-9 broth as analyzed by GCMS
128
4.9 Proposed pathway for 3, 5, 6-Trichloropyridinol (TCP)
degradation by bacterial isolates (MB490, MB497, MB498 and
MB504)
131
4.10 Proposed metabolic pathway of Chlorpyrifos degradation by
bacterial isolates (MB490, MB497, MB498 and MB504) and their
consortia A, B, C, D, E, F and G
132
Chapter 5: Bacterial degradation and transformation of
Triazophos (TAP)
135
5.1 Optimization of environmental parameters for TAP
biodegradation
137
5.2 Bacterial growth/ degradation of TAP in the presence of
Chlorpyrifos
140
5.3 Effect of incubation period on bacterial growth and %
degradation of TAP in M-9 medium
141
5.4 Degradation of Triazophos by the bacterial isolates and their
consortia in soil slurry
143
5.5 Degradation of Triazophos by bacterial strains and their
consortia in the soil microcosm
145
5.6 Quantitative analysis through HPLC for biodegradation of TAP 147
5.6.1 Effect of pH on TAP degradation 147-158
5.6.2 Effect of temperature on TAP degradation 158-169
5.7 Qualitative analysis through GCMS to detect metabolites of OP
Pesticide Triazophos (TAP) by bacterial isolates and their consortia
in M-9 broth, soil slurry and soil microcosm
169
5.8 Proposed Metabolic Pathway for the biotransformation of TAP
by bacterial isolates MB490, MB497, MB498 and MB504
174
Chapter 6:
Biodegradation and biotransformation of OP pesticide
Dimethoate (DM)
178
6.1 Optimization of environmental conditions for Dimethoate
biodegradation
179
6.2 Effect of incubation period on bacterial growth and %
degradation of DM in M-9 broth
183
6.3 Effect of incubation period on bacterial growth and %
degradation of DM in the soil slurry
186
6.4 Effect of incubation period on bacterial growth and %
degradation of DM in the soil microcosm
187
6.5 Quantitative analysis through HPLC for Dimethoate
biodegradation
189
6.5.1 Effect of pH on DM degradation 189-193
6.5.2 Effect of temperature on DM degradation
6.5.3 DM degradation in soil microcosm by four isolate after 9
days of incubation
193-197
197
6.6 Qualitative analysis through GCMS to detect metabolites of
Dimethoate (DM) by the 4 isolates and their consortia in the M-9
broth, soil slurry and soil microcosm
199

6.7 Proposed Metabolic Pathway for the Transformation of
Dimethoate by Bacteria
204
Chapter 7: Organophosphorus phosphatase (OPP) enzyme
studies
207
7.1 Screening for phosphate solubilization potential of bacterial
isolates
209
7.2 Screening of extracellular Organophosphorus phosphatase (OPP)
production in bacterial isolates (MB490, MB497, MB498 and
MB504)
210
7.3 Screening of intracellular Organophosphorus phosphatase (OPP)
in bacterial isolates (MB490, MB497, MB498 and MB504)
210
7.4 Factors affecting the production of extracellular
Organophosphorus Phosphatase (OPP)
7.4a Effect of pH on extracellular OPP production by bacterial
isolates (MB490, MB497, MB498 and MB504)
211
211
7.4b Effect of temperature on extracellular OPP production by
bacterial isolates (MB490, MB497, MB498 and MB504)
212
7.4c Effect of incubation time on OPP production by bacterial
isolates (MB490, MB497, MB498 and MB504)
213
7.5 Factors affecting Organophosphorus Phosphatase (OPP) Activity 214
7.5a Effect of temperature on OPP activity and stability 215
7.5b Effect of substrate (p-NPP) concentration on OPP activity 216
7.5c Effect of incubation time on OPP activity 218
7.6 Study of stimulatory or inhibitory effect of chemicals (SDS,
EDTA, metals) on OPP Activity
220
7.6.1 Effect of Sodium dodecyl sulphate (SDS) on OPP
Activity
220
7.6.2 Effect of EDTA on OPP Activity 223
7.6.3 Effect of metals on OPP Activity 225
7.7 Metal bioprecipitation by Organophosphorus Phosphatase (OPP) 227
7.7.1 Bioprecipitation of Nickel (Ni++) by OPP 228
7.7.2 Bioprecipitation of Manganese (Mn++) by OPP 229
7.7.3 Bioprecipitation of Chromium (Cr++) by OPP 231

7.7.4 Bioprecipitation of Cadmium (Cd++) by OPP 232
7.8 Substrate specificity of acidic and alkaline OPP for CPF, TAP
and DM
234
Chapter 8: Discussion 240
i
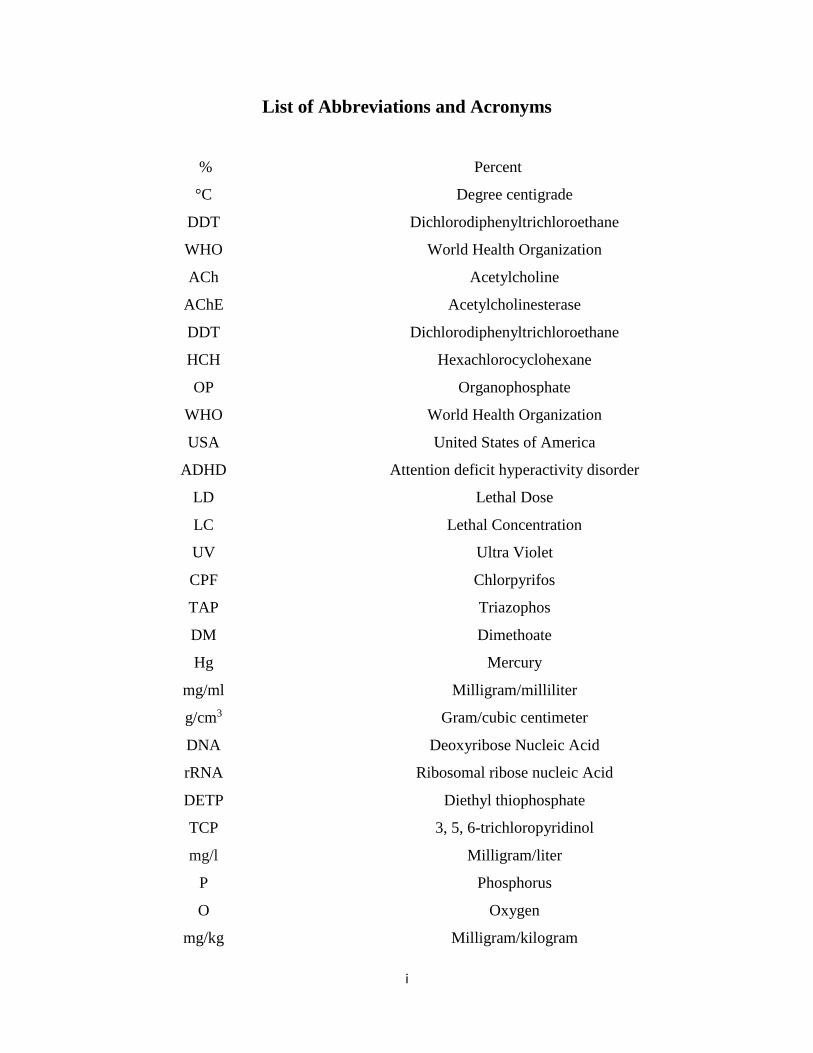
List of Abbreviations and Acronyms
% Percent
°C Degree centigrade
DDT Dichlorodiphenyltrichloroethane
WHO World Health Organization
ACh Acetylcholine
AChE Acetylcholinesterase
DDT Dichlorodiphenyltrichloroethane
HCH Hexachlorocyclohexane
OP Organophosphate
WHO World Health Organization
USA United States of America
ADHD Attention deficit hyperactivity disorder
LD Lethal Dose
LC Lethal Concentration
UV Ultra Violet
CPF Chlorpyrifos
TAP Triazophos
DM Dimethoate
Hg Mercury
mg/ml Milligram/milliliter
g/cm3 Gram/cubic centimeter
DNA Deoxyribose Nucleic Acid
rRNA Ribosomal ribose nucleic Acid
DETP Diethyl thiophosphate
TCP 3, 5, 6-trichloropyridinol
mg/l Milligram/liter
P Phosphorus
O Oxygen
mg/kg Milligram/kilogram
ii
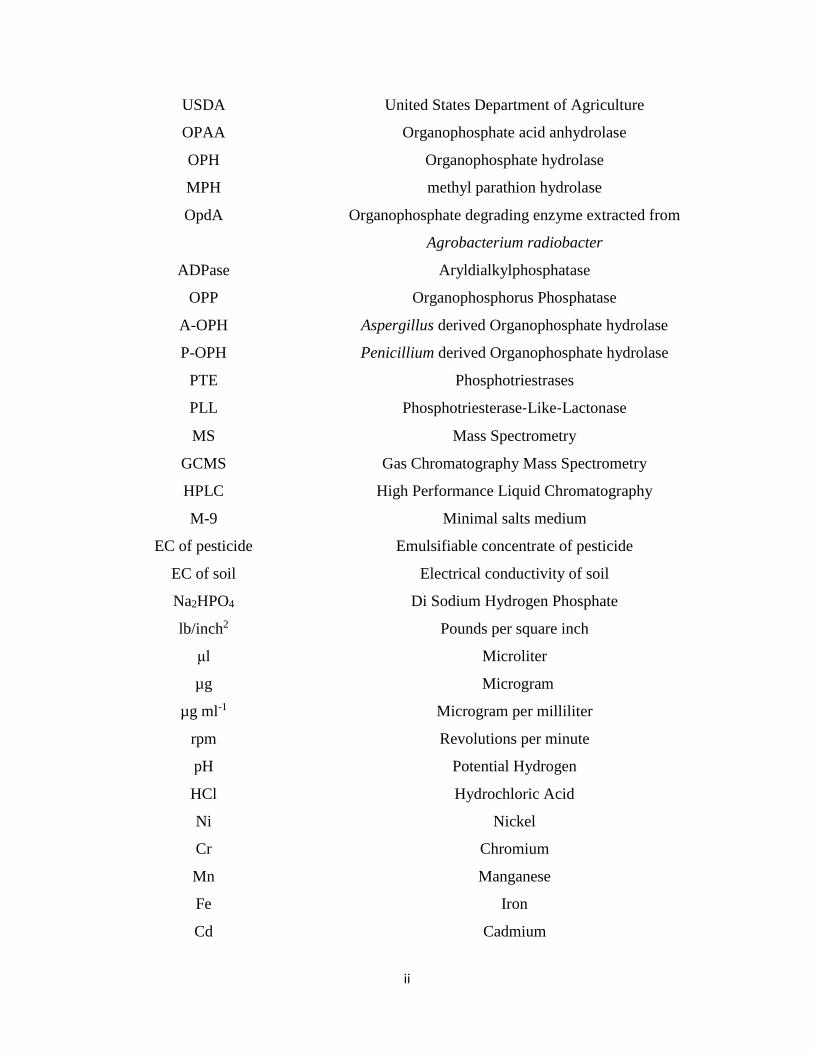
USDA United States Department of Agriculture
OPAA Organophosphate acid anhydrolase
OPH Organophosphate hydrolase
MPH methyl parathion hydrolase
OpdA Organophosphate degrading enzyme extracted from
Agrobacterium radiobacter
ADPase Aryldialkylphosphatase
OPP Organophosphorus Phosphatase
A-OPH Aspergillus derived Organophosphate hydrolase
P-OPH Penicillium derived Organophosphate hydrolase
PTE Phosphotriestrases
PLL Phosphotriesterase‐Like‐Lactonase
MS Mass Spectrometry
GCMS Gas Chromatography Mass Spectrometry
HPLC High Performance Liquid Chromatography
M-9 Minimal salts medium
EC of pesticide Emulsifiable concentrate of pesticide
EC of soil Electrical conductivity of soil
Na2HPO4 Di Sodium Hydrogen Phosphate
lb/inch2 Pounds per square inch
μl Microliter
µg Microgram
µg ml-1 Microgram per milliliter
rpm Revolutions per minute
pH Potential Hydrogen
HCl Hydrochloric Acid
Ni Nickel
Cr Chromium
Mn Manganese
Fe Iron
Cd Cadmium

iii
Cl Chlorine
Cu Copper
S Sulphur
Zn Zinc
Pb Lead
Co Cobalt
CFU Colony forming units
H2O2 Hydrogen peroxide
API Analytical Profile Index
LDC Lysine decarboxylase
H2S hydrogen sulfide production
ADH Arginine dihydrolase
ODC Ornithine decarboxylase
URE Urea hydrolysis
TDA Tryptophan deaminase test
VP Voges Proskauer
EM Eosin Methylene Blue
OD Optical Density
CIT Citrate Utilization
GEL Gelatine Liquefaction
Vis Visible
Consortium A MB490+ MB498
Consortium B MB490+ MB497
Consortium C MB490+ MB504
Consortium D MB497+ MB498
Consortium E MB498+ MB504
Consortium F MB497+ MB504
Consortium G MB490+MB497+ MB498+MB504
TCD Thermal Conductivity Detector
EI Electron impact
eV Electron volt
iv
min minutes
Hrs Hours
PCR Polymerase Chain Reaction
µM Micromolar
TaqDNA polymerase DNA Polymerase derived from Thermus aquaticus
dNTP Deoxyribonucleotide triphosphate
TBE buffer Tris/Borate/EDTA buffer
kb Kilo bases
Tris HCl (hydroxymethyl)aminomethane/ tromethamine
hydrochloride
STE buffer Sodium Chloride-Tris-EDTA
TE buffer Tris-EDTA buffer
mM millimolar
NBRIP National Botanical Research Institute’s phosphate
PSI Phosphate solubilization index
p-NP p-nitrophenol
p-NPP p-nitrophenol phosphate
nm nanometer
1N 1Normal
SDS Sodium dodecyl sulphate
EDTA Ethylene diamine tetraacetic acid
ALP Alkaline phosphatases
Vmax Maximum velocity
> More than
SBs slurry bioreactors
µS/cm micro-Siemens per centimeter
CIAP Calf Intestinal Alkaline Phosphatase
PhoN Non-specific Phosphatase
v
List of Figures
Figure No. Caption Page No.
1.1 Fate of pesticides in the environment 2
1.2 Different sources of pesticide pollution 2
1.3 Chemical structure of an organophosphate compound 4
1.4 Chemical structure of a). Tetrachlorvinphos. b). Dichlorvos. c).
Paraoxon.
5
1.5 Chemical structure of a). Chlorpyrifos. b). Methyl parathion. c).
Triazophos. d). Diazinon.
6
1.6 Chemical structures of: a). Dimethoate b). Malathion c). Phosmet
d). Oxydemeton methyl.
6
1.7 Diagram representing the possible routes of OP pesticides entering
humans and other animals
8
1.8 The chemical structures of triazophos and its main metabolite 1-
phenyl-3-hydroxy-1, 2, 4-triazole
15
1.9 Chemical structure of Dimethoate 17
2.1 Graphical scheme of methodology 31
2.2 Standard curve for p-Nitrophenol 55
3.1 Effect of different pH on the growth of bacterial isolates MB490,
MB497, MB498 and MB504.
70
3.2 Effect of different temperatures on the growth of bacterial isolates
MB490, MB497, MB498 and MB504
70
3.3 Percent degradation of Chlorpyrifos (800mg/l) by bacterial isolate
a) MB490. b) MB497. c) MB498. d) MB504 after 24, 48 and 72hrs
of incubation, using UV-Vis spectrophotometer.
72
3.4 DNA bands of 1). MB490, 2). MB498, 3). MB497 and 4). MB504
in the 2nd, 3rd, 4th and 5th well respectively, along with DNA ladder
in the 1st well.
73
vi
3.5 Evolutionary relationships of Pseudomonas kilonensis MB490. 74
3.6 Evolutionary relationships of Bacillus thuringiensis sp. MB497. 74
3.7 Evolutionary relationships of Pseudomonas kilonensis MB498. 74
3.8 Evolutionary relationships of Pseudomonas sp. MB504. 75
4.1 Growth and % degradation of CPF by four isolates (MB490,
MB497, MB498 and MB504) at different pHs after 24hrs. Error
bars represent standard errors for values of three sample replicates.
80
4.2 Growth and % degradation of CPF by 7 consortia (A, B, C, D, E,
F and) G) at different pHs after 24hrs.
80
4.3 Effect of temperature on growth and degradation of CPF by four
isolates (MB490, MB497, MB498 and MB504) after 24hrs.
81
4.4 Effect of temperature on growth and degradation of CPF by 7
consortia (A, B, C, D, E, F and) G) after 24hrs.
82
4.5 Effect of shaking versus static conditions on growth and %
degradation of CPF by four isolates (MB490, MB497, MB498 and
MB504) after 24hrs.
83
4.6 Effect of shaking versus static conditions on growth and %
degradation of CPF by 7 consortia (A, B, C, D, E, F and G) after
24hrs.
84
4.7 Effect of presence of TAP on the degradation of Chlorpyrifos
(CPF) and growth (OD) by the 4 isolates (MB490, MB497, MB498
and MB504) along with the consortium G (mixture of all four
bacterial isolates) in M-9 broth after 24hrs incubation.
84
4.8 Effect of incubation period on the degradation of Chlorpyrifos and
growth of the 4 isolates (MB490, MB497, MB498 and MB504) in
the M-9 broth.
88
4.9 Effect of incubation period on the biodegradation of Chlorpyrifos
(CPF) by the 7 consortia (A, B, C, D, E, F and G) of bacterial
isolates in the M-9 bacterial culture broth.
88
vii
4.10 Effect of incubation period on percentage degradation of
Chlorpyrifos (CPF) by the 4 isolates (MB490, MB497, MB498 and
MB504) in the soil slurry
90
4.11 Effect of incubation period on percentage degradation of
Chlorpyrifos (CPF) by 7 consortia (A, B, C, D, E, F and G) in soil
slurry.
90
4.12 Effect of incubation period on degradation of Chlorpyrifos (CPF)
by the 4 isolates (MB490, MB497, MB498 and MB504) in the soil
microcosm
93
4.13 Effect of incubation period on degradation of CPF by 7 consortia
(A, B, C, D, E, F and G) in soil microcosm
94
4.14 Effect of incubation period on growth (OD600) and degradation of
3, 5, 6-Trichloropyridinol (TCP) by the 4 isolates (MB490,
MB497, MB498, MB504) in the M-9 broth as analyzed by HPLC
96
4.15 Effect of incubation period on growth (OD600) and degradation of
3, 5, 6- Trichloropyridinol (TCP) by the 4 isolates (MB490,
MB497, MB498, MB504) in the M-9 broth as analyzed by HPLC
97
4.16 Effect of pH on degradation of CPF (RT= 5.4min) by MB490. (a)
Control, (b) MB490 at pH 6 (c) pH 7 (d) pH 8.
98
4.17 Effect of pH on degradation of CPF (RT= 5.4min) by MB497. (a)
Control, (b) MB497 at pH 6 (c) pH 7 (d) pH 8.
99
4.18 Effect of pH on degradation of CPF (RT= 5.4) by MB498. (a)
Control, (b) MB498 at pH 6 (c) pH 7 (d) pH 8.
100
4.19 Effect of pH on degradation of CPF (RT= 5.4) by MB504. (a)
Control, (b) MB504 at pH 6, (c) pH 7, (d) pH 8.
101
4.20 Effect of pH on degradation of CPF (RT= 5.4min) by Consortium
A. (a) Control, (b) Consortium A at pH 6 (c) pH 7 (d) pH 8.
102
4.21 Effect of pH on degradation of CPF (RT= 5.4min) by consortium
B. (a) Control, (b) Consortium B at pH 6 (c) pH 7 (d) pH 8
102
viii
4.22 Effect of pH on degradation of CPF (RT= 5.4min) by consortium
C. (a) Control, (b) Consortium C, at pH 6 (c) pH 7 (d) pH 8.
104
4.23 Effect of pH on degradation of CPF (RT= 5.4min) by Consortium
D. (a) Control, (b) Consortium D, at pH 6 (c) pH 7 (d) pH 8.
105
4.24 Effect of pH on degradation of CPF (RT= 5.4min) by consortium
E. (a) Control, (b) Consortium E, at pH 6 (c) pH 7 (d) pH 8.
106
4.25 Effect of pH on degradation of CPF (RT= 5.4min) by Consortium
F. (a) Control, (b) Consortium F, at pH 6 (c) pH 7 (d) pH 8. TCP
peak is prominent (RT= 1.7min).
107
4.26 Effect of pH on degradation of CPF (RT= 5.4min) by Consortium
G. (a) Control, (b) Consortium G, at pH 6 (c) pH 7 (d) pH 8.
108
4.27 Effect of temperature on degradation of CPF (RT= 5.4min) by
MB490. (a) Control, (b) MB490, at 25°C(c) 30°C (d) 37°C.
109
4.28 Effect of temperature on degradation of CPF (RT= 5.4min) by
MB497. (a) Control, (b) MB497, at 25°C(c) 30°C (d) 37°C.
110
4.29 Effect of temperature on degradation of CPF (RT= 5.4) by MB498.
(a) Control, (b) MB498, at 25°C(c) 30°C (d) 37°C. A single and
prominent peak of TCP can be noted at 1.77 min at 37°C.
111
4.30 Effect of temperature on degradation of CPF (RT = 5.4min) by
MB504. (a) Control, (b) MB504, at 25°C(c) 30°C (d) 37°C.
112
4.31 Effect of temperature on degradation of CPF (RT= 5.4) by
consortium A. (a) Control, (b) consortium A, at 25°C (c) 30°C (d)
37°C.
113
4.32 Effect of temperature on degradation of CPF (RT = 5.4min) by
consortium B. (a) Control, (b) consortium B, at 25°C(c) 30°C (d)
37°C.
114
4.33 Effect of temperature on degradation of CPF (RT = 5.4min) by
consortium C. (a) Control, (b) consortium C, at 25°C(c) 30°C (d)
37°C.
115
ix
4.34 Effect of temperature on degradation of CPF (RT= 5.4min) by
consortium D. (a) Control, (b) consortium D, at 25°C(c) 30°C (d)
37°C.
116
4.35 Effect of temperature on degradation of CPF (RT= 5.4min) by
consortium E. (a) Control, (b) consortium E, at 25°C(c) 30°C (d)
37°C.
117
4.36 Effect of temperature on degradation of CPF (RT = 5.4min) by
consortium F. (a) Control, (b) consortium F, at 25°C(c) 30°C. Note
peak for TCP at RT = 1.77min. (d) 37°C.
118
4.37 Effect of temperature on degradation of CPF (RT= 5.4min) by
consortium G. (a) Control, (b) consortium G, at 25°C(c) 30°C (d)
37°C.
119
4.38 (a) HPLC chromatogram of standard TCP. Degradation of 14mg/l
3, 5, 6-Trichloropyridinol (TCP) by (b). MB490, c). MB497, d).
MB498, e). MB504 after 72hrs incubation.
120
4.39 (A). GCMS Chromatogram of Chlorpyrifos standard (RT =
22minutes). (B). GCMS Chromatogram of 3, 5, 6
Trichloropyridinol (TCP) standard with retention time (RT) = 12.8
minutes.
122
4.40 (A). Mass spectra of Chlorpyrifos standard (m/z: 20-320). (B).
Mass spectra of Chlorpyrifos degraded by bacteria (m/z: 20-260).
123
4.41 GCMS Chromatograms of Chlorpyrifos degraded by: (A). MB490
(B). MB497 (C). MB498 after 3 days incubation in M-9 broth
125
4.42 GCMS Chromatograms of Chlorpyrifos degraded by MB504 after
3 days incubation in M-9 broth.
126
4.43 GCMS Chromatogram of Chlorpyrifos degraded by: (a).
Consortium A (b). Consortium B (c). Consortium C (d).
Consortium D (e). Consortium E (f). Consortium F (g).
Consortium G after 3 days incubation in soil microcosm.
127
4.44 (A). GCMS chromatogram of TCP standard (RT = 12.8min). (B).
Mass spectra of standard TCP.
129
x
4.45 GCMS chromatogram (A) and Mass spectrum (B) of TCP
degraded by MB490. GCMS chromatogram of TCP degraded by
(C). MB497 after 72hrs in M-9 broth
130
4.46 GCMS chromatogram of TCP degraded by (A). MB498 (B).
MB504 after 72hrs in M-9 broth
131
4.47 Proposed pathway for 3, 5, 6-Trichloropyridinol (TCP)
degradation by bacterial isolates.
132
4.48 Proposed metabolic pathway of Chlorpyrifos degradation by
bacteria.
134
5.1 Optical density and % degradation of TAP by four isolates
(MB490, MB497, MB498 and MB504) at different pH after 24 hrs.
138
5.2 Optical density and % degradation of TAP by 7 consortia (A, B, C,
D, E, F, and G) at different pH after 24 hrs.
139
5.3 Optical density and % degradation of TAP by four isolates
(MB490, MB497, MB498 and MB504) at different temperatures
after 24 hrs.
139
5.4 Optical density and % degradation of TAP by 7 consortia (A, B, C,
D, E, F, and G) at different temperature after 24 hrs.
139
5.5 Effect of shaking and static conditions on growth and TAP
degradation by bacterial isolates (MB490, MB497, MB498 and
MB504).
140
5.6 Effect of shaking and static conditions on growth and TAP
degradation by bacterial consortia (A, B, C, D, E, F and G).
140
5.7 Effect of presence of CPF on the growth (OD600) and degradation
of Triazophos by the 4 isolates (MB490, MB497, MB498, MB504)
and the consortium G
141
5.8 Effect of incubation period on bacterial growth and % degradation
of TAP by bacterial isolates (MB490, MB497, MB498, MB504) in
M-9 broth.
142
xi
5.9 Effect of incubation period on the growth and degradation of
Triazophos by the bacterial consortia (A, B, C, D, E, F, and G) in
M-9 broth
143
5.10 Effect of incubation period on degradation of Triazophos by the
bacterial isolates (MB490, MB497, MB498, and MB504) in the
soil slurry
144
5.11 Effect of incubation period on degradation of Triazophos by the 7
consortia (A, B, C, D, E, F and G in the soil slurry
144
5.12 Effect of incubation period on degradation of Triazophos by
bacterial isolates (MB490, MB497, MB498, and MB504) in the
soil microcosm
146
5.13 Effect of incubation period on degradation of Triazophos by the
bacterial consortia (A, B, C, D, E, F and G) in the soil microcosm
146
5.14 Effect of pH on degradation of TAP (RT= 2.4) by MB490. (a)
Control, (b) MB490 at pH 6, (c) pH 7, (d) pH 8.
148
5.15 Effect of pH on degradation of TAP (RT= 2.4) by MB497. (a)
Control, (b) MB497 at pH 6, (c) pH 7, (d) pH 8.
149
5.16 Effect of pH on degradation of TAP (RT = 2.4min) by MB498. (a)
Control, (b) MB498 at pH 6, (c) pH 7, (d) pH 8.
150
5.17 Effect of pH on degradation of TAP (RT= 2.4min) by MB504. (a)
Control, (b) MB504 at pH 6, (c) pH 7, (d) pH 8.
151
5.18 Effect of pH on degradation of TAP (RT= 2.4) by consortium A.
(a) Control, (b) consortium A, at pH 6, (c) pH 7, (d) pH 8.
152
5.19 Effect of pH on degradation of TAP (RT= 2.4) by consortium B.
(a) Control, (b) consortium B, at pH 6, (c) pH 7, (d) pH 8.
153
5.20 Effect of pH on degradation of TAP (RT= 2.4) by consortium C.
(a) Control, (b) consortium C, at pH 6, (c) pH 7, (d) pH 8.
154
xii
5.21 Effect of pH on degradation of TAP (RT= 2.4) by consortium D.
(a) Control, (b) consortium D, at pH 6, (c) pH 7, (d) pH 8.
155
5.22 Effect of pH on degradation of TAP (RT= 2.4) by consortium E.
(a) Control, (b) consortium E, at pH 6, (c) pH 7, (d) pH 8.
156
5.23 Effect of pH on degradation of TAP (RT= 2.4) by consortium F.
(a) Control, (b) consortium F, at pH 6, (c) pH 7, (d) pH 8.
157
5.24 Effect of pH on degradation of TAP (RT= 2.4) by consortium G.
(a) Control, (b) consortium G, at pH 6, (c) pH 7, (d) pH 8.
158
5.25 Effect of temperature on degradation of TAP (RT= 2.4) by MB490.
(a) Control, (b) MB490 at 25°C, (c) 30°C, (d) 37°C.
159
5.26 Effect of temperature on degradation of TAP (RT= 2.4) by MB497.
(a) Control, (b) MB497 at 25°C, (c) 30°C, (d) 37°C.
160
5.27 Effect of temperature on degradation of TAP (RT= 2.4) by MB498.
(a) Control, (b) MB498 at 25°C, (c) 30°C, (d) 37°C.
161
5.28 Effect of temperature on degradation of TAP (RT = 2.4) by
MB504. (a) Control, (b) MB504 at 25°C, (c) 30°C, (d) 37°C.
162
5.29 Effect of temperature on degradation of TAP (RT= 2.4) by
consortium A. (a) Control, (b) consortium A at 25°C, (c) 30°C, (d)
37°C.
163
5.30 Effect of temperature on degradation of TAP (RT= 2.4) by
consortium B. (a) Control, (b) consortium B at 25°C, (c) 30°C, (d)
37°C.
164
5.31 Effect of temperature on degradation of TAP (RT= 2.4) by
consortium C. (a) Control, (b) consortium C at 25°C, (c) 30°C, (d)
37°C.
165
5.32 Effect of temperature on degradation of TAP (RT= 2.4) by
consortium D. (a) Control, (b) consortium D at 25°C, (c) 30°C, (d)
37°C.
166
xiii
5.33 Effect of temperature on degradation of TAP (RT= 2.4) by
consortium E. (a) Control, (b) consortium E at 25°C, (c) 30°C, (d)
37°C.
167
5.34 Effect of temperature on degradation of TAP (RT= 2.4) by
consortium F. (a) Control, (b) consortium F at 25°C, (c) 30°C, (d)
37°C.
168
5.35 Effect of temperature on degradation of TAP (RT= 2.4) by
consortium G. (a) Control, (b) consortium G at 25°C, (c) 30°C, (d)
37°C.
169
5.36 (a). GCMS chromatogram of Triazophos standard (RT= 27.8min)
(b). GCMS mass spectrum of Triazophos standard.
170
5.37 GCMS chromatogram of Triazophos in the sample treated with (a)
MB490 (b) MB497 after 3 days of incubation in M-9 broth.
171
5.38 GCMS chromatogram of Triazophos in the sample treated with (a)
MB498 (b) MB504 after 3 days of incubation in M-9 broth.
172
5.39 Proposed metabolic pathway for the biotransformation of TAP by
bacterial isolates MB490, MB497, MB498 and MB504.
176
6.1 Effect of pH on growth (OD600nm) and % degradation of
Dimethoate by four isolates (MB490, MB497, MB498 and
MB504) after 24 hrs.
181
6.2 Effect of temperature on growth (OD600nm) and % degradation of
Dimethoate by four isolates (MB490, MB497, MB498 and
MB504) after 24 hrs.
181
6.3 Effect of pH on growth (OD600nm) and % degradation of
Dimethoate 7 consortia (A, B, C, D, E, F, and G) after 24 hrs.
182
6.4 Effect of temperature on growth (OD600nm) and % degradation of
Dimethoate by 7 consortia (A, B, C, D, E, F, and G) after 24 hrs.
182
6.5 Effect of Shaking versus static conditions on growth and %
degradation of Dimethoate by four isolates (MB490, MB497,
MB498 and MB504) after 24hrs.
183
xiv
6.6 Effect of Shaking versus static conditions on growth and %
degradation of Dimethoate by seven consortia (A, B, C, D, E, F,
and G) after 24hrs.
183
6.7 Effect of incubation period on growth and degradation of
Dimethoate (DM) by the 4 isolates (MB490, MB497, MB498,
MB504) in the M-9 broth
185
6.8 Effect of incubation period on growth and degradation of
Dimethoate (DM) by seven consortia (A, B, C, D, E, F, and G) of
bacterial isolates in the M-9 broth
185
6.9 Effect of incubation period on degradation of Dimethoate (DM) by
the 4 bacterial isolates (MB490, MB497, MB498 and MB504) in
the soil slurry
186
6.10 Effect of incubation period on degradation of Dimethoate (DM) by
the 7 consortia (A, B, C, D, E, F, and G) in the soil slurry
187
6.11 Effect of incubation period on degradation of Dimethoate (DM) by
the bacterial isolates (MB490, MB497, MB498 and MB504) in the
soil microcosm
188
6.12 Effect of incubation period on degradation of Dimethoate (DM) by
the consortia (A, B, C, D, E, F, and G) in the soil microcosm
189
6.13 a) HPLC chromatogram of Dimethoate control. b). HPLC
chromatogram of Dimethoate degraded by MB490 in M-9 broth
after24hrs at pH 6. c). pH 7. d). pH 9.
190
6.14 a) HPLC chromatogram of Dimethoate control. b). HPLC
chromatogram of Dimethoate degraded by MB497 in M-9 broth
after24hrs at pH 6. c). pH 7. d). pH 9.
191
6.15. a) HPLC chromatogram of Dimethoate control. b). HPLC
chromatogram of Dimethoate degraded by MB498 in M-9 broth
after 24hrs at pH 6. c). pH 7. d). pH 9.
192
6.16 a) HPLC chromatogram of Dimethoate control. b). HPLC
chromatogram of Dimethoate degraded by MB504 in M-9 broth
after 24hrs at pH 6. c). pH 7. d). pH 9.
193
xv
6.17 a) HPLC chromatogram of Dimethoate control. b). HPLC
chromatogram of Dimethoate degraded by MB490 in M-9 broth
after 24hrs at 25°C. c). 30°C. d). 37°C.
194
6.18 a) HPLC chromatogram of Dimethoate control. b). HPLC
chromatogram of Dimethoate degraded by MB497 in M-9 broth
after 24hrs at 25°C. c). 30°C. d). 37°C.
195
6.19 a) HPLC chromatogram of Dimethoate control. b). HPLC
chromatogram of Dimethoate degraded by MB498 in M-9 broth
after 24hrs at 25°C. c). 30°C. d). 37°C.
196
6.20 a) HPLC chromatogram of Dimethoate control. b). HPLC
chromatogram of Dimethoate degraded by MB490 in M-9 broth
after 24hrs at 25°C. c). 30°C. d). 37°C.
197
6.21 a) HPLC chromatogram of Dimethoate control. HPLC
chromatogram of Dimethoate degraded by: b). MB490. c).
MB497. d). MB498. e).MB504 in soil microcosm after 9 days of
incubation.
198
6.22 (a). GCMS chromatogram of Dimethoate standard (RT =
17.7min). (b). Mass spectrum of Dimethoate standard.
200
6.23 GCMS chromatogram of Dimethoate (RT = 17.7min) degraded by:
A). MB490. B). MB497. C). MB498. D). MB504 in soil
microcosm after 3 days of incubation.101
202
6.24 GCMS chromatogram of Dimethoate (RT = 17.7min) degraded by
a). Consortium A, b). Consortium B, c). Consortium C, d).
Consortium D, e). Consortium E, f). Consortium F, g). Consortium
G, h). Mass spectrum of Dimethoate degraded by bacteria in soil
microcosm after 9 days of incubation.
203
6.26 Proposed metabolic pathway for the transformation of Dimethoate
by bacteria.
205
7.1 Extracellular production of Organophosphorus-phosphatase (OPP)
by bacterial isolates (MB490, MB497, MB498 and MB504) at
405nm.
211
xvi
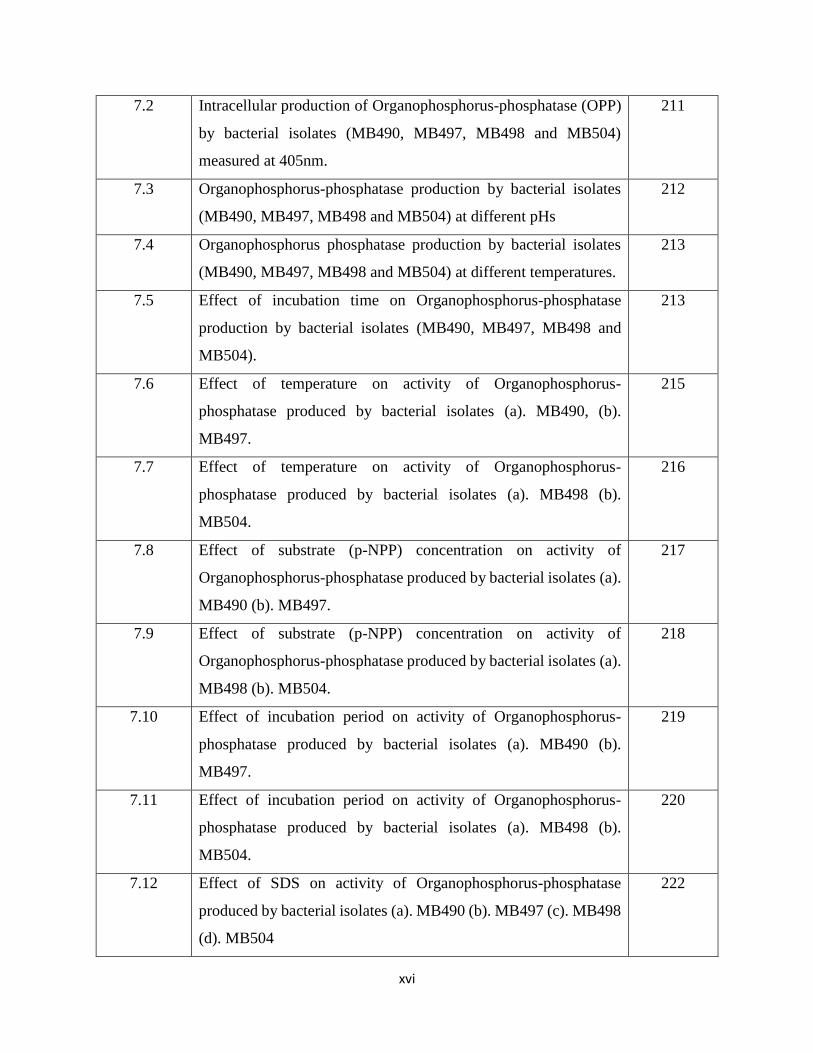
7.2 Intracellular production of Organophosphorus-phosphatase (OPP)
by bacterial isolates (MB490, MB497, MB498 and MB504)
measured at 405nm.
211
7.3 Organophosphorus-phosphatase production by bacterial isolates
(MB490, MB497, MB498 and MB504) at different pHs
212
7.4 Organophosphorus phosphatase production by bacterial isolates
(MB490, MB497, MB498 and MB504) at different temperatures.
213
7.5 Effect of incubation time on Organophosphorus-phosphatase
production by bacterial isolates (MB490, MB497, MB498 and
MB504).
213
7.6 Effect of temperature on activity of Organophosphorus-
phosphatase produced by bacterial isolates (a). MB490, (b).
MB497.
215
7.7 Effect of temperature on activity of Organophosphorus-
phosphatase produced by bacterial isolates (a). MB498 (b).
MB504.
216
7.8 Effect of substrate (p-NPP) concentration on activity of
Organophosphorus-phosphatase produced by bacterial isolates (a).
MB490 (b). MB497.
217
7.9 Effect of substrate (p-NPP) concentration on activity of
Organophosphorus-phosphatase produced by bacterial isolates (a).
MB498 (b). MB504.
218
7.10 Effect of incubation period on activity of Organophosphorus-
phosphatase produced by bacterial isolates (a). MB490 (b).
MB497.
219
7.11 Effect of incubation period on activity of Organophosphorus-
phosphatase produced by bacterial isolates (a). MB498 (b).
MB504.
220
7.12 Effect of SDS on activity of Organophosphorus-phosphatase
produced by bacterial isolates (a). MB490 (b). MB497 (c). MB498
(d). MB504
222
xvii
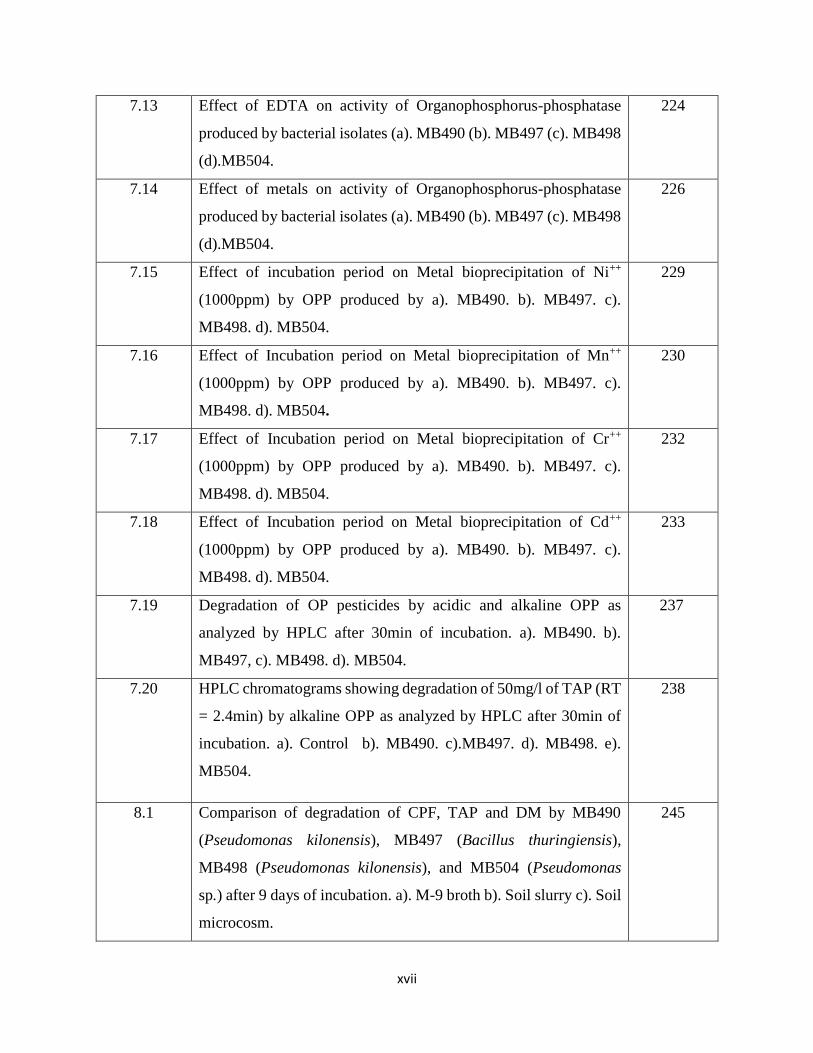
7.13 Effect of EDTA on activity of Organophosphorus-phosphatase
produced by bacterial isolates (a). MB490 (b). MB497 (c). MB498
(d).MB504.
224
7.14 Effect of metals on activity of Organophosphorus-phosphatase
produced by bacterial isolates (a). MB490 (b). MB497 (c). MB498
(d).MB504.
226
7.15 Effect of incubation period on Metal bioprecipitation of Ni++
(1000ppm) by OPP produced by a). MB490. b). MB497. c).
MB498. d). MB504.
229
7.16 Effect of Incubation period on Metal bioprecipitation of Mn++
(1000ppm) by OPP produced by a). MB490. b). MB497. c).
MB498. d). MB504.
230
7.17 Effect of Incubation period on Metal bioprecipitation of Cr++
(1000ppm) by OPP produced by a). MB490. b). MB497. c).
MB498. d). MB504.
232
7.18 Effect of Incubation period on Metal bioprecipitation of Cd++
(1000ppm) by OPP produced by a). MB490. b). MB497. c).
MB498. d). MB504.
233
7.19 Degradation of OP pesticides by acidic and alkaline OPP as
analyzed by HPLC after 30min of incubation. a). MB490. b).
MB497, c). MB498. d). MB504.
237
7.20 HPLC chromatograms showing degradation of 50mg/l of TAP (RT
= 2.4min) by alkaline OPP as analyzed by HPLC after 30min of
incubation. a). Control b). MB490. c).MB497. d). MB498. e).
MB504.
238
8.1 Comparison of degradation of CPF, TAP and DM by MB490
(Pseudomonas kilonensis), MB497 (Bacillus thuringiensis),
MB498 (Pseudomonas kilonensis), and MB504 (Pseudomonas
sp.) after 9 days of incubation. a). M-9 broth b). Soil slurry c). Soil
microcosm.
245

xviii
8.2 Comparison of degradation of 3, 5, 6 Trichloropyridinol (TCP) at
two different concentrations (14mg/l and 28mg/l) by bacterial
isolates MB490 (Pseudomonas kilonensis), MB497 (Bacillus
thuringiensis), MB498 (Pseudomonas kilonensis) and MB504
(Pseudomonas sp.).
246
8.3 Comparison of degradation of TAP by pure strains (MB490,
MB497, MB498 and MB504) with their respective consortia A, B,
C, D, E, F and G in M-9 broth after 9 days.
251
8.4 Comparison of degradation of TAP by pure strains (MB490,
MB497, MB498 and MB504) with their respective consortia A, B,
C, D, E, F and G in soil slurry after 9 days.
252
8.5 Comparison of degradation of TAP by pure strains (MB490,
MB497, MB498 and MB504) with their respective consortia A, B,
C, D, E, F and G in soil microcosm after 9 days.
253
8.6 Comparison of degradation of DM by pure strains (MB490,
MB497, MB498 and MB504) with their respective consortia A, B,
C, D, E, F and G in M-9 broth after 9 days.
255
8.7 Comparison of degradation of DM by pure strains (MB490,
MB497, MB498 and MB504) with their respective consortia A, B,
C, D, E, F and G in soil slurry after 9 days.
256
8.8 Comparison of degradation of DM by pure strains (MB490,
MB497, MB498 and MB504) with their respective consortia A, B,
C, D, E, F and G in soil microcosm after 9 days.
257
xix
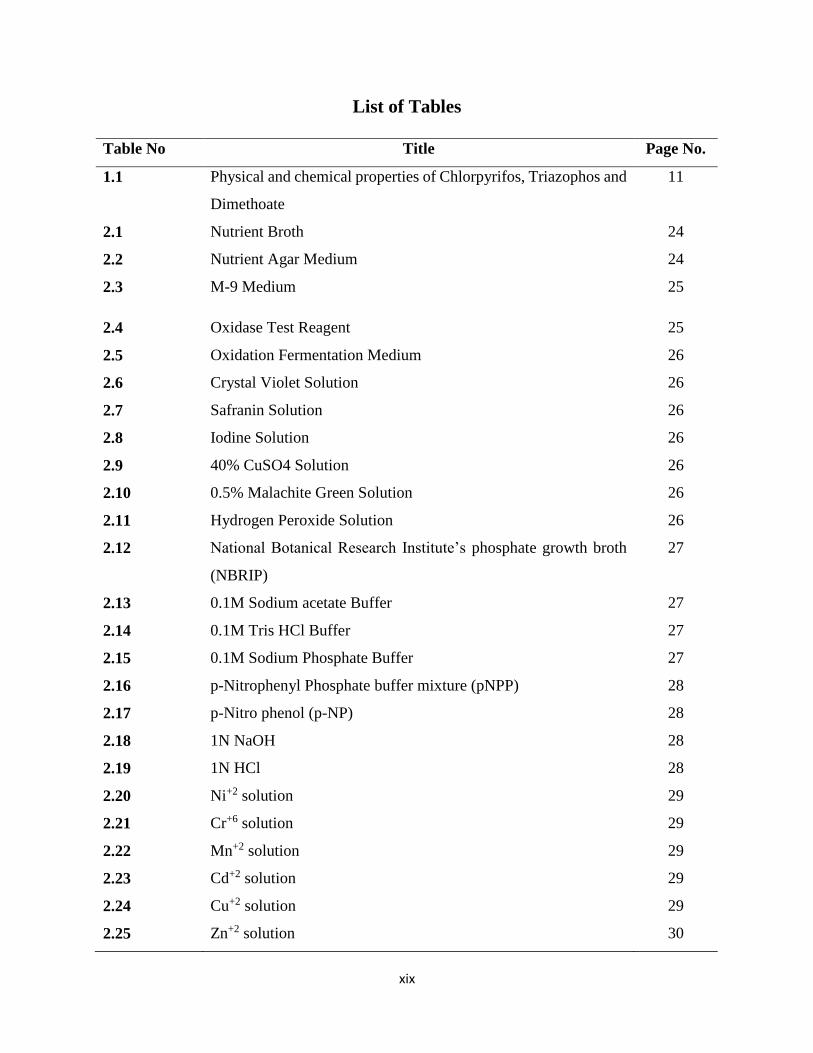
List of Tables
Table No Title Page No.
1.1 Physical and chemical properties of Chlorpyrifos, Triazophos and
Dimethoate
11
2.1 Nutrient Broth 24
2.2 Nutrient Agar Medium 24
2.3 M-9 Medium 25
2.4 Oxidase Test Reagent 25
2.5 Oxidation Fermentation Medium 26
2.6 Crystal Violet Solution 26
2.7 Safranin Solution 26
2.8 Iodine Solution 26
2.9 40% CuSO4 Solution 26
2.10 0.5% Malachite Green Solution 26
2.11 Hydrogen Peroxide Solution 26
2.12 National Botanical Research Institute’s phosphate growth broth
(NBRIP)
27
2.13 0.1M Sodium acetate Buffer 27
2.14 0.1M Tris HCl Buffer 27
2.15 0.1M Sodium Phosphate Buffer 27
2.16 p-Nitrophenyl Phosphate buffer mixture (pNPP) 28
2.17 p-Nitro phenol (p-NP) 28
2.18 1N NaOH 28
2.19 1N HCl 28
2.20 Ni+2 solution 29
2.21 Cr+6 solution 29
2.22 Mn+2 solution 29
2.23 Cd+2 solution 29
2.24 Cu+2 solution 29
2.25 Zn+2 solution 30
xx
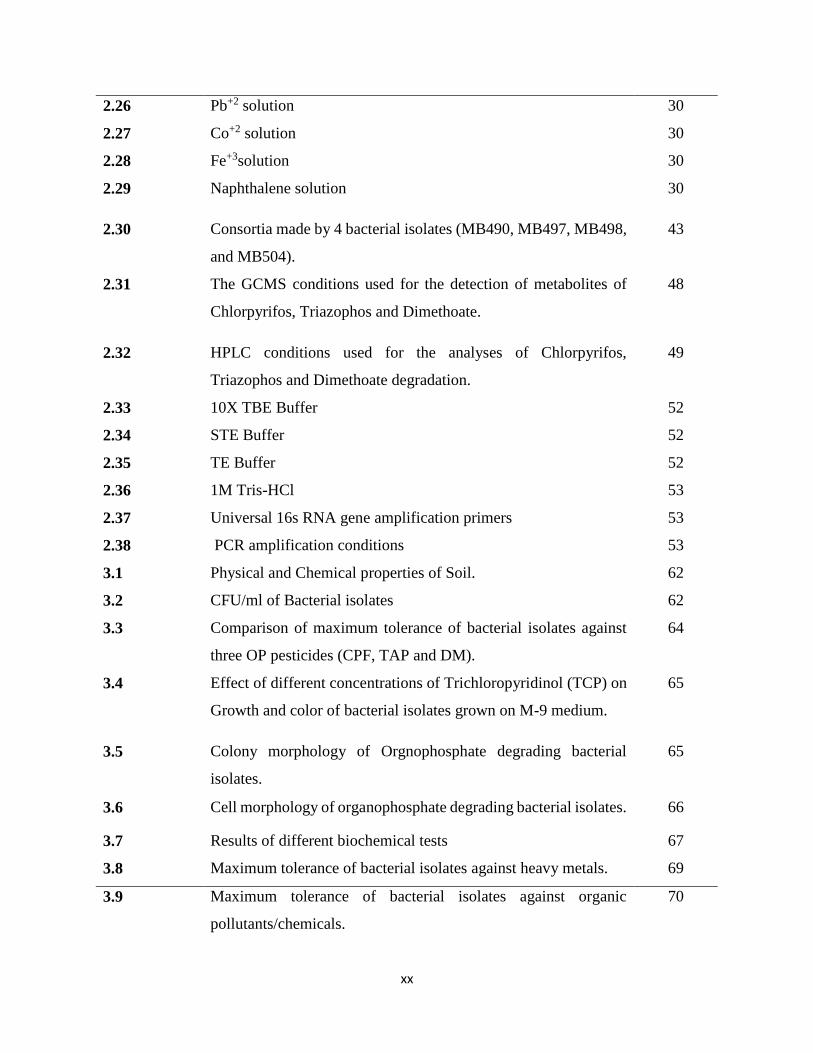
2.26 Pb+2 solution 30
2.27 Co+2 solution 30
2.28 Fe+3solution 30
2.29 Naphthalene solution 30
2.30 Consortia made by 4 bacterial isolates (MB490, MB497, MB498,
and MB504).
43
2.31 The GCMS conditions used for the detection of metabolites of
Chlorpyrifos, Triazophos and Dimethoate.
48
2.32 HPLC conditions used for the analyses of Chlorpyrifos,
Triazophos and Dimethoate degradation.
49
2.33 10X TBE Buffer 52
2.34 STE Buffer 52
2.35 TE Buffer 52
2.36 1M Tris-HCl 53
2.37 Universal 16s RNA gene amplification primers 53
2.38 PCR amplification conditions 53
3.1 Physical and Chemical properties of Soil. 62
3.2 CFU/ml of Bacterial isolates 62
3.3 Comparison of maximum tolerance of bacterial isolates against
three OP pesticides (CPF, TAP and DM).
64
3.4 Effect of different concentrations of Trichloropyridinol (TCP) on
Growth and color of bacterial isolates grown on M-9 medium.
65
3.5 Colony morphology of Orgnophosphate degrading bacterial
isolates.
65
3.6 Cell morphology of organophosphate degrading bacterial isolates. 66
3.7 Results of different biochemical tests 67
3.8 Maximum tolerance of bacterial isolates against heavy metals. 69
3.9 Maximum tolerance of bacterial isolates against organic
pollutants/chemicals.
70

xxi
3.10 Percentage degradation of Chlorpyrifos (800mg/l) by bacterial
isolates as analyzed by UV-Vis Spectrophotometer.
71
4.1 Bacterial Population in soil slurry spiked with 200mg/l of CPF 91
4.2 Bacterial Population in soil microcosm spiked with CPF
(200mg/kg).
93
4.3 Biotransformation of Chlorpyrifos by the 4 bacteria in M-9 broth,
soil slurry and soil microcosm as analyzed by GCMS.
124
4.4 Biotransformation of 3, 5, 6-Trichloropyridinol (TCP) by the 4
bacteria in M-9 broth as analyzed by GCMS.
128
5.1 Bacterial Population in soil slurry spiked with 200mg/l of TAP 144
5.2 Bacterial Population in soil microcosm spiked with 200mg/kg of
TAP.
146
5.3 Biotransformation of Triazophos by bacterial isolates and their
consortia in M-9 broth, soil slurry and soil microcosm.
173
6.1 Bacterial Population in soil slurry spiked with 200mg/l of DM 187
6.2 Bacterial Population in soil microcosm spiked with 200mg/kg of
DM
189
6.3 Biotransformation of Dimethoate (DM) by the 4 isolates (MB490,
MB497, MB498, and MB504) and the consortia of these 4 isolates
in the M-9 broth, soil slurry and soil microcosm.
201
7.1 Screening for Phosphate solubilization potential of bacterial
isolates (MB490, MB497, MB498 and MB504).
209
8.1 Main compounds identified in the GCMS chromatogram of
Dimethoate degraded by bacterial isolates (MB490, MB497,
MB498 and MB504) and their consortia.
260
xxii
Dedication
My Ph.D thesis is dedicated to my Loving Parents, whose unconditional love
and support along with their prayers enabled me to complete my Ph.D.
xxiii
Acknowledgements
All praises and thanks to Almighty Allah for giving me strength and courage to complete my thesis.
Modest respects to Holy Prophet Muhammad (PBUH), Who is persistently a guidance for entire
human kind.
I would like to express my sincere gratitude to my advisor Prof. Dr. Azra Yasmin for the
continuous support of my Ph.D study and related research work, for her patience, motivation, and
immense knowledge. Her guidance helped me in all aspects of my research and writing of this
thesis. She proved best advisor and mentor for my Ph.D study. Special thanks to Mrs. Irum Asif,
Mr. Joseph Gill, Mr. Riaz and Mrs. Komal for their technical assistance during my research in
their Analytical lab. My heartiest thanks to all lab fellows especially Anila, Satara, Uruj, Tabeer,
Ayesha and Monaza for their tolerance and cooperation during my research work.
Last but not least, I am especially thankful to my parents, brothers and sisters for their love,
prayers, patience and endless support throughout my life. I specially acknowledge my husband
and my kids who facilitated me and provided me a peaceful environment at home to complete this
study.
Samina Ambreen
xxiv
Summary
Over use of pesticides including organophosphates has resulted in the contamination of soil, water
and food resources, thus harming non-target organisms via food chain. The removal of pesticides
and other pollutants from soil and water has become the point of interest for many research
workers since last few decades. Multiple varieties of microbes have been reported that have
potential to degrade pesticides. Therefore present study was aimed to isolate indigenous
organophosphate (OP) degrading soil bacteria from various agricultural soils of district Mianwali,
Punjab, Pakistan. Among a large number of bacterial isolates obtained, fifteen isolates (MB490
to MB505) were selected and purified based on their discrete morphological characters and their
resistance against three OP pesticides Chlorpyrifos (CPF), Triazophos (TAP) and Dimethoate
(DM). Four best isolates (MB490, MB497, MB498 and MB504) were selected for further
analyses. Strain MB497 was the most tolerant for CPF (8g/l), followed by MB490 and MB498
(6g/l) and then MB504 (0.8g/l). Strains MB490, MB497 and MB498 were tolerant up to 4g/l of
TAP and 0.4g/l of DM, whereas MB504 was least tolerant for TAP (2g/l) and DM (0.22g/l).
Isolate MB497 was Gram positive, while the other three were Gram negative. All were rods and
facultative anaerobes. All the isolates were able to grow under wide range of temperature (25-
42◦C) and pH (5-11), and were characterized as neutrophile (MB490), slightly acidophile
(MB504) and moderately alkaliphile (MB497 and MB498).
All of the isolates showed resistance against multiple organic and inorganic pollutants including
heavy metals (Pb, Mn, Zn, Fe, Cr, Cu, Ni) and aromatic hydrocarbons (Benzene, Toluene, Xylene,
Biphenyl and Naphthalene). Biochemical analysis of these isolates revealed the presence of
important enzymes like nitrate reductase, oxidase and catalase needed for biodegradation. Four
selected strains were identified as Pseudomonas kilonensis MB490, Bacillus thuringiensis
MB497, Pseudomonas kilonensis MB498 and Pseudomonas sp. MB504 on the basis of 16s rRNA
analysis. These strains and their seven consortia (A, B, C, D, E, F and G) efficiently degraded
40.01 - 99.99% of initial 200mg/l of CPF, TAP and DM at different pHs (6, 7, and 8) and at
different incubation temperatures (25, 30 and 37◦C). There was significant degradation of CPF
(up to 99%), TAP (88.4 – 99.9%) and DM (77.67 to 99%) in M-9 broth, soil slurry and soil
microcosm for most of the isolates/consortia within 9 days. Negligible pesticide degradation was
observed in the control samples without bacterial inoculum. The bacterial isolates were also found
xxv
capable of degrading 3, 5, 6-Trichloropyridinol (28mg/l) up to 90.57% within 72hrs. GCMS
analysis of CPF degradation revealed the formation of 3, 5, 6 Trichloropyridinol (TCP) along
with [(3, 5, 6-trichloro-2-pyridinyl) oxy] acetic acid; Diethyl thiophosphate (DETP);
phosphorothioic acid and Diisopropyl methanephosphonate. TCP was further metabolized
into 1-methyl-2-pyrrolidine ethanol; 2-Ethoxy-4, 4, 5, 5-tetramethyloxazoline; 3-(2, 4, 5-
Trichlorophenoxy)-1-propyne and p-Propyl phenol.
While 7 novel metabolites of TAP were identified according to NIST library i.e 1, 2, 4-Triazole-
4—amine, N-(2-Thienylmethyl); Benzene sulfonic acid hydrazide; Benzene sulfonic acid
methyl ester; 4H-1,2,4-Triazole-4-benzenesulfonamide; 4, 5 dihydro-N-(O-toyl)-3-furamide;
Ethyl 4-phenyldiazenylbenzoate and Dibutyl methanephosphonate. Dimethoate was
metabolized into 5 products i.e Methyl diethanol amine; Phosphonothioic acid propyl-O, S-
dimethyl ester; O, O, O- Trimethyl thiophosphate; Omethoate and Aspartylglycine ethyl
ester.
All bacterial strains were capable of phosphate solubilization and could produce substantial
amounts of extracellular, acidic, neutral and alkaline organophosphorous phosphatases (OPP).
Mainly, there was more production of acidic and alkaline phosphatases as compared to neutral
phosphatases. Among three types of OPP, Pseudomonas kilonensis MB490 produced maximum
amount of neutral OPP, Bacillus thuringiensis MB497 produced maximum alkaline OPP, whereas
Pseudomonas sp. MB504 showed highest production of acidic OPP. The highest OPP production
was observed at pH 11 by all isolates. The maximum OPP enzyme production was exhibited at
50°C (MB490, MB497 and MB498) and at 45°C (MB504). Generally, OPP production was
reduced by all isolates after 48hrs. Though OPP enzyme activity and stability was maximum at
37⁰C, but remained still active even at highest given temperature (70⁰C) by all isolates. Largely,
acidic, neutral and alkaline OPP activity was inhibited by SDS and EDTA especially at higher
concentrations, whereas, Zn++, Cu++ and Cd++ significantly enhanced OPP activity. All three OPPs
exhibited 86-100% bioprecipitation of selected metals (Ni, Mn, Cr and Cd). Alkaline OPP showed
more degradation (80 to 99%) of given 50mg/l of three OP pesticides (CPF, TAP and DM), within
30min of incubation as compared to acidic OPP that was able to degrade up to 40 to 80%.
xxvi
Present research revealed that these indigenous bacteria (Pseudomonas kilonensis MB490,
Bacillus thuringiensis MB497, Pseudomonas kilonensis MB498 and Pseudomonas sp. MB504)
exhibited significant tolerance and degradation of multiple organophosphate pesticides (CPF,
TAP and DM) along with their unique aspect to degrade and transform recalcitrant 3, 5, 6
Trichloropyridinol (metabolite of CPF) which was further supported by the identification of many
known as well as novel metabolites formed by these isolates during degradation process. These
strains were resistant to a variety of metals and organic pollutants. Presence of acidic, neutral and
alkaline OPP and other enzymes (nitroreductase, oxidase and catalase) involved in degradation
process further support the possible use of these indigenous bacteria for bioremediation of OP
pesticide contaminated soils of Pakistan.
1
Chapter 1
Introduction
Pesticides are the organic compounds which are synthesized and used to control pest
either by killing or slowing down their growth. Pesticides include herbicides,
insecticides, fungicides, and nematocides. These are being used extensively in modern
age agriculture to increase food production for huge human population. The extensive
and continuous use of man-made pesticides leads to environmental pollution which is
enhanced by other diffused sources like unintentional spills, left over pesticides in the
drums or vessels, mishandling of application tools and also the undesirable application
methods (Diez, 2010). Pesticide contamination affects the quality of air, soils, food and
water resources, ultimately harming non-intended organisms including humans and
inducing pesticide resistance in pests by inborn mutations (Gavrilescu et al., 2015;
Aceves-Diez et al., 2015).
Biological, chemical and physical agents/factors regulate the steadiness as well as
movement of pesticides in the environment. Most of the pesticides are obstinate, as they
persevere for a longer time in soils and deposits, ultimately entering the food chain
(Ortiz-Hernandez et al., 2013). Though quantity of pesticides which are applied
annually reaches millions of tons, yet merely a minor portion of these pesticides targets
the intended organisms, while the major part is wasted reaching the soil, water and
atmosphere harming humans and other non-subjective species (Gill et al., 2014; Lewis
et al., 2016).
Traditional methods to deactivate pesticides mainly depend on chemical treatment,
incineration and landfilling. These methods have many downsides including the release
of large amounts of acids and alkali as secondary waste product (in case of landfills),
leaching of pesticides into surrounding soil and ground water supplies, and toxic
contamination of the environment as a result of incineration. As opposed to the old and
outdated methods, bioremediation using microorganisms or plants (phytoremediation)
is now considered as an alternative and smooth, potentially applicable, active, cheaper
and an eco-friendly method (Liu et al., 2016; Rayu et al., 2017). The microorganisms
are the chief biological mediators that can remove and degrade waste materials, in order
to allow their recycling in the surroundings (Parte et al., 2017).
2
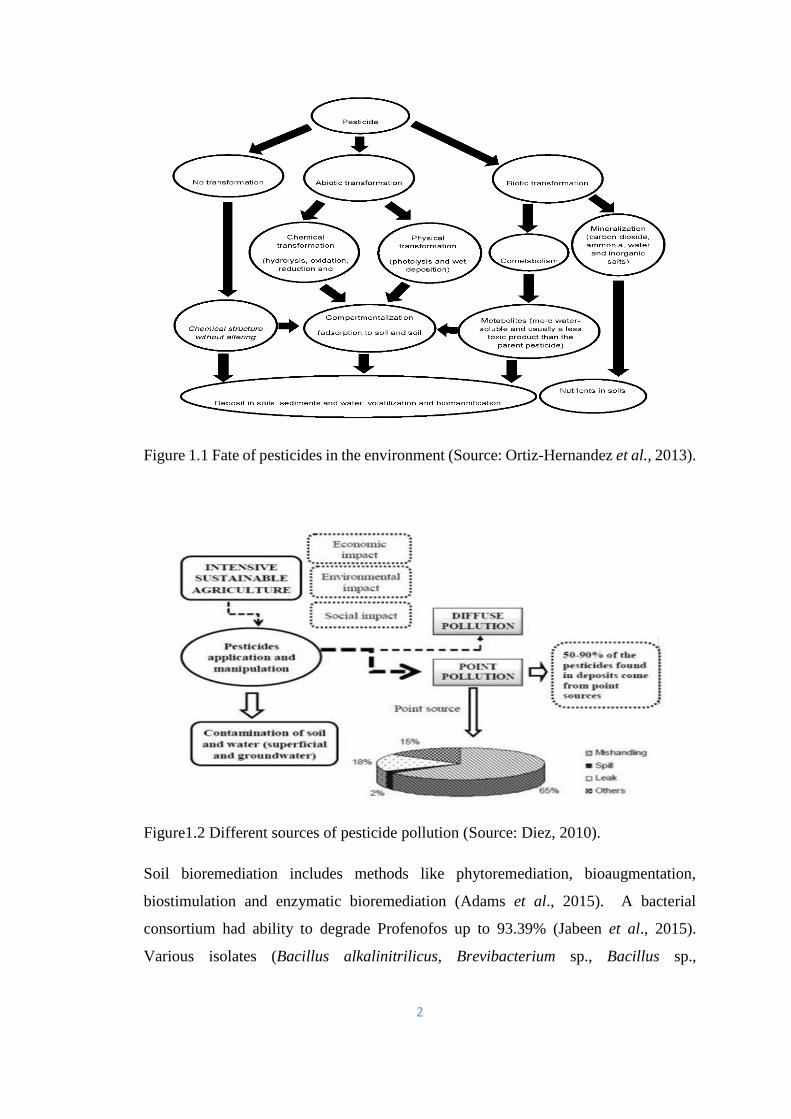
Figure 1.1 Fate of pesticides in the environment (Source: Ortiz-Hernandez et al., 2013).
Figure1.2 Different sources of pesticide pollution (Source: Diez, 2010).
Soil bioremediation includes methods like phytoremediation, bioaugmentation,
biostimulation and enzymatic bioremediation (Adams et al., 2015). A bacterial
consortium had ability to degrade Profenofos up to 93.39% (Jabeen et al., 2015).
Various isolates (Bacillus alkalinitrilicus, Brevibacterium sp., Bacillus sp.,

3
Pseudomonas putida F1, Rhizobium sp.) had been reported to breakdown imidacloprid
(Sharma et al., 2014; Sabourmoghaddam et al., 2015).
1.1 Pesticides in Pakistan
The pesticides have been imported in Pakistan since 1954. The pesticide business was
given to the private sector in 1980. This resulted in a high rise of pesticide consumption
reaching to 5519 metric tons in 1992. Total 85% of the pesticides consist of insecticides
used mostly on cotton crop (Jabbar and Mallick, 1994). The pesticides in Pakistan are
regularized/controlled by the Agricultural Pesticide Rules, 1973 with respect to their
production/ import, registration and use etc. The Department of Plant Protection
working under government of Pakistan is responsible for the registration of pesticides.
All the agricultural workers especially the spray men and female cotton pickers are at
greater risks to pesticide poisoning. The pesticides are mostly handled without
appropriate precautionary measures as a result of lack of awareness. Pesticide remains
have been detected in many food and feed items sometimes exceeding the WHO
recommended limits. Likewise, crop soils and groundwater at various sites have
been found contaminated with the pesticide residues, ultimately reaching the human
bodies. There are only limited studies available in Pakistan on the human exposure to
pesticides. Moreover, these are only limited to organochlorine and organophosphates.
In Quetta and Karachi, organochlorine like DDT and HCH have been detected in the
blood and fat tissues of human population (Jabbar and Mallick, 1994). Similarly, the
activities of blood choline-esterase have been found reduced to dangerously low levels
in the spray men and cotton pickers in cotton growing area of Multan. Khan et al. (2015)
studied risks related to pesticide use among farmers from cotton belt of Punjab,
Pakistan. According to their survey, 4875 kg of pesticides/year was being used by the
farmers including 55% moderately risky and 23% extremely dangerous. There were 10-
11 average pesticide applications in each growing season. Most of the farmers were
unaware or less informed about pesticide risk and safe use of pesticides. So, there must
be alternative safer measures of integrated pest management (involving natural pest
control and biological control) and decrease in dependence on man-made pesticides.
Pesticide residues (chlorpyrifos, fenvalerate, dimethoate, methyl parathion,
fenitrothion, cypermethrin etc) were present in various fruit samples and in apple,
these were found above the permissible limits (Anwar et al., 2011). Chlorpyriphos
4
followed by Endosulfan and Dimethoate were the mostly observed pesticides in soil
samples of various cotton fields in Sindh (Anwar et al., 2012). Similarly, high
concentrations of DDTs and HCHs were noticed at pesticide dumping sites and adjacent
areas in Hyderabad, posing potential risk to living organisms, safety of food crops and
ultimately to human health (Alamdar et al., 2014).
1.2 Organophosphate pesticides
Organophosphate (OP) pesticides are man-made esters, thiol derivatives, or amides, of
phosphoric, phosphonic, phosphonothioic or phosphorothioic acids. In OP pesticides
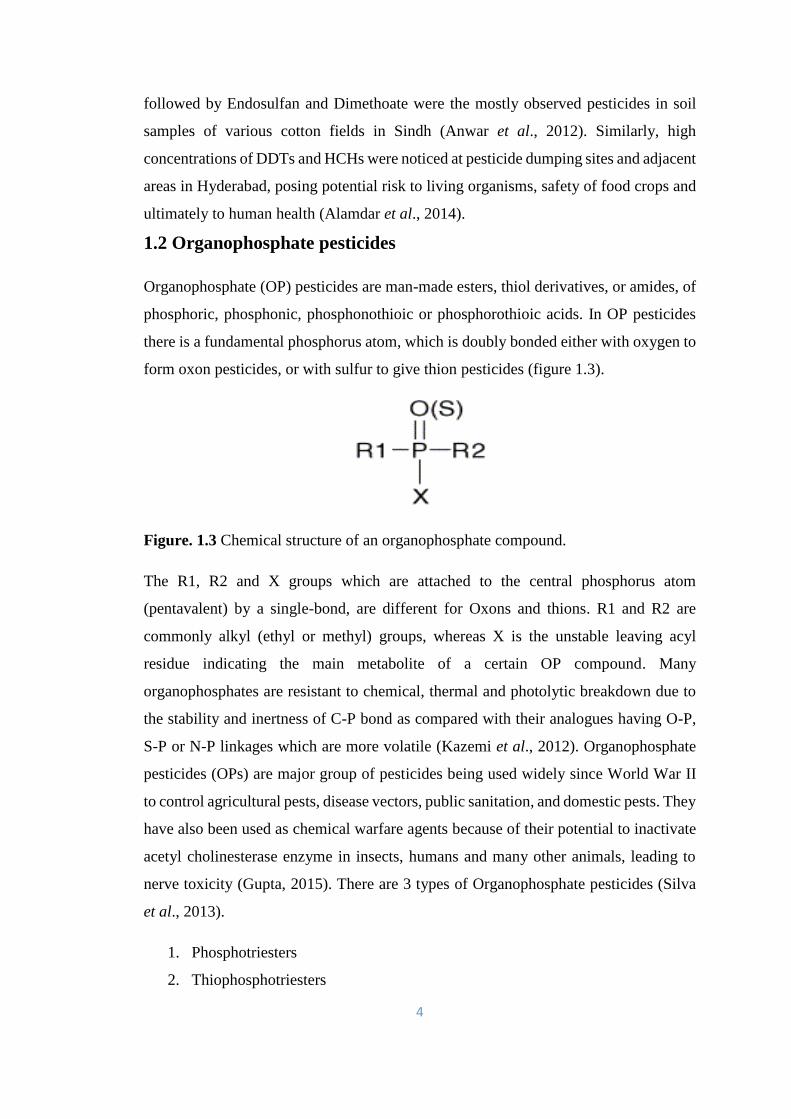
there is a fundamental phosphorus atom, which is doubly bonded either with oxygen to
form oxon pesticides, or with sulfur to give thion pesticides (figure 1.3).
Figure. 1.3 Chemical structure of an organophosphate compound.
The R1, R2 and X groups which are attached to the central phosphorus atom
(pentavalent) by a single-bond, are different for Oxons and thions. R1 and R2 are
commonly alkyl (ethyl or methyl) groups, whereas X is the unstable leaving acyl
residue indicating the main metabolite of a certain OP compound. Many
organophosphates are resistant to chemical, thermal and photolytic breakdown due to
the stability and inertness of C-P bond as compared with their analogues having O-P,
S-P or N-P linkages which are more volatile (Kazemi et al., 2012). Organophosphate
pesticides (OPs) are major group of pesticides being used widely since World War II
to control agricultural pests, disease vectors, public sanitation, and domestic pests. They
have also been used as chemical warfare agents because of their potential to inactivate
acetyl cholinesterase enzyme in insects, humans and many other animals, leading to
nerve toxicity (Gupta, 2015). There are 3 types of Organophosphate pesticides (Silva
et al., 2013).
1. Phosphotriesters
2. Thiophosphotriesters
5
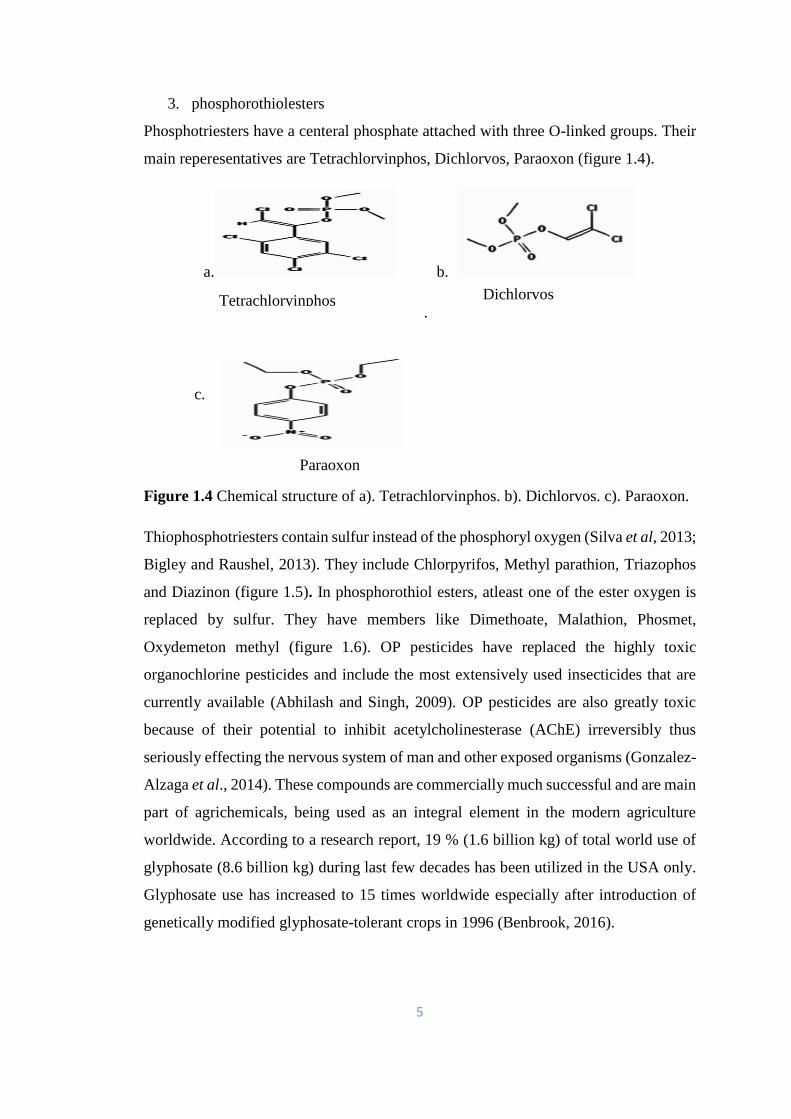
3. phosphorothiolesters
Phosphotriesters have a centeral phosphate attached with three O-linked groups. Their
main reperesentatives are Tetrachlorvinphos, Dichlorvos, Paraoxon (figure 1.4).
a. b.
.
c.
Figure 1.4 Chemical structure of a). Tetrachlorvinphos. b). Dichlorvos. c). Paraoxon.
Thiophosphotriesters contain sulfur instead of the phosphoryl oxygen (Silva et al, 2013;
Bigley and Raushel, 2013). They include Chlorpyrifos, Methyl parathion, Triazophos
and Diazinon (figure 1.5). In phosphorothiol esters, atleast one of the ester oxygen is
replaced by sulfur. They have members like Dimethoate, Malathion, Phosmet,
Oxydemeton methyl (figure 1.6). OP pesticides have replaced the highly toxic
organochlorine pesticides and include the most extensively used insecticides that are
currently available (Abhilash and Singh, 2009). OP pesticides are also greatly toxic
because of their potential to inhibit acetylcholinesterase (AChE) irreversibly thus
seriously effecting the nervous system of man and other exposed organisms (Gonzalez-
Alzaga et al., 2014). These compounds are commercially much successful and are main
part of agrichemicals, being used as an integral element in the modern agriculture
worldwide. According to a research report, 19 % (1.6 billion kg) of total world use of
glyphosate (8.6 billion kg) during last few decades has been utilized in the USA only.
Glyphosate use has increased to 15 times worldwide especially after introduction of
genetically modified glyphosate-tolerant crops in 1996 (Benbrook, 2016).
Dichlorvos Tetrachlorvinphos
Paraoxon

6
a. b.
c. d.
Figure 1.5. Chemical structure of a). Chlorpyrifos. b). Methyl parathion. c).
Triazophos. d). Diazinon.
a. b.
c. d.
Figure. 1.6 Chemical structures of: a). Dimethoate b). Malathion c). Phosmet d).
Oxydemeton methyl.
Diazinon
Triazophos
Methyl parathion Chlorpyrifos
Dimethoate Malathion
Phosmet Oxydemeton methyl
7
Even though OP compounds are considered harmless as compared to organochlorines,
yet they are still extremely neurotoxic for humans (Martin-Reina et al., 2017).
Pesticides may enter the living body by inhalation, ingestion, and skin penetration
(Garcia-Garcia et al., 2016). In the modern times, there are 140 types of pesticides as
well as plant growth regulators belonging to organophosphates being used worldwide.
Moreover it has been assessed that 1.5 thousand or more types of organophosphates
had been manufactured during the last century (Kang et al., 2006). Though they may
be very beneficial as insecticides, their exhaustive and haphazard use has resulted in
acute and chronic environmental threats and health issues (Suratman et al., 2015). The
inappropriate handling and improper storage of OP pesticides may give rise to severe
environmental hazards at both waste disposal sites especially near to cultivated areas as
well as at OP manufacturing factories resulting in leaching into soil/water resources.
These environmental risks and health hazards due to obsolete pesticides have the
potential to affect several countries (Matthews, 2015).
1.2.1 The toxicity of OP compounds and inhibition of Acetyl Cholinestrase (AChE)
OP pesticides are strong inhibitors of cholinesterase enzymes that function as
neurotransmitters. These enzymes include acetylcholinesterase, butylcholinesterase,
and pseudocholinesterase. These enzymes are inhibited as they bind to the OP
compound. This inhibition results in the accumulation of neurotransmitter acetylcholine
at neuron gaps (O'Brien, 2016). Under normal conditions, the Acetyl Cholinestrase
(AChE) catalyzes the hydrolysis reaction at the neuron synapsis and this reaction
depends on a serine residue present in the active site of enzyme reacting with the
carbonyl group in Acetylcholine (Ach) neurotransmitter compound. But when
organophosphates are present, the serine residue is phosphorylated quickly so that the
phosphorylated acetyl cholinesterase is inactivated (Santos et al., 2007). OP pesticides
are the most widely observed residues within contaminated foodstuff samples. These
include methamidophos, Chlorpyrifos and acephate as the major active components
which are causing food contamination (Silva et al., 2013; Xu et al., 2015).
Each year thousands of humans experience OPs toxicity all over the world. OP
pesticides along with some other chemicals have been declared as developmental
neurotoxicant since 2006 (Grandjean and Landrigan, 2014). It was reported that there
8
is more chance of cancer development in farm children exposed to pesticide-treated
agricultural fields (How et al., 2014). It had been observed that children affected by OP
pesticides were much expected to be diagnosed with attention deficit hyperactivity
disorder (ADHD) (Bouchard et al., 2010). Human exposure has been due to the
frequent use of OP pesticides in agriculture and their residues present in vegetables,
fruits, drinking water resources dairy and poultry products (Kim et al., 2017). Once in
the environment, pesticides are regulated by a number of biological, chemical and
physical routes. Though many OP pesticides can be degraded by microbial or
environmental methods, some of the pesticides may either be used up by living
organisms, or they might leach into ground water. When a pesticide reaches the ground
water, it can persist there as such for a significant period of time. As no sunlight
approaches in ground water, pesticide degradation is reduced, enhancing their possible
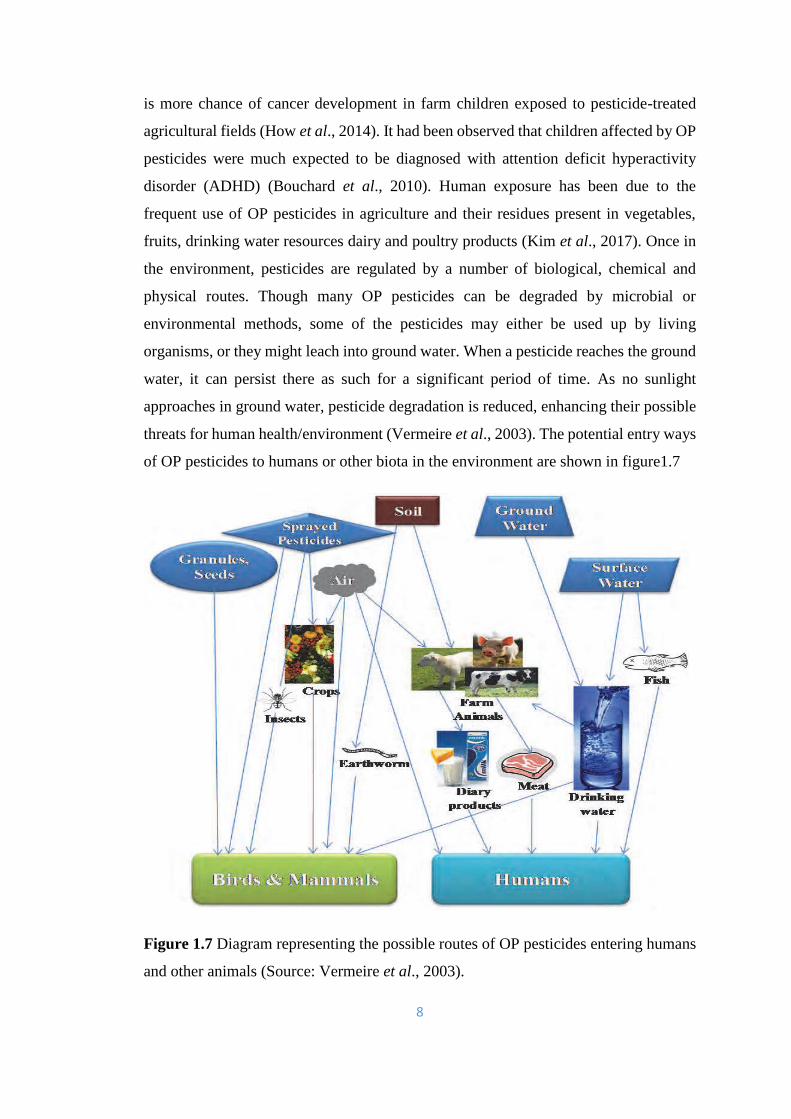
threats for human health/environment (Vermeire et al., 2003). The potential entry ways
of OP pesticides to humans or other biota in the environment are shown in figure1.7
Figure 1.7 Diagram representing the possible routes of OP pesticides entering humans
and other animals (Source: Vermeire et al., 2003).
9
Toxicity of OP compounds interacts with any given biological system depending upon
dose and is expressed as lethal dose (LD) which is the dose required to kill 50% of the
given animal species (LD50). These LD50 values are usually expressed as amount per
unit weight (mg/kg). There are both living as well as non-living factors responsible for
pesticide degradation in the natural environment. Yet microbes are the major
contributors for pesticide removal in various environmental compartments (Moorman,
2018). The studies on microbial degradation are helpful to develop strategies for
decontamination of pesticides. Biodegradation has become an important method to
remove organic impurities due to its cheap cost and less negative after-effects like
devastation of native animal and plant organisms as against other remediation
techniques (Verma et al., 2014). Recently isolation of indigenous bacteria that are able
to transform OP pesticides has been a focus for many scientists as these bacteria offer
a technique for in situ detoxification of pesticides and is also an environment friendly
method (Tang et al., 2017). The degradation of the pesticide deposits in the soil by the
natural local microflora is a much slower process which may be accelerated by
externally inoculating the soil with more competent/effective degrading microbes by
the practice of bioaugmentation (Cycon et al., 2013). Cyanobacteria have also been
reported to degrade OP pesticides. Malathion was removed by Nostoc muscorum up to
91% (Ibrahim et al., 2014). A bacterial strain Ochrobactrum sp. HZM was reported to
utilize quinalphos, profenofos, parathion‐methyl and chlorpyrifos as energy sources
(Talwar et al., 2014). Ortiz-Hernandez et al. (2003) revealed tetrachlorvinphos (TCV)
degradation by bacterial co-culture. Bacillus aryabhattai could degrade 70% parathion
within 120 hrs in mineral broth (Pailan et al., 2015). It has been observed that certain
native microorganisms living in polluted environments for a long period of time have
become adapted to these contaminants due to genetic evolution. These locations are the
most suitable ecological places for the isolation of OP degrading strains (Ortiz-
Hernandez et al., 2013). Hossain et al. (2015) reported complete removal of 20 mg/l
CPF by three bacterial strains within 8 -10 days.
1.3 Chlorpyrifos (CPF)
Chlorpyrifos is an important organophosphate pesticide used to control a large variety
of agricultural, veterinary and domestic pests (Das and Adhya, 2015). Generally half-
life of Chlorpyrifos in soil ranges from 60 to 120 days. Yet it may be as low as 2 weeks
to as long as more than one year, due to differences in the formulation, rate of
10
application, soil type, and the environmental conditions like soil type, pH, temperature
etc. (Racke et al., 1994; Williams et al., 2014). Soil bound Chlorpyrifos may undergo
break down by chemical hydrolysis, dechlorination, UV light and soil microbes
(Williams et al., 2014). Chlorpyrifos was reported to be immobile in certain soils like
clay, clay loam and peat (Halimah et al., 2016). Chlorpyrifos binding to soil particles
is very strong. It is less water soluble, thus has low mobility through soil. While its
metabolite TCP loosely binds to soil particles and is considerably more leachable in
soils (John and Shaike, 2015; Jaiswal et al., 2017). The widespread usage of
chlorpyrifos has led to pollution of soils in addition to water resources causing great
harm to non-target species (Solomon et al., 2014). The CPF contamination has been
noticed up to approximately 24 kilometres from the place of its application (Bhagobaty
et al., 2007). CPF being an OP pesticide has the potential to cause diseases like
Alzheimer’s and chronic fatigue (Peris-Sampedro et al., 2015). Neurobehavioural,
cardiovascular, and the respiratory health problems may have a link to low level
exposure to CPF due to its high acute toxicity resulting in increased public concern
about the extensive use of Chlorpyrifos in agriculture having potential human health
risks (Deeba et al., 2017; Dominah et al., 2017). Among organophosphates,
Chlorpyrifos is the much comprehensively studied pesticide. It interrupts neurons
duplication and maturation, axon production and neural function resulting in
developmental defects associated with experimental animals (used as models of
developmental CPF action) as well as in children highly exposed to CPF present in the
environment (De Felice et al., 2016). Among CPF breakdown products both CPF oxon
and trichloropyridinol have been reported as less effective to inhibit DNA synthesis in
neurons as compared with the parent compound (Wu et al., 2017). Physical and
chemical Properties of CPF are given in Table 1.1.
1.3.1 Mode of Action
CPF acts in a similar way for both intended and non-intended organisms (Roberts and
Reigart, 2013). Chlorpyrifos inhibits the cholinesterase enzyme, which results in
buildup of Acetylcholine in the synaptic gap causing over-reactivity of the neurons,
leading to neurological toxicity which ultimately may kill the CPF exposed organism.
Potentially lethal symptoms include diarrhea, neck muscle weakness, and respiratory
depression (Jacquet et al., 2016). In addition to cholinesterase, many other
11
biomolecules are probable targets for chlorpyrifos poisoning including interruption of
macromolecular (nucleic acids and proteins) synthesis, cytotoxicity and also
interactions with several enzymes. In humans, symptoms of CPF severe toxicity include
pain in head, weakness, vomiting, dizziness, muscle jerking, increased sweating and
salivation, happen as a result of about 50% decrease in cholinesterase activity (Eaton et
al., 2008). In case of mammalion non target organisms, CPF interrupts many other
enzymes, like A-esterases and carboxylesterases that occur in many mammalian
systems, though the function of these enzymes is not well understood (Karanth and
Pope, 2000).
1.3.2 Acute toxicity of CPF to non-target organisms
In general, LD50 is expressed as mg (milligrams) of the chemical per kg (kilogram) of
body weight, while LC50 is mostly expressed as weight (e.g mg) of the chemical per
volume (e.g liter) of the medium (air or water) to which the organism is exposed
(Adamson, 2016).
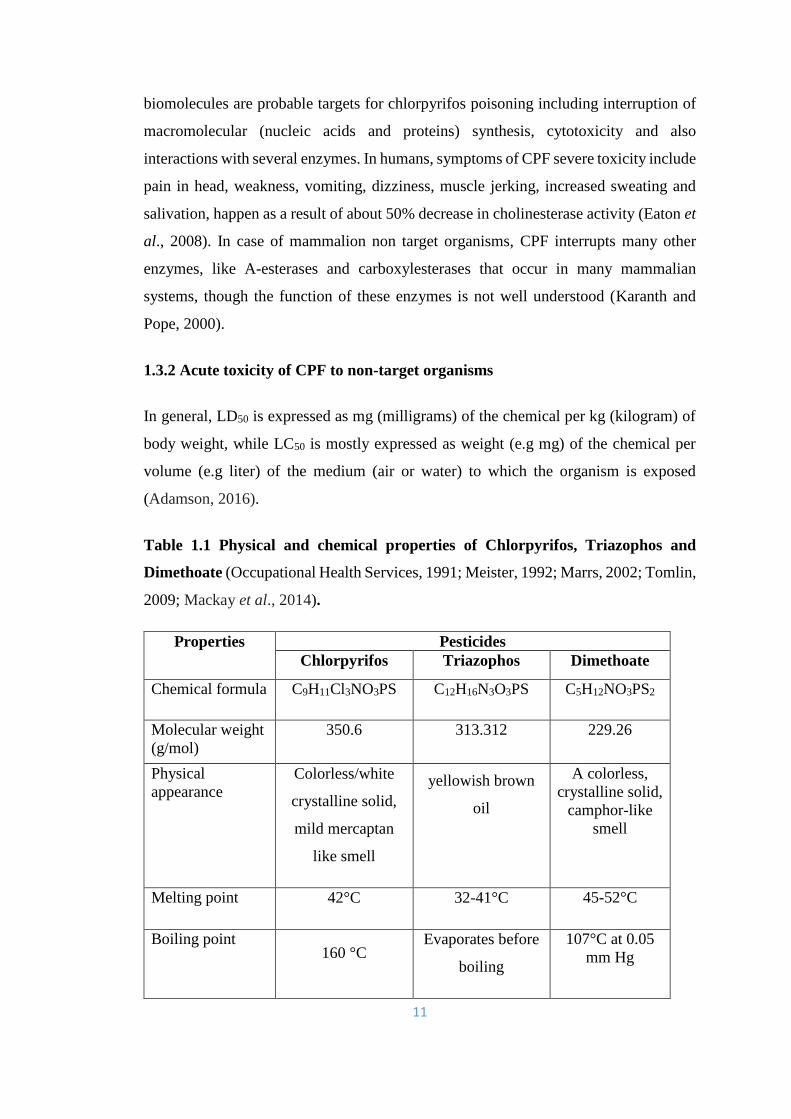
Table 1.1 Physical and chemical properties of Chlorpyrifos, Triazophos and
Dimethoate (Occupational Health Services, 1991; Meister, 1992; Marrs, 2002; Tomlin,
2009; Mackay et al., 2014).
Properties Pesticides
Chlorpyrifos Triazophos Dimethoate
Chemical formula C9H11Cl3NO3PS C12H16N3O3PS C5H12NO3PS2
Molecular weight
(g/mol)
350.6 313.312 229.26
Physical
appearance
Colorless/white
crystalline solid,
mild mercaptan
like smell
yellowish brown
oil
A colorless,
crystalline solid,
camphor-like
smell
Melting point 42°C 32-41°C 45-52°C
Boiling point 160 °C
Evaporates before
boiling
107°C at 0.05
mm Hg
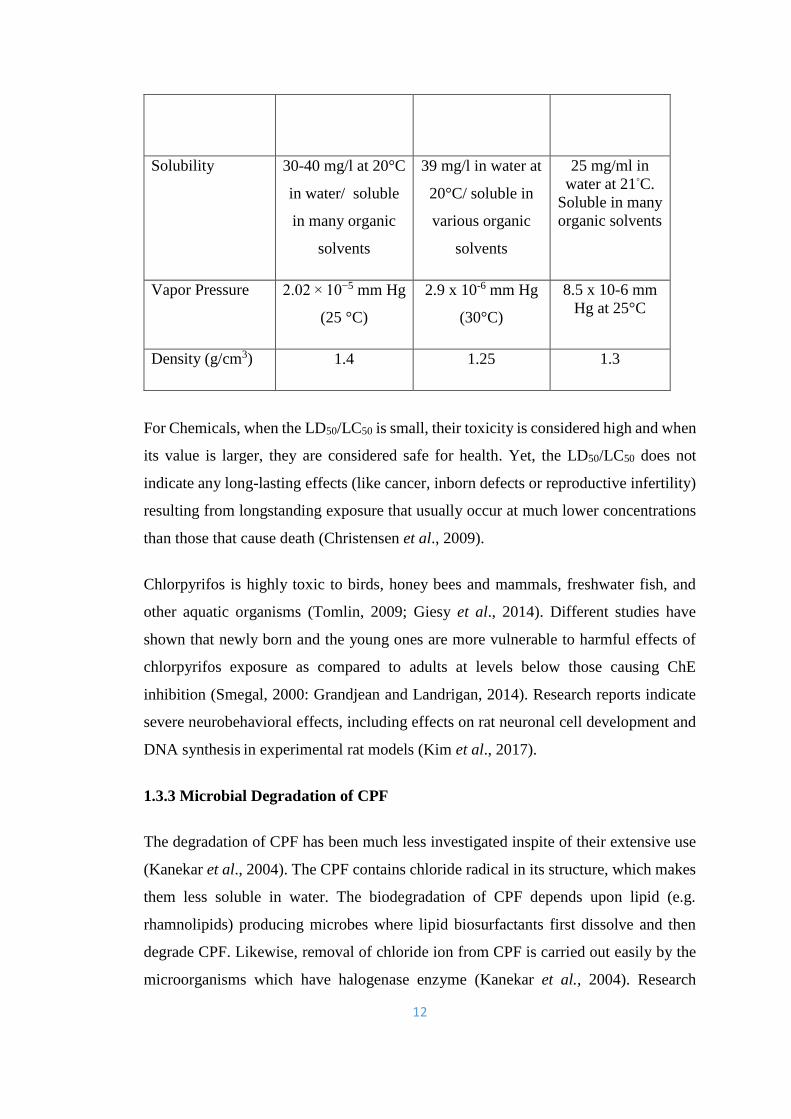
12
Solubility 30-40 mg/l at 20°C
in water/ soluble
in many organic
solvents
39 mg/l in water at
20°C/ soluble in
various organic
solvents
25 mg/ml in
water at 21◦C.
Soluble in many
organic solvents
Vapor Pressure 2.02 × 10⁻⁵ mm Hg
(25 °C)
2.9 x 10⁻⁶ mm Hg
(30°C)
8.5 x 10⁻⁶ mm
Hg at 25°C
Density (g/cm3) 1.4 1.25 1.3
For Chemicals, when the LD50/LC50 is small, their toxicity is considered high and when
its value is larger, they are considered safe for health. Yet, the LD50/LC50 does not
indicate any long-lasting effects (like cancer, inborn defects or reproductive infertility)
resulting from longstanding exposure that usually occur at much lower concentrations
than those that cause death (Christensen et al., 2009).
Chlorpyrifos is highly toxic to birds, honey bees and mammals, freshwater fish, and
other aquatic organisms (Tomlin, 2009; Giesy et al., 2014). Different studies have
shown that newly born and the young ones are more vulnerable to harmful effects of
chlorpyrifos exposure as compared to adults at levels below those causing ChE
inhibition (Smegal, 2000: Grandjean and Landrigan, 2014). Research reports indicate
severe neurobehavioral effects, including effects on rat neuronal cell development and
DNA synthesis in experimental rat models (Kim et al., 2017).
1.3.3 Microbial Degradation of CPF
The degradation of CPF has been much less investigated inspite of their extensive use
(Kanekar et al., 2004). The CPF contains chloride radical in its structure, which makes
them less soluble in water. The biodegradation of CPF depends upon lipid (e.g.
rhamnolipids) producing microbes where lipid biosurfactants first dissolve and then
degrade CPF. Likewise, removal of chloride ion from CPF is carried out easily by the
microorganisms which have halogenase enzyme (Kanekar et al., 2004). Research
13
studies indicate that CPF is broken down to DETP and TCP by hydrolysis during
biodegradation by bacteria. Yet limited studies have been conducted to search for the
metabolism and degradation products of CPF (Xu et al., 2007). The degradation by
microorganisms is now understood to be the basic tool which determines the
environmental outcome and conduct of Chlorpyrifos (Kulshrestha and Kumari, 2011;
Ortiz-Hernandez et al., 2013). Research studies on microbial degradation are vital in
developing strategies for bioremediation to detoxify Chlorpyrifos and other pesticides
(Chen et al., 2011). Bioremediation is the biological process that involves using living
organisms or their products like enzymes to change a toxic/harmful material to a non-
toxic substance or to achieve the original condition (before contamination) of the
contaminated environment (Singh, 2009). During the last decade, bioremediation has
been established as a safe, cost effective, easily handled and smooth method to clear-
out polluted environments (Gao et al., 2012). Many different chemicals have been
removed effectively from soils and aquatic environments using degrading microbes
(Alvarenga et al., 2015).
The Chlorpyrifos degrading bacteria have been sequestered from CPF contaminated
agricultural land deposits, industrial effluents and waste water in the recent years (Li et
al., 2007; Latifi et al., 2012; Supreeth and Raju, 2016; Rayu et al., 2017). In alkaline
soils, Chlorpyrifos is briskly hydrolyzed by the soil bacteria (Singh and Walker, 2006).
Strain Burkholderia cepacia KR100 could hydrolyze chlorpyrifos-methyl to 3, 5, 6-
trichloro-2-pyridinol (TCP) and was also capable of degrading chlorpyrifos (Kim and
Ahn, 2009). Strains Ralstonia sp. T6 and Cupriavidus sp. DT-1 were capable of
metabolizing both CPF and TCP (Li et al., 2010; Lu et al., 2013). Similarly, a
cyanobacterium Synechocystis sp. PUPCCC 64 could metabolize CPF in to 3, 5, 6-
trichloro-2-pyridinol (Singh et al., 2011). Microbes were important factor in
degradation of Chlorpyrifos in non-sterilized soil slurries of paddy soils (Das and
Adhya, 2015). It was revealed in a study that Penicillium sp., Bacillus sp. and
Streptomyces thermocarboxydus were capable of degrading Chlorpyrifos in mineral
broth in the order: bacteria > fungi > actinomycetes (Eissa et al., 2014). A consortium
consisting of bacterial and fungal isolates (Cellulomonas fimi and Phanerochaete
chrysosporium) was able to completely remove CPF (50 mg/l) within 16 hrs, while
fungus alone took 6 days to degrade 50mg/l of Chlorpyrifos (Barathidasan et al., 2014).
14
A bacterial strain Acinetobacter calcoaceticus D10 could degrade 100 mg/l of CPF up
to 60% within 4 days (Zhao et al., 2014). It was revealed in a study that isolate Bacillus
safensis exhibited highest CPF degeadation followed by Bacillus subtilis and then
Bacillus cereus respectively (Ishag et al., 2016). Biodegradation is considered as the
most active route for the elimination of Chlorpyrifos even on the glacier surface
(Ambrosini et al., 2017).
1.3.4 Metabolic products of CPF
Chlorpyrifos metabolic pathway depends upon the various microorganisms involved in
the biotransformation and also the environmental conditions. It may result in four major
metabolites i.e 3, 5, 6-trichloropyridinol, chlorpyrifos oxon, Diethyl phosphate and
Diethyl thiophosphate (Sanchez-Hernandez et al., 2018). The CPF degradation
pathway leads to the formation of two unstable metabolites (chlorpyrifos oxon and
desethyl chlorpyrifos). Further, these metabolites are hydrolyzed to form the major
metabolite TCP, which is ultimately broken down to trichloro methoxypyridinol/carbon
dioxide (Racke, 1993). It has been previously reported that TCP is persistent in the soil
having t1/2 from 42-49 days in top soils and 64 -117 days in subsurface soils (Racke,
1993; Baskara et al., 2003). But in acidic top soils, the t1/2 of TCP has been reported
from 10 to 325 days (Racke, 1993). The major metabolites of CPF formed in soils,
plants and animals are identical to each other. These metabolites (diethyl phosphates
and 3, 5, 6-trichloropyridinol) are produced by hydrolysis/oxidative dealkylation of
CPF (Das and Adhya, 2015; Li et al., 2017).
So, briefly a great variety of microorganisms have been explored that are able to break
down CPF. Future studies must be sought for the complete mineralisation of
Chlorpyrifos as some of the intermediate metabolites of CPF degradation like TCP are
more insistent towards degradation by microbes and has also antimicrobial action.
Moreover, there should be enhanced research for co-culture of two or more
microorganisms, in order to achieve complete degradation of both chlorpyrifos and
TCP.
15
1.4 Triazophos (TAP)
Triazophos (TAP) has been an effective alternate to highly toxic organophosphate
pesticides, and applied worldwide on crops (maize, cotton, vegetables and paddy rice
etc.) for the last 40-50 years (Lin and Dongxing, 2005). Triazophos is being used with
wide-range and random effects as insecticide and miticide with a certain degree of
nematicidal effects. It exhibits tremendous preventive effects for many pests of the
major crops (grain, cotton and vegetables), such as stem borers, rice plant hoppers,
spider mites, cotton bollworms, lepidoptera and nematodes etc. (Aungpradit et al.,
2007). But its extensive use has resulted in environmental contamination by the TAP.
There are reports of higher concentrations of TAP in food, soil and water resources
(Zhong et al., 2006; Cherukuri et al., 2015; Bhamore et al., 2016). Average t1/2 of
Triazophos in different plant parts of wheat is 5.22 days, whereas in soil, it is 7.93 days
(Li et al., 2008). TAP may be harmful to beneficial organisms as it is inhibitor of
enzyme acetyl cholinesterase and neurotoxicant, thus possibly posing hazard to
mankind. It can also show genotoxicity, damaging immune genes and membrane
structural proteins of non- intended organisms (Zhong et al., 2005; Xiao et al., 2010;
Zhu et al., 2014; Wu et al., 2018). Ghaffar et al. (2014) conducted a research in Pakistan
to analyze the changes in blood composition caused by oral intake of TAP in birds
(male quail). They reported several medical symptoms like messy feathers, trembles,
watery stools, saliva secretion, less count of crowing and mating at high TAP
concentrations (6 and 8mg/kg/day) in treated Quails. Mahboob et al. (2015) studied the
severe effects of Triazophos in Cirrhinus mrigala baby fish in Pakistan and reported
critical toxic stress (choking, bottom dwelling, inconsistent swimming, exhaustion and
swigging before death). Therefore, it is need of the day to increase public concern about
its biological and ecological effects and to search for an efficient/suitable technique to
remove TAP residue. Physical and chemical properties of TAP are given in Table 1.1.
1.4.1 Biodegradation of TAP
Cheng et al. (2007) reported the 41–55% removal of Triazophos by Canna indica
(Linn.) in a water culture system. Research on biodegradation helps in developing
strategies to clear up pollutants by microorganisms (Hayatsu et al. 2000). Only few
triazophos degrading bacteria have been obtained from various sites (Wang et al., 2005;

16
Yang et al., 2011; Gu et al., 2014). Liang et al. (2011) revealed greater adsorption
tendency and microbial degradation of Triazophos along with chlorpyrifos, 1-phenyl-
3-hydroxy-1, 2, 4-triazole and 3, 5, 6-trichloro-2-pyridinol within paddy soil. Wu et al.,
(2016) reported the positive role of microbes in removal of TAP from polluted
wetlands. A bacterial isolate Roseomonas rhizosphaerae sp. nov. YW11T was reported
to be capable of degrading TAP (Chen et al., 2014). Isolate Pseudomonas stutzeri YC-
YH1 was capable of degrading Triazophos and other OP pesticides (Shi et al., 2015).
Burkholderia sp. SZL-1 was reported to hydrolyze Triazophos into 1-phenyl-3-
hydroxy-1, 2, 4-triazole (Zhang et al., 2016).
Figure 1.8 The chemical structures of triazophos and its main metabolite 1-phenyl-3-
hydroxy-1, 2, 4-triazole.
1.4.2 Metabolites of Triazophos
The well-known intermediate of TAP degradation is 1-phenyl-3-hydroxy-1, 2, 4-
triazole, which is formed by the hydrolytic break down of P–O ester bond in triazophos
molecule (Dai et al., 2007; Liang et al., 2011). Lin and Dongxing (2005) identified 4
main degradation products of TAP (monoethyl phosphorothioic acid, O, O diethyl
phosphorothioic acid, phosphorothioic acid and 1-phenyl-3-hydroxy-1, 2, 4-triazole).
Much earlier Schwalbe-Fehl and Schmidt (1986) working on degradation pathway of
TAP in dogs and rats suggested 3 metabolites of TAP i.e 1-phenyl-3-hydroxy-(1H)-1,
2, 4-triazole and its two conjugation products with glucuronide and sulfate. TAP oxon
and Phenylsemicarbazine has also been reported as metabolite of TAP in soil (Bock,
1975). Triazophos is one of major organophosphate pesticides being used worldwide
but there are only few reports on microbial degradation and metabolites of TAP as given
above. There is still no research done on TAP microbial degradation in Pakistan, though
it is being used here extensively contributing to TAP contamination in land and water
bodies. The main objective behind the present research work is to evaluate the potential
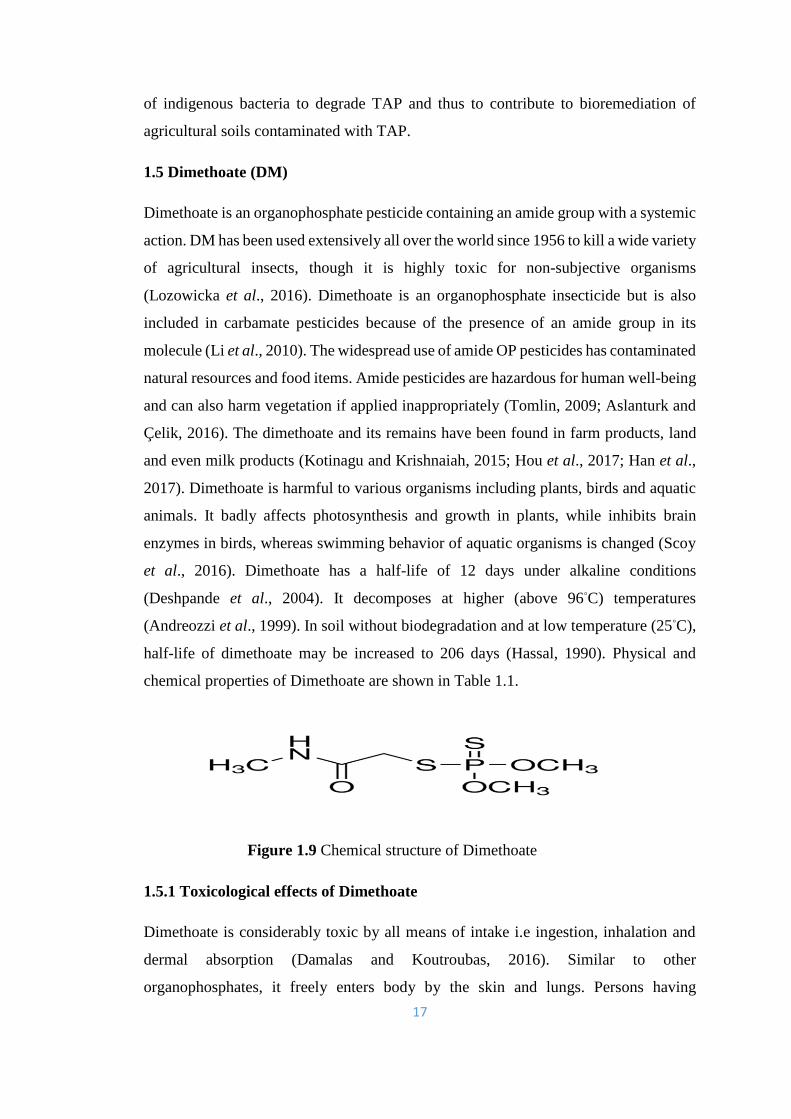
17
of indigenous bacteria to degrade TAP and thus to contribute to bioremediation of
agricultural soils contaminated with TAP.
1.5 Dimethoate (DM)
Dimethoate is an organophosphate pesticide containing an amide group with a systemic
action. DM has been used extensively all over the world since 1956 to kill a wide variety
of agricultural insects, though it is highly toxic for non-subjective organisms
(Lozowicka et al., 2016). Dimethoate is an organophosphate insecticide but is also
included in carbamate pesticides because of the presence of an amide group in its
molecule (Li et al., 2010). The widespread use of amide OP pesticides has contaminated
natural resources and food items. Amide pesticides are hazardous for human well-being
and can also harm vegetation if applied inappropriately (Tomlin, 2009; Aslanturk and
Çelik, 2016). The dimethoate and its remains have been found in farm products, land
and even milk products (Kotinagu and Krishnaiah, 2015; Hou et al., 2017; Han et al.,
2017). Dimethoate is harmful to various organisms including plants, birds and aquatic
animals. It badly affects photosynthesis and growth in plants, while inhibits brain
enzymes in birds, whereas swimming behavior of aquatic organisms is changed (Scoy
et al., 2016). Dimethoate has a half-life of 12 days under alkaline conditions
(Deshpande et al., 2004). It decomposes at higher (above 96◦C) temperatures
(Andreozzi et al., 1999). In soil without biodegradation and at low temperature (25◦C),
half-life of dimethoate may be increased to 206 days (Hassal, 1990). Physical and
chemical properties of Dimethoate are shown in Table 1.1.
Figure 1.9 Chemical structure of Dimethoate
1.5.1 Toxicological effects of Dimethoate
Dimethoate is considerably toxic by all means of intake i.e ingestion, inhalation and
dermal absorption (Damalas and Koutroubas, 2016). Similar to other
organophosphates, it freely enters body by the skin and lungs. Persons having
18
respiratory syndromes, recently exposed to cholinesterase inhibitors, already reduced
cholinesterase production, or having liver diseases may be highly threatened by
exposure to DM. Dimethoate toxicity may be boosted by elevated temperatures or
visible/UV light exposure of DM (Occupational Health Services, 1991). Severe eye
irritation has been reported to occur in industrial workers manufacturing Dimethoate,
firefighters and farmers when exposed to fumes of dimethoate (Mattos and Lorripa,
1982; Pham et al., 2016). In an experimental study, human lymphocytes were damaged
by dimethoate in a dose dependent manner (Soni et al., 2016). Being an
organophosphate insecticides, dimethoate is a cholinesterase inhibitor and is extremely
toxic by all means of exposure. Inhalation of DM results in coughing, runny nose, chest
pain, short breathing. Similarly, contact with Dimethoate through skin may give rise to
local sweating and spontaneous muscle tightening while eye contact would cause
blurred vision, pain and tears/ bleeding. The systemic effects may start immediately or
after up to 12 hrs of exposure by any means. Higher level of toxicity will damage the
central nervous system, thus producing incoordination, loss of reflexes, speech
difficulty, lethargy, jolting, tongue/eyelids trembling, and ultimately paralyzing the
body and leading to death (Occupational Health Services, 1991). For adult humans,
cholinesterase inhibition was observed at 30 mg/day or higher dosage (Hayes and Laws
1990). The continued exposure as well as severe exposure to Dimethoate may result in
the similar effects.
Dimethoate was found as carcinogenic, mutagenic teratogenic in cats and rats (Hayes,
1982; Hallenbeck and Cunningham-Burns, 1985). Dimethoate appeared to be less toxic
for animals having fast DM metabolism and larger weight ratios of liver to body (Hayes
and Laws, 1990). Dimethoate is more toxic to birds than mammals as birds cannot
metabolize dimethoate as quickly as mammals (Hudson et al., 1984; Meister, 1992).
Dimethoate (500 mg/kg) caused significant mortality within 24 hrs in rabbits and
symptoms included congestion, hemorrhages, and extensive degeneration in vital
organs of liver, kidneys, and brain (Baba et al., 2015).
1.5.2 Environmental fate of Dimethoate
Dimethoate is rapidly biodegraded in waste water treatment tanks. It under goes
significant leaching as it is highly soluble in water and is weakly adsorbed to soil
19
particles. There is hydrolytic degradation of DM, particularly under high pH condition.
Its evaporation occurs in dry soil surfaces. 23 to 40% of applied Dimethoate have been
reportedly lost by evaporation. Significant DM biodegradation (77%) has been reported
in a non-autoclaved soil within 14 days (Howard, 1991; USDA, 1990). T ½ of
dimethoate varies from 4 -122 days in soil. The rate of dimethoate break down increases
in moist soils and DM is readily degraded by soil microbes (Howard, 1991). There is
no Dimethoate adsorption to deposits or scattered particles under water bodies. It is
expressively hydrolyzed, specifically in waters with basic pH. It does not undergo
photolytic breakdown and is not evaporated significantly from surfaces of water bodies.
Its half-life was 8 days in fresh water body (river) and removal was probably as a result
of microbial and/or chemical degradation (Anyusheva et al., 2016). The half-lives of
dimethoate in purple flowering stalk, celery, Chinese kale and soil were reported to be
5.9–6.5, 3.5–5.4, 3.8–5.1, 3.4–3.6 days respectively (Chen et al., 2018).
1.5.3 Microbial degradation of Dimethoate
There has been a significant role for microorganisms to degrade or detoxify amide/OP
pesticides. Moreover metabolic pathways of pesticides by microbes have also been
revealed (Hashimoto et al., 2002; Li, et al., 2010; Pandey et al., 2010; Zhang et al.,
2011). Pseudomonas sutzeri was reported to tolerate dimethoate up to 900ppm and
completely removed dimethoate at pH8.5 and 30°C within72 hrs of treatment (Jadhav,
2014). There have been some reports for bacterial degradation of dimethoate from
different sites (Deshpande et al. 2001; DebMandal et al. 2002 and 2005). DebMandal
et al. (2008) reported four unidentified potential metabolites of dimethoate formed by
Bacillus licheniformis and Pseudomonas aeruginosa. Being a member of carbamate
pesticides, DM is slightly less readily degraded as compared with other common
organophosphates (Kanekar et al., 2004). The stability of dimethoate in nature depends
upon pH, temperature and type of the medium (Megeed and El-Nakieb, 2008). Liu et
al. (2001) reported 71.82% degradation of dimethoate by Pseudomonas stutzeri within
72 hrs. Pseudomonas putida and Bacillus pumulus could degrade DM up to 88 and 92%
respectively after72 hrs of incubation (Madhuri, 2014). 100 mg/l of dimethoate was
completely removed under 6 hrs of incubation in liquid culture by Paracoccus sp. (Li
et al., 2010). The concept of Effective Microorganisms (EM) utilizes different types of
microorganisms including bacteria, fungi, actinomyces and cyanobacteria. This unique
20
approach of the Effective Microorganisms was utilized by Megeed and El-Nakieb
(2008) to study the degradation of dimethoate in broth using the microbial consortia
that could tolerate and completely degrade dimethoate up to 120 mg/l within 3 days.
Strain Raoultella sp. could remove dimethoate up to 75% co-metabolically (Liang et
al., 2009).
Generally, microbial degradation of pesticides follows two types of mechanisms. The
first type is catabolism that utilizes both individual isolates as well as consortia that are
able to utilize precise pesticides as a sole source of carbon (Barton et al., 2004). The
individual components of mixed microbial cultures are not able to utilize chemicals as
a source of carbon/energy, so they are defined independently (Shelton and Somich,
1988). The second type is co-metabolism that indicates the biotransformation of a non-
growth substance only in the existence of an obligatory substrate needed for growth
(Liang et al., 2009). In this case, there is mutual use of enzymes for transformation of
the secondary substance as well as for utilizing primary growth substance. Optimization
of co-metabolism can be achieved by upholding the appropriate ratio of primary to
secondary substrates (Claus et al., 2007). Shinde et al. (2015) revealed that isolate
Pseudomonas spp.A1113 could degrade Dimethoate up to 19%. Chen et al. (2016)
reported the expression of cloned gene (dmhA) belonging to Sphingomonas, responsible
for dimethoate amidohydrolase in Escherichia coli BL21, which could transform DM
into two metabolites (methylamine and dimethoate carboxylic acid). Two bacterial
isolates Acinetobacter sp. Yj2 and Bacillus sp. Yj3 were able to degrade Dimethoate
due to the action of both acid and alkaline phosphatases having key roles in degrading
organophosphates (Yang et al., 2016). Begum et al. (2016) revealed the isolation of B.
pumilus from agricultural soil of Tamil Nadu which was very effective in DM
degradation. Co-culture of bacterial isolates Enterobacter cloacae, Panteoa sp,
Pseudomonas putida were reported to play important role in DM degradation in
Tunisian soil having t1/2 of 2.39 days for dimethoate in non-sterilized soil as compared
to 3.3 days in sterilized soil (Salem et al., 2016). Cellulolytic bacterial isolates
Pseudomonas putida and Bacillus pumulus could degrade dimethoate up to 88 and 92%
respectively within72 hrs of incubation (Madhuri, 2014).
21
1.5.4 Metabolites of Dimethoate
Li et al (2010) identified many metabolites of dimethoate (O,O,S-trimethyl
thiophosphorothioate , dimethoate carboxylic acid, 2-(hydroxyl (methoxy)
phosphorylthio)acetic acid, and O-methyl O,S-dihydrogen phosphorothioate etc,)
formed by Paracoccus sp. thus suggesting a metabolic pathway for DM. The
degradation of dimethoate even in mammals and plants has been reported (Gandhi et
al., 2015; Meghesan-Breja et al., 2017). Though Omethoate (dimethoate Oxon) is
considered as most common metabolite of dimethoate, but in plants, Dimethoate
carboxylic acid, Omethoate carboxylic acid and des-O-methyl-dimethoate carboxylic
acid were also reported as metabolites of DM in plants (Meghesan-Breja et al., 2017).
1.6 Microbial organophosphate degrading enzymes
Among the OP degrading enzymes, earliest isolated is phosphotriesterase (PTE). This
enzyme is capable of hydrolyzing variety of OP compounds (Serdar et al., 1989; Singh
et al., 2006). Another name for this enzyme is organophosphorus hydrolase (OPH) and
it shows great catalytic activity to hydrolyze a large number of organophosphates by
breaking P-S and P-O linkages. Enzymes mainly derived from microbes, like OPH,
OPAA (OP acid anhydrolases) and methyl parathion hydrolase (MPH), have been
proved as strong mediators for OP removal (Schenk et al., 2016). Ortiz-Hernandez et
al. (2003) tested a number of organophosphate pesticides with phosphotriesterase
isolated from Flavobacterium sp. They noted that some chemical structures of OP (like
TCV) were not responsive towards the enzyme activity. Gao et al. (2014) revealed that
immobilized OpdA was very effective to remove methyl parathion from solution. The
OP compounds detoxify initially by hydrolysis, which is considered a vital step as they
become more exposed for further microbial breakdown (Pinto et al., 2017). There have
been extensive studies to understand the process of hydrolysis and also its kinetic
features (Ortiz-Hernandez et al., 2003). Among OP hydrolases OpdA extracted from
Agrobacterium radiobacter is much effective enzyme (Selleck et al., 2017). The OP
hydrolase is capable of detoxifying OP-polluted environments (Ortiz-Hernandez et al.,
2011). Though there is much diversity of enzyme systems, but OPH and OPAA have
been focus of most studies of organophosphorus degrading enzymes.
22
OPDA has similarity to OPH in general secondary structure, yet these two enzymes
differ in substrate specificities due to difference in active site structure and thus OPDA
prefers for substrates having smaller alkyl substituents. It has been suggested that OPH
naturally evolved to OPDA by mutation in active site (Yang, 2003). There is another
important enzyme OPAA (organophosphorus acid anhydrolase), isolated from different
species of Alteromonas (Cheng et al., 1997). OPAA is less responsive for P–O but more
for P–F linkage (Hill et al., 2001). This enzyme has been found in both prokaryotes and
various eukaryotes thus suggesting its primitive origin (Cheng et al., 1999). Some other
organophosphorus degrading enzymes like parathion hydrolases,
aryldialkylphosphatase (ADPase), phosphotriesterases have been reported which are
structurally and functionally different (Mulbry and Karns, 1989a; Mulbry, 1992;
Mulbry, 2000; Horne et al., 2002). There have been reports of only a few
organophosphate hydrolyzing enzymes isolated from fungi including laccase (phenol
oxidase), A-OPH, P-OPH (Amitai, 1998; Liu et al., 2001; Liu et al., 2004). These
enzymes that have capability to immobilise or degrade organophosphate residues, may
be applied in bioreactors to decontaminate polluted water, after post-harvest
purification of farm /animal products to decrease or remove pesticide levels. Recently
Phosphotriesterase‐Like‐Lactonase (PLL) enzymes have been extracted from
thermophilic/extremophilic bacteria/hyperthermophilic archaea having extraordinary
thermal stability and are much promising for detoxification of OPs/nerve agents
(Manco et al., 2018).
1.7 Modern Analytical methods for the analyses of Pesticides
Multiple approaches like enzymatic analyses along with colorimetric methods have
been explored for the detection of organophosphates in different samples (Turner et al.,
2015). Chromatographic methods assisted with various detectors and spectroscopy
along with immunoassays/enzyme biosensors using cholinesterase activity inhibition
have been used for detecting pesticides and other pollutants (Samuels and Obare, 2011;
Tuzimski and Sherma. 2015; Zhang et al., 2016). Recently, Mass spectrometry (MS)
methods are being successfully applied for the qualitative and quantitative analysis of
several OP pesticides. These methods have extremely low detection limits (part per
billion and part per trillion) and also have the selective detection of analytes in multi-
residue samples (Wu et al., 2015). The mass spectrometry procedures are mostly joined
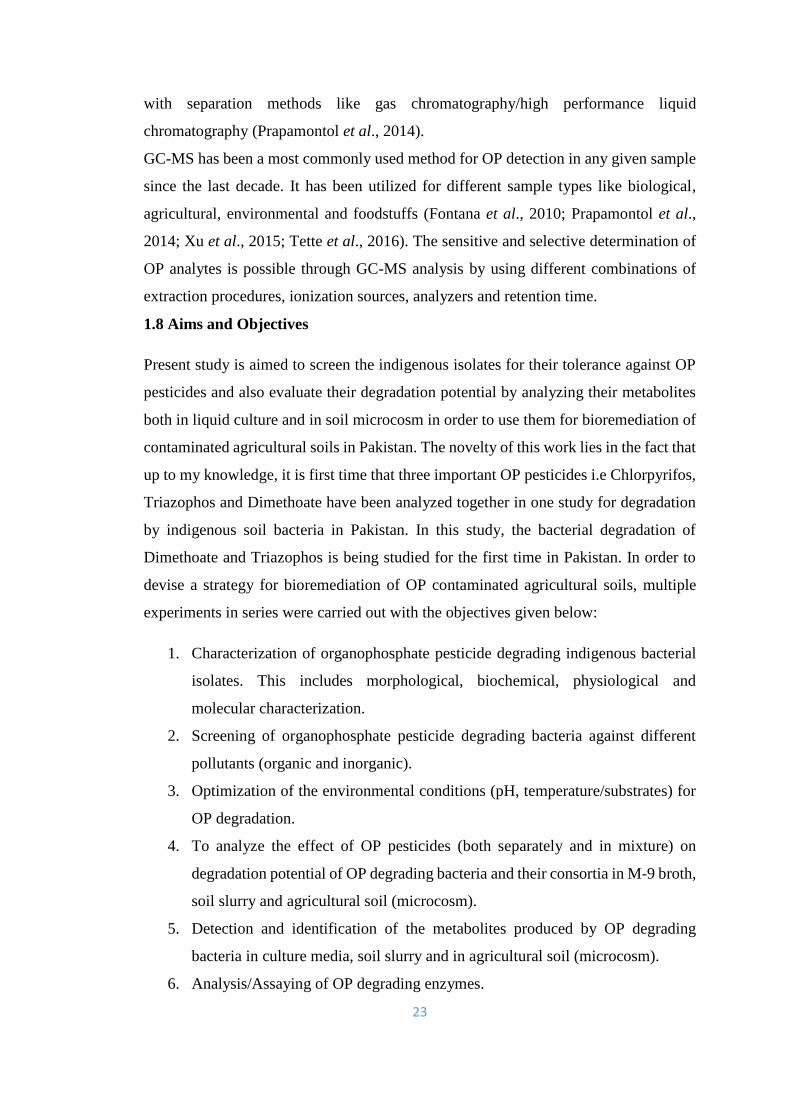
23
with separation methods like gas chromatography/high performance liquid
chromatography (Prapamontol et al., 2014).
GC-MS has been a most commonly used method for OP detection in any given sample
since the last decade. It has been utilized for different sample types like biological,
agricultural, environmental and foodstuffs (Fontana et al., 2010; Prapamontol et al.,
2014; Xu et al., 2015; Tette et al., 2016). The sensitive and selective determination of
OP analytes is possible through GC-MS analysis by using different combinations of
extraction procedures, ionization sources, analyzers and retention time.
1.8 Aims and Objectives
Present study is aimed to screen the indigenous isolates for their tolerance against OP
pesticides and also evaluate their degradation potential by analyzing their metabolites
both in liquid culture and in soil microcosm in order to use them for bioremediation of
contaminated agricultural soils in Pakistan. The novelty of this work lies in the fact that
up to my knowledge, it is first time that three important OP pesticides i.e Chlorpyrifos,
Triazophos and Dimethoate have been analyzed together in one study for degradation
by indigenous soil bacteria in Pakistan. In this study, the bacterial degradation of
Dimethoate and Triazophos is being studied for the first time in Pakistan. In order to
devise a strategy for bioremediation of OP contaminated agricultural soils, multiple
experiments in series were carried out with the objectives given below:
1. Characterization of organophosphate pesticide degrading indigenous bacterial
isolates. This includes morphological, biochemical, physiological and
molecular characterization.
2. Screening of organophosphate pesticide degrading bacteria against different
pollutants (organic and inorganic).
3. Optimization of the environmental conditions (pH, temperature/substrates) for
OP degradation.
4. To analyze the effect of OP pesticides (both separately and in mixture) on
degradation potential of OP degrading bacteria and their consortia in M-9 broth,
soil slurry and agricultural soil (microcosm).
5. Detection and identification of the metabolites produced by OP degrading
bacteria in culture media, soil slurry and in agricultural soil (microcosm).
6. Analysis/Assaying of OP degrading enzymes.
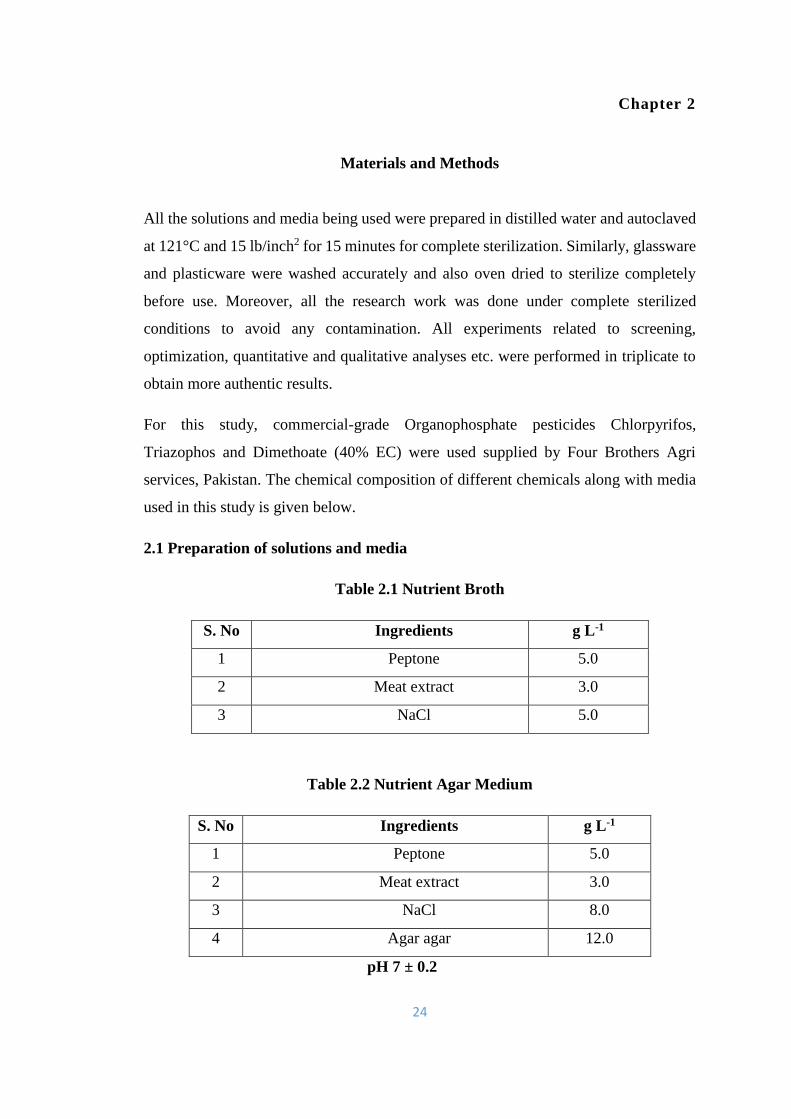
24
Chapter 2
Materials and Methods
All the solutions and media being used were prepared in distilled water and autoclaved
at 121°C and 15 lb/inch2 for 15 minutes for complete sterilization. Similarly, glassware
and plasticware were washed accurately and also oven dried to sterilize completely
before use. Moreover, all the research work was done under complete sterilized
conditions to avoid any contamination. All experiments related to screening,
optimization, quantitative and qualitative analyses etc. were performed in triplicate to
obtain more authentic results.
For this study, commercial-grade Organophosphate pesticides Chlorpyrifos,
Triazophos and Dimethoate (40% EC) were used supplied by Four Brothers Agri
services, Pakistan. The chemical composition of different chemicals along with media
used in this study is given below.
2.1 Preparation of solutions and media
Table 2.1 Nutrient Broth
S. No Ingredients g L-1
1 Peptone 5.0
2 Meat extract 3.0
3 NaCl 5.0
Table 2.2 Nutrient Agar Medium
S. No Ingredients g L-1
1 Peptone 5.0
2 Meat extract 3.0
3 NaCl 8.0
4 Agar agar 12.0
pH 7 ± 0.2

25
Table 2.3 M-9 Medium
S.
No
Ingredients g/l
1 Na2HPO4 6
2 KH2PO4 3
3 NaCl 0.5
4 NH4Cl 1.0
5 Agar 15
pH 7.4 ± 0.2
Among these ingredients in the media bottles, 1ml of 0.1M CaCl2 solution, 10 ml of
20% glucose solution (if required), 1ml of 1M MgSO4 solution and 5 g/l of Casein
hydrolysate were added after autoclaving of rest of the media, stirred and then poured
into the pre-autoclaved petri plates.
Table 2.4 Oxidase Test Reagent
S. No Ingredients g100 ml-1
1 NNNʹNʹ-Tetramethyl-p-Phenylenediamine
dihydrochloride
1.0 g
2 Distilled water 100 ml
Table 2.5 Oxidation Fermentation Medium
S. No Ingredients g m L-1
1 Peptone water 2.0
2 Sodium chloride 5.0
3 Dipotassium hydrogen phosphate 1.0
4 Bromothymol blue 0.03
5 Glucose 10.0
6 Agar agar 8.0
pH 7.1 ± 0.2
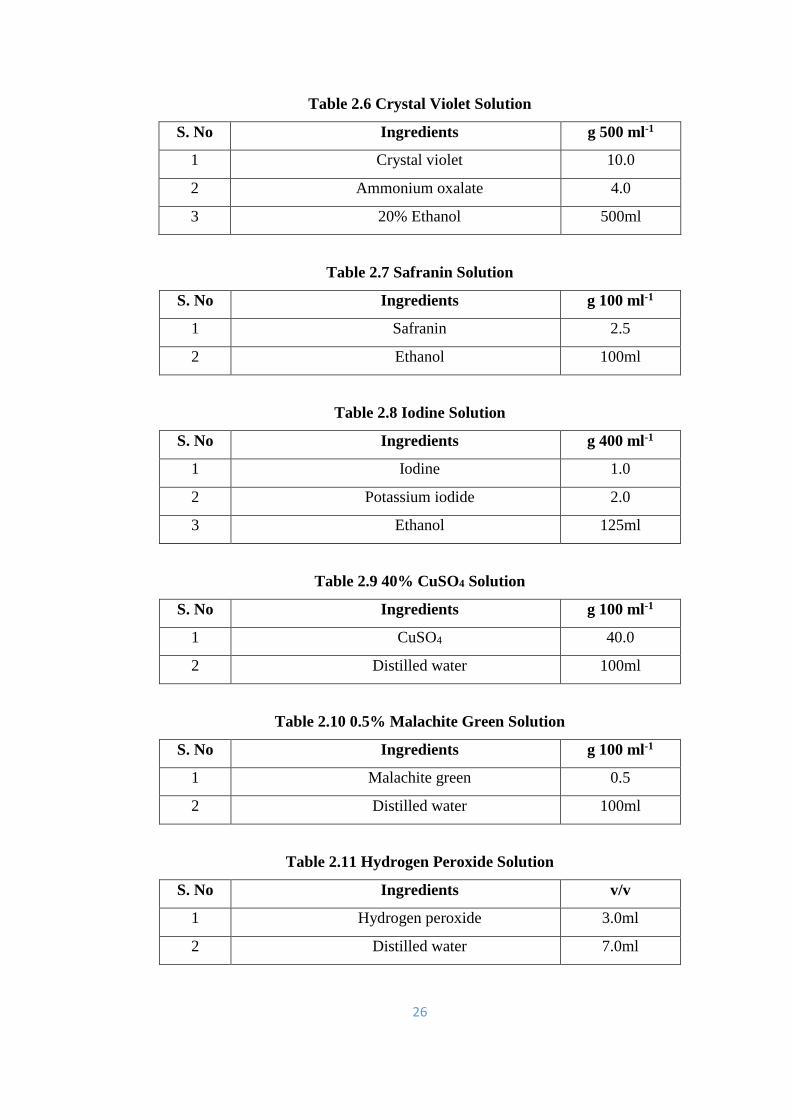
26
Table 2.6 Crystal Violet Solution
S. No Ingredients g 500 ml-1
1 Crystal violet 10.0
2 Ammonium oxalate 4.0
3 20% Ethanol 500ml
Table 2.7 Safranin Solution
S. No Ingredients g 100 ml-1
1 Safranin 2.5
2 Ethanol 100ml
Table 2.8 Iodine Solution
S. No Ingredients g 400 ml-1
1 Iodine 1.0
2 Potassium iodide 2.0
3 Ethanol 125ml
Table 2.9 40% CuSO4 Solution
S. No Ingredients g 100 ml-1
1 CuSO4 40.0
2 Distilled water 100ml
Table 2.10 0.5% Malachite Green Solution
S. No Ingredients g 100 ml-1
1 Malachite green 0.5
2 Distilled water 100ml
Table 2.11 Hydrogen Peroxide Solution
S. No Ingredients v/v
1 Hydrogen peroxide 3.0ml
2 Distilled water 7.0ml
27
Table 2.12 National Botanical Research Institute’s phosphate growth broth
(NBRIP) (Nautiyal, 1999).
S. No Ingredients g/l
1 Glucose 10
2 KCl 0.2
3 Ca3(PO4)2 5
4 MgCl2. 6H2O 5
5 MgSO4.7H2O 0.25
6 (NH4)2SO4, 0.1
Table 2.13 0.1M Sodium acetate Buffer (Weinberg and Zusman, 1990)
S. No Ingredients g/100ml
1 Sodium acetate 0.82
2 Acetic acid Up to pH adjustment
pH 5.2
Table 2.14 0.1M Tris HCl Buffer (Plisova et al., 2005)
S. No Ingredients g/100ml
1 Trizma base 1.2114
2 HCl Adjust pH
pH 9.5
Table 2.15 0.1M Sodium Phosphate Buffer
S. No Ingredients g/100ml
1 Sodium Phosphate Monobasic 1.09
2 Sodium Phosphate dibasic dehydrated 0.31
pH 7
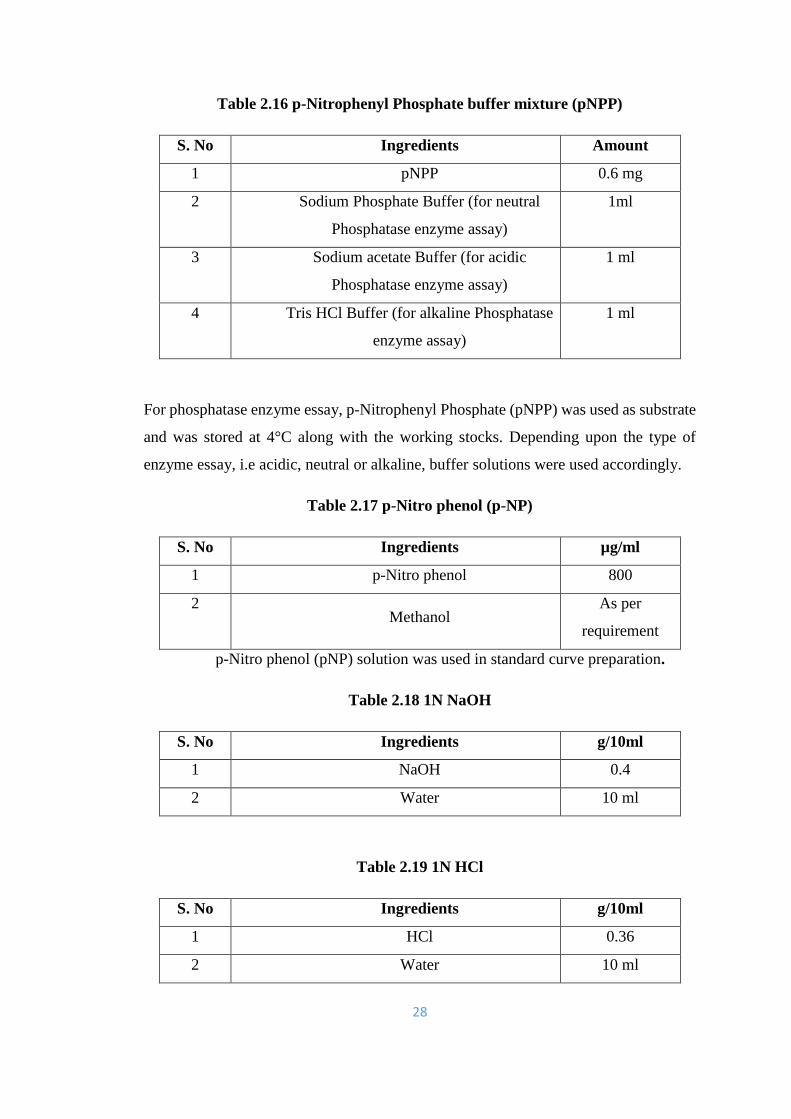
28
Table 2.16 p-Nitrophenyl Phosphate buffer mixture (pNPP)
S. No Ingredients Amount
1 pNPP 0.6 mg
2 Sodium Phosphate Buffer (for neutral
Phosphatase enzyme assay)
1ml
3 Sodium acetate Buffer (for acidic
Phosphatase enzyme assay)
1 ml
4 Tris HCl Buffer (for alkaline Phosphatase
enzyme assay)
1 ml
For phosphatase enzyme essay, p-Nitrophenyl Phosphate (pNPP) was used as substrate
and was stored at 4°C along with the working stocks. Depending upon the type of
enzyme essay, i.e acidic, neutral or alkaline, buffer solutions were used accordingly.
Table 2.17 p-Nitro phenol (p-NP)
S. No Ingredients µg/ml
1 p-Nitro phenol 800
2 Methanol
As per
requirement
p-Nitro phenol (pNP) solution was used in standard curve preparation.
Table 2.18 1N NaOH
S. No Ingredients g/10ml
1 NaOH 0.4
2 Water 10 ml
Table 2.19 1N HCl
S. No Ingredients g/10ml
1 HCl 0.36
2 Water 10 ml
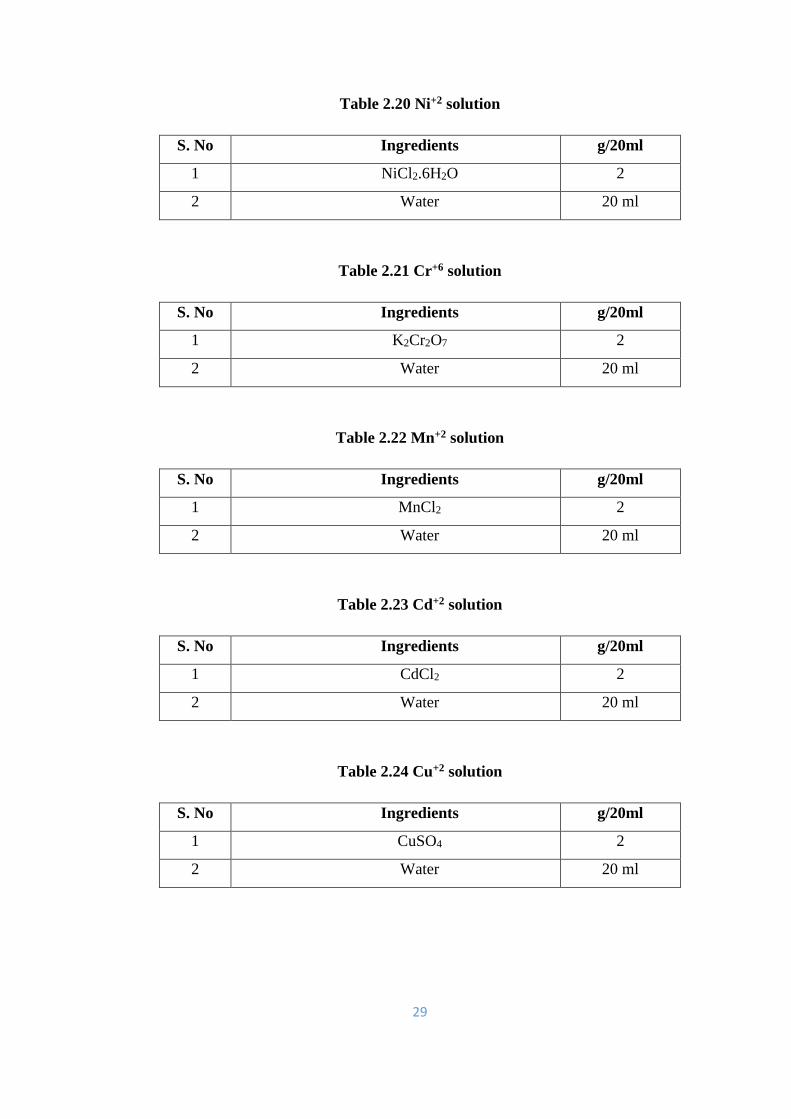
29
Table 2.20 Ni+2 solution
S. No Ingredients g/20ml
1 NiCl2.6H2O 2
2 Water 20 ml
Table 2.21 Cr+6 solution
S. No Ingredients g/20ml
1 K2Cr2O7 2
2 Water 20 ml
Table 2.22 Mn+2 solution
S. No Ingredients g/20ml
1 MnCl2 2
2 Water 20 ml
Table 2.23 Cd+2 solution
S. No Ingredients g/20ml
1 CdCl2 2
2 Water 20 ml
Table 2.24 Cu+2 solution
S. No Ingredients g/20ml
1 CuSO4 2
2 Water 20 ml

30
Table 2.25 Zn+2 solution
S. No Ingredients g/20ml
1 ZnSO4 2
2 Water 20
Table 2.26 Pb+2 solution
S. No Ingredients g/20ml
1 Pb(NO3)2 2
2 Water 20
Table 2.27 Co+2 solution
S. No Ingredients g/20ml
1 CoCl2 2
2 Water 20
Table 2.28 Fe+3solution
S. No Ingredients g/20ml
1 FeCl3 2
2 Water 20
Table 2.29 Naphthalene solution
S. No Ingredients g/10ml
1 Naphthalene 0.5
2 Ethanol 10

31
Figure 2.1. Graphical scheme of methodology
Soil Sampling and Physicochemical analysis
of Soil
Isolation of bacteria from soil
Purification of bacteria Morphological, Physiological and
biochemical characterization of bacterial isolates
Molecular Characterization of bacterial isolates
Screening of bacterial isolates against CPF, TAP,
DM and TCP on M-9 medium
Optimization of biodegradation of CPF,
TAP and DM
HPLC analysis of pesticide degradation by
Bacteria.
Organophosphorus Phosphatase (OPP)
Assay
Detection of Metabolite of pesticides formed
during Biodegradation using GCMS
32
2.2 Sampling Site and Soil Sampling
Soil samples used in the current study, were collected from three different cotton and
wheat fields with previous 20 years history of treatment with organophosphate (OP)
pesticides frequently, at Dera Saleemabad, Mochh, District Mianwali, Punjab, Pakistan.
The OP pesticides are mostly used to protect cotton and wheat crops from insects and
pests in this area. Generally, the climate in this part of southern Punjab is very hot and
dry during summers, while moderately cold in winters. For sample collection, the sandy
loam soil samples were collected in triplicate in polythene bags from 0-12 inches depth
in the early hours of morning. The collected soil had been treated with the OP pesticide
two weeks earlier, before the sampling. During sampling, separate and sterilized
trowels were used to collect each sample in order to reduce chance of external
contamination. Collected soil samples were then brought to laboratory immediately to
isolate bacteria, where these soil samples were sieved after being partially air dried
overnight before making suspension for isolation of bacteria.
2.3 Physicochemical Analysis of Soil
2.3.1 Measurement of the soil pH
The pH of soil samples was measured with the help of BMS Neomet pH meter (Thomas,
1996). For this purpose, 20 g of soil sample was suspended in 40 ml distilled water (1:2
ratio) followed by stirring intermittently using glass rod for half an hour and then
was left for an hour. The pH meter electrode was dipped into the soil suspension and
pH was recorded. The soil pH indicates the acidity and alkalinity of the soil and is a
very important soil property as it is deeply related with the nutrients accessibility, soil
microbial activity along with physical state of soil.
2.3.2 Electrical Conductivity (EC)
Electrical conductivity (EC) is another very important property of soil which gives ion
contents of soil solution indicating the soluble salt content of soil and thus current
carrying capacity of soil. The electrical conductivity (EC) of soil samples was
measured using a digital electrical conductivity meter (Rayment and Higginson,1992;
Wagh et al., 2013) and for this 20 g soil was mixed and stirred in 40 ml distilled
water for half an hour and kept undisturbed for 30 minutes so that soluble salts may
33
be dissolved completely and the soil is settled down and then filtered. Then conductivity
cell was dipped in soil suspension filtrate to note the EC value.
2.3.3 Soil organic matter
Soil organic matter consists of the remnants of plant material, roots and soil organisms
at various levels of degradation as well as synthesis. It also varies in composition.
Although soil organic matter is small in amounts yet it has a main impact on nutrient
availability, moisture retention, soil aggregation and biological activity. The Weight
Loss on Ignition method (Davies, 1974) was used to estimate soil organic matter and it
measures the weight loss from a dry soil sample when heated to high temperatures
(360oC). Finely ground soil (10 g) was taken in a crucible oven dried at 105◦C for two
hours and then weighed. It was heated again in a pre-heated oven at 360◦C for two hours
and then cooled to 150oC and weighed again. The weight loss occurring at this
temperature was then interrelated to oxidizable organic carbon using the following
formula:
% Organic carbon = (Soil weight at 105oC-weight at 360 oC) × 100
Soil Weight at 105◦C
2.3.4 Soil texture
Soil texture analysis refers to the measurement of the proportions of the different sizes
of the soil particles. There are three major groups of soil particles i.e sand (2.0-0.05
mm), silt (0.05-0.002 mm) and clay (< 0.002 mm). Soil texture effects the rate of
organic matter breakdown. The higher clay content in soils usually indicate a higher
organic matter content, as a result of slower rate of decomposition of organic matter.
The soil texture was determined with the help of Siever or Oscillator using standard
methods (Kettler et al., 2001) depending upon fractionation of different particle size of
soil and then calculating the percentage of each fraction against total weight of soil
sample used. Finally soil texture was determined by putting/comparing percentage of
each particle size i.e sand, silt and clay in Texture Triangle Chart.
34
2.3.5 Soil moisture Content
The soil water content was measured using analytical balance according to the standard
method (Wagh et al., 2013). For this purpose, fresh weight of soil along with crucible
dish was recorded. It was kept in the oven at 105 ◦C for overnight and then dry weight
of soil sample along with crucible dish was noted. The weight of the dish was then
subtracted from both dry and fresh weight of soil. The % water content of soil was
calculated by the following formula:
% water content of soil = Soil dry weight × 100
Soil fresh weight
2.4 Isolation of bacteria from the soil samples
In order to make soil suspension, 1 gm of each of the three soil samples was suspended
in 10 ml of autoclaved distilled water in a sterilized universal bottle, separately using a
vortex. The resultant soil suspensions were labelled as sample suspension (direct
sample) and were left on bench for 2-3 hours before use. This direct suspension was
used to make further dilutions of 1/10, 1/100, and 1/1000. In order to make 1/10
dilution, 100 µl of sample suspension was added to 1 ml of autoclaved distilled water
in an eppendorf and labelled as 1/10. Next, 100 µl of this 1/10 sample was mixed with
1 ml of autoclaved distilled water in an eppendorf and then labelled as 1/100. Likewise,
100µl of this 1/100 sample was taken and added to 1 ml of autoclaved distilled water
to get 1/1000 dilution.
For the initial isolation of bacterial population, nutrient agar medium (Table 2.2) was
prepared. Then 10 µl of direct as well as diluted samples (1/10, 1/100, 1/1000) was
taken and poured in the center of different agar plates labeled as direct, 1/10, 1/100,and
1/1000, respectively. Next, these soil suspensions were spread using glass spreader over
the whole surface of agar medium in the petri plate. This spreading was continued untill
the drying of liquid on the agar surface was achieved. Then the plates after being
covered with lids were incubated at 37◦C for 24-48 hours and different bacterial
colonies having different morphology were observed after incubation period.
35
2.4.1 Colony Counting (CFU/ml)
Colony counting is a measure of viable cells where a colony represents an aggregate of
cells derived from a single cell. CFU is applied to determine the number of active living
bacterial cells in a sample per ml or per gram. In order to determine the colony forming
units (CFU) of bacterial isolates in 1 g of soil, following formula was used:
CFU/g of soil ꞊ no. of colonies×1/dilution
2.4.2 Single colony streaking (bacterial culture purification)
For the purification of bacterial isolates, single colony streaking method was used,
where morphologically distinct bacterial colonies after selection, were picked and
purified by streaking on nutrient agar plates. This streaking method was continued until
a pure colony was obtained.
2.5 Screening for OP pesticide tolerance
In order to determine their resistance or tolerance for organophosphate pesticides, the
bacterial isolates MB490, MB497, MB498 and MB504 were grown on Minimal
medium M-9 (Table.2.3) (with and without 20% glucose) supplemented with different
concentrations of OP pesticides Chlorpyrifos, Triazophos and Dimethoate. The stock
solution of commercial grade Chlorpyrifos was made by dissolving 1 ml of OP in 10
ml of autoclaved distilled water and different concentrations of this stock solution (0.1,
0.2, 0.3, 0.4…….6%) were provided in the M-9 medium (Table 2.3), which were easily
tolerated by the isolates with very good growth. Next, these isolates were tested against
different concentrations i.e 0.1 to 20% (0.04 g/l to 8 g/l) of concentrated pure
commercial grade (EC 400 g/l) OP pesticides (Chlorpyrifos, Dimethoate and
Triazophos) supplemented to M-9 medium to check bacterial growth.
2.6 Screening for 3, 5, 6-Trichloropyridinol (TCP) tolerance
Trichloropyridinol is the major metabolite of Chlorpyrifos, and is known for its
antimicrobial effects (Racke et al., 1988). The isolation of CPF degrading bacteria had
been difficult in the past mainly due to killing of these bacteria by TCP. Therefore, the
four isolates MB490, MB497, MB498 and MB504 were tested for their tolerance
36
against TCP (Sigma Aldrich) by growing them on M-9 medium supplemented with 14
and 28 mg/l of TCP. Their growth was checked after 24 hrs incubation at 37°C.
2.7 Morphological characterization of OP pesticide degrading bacterial isolates
After screening, the morphological and biochemical characterization of purified
bacterial isolates was carried out.
2.7.1 Colony morphology
The visual and microscopic studies were conducted to observe and record colony
morphology of the bacterial isolates including shape, color, margins, elevation, texture
and size of colonies.
2.7.2 Cell morphology
Different tests like Gram’s staining, capsule staining, spore staining and motility test of
bacterial isolates were carried out to study the cell morphology.
2.7.2.1 Gram’s staining
Gram’s staining is a technique used to differentiate bacteria into two main group i.e
Gram-positive and Gram-negative, on the basis of cell wall composition. It was
introduced in 1884 by Hans Christian Gram as a differential staining method to study
the phenotypic characters of bacteria and their taxonomic grouping. The cell walls have
thick layers of peptidoglycan (90% of cell wall) in case of Gram-positive bacteria.
These bacteria retain the crystal violet-iodine complex during the staining process and
so, these are stained purple. While, Gram-negative bacteria have thin layers of
peptidoglycan (10% of wall) and higher lipid content in their cell walls and hence are
stained pink.
During Gram’s staining the first step is the smear preparation where a drop of distilled
water was put on a clean glass slide. Next, a small amount of fresh 24 hours old bacterial
culture was mixed well with the drop of water so that the smear was spread uniformly
on the slide surface, followed by air drying. Then, bacterial smear was heat fixed by
passing across the flame twice or thrice and stained with crystal violet solution (Table
2.6) for 1 minute followed by washing with distilled water. Next step was flooding with
37
iodine solution (Table 2.8) for 1 minute and washing with distilled water. The smear
was then dipped in 70% ethanol for 5-6 minutes, in order to remove extra stain.
Afterwards, the smear was air dried and stained with Safranin (Table 2.7) for 30-45
seconds. It was then washed with distilled water and air dried. Finally, a drop of oil
immersion was put on the smear and covered by a cover slip and observed under the
microscope using oil immersion lens.
2.7.2.2 Capsule staining
Many different types of bacteria both Gram-positive and Gram-negative, may possess
an outer layer called the glycocalyx that is referred to as a capsule if it is tightly bound
and remains attached to cells. Whereas the loosely bound layers are known as slime
layers. These bacterial capsules are composed of high molecular weight
polysaccharides and/or polypeptides along with polyalcohol and polyamines. Capsules
give protection against dehydration and assist in adherence of cells to surfaces and with
other bacteria thus forming biofilms.
The first step for the capsule staining is the smear preparation by mixing the 24 hours
fresh bacterial culture in a drop of distilled water. Next, the smear was air dried and
stained with 1% aqueous crystal violet solution (Table 2.6) for 1 minute. Then, it was
washed well with 40% copper sulfate solution (Table 2.9). After washing with copper
sulfate, the slide was instantly dried with the help of filter paper to avoid crystallization
of copper sulfate solution after its direct contact with air. Ultimately, a drop of oil
immersion was put on the slide and was covered with a cover slip. These slides were
then observed under the microscope (100X) in order to identify the shiny layer of
capsule in dim light.
2.7.2.3 Spore staining
The spores are formed in many genera of bacteria like Bacillus and Clostridium, not for
their reproduction, but as a mean of survival. The sporulation is stimulated by stress
conditions like shortage of nutrients or unfavorable environmental conditions. Spores
are produced in bacteria as a thick protective wall and are called endospores. While the
rest of the cell is known as vegetative cell.
38
In case of spore staining, 72-96 hours old bacterial cultures were used. The smear was
made by mixing bacterial culture in a drop of distilled water on the slide. Smear was
air dried, heat fixed and the malachite green solution (Table 2.10) was put continuously
on the slide over steam for 15-20 minutes. Then, the slide was washed with distilled
water followed by staining with safranin solution (Table 2.7) for 30-45 seconds. Stained
smear was washed again with distilled water, air dried and a drop of oil immersion was
put on the slide before covering with the cover slip. Slide was observed using the
microscope (100X) where the spores appear green after staining and the vegetative cells
give pink appearance.
2.7.2.4 Motility test
Bacterial motility usually depends on the presence of flagella or axial filaments. The
flagella are thin, protoplasmic, whip-like extensions of the cell. For motility test, a tiny
drop of water was placed on cover slip to prepare a hanging drop culture. Then, the
cover slip was inverted on a cavity slide, so as the bottom of drop did not touch the
slide itself. Next a drop of oil immersion was placed on the slide and the slide was then
observed in weak light using oil immersion lens.
2.8 Biochemical characterization
2.8.1 Oxidation Fermentation Test
Some bacteria, utilize glucose or other carbohydrates by oxidative pathway (aerobic
routes), while others are able to ferment sugars anaerobically (fermentation reaction).
There also may be facultative anaerobes capable of using both aerobic and anaerobic
pathways. In case of Oxidation Fermentation test, the carbohydrate source is the
glucose, whereas bromothymol blue is used as an indicator. If the acid is produced only
in the open tube (without agar plug), it indicates that the organism is an oxidizer. While
in case of a fermenter, acid production will be both in the agar-covered tube and in the
open tube. The peptone in the medium may be utilized by some aerobic bacteria to form
ammonia resulting in appearance of blue color in the upper part of the open tube due to
alkaline conditions.
For oxidation fermentation (OF) test, four test tubes were used for each isolate while
four test tubes were labeled as control. Oxidation fermentation medium (Table 2.5) was
39
dissolved carefully in distilled water near boiling. Four ml of this medium was poured
in each test tube and then autoclaved. The fresh bacterial culture was used to streak all
test tubes after solidification except the control, while two of the inoculated test tubes
for each strain were sealed with 4 ml of molten agar to create anaerobic conditions.
Also, the two test tubes of control were plugged with agar and other two were left
unplugged. All the test tubes were incubated at 37°C for 24-48 hours and then the
results were recorded. The change in color from bluish green to yellow in the unplugged
test tubes indicated the oxidative pathway of isolates. While change in color of the
medium and the gas production in both open and plugged tubes indicated the
fermentative pathway of carbohydrates by the bacteria.
2.8.2 Oxidase Test
The oxidase test which is a biochemical reaction, is carried out to detect the presence
of enzyme cytochrome oxidase (indophenol oxidase). During this test, the colorless
reagent is reduced to an oxidized colored product by the organism having cytochrome
oxidase enzyme. This enzyme cytochrome oxidase takes part in the electron transport
chain reactions of bacterial respiration, to catalyze the oxidation of cytochrome c and
reduces oxygen to give water. For this oxidase test, tetra-methyl-p-phenylene diamine
dihydro chloride reagent is utilized as an artificial electron donor for cytochrome c.
There is a change in the reagent from colorless to a dark blue or purple compound,
indophenol blue, when it is oxidized by cytochrome C.
For the oxidase test, 1% Oxidase reagent (Table 2.4) was prepared in autoclaved
distilled water and this solution was kept in dark bottle and stored in refrigerator for
maximum a week. Next step was to saturate the autoclaved filter paper strips in the
oxidase reagent followed by air drying. A little amount of fresh bacterial culture was
taken with the help of inoculating loop and was rubbed against the filter paper strips
previously treated with the reagent. Then any change in color of strips was observed.
The isolates were oxidase positive, if the color changed to purple within 5-10 seconds
and when the color changed to purple after 60-90 seconds, the organism was considered
weak positive. The organism was considered negative, if the color did not change
during more than 2 minutes.
40
2.8.3 Catalase Test
In order to survive, organisms utilize defense mechanisms that help them to restore or
escape the oxidative breakdown by hydrogen peroxide (H2O2). For this purpose, the
enzyme catalase is produced by some bacteria to help in the cellular detoxification. The
catalase test is carried out for detection of the enzyme catalase in bacteria. This enzyme
named catalase counteracts the toxic effects of hydrogen peroxide. Its concentration is
especially higher in the pathogenic bacteria. The breakdown of hydrogen peroxide to
water and oxygen is catalyzed by catalase. This reaction is indicated in the form of
quick bubble formation. For the catalase test conduction, a little amount of bacterial
culture was put on a clean glass slide with the help of sterilized loop. Then 50 μl of
hydrogen peroxide (Table 2.11) was added to the culture. The catalase-positive
organism was confirmed by the formation of bubbles or foam.
2.8.4 Other biochemical/enzyme Tests
The API-20E System was used to characterize Enterobacteriaceae and other non-
fastidious Gram-negative bacteria. For API strip test, 0.8% saline solution was made
first, 7 ml of which was poured in each test tube for a bacterial isolate, and then test
tubes were sealed and autoclaved. After then, they were kept to cool down at room
temperature. A loopful of fresh bacterial culture (24 hours old) was put in the saline
solution in the test tube and was vortexed to get uniform bacterial suspension. The base
of incubation tray consisting of wells was filled with autoclaved distilled water to
provide humid conditions. Next, the strip having the dehydrated substrates was put in
the incubation tray. The bacterial culture prepared in saline solution was poured in to
each cup containing the dehydrated substrates. Five cups {Lysine decarboxylase
(LDC), hydrogen sulfide production (H2S), Arginine dihydrolase (ADH), Ornithine
decarboxylase (ODC), and urea hydrolysis (URE)} were half filled with bacterial
culture solution, whereas mineral oil was used to fill other half to provide anaerobic
conditions. The incubation tray was covered with the lid and then incubated for 18-24
hours at 37°C. After the incubation period, the strips were observed, interpreted and
recorded consequently. Specific reagents were also added for some of the tests such as
James reagent for Indole test, NIT 1 and NIT 2 reagents for Nitrate reduction test in
glucose tube, TDA reagent for Tryptophan deaminase test, and VP 1 and VP 2 reagents
41
for Voges Proskauer test. In the case of no red or orange color within the glucose tube,
small quantity of zinc dust was added and observed after five minutes for color change.
The nitrate reduction to molecular nitrogen was indicated by the appearance of red color
on addition of zinc dust while appearance of yellow color indicated a positive result.
2.9 Physiological Characterization
2.9.1 pH Optimization for Bacterial Growth
Different bacteria have specific optimal pH range for their best growth. The growth
reduction can occur, in case the pH of the environment varies from the optimal range.
There are many bacterial species that grow best at neutral or slightly alkaline pH.
Likewise, some bacteria grow best at low pH like 4, whereas others may grow at higher
pH as 11. The potential of bacteria to survive beyond their optimal pH range, depends
on their ability to tolerate or self-adjust changes in the environmental pH. Some bacteria
are naturally able to acclimatize to pH changes and are classified as acidophiles,
neutrophiles or alkaliphiles.
The effect of pH was studied by growing all the isolates in nutrient broth (Table 2.1) at
pH 5, 6, 7, 8, 9, 10 and 11 on a shaker at 37◦C. Earlier, four millilitre of this broth was
poured in each test tube, cotton plugged and autoclaved. For preparing bacterial
suspension, inoculum from fresh bacterial culture was mixed in 1ml autoclaved distilled
water in eppendorf and then 25 μl of bacterial suspension was added to each test tube
containing the sterilized nutrient broth which were then kept in the shaking incubator
(150 rpm) at 37°C for 24 hours. After the incubation period, the optical density (OD)
was measured using UV/VIS spectrophotometer (BMS UV-160) at 600 nm.
2.9.2 Effect of temperature on the growth of bacterial isolates
Like pH, temperature is very important factor, for bacterial growth. Bacteria have a
wide range of temperature for their growth. Psychrophilic bacteria are able to grow at
low temperature. Whereas, thermophilic bacteria can grow at higher temperatures.
However, most of the bacteria are mesophilic and can grow at temperatures between
5◦C to 63◦C (growth zone). They are having an optimum temperature of about 37 ◦C for
their growth.
42
The effect of temperature on bacterial growth was studied by growing all the bacterial
isolates (MB490, MB497, MB498 and MB504) at various temperatures (25◦C, 30◦C,
37◦C and 42◦C) in the nutrient broth at pH 7. For this purpose, 4 ml of nutrient broth
was taken in each test tube. After being cotton plugged, tubes were autoclaved.
Bacterial suspension was made using 24 hrs fresh bacterial culture for each isolate using
a sterilized loop and mixed with 1 ml of autoclaved distilled water in each eppendorf.
For each bacterial isolate, five test tubes having nutrient broth were taken and 25 μl of
bacterial suspension was added to each tube as inoculum, except the control test tubes.
Test tubes were incubated at the selective temperature for 24 hrs. After incubation
period, bacterial growth was estimated by measuring optical density (OD) using
UV/VIS spectrophotometer at 600 nm.
2.10 Heavy Metal Resistance Profile
The metals having density above 5 g/cm3 are called heavy metals and are essential trace
elements for living organisms. Though they play significant role in important
biochemical reactions but in higher concentration they lead to formation of complex
chemical compounds with toxic effects. Many bacteria are resistant to heavy metals due
to their inheritance and the genes responsible for metal resistance are related to plasmids
and transposon. As a result of natural and industrial processes, greater concentrations
of heavy metals are accumulated in the microbial environment. The microbial
organisms have evolved different methods for metal toleration like complexation, metal
ion reduction, or effluxion.
The isolates (MB490, MB497, MB498 and MB504) were tested for their heavy metal
resistance using various metals like Ni+2(NiCl2), Cr+6(K2Cr2O7), Mn+2(MnCl2),
Cd+2(CdCl2), Cu+2(CuSO4), Zn+2(ZnSO4), Pb+2[Pb(NO3)2], Co+2(CoCl2) and
Fe+3(FeCl3) (Table 2.20, 2.21, 2.22, 2.23, 2.24, 2.25, 2.26, 2.27, and 2.28 respectively).
Different concentrations of these metals ranging from 50-3000 μg/ml were
supplemented to the autoclaved M-9 medium and poured in Petri plates. It was allowed
to solidify and then, it was streaked with isolates. The Petri plates were kept in the
incubator at 37◦C for 24 hrs. After incubation period, bacterial growth and their color
was checked and noted.
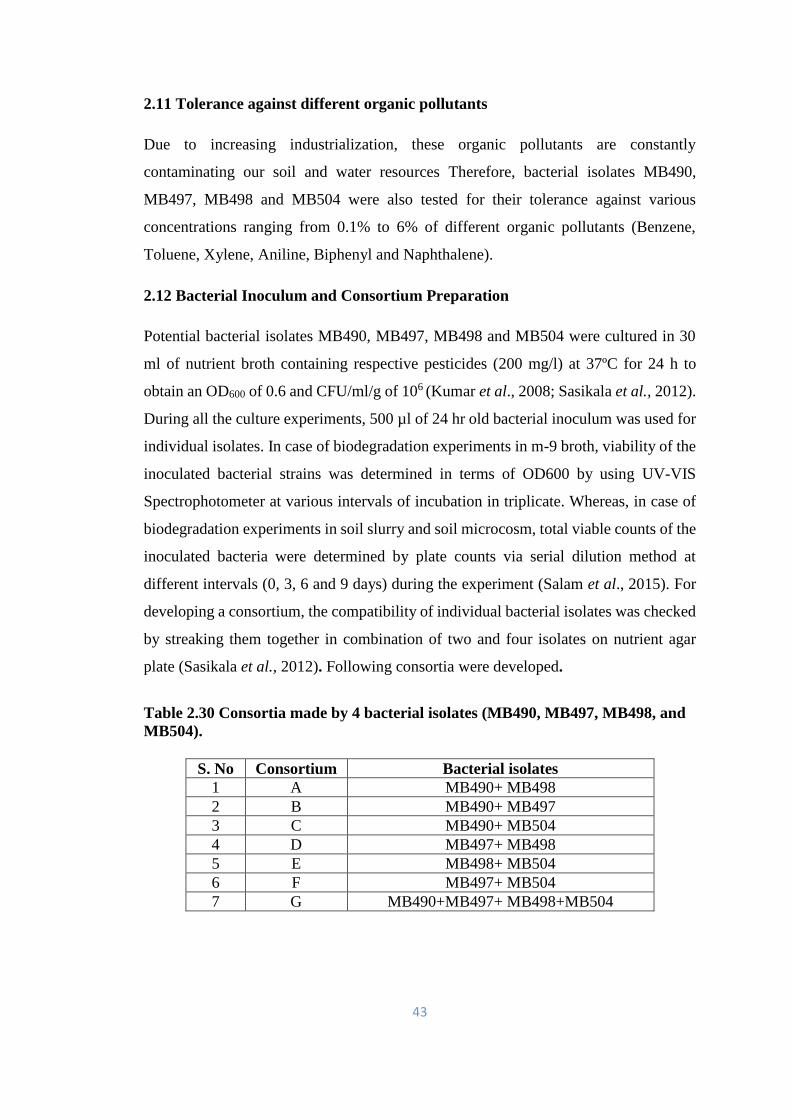
43
2.11 Tolerance against different organic pollutants
Due to increasing industrialization, these organic pollutants are constantly
contaminating our soil and water resources Therefore, bacterial isolates MB490,
MB497, MB498 and MB504 were also tested for their tolerance against various
concentrations ranging from 0.1% to 6% of different organic pollutants (Benzene,
Toluene, Xylene, Aniline, Biphenyl and Naphthalene).
2.12 Bacterial Inoculum and Consortium Preparation
Potential bacterial isolates MB490, MB497, MB498 and MB504 were cultured in 30
ml of nutrient broth containing respective pesticides (200 mg/l) at 37ºC for 24 h to
obtain an OD600 of 0.6 and CFU/ml/g of 106 (Kumar et al., 2008; Sasikala et al., 2012).
During all the culture experiments, 500 µl of 24 hr old bacterial inoculum was used for
individual isolates. In case of biodegradation experiments in m-9 broth, viability of the
inoculated bacterial strains was determined in terms of OD600 by using UV-VIS
Spectrophotometer at various intervals of incubation in triplicate. Whereas, in case of
biodegradation experiments in soil slurry and soil microcosm, total viable counts of the
inoculated bacteria were determined by plate counts via serial dilution method at
different intervals (0, 3, 6 and 9 days) during the experiment (Salam et al., 2015). For
developing a consortium, the compatibility of individual bacterial isolates was checked
by streaking them together in combination of two and four isolates on nutrient agar
plate (Sasikala et al., 2012). Following consortia were developed.
Table 2.30 Consortia made by 4 bacterial isolates (MB490, MB497, MB498, and
MB504).
S. No Consortium Bacterial isolates
1 A MB490+ MB498
2 B MB490+ MB497
3 C MB490+ MB504
4 D MB497+ MB498
5 E MB498+ MB504
6 F MB497+ MB504
7 G MB490+MB497+ MB498+MB504
44
2.13 Analysis of OP pesticide degradation using UV-VIS Spectrophotometer
Initially, the degradation of Chlorpyrifos was studied by growing isolates MB490,
MB497, MB498 and MB504 in M-9 broth in test tubes supplemented with 800 mg/l
Chlorpyrifos as the sole source of carbon and nitrogen. Then, the test tubes including
control (without inoculum), were incubated at 120 rpm on rotary shaker at 37◦C. The
contents of the test tubes were centrifuged at 3500 rpm for 12 minutes after every 24
hrs interval up to 72 hrs. Next, the supernatant was analyzed by UV-VIS
Spectrophotometer (BMS UV-160) to analyze the Chlorpyrifos degradation by the four
isolates. The percentage of the compound degraded was found by the formula:
Percentage of degradation = (Xa–Xb) /Xa × 100
Where, Xa = absorbance of compound before degradation
Xb = absorbance at the same wavelength after degradation (Rokade and Mali,
2013).
2.14 Qualitative and Quantitative Analysis for OP pesticide degradation using
GC-MS and HPLC
A more elaborate and advanced analysis for OP pesticide degradation was conducted
using GC-MS (Shimadzu QP5050), and HPLC (Shimadzu LC-20AT). For this
purpose, bacterial isolates MB490, MB497, MB498 and MB504 and their different
consortia were grown stepwise in M-9 broth, soil slurry and soil microcosm
respectively. Extraction method for each is given below.
2.14.1 Extraction of pesticide residues from M-9 Culture Broth
Bacterial strains MB490, MB497, MB498 and MB504 and their different consortia
were grown in 30 ml of M-9 broth in 100 ml flasks supplemented with 200 mg/l of OP
pesticides CPF, TAP and DM separately and combined (CPF and TAP) in certain cases.
The culture flasks along with controls (without any inoculum) were incubated at 120
rpm in a shaker for 9 days. After incubation period of 3 days, 6 days and 9 days, 4 ml
of sample was taken from each flask using micropipette under sterile conditions in a 10
ml falcon tube. Its absorbance/optical density (OD) was observed at 600 nm to estimate
bacterial growth (Kale et al., 1989; Negi et al., 2014) followed by centrifugation at
45
3500 rpm for 20 minutes. The supernatant was taken in another falcon and ethyl acetate
was added to it in 1꞉1 ratio, and dried with 5 g of anhydrous Na2SO4 to absorb moisture
and to concentrate the extract. The sample was shaken well and left for 30 minutes
(Rokade and Mali, 2013; Pawar and Mali, 2014). Then 1.5 ml of upper organic layer
was collected in an Eppendorf and stored in biorefrigerater at -20◦C for few days (if
delay is necessary) untill used for GC-MS analyses etc. Just before GC-MS analyses,
1ml of extract was taken in a falcon and mixed with 9 ml of methanol to obtain 1: 9
ratio. Next, 1.5 ml of this mixture was filtered using Sartorius Ministart sterile syringe
filters (0.45 µm) to remove any particles and put in the GC vials for GC-MS analyses.
Each experiment was conducted in triplicate.
2.14.2 Extraction of 3, 5, 6-Trichloropyridinol (TCP) residues from M-9 Culture
Broth
Bacterial strains MB490, MB497, MB498 and MB504 were tested for their potential to
degrade and transform TCP, the major metabolite of CPF. For this purpose, they were
grown in 10 ml of M-9 broth separately in two sets of test tubes supplemented with 14
mg/l and 28 mg/l of Trichloropyridinol. The test tubes along with controls (without any
inoculum) were incubated at 120 rpm in a shaker for 24, 48 and 72 hrs. 4 ml of sample
was taken from each test tube after incubation period of 24, 48 and 72 hrs, with the help
of micropipette under sterile conditions in a 10 ml falcon tube. Its absorbance/optical
density (OD) was observed at 600 nm to determine bacterial growth (Anwar et al.,
2009) followed by centrifugation at 3500 rpm for 20 minutes. The supernatant was
shifted to another falcon and ethyl acetate was added to it in 1꞉1 ratio. It was dried with
5 g of anhydrous Na2SO4 to absorb moisture. After 30 minutes of shaking well, 1.5 ml
of upper organic layer was collected in an Eppendorf and stored in biorefrigerater at -
20◦C for few days until used for GC-MS and HPLC analyses. GC-MS and HPLC
instrumental conditions used were same for both CPF and TCP with slight
modifications (Brzak et al., 1998; Li et al., 2014).
Just prior to GC-MS analyses, 1 ml of extract was taken in a falcon and mixed with 9
ml of methanol to obtain 1:9 ratio. Next, 1.5 ml of this mixture was filtered using
Sartorius Ministart sterile syringe filters (0.45 µm) to remove any particles and put in
the GC vials for GC-MS analyses. For HPLC analyses, about 1 ml of the sample was
46
filtered through 0.45 µm syringe filter and put into the sample vial. Then a set volume
of the sample was injected into the column of HPLC system.
2.14.3 Extraction from soil slurry for OP pesticide degradation analysis
The biodegradation of OP pesticides by MB490, MB497, MB498 and MB504 and by
their consortium was also tested in soil slurry. For this purpose, 50 g soil was suspended
in 30 ml M-9 broth in 250 ml flasks to achieve 60% soil water content and autoclaved.
After then, this soil suspension was spiked with 200 mg of OP pesticide (CPF, TAP or
DM) and 500 µl of bacterial inoculum and incubated at 37◦C for 9 days. After 3 days,
6 days and 9 days, 3 ml of soil slurry was taken from each flask using a micro pipette
in a falcon tube and 10 ml of ethyl acetate was added to it. This suspension was filtered
through Butchner funnel with a cotton pad and filterate was centrifuged at 3500 rpm
for 20 minutes. The supernatant was shifted to another falcon containing 5 g of
anhydrous Na2SO4 and kept for 30 minutes. Then, 1 ml of upper organic layer was
taken in an Eppendorf and stored at -20◦C in biomedical freezer for further analyses by
GCMS. Before GC-MS analyses, 1ml of extract was mixed with analytical grade
methanol in 1: 9 ratio. Next, 1.5 ml of this extract solution in methanol was syringe
filtered using Sartorius Ministart sterile syringe filters (0.45 µm) and added to GC vials
being used for GCMS analyses (Polese et al., 2002; EL-Bestawy et al., 2014). Each
experiment was conducted in triplicate.
2.14.4 Extraction from soil microcosm for OP pesticide degradation analysis
For OP pesticide degradation analysis in soil microcosm, 50 g of agricultural soil was
finely ground, sterilized and then added to autoclaved glass Petri plates. These 50 g soil
samples were spiked with 200 mg/kg of OP pesticides (CPF, TAP and DM) separately
and 500 µl of 24 hrs old bacterial inoculum (106- 107cfu/g of soil, suspended in 10 ml
M-9 broth as fertilizer) (Ueno et al., 2006) was mixed well to obtain uniform
concentration of pesticide. Additionally, 10 ml of autoclaved distilled water was also
added to soil samples in Petri plates to maintain 40% of water-holding capacity (Singh
et al., 2004; Hong et al., 2007). In order to compare bacterial degrading efficiency,
similar process was carried out with sterilized as well as unsterilized soil sample
(without inoculum) as control. Finally these soil samples were incubated at 37°C under
dark conditions to avoid photo oxidation of pesticides. Autoclaved distilled water was
47
added periodically to overcome the loss of water by evaporation (Hong et al., 2007;
Sasikala et al, 2012; Akbar and Sultan, 2016). The experiment was conducted in
triplicate to authenticate the results. For extraction of pesticide residues, 10 g of soil
was taken from all the petriplates separately on 0, 3, 6 and 9th day of incubation in a 50
ml universal falcon and shaken well with 10 ml of Ethyl acetate along with 5 g of
anhydrous Na2SO4 and then kept for 2 hrs. This mixture was then filtered through
Buchner funnel with cotton pad followed by centrifugation of filtrate at 3500 rpm for
20 minutes. The supernatant was microfiltered and 1 ml of filterate was taken in
eppendorfs and stored at -20°C for few days (if necessary otherwise used freshly) till
further analyses. For GC-MS analyses, 1ml of extract was mixed with analytical grade
methanol in 1: 9 ratio. Then 1.5 ml of this extract sample in methanol was syringe
filtered using Sartorius Ministart sterile syringe filters (.45 µm) and added to GC vials
being used for GCMS analyses.
2.14.5 GC-MS conditions used for the analyses of CPF, TCP, TAP and DM
biotransformation
GC-MS analyses of OP pesticides was done using QP5050 GC-MS equipped with a
DB-5 MS capillary column (30 m × 0.25 mm ×0.25 mm) and helium as carrier gas (100
ml/min) with Thermal Conductivity Detector (TCD) with splitless injection system.
The GCMS conditions used for the detection of intermediate products of CPF/TCP,
TAP and DM (formed during the degradation) are given in Table 2.31.
2.14.6 HPLC conditions used for the analyses of CPF, TCP, TAP and DM
degradation
The degradation of Chlorpyrifos, 3, 5, 6 Trichloropyridinol, Triazophos and
Dimethoate by four isolates MB490, MB497, MB498 and MB504 was also analyzed
using High-performance liquid chromatography (HPLC) LC-20AT equipped with a
UV-VISible detector (SPD-20A) and a C18 column (0.46 x 15 cm). For this purpose,
sample extract with ethyl acetate after being filtered by syringe filters (0.45 µm) was
directly analyzed by HPLC according to conditions given in Table 2.32 for each
pesticide respectively. Each experiment was conducted in triplicate. The HPLC
conditions used are given in Table 2.32. The percentage degradation of OP
pesticide/TCP was calculated using the equation:
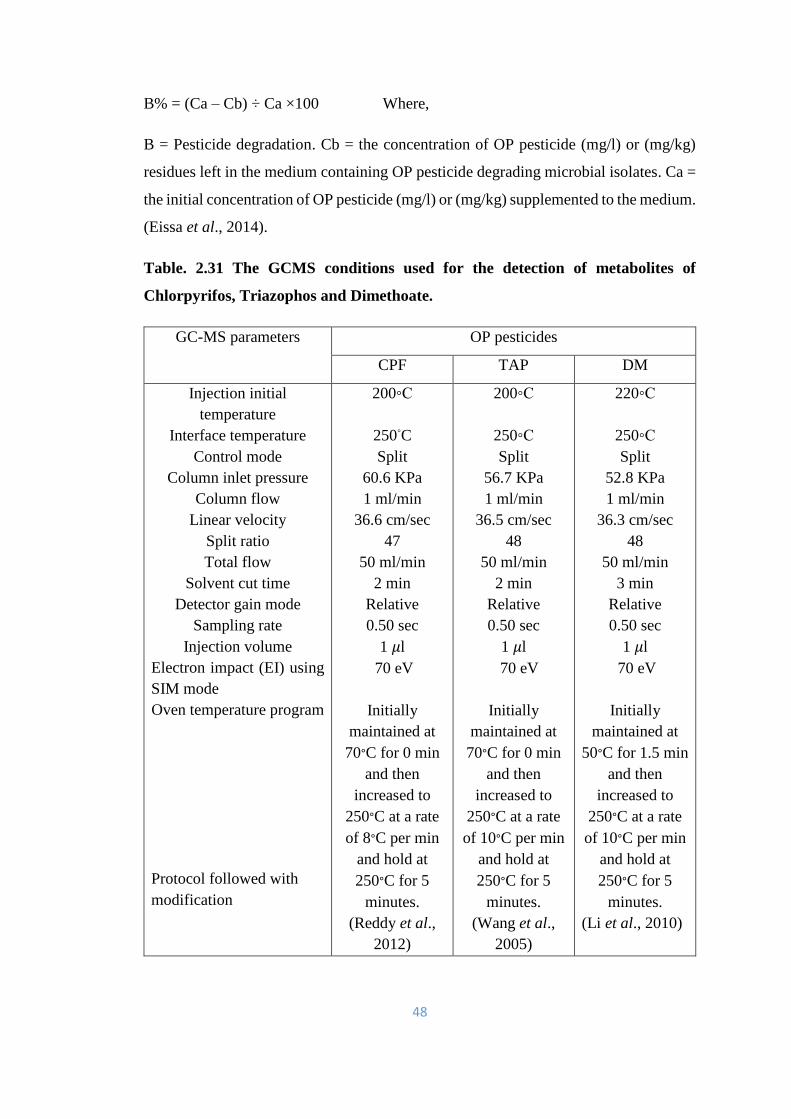
48
B% = (Ca – Cb) ÷ Ca ×100 Where,
B = Pesticide degradation. Cb = the concentration of OP pesticide (mg/l) or (mg/kg)
residues left in the medium containing OP pesticide degrading microbial isolates. Ca =
the initial concentration of OP pesticide (mg/l) or (mg/kg) supplemented to the medium.
(Eissa et al., 2014).
Table. 2.31 The GCMS conditions used for the detection of metabolites of
Chlorpyrifos, Triazophos and Dimethoate.
GC-MS parameters OP pesticides
CPF TAP DM
Injection initial
temperature
Interface temperature
Control mode
Column inlet pressure
Column flow
Linear velocity
Split ratio
Total flow
Solvent cut time
Detector gain mode
Sampling rate
Injection volume
Electron impact (EI) using
SIM mode
Oven temperature program
Protocol followed with
modification
200◦C
250◦C
Split
60.6 KPa
1 ml/min
36.6 cm/sec
47
50 ml/min
2 min
Relative
0.50 sec
1 𝜇l
70 eV
Initially
maintained at
70∘C for 0 min
and then
increased to
250∘C at a rate
of 8∘C per min
and hold at
250∘C for 5
minutes.
(Reddy et al.,
2012)
200◦C
250◦C
Split
56.7 KPa
1 ml/min
36.5 cm/sec
48
50 ml/min
2 min
Relative
0.50 sec
1 𝜇l
70 eV
Initially
maintained at
70∘C for 0 min
and then
increased to
250∘C at a rate
of 10∘C per min
and hold at
250∘C for 5
minutes.
(Wang et al.,
2005)
220◦C
250◦C
Split
52.8 KPa
1 ml/min
36.3 cm/sec
48
50 ml/min
3 min
Relative
0.50 sec
1 𝜇l
70 eV
Initially
maintained at
50∘C for 1.5 min
and then
increased to
250∘C at a rate
of 10∘C per min
and hold at
250∘C for 5
minutes.
(Li et al., 2010)
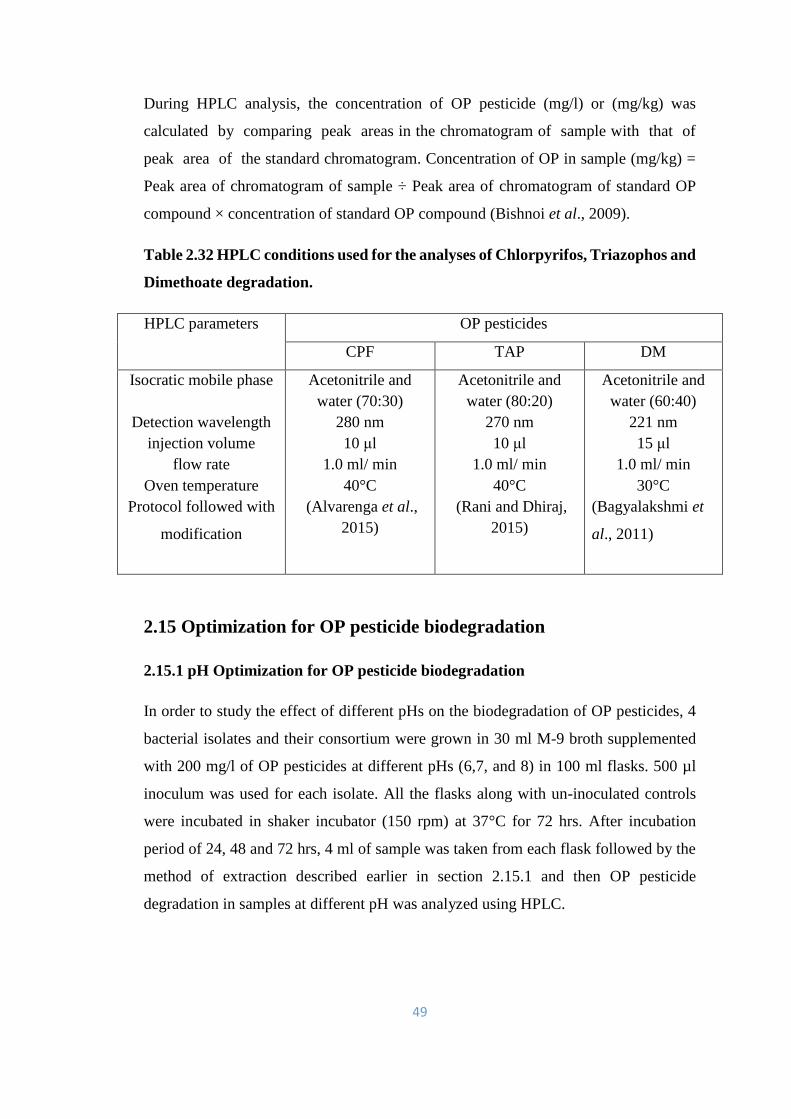
49
During HPLC analysis, the concentration of OP pesticide (mg/l) or (mg/kg) was
calculated by comparing peak areas in the chromatogram of sample with that of
peak area of the standard chromatogram. Concentration of OP in sample (mg/kg) =
Peak area of chromatogram of sample ÷ Peak area of chromatogram of standard OP
compound × concentration of standard OP compound (Bishnoi et al., 2009).
Table 2.32 HPLC conditions used for the analyses of Chlorpyrifos, Triazophos and
Dimethoate degradation.
HPLC parameters OP pesticides
CPF TAP DM
Isocratic mobile phase
Detection wavelength
injection volume
flow rate
Oven temperature
Protocol followed with
modification
Acetonitrile and
water (70:30)
280 nm
10 μl
1.0 ml/ min
40°C
(Alvarenga et al.,
2015)
Acetonitrile and
water (80:20)
270 nm
10 μl
1.0 ml/ min
40°C
(Rani and Dhiraj,
2015)
Acetonitrile and
water (60:40)
221 nm
15 μl
1.0 ml/ min
30°C
(Bagyalakshmi et
al., 2011)
2.15 Optimization for OP pesticide biodegradation
2.15.1 pH Optimization for OP pesticide biodegradation
In order to study the effect of different pHs on the biodegradation of OP pesticides, 4
bacterial isolates and their consortium were grown in 30 ml M-9 broth supplemented
with 200 mg/l of OP pesticides at different pHs (6,7, and 8) in 100 ml flasks. 500 µl
inoculum was used for each isolate. All the flasks along with un-inoculated controls
were incubated in shaker incubator (150 rpm) at 37°C for 72 hrs. After incubation
period of 24, 48 and 72 hrs, 4 ml of sample was taken from each flask followed by the
method of extraction described earlier in section 2.15.1 and then OP pesticide
degradation in samples at different pH was analyzed using HPLC.
50
2.15.2 Temperature Optimization for OP pesticide biodegradation
The effect of different temperatures on the degradation of OP pesticides was studied by
growing four bacterial isolates (MB490, MB497, MB498 and MB504) and their
consortia in 30 ml of M-9 medium with pH 7 supplemented with 200 mg/l of OP
pesticide and 500µl of bacterial inoculum in 100 ml flasks at different temperatures (25,
30 and 37◦C) under static conditions for 72 hrs. For each temperature, control flask
without inoculum was also incubated. Extraction was carried out after 24, 48 and 72
hrs of incubation as described earlier in section 2.12.1. Degradation of OP pesticide in
each sample was analyzed using HPLC and % degradation was calculated using the
equation 2.6.
2.15.3 Effect of Shaking and Static conditions for OP pesticide biodegradation
The effect of shaking and static conditions on OP pesticide biodegradation was also
tested by growing four isolates (MB490, MB497, MB498 and MB504) and their
consortia in M-9 broth supplemented with different OP pesticides at 37°C and at pH 7
under shaking and static conditions.
2.16 Molecular Studies
For the identification of the isolates, 16S rRNA Gene Sequencing analysis was used.
2.16.1 DNA Extraction
For extracting the total genomic DNA from each isolate (MB490, MB497, MB498 and
MB504), a loop full of 24 hrs fresh bacterial culture was picked and mixed well with
1ml of autoclaved distilled water in an eppendorf. The cell suspension was centrifuged
at 13000 g for 2 minutes. The supernatant was discarded and pellet was washed twice
with 400 µl of STE buffer (Table 2.34). It was centrifuged at 13000 g for 2 minutes and
pellet was re-suspended in 200 µl of TE buffer (Table 2.35). Then, 100 µl of Tris
saturated phenol (Table 2.21) with pH 8 was added to this mixture and mixed well by
inverting gently for 1 minute. It was centrifuged at 13000 g for 5 minutes at 4◦C so as
to obtain 2 layers. Next, 160 µl of upper phase was picked and transferred to new
Eppendorf. 40 µl of TE buffer and 100 µl of chloroform was added to it and mixed well
by inverting gently until a white interface was observed between two layers. It was
51
centrifuged again at 13000 g for 5 minutes. The upper phase containing pure DNA was
shifted to another eppendorf and was confirmed by Gel electrophoresis.
2.16.2 Polymerase Chain Reaction (PCR)
The colony PCR was performed for the amplification of 16S rRNA gene. For this
purpose a 25 µl PCR reaction was established in the thermo cycler (96 universal
Gradient Peq Star, Peq Lab UK). Earlier, 0.4 µl each of forward and reverse primers
(0.5 µM), 12.5 µl of commercial master mix (Go Green Mastermix, Promega) and 8.7
µl PCR water were mixed together in a sterilized PCR tube. Then, 22 µl of this PCR
mix was taken in another sterile PCR tube for each isolate and 3µl of genomic DNA
was mixed with it to obtain final volume of 25 µl. All the reaction steps were done on
ice. Negative and positive controls were also incorporated. Go Green Mastermix
contains Taq DNA polymerase, dNTPs, MgCl2 and reaction buffers with best possible
concentrations. During agarose gel electrophoresis of PCR products, loading dye was
also integrated. Universal primers 27F and 1492R (Table 2.37) were used in the PCR
reaction to give a product size of nearly 1500 base pairs. The reaction conditions which
were used for the PCR are given in the Table 2.38. The blank without DNA was used
as control.
2.16.3 Gel Electrophoresis
Agarose gel (1%) prepared in 1X TBE Buffer (Table 2.33) and stained with ethidium
bromide was used to analyze PCR amplified samples. Gel was prepared by dissolving
0.5 g of Agarose (Oxoid) in 50 ml of 1X TBE Buffer after being heated in the
microwave up to boiling. It was cooled down to about 60˚C. Then a final concentration
of 0.5 µg/mL was achieved by adding 2.5 µl of ethidium bromide. Further, the gel was
poured vigilantly into the gel casting tray fitted with a comb and then it was solidified
in 20-30 min at room temperature. The combs were detached cautiously from the gel
and then, they were placed horizontally into the electrophoresis unit. For the running
medium, 1 X TBE buffer was used and poured into the electrophoresis chamber so that
to cover the gel. 3µl of each PCR amplified product was loaded in each well. In the first
well, 2 µL of 1 kb DNA ladder (Invitrogen) was loaded. The apparatus was run using a
current of 80 V for 30-45 min after the lid and power leads being placed on it. The
bubbles were given off the electrodes confirming the current flow. After giving enough
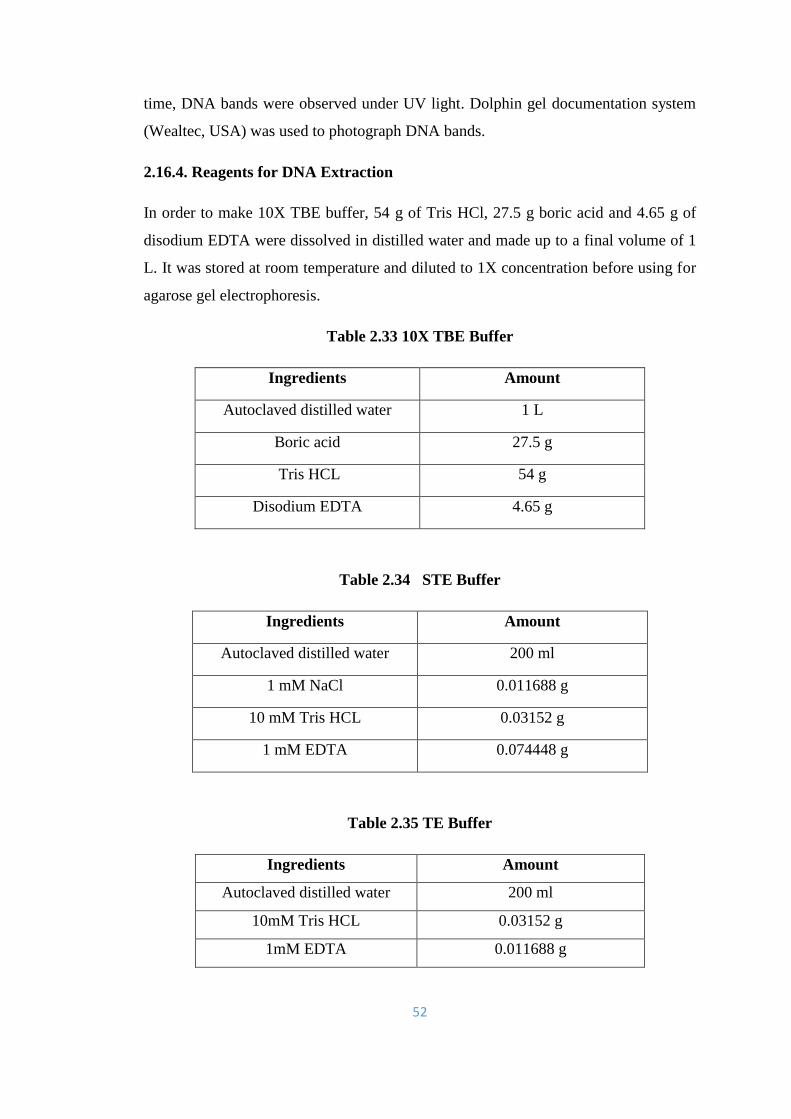
52
time, DNA bands were observed under UV light. Dolphin gel documentation system
(Wealtec, USA) was used to photograph DNA bands.
2.16.4. Reagents for DNA Extraction
In order to make 10X TBE buffer, 54 g of Tris HCl, 27.5 g boric acid and 4.65 g of
disodium EDTA were dissolved in distilled water and made up to a final volume of 1
L. It was stored at room temperature and diluted to 1X concentration before using for
agarose gel electrophoresis.
Table 2.33 10X TBE Buffer
Ingredients Amount
Autoclaved distilled water 1 L
Boric acid 27.5 g
Tris HCL 54 g
Disodium EDTA 4.65 g
Table 2.34 STE Buffer
Ingredients Amount
Autoclaved distilled water 200 ml
1 mM NaCl 0.011688 g
10 mM Tris HCL 0.03152 g
1 mM EDTA 0.074448 g
Table 2.35 TE Buffer
Ingredients Amount
Autoclaved distilled water 200 ml
10mM Tris HCL 0.03152 g
1mM EDTA 0.011688 g
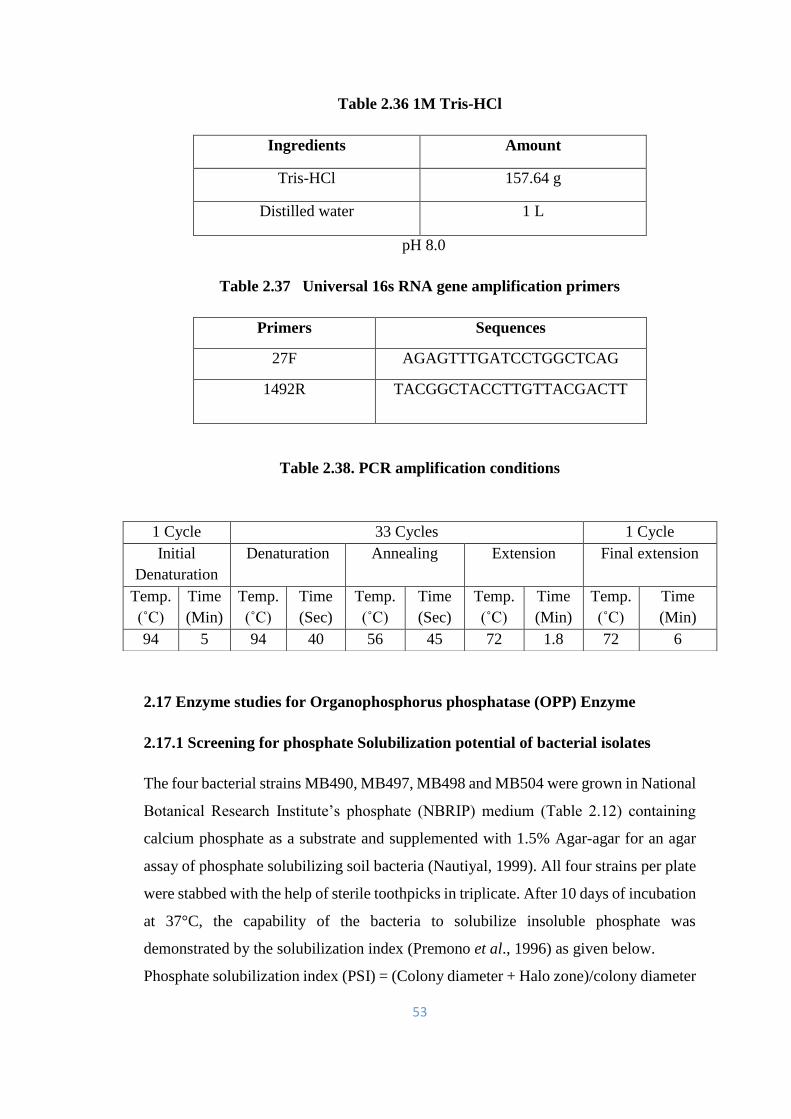
53
Table 2.36 1M Tris-HCl
Ingredients Amount
Tris-HCl 157.64 g
Distilled water 1 L
pH 8.0
Table 2.37 Universal 16s RNA gene amplification primers
Primers Sequences
27F AGAGTTTGATCCTGGCTCAG
1492R TACGGCTACCTTGTTACGACTT
Table 2.38. PCR amplification conditions
2.17 Enzyme studies for Organophosphorus phosphatase (OPP) Enzyme
2.17.1 Screening for phosphate Solubilization potential of bacterial isolates
The four bacterial strains MB490, MB497, MB498 and MB504 were grown in National
Botanical Research Institute’s phosphate (NBRIP) medium (Table 2.12) containing
calcium phosphate as a substrate and supplemented with 1.5% Agar-agar for an agar
assay of phosphate solubilizing soil bacteria (Nautiyal, 1999). All four strains per plate
were stabbed with the help of sterile toothpicks in triplicate. After 10 days of incubation
at 37°C, the capability of the bacteria to solubilize insoluble phosphate was
demonstrated by the solubilization index (Premono et al., 1996) as given below.
Phosphate solubilization index (PSI) = (Colony diameter + Halo zone)/colony diameter
1 Cycle 33 Cycles 1 Cycle
Initial
Denaturation
Denaturation Annealing Extension Final extension
Temp.
(˚C)
Time
(Min)
Temp.
(˚C)
Time
(Sec)
Temp.
(˚C)
Time
(Sec)
Temp.
(˚C)
Time
(Min)
Temp.
(˚C)
Time
(Min)
94 5 94 40 56 45 72 1.8 72 6
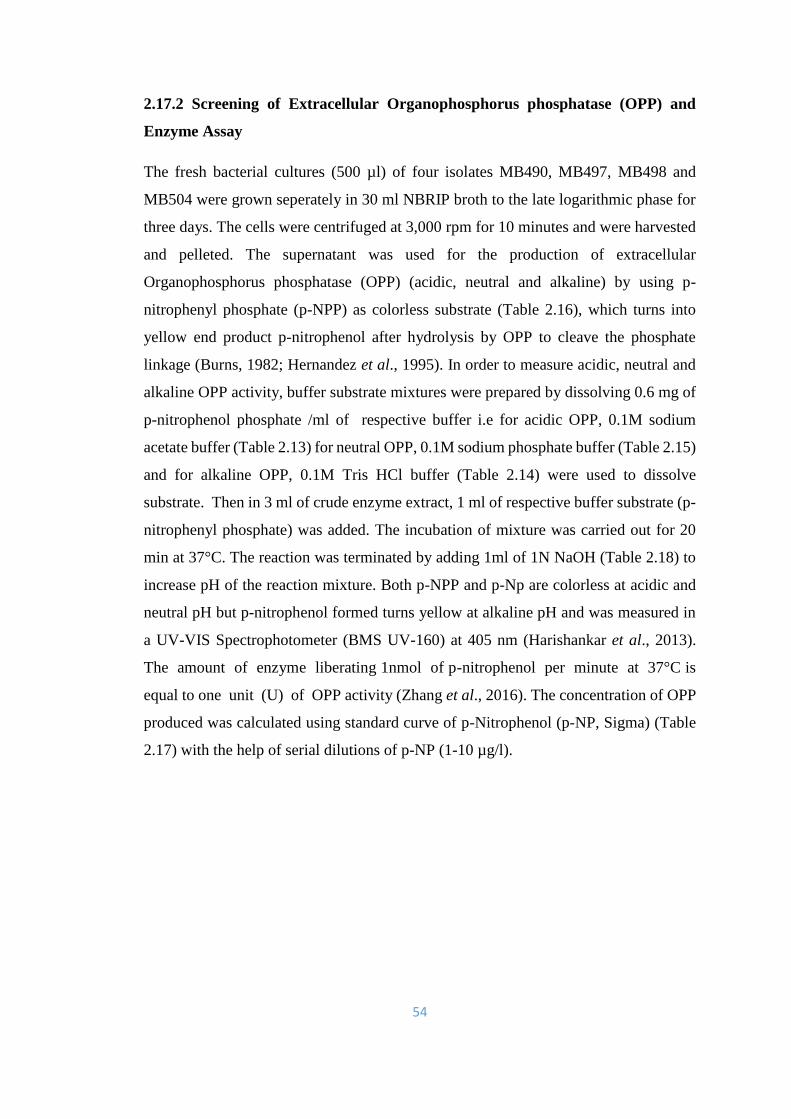
54
2.17.2 Screening of Extracellular Organophosphorus phosphatase (OPP) and
Enzyme Assay
The fresh bacterial cultures (500 µl) of four isolates MB490, MB497, MB498 and
MB504 were grown seperately in 30 ml NBRIP broth to the late logarithmic phase for
three days. The cells were centrifuged at 3,000 rpm for 10 minutes and were harvested
and pelleted. The supernatant was used for the production of extracellular
Organophosphorus phosphatase (OPP) (acidic, neutral and alkaline) by using p-
nitrophenyl phosphate (p-NPP) as colorless substrate (Table 2.16), which turns into
yellow end product p-nitrophenol after hydrolysis by OPP to cleave the phosphate
linkage (Burns, 1982; Hernandez et al., 1995). In order to measure acidic, neutral and
alkaline OPP activity, buffer substrate mixtures were prepared by dissolving 0.6 mg of
p-nitrophenol phosphate /ml of respective buffer i.e for acidic OPP, 0.1M sodium
acetate buffer (Table 2.13) for neutral OPP, 0.1M sodium phosphate buffer (Table 2.15)
and for alkaline OPP, 0.1M Tris HCl buffer (Table 2.14) were used to dissolve
substrate. Then in 3 ml of crude enzyme extract, 1 ml of respective buffer substrate (p-
nitrophenyl phosphate) was added. The incubation of mixture was carried out for 20
min at 37°C. The reaction was terminated by adding 1ml of 1N NaOH (Table 2.18) to
increase pH of the reaction mixture. Both p-NPP and p-Np are colorless at acidic and
neutral pH but p-nitrophenol formed turns yellow at alkaline pH and was measured in
a UV-VIS Spectrophotometer (BMS UV-160) at 405 nm (Harishankar et al., 2013).
The amount of enzyme liberating 1nmol of p-nitrophenol per minute at 37°C is
equal to one unit (U) of OPP activity (Zhang et al., 2016). The concentration of OPP
produced was calculated using standard curve of p-Nitrophenol (p-NP, Sigma) (Table
2.17) with the help of serial dilutions of p-NP (1-10 µg/l).
55
Figure. 2.2 Standard curve for p-Nitrophenol.
2.17.3 Screening of intracellular Organophosphorus phosphatase (OPP)
The resuspension of cell pellet was made in 1ml of phosphate buffer with pH 7 and
silica/glass beads were used for disrupting cells. The centrifugation of the lysate was
carried out at 30,000 g at 4°C for 30 min to remove all cell debris and the
supernatant was used as enzyme source for intracellular OPP activity (Chaudhry et
al.,1988). The 3 ml of this supernatant enzyme extract was mixed with substrate buffer
mixture (1 ml) after various time intervals and incubated for 30 min. The reaction was
stopped by adding 1ml of 1N NaOH. All the experiments were performed in triplicates.
2.17.4 Factors effecting the production of Organophosphorus phosphatase (OPP)
Enzyme
2.17.4a Effect of pH on OPP production
The effect of pH on enzyme production was studied by inoculating24 hrs fresh bacterial
culture (50 µl) in 5 ml of NBRIP broth at pH range of 6, 7, 8, 9, 10 and 11 along with
substrate p-NPP and then incubated for 24 hrs. Initially, the pH of the medium was
adjusted by 1N HCl (Table 2.19) or 1N NaOH before autoclaving. After incubation, the
0.033
0.231
0.7920.893
1.021
1.2131.311
1.4321.53
1.65
2.025
2.52y = 0.1889x - 0.0069
R² = 0.9468
0
0.5
1
1.5
2
2.5
3
0 5 10 15
O.D
(4
05
nm
)
p-Nitrophenol (nmol)
56
sample cultures were centrifuged at 3000 rpm for 10 min and supernatant was used for
enzyme assay.
2.17.4b Effect of temperature on Organophosphorus phosphatase (OPP)
production
The effect of temperature on OPP enzyme production was checked by taking 5ml of
NBRIP broth in test tubes inoculated with 50 µl of 24 hrs fresh bacterial cultures and
then incubating at different temperatures (37, 45, 50 and 60°C) in a rotary shaker for
24 hrs. The enzyme was extracted by centrifugation at 3000 rpm for 10 min.
Supernatant was used to analyze the enzyme production by UV-VIS spectrophotometer
at 405 nm.
2.17.4c Effect of incubation time on Organophosphorus phosphatase (OPP)
enzyme production
In order to study the effect of incubation time on the production of acidic, neutral and
alkaline organophosphate phosphatase enzyme, the NBRIP broth inoculated with 24
hrs fresh bacterial cultures and supplemented with substrate buffer mixture was
incubated at 37°C in a rotary shaker at 120 rpm for 24, 48 and72 hrs. The enzyme was
extracted after incubation, centrifuged and supernatant was used for acidic, neutral and
alkaline organophosphate phosphatase enzyme assay as described above.
2.17.5 Factors affecting Organophosphorus phosphatase enzyme Activity
2.17.5a Effect of temperature on Organophosphorus phosphatase enzyme Activity
For temperature optimization, OPP activity, was assayed at 37, 45, 50, 60 and 70°C,
while pH was maintained according to the acidic, neutral or alkaline nature of enzyme.
The relative residual enzyme activity was measured using UV-VIS Spectrophotometer
at 405 nm as before immediately.
2.17.5b Effect of chemicals on Organophosphorus phosphatase enzyme Activity
The effect of different concentrations of SDS and EDTA on OPP activity was studied
using the supernatant enzyme extract mixed with substrate buffer and then adding SDS
and EDTA (2.5, 5 and 7.5%) separately to it. This enzyme reaction mixture was
57
incubated for 30 min at 37°C and then enzyme activity was assayed/analyzed using
UV-VIS Spectrophotometer at 405 nm. Control was without these chemicals.
2.17.5c Effect of metals on Organophosphorus phosphatase enzyme Activity
In order to study the effect of different metals on the activity of acidic, neutral and
alkaline OPP, 2.5% of stock solutions of different metals like ZnSO4, CuSO4 and CdCl2
(Table 2.27, 2.26 and 2.25, respectively) were added separately to enzyme substrate
mixture and was incubated at 37°C for 30 min while control was without metals. The
enzyme activity was analyzed using UV-VIS Spectrophotometer at 405 nm as
mentioned before.
2.17.5d Effect of Substrate concentration on Organophosphorus phosphatase
enzyme Activity
In order to study the effect of substrate concentration on the activity of OPP, different
substrate concentrations of 0.06, 0.6, 0.8 and 1.1% were used in the supernatant enzyme
extract of acidic, neutral and alkaline phosphatases and incubated for 30 min. Then
enzyme activity was observed and calculated with the help of UV-VIS
Spectrophotometer at 405nm.
2.17.5e Effect of incubation period on Organophosphorus phosphatase enzyme
Activity
Similarly enzyme activity at different incubation times of 30, 50, 70 and 90 minutes
was observed using p-NPP as substrate in the supernatant enzyme extract. The enzyme
activity determined with the help of UV-VIS Spectrophotometer at 405 nm.
2.17.6 Metal bioprecipitation by Organophosphorus phosphatase enzyme
The bioprecipitation potential of acidic, neutral and alkaline phosphatases was studied
for different heavy metals i.e Ni+2, Cr+6, Mn+2 and Cd+2. For this purpose, 30 ml NBRIP
broth was inoculated with 24 hrs fresh bacterial culture, and incubated for 3 days at
37°C at 150 rpm. Then, the bacterial culture broth was centrifuged at 8000 rpm for 10
minutes and supernatant (extracellular OPP phosphatase) was collected and used for
metal bioprecipitation study. The reaction mixture was prepared by using buffer
substrate mixture and extracellular phosphatase extract (supernatant) supplemented
58
with 1000 ppm of respective metal ion stock solutions of Ni+2 (NiCl2), Cr+6 (K2Cr2O7),
Mn+2 (MnCl2) and Cd+2 (CdCl2) (Table 2.20, 2.21, 2.22 and 2.23 respectively) at
different incubation times of 60 min, 120 min and 180 min. The amount of
bioprecipitated metal was measured by quantifying the reduction in the concentration
of respective metal content in the supernatant before and after incubation using Atomic
Absorption Spectrometer (AAS Shimadzu AA 7000), with the help of following
equation:
X = (A-B)/A×100 (Chaudhary et al., 2013)
Where
X = % of metal precipitation
A = Initial concentration of metal in the aliquot
B = Final concentration of metal in the aliquot i.e the supernatant.
2.17.7 Substrate specificity determination of Organophosphorus phosphatase
enzyme against OP pesticides (CPF, TAP and DM)
Finally the substrate specificity of OPP against different organophosphorus insecticides
(Chlorpyrifos, Dimethoate and Triazophos) was determined by measuring the OPP
activity against 50 mg/l of respective pesticides using HPLC and metabolites formed
were analyzed using GCMS (Liang et al., 2005; Gao et al., 2012).
59
RESULTS
Chapter 3
Isolation, characterization and screening of organophosphate
degrading soil bacterial isolates
Overview
Organophosphates are among the main group of pesticides being used extensively
worldwide to control pests as well as other domestic and veterinary insects. Their over
use has led to the contamination of soil, water and food resources. These become
harmful for non-target organisms by entering the food chain and causing
biomagnification. On the other hand, a large number of microbes have been reported
that are capable of degrading pesticides. Therefore present study was carried out to
isolate indigenous organophosphate (OP) degrading soil bacteria from different
agricultural soils of district Mianwali, Punjab, Pakistan. For this purpose, a large
number of bacterial isolates were obtained from the soil of three different wheat and
cotton fields at 6-12 inch depth. Diverse bacterial colonies were obtained by spread
plate method (105 CFU/g of soil). Out of them, fifteen bacterial isolates were selected
based on their distinct morphological characters and their tolerance against the OP
pesticides Chlorpyrifos (CPF), Triazophos (TAP) and Dimethoate (DM). After
purification on nutrient agar medium, they were named as MB490 to MB505. Among
them, four best isolates (MB490, MB497, MB498 and MB504) were selected for
further analyses. In case of CPF, MB497 was seen most tolerant as it could tolerate up
to 8 g/l of CPF, while MB490 and MB498 could tolerate up to 6 g/l and MB504 up to
0.8 g/l of CPF concentration. For TAP, MB490, MB497 and MB498 were tolerant up
to 4 g/l, while MB504 could grow up to 2 g/l of TAP. Similarly, for Dimethoate (DM),
MB504 was least tolerant up to 0.22 g/l, while MB490, MB497 and MB498 showed
growth up to 0.4 g/l of Dimethoate. MB504 showed the highest biodegradation of
63.56 % followed by MB490 with 63.19% .While MB497 and MB498 could degrade
41.57% and 37.97% respectively of Chlorpyrifos (0.8 g/l) after 72 hrs of incubation.
60
Isolate MB497 was Gram positive, while the other three were Gram negative. All were
rods and facultative anaerobes. All the isolates were mesophiles growing best at 30 to
42◦C. While on the basis of pH, these were characterized as neutrophile (MB490),
slightly acidophile (MB504), and moderately alkaliphile (MB497 and MB498). All of
the isolates showed multiple heavy metal resistance.The four isolates were positive for
important enzymes like Nitrate Reductase, Oxidase and Catalase etc. needed for
biodegradation. On the basis of all above mentioned facts, it can be suggested that these
isolated bacteria have good potential for degradation of OP pesticides and can be
utilized for bioremediation of OP pesticide contaminated soils.
Background
There are many reports that indigenous microbes from soil have potential for pesticide
degradation. The degradation of ipconazole (triazole fungicide) by soil
microorganisms (bacteria, Actinomycetes and fungi) was reported by Eizuka et al.
(2003). Similarly, the degradation of a chlorpyrifos contaminated soil using indigenous
mixed microorganisms in a slurry bioreactor at 3000 μg/g, 6000 μg/g and 12000 μg/g
was studied by Mohan et al. (2004) where they observed that 91, 82 and 14% of
chlorpyrifos was respectively degraded after 72 hrs. Singh (2008) reported the potential
of an isolated inborn fungal strain from corn field soil to degrade 44% of atrazine
within 20 days and utilize atrazine as a source of nitrogen. The isolation and
characterization of a fungal strain was mentioned by Yu et al. (2006) having potential
of degrading more than 80% of Chlorpyrifos and using it as a sole source of carbon
and energy. Mostly pesticides are applied simultaneously or in sequence for crop
protection, which results in a collective contamination of pesticide residues in the soil
environment (Diez, 2010). The biodegradation of lindane by a native bacterial
consortium was studied by Pesce and Wunderlin (2004) and they reported the
degradation of lindane by B. thiooxidans and S. Paucimobilis within 3 days of aerobic
incubation. Chu et al. 2008 investigated the impact of chlorothalonil on degradation of
chlorpyrifos and its effects on microbial populations in the soil. They found that
Chlorpyrifos degradation was not effected significantly by the presence of
chlorothalonil but there was increased inhibitory effect of chlorpyrifos on soil
microorganisms. Chirnside et al. (2007) reported the isolation of an indigenous
microbial consortium from polluted soils having a potential to degrade both atrazine
61
and alachlor. According to them, the consortium revealed a unique degradation pattern
in which atrazine degradation was dependent on alachlor degradation.
There have been many recent studies for isolation and characterization of various
Actinomycetes able to degrade pesticides (Benimeli et al., 2003). The lindane
biodegradation capability of Streptomyces sp. M7 in soil samples was studied by
Benimeli et al. (2008). They worked out effects of pesticide on maize plants grown in
lindane-polluted soil formerly inoculated with Streptomyces sp. M7. The researchers
found that Streptomyces sp. improved the biomass and concurrently reduced lindane
residues. According to them, the activity and growth of this strain was not inhibited by
natural soil microbial flora and by high pesticide concentration.
On the basis of above studies, current research was conducted to isolate, screen and
characterize the indigenous soil bacteria and to optimize different parameters for the
bacterial growth and OP pesticide biodegradation. The Detail of experimental results
with optimized parameters has been given in this chapter.
Results and Discussion
3.1 Soil Sampling and Physical and Chemical properties of Soil
For the isolation of OP degrading bacteria, soil sample collected was analyzed for its
physical and chemical properties as explained in section 2.2 of chapter 2 (Materials
and Methods). Soil pH was found to be 6.21, soil EC 143.3 µS/cm and soil organic
matter was 3.15%. Soil texture was to be sandy loam with 5% moisture. (Table 3.1).
Soils with EC below 0.4 mS/cm (400 µS/cm) are considered slightly or non-saline,
wheras soils having EC more than 0.8 mS/cm are considered highly saline (Wagh et
al., 2013). The agricultural soil used for bacterial isolation under current study was
found non-saline having EC value of 143.3µS/cm (0.1433 mS/cm).
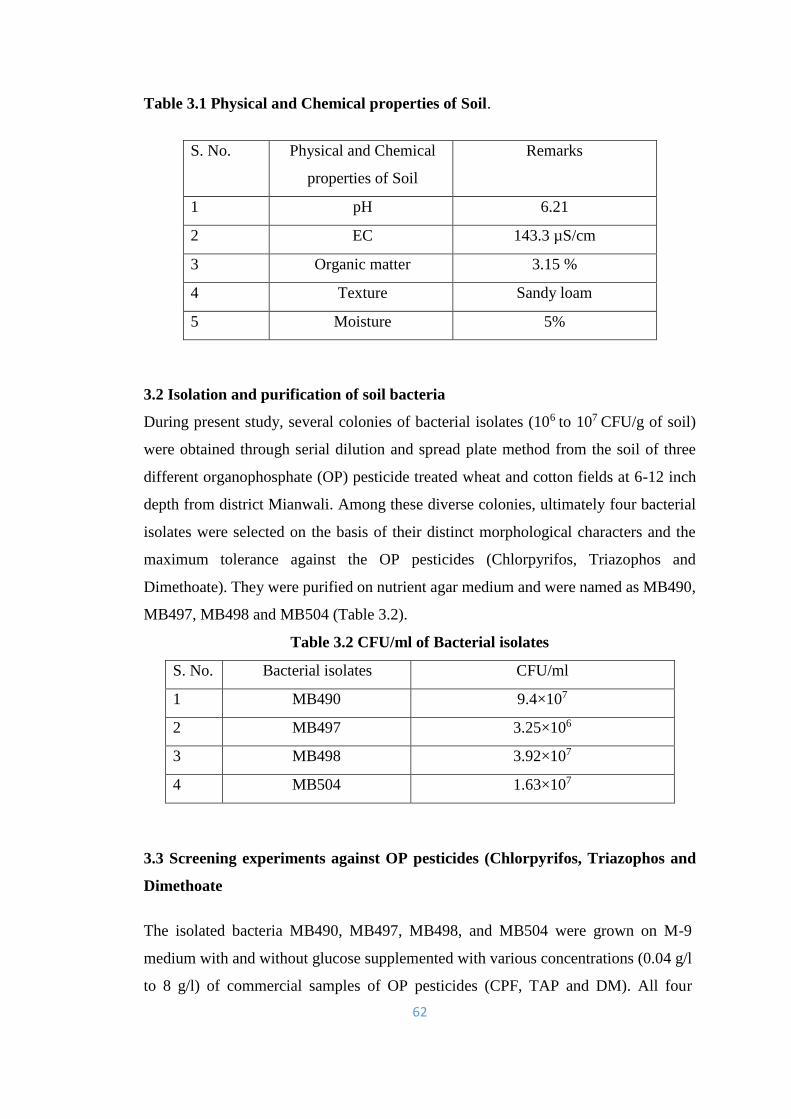
62
Table 3.1 Physical and Chemical properties of Soil.
S. No. Physical and Chemical
properties of Soil
Remarks
1 pH 6.21
2 EC 143.3 µS/cm
3 Organic matter 3.15 %
4 Texture Sandy loam
5 Moisture 5%
3.2 Isolation and purification of soil bacteria
During present study, several colonies of bacterial isolates (106 to 107 CFU/g of soil)
were obtained through serial dilution and spread plate method from the soil of three
different organophosphate (OP) pesticide treated wheat and cotton fields at 6-12 inch
depth from district Mianwali. Among these diverse colonies, ultimately four bacterial
isolates were selected on the basis of their distinct morphological characters and the
maximum tolerance against the OP pesticides (Chlorpyrifos, Triazophos and
Dimethoate). They were purified on nutrient agar medium and were named as MB490,
MB497, MB498 and MB504 (Table 3.2).
Table 3.2 CFU/ml of Bacterial isolates
S. No. Bacterial isolates CFU/ml
1 MB490 9.4×10⁷
2 MB497 3.25×10⁶
3 MB498 3.92×10⁷
4 MB504 1.63×10⁷
3.3 Screening experiments against OP pesticides (Chlorpyrifos, Triazophos and
Dimethoate
The isolated bacteria MB490, MB497, MB498, and MB504 were grown on M-9
medium with and without glucose supplemented with various concentrations (0.04 g/l
to 8 g/l) of commercial samples of OP pesticides (CPF, TAP and DM). All four
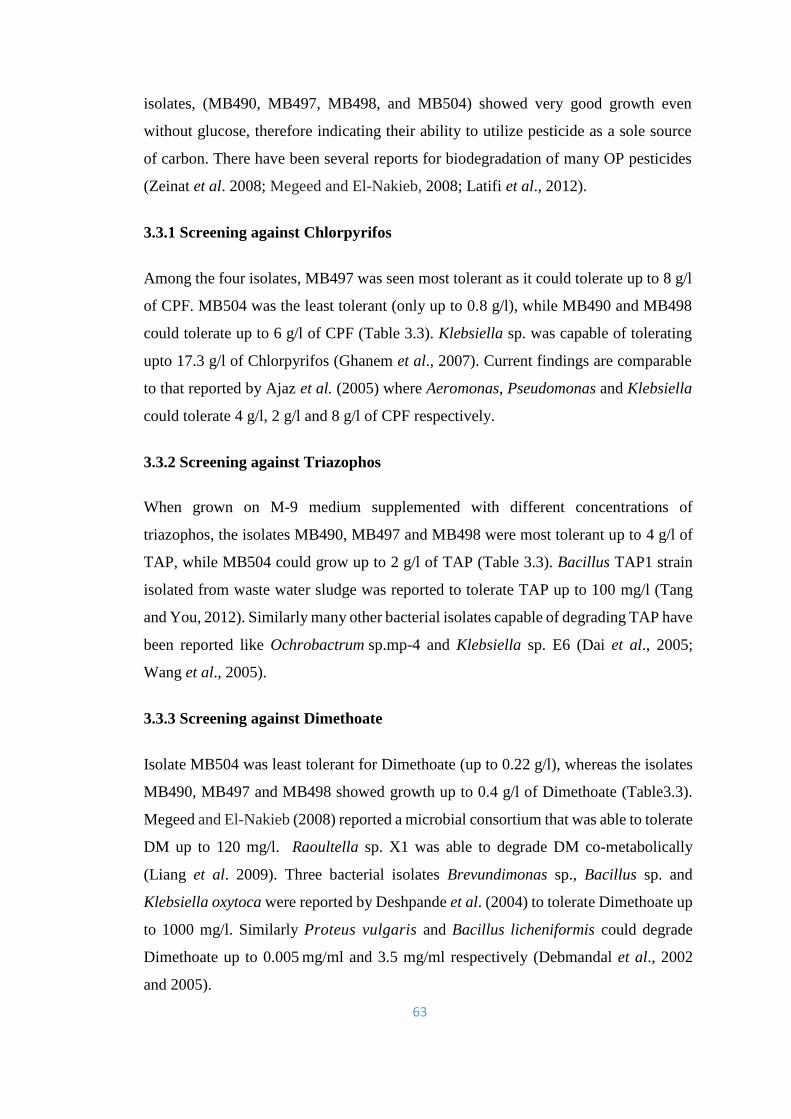
63
isolates, (MB490, MB497, MB498, and MB504) showed very good growth even
without glucose, therefore indicating their ability to utilize pesticide as a sole source
of carbon. There have been several reports for biodegradation of many OP pesticides
(Zeinat et al. 2008; Megeed and El-Nakieb, 2008; Latifi et al., 2012).
3.3.1 Screening against Chlorpyrifos
Among the four isolates, MB497 was seen most tolerant as it could tolerate up to 8 g/l
of CPF. MB504 was the least tolerant (only up to 0.8 g/l), while MB490 and MB498
could tolerate up to 6 g/l of CPF (Table 3.3). Klebsiella sp. was capable of tolerating
upto 17.3 g/l of Chlorpyrifos (Ghanem et al., 2007). Current findings are comparable
to that reported by Ajaz et al. (2005) where Aeromonas, Pseudomonas and Klebsiella
could tolerate 4 g/l, 2 g/l and 8 g/l of CPF respectively.
3.3.2 Screening against Triazophos
When grown on M-9 medium supplemented with different concentrations of
triazophos, the isolates MB490, MB497 and MB498 were most tolerant up to 4 g/l of
TAP, while MB504 could grow up to 2 g/l of TAP (Table 3.3). Bacillus TAP1 strain
isolated from waste water sludge was reported to tolerate TAP up to 100 mg/l (Tang
and You, 2012). Similarly many other bacterial isolates capable of degrading TAP have
been reported like Ochrobactrum sp.mp-4 and Klebsiella sp. E6 (Dai et al., 2005;
Wang et al., 2005).
3.3.3 Screening against Dimethoate
Isolate MB504 was least tolerant for Dimethoate (up to 0.22 g/l), whereas the isolates
MB490, MB497 and MB498 showed growth up to 0.4 g/l of Dimethoate (Table3.3).
Megeed and El-Nakieb (2008) reported a microbial consortium that was able to tolerate
DM up to 120 mg/l. Raoultella sp. X1 was able to degrade DM co-metabolically
(Liang et al. 2009). Three bacterial isolates Brevundimonas sp., Bacillus sp. and
Klebsiella oxytoca were reported by Deshpande et al. (2004) to tolerate Dimethoate up
to 1000 mg/l. Similarly Proteus vulgaris and Bacillus licheniformis could degrade
Dimethoate up to 0.005 mg/ml and 3.5 mg/ml respectively (Debmandal et al., 2002
and 2005).
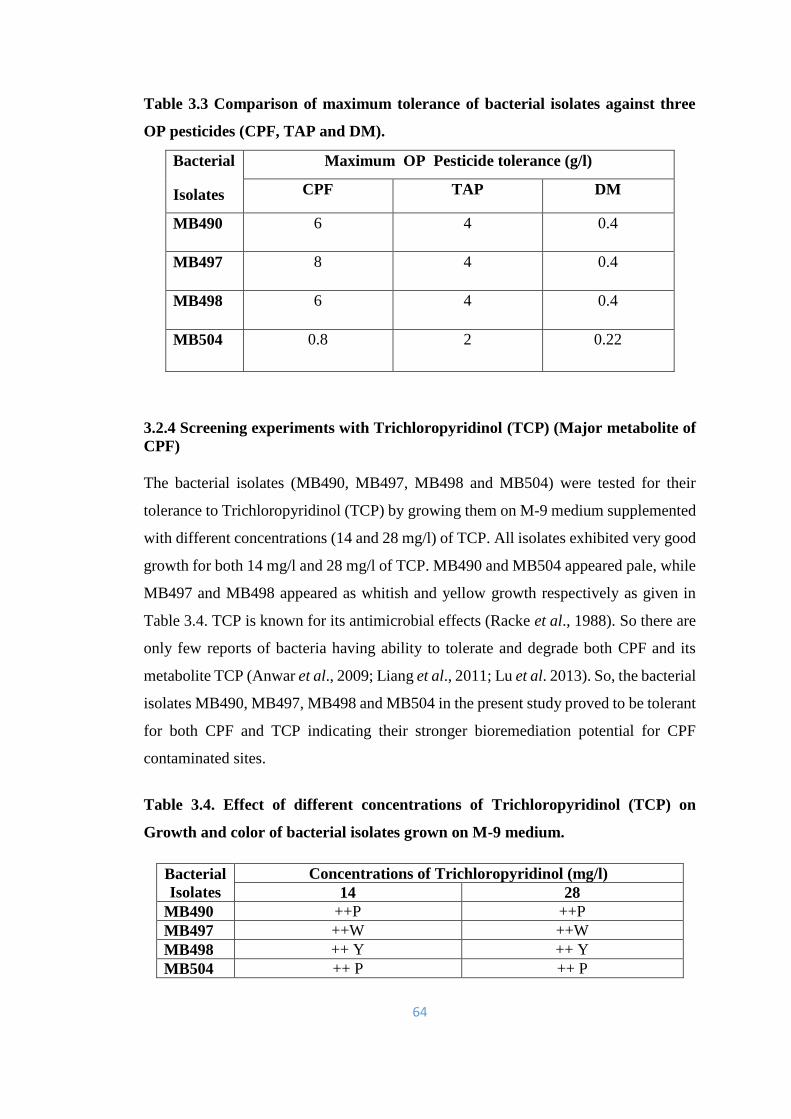
64
Table 3.3 Comparison of maximum tolerance of bacterial isolates against three
OP pesticides (CPF, TAP and DM).
Bacterial
Isolates
Maximum OP Pesticide tolerance (g/l)
CPF TAP DM
MB490 6 4 0.4
MB497 8 4 0.4
MB498 6 4 0.4
MB504 0.8 2 0.22
3.2.4 Screening experiments with Trichloropyridinol (TCP) (Major metabolite of
CPF)
The bacterial isolates (MB490, MB497, MB498 and MB504) were tested for their
tolerance to Trichloropyridinol (TCP) by growing them on M-9 medium supplemented
with different concentrations (14 and 28 mg/l) of TCP. All isolates exhibited very good
growth for both 14 mg/l and 28 mg/l of TCP. MB490 and MB504 appeared pale, while
MB497 and MB498 appeared as whitish and yellow growth respectively as given in
Table 3.4. TCP is known for its antimicrobial effects (Racke et al., 1988). So there are
only few reports of bacteria having ability to tolerate and degrade both CPF and its
metabolite TCP (Anwar et al., 2009; Liang et al., 2011; Lu et al. 2013). So, the bacterial
isolates MB490, MB497, MB498 and MB504 in the present study proved to be tolerant
for both CPF and TCP indicating their stronger bioremediation potential for CPF
contaminated sites.
Table 3.4. Effect of different concentrations of Trichloropyridinol (TCP) on
Growth and color of bacterial isolates grown on M-9 medium.
Bacterial
Isolates
Concentrations of Trichloropyridinol (mg/l)
14 28
MB490 ++P ++P
MB497 ++W ++W
MB498 ++ Y ++ Y
MB504 ++ P ++ P
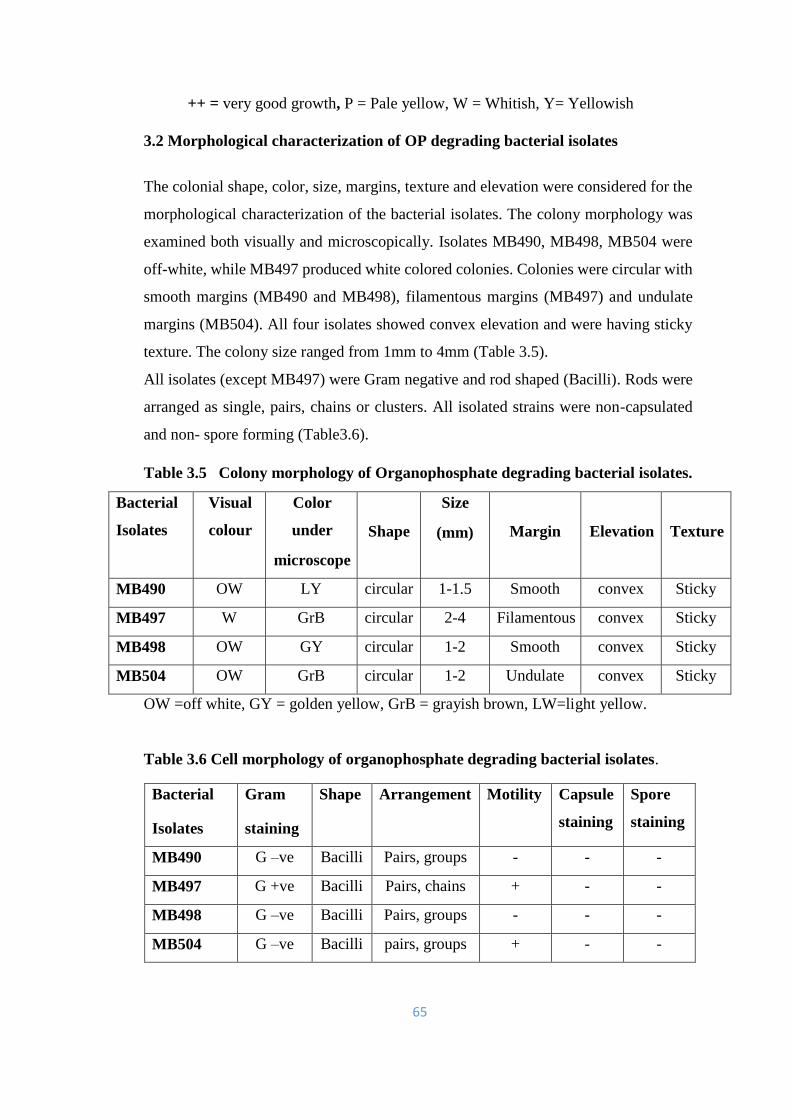
65
++ = very good growth, P = Pale yellow, W = Whitish, Y= Yellowish
3.2 Morphological characterization of OP degrading bacterial isolates
The colonial shape, color, size, margins, texture and elevation were considered for the
morphological characterization of the bacterial isolates. The colony morphology was
examined both visually and microscopically. Isolates MB490, MB498, MB504 were
off-white, while MB497 produced white colored colonies. Colonies were circular with
smooth margins (MB490 and MB498), filamentous margins (MB497) and undulate
margins (MB504). All four isolates showed convex elevation and were having sticky
texture. The colony size ranged from 1mm to 4mm (Table 3.5).
All isolates (except MB497) were Gram negative and rod shaped (Bacilli). Rods were
arranged as single, pairs, chains or clusters. All isolated strains were non-capsulated
and non- spore forming (Table3.6).
Table 3.5 Colony morphology of Organophosphate degrading bacterial isolates.
Bacterial
Isolates
Visual
colour
Color
under
microscope
Shape
Size
(mm) Margin Elevation Texture
MB490 OW LY circular 1-1.5 Smooth convex Sticky
MB497 W GrB circular 2-4 Filamentous convex Sticky
MB498 OW GY circular 1-2 Smooth convex Sticky
MB504 OW GrB circular 1-2 Undulate convex Sticky
OW =off white, GY = golden yellow, GrB = grayish brown, LW=light yellow.
Table 3.6 Cell morphology of organophosphate degrading bacterial isolates.
Bacterial
Isolates
Gram
staining
Shape Arrangement Motility Capsule
staining
Spore
staining
MB490 G –ve Bacilli Pairs, groups - - -
MB497 G +ve Bacilli Pairs, chains + - -
MB498 G –ve Bacilli Pairs, groups - - -
MB504 G –ve Bacilli pairs, groups + - -
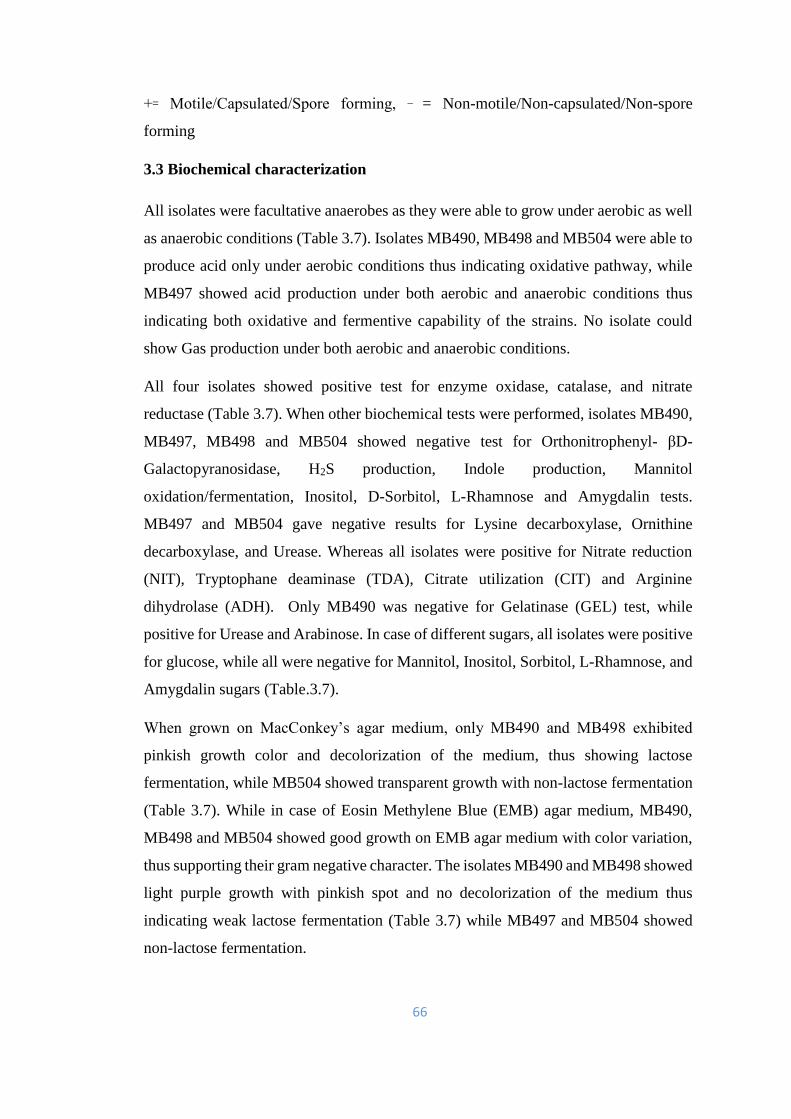
66
+꞊ Motile/Capsulated/Spore forming, _ = Non-motile/Non-capsulated/Non-spore
forming
3.3 Biochemical characterization
All isolates were facultative anaerobes as they were able to grow under aerobic as well
as anaerobic conditions (Table 3.7). Isolates MB490, MB498 and MB504 were able to
produce acid only under aerobic conditions thus indicating oxidative pathway, while
MB497 showed acid production under both aerobic and anaerobic conditions thus
indicating both oxidative and fermentive capability of the strains. No isolate could
show Gas production under both aerobic and anaerobic conditions.
All four isolates showed positive test for enzyme oxidase, catalase, and nitrate
reductase (Table 3.7). When other biochemical tests were performed, isolates MB490,
MB497, MB498 and MB504 showed negative test for Orthonitrophenyl- βD-
Galactopyranosidase, H2S production, Indole production, Mannitol
oxidation/fermentation, Inositol, D-Sorbitol, L-Rhamnose and Amygdalin tests.
MB497 and MB504 gave negative results for Lysine decarboxylase, Ornithine
decarboxylase, and Urease. Whereas all isolates were positive for Nitrate reduction
(NIT), Tryptophane deaminase (TDA), Citrate utilization (CIT) and Arginine
dihydrolase (ADH). Only MB490 was negative for Gelatinase (GEL) test, while
positive for Urease and Arabinose. In case of different sugars, all isolates were positive
for glucose, while all were negative for Mannitol, Inositol, Sorbitol, L-Rhamnose, and
Amygdalin sugars (Table.3.7).
When grown on MacConkey’s agar medium, only MB490 and MB498 exhibited
pinkish growth color and decolorization of the medium, thus showing lactose
fermentation, while MB504 showed transparent growth with non-lactose fermentation
(Table 3.7). While in case of Eosin Methylene Blue (EMB) agar medium, MB490,
MB498 and MB504 showed good growth on EMB agar medium with color variation,
thus supporting their gram negative character. The isolates MB490 and MB498 showed
light purple growth with pinkish spot and no decolorization of the medium thus
indicating weak lactose fermentation (Table 3.7) while MB497 and MB504 showed
non-lactose fermentation.
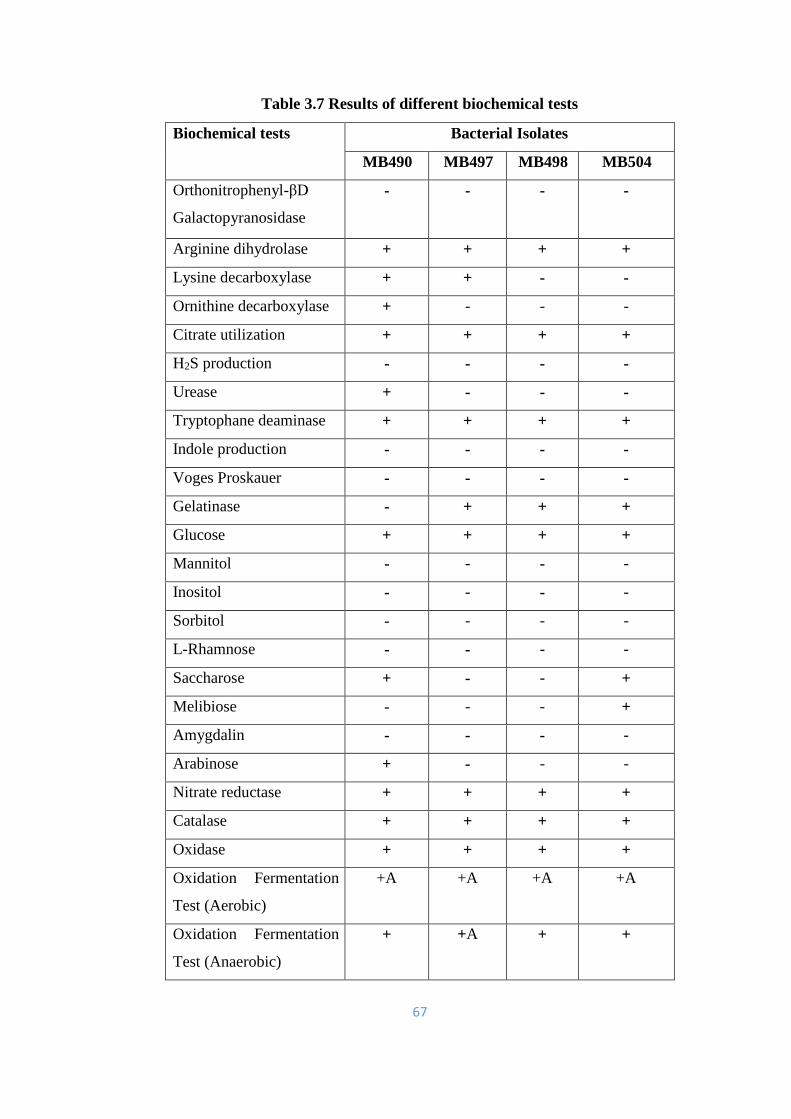
67
Table 3.7 Results of different biochemical tests
Biochemical tests Bacterial Isolates
MB490 MB497 MB498 MB504
Orthonitrophenyl-βD
Galactopyranosidase
- - - -
Arginine dihydrolase + + + +
Lysine decarboxylase + + - -
Ornithine decarboxylase + - - -
Citrate utilization + + + +
H2S production - - - -
Urease + - - -
Tryptophane deaminase + + + +
Indole production - - - -
Voges Proskauer - - - -
Gelatinase - + + +
Glucose + + + +
Mannitol - - - -
Inositol - - - -
Sorbitol - - - -
L-Rhamnose - - - -
Saccharose + - - +
Melibiose - - - +
Amygdalin - - - -
Arabinose + - - -
Nitrate reductase + + + +
Catalase + + + +
Oxidase + + + +
Oxidation Fermentation
Test (Aerobic)
+A +A +A +A
Oxidation Fermentation
Test (Anaerobic)
+ +A + +
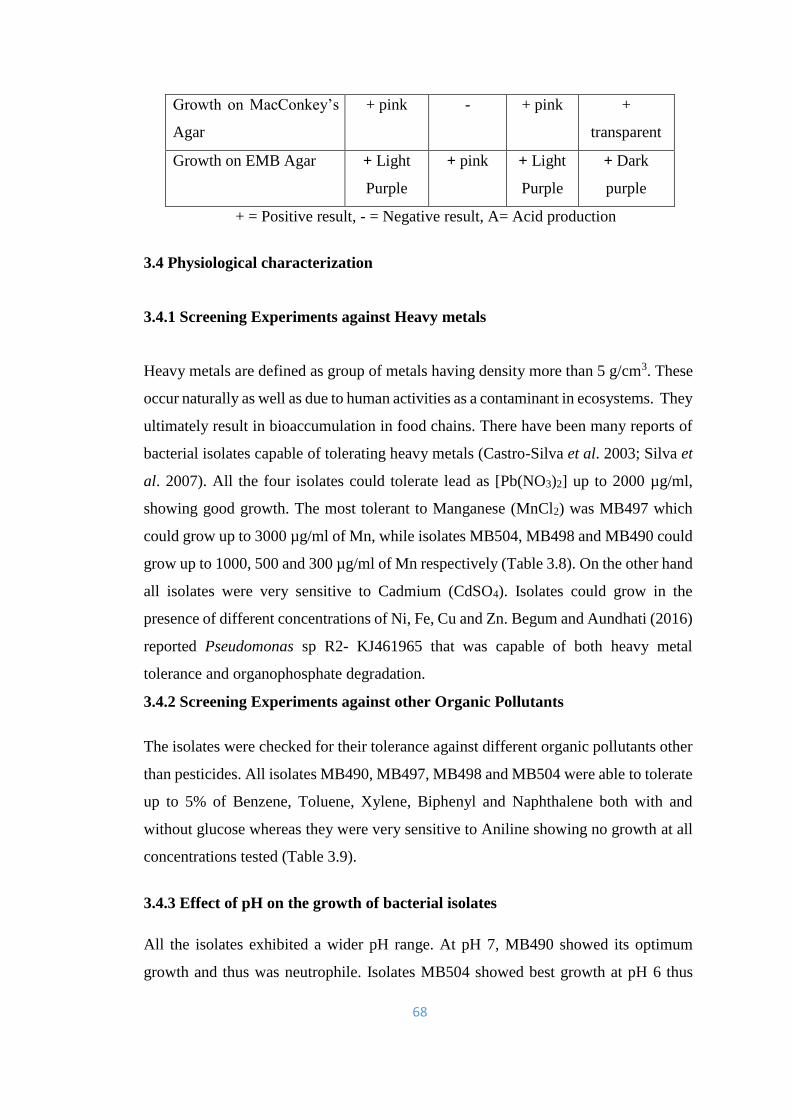
68
Growth on MacConkey’s
Agar
+ pink - + pink +
transparent
Growth on EMB Agar + Light
Purple
+ pink + Light
Purple
+ Dark
purple
+ = Positive result, - = Negative result, A= Acid production
3.4 Physiological characterization
3.4.1 Screening Experiments against Heavy metals
Heavy metals are defined as group of metals having density more than 5 g/cm3. These
occur naturally as well as due to human activities as a contaminant in ecosystems. They
ultimately result in bioaccumulation in food chains. There have been many reports of
bacterial isolates capable of tolerating heavy metals (Castro-Silva et al. 2003; Silva et
al. 2007). All the four isolates could tolerate lead as [Pb(NO3)2] up to 2000 µg/ml,
showing good growth. The most tolerant to Manganese (MnCl2) was MB497 which
could grow up to 3000 µg/ml of Mn, while isolates MB504, MB498 and MB490 could
grow up to 1000, 500 and 300 µg/ml of Mn respectively (Table 3.8). On the other hand
all isolates were very sensitive to Cadmium (CdSO4). Isolates could grow in the
presence of different concentrations of Ni, Fe, Cu and Zn. Begum and Aundhati (2016)
reported Pseudomonas sp R2- KJ461965 that was capable of both heavy metal
tolerance and organophosphate degradation.
3.4.2 Screening Experiments against other Organic Pollutants
The isolates were checked for their tolerance against different organic pollutants other
than pesticides. All isolates MB490, MB497, MB498 and MB504 were able to tolerate
up to 5% of Benzene, Toluene, Xylene, Biphenyl and Naphthalene both with and
without glucose whereas they were very sensitive to Aniline showing no growth at all
concentrations tested (Table 3.9).
3.4.3 Effect of pH on the growth of bacterial isolates
All the isolates exhibited a wider pH range. At pH 7, MB490 showed its optimum
growth and thus was neutrophile. Isolates MB504 showed best growth at pH 6 thus
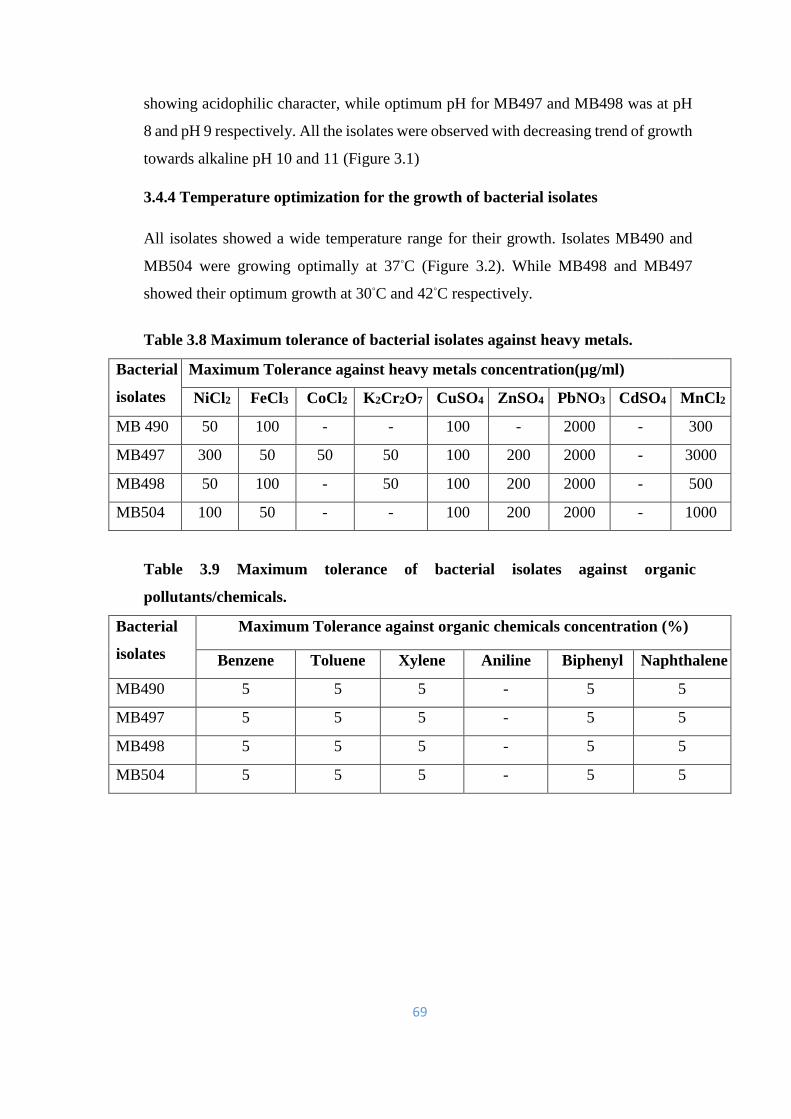
69
showing acidophilic character, while optimum pH for MB497 and MB498 was at pH
8 and pH 9 respectively. All the isolates were observed with decreasing trend of growth
towards alkaline pH 10 and 11 (Figure 3.1)
3.4.4 Temperature optimization for the growth of bacterial isolates
All isolates showed a wide temperature range for their growth. Isolates MB490 and
MB504 were growing optimally at 37◦C (Figure 3.2). While MB498 and MB497
showed their optimum growth at 30◦C and 42◦C respectively.
Table 3.8 Maximum tolerance of bacterial isolates against heavy metals.
Bacterial
isolates
Maximum Tolerance against heavy metals concentration(µg/ml)
NiCl2 FeCl3 CoCl2 K2Cr2O7 CuSO4 ZnSO4 PbNO3 CdSO4 MnCl2
MB 490 50 100 - - 100 - 2000 - 300
MB497 300 50 50 50 100 200 2000 - 3000
MB498 50 100 - 50 100 200 2000 - 500
MB504 100 50 - - 100 200 2000 - 1000
Table 3.9 Maximum tolerance of bacterial isolates against organic
pollutants/chemicals.
Bacterial
isolates
Maximum Tolerance against organic chemicals concentration (%)
Benzene Toluene Xylene Aniline Biphenyl Naphthalene
MB490 5 5 5 - 5 5
MB497 5 5 5 - 5 5
MB498 5 5 5 - 5 5
MB504 5 5 5 - 5 5
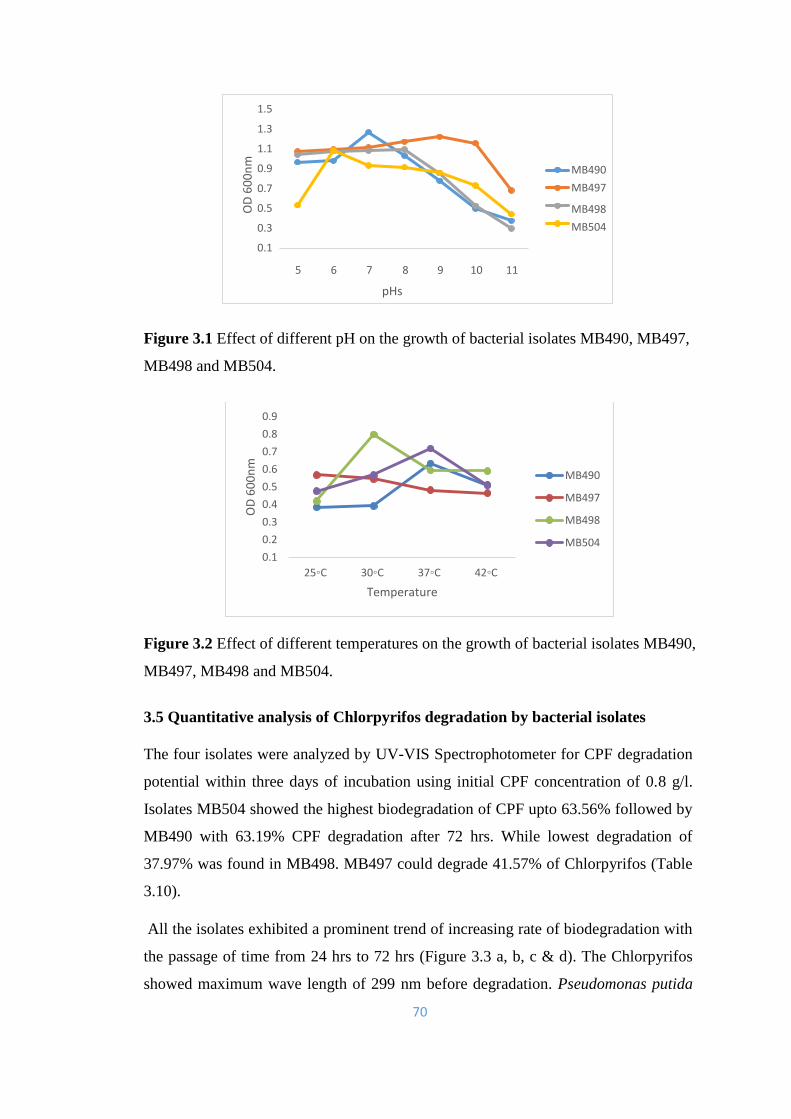
70
Figure 3.1 Effect of different pH on the growth of bacterial isolates MB490, MB497,
MB498 and MB504.
Figure 3.2 Effect of different temperatures on the growth of bacterial isolates MB490,
MB497, MB498 and MB504.
3.5 Quantitative analysis of Chlorpyrifos degradation by bacterial isolates
The four isolates were analyzed by UV-VIS Spectrophotometer for CPF degradation
potential within three days of incubation using initial CPF concentration of 0.8 g/l.
Isolates MB504 showed the highest biodegradation of CPF upto 63.56% followed by
MB490 with 63.19% CPF degradation after 72 hrs. While lowest degradation of
37.97% was found in MB498. MB497 could degrade 41.57% of Chlorpyrifos (Table
3.10).
All the isolates exhibited a prominent trend of increasing rate of biodegradation with
the passage of time from 24 hrs to 72 hrs (Figure 3.3 a, b, c & d). The Chlorpyrifos
showed maximum wave length of 299 nm before degradation. Pseudomonas putida
0.1
0.2
0.3
0.4
0.5
0.6
0.7
0.8
0.9
25◦C 30◦C 37◦C 42◦C
OD
60
0n
m
Temperature
MB490
MB497
MB498
MB504
0.1
0.3
0.5
0.7
0.9
1.1
1.3
1.5
5 6 7 8 9 10 11
pHs
MB490 MB497
MB498 MB504
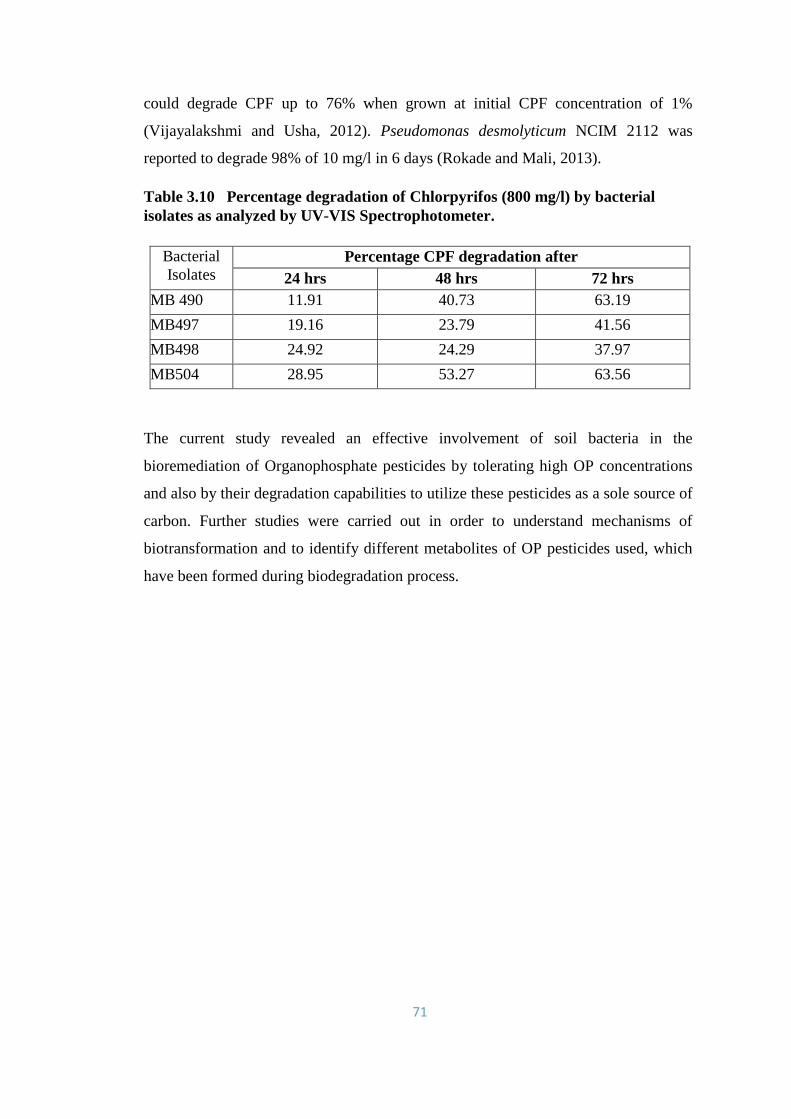
71
could degrade CPF up to 76% when grown at initial CPF concentration of 1%
(Vijayalakshmi and Usha, 2012). Pseudomonas desmolyticum NCIM 2112 was
reported to degrade 98% of 10 mg/l in 6 days (Rokade and Mali, 2013).
Table 3.10 Percentage degradation of Chlorpyrifos (800 mg/l) by bacterial
isolates as analyzed by UV-VIS Spectrophotometer.
Bacterial
Isolates Percentage CPF degradation after
24 hrs 48 hrs 72 hrs
MB 490 11.91 40.73 63.19
MB497 19.16 23.79 41.56
MB498 24.92 24.29 37.97
MB504 28.95 53.27 63.56
The current study revealed an effective involvement of soil bacteria in the
bioremediation of Organophosphate pesticides by tolerating high OP concentrations
and also by their degradation capabilities to utilize these pesticides as a sole source of
carbon. Further studies were carried out in order to understand mechanisms of
biotransformation and to identify different metabolites of OP pesticides used, which
have been formed during biodegradation process.
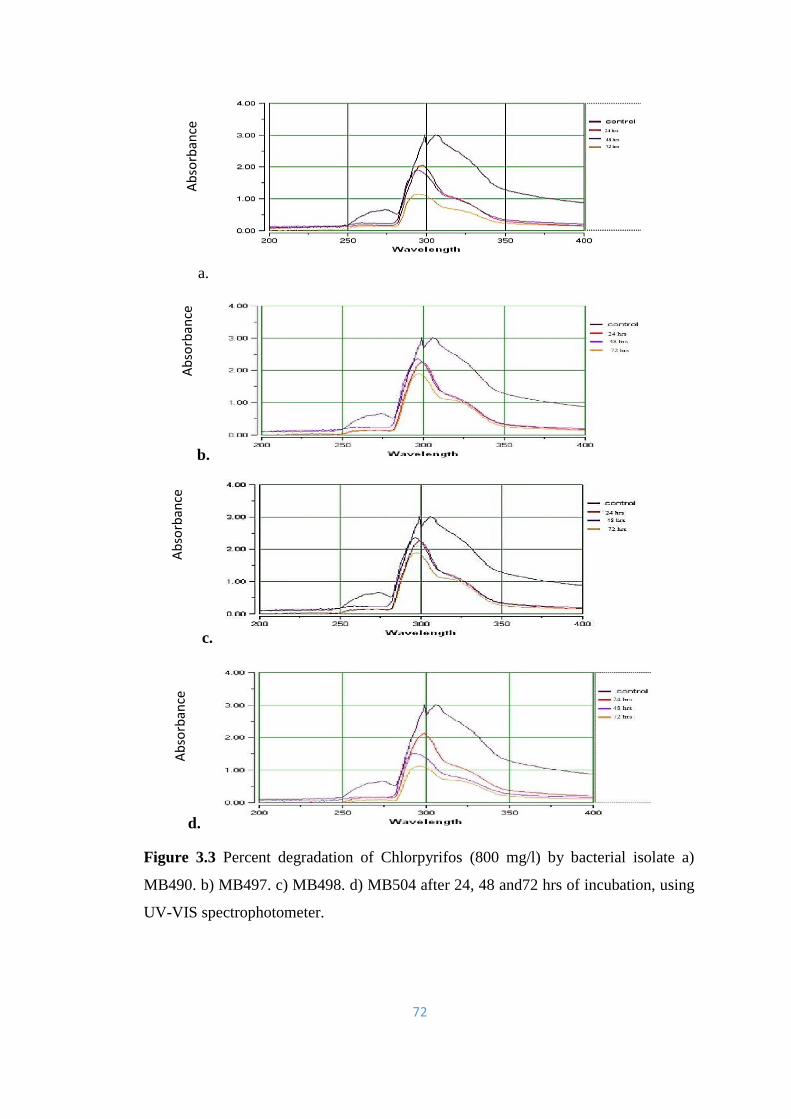
72
a.
b.
c.
d.
Figure 3.3 Percent degradation of Chlorpyrifos (800 mg/l) by bacterial isolate a)
MB490. b) MB497. c) MB498. d) MB504 after 24, 48 and72 hrs of incubation, using
UV-VIS spectrophotometer.
Ab
sorb
ance
A
bso
rban
ce
Ab
sorb
ance
A
bso
rban
ce
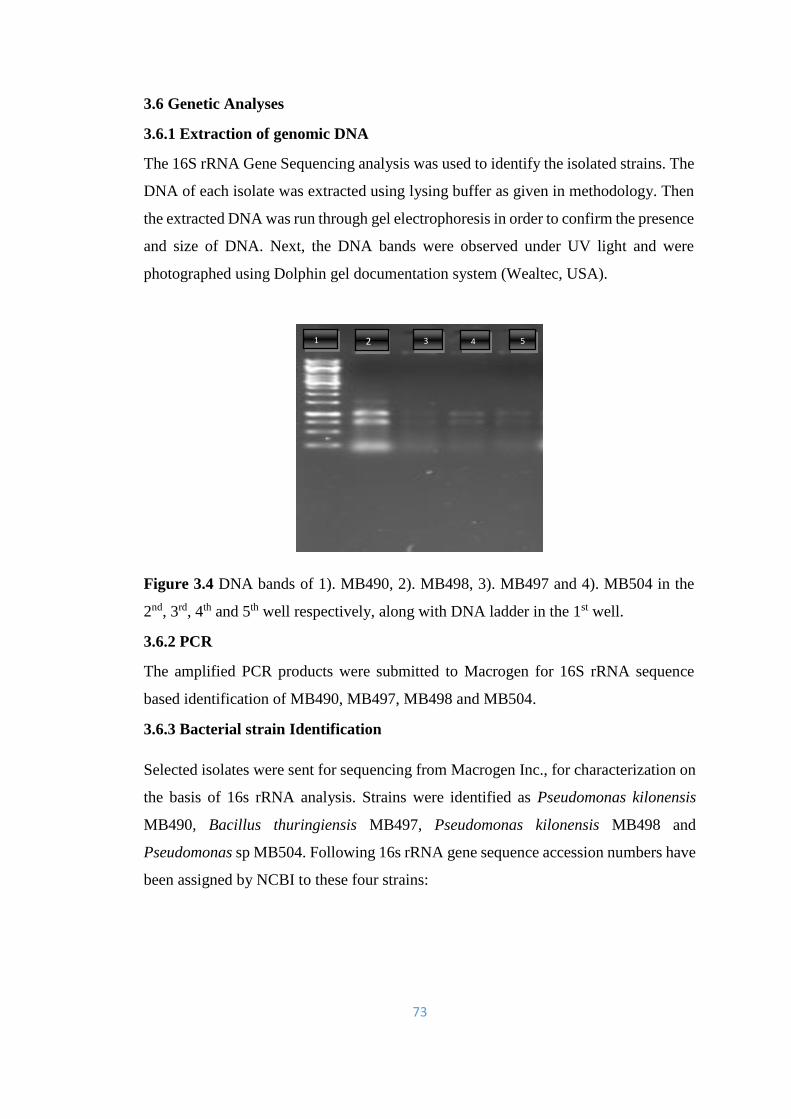
73
3.6 Genetic Analyses
3.6.1 Extraction of genomic DNA
The 16S rRNA Gene Sequencing analysis was used to identify the isolated strains. The
DNA of each isolate was extracted using lysing buffer as given in methodology. Then
the extracted DNA was run through gel electrophoresis in order to confirm the presence
and size of DNA. Next, the DNA bands were observed under UV light and were
photographed using Dolphin gel documentation system (Wealtec, USA).
Figure 3.4 DNA bands of 1). MB490, 2). MB498, 3). MB497 and 4). MB504 in the
2nd, 3rd, 4th and 5th well respectively, along with DNA ladder in the 1st well.
3.6.2 PCR
The amplified PCR products were submitted to Macrogen for 16S rRNA sequence
based identification of MB490, MB497, MB498 and MB504.
3.6.3 Bacterial strain Identification
Selected isolates were sent for sequencing from Macrogen Inc., for characterization on
the basis of 16s rRNA analysis. Strains were identified as Pseudomonas kilonensis
MB490, Bacillus thuringiensis MB497, Pseudomonas kilonensis MB498 and
Pseudomonas sp MB504. Following 16s rRNA gene sequence accession numbers have
been assigned by NCBI to these four strains:
1 2 3 4 5
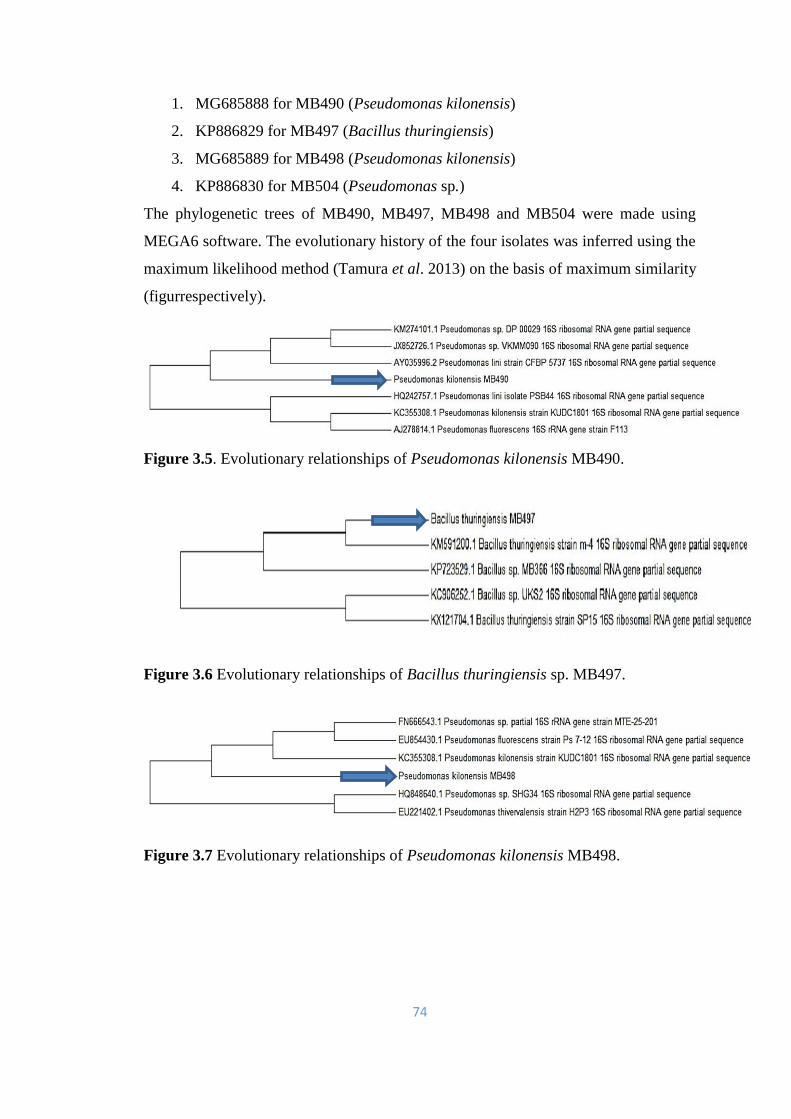
74
1. MG685888 for MB490 (Pseudomonas kilonensis)
2. KP886829 for MB497 (Bacillus thuringiensis)
3. MG685889 for MB498 (Pseudomonas kilonensis)
4. KP886830 for MB504 (Pseudomonas sp.)
The phylogenetic trees of MB490, MB497, MB498 and MB504 were made using
MEGA6 software. The evolutionary history of the four isolates was inferred using the
maximum likelihood method (Tamura et al. 2013) on the basis of maximum similarity
(figurrespectively).
Figure 3.5. Evolutionary relationships of Pseudomonas kilonensis MB490.
Figure 3.6 Evolutionary relationships of Bacillus thuringiensis sp. MB497.
Figure 3.7 Evolutionary relationships of Pseudomonas kilonensis MB498.
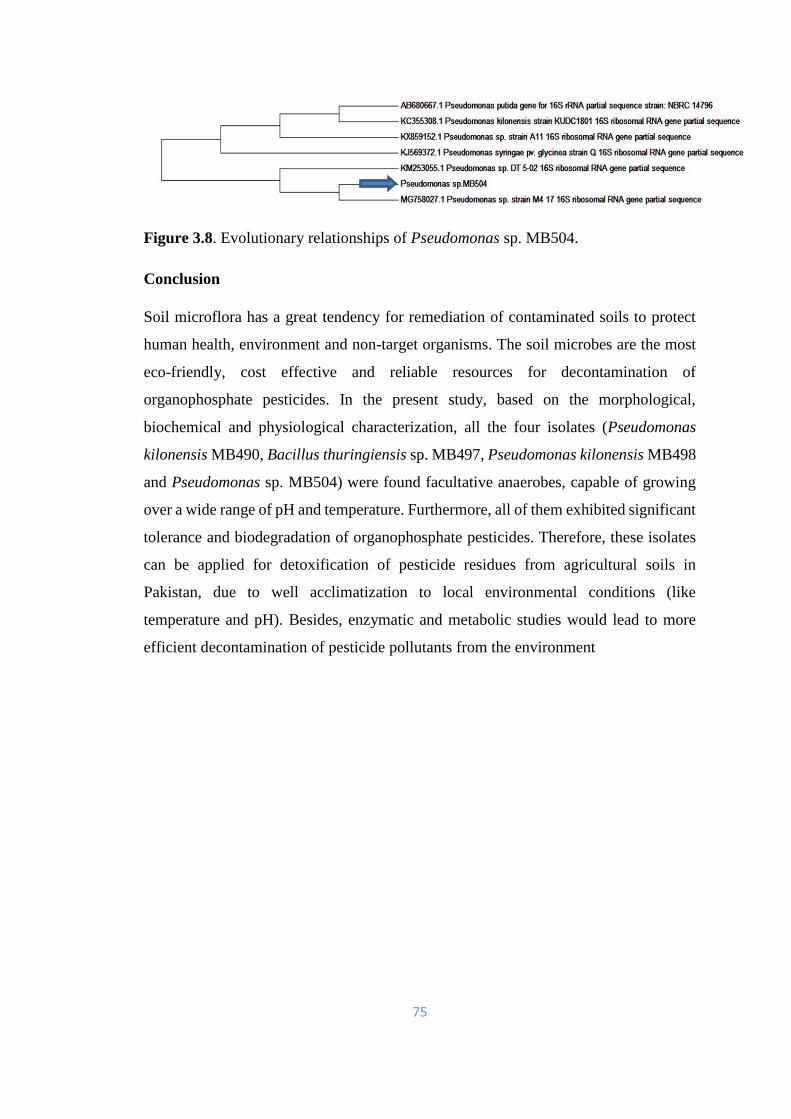
75
Figure 3.8. Evolutionary relationships of Pseudomonas sp. MB504.
Conclusion
Soil microflora has a great tendency for remediation of contaminated soils to protect
human health, environment and non-target organisms. The soil microbes are the most
eco-friendly, cost effective and reliable resources for decontamination of
organophosphate pesticides. In the present study, based on the morphological,
biochemical and physiological characterization, all the four isolates (Pseudomonas
kilonensis MB490, Bacillus thuringiensis sp. MB497, Pseudomonas kilonensis MB498
and Pseudomonas sp. MB504) were found facultative anaerobes, capable of growing
over a wide range of pH and temperature. Furthermore, all of them exhibited significant
tolerance and biodegradation of organophosphate pesticides. Therefore, these isolates
can be applied for detoxification of pesticide residues from agricultural soils in
Pakistan, due to well acclimatization to local environmental conditions (like
temperature and pH). Besides, enzymatic and metabolic studies would lead to more
efficient decontamination of pesticide pollutants from the environment
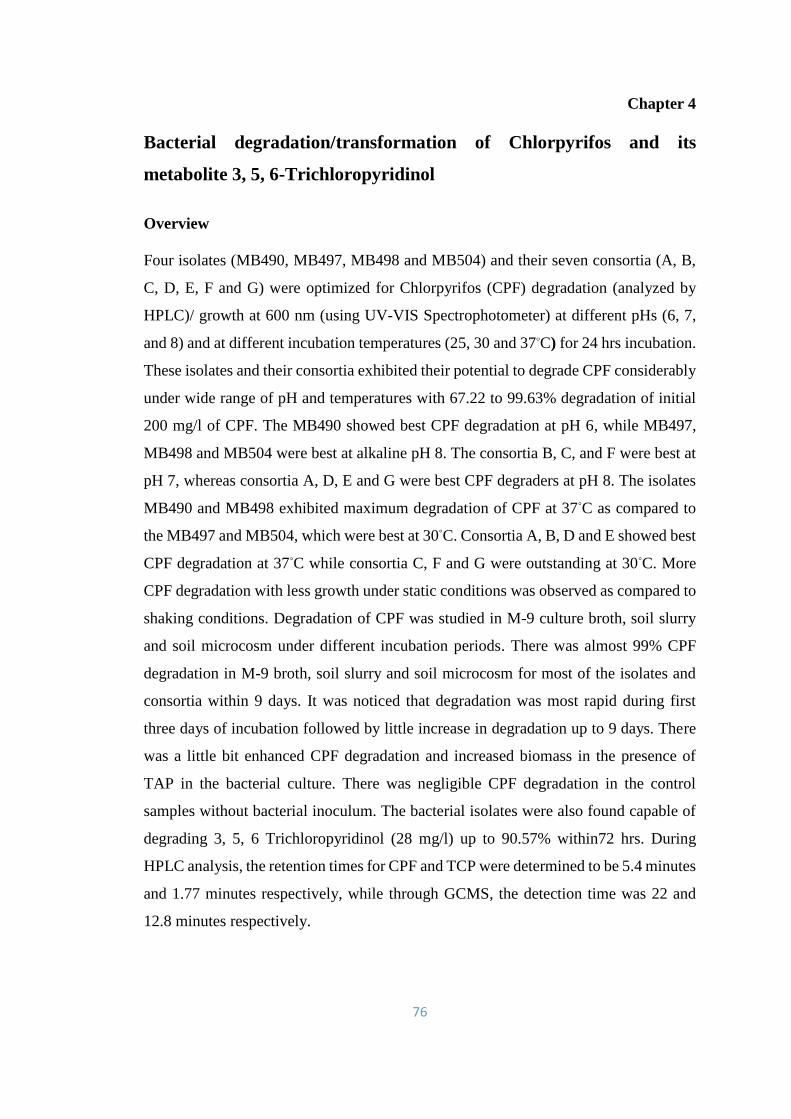
76
Chapter 4
Bacterial degradation/transformation of Chlorpyrifos and its
metabolite 3, 5, 6-Trichloropyridinol
Overview
Four isolates (MB490, MB497, MB498 and MB504) and their seven consortia (A, B,
C, D, E, F and G) were optimized for Chlorpyrifos (CPF) degradation (analyzed by
HPLC)/ growth at 600 nm (using UV-VIS Spectrophotometer) at different pHs (6, 7,
and 8) and at different incubation temperatures (25, 30 and 37◦C) for 24 hrs incubation.
These isolates and their consortia exhibited their potential to degrade CPF considerably
under wide range of pH and temperatures with 67.22 to 99.63% degradation of initial
200 mg/l of CPF. The MB490 showed best CPF degradation at pH 6, while MB497,
MB498 and MB504 were best at alkaline pH 8. The consortia B, C, and F were best at
pH 7, whereas consortia A, D, E and G were best CPF degraders at pH 8. The isolates
MB490 and MB498 exhibited maximum degradation of CPF at 37◦C as compared to
the MB497 and MB504, which were best at 30◦C. Consortia A, B, D and E showed best
CPF degradation at 37◦C while consortia C, F and G were outstanding at 30◦C. More
CPF degradation with less growth under static conditions was observed as compared to
shaking conditions. Degradation of CPF was studied in M-9 culture broth, soil slurry
and soil microcosm under different incubation periods. There was almost 99% CPF
degradation in M-9 broth, soil slurry and soil microcosm for most of the isolates and
consortia within 9 days. It was noticed that degradation was most rapid during first
three days of incubation followed by little increase in degradation up to 9 days. There
was a little bit enhanced CPF degradation and increased biomass in the presence of
TAP in the bacterial culture. There was negligible CPF degradation in the control
samples without bacterial inoculum. The bacterial isolates were also found capable of
degrading 3, 5, 6 Trichloropyridinol (28 mg/l) up to 90.57% within72 hrs. During
HPLC analysis, the retention times for CPF and TCP were determined to be 5.4 minutes
and 1.77 minutes respectively, while through GCMS, the detection time was 22 and
12.8 minutes respectively.
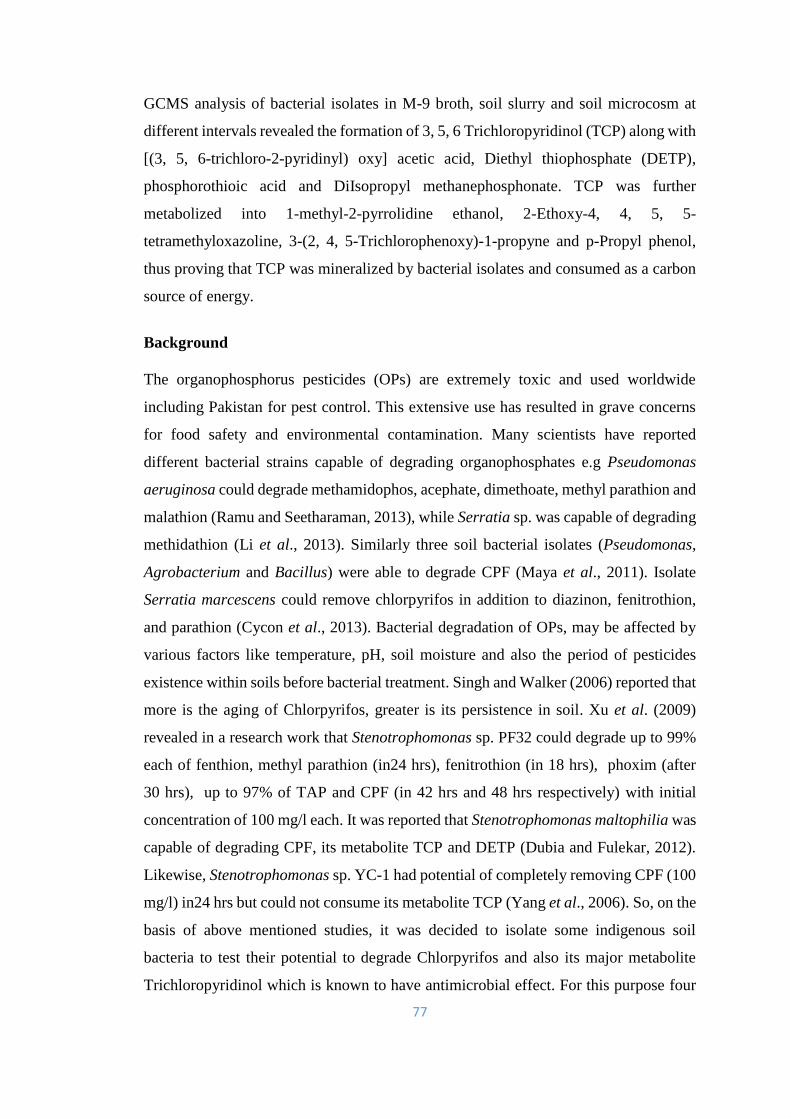
77
GCMS analysis of bacterial isolates in M-9 broth, soil slurry and soil microcosm at
different intervals revealed the formation of 3, 5, 6 Trichloropyridinol (TCP) along with
[(3, 5, 6-trichloro-2-pyridinyl) oxy] acetic acid, Diethyl thiophosphate (DETP),
phosphorothioic acid and DiIsopropyl methanephosphonate. TCP was further
metabolized into 1-methyl-2-pyrrolidine ethanol, 2-Ethoxy-4, 4, 5, 5-
tetramethyloxazoline, 3-(2, 4, 5-Trichlorophenoxy)-1-propyne and p-Propyl phenol,
thus proving that TCP was mineralized by bacterial isolates and consumed as a carbon
source of energy.
Background
The organophosphorus pesticides (OPs) are extremely toxic and used worldwide
including Pakistan for pest control. This extensive use has resulted in grave concerns
for food safety and environmental contamination. Many scientists have reported
different bacterial strains capable of degrading organophosphates e.g Pseudomonas
aeruginosa could degrade methamidophos, acephate, dimethoate, methyl parathion and
malathion (Ramu and Seetharaman, 2013), while Serratia sp. was capable of degrading
methidathion (Li et al., 2013). Similarly three soil bacterial isolates (Pseudomonas,
Agrobacterium and Bacillus) were able to degrade CPF (Maya et al., 2011). Isolate
Serratia marcescens could remove chlorpyrifos in addition to diazinon, fenitrothion,
and parathion (Cycon et al., 2013). Bacterial degradation of OPs, may be affected by
various factors like temperature, pH, soil moisture and also the period of pesticides
existence within soils before bacterial treatment. Singh and Walker (2006) reported that
more is the aging of Chlorpyrifos, greater is its persistence in soil. Xu et al. (2009)
revealed in a research work that Stenotrophomonas sp. PF32 could degrade up to 99%
each of fenthion, methyl parathion (in24 hrs), fenitrothion (in 18 hrs), phoxim (after
30 hrs), up to 97% of TAP and CPF (in 42 hrs and 48 hrs respectively) with initial
concentration of 100 mg/l each. It was reported that Stenotrophomonas maltophilia was
capable of degrading CPF, its metabolite TCP and DETP (Dubia and Fulekar, 2012).
Likewise, Stenotrophomonas sp. YC-1 had potential of completely removing CPF (100
mg/l) in24 hrs but could not consume its metabolite TCP (Yang et al., 2006). So, on the
basis of above mentioned studies, it was decided to isolate some indigenous soil
bacteria to test their potential to degrade Chlorpyrifos and also its major metabolite
Trichloropyridinol which is known to have antimicrobial effect. For this purpose four
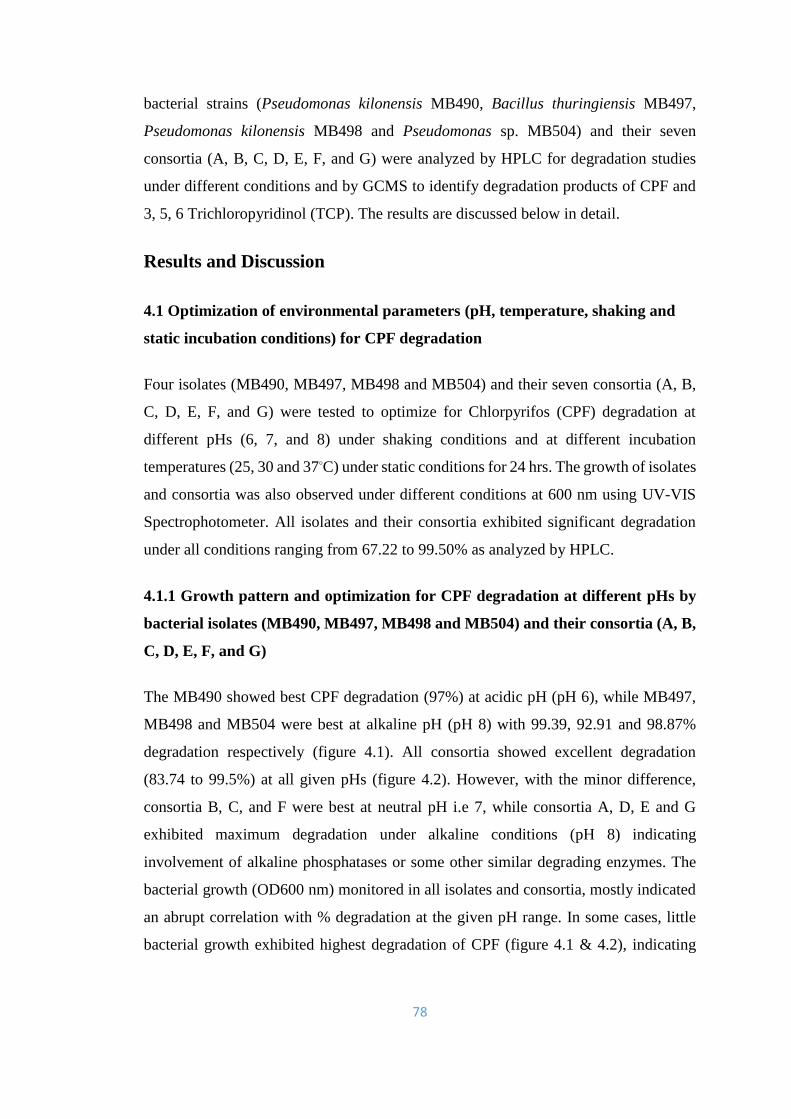
78
bacterial strains (Pseudomonas kilonensis MB490, Bacillus thuringiensis MB497,
Pseudomonas kilonensis MB498 and Pseudomonas sp. MB504) and their seven
consortia (A, B, C, D, E, F, and G) were analyzed by HPLC for degradation studies
under different conditions and by GCMS to identify degradation products of CPF and
3, 5, 6 Trichloropyridinol (TCP). The results are discussed below in detail.
Results and Discussion
4.1 Optimization of environmental parameters (pH, temperature, shaking and
static incubation conditions) for CPF degradation
Four isolates (MB490, MB497, MB498 and MB504) and their seven consortia (A, B,
C, D, E, F, and G) were tested to optimize for Chlorpyrifos (CPF) degradation at
different pHs (6, 7, and 8) under shaking conditions and at different incubation
temperatures (25, 30 and 37◦C) under static conditions for 24 hrs. The growth of isolates
and consortia was also observed under different conditions at 600 nm using UV-VIS
Spectrophotometer. All isolates and their consortia exhibited significant degradation
under all conditions ranging from 67.22 to 99.50% as analyzed by HPLC.
4.1.1 Growth pattern and optimization for CPF degradation at different pHs by
bacterial isolates (MB490, MB497, MB498 and MB504) and their consortia (A, B,
C, D, E, F, and G)
The MB490 showed best CPF degradation (97%) at acidic pH (pH 6), while MB497,
MB498 and MB504 were best at alkaline pH (pH 8) with 99.39, 92.91 and 98.87%
degradation respectively (figure 4.1). All consortia showed excellent degradation
(83.74 to 99.5%) at all given pHs (figure 4.2). However, with the minor difference,
consortia B, C, and F were best at neutral pH i.e 7, while consortia A, D, E and G
exhibited maximum degradation under alkaline conditions (pH 8) indicating
involvement of alkaline phosphatases or some other similar degrading enzymes. The
bacterial growth (OD600 nm) monitored in all isolates and consortia, mostly indicated
an abrupt correlation with % degradation at the given pH range. In some cases, little
bacterial growth exhibited highest degradation of CPF (figure 4.1 & 4.2), indicating
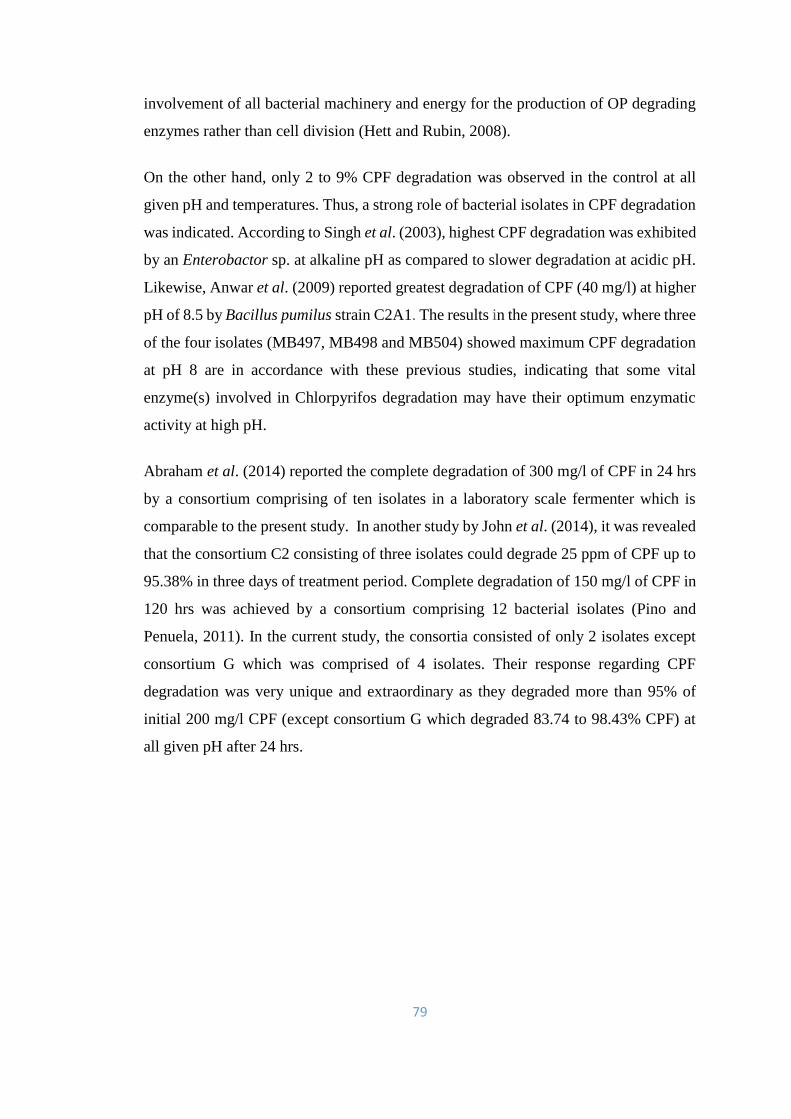
79
involvement of all bacterial machinery and energy for the production of OP degrading
enzymes rather than cell division (Hett and Rubin, 2008).
On the other hand, only 2 to 9% CPF degradation was observed in the control at all
given pH and temperatures. Thus, a strong role of bacterial isolates in CPF degradation
was indicated. According to Singh et al. (2003), highest CPF degradation was exhibited
by an Enterobactor sp. at alkaline pH as compared to slower degradation at acidic pH.
Likewise, Anwar et al. (2009) reported greatest degradation of CPF (40 mg/l) at higher
pH of 8.5 by Bacillus pumilus strain C2A1. The results in the present study, where three
of the four isolates (MB497, MB498 and MB504) showed maximum CPF degradation
at pH 8 are in accordance with these previous studies, indicating that some vital
enzyme(s) involved in Chlorpyrifos degradation may have their optimum enzymatic
activity at high pH.
Abraham et al. (2014) reported the complete degradation of 300 mg/l of CPF in 24 hrs
by a consortium comprising of ten isolates in a laboratory scale fermenter which is
comparable to the present study. In another study by John et al. (2014), it was revealed
that the consortium C2 consisting of three isolates could degrade 25 ppm of CPF up to
95.38% in three days of treatment period. Complete degradation of 150 mg/l of CPF in
120 hrs was achieved by a consortium comprising 12 bacterial isolates (Pino and
Penuela, 2011). In the current study, the consortia consisted of only 2 isolates except
consortium G which was comprised of 4 isolates. Their response regarding CPF
degradation was very unique and extraordinary as they degraded more than 95% of
initial 200 mg/l CPF (except consortium G which degraded 83.74 to 98.43% CPF) at
all given pH after 24 hrs.
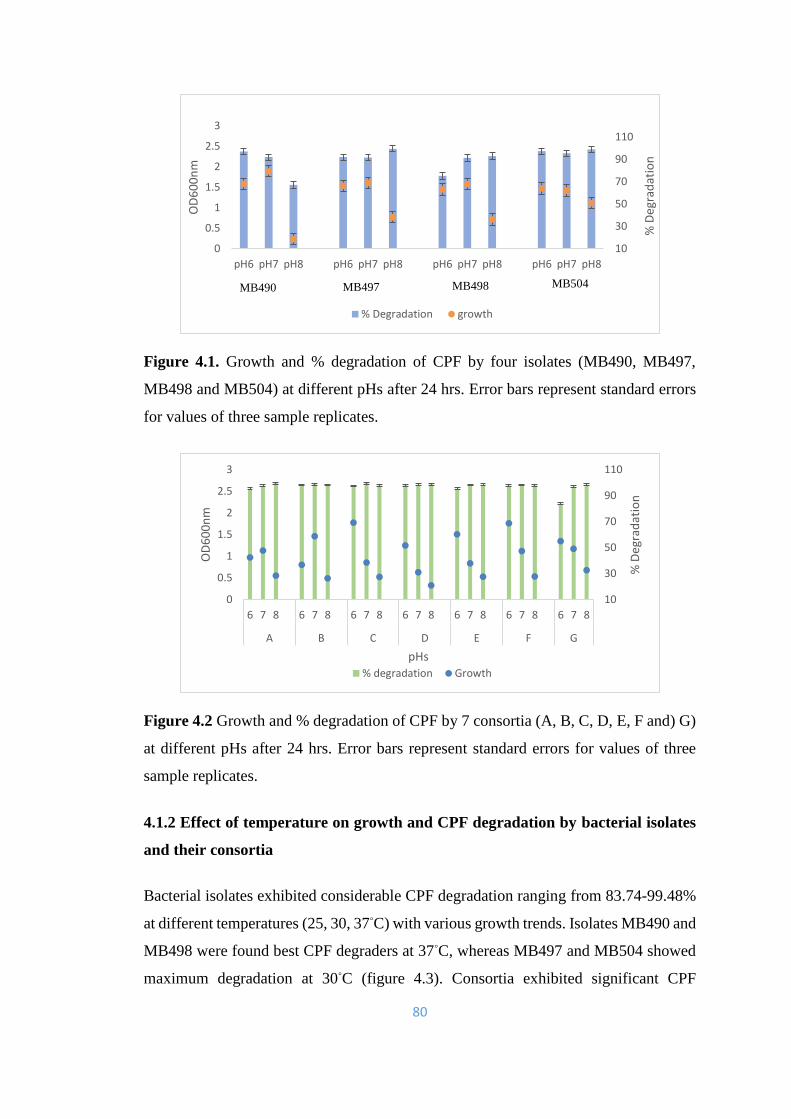
80
Figure 4.1. Growth and % degradation of CPF by four isolates (MB490, MB497,
MB498 and MB504) at different pHs after 24 hrs. Error bars represent standard errors
for values of three sample replicates.
Figure 4.2 Growth and % degradation of CPF by 7 consortia (A, B, C, D, E, F and) G)
at different pHs after 24 hrs. Error bars represent standard errors for values of three
sample replicates.
4.1.2 Effect of temperature on growth and CPF degradation by bacterial isolates
and their consortia
Bacterial isolates exhibited considerable CPF degradation ranging from 83.74-99.48%
at different temperatures (25, 30, 37◦C) with various growth trends. Isolates MB490 and
MB498 were found best CPF degraders at 37◦C, whereas MB497 and MB504 showed
maximum degradation at 30◦C (figure 4.3). Consortia exhibited significant CPF
10
30
50
70
90
110
0
0.5
1
1.5
2
2.5
3
pH6 pH7 pH8 pH6 pH7 pH8 pH6 pH7 pH8 pH6 pH7 pH8
% D
egra
dat
ion
OD
60
0n
m
% Degradation growth
MB490 MB497 MB498 MB504
10
30
50
70
90
110
0
0.5
1
1.5
2
2.5
3
6 7 8 6 7 8 6 7 8 6 7 8 6 7 8 6 7 8 6 7 8
A B C D E F G%
Deg
rad
atio
n
OD
60
0n
m
pHs% degradation Growth
81
degradation (90.88 to 99.63%) at different temperatures with optimum growth.
Consortia A, B, D and E showed best CPF degradation at 37◦C while consortia C, F and
G were outstanding at 30◦C (figure 4.4). In case of control, only 3. 6 and 9% CPF
degradation was observed at 25, 30, 37◦C respectively thus confirming the role of
bacterial isolates in pesticide degradation. According to Vijayalakshmi and Usha
(2012), strain Pseudomonas putida was able to achieve maximum (76%) degradation
of given 2% CPF at pH 7 and at 35°C. Singh et al. (2004) isolated Enterobacter sp.
from Australian soil that degraded Chlorpyrifos most rapidly at temperature 35°C. It
was reported that the isolated strains (Agrobacterium and Enterobacter spp.,
Pseudomonas spp. and Bacillus cereus) degraded Chlorpyrifos most efficiently at
optimal temperature of 30°C and pH 7 (Chishti and Arshad, 2012; Awad et al., 2011;
Liu, et al., 2012). Consortium C5 was able to degrade up to 90.02% CPF (125 ppm) at
optimum 30 ºC and pH 7 after 8 days of incubation (John et al., 2016).
Figure 4.3 Effect of temperature on growth and degradation of CPF by four isolates
(MB490, MB497, MB498 and MB504) after 24 hrs. Error bars represent standard errors
for values of three sample replicates.
10
30
50
70
90
110
0
0.5
1
1.5
2
25
°C
30
°C
37
°C
25
°C
30
°C
37
°C
25
°C
30
°C
37
°C
25
°C
30
°C
37
°C
MB 490 MB497 MB498 MB504%
Deg
rad
atio
n
OD
60
0n
m
Temperatures% Degradation growth

82
Figure 4.4 Effect of temperature on growth and degradation of CPF by 7 consortia
(A, B, C, D, E, F and) G) after 24 hrs. Error bars represent standard errors for values
of three sample replicates.
4.1.3 Effect of shaking versus static conditions on growth and CPF degradation by
four isolates (MB490, MB497, MB498 and MB504) and seven consortia (A, B, C,
D, E, F, and G) after 24 hrs of incubation
There was significant variation in biodegradation of CPF and growth of bacterial
isolates under shaking (aerobic) and static culture conditions after 24 hrs of incubation.
Generally there was little bit more CPF degradation by the bacterial isolates (96 to
99.36%) and their consortia (98.05 to 99.63%) but less growth under static than shaking
conditions, though more than 90% CPF degradation was noted under both conditions
(figures 4.5 & 4.6). These results are partly in contrast to Chishti and Arshad, (2012),
who revealed greater degradation of Chlorpyrifos (87−92%) under shaking/aeration
conditions, by four isolated strains after 18 days as compared to lesser 50−56%
degradation under static condition. However, according to them, strain SWLC2
exhibited highest degradation of Chlorpyrifos under shaking incubation which is in
accordance with present study. Similar to present study, they observed more bacterial
growth and higher abiotic degradation under shaking than under static conditions.
Pseudomonas putida was reported to have lesser degradation efficiency at higher speed
of shaking condition which was explained to be due to less contact between the
pesticide and the culture (Vijayalakshmi and Usha, 2012).
10
30
50
70
90
110
0
0.5
1
1.5
2
2.5
25
°C3
0°C
37
°C
25
°C3
0°C
37
°C
25
°C3
0°C
37
°C
25
°C3
0°C
37
°C
25
°C3
0°C
37
°C
25
°C3
0°C
37
°C
25
°C3
0°C
37
°C
A B C D E F G
% D
egra
dat
ion
OD
60
0n
m
Temperatures
% degradation Growth
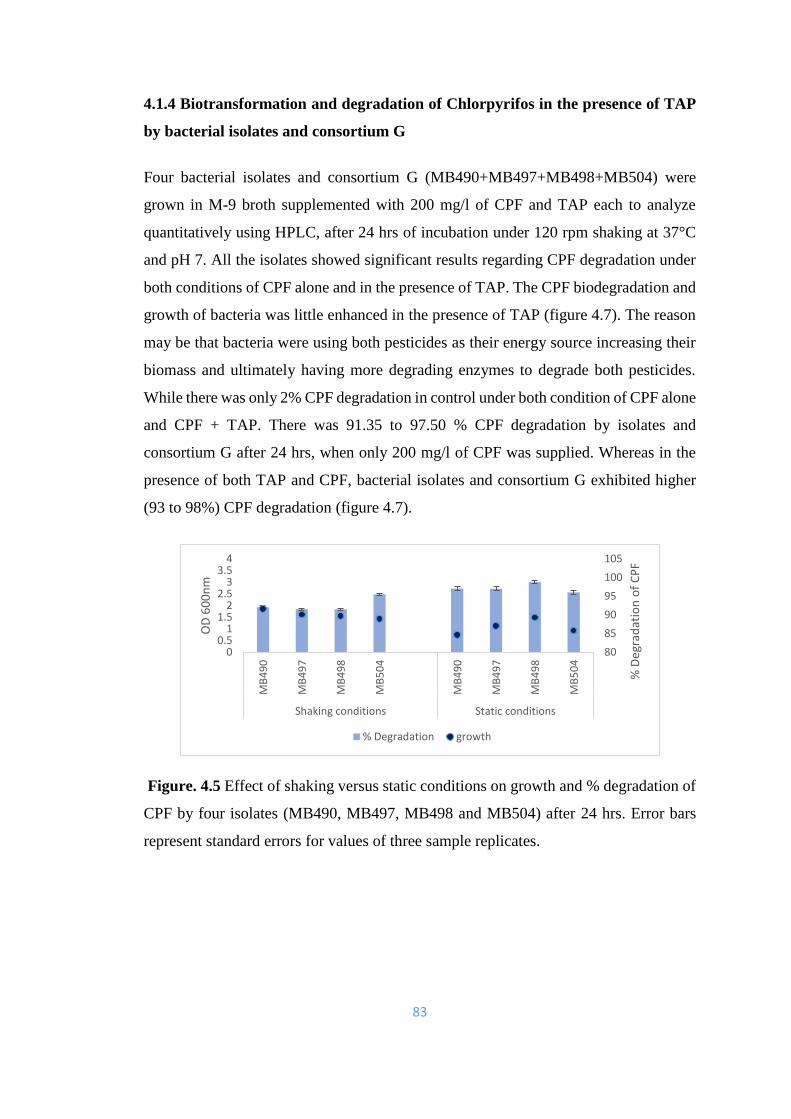
83
4.1.4 Biotransformation and degradation of Chlorpyrifos in the presence of TAP
by bacterial isolates and consortium G
Four bacterial isolates and consortium G (MB490+MB497+MB498+MB504) were
grown in M-9 broth supplemented with 200 mg/l of CPF and TAP each to analyze
quantitatively using HPLC, after 24 hrs of incubation under 120 rpm shaking at 37°C
and pH 7. All the isolates showed significant results regarding CPF degradation under
both conditions of CPF alone and in the presence of TAP. The CPF biodegradation and
growth of bacteria was little enhanced in the presence of TAP (figure 4.7). The reason
may be that bacteria were using both pesticides as their energy source increasing their
biomass and ultimately having more degrading enzymes to degrade both pesticides.
While there was only 2% CPF degradation in control under both condition of CPF alone
and CPF + TAP. There was 91.35 to 97.50 % CPF degradation by isolates and
consortium G after 24 hrs, when only 200 mg/l of CPF was supplied. Whereas in the
presence of both TAP and CPF, bacterial isolates and consortium G exhibited higher
(93 to 98%) CPF degradation (figure 4.7).
Figure. 4.5 Effect of shaking versus static conditions on growth and % degradation of
CPF by four isolates (MB490, MB497, MB498 and MB504) after 24 hrs. Error bars
represent standard errors for values of three sample replicates.
80
85
90
95
100
105
00.5
11.5
22.5
33.5
4
MB
49
0
MB
49
7
MB
49
8
MB
50
4
MB
49
0
MB
49
7
MB
49
8
MB
50
4
Shaking conditions Static conditions
% D
egra
dat
ion
of
CP
F
OD
60
0n
m
% Degradation growth

84
Figure 4.6 Effect of shaking versus static conditions on growth and % degradation of
CPF by 7 consortia (A, B, C, D, E, F and G) after 24 hrs. Error bars represent standard
errors for values of three sample replicates.
Figure 4.7 Effect of presence of TAP on the degradation of Chlorpyrifos (CPF) and
growth (OD) by the 4 isolates (MB490, MB497, MB498 and MB504) along with the
consortium G (mixture of all four bacterial isolates) in M-9 broth after 24 hrs incubation
(initial concentration of CPF and TAP used = 200 mg/l). Error bars represent standard
errors for values of three sample replicates.
There are other reports regarding degradation of mixtures of pesticides. Fuentes et al.
(2013) studied the degradation of mixture of CPF and Pentachlorophenol (PCP) by the
combined cultures and revealed that two immobilized consortia, first composed of 2
species of Streptomyces (AC5-AC7) and second consisting of six Streptomyces strains
80
85
90
95
100
105
0
0.5
1
1.5
2
2.5
3
3.5
4
A B C D E F G A B C D E F G
Shaking Conditions Static Conditions
% D
egra
dat
ion
of
CP
F
OD
60
0n
m
% Degradation Growth
80
85
90
95
100
0
0.5
1
1.5
2
2.5
3
3.5
4
MB490 MB497 MB498 MB504 Consortium G%
CP
F d
egra
dat
ion
OD
60
0n
m
% degradation of CPF alone % CPF degradation in presence of TAP
OD of isolates in presence of CPF alone OD of isolates in presence of CPF + TAP
85
(A2-A5-A11-M7-AC5-AC7) could degrade up to 48.64 and 42.90%, of 1.66 mg/l of
CPF and PCP respectively. Yanez-Ocampo et al. (2009) studied the consumption of 25
mg/l each of methyl-parathion (MP) and tetrachlorvinphos (TCF), by a bacterial co-
culture immobilized in three different ways (suspended, alginate immobilized and
tezontle-immobilized) and found 41, 72 and 66% removal for MP and 53, 65 and 47%
for TCF in three types of cultures respectively. A consortium consisting of many
bacterial species could degrade methyl parathion up to 72% and CPF up to 39% in a
combination of both pesticides with 150 mg/l each in 120 hrs, though it had completely
consumed each pesticide when used separately (Pino and Pinuela, 2011). The present
study is different and unique in the sense that both CPF and TAP in a mixture were
degraded independently to each other with very astonishing results, rather TAP
showing little enhancing effect on CPF degradation possibly due to fortification of
degrading microbial population.
4.2 Degradation of Chlorpyrifos by the bacterial isolates and their consortia in M-
9 broth
When bacterial isolates and their consortia (A, B, C, D, E, F and G) were grown in M-
9 broth supplemented with 200 mg/l of CPF and analyzed quantitatively using HPLC,
after 1, 3, 6 and 9 days of incubation, they all showed very good results regarding CPF
degradation and bacterial growth monitored by UV-VIS spectrophotometer (BMS UV-
160). Strains MB490, MB497, MB498 and MB504 consumed up to 99.90% of the
spiked CPF (200 mg/l) reaching maximum after 9 days of incubation (figure 4.8). These
results are very unique and excellent as compared to those reported by other researchers
especially with respect to time period required to achieve maximum degradation.
Chishti and Arshad (2012) reported 86, 81 and 89% degradation of Chlorpyrifos (100
mg/l) by the strains SGB2, SWLC1 and SWLH2 in 18 days, respectively. The bacterial
strain Pseudomonas WW5 was reported to degrade 94% of supplied CPF (400 mg/l) in
18 days (Farhan et al., 2012). Similarly two isolated strains of Streptomyces AC5 and
AC7 could degrade 90% of only 50 mg/l CPF after 24 hrs incubation (Briceno et al.,
2012). Feng et al. (2017) revealed more than 90% degradation of initial 20 mg/l CPF
in 12 days by a plant-derived bacterium Sphingomonas sp. Akbar and Sultan (2016)
reported 84.4 and 78.6% degradation of initial 100mg/l CPF in 10 days by the two
86
isolates. Hamsavathani et al. (2017) reported 30.78 to 82.06% CPF degradation of 0.5%
initial amount in 2 weeks by the 3 isolates. In the current study, CPF degradation rate
was most rapid during initial 3 days due to log phase of bacteria in accordance with the
previous reports (Hossain et al., 2015; Ishag et al., 2016).
Consortia A, B, C, D, E, F and G showed maximum (>99 %) CPF degradation from
day 3 to 9 as no significant increase was noticed. After 9 days, minimum (99.61%) CPF
degradation was exhibited by consortium A and maximum (99.95%) degradation by
consortium E was observed (figure 4.9). On contrary, much less degradation was
observed in the control with only 2, 3, 5 and 7% CPF degradation after 1, 3, 6 and 9
days of incubation respectively. Recently bioremediation research have been focused
more on using microbial consortia as they were considered to be more effective than
single culture methods due to their synergistic effects. So, it is obvious that ability of
consortia to metabolize CPF to use it as a nutrient for their growth, is a growth linked
process. Earlier, Singh et al. (2003) as well as Chishti and Arshad (2012) had reported
growth linked degradation of CPF by bacterial isolates but in the current study, the CPF
degradation efficiency of the respective consortia is extraordinary and excellent as
compared to previous studies. Despite, there are many reports of isolation of many
Chlorpyrifos degrading microorganisms from various polluted sources, yet there are
very few reports on consortial biodegradation of Chlorpyrifos (Fulekar and Geetha,
2008; Pino and Penuela, 2011; Sasikala et al., 2012). Sasikala et al. (2012) reported
70% degradation of 200 mg/l CPF by a bacterial co-culture composed of three bacterial
strains after 30 days of incubation. A consortium consisting of multiple microorganisms
could consume 150 mg/l of Chlorpyrifos in 120 hrs (Pino and Pinuela, 2011). The
consortium C5 consisting of 3 species could degrade up to 90% of 125 ppm
Chlorpyrifos within 8 days (John et al., 2016). Therefore, all the consortia in the current
study have best potential to remove Chlorpyrifos from contaminated sites and are most
suitable to be used for
Ivashina (1986) studied chlorpyrifos degradation by co-culture of Trichoderma sp. and
Bacillus sp. Shaker et al. (1988) reported 72-83% CPF degradation after 96 hrs by two
lactic acid bacterial strains. Chishti and Arshad (2012) studied the growth linked
biodegradation of chlorpyrifos by mixed culture (Agrobacterium and Enterobacter sp).
A co-culture consisting of a bacterium and a fungus could mineralize given CPF (100
87
mg/l) completely in 24 hrs (Xu et al., 2007). Likewise, Yang et al. (2005) revealed 40%
degradation of CPF (100 mg/l) within two days of incubation by an isolated bacterium.
Strain Paracoccus sp. demonstrated complete mineralization of CPF (50 mg/l) within
4 days (Xu et al., 2008). It was reported that a variety of bacterial isolates (Bacillus
subtilis, Bacillus cereus, Klebsiella, Brucella melitensis species, Pseudomonas sp.)
could degrade 46-72% of CPF in a culture broth within 20 days (Lakshmi et al., 2008).
Similarly, Ajaz et al. (2012) stated that Pseudomonas putida MAS-1 exhibited about
95% degradation of 200 mg/l CPF in 3 days in minimal medium.
In preset study, the isolates showed rapid degradation in minimal medium without
glucose because they have no other option of carbon source, thus these isolates had to
depend upon the Chlorpyrifos for their carbon and energy needs. Maximum growth
activity for all isolates and their consortia was noticed after first three days of incubation
which was followed by little decrease up to 9th day indicating either toxicity of
metabolites formed during CPF degradation thus killing the bacterial population or
scarcity of carbon source as almost all the CPF have been degraded (figure 4.8 and 4.9).
Moreover, the less availability of dissolved oxygen (DO), may be another reason for
lagging phase as increase in the organic load might result in the decreased DO
concentration (Corbitt, 1998). Moreover, the bacterial cells present in log phase during
rapid biodegradation achieved within initial three days also indicated that substrate
transformation would be at its maximum (Gray, 1989; Jilani, 2013). These results
indicated a strong association between bacterial growth activity and degradation
processes of CPF just like that reported by Chishti and Arshad (2012).
In the present study, 200 mg/l of CPF was almost completely mineralized in maximum
9 days, which indicated the incredible potential of 4 bacterial isolates and their consortia
to degrade and mineralize CPF and utilize resulting carbon and phosphorus for their
energy source. So, these isolates and their consortia may be considered as best
candidates to be applied for bioremediation of CPF contaminated places. Moreover,
these studies also revealed that these strains may have alkaline Phosphatase activity as
this enzyme is a phosphomonoestrase playing a very vital role in the CPF degradation
metabolism by hydrolysis of O-P bonds to give off phosphorus along with ethanol
which can be assimilated by bacteria (Singh and Walker, 2006).
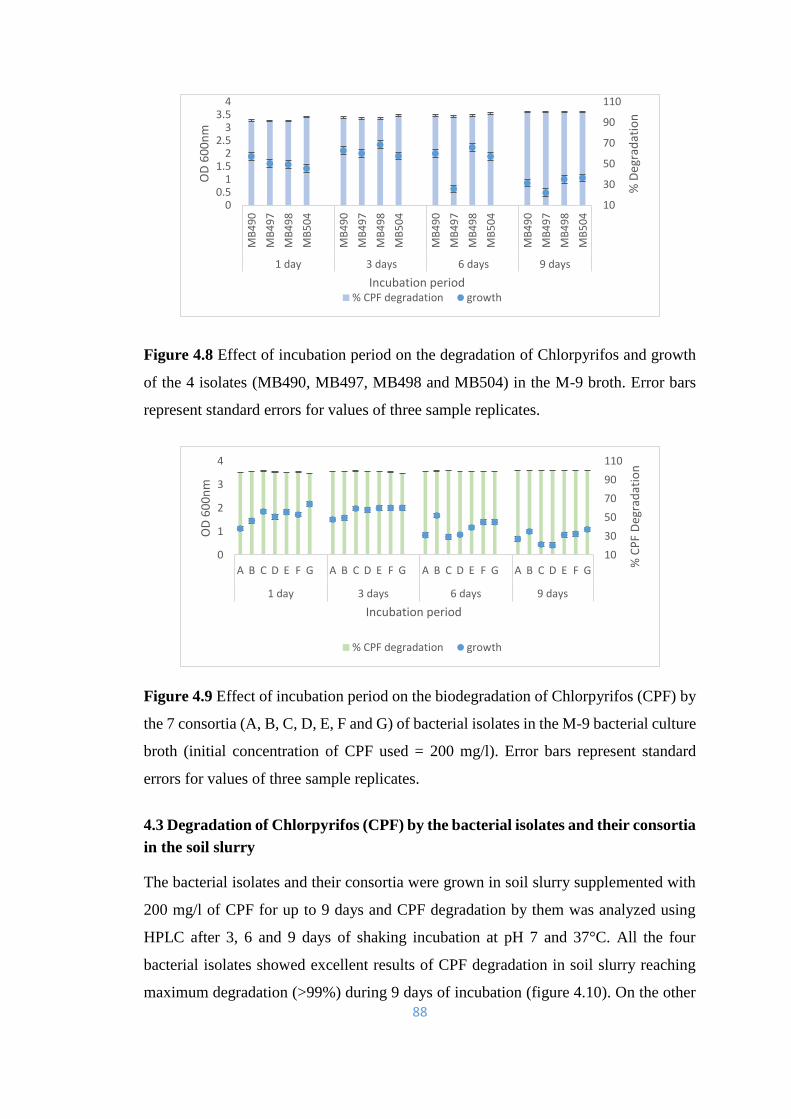
88
Figure 4.8 Effect of incubation period on the degradation of Chlorpyrifos and growth
of the 4 isolates (MB490, MB497, MB498 and MB504) in the M-9 broth. Error bars
represent standard errors for values of three sample replicates.
Figure 4.9 Effect of incubation period on the biodegradation of Chlorpyrifos (CPF) by
the 7 consortia (A, B, C, D, E, F and G) of bacterial isolates in the M-9 bacterial culture
broth (initial concentration of CPF used = 200 mg/l). Error bars represent standard
errors for values of three sample replicates.
4.3 Degradation of Chlorpyrifos (CPF) by the bacterial isolates and their consortia
in the soil slurry
The bacterial isolates and their consortia were grown in soil slurry supplemented with
200 mg/l of CPF for up to 9 days and CPF degradation by them was analyzed using
HPLC after 3, 6 and 9 days of shaking incubation at pH 7 and 37°C. All the four
bacterial isolates showed excellent results of CPF degradation in soil slurry reaching
maximum degradation (>99%) during 9 days of incubation (figure 4.10). On the other
10
30
50
70
90
110
00.5
11.5
22.5
33.5
4
MB
49
0
MB
49
7
MB
49
8
MB
50
4
MB
49
0
MB
49
7
MB
49
8
MB
50
4
MB
49
0
MB
49
7
MB
49
8
MB
50
4
MB
49
0
MB
49
7
MB
49
8
MB
50
4
1 day 3 days 6 days 9 days
% D
egra
dat
ion
OD
60
0n
m
Incubation period% CPF degradation growth
10
30
50
70
90
110
0
1
2
3
4
A B C D E F G A B C D E F G A B C D E F G A B C D E F G
1 day 3 days 6 days 9 days
% C
PF
Deg
rad
atio
n
OD
60
0n
m
Incubation period
% CPF degradation growth
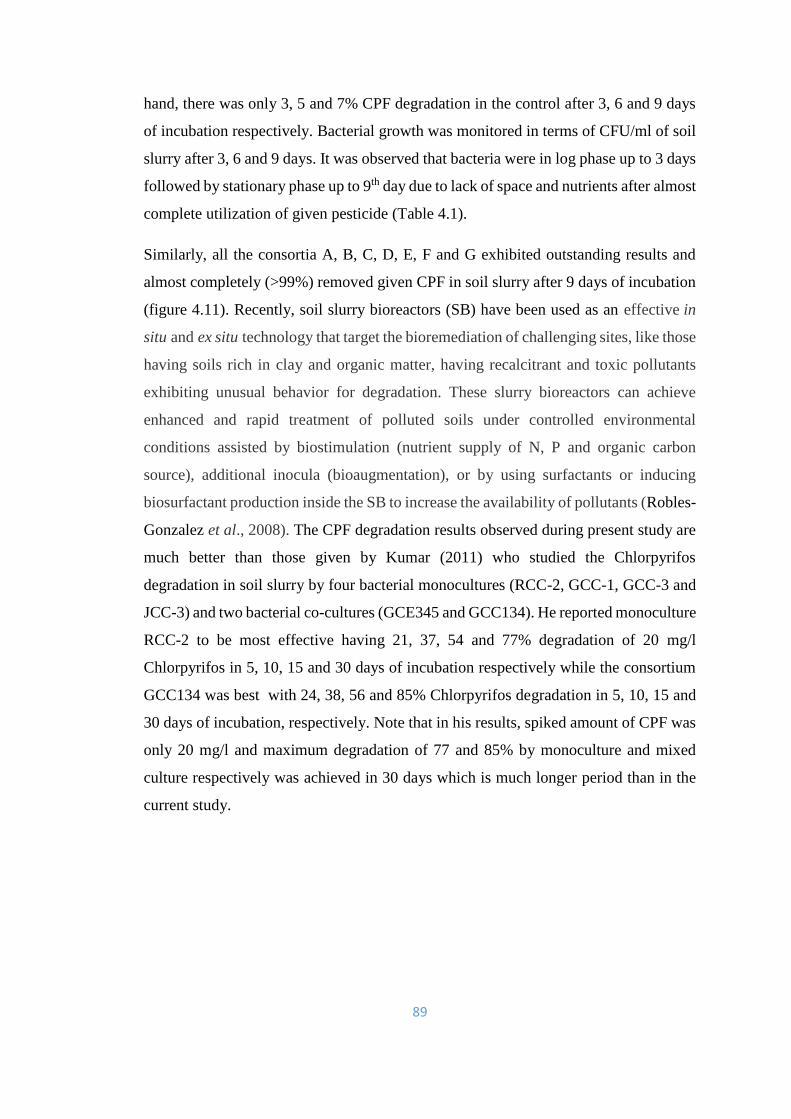
89
hand, there was only 3, 5 and 7% CPF degradation in the control after 3, 6 and 9 days
of incubation respectively. Bacterial growth was monitored in terms of CFU/ml of soil
slurry after 3, 6 and 9 days. It was observed that bacteria were in log phase up to 3 days
followed by stationary phase up to 9th day due to lack of space and nutrients after almost
complete utilization of given pesticide (Table 4.1).
Similarly, all the consortia A, B, C, D, E, F and G exhibited outstanding results and
almost completely (>99%) removed given CPF in soil slurry after 9 days of incubation
(figure 4.11). Recently, soil slurry bioreactors (SB) have been used as an effective in
situ and ex situ technology that target the bioremediation of challenging sites, like those
having soils rich in clay and organic matter, having recalcitrant and toxic pollutants
exhibiting unusual behavior for degradation. These slurry bioreactors can achieve
enhanced and rapid treatment of polluted soils under controlled environmental
conditions assisted by biostimulation (nutrient supply of N, P and organic carbon
source), additional inocula (bioaugmentation), or by using surfactants or inducing
biosurfactant production inside the SB to increase the availability of pollutants (Robles-
Gonzalez et al., 2008). The CPF degradation results observed during present study are
much better than those given by Kumar (2011) who studied the Chlorpyrifos
degradation in soil slurry by four bacterial monocultures (RCC-2, GCC-1, GCC-3 and
JCC-3) and two bacterial co-cultures (GCE345 and GCC134). He reported monoculture
RCC-2 to be most effective having 21, 37, 54 and 77% degradation of 20 mg/l
Chlorpyrifos in 5, 10, 15 and 30 days of incubation respectively while the consortium
GCC134 was best with 24, 38, 56 and 85% Chlorpyrifos degradation in 5, 10, 15 and
30 days of incubation, respectively. Note that in his results, spiked amount of CPF was
only 20 mg/l and maximum degradation of 77 and 85% by monoculture and mixed
culture respectively was achieved in 30 days which is much longer period than in the
current study.
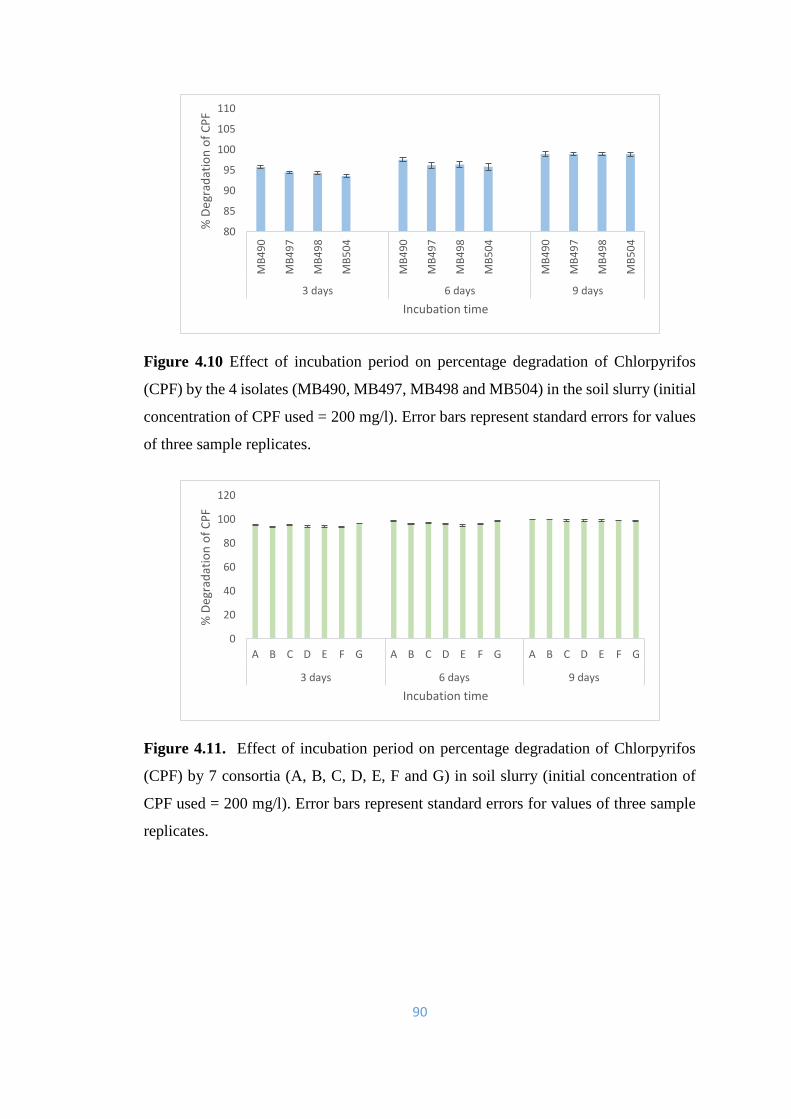
90
Figure 4.10 Effect of incubation period on percentage degradation of Chlorpyrifos
(CPF) by the 4 isolates (MB490, MB497, MB498 and MB504) in the soil slurry (initial
concentration of CPF used = 200 mg/l). Error bars represent standard errors for values
of three sample replicates.
Figure 4.11. Effect of incubation period on percentage degradation of Chlorpyrifos
(CPF) by 7 consortia (A, B, C, D, E, F and G) in soil slurry (initial concentration of
CPF used = 200 mg/l). Error bars represent standard errors for values of three sample
replicates.
80
85
90
95
100
105
110
MB
49
0
MB
49
7
MB
49
8
MB
50
4
MB
49
0
MB
49
7
MB
49
8
MB
50
4
MB
49
0
MB
49
7
MB
49
8
MB
50
4
3 days 6 days 9 days
% D
egra
dat
ion
of
CP
F
Incubation time
0
20
40
60
80
100
120
A B C D E F G A B C D E F G A B C D E F G
3 days 6 days 9 days
% D
egra
dat
ion
of
CP
F
Incubation time
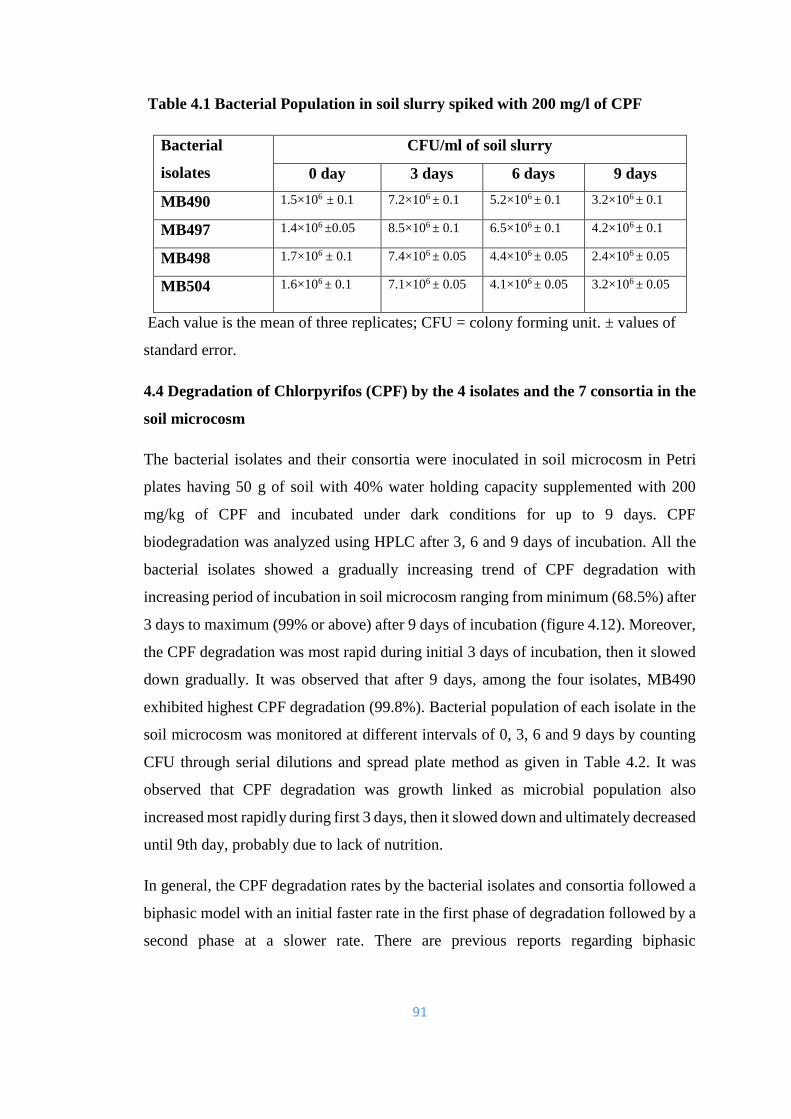
91
Table 4.1 Bacterial Population in soil slurry spiked with 200 mg/l of CPF
Bacterial
isolates
CFU/ml of soil slurry
0 day 3 days 6 days 9 days
MB490 1.5×10⁶ ± 0.1 7.2×10⁶ ± 0.1 5.2×10⁶ ± 0.1 3.2×10⁶ ± 0.1
MB497 1.4×10⁶ ±0.05 8.5×10⁶ ± 0.1 6.5×10⁶ ± 0.1 4.2×10⁶ ± 0.1
MB498 1.7×10⁶ ± 0.1 7.4×10⁶ ± 0.05 4.4×10⁶ ± 0.05 2.4×10⁶ ± 0.05
MB504 1.6×10⁶ ± 0.1 7.1×10⁶ ± 0.05 4.1×10⁶ ± 0.05 3.2×10⁶ ± 0.05
Each value is the mean of three replicates; CFU = colony forming unit. ± values of
standard error.
4.4 Degradation of Chlorpyrifos (CPF) by the 4 isolates and the 7 consortia in the
soil microcosm
The bacterial isolates and their consortia were inoculated in soil microcosm in Petri
plates having 50 g of soil with 40% water holding capacity supplemented with 200
mg/kg of CPF and incubated under dark conditions for up to 9 days. CPF
biodegradation was analyzed using HPLC after 3, 6 and 9 days of incubation. All the
bacterial isolates showed a gradually increasing trend of CPF degradation with
increasing period of incubation in soil microcosm ranging from minimum (68.5%) after
3 days to maximum (99% or above) after 9 days of incubation (figure 4.12). Moreover,
the CPF degradation was most rapid during initial 3 days of incubation, then it slowed
down gradually. It was observed that after 9 days, among the four isolates, MB490
exhibited highest CPF degradation (99.8%). Bacterial population of each isolate in the
soil microcosm was monitored at different intervals of 0, 3, 6 and 9 days by counting
CFU through serial dilutions and spread plate method as given in Table 4.2. It was
observed that CPF degradation was growth linked as microbial population also
increased most rapidly during first 3 days, then it slowed down and ultimately decreased
until 9th day, probably due to lack of nutrition.
In general, the CPF degradation rates by the bacterial isolates and consortia followed a
biphasic model with an initial faster rate in the first phase of degradation followed by a
second phase at a slower rate. There are previous reports regarding biphasic
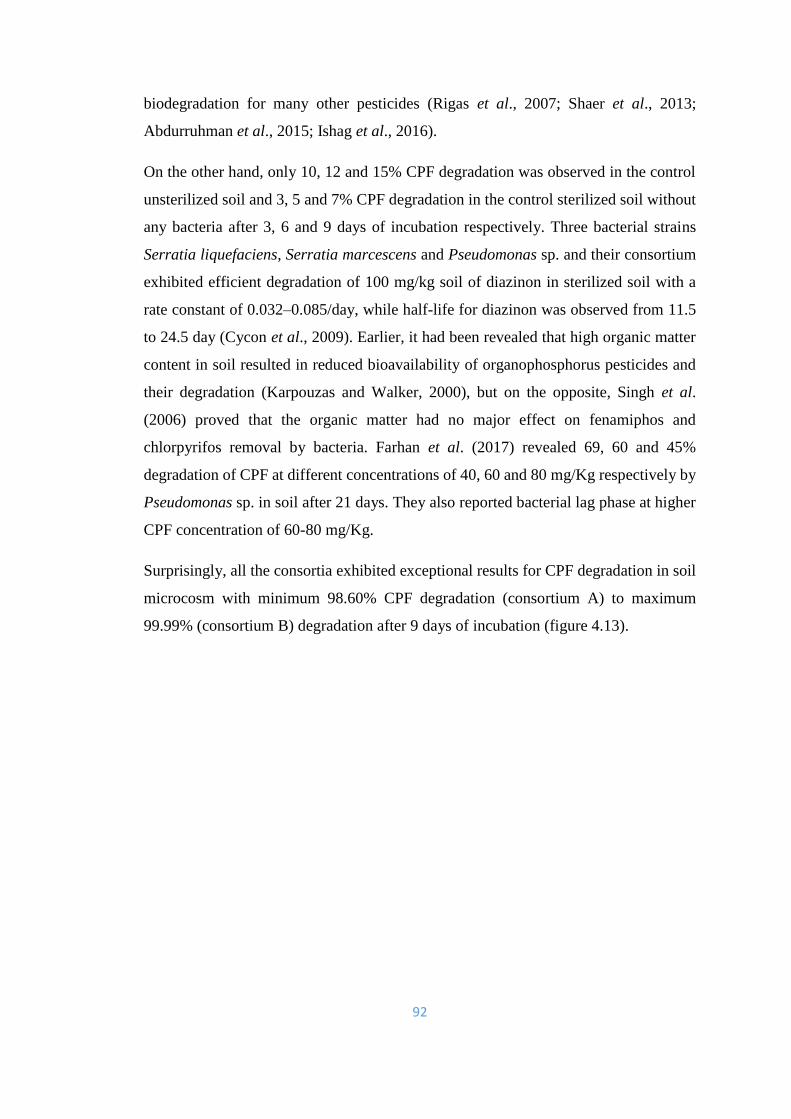
92
biodegradation for many other pesticides (Rigas et al., 2007; Shaer et al., 2013;
Abdurruhman et al., 2015; Ishag et al., 2016).
On the other hand, only 10, 12 and 15% CPF degradation was observed in the control
unsterilized soil and 3, 5 and 7% CPF degradation in the control sterilized soil without
any bacteria after 3, 6 and 9 days of incubation respectively. Three bacterial strains
Serratia liquefaciens, Serratia marcescens and Pseudomonas sp. and their consortium
exhibited efficient degradation of 100 mg/kg soil of diazinon in sterilized soil with a
rate constant of 0.032–0.085/day, while half-life for diazinon was observed from 11.5
to 24.5 day (Cycon et al., 2009). Earlier, it had been revealed that high organic matter
content in soil resulted in reduced bioavailability of organophosphorus pesticides and
their degradation (Karpouzas and Walker, 2000), but on the opposite, Singh et al.
(2006) proved that the organic matter had no major effect on fenamiphos and
chlorpyrifos removal by bacteria. Farhan et al. (2017) revealed 69, 60 and 45%
degradation of CPF at different concentrations of 40, 60 and 80 mg/Kg respectively by
Pseudomonas sp. in soil after 21 days. They also reported bacterial lag phase at higher
CPF concentration of 60-80 mg/Kg.
Surprisingly, all the consortia exhibited exceptional results for CPF degradation in soil
microcosm with minimum 98.60% CPF degradation (consortium A) to maximum
99.99% (consortium B) degradation after 9 days of incubation (figure 4.13).
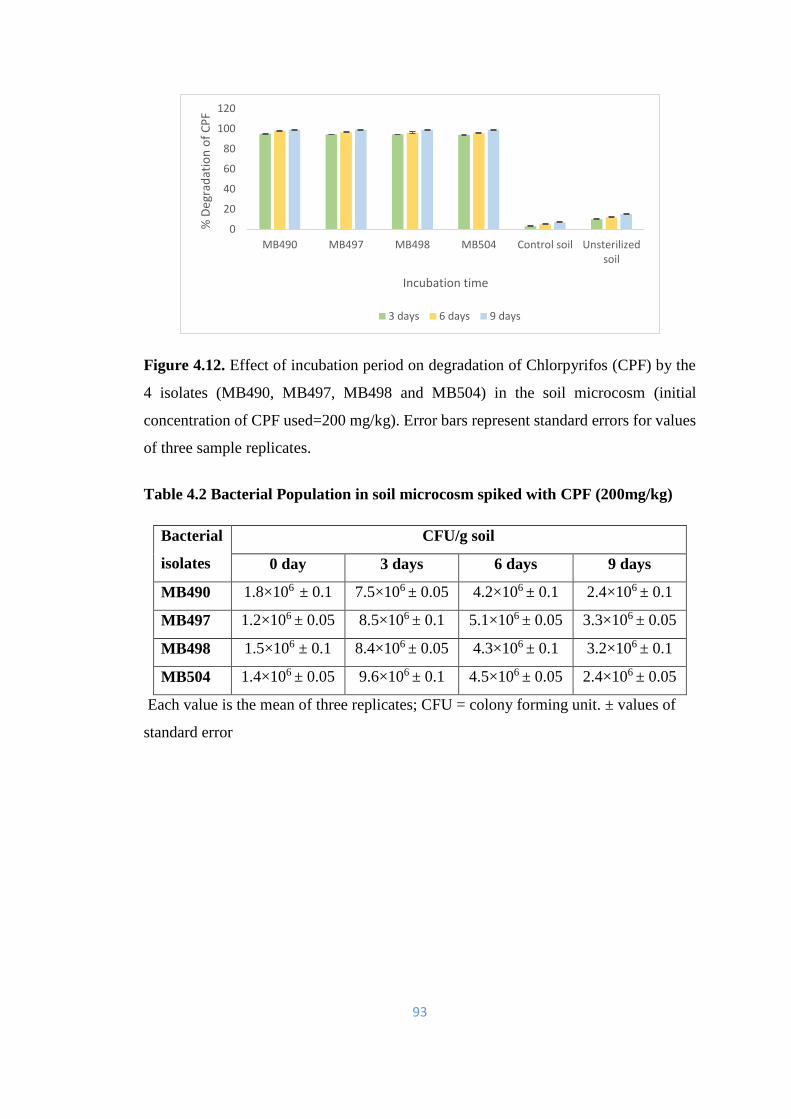
93
Figure 4.12. Effect of incubation period on degradation of Chlorpyrifos (CPF) by the
4 isolates (MB490, MB497, MB498 and MB504) in the soil microcosm (initial
concentration of CPF used=200 mg/kg). Error bars represent standard errors for values
of three sample replicates.
Table 4.2 Bacterial Population in soil microcosm spiked with CPF (200mg/kg)
Bacterial
isolates
CFU/g soil
0 day 3 days 6 days 9 days
MB490 1.8×10⁶ ± 0.1 7.5×10⁶ ± 0.05 4.2×10⁶ ± 0.1 2.4×10⁶ ± 0.1
MB497 1.2×10⁶ ± 0.05 8.5×10⁶ ± 0.1 5.1×10⁶ ± 0.05 3.3×10⁶ ± 0.05
MB498 1.5×10⁶ ± 0.1 8.4×10⁶ ± 0.05 4.3×10⁶ ± 0.1 3.2×10⁶ ± 0.1
MB504 1.4×10⁶ ± 0.05 9.6×10⁶ ± 0.1 4.5×10⁶ ± 0.05 2.4×10⁶ ± 0.05
Each value is the mean of three replicates; CFU = colony forming unit. ± values of
standard error
0
20
40
60
80
100
120
MB490 MB497 MB498 MB504 Control soil Unsterilizedsoil
% D
egra
dat
ion
of
CP
F
Incubation time
3 days 6 days 9 days
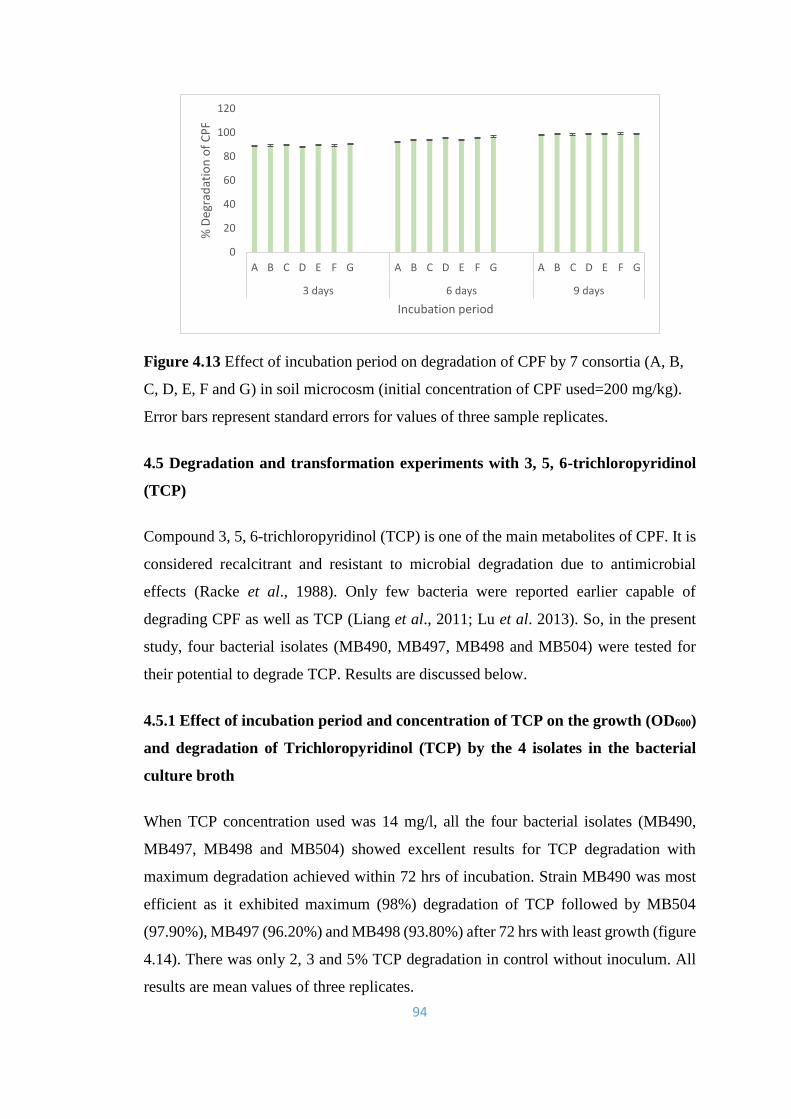
94
Figure 4.13 Effect of incubation period on degradation of CPF by 7 consortia (A, B,
C, D, E, F and G) in soil microcosm (initial concentration of CPF used=200 mg/kg).
Error bars represent standard errors for values of three sample replicates.
4.5 Degradation and transformation experiments with 3, 5, 6-trichloropyridinol
(TCP)
Compound 3, 5, 6-trichloropyridinol (TCP) is one of the main metabolites of CPF. It is
considered recalcitrant and resistant to microbial degradation due to antimicrobial
effects (Racke et al., 1988). Only few bacteria were reported earlier capable of
degrading CPF as well as TCP (Liang et al., 2011; Lu et al. 2013). So, in the present
study, four bacterial isolates (MB490, MB497, MB498 and MB504) were tested for
their potential to degrade TCP. Results are discussed below.
4.5.1 Effect of incubation period and concentration of TCP on the growth (OD600)
and degradation of Trichloropyridinol (TCP) by the 4 isolates in the bacterial
culture broth
When TCP concentration used was 14 mg/l, all the four bacterial isolates (MB490,
MB497, MB498 and MB504) showed excellent results for TCP degradation with
maximum degradation achieved within 72 hrs of incubation. Strain MB490 was most
efficient as it exhibited maximum (98%) degradation of TCP followed by MB504
(97.90%), MB497 (96.20%) and MB498 (93.80%) after 72 hrs with least growth (figure
4.14). There was only 2, 3 and 5% TCP degradation in control without inoculum. All
results are mean values of three replicates.
0
20
40
60
80
100
120
A B C D E F G A B C D E F G A B C D E F G
3 days 6 days 9 days
% D
egra
dat
ion
of
CP
F
Incubation period

95
On the other hand, when initial concentration of TCP was increased to 28 mg/l, all the
isolates exhibited gradual increase in TCP degradation with increasing incubation time
from 24 hrs to 72 hrs. Strain MB497 exhibited highest TCP degradation of 90.57%,
followed by MB504 (83.07%), while isolates MB490 and MB498 could degrade up to
67.53 and 60.39% TCP after 72 hrs (4.15). In contrast, they showed gradual decreasing
trend in their growth from 24 hrs to 72 hrs. The reason for highest growth and lowest
degradation during 24 hrs may be that bacteria were growing rapidly to produce more
enzymes for the degradation of higher concentration of TCP. During maximum
degradation, bacterial growth decreased rapidly due to different factors like
accumulation of toxic metabolites of TCP or some other toxic secondary secretion of
bacteria themselves. The TCP utilization by all the 4 strains was confirmed by HPLC
analysis (figure 4.38a, b, c, d and e).
Previously, it has been suggested that CPF biodegradation is resisted due to the
accumulation of its main metabolite 3, 5, 6-trichloro-2-pyridinol (TCP). TCP had been
declared as a persistent and leachable pollutant by the US Environmental Protection
Agency (Armbrust, 2001). It has somewhat higher antimicrobial effects on microbes,
which prevents its own degradation (Caceres et al., 2007; Cao et al., 2012). The
resistance of TCP towards degradation might be due to the presence of three chlorine
atoms in the pyridinol ring of TCP structure which must be eliminated in order to break
the ring (Feng et al., 1997).
There are only few reports of TCP degradation due to its antimicrobial effects. Present
results are in consistence with those reported by Chen et al. (2012), which revealed
89% degradation of CPF and 93.5% degradation of TCP (50 mg/l each) by fungal strain
Cladosporium cladosporioides Hu-01 within 1 day and their complete disappearance
after 5 and 6 days of incubation respectively.
A bacterial strain, Cupriavidus sp. DT-1, was also reported by Lu et al. (2013) that was
able to degrade both Chlorpyrifos (100 mg/kg) and 3,5,6-trichloro-2-pyridinol (50
mg/kg) up to 100 and 94% respectively in 30 days of incubation in soil. The strain
Bacillus pumilus C2A1 was reported to degrade up to 90% of initial 300 mg/l of TCP
after 8 days of incubation and up to 73, 83 and 87% of the spiked Chlorpyrifos (100,
200 and 300 mg/l respectively) in broth within 10 days of incubation (Anwar et al.,
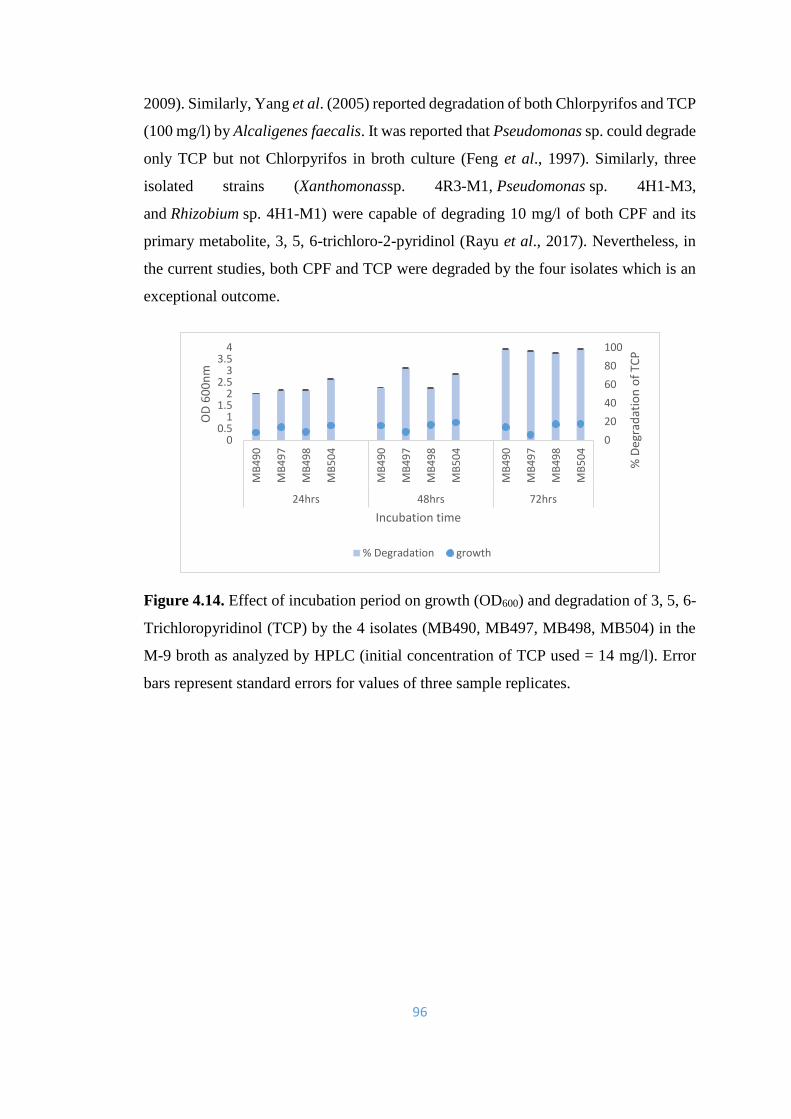
96
2009). Similarly, Yang et al. (2005) reported degradation of both Chlorpyrifos and TCP
(100 mg/l) by Alcaligenes faecalis. It was reported that Pseudomonas sp. could degrade
only TCP but not Chlorpyrifos in broth culture (Feng et al., 1997). Similarly, three
isolated strains (Xanthomonassp. 4R3-M1, Pseudomonas sp. 4H1-M3,
and Rhizobium sp. 4H1-M1) were capable of degrading 10 mg/l of both CPF and its
primary metabolite, 3, 5, 6-trichloro-2-pyridinol (Rayu et al., 2017). Nevertheless, in
the current studies, both CPF and TCP were degraded by the four isolates which is an
exceptional outcome.
Figure 4.14. Effect of incubation period on growth (OD600) and degradation of 3, 5, 6-
Trichloropyridinol (TCP) by the 4 isolates (MB490, MB497, MB498, MB504) in the
M-9 broth as analyzed by HPLC (initial concentration of TCP used = 14 mg/l). Error
bars represent standard errors for values of three sample replicates.
0
20
40
60
80
100
00.5
11.5
22.5
33.5
4
MB
49
0
MB
49
7
MB
49
8
MB
50
4
MB
49
0
MB
49
7
MB
49
8
MB
50
4
MB
49
0
MB
49
7
MB
49
8
MB
50
4
24hrs 48hrs 72hrs
% D
egra
dat
ion
of
TCP
OD
60
0n
m
Incubation time
% Degradation growth
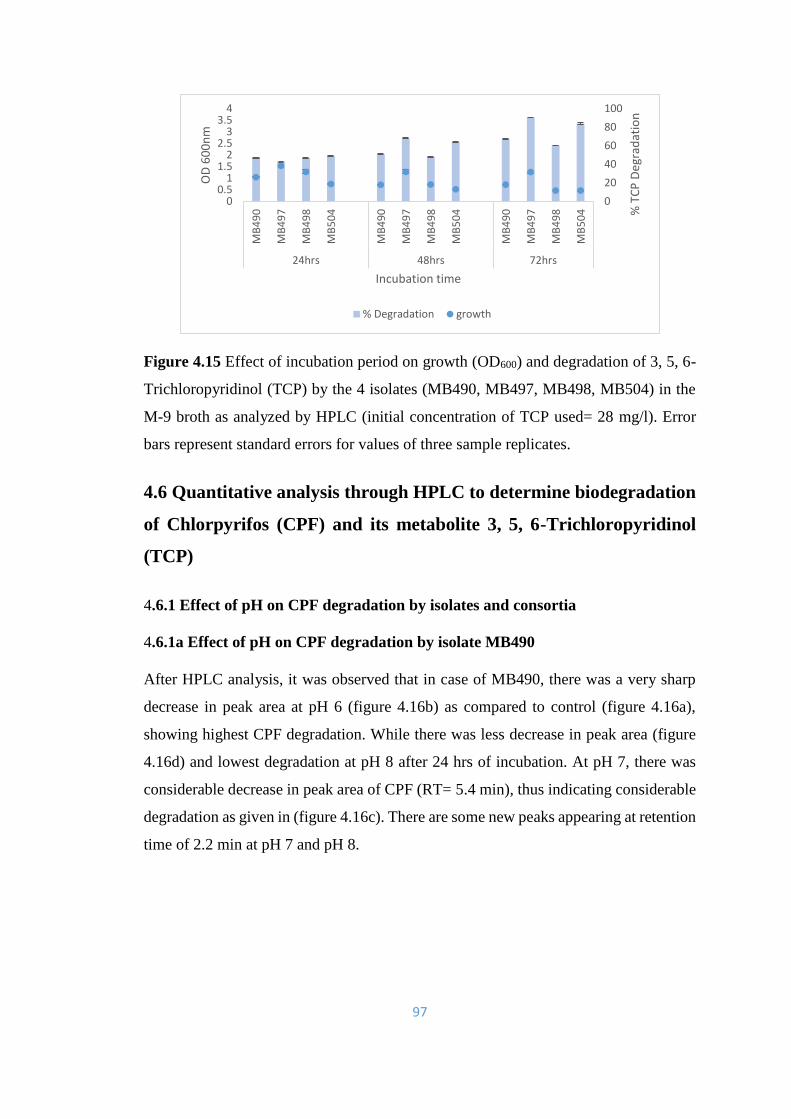
97
Figure 4.15 Effect of incubation period on growth (OD600) and degradation of 3, 5, 6-
Trichloropyridinol (TCP) by the 4 isolates (MB490, MB497, MB498, MB504) in the
M-9 broth as analyzed by HPLC (initial concentration of TCP used= 28 mg/l). Error
bars represent standard errors for values of three sample replicates.
4.6 Quantitative analysis through HPLC to determine biodegradation
of Chlorpyrifos (CPF) and its metabolite 3, 5, 6-Trichloropyridinol
(TCP)
4.6.1 Effect of pH on CPF degradation by isolates and consortia
4.6.1a Effect of pH on CPF degradation by isolate MB490
After HPLC analysis, it was observed that in case of MB490, there was a very sharp
decrease in peak area at pH 6 (figure 4.16b) as compared to control (figure 4.16a),
showing highest CPF degradation. While there was less decrease in peak area (figure
4.16d) and lowest degradation at pH 8 after 24 hrs of incubation. At pH 7, there was
considerable decrease in peak area of CPF (RT= 5.4 min), thus indicating considerable
degradation as given in (figure 4.16c). There are some new peaks appearing at retention
time of 2.2 min at pH 7 and pH 8.
0
20
40
60
80
100
00.5
11.5
22.5
33.5
4
MB
49
0
MB
49
7
MB
49
8
MB
50
4
MB
49
0
MB
49
7
MB
49
8
MB
50
4
MB
49
0
MB
49
7
MB
49
8
MB
50
4
24hrs 48hrs 72hrs
% T
CP
Deg
rad
atio
n
OD
60
0n
m
Incubation time
% Degradation growth
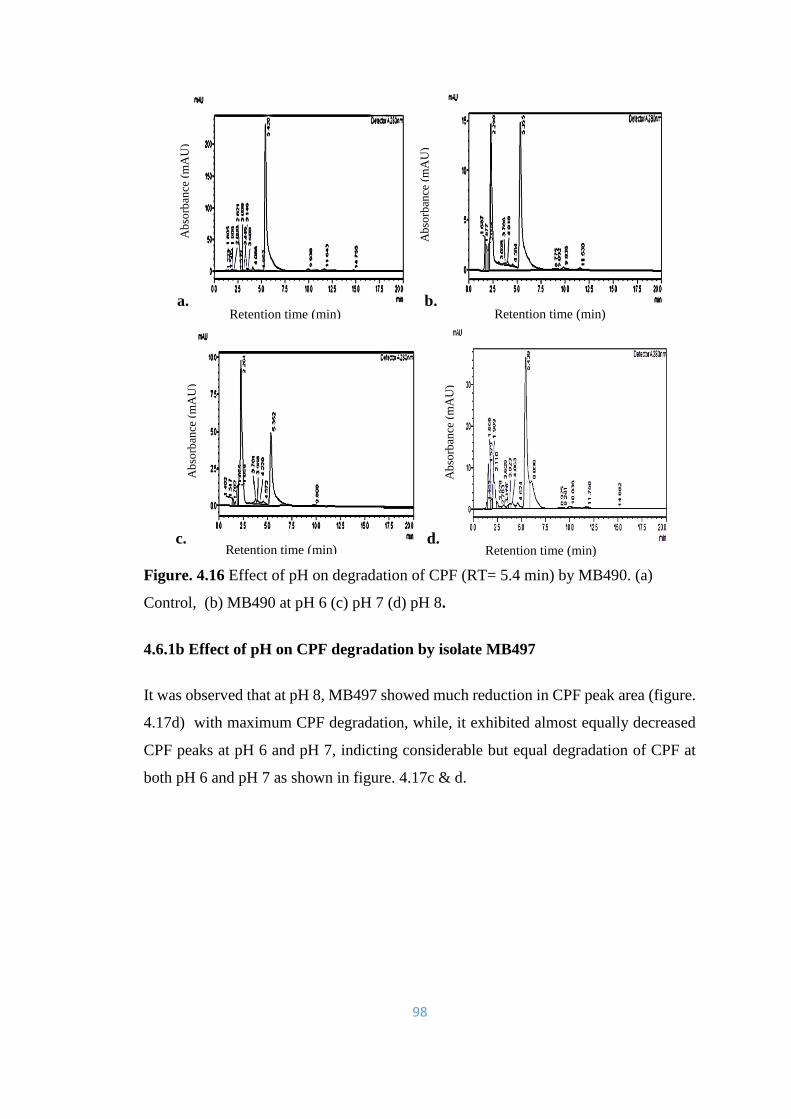
98
a. b.
c. d.
Figure. 4.16 Effect of pH on degradation of CPF (RT= 5.4 min) by MB490. (a)
Control, (b) MB490 at pH 6 (c) pH 7 (d) pH 8.
4.6.1b Effect of pH on CPF degradation by isolate MB497
It was observed that at pH 8, MB497 showed much reduction in CPF peak area (figure.
4.17d) with maximum CPF degradation, while, it exhibited almost equally decreased
CPF peaks at pH 6 and pH 7, indicting considerable but equal degradation of CPF at
both pH 6 and pH 7 as shown in figure. 4.17c & d.
Retention time (min)
Ab
sorb
ance
(m
AU
)
Ab
sorb
ance
(m
AU
) A
bso
rban
ce (
mA
U)
Ab
sorb
ance
(m
AU
)
Retention time (min)
Retention time (min) Retention time (min)
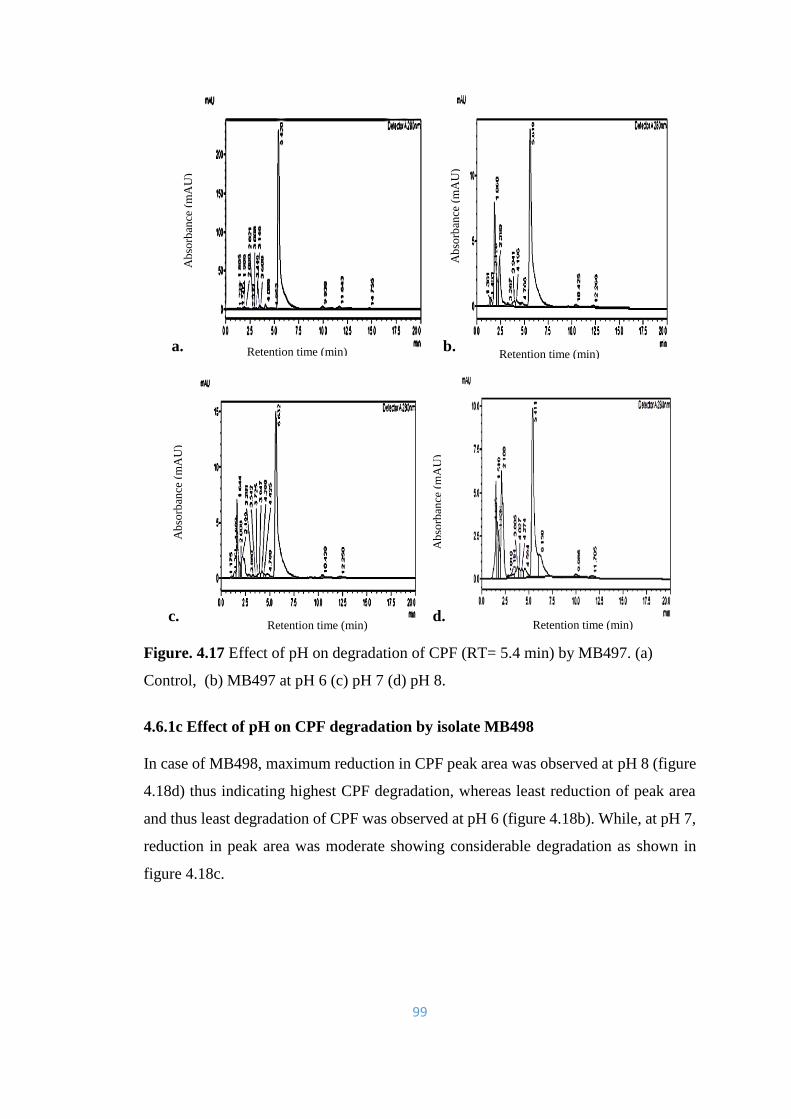
99
a. b.
c. d.
Figure. 4.17 Effect of pH on degradation of CPF (RT= 5.4 min) by MB497. (a)
Control, (b) MB497 at pH 6 (c) pH 7 (d) pH 8.
4.6.1c Effect of pH on CPF degradation by isolate MB498
In case of MB498, maximum reduction in CPF peak area was observed at pH 8 (figure
4.18d) thus indicating highest CPF degradation, whereas least reduction of peak area
and thus least degradation of CPF was observed at pH 6 (figure 4.18b). While, at pH 7,
reduction in peak area was moderate showing considerable degradation as shown in
figure 4.18c.
Retention time (min)
Ab
sorb
ance
(m
AU
)
Retention time (min)
Ab
sorb
ance
(m
AU
)
Retention time (min)
Ab
sorb
ance
(m
AU
)
Ab
sorb
ance
(m
AU
)
Retention time (min)
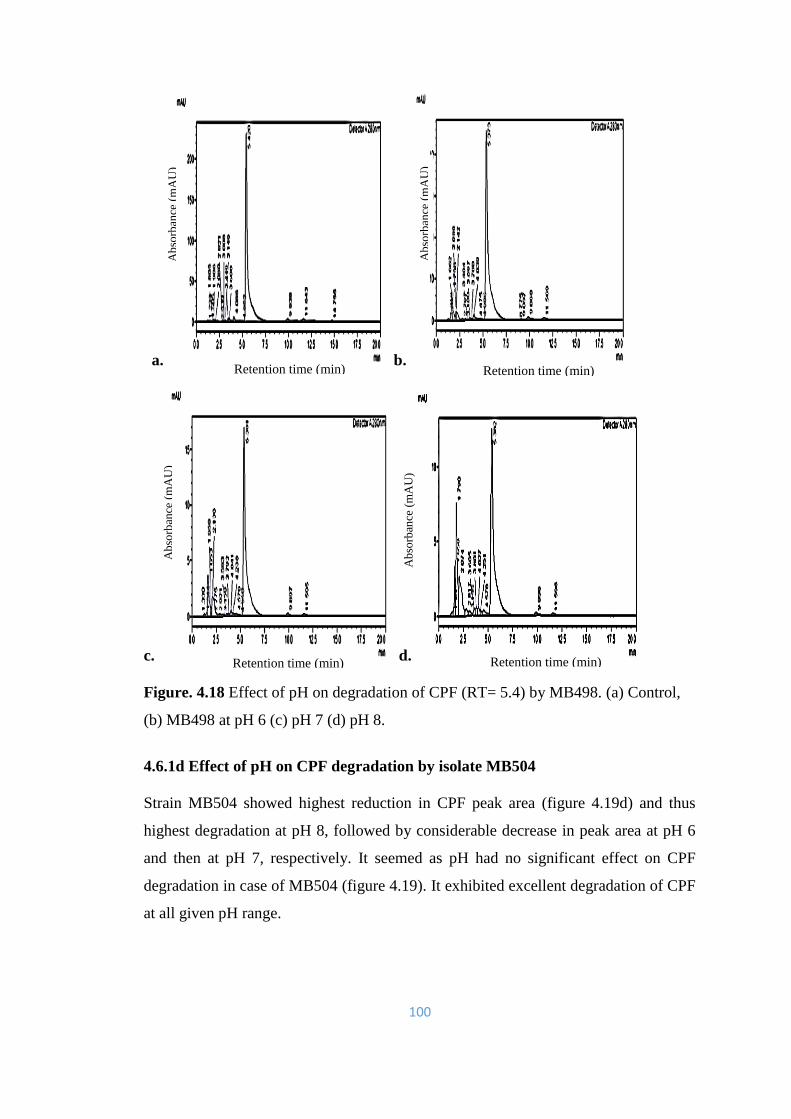
100
a. b.
c. d.
Figure. 4.18 Effect of pH on degradation of CPF (RT= 5.4) by MB498. (a) Control,
(b) MB498 at pH 6 (c) pH 7 (d) pH 8.
4.6.1d Effect of pH on CPF degradation by isolate MB504
Strain MB504 showed highest reduction in CPF peak area (figure 4.19d) and thus
highest degradation at pH 8, followed by considerable decrease in peak area at pH 6
and then at pH 7, respectively. It seemed as pH had no significant effect on CPF
degradation in case of MB504 (figure 4.19). It exhibited excellent degradation of CPF
at all given pH range.
Retention time (min) Retention time (min)
Retention time (min) Retention time (min)
Ab
sorb
ance
(m
AU
)
Ab
sorb
ance
(m
AU
)
Ab
sorb
ance
(m
AU
)
Ab
sorb
ance
(m
AU
)
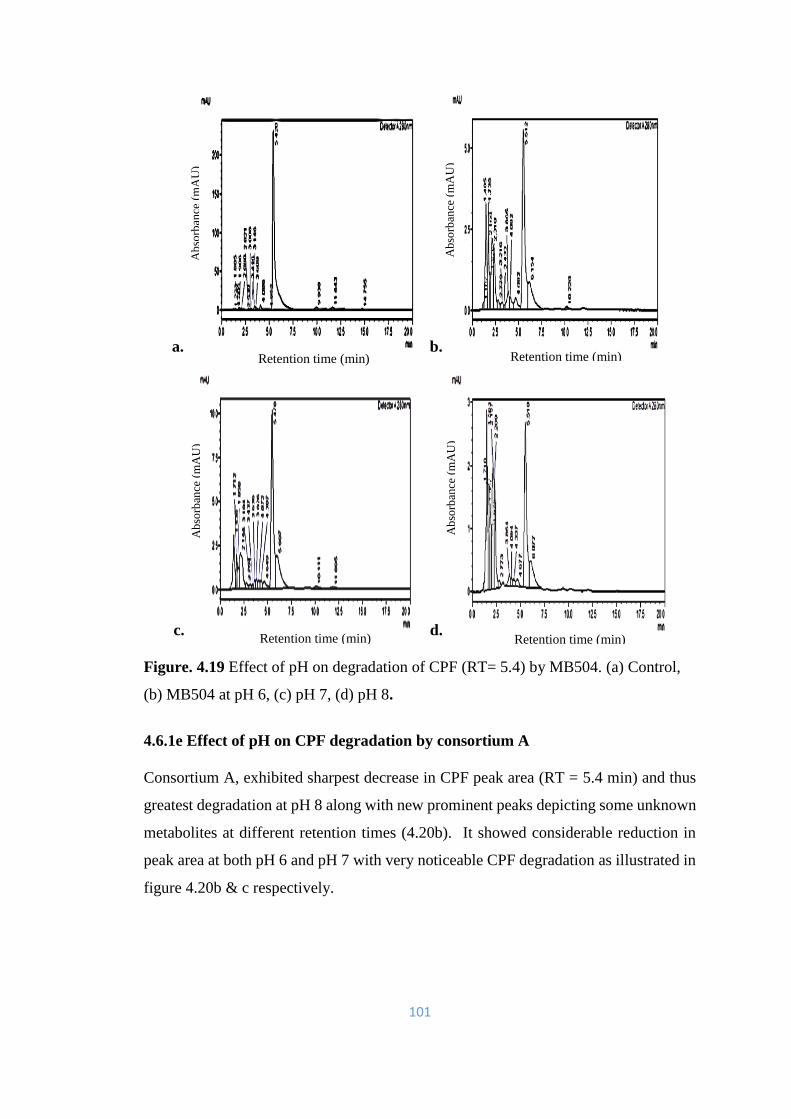
101
a. b.
c. d.
Figure. 4.19 Effect of pH on degradation of CPF (RT= 5.4) by MB504. (a) Control,
(b) MB504 at pH 6, (c) pH 7, (d) pH 8.
4.6.1e Effect of pH on CPF degradation by consortium A
Consortium A, exhibited sharpest decrease in CPF peak area (RT = 5.4 min) and thus
greatest degradation at pH 8 along with new prominent peaks depicting some unknown
metabolites at different retention times (4.20b). It showed considerable reduction in
peak area at both pH 6 and pH 7 with very noticeable CPF degradation as illustrated in
figure 4.20b & c respectively.
Ab
sorb
ance
(m
AU
)
Ab
sorb
ance
(m
AU
)
Ab
sorb
ance
(m
AU
)
Ab
sorb
ance
(m
AU
)
Retention time (min) Retention time (min)
Retention time (min) Retention time (min)
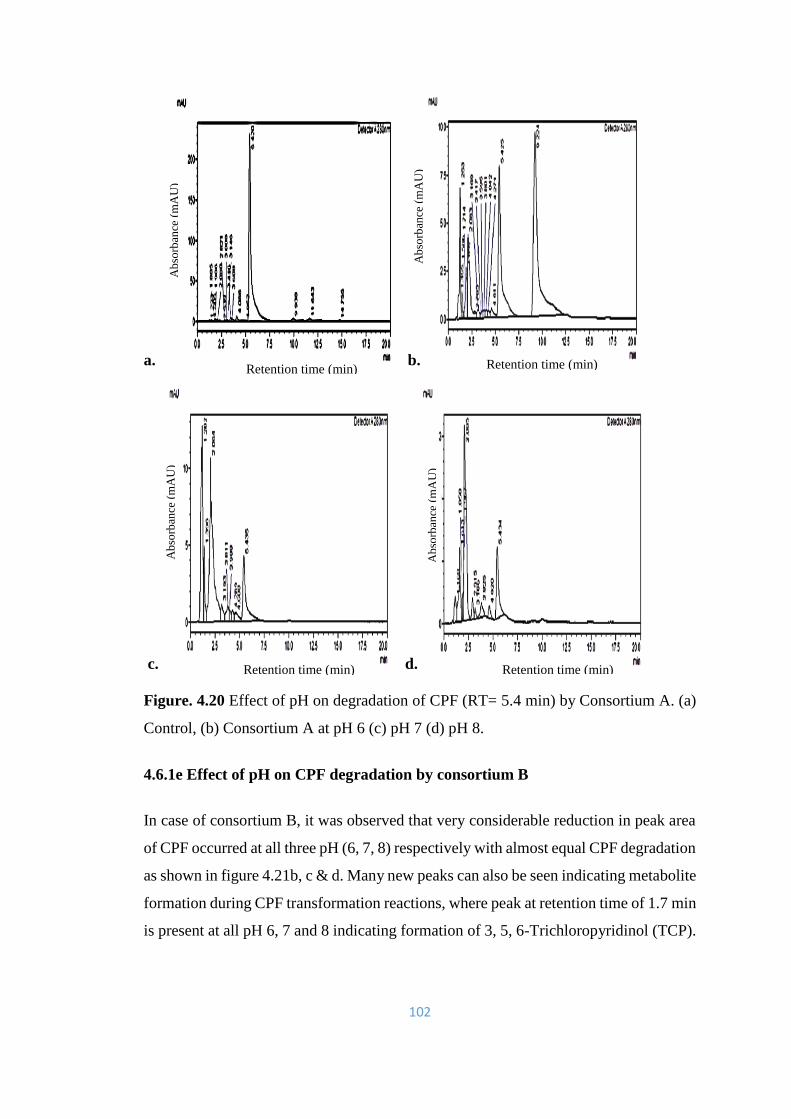
102
a. b.
c. d.
Figure. 4.20 Effect of pH on degradation of CPF (RT= 5.4 min) by Consortium A. (a)
Control, (b) Consortium A at pH 6 (c) pH 7 (d) pH 8.
4.6.1e Effect of pH on CPF degradation by consortium B
In case of consortium B, it was observed that very considerable reduction in peak area
of CPF occurred at all three pH (6, 7, 8) respectively with almost equal CPF degradation
as shown in figure 4.21b, c & d. Many new peaks can also be seen indicating metabolite
formation during CPF transformation reactions, where peak at retention time of 1.7 min
is present at all pH 6, 7 and 8 indicating formation of 3, 5, 6-Trichloropyridinol (TCP).
Ab
sorb
ance
(m
AU
)
Ab
sorb
ance
(m
AU
)
Ab
sorb
ance
(m
AU
)
Ab
sorb
ance
(m
AU
)
Retention time (min) Retention time (min)
Retention time (min) Retention time (min)
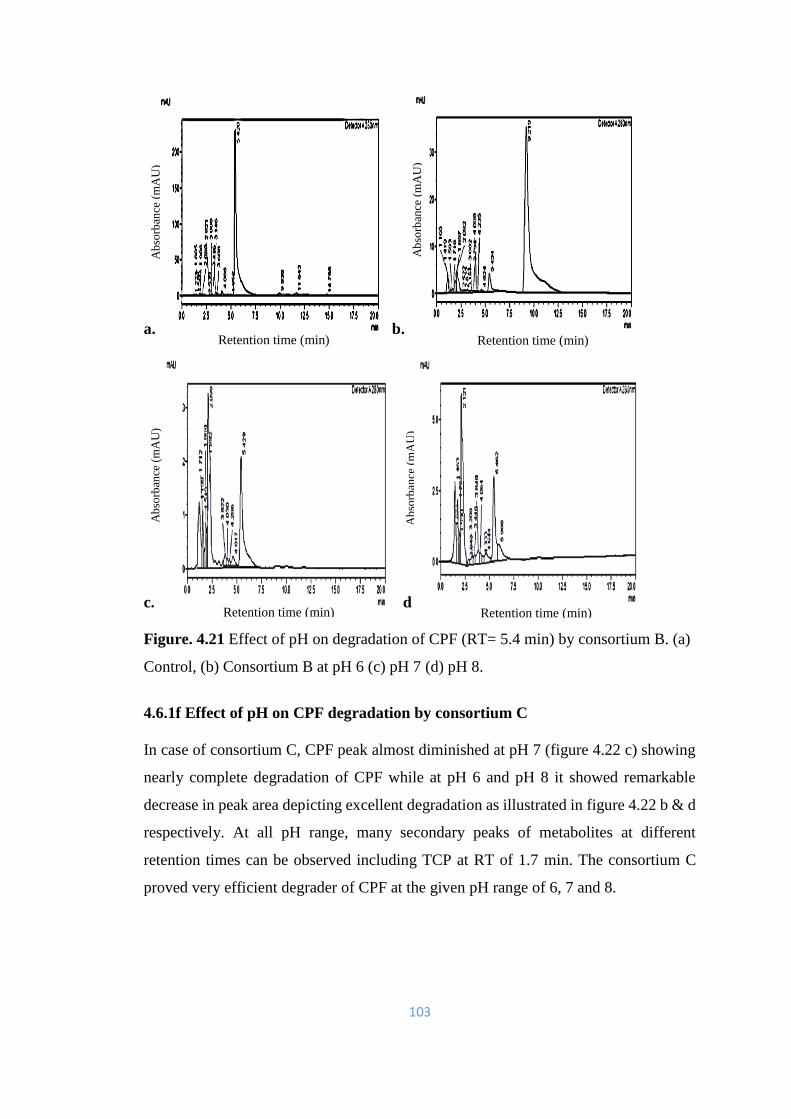
103
a. b.
c. d
Figure. 4.21 Effect of pH on degradation of CPF (RT= 5.4 min) by consortium B. (a)
Control, (b) Consortium B at pH 6 (c) pH 7 (d) pH 8.
4.6.1f Effect of pH on CPF degradation by consortium C
In case of consortium C, CPF peak almost diminished at pH 7 (figure 4.22 c) showing
nearly complete degradation of CPF while at pH 6 and pH 8 it showed remarkable
decrease in peak area depicting excellent degradation as illustrated in figure 4.22 b & d
respectively. At all pH range, many secondary peaks of metabolites at different
retention times can be observed including TCP at RT of 1.7 min. The consortium C
proved very efficient degrader of CPF at the given pH range of 6, 7 and 8.
Ab
sorb
ance
(m
AU
)
Ab
sorb
ance
(m
AU
) A
bso
rban
ce (
mA
U)
Ab
sorb
ance
(m
AU
)
Retention time (min)
Retention time (min)
Retention time (min)
Retention time (min)
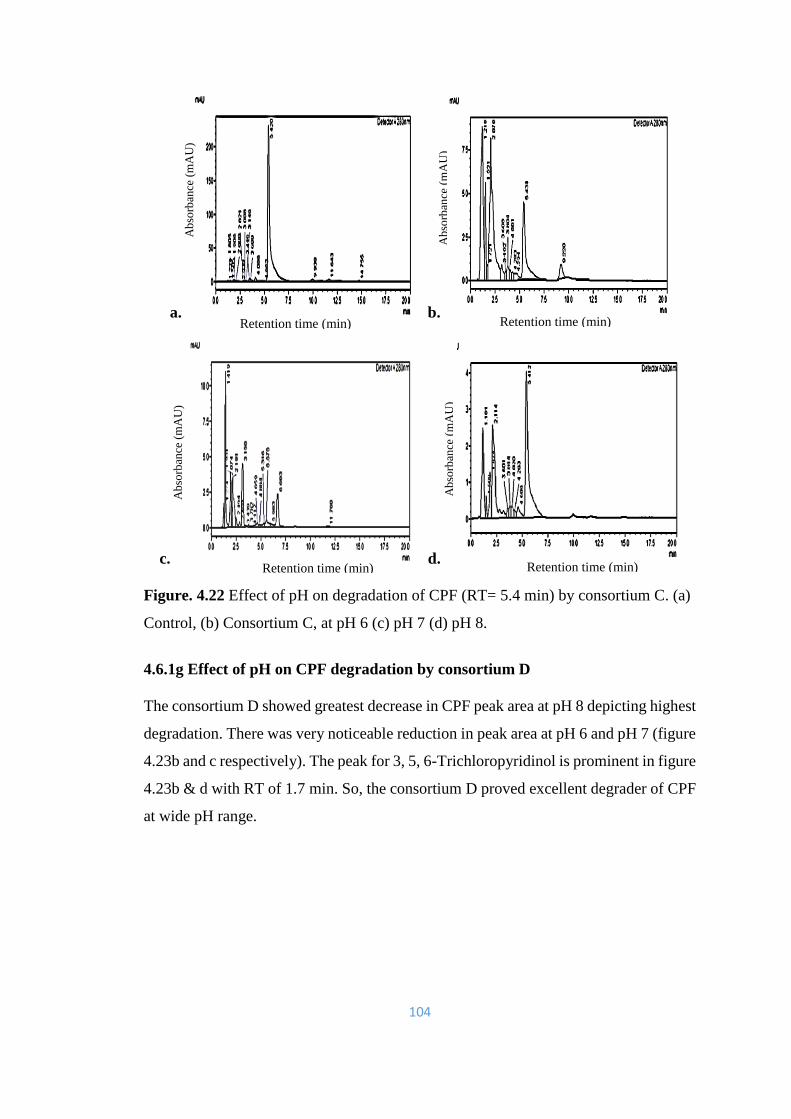
104
a. b.
c. d.
Figure. 4.22 Effect of pH on degradation of CPF (RT= 5.4 min) by consortium C. (a)
Control, (b) Consortium C, at pH 6 (c) pH 7 (d) pH 8.
4.6.1g Effect of pH on CPF degradation by consortium D
The consortium D showed greatest decrease in CPF peak area at pH 8 depicting highest
degradation. There was very noticeable reduction in peak area at pH 6 and pH 7 (figure
4.23b and c respectively). The peak for 3, 5, 6-Trichloropyridinol is prominent in figure
4.23b & d with RT of 1.7 min. So, the consortium D proved excellent degrader of CPF
at wide pH range.
Ab
sorb
ance
(m
AU
)
Ab
sorb
ance
(m
AU
)
Ab
sorb
ance
(m
AU
)
Ab
sorb
ance
(m
AU
)
Retention time (min) Retention time (min)
Retention time (min) Retention time (min)
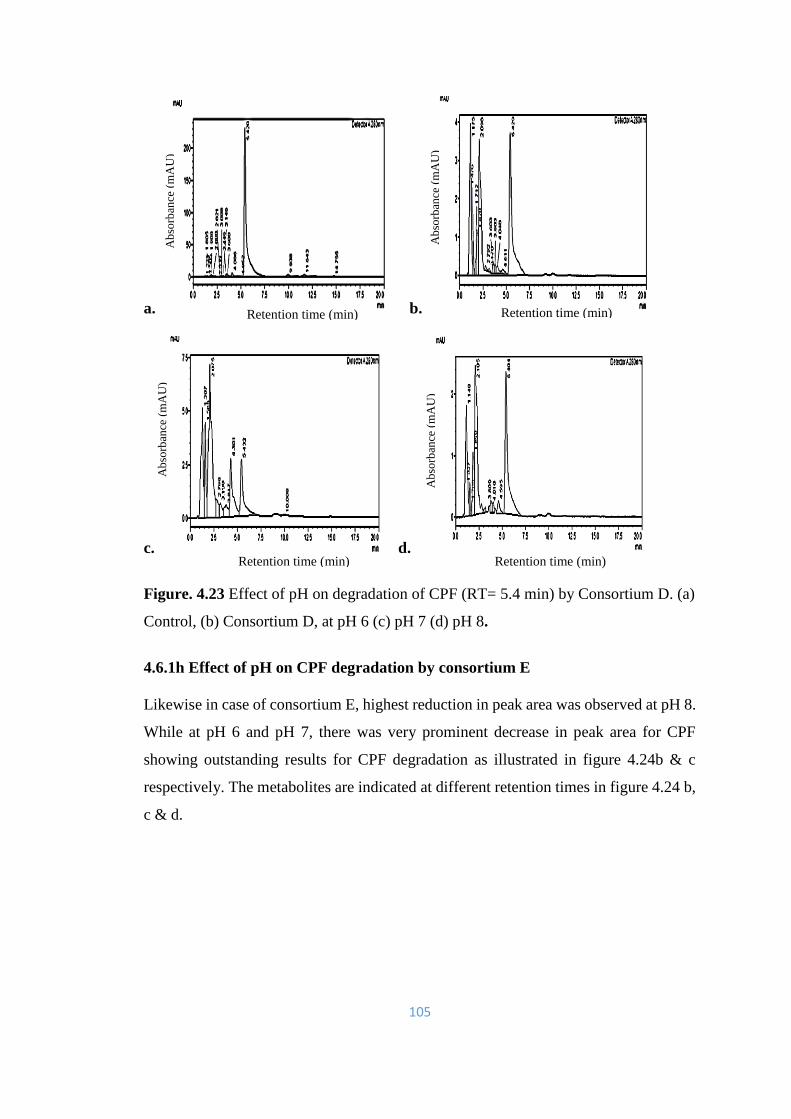
105
a. b.
c. d.
Figure. 4.23 Effect of pH on degradation of CPF (RT= 5.4 min) by Consortium D. (a)
Control, (b) Consortium D, at pH 6 (c) pH 7 (d) pH 8.
4.6.1h Effect of pH on CPF degradation by consortium E
Likewise in case of consortium E, highest reduction in peak area was observed at pH 8.
While at pH 6 and pH 7, there was very prominent decrease in peak area for CPF
showing outstanding results for CPF degradation as illustrated in figure 4.24b & c
respectively. The metabolites are indicated at different retention times in figure 4.24 b,
c & d.
Ab
sorb
ance
(m
AU
)
Ab
sorb
ance
(m
AU
)
Ab
sorb
ance
(m
AU
)
Ab
sorb
ance
(m
AU
)
Retention time (min) Retention time (min)
Retention time (min) Retention time (min)
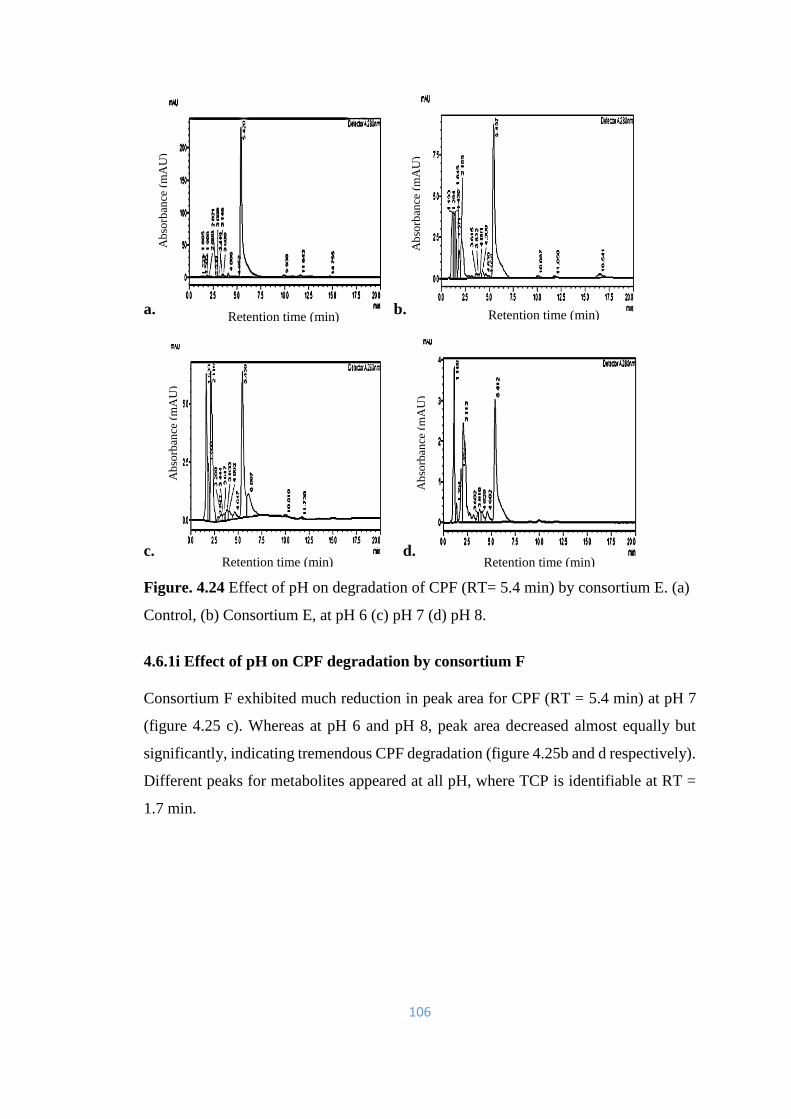
106
a. b.
c. d.
Figure. 4.24 Effect of pH on degradation of CPF (RT= 5.4 min) by consortium E. (a)
Control, (b) Consortium E, at pH 6 (c) pH 7 (d) pH 8.
4.6.1i Effect of pH on CPF degradation by consortium F
Consortium F exhibited much reduction in peak area for CPF (RT = 5.4 min) at pH 7
(figure 4.25 c). Whereas at pH 6 and pH 8, peak area decreased almost equally but
significantly, indicating tremendous CPF degradation (figure 4.25b and d respectively).
Different peaks for metabolites appeared at all pH, where TCP is identifiable at RT =
1.7 min.
Ab
sorb
ance
(m
AU
)
Ab
sorb
ance
(m
AU
)
Ab
sorb
ance
(m
AU
)
Ab
sorb
ance
(m
AU
)
Retention time (min) Retention time (min)
Retention time (min) Retention time (min)

107
a. b.
c. d.
Figure. 4.25 Effect of pH on degradation of CPF (RT= 5.4 min) by Consortium F. (a)
Control, (b) Consortium F, at pH 6 (c) pH 7 (d) pH 8. TCP peak is prominent (RT= 1.7
min).
4.6.1j Effect of pH on CPF degradation by consortium G
In case of consortium G (MB490+MB497+MB498+MB504), it was observed that
highest decrease in CPF peak area occurred at pH 8 (figure 4.26 d). There was least
reduction in peak area at pH 6, while at pH 7, considerable decrease in peak area was
noticed as exhibited in figure 4.26 b & c. Different new peaks for metabolites are
prominent in figure 4.26c & d).
Ab
sorb
ance
(m
AU
)
Ab
sorb
ance
(m
AU
)
Ab
sorb
ance
(m
AU
)
Ab
sorb
ance
(m
AU
)
Retention time (min) Retention time (min)
Retention time (min) Retention time (min)
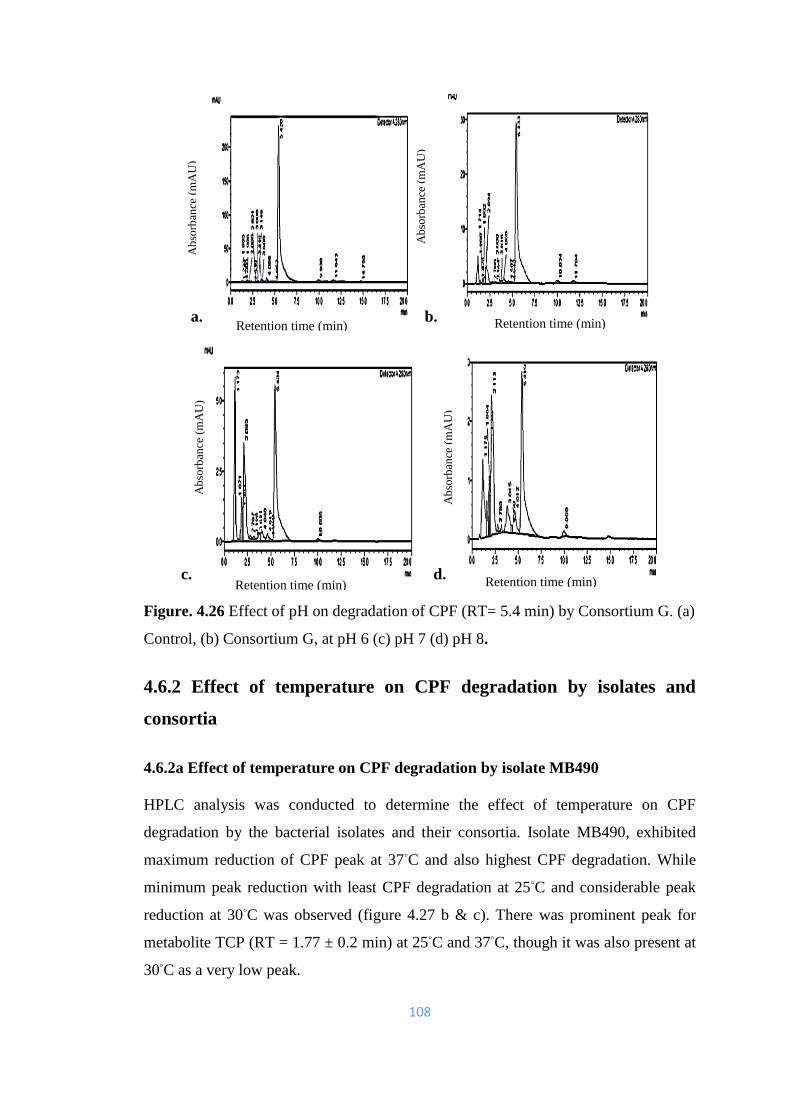
108
a. b.
c. d.
Figure. 4.26 Effect of pH on degradation of CPF (RT= 5.4 min) by Consortium G. (a)
Control, (b) Consortium G, at pH 6 (c) pH 7 (d) pH 8.
4.6.2 Effect of temperature on CPF degradation by isolates and
consortia
4.6.2a Effect of temperature on CPF degradation by isolate MB490
HPLC analysis was conducted to determine the effect of temperature on CPF
degradation by the bacterial isolates and their consortia. Isolate MB490, exhibited
maximum reduction of CPF peak at 37◦C and also highest CPF degradation. While
minimum peak reduction with least CPF degradation at 25◦C and considerable peak
reduction at 30◦C was observed (figure 4.27 b & c). There was prominent peak for
metabolite TCP (RT = 1.77 ± 0.2 min) at 25◦C and 37◦C, though it was also present at
30◦C as a very low peak.
Ab
sorb
ance
(m
AU
)
Ab
sorb
ance
(m
AU
)
Ab
sorb
ance
(m
AU
)
Ab
sorb
ance
(m
AU
)
Retention time (min) Retention time (min)
Retention time (min) Retention time (min)
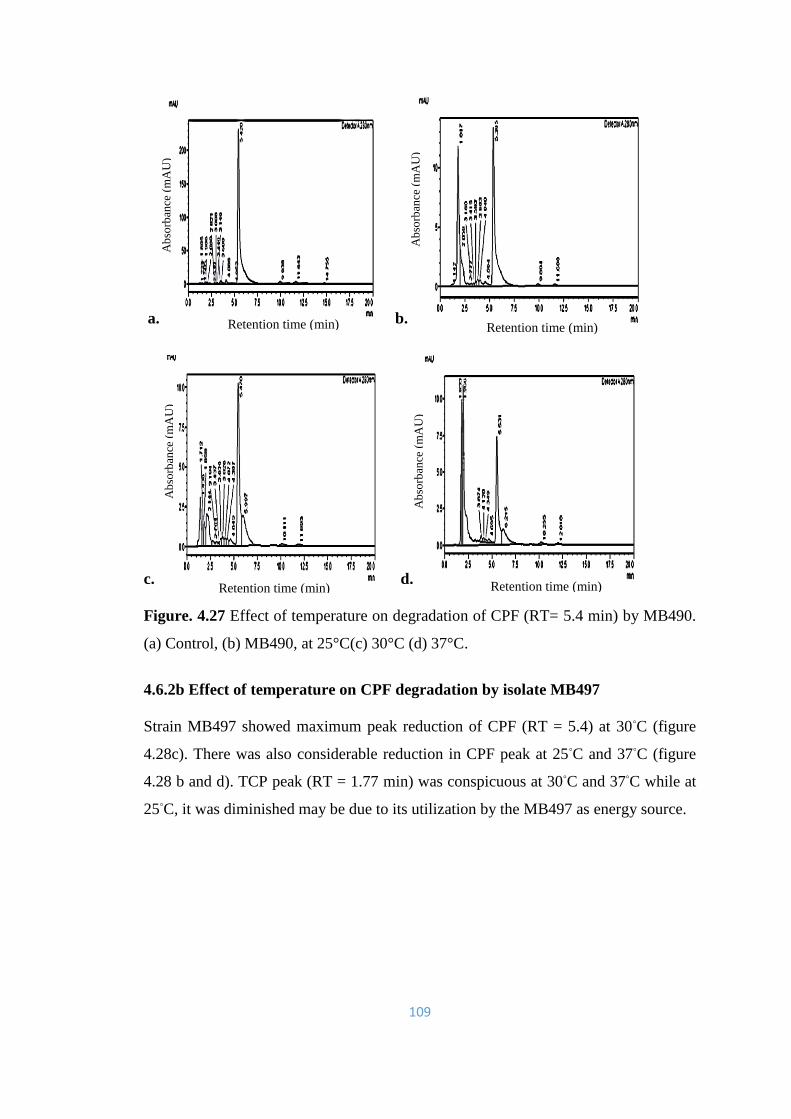
109
a. b.
c. d.
Figure. 4.27 Effect of temperature on degradation of CPF (RT= 5.4 min) by MB490.
(a) Control, (b) MB490, at 25°C(c) 30°C (d) 37°C.
4.6.2b Effect of temperature on CPF degradation by isolate MB497
Strain MB497 showed maximum peak reduction of CPF (RT = 5.4) at 30◦C (figure
4.28c). There was also considerable reduction in CPF peak at 25◦C and 37◦C (figure
4.28 b and d). TCP peak (RT = 1.77 min) was conspicuous at 30◦C and 37◦C while at
25◦C, it was diminished may be due to its utilization by the MB497 as energy source.
Ab
sorb
ance
(m
AU
)
Ab
sorb
ance
(m
AU
)
Ab
sorb
ance
(m
AU
)
Ab
sorb
ance
(m
AU
)
Retention time (min) Retention time (min)
Retention time (min) Retention time (min)
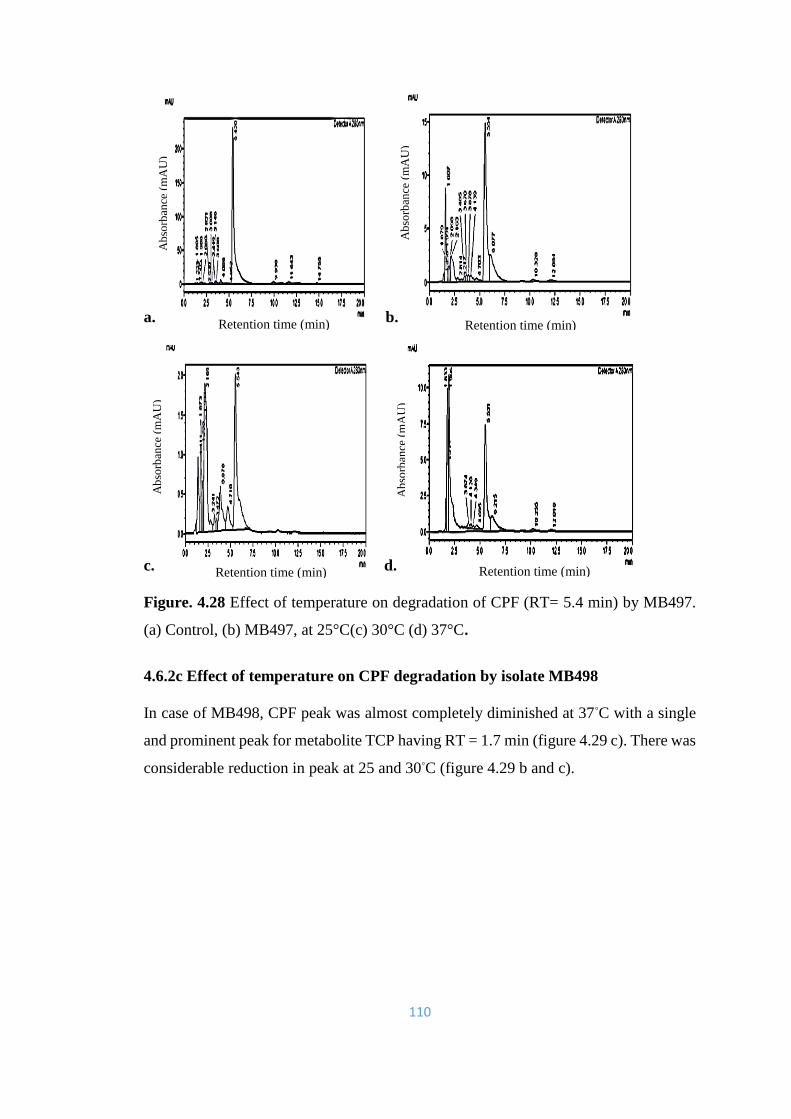
110
a. b.
c. d.
Figure. 4.28 Effect of temperature on degradation of CPF (RT= 5.4 min) by MB497.
(a) Control, (b) MB497, at 25°C(c) 30°C (d) 37°C.
4.6.2c Effect of temperature on CPF degradation by isolate MB498
In case of MB498, CPF peak was almost completely diminished at 37◦C with a single
and prominent peak for metabolite TCP having RT = 1.7 min (figure 4.29 c). There was
considerable reduction in peak at 25 and 30◦C (figure 4.29 b and c).
Ab
sorb
ance
(m
AU
)
Ab
sorb
ance
(m
AU
)
Ab
sorb
ance
(m
AU
)
Ab
sorb
ance
(m
AU
)
Retention time (min) Retention time (min)
Retention time (min) Retention time (min)
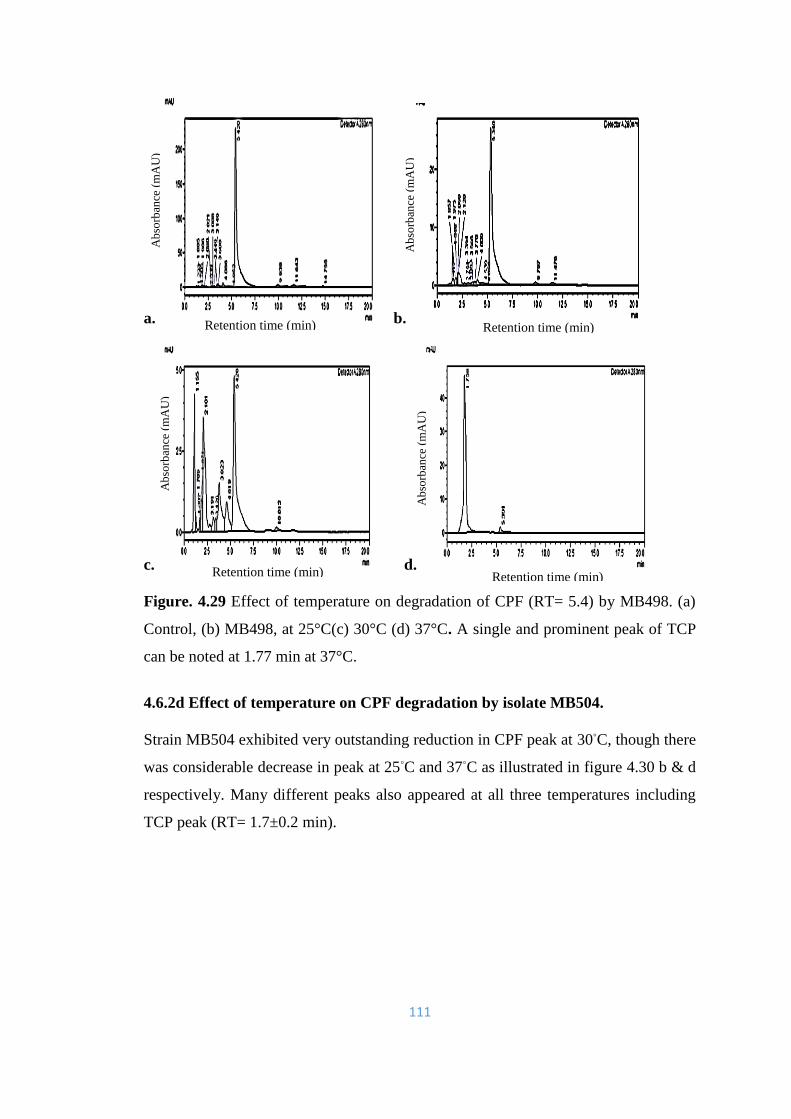
111
a. b.
c. d.
Figure. 4.29 Effect of temperature on degradation of CPF (RT= 5.4) by MB498. (a)
Control, (b) MB498, at 25°C(c) 30°C (d) 37°C. A single and prominent peak of TCP
can be noted at 1.77 min at 37°C.
4.6.2d Effect of temperature on CPF degradation by isolate MB504.
Strain MB504 exhibited very outstanding reduction in CPF peak at 30◦C, though there
was considerable decrease in peak at 25◦C and 37◦C as illustrated in figure 4.30 b & d
respectively. Many different peaks also appeared at all three temperatures including
TCP peak (RT= 1.7±0.2 min).
Ab
sorb
ance
(m
AU
)
Ab
sorb
ance
(m
AU
)
Ab
sorb
ance
(m
AU
)
Ab
sorb
ance
(m
AU
)
Retention time (min) Retention time (min)
Retention time (min) Retention time (min)
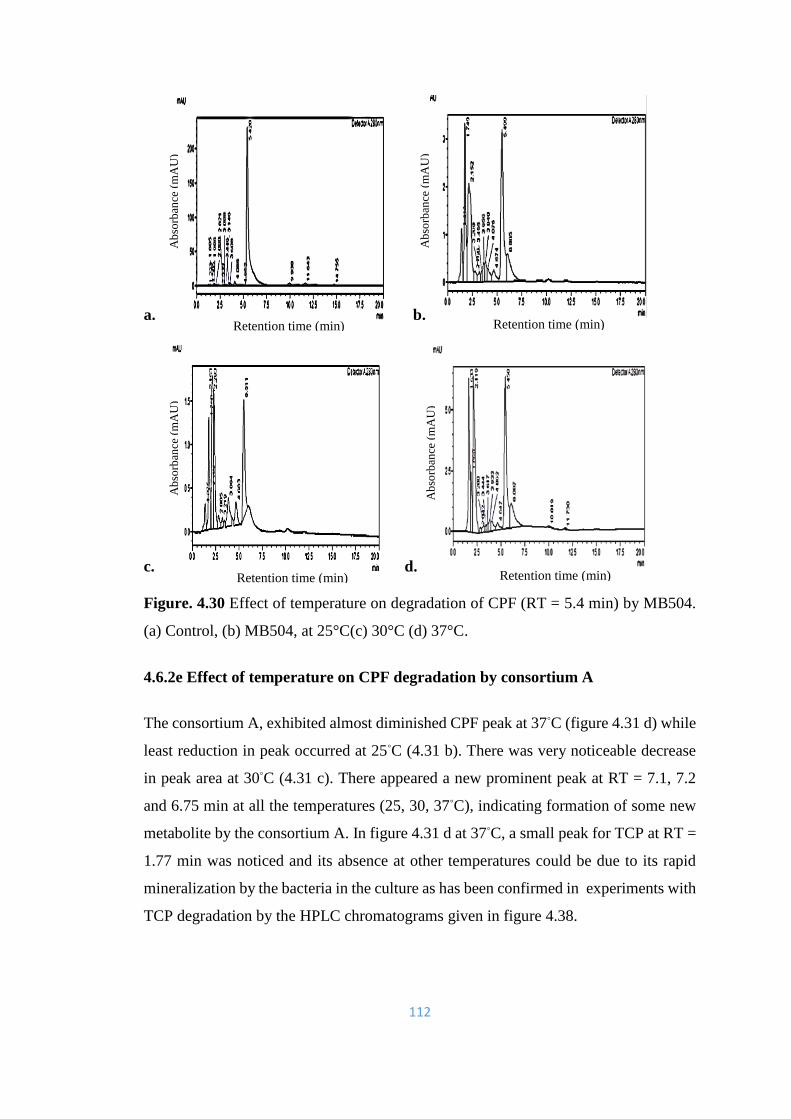
112
a. b.
c. d.
Figure. 4.30 Effect of temperature on degradation of CPF (RT = 5.4 min) by MB504.
(a) Control, (b) MB504, at 25°C(c) 30°C (d) 37°C.
4.6.2e Effect of temperature on CPF degradation by consortium A
The consortium A, exhibited almost diminished CPF peak at 37◦C (figure 4.31 d) while
least reduction in peak occurred at 25◦C (4.31 b). There was very noticeable decrease
in peak area at 30◦C (4.31 c). There appeared a new prominent peak at RT = 7.1, 7.2
and 6.75 min at all the temperatures (25, 30, 37◦C), indicating formation of some new
metabolite by the consortium A. In figure 4.31 d at 37◦C, a small peak for TCP at RT =
1.77 min was noticed and its absence at other temperatures could be due to its rapid
mineralization by the bacteria in the culture as has been confirmed in experiments with
TCP degradation by the HPLC chromatograms given in figure 4.38.
Ab
sorb
ance
(m
AU
)
Ab
sorb
ance
(m
AU
)
Ab
sorb
ance
(m
AU
)
Ab
sorb
ance
(m
AU
)
Retention time (min) Retention time (min)
Retention time (min) Retention time (min)
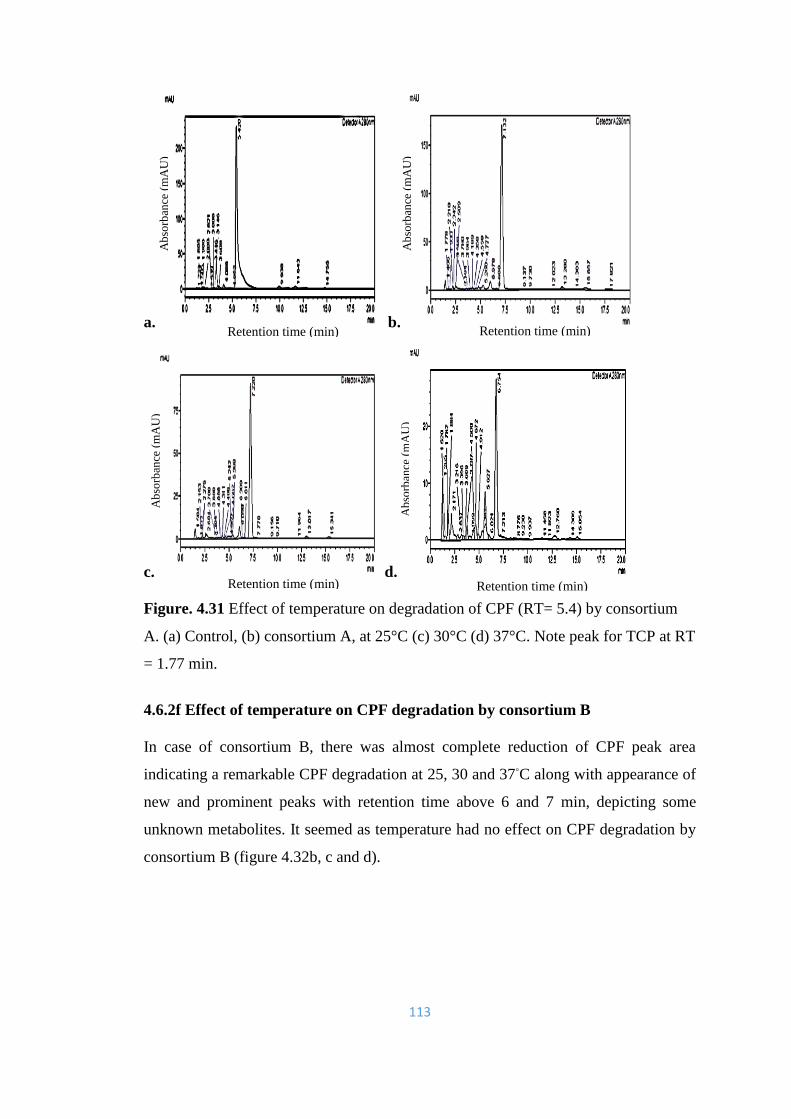
113
a. b.
c. d.
Figure. 4.31 Effect of temperature on degradation of CPF (RT= 5.4) by consortium
A. (a) Control, (b) consortium A, at 25°C (c) 30°C (d) 37°C. Note peak for TCP at RT
= 1.77 min.
4.6.2f Effect of temperature on CPF degradation by consortium B
In case of consortium B, there was almost complete reduction of CPF peak area
indicating a remarkable CPF degradation at 25, 30 and 37◦C along with appearance of
new and prominent peaks with retention time above 6 and 7 min, depicting some
unknown metabolites. It seemed as temperature had no effect on CPF degradation by
consortium B (figure 4.32b, c and d).
Ab
sorb
ance
(m
AU
)
Ab
sorb
ance
(m
AU
)
Ab
sorb
ance
(m
AU
)
Ab
sorb
ance
(m
AU
)
Retention time (min) Retention time (min)
Retention time (min) Retention time (min)
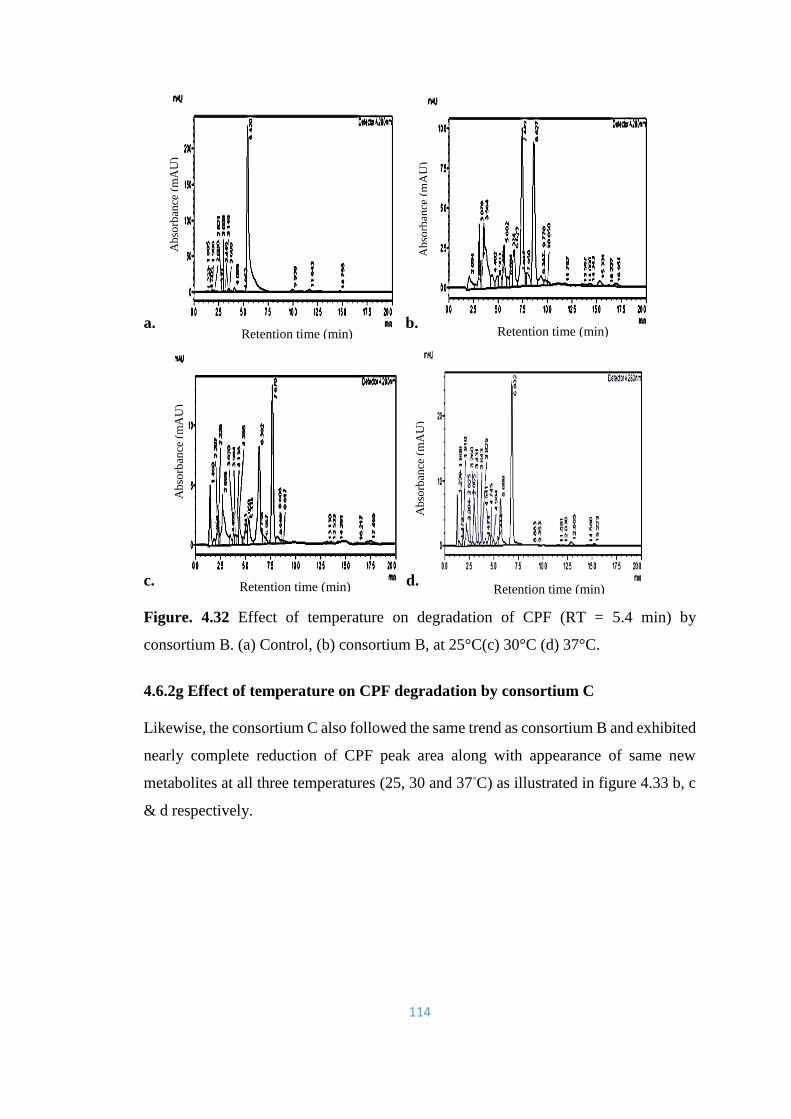
114
a. b.
c. d.
Figure. 4.32 Effect of temperature on degradation of CPF (RT = 5.4 min) by
consortium B. (a) Control, (b) consortium B, at 25°C(c) 30°C (d) 37°C.
4.6.2g Effect of temperature on CPF degradation by consortium C
Likewise, the consortium C also followed the same trend as consortium B and exhibited
nearly complete reduction of CPF peak area along with appearance of same new
metabolites at all three temperatures (25, 30 and 37◦C) as illustrated in figure 4.33 b, c
& d respectively.
Ab
sorb
ance
(m
AU
)
Ab
sorb
ance
(m
AU
)
Ab
sorb
ance
(m
AU
)
Ab
sorb
ance
(m
AU
)
Retention time (min) Retention time (min)
Retention time (min) Retention time (min)
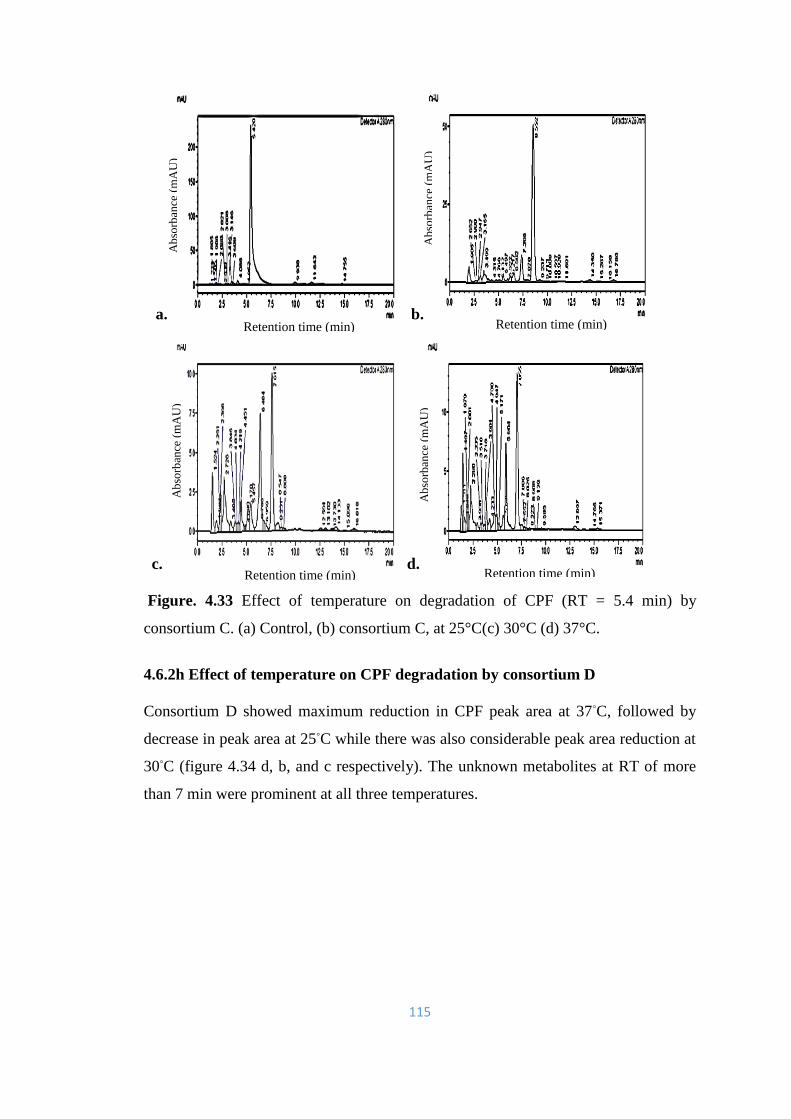
115
a. b.
c. d.
Figure. 4.33 Effect of temperature on degradation of CPF (RT = 5.4 min) by
consortium C. (a) Control, (b) consortium C, at 25°C(c) 30°C (d) 37°C.
4.6.2h Effect of temperature on CPF degradation by consortium D
Consortium D showed maximum reduction in CPF peak area at 37◦C, followed by
decrease in peak area at 25◦C while there was also considerable peak area reduction at
30◦C (figure 4.34 d, b, and c respectively). The unknown metabolites at RT of more
than 7 min were prominent at all three temperatures.
Ab
sorb
ance
(m
AU
)
Ab
sorb
ance
(m
AU
)
Ab
sorb
ance
(m
AU
)
Ab
sorb
ance
(m
AU
)
Retention time (min) Retention time (min)
Retention time (min) Retention time (min)
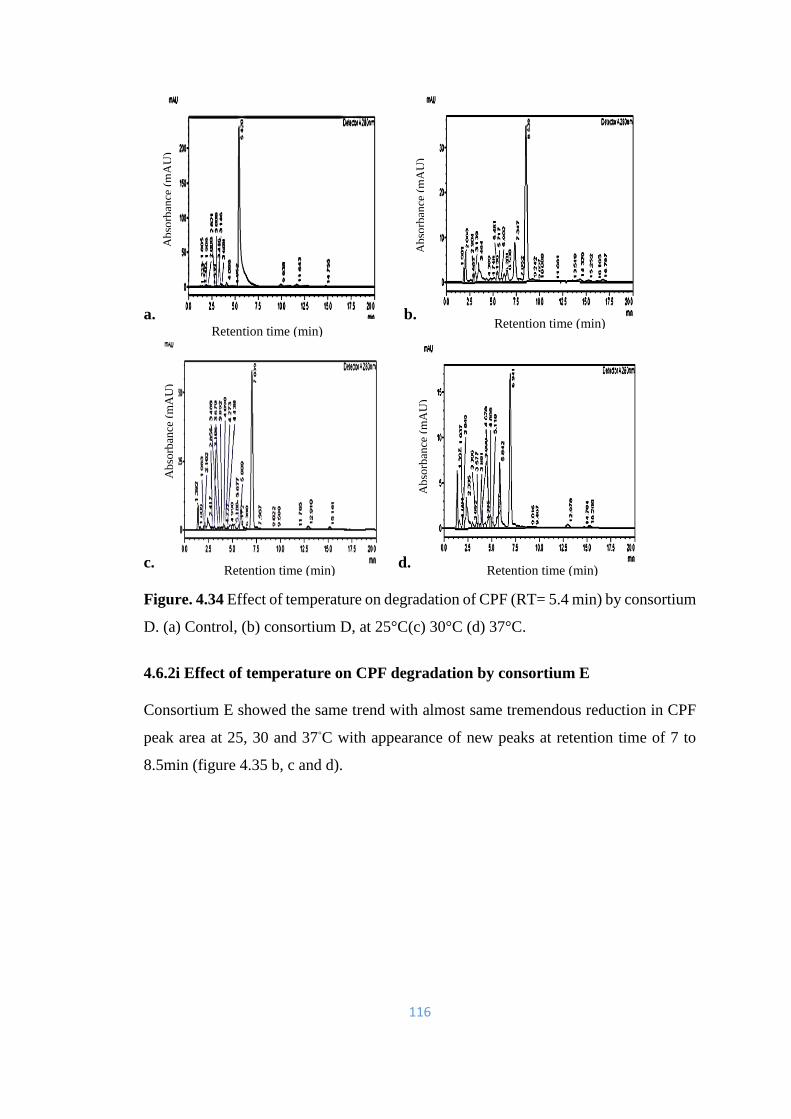
116
a. b.
c. d.
Figure. 4.34 Effect of temperature on degradation of CPF (RT= 5.4 min) by consortium
D. (a) Control, (b) consortium D, at 25°C(c) 30°C (d) 37°C.
4.6.2i Effect of temperature on CPF degradation by consortium E
Consortium E showed the same trend with almost same tremendous reduction in CPF
peak area at 25, 30 and 37◦C with appearance of new peaks at retention time of 7 to
8.5min (figure 4.35 b, c and d).
Ab
sorb
ance
(m
AU
)
Ab
sorb
ance
(m
AU
)
Ab
sorb
ance
(m
AU
)
Ab
sorb
ance
(m
AU
)
Retention time (min) Retention time (min)
Retention time (min) Retention time (min)

117
a. b.
c. d.
Figure. 4.35 Effect of temperature on degradation of CPF (RT= 5.4 min) by consortium
E. (a) Control, (b) consortium E, at 25°C(c) 30°C (d) 37°C.
4.6.2j Effect of temperature on CPF degradation by consortium F
Consortium F behaved similarly and exhibited almost complete reduction of CPF peak
area at 25, 30 and 37◦C thus indicating excellent results for CPF degradation at all
temperatures along with presence of same peaks of metabolites as described in above
consortia (figure 4.36 b, c and d).
Ab
sorb
ance
(m
AU
)
Ab
sorb
ance
(m
AU
)
Ab
sorb
ance
(m
AU
)
Ab
sorb
ance
(m
AU
)
Retention time (min) Retention time (min)
Retention time (min) Retention time (min)
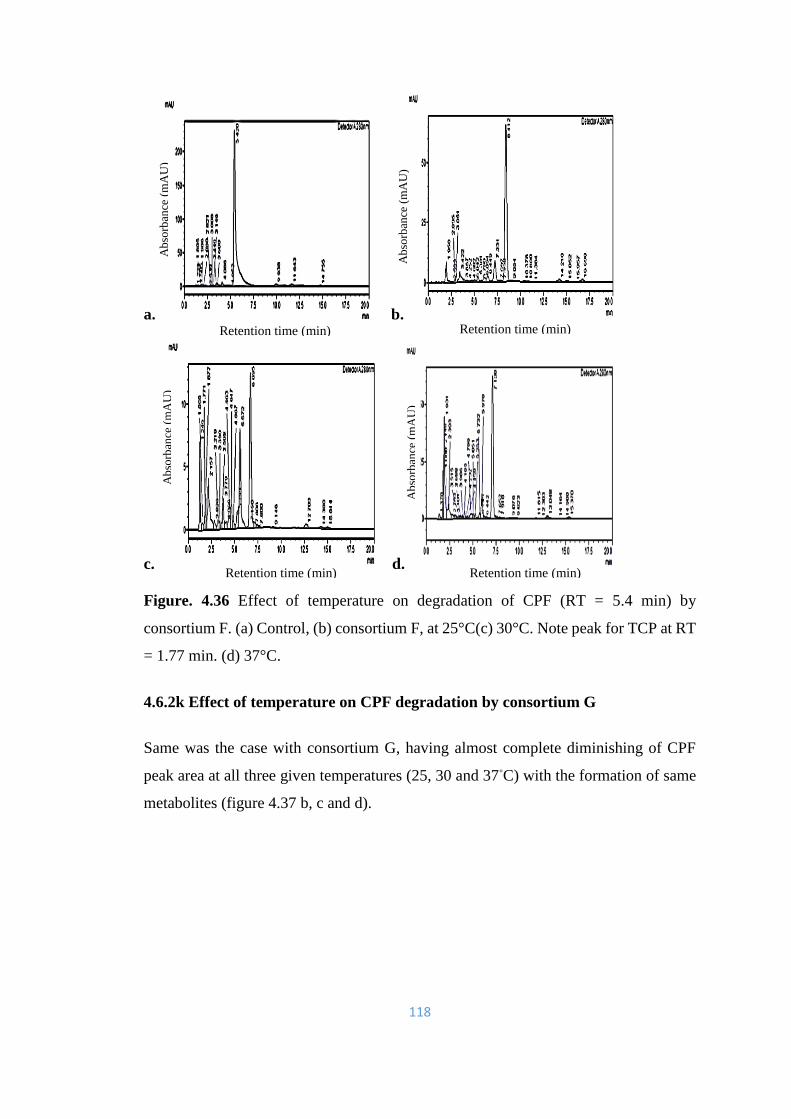
118
a. b.
c. d.
Figure. 4.36 Effect of temperature on degradation of CPF (RT = 5.4 min) by
consortium F. (a) Control, (b) consortium F, at 25°C(c) 30°C. Note peak for TCP at RT
= 1.77 min. (d) 37°C.
4.6.2k Effect of temperature on CPF degradation by consortium G
Same was the case with consortium G, having almost complete diminishing of CPF
peak area at all three given temperatures (25, 30 and 37◦C) with the formation of same
metabolites (figure 4.37 b, c and d).
Ab
sorb
ance
(m
AU
)
Ab
sorb
ance
(m
AU
)
Ab
sorb
ance
(m
AU
)
Ab
sorb
ance
(m
AU
)
Retention time (min) Retention time (min)
Retention time (min) Retention time (min)

119
a. b.
c. d.
Figure. 4.37 Effect of temperature on degradation of CPF (RT= 5.4 min) by consortium
G. (a) Control, (b) consortium G, at 25°C(c) 30°C (d) 37°C.
4.6.3 Degradation of 3, 5, 6-Trichloropyridinol (14mg/l) by four isolates after72
hrs incubation
In case of all isolates, there was great reduction in TCP peak area and thus maximum
degradation of TCP (14 mg/l) after 72 hrs of incubation. Some new peaks with different
retention times can also be seen in the chromatogram indicating the new metabolites
formed by TCP degradation (figure 4.38b, c, d, e).
Ab
sorb
ance
(m
AU
)
Ab
sorb
ance
(m
AU
)
Ab
sorb
ance
(m
AU
)
Ab
sorb
ance
(m
AU
)
Retention time (min) Retention time (min)
Retention time (min) Retention time (min)
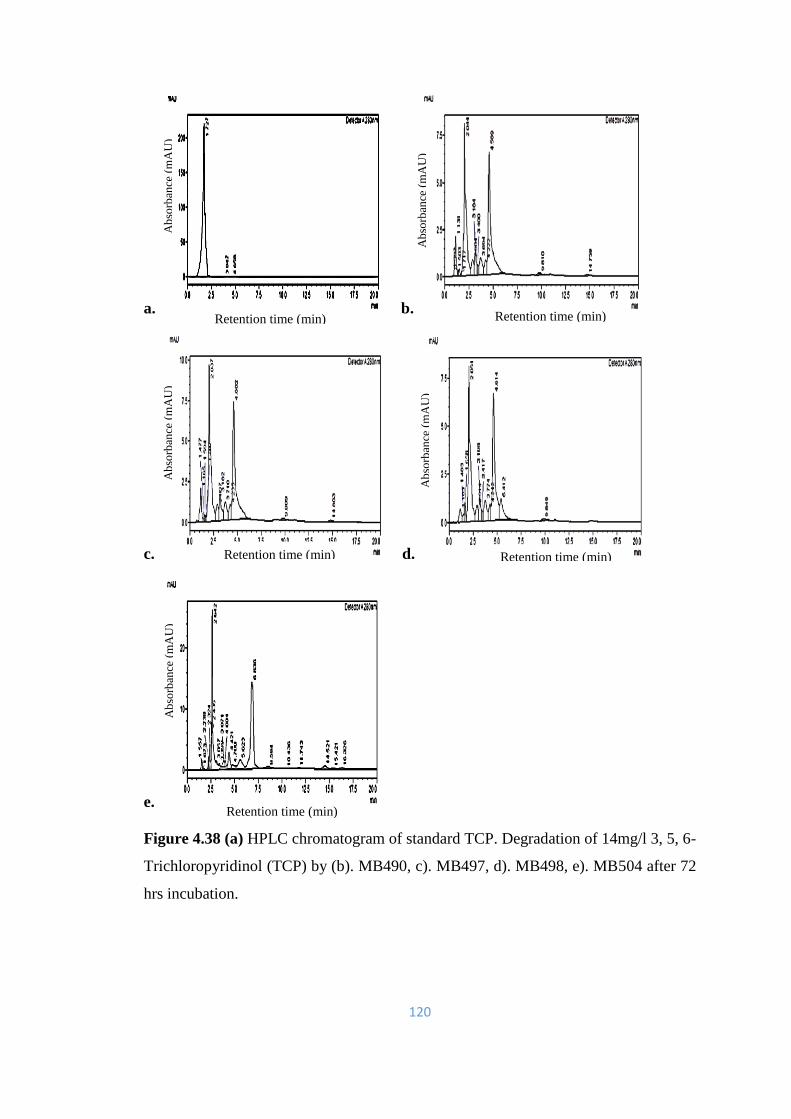
120
a. b.
c. d.
e.
Figure 4.38 (a) HPLC chromatogram of standard TCP. Degradation of 14mg/l 3, 5, 6-
Trichloropyridinol (TCP) by (b). MB490, c). MB497, d). MB498, e). MB504 after 72
hrs incubation.
Ab
sorb
ance
(m
AU
)
Ab
sorb
ance
(m
AU
)
Ab
sorb
ance
(m
AU
)
Ab
sorb
ance
(m
AU
)
Ab
sorb
ance
(m
AU
)
Retention time (min) Retention time (min)
Retention time (min) Retention time (min)
Retention time (min)
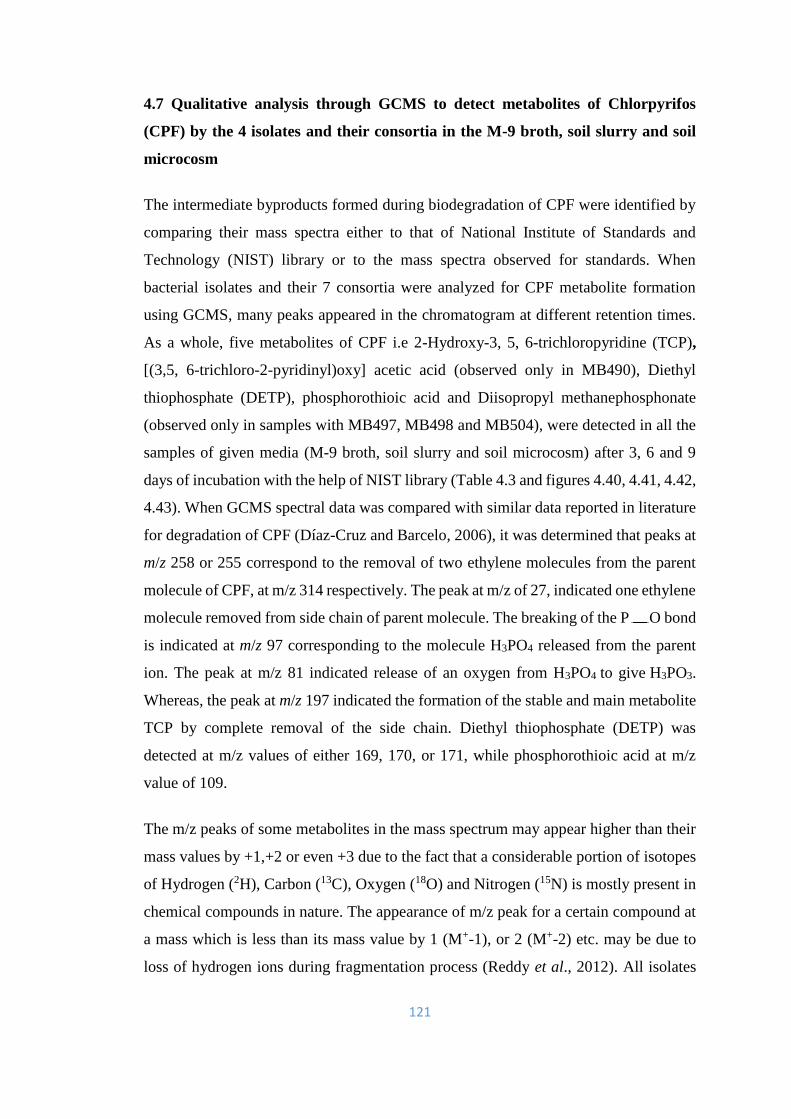
121
4.7 Qualitative analysis through GCMS to detect metabolites of Chlorpyrifos
(CPF) by the 4 isolates and their consortia in the M-9 broth, soil slurry and soil
microcosm
The intermediate byproducts formed during biodegradation of CPF were identified by
comparing their mass spectra either to that of National Institute of Standards and
Technology (NIST) library or to the mass spectra observed for standards. When
bacterial isolates and their 7 consortia were analyzed for CPF metabolite formation
using GCMS, many peaks appeared in the chromatogram at different retention times.
As a whole, five metabolites of CPF i.e 2-Hydroxy-3, 5, 6-trichloropyridine (TCP),
[(3,5, 6-trichloro-2-pyridinyl)oxy] acetic acid (observed only in MB490), Diethyl
thiophosphate (DETP), phosphorothioic acid and Diisopropyl methanephosphonate
(observed only in samples with MB497, MB498 and MB504), were detected in all the
samples of given media (M-9 broth, soil slurry and soil microcosm) after 3, 6 and 9
days of incubation with the help of NIST library (Table 4.3 and figures 4.40, 4.41, 4.42,
4.43). When GCMS spectral data was compared with similar data reported in literature
for degradation of CPF (Díaz-Cruz and Barcelo, 2006), it was determined that peaks at
m/z 258 or 255 correspond to the removal of two ethylene molecules from the parent
molecule of CPF, at m/z 314 respectively. The peak at m/z of 27, indicated one ethylene
molecule removed from side chain of parent molecule. The breaking of the P O bond
is indicated at m/z 97 corresponding to the molecule H3PO4 released from the parent
ion. The peak at m/z 81 indicated release of an oxygen from H3PO4 to give H3PO3.
Whereas, the peak at m/z 197 indicated the formation of the stable and main metabolite
TCP by complete removal of the side chain. Diethyl thiophosphate (DETP) was
detected at m/z values of either 169, 170, or 171, while phosphorothioic acid at m/z
value of 109.
The m/z peaks of some metabolites in the mass spectrum may appear higher than their
mass values by +1,+2 or even +3 due to the fact that a considerable portion of isotopes
of Hydrogen (2H), Carbon (13C), Oxygen (18O) and Nitrogen (15N) is mostly present in
chemical compounds in nature. The appearance of m/z peak for a certain compound at
a mass which is less than its mass value by 1 (M+-1), or 2 (M+-2) etc. may be due to
loss of hydrogen ions during fragmentation process (Reddy et al., 2012). All isolates
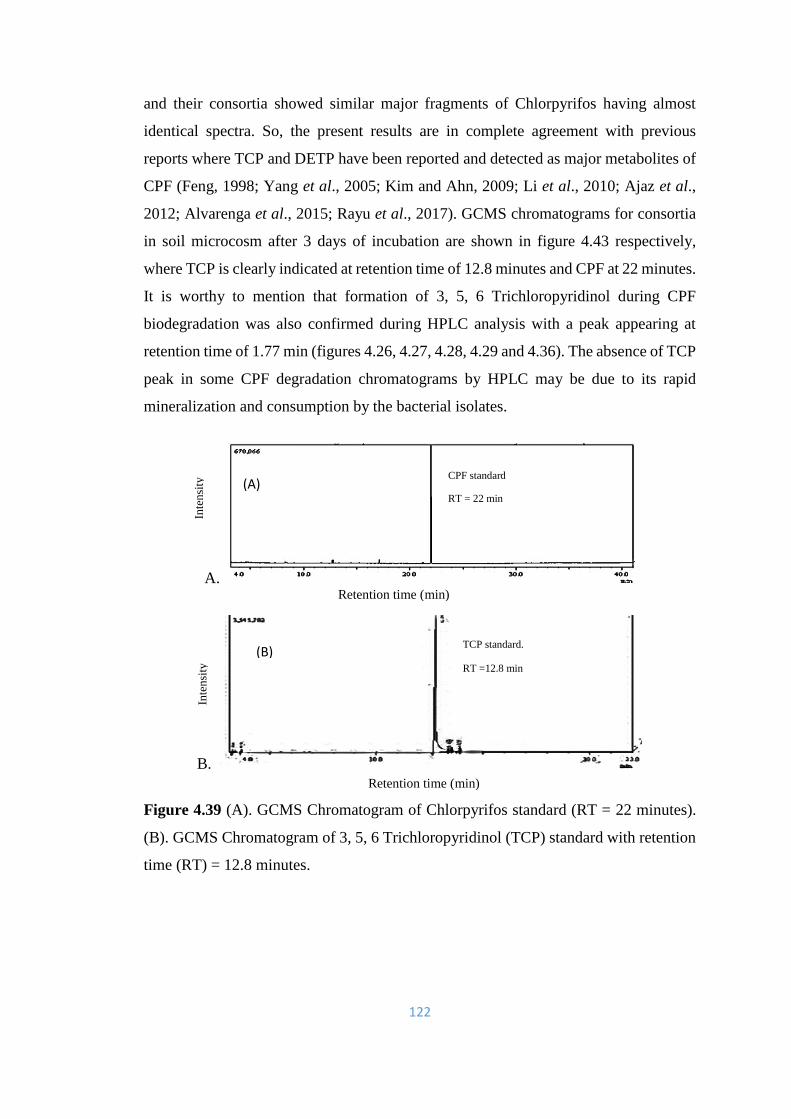
122
and their consortia showed similar major fragments of Chlorpyrifos having almost
identical spectra. So, the present results are in complete agreement with previous
reports where TCP and DETP have been reported and detected as major metabolites of
CPF (Feng, 1998; Yang et al., 2005; Kim and Ahn, 2009; Li et al., 2010; Ajaz et al.,
2012; Alvarenga et al., 2015; Rayu et al., 2017). GCMS chromatograms for consortia
in soil microcosm after 3 days of incubation are shown in figure 4.43 respectively,
where TCP is clearly indicated at retention time of 12.8 minutes and CPF at 22 minutes.
It is worthy to mention that formation of 3, 5, 6 Trichloropyridinol during CPF
biodegradation was also confirmed during HPLC analysis with a peak appearing at
retention time of 1.77 min (figures 4.26, 4.27, 4.28, 4.29 and 4.36). The absence of TCP
peak in some CPF degradation chromatograms by HPLC may be due to its rapid
mineralization and consumption by the bacterial isolates.
A.
B.
Figure 4.39 (A). GCMS Chromatogram of Chlorpyrifos standard (RT = 22 minutes).
(B). GCMS Chromatogram of 3, 5, 6 Trichloropyridinol (TCP) standard with retention
time (RT) = 12.8 minutes.
Retention time (min)
CPF standard
RT = 22 min
TCP standard.
RT =12.8 min
Retention time (min)
Inte
nsi
ty
Inte
nsi
ty
(A)
(B)
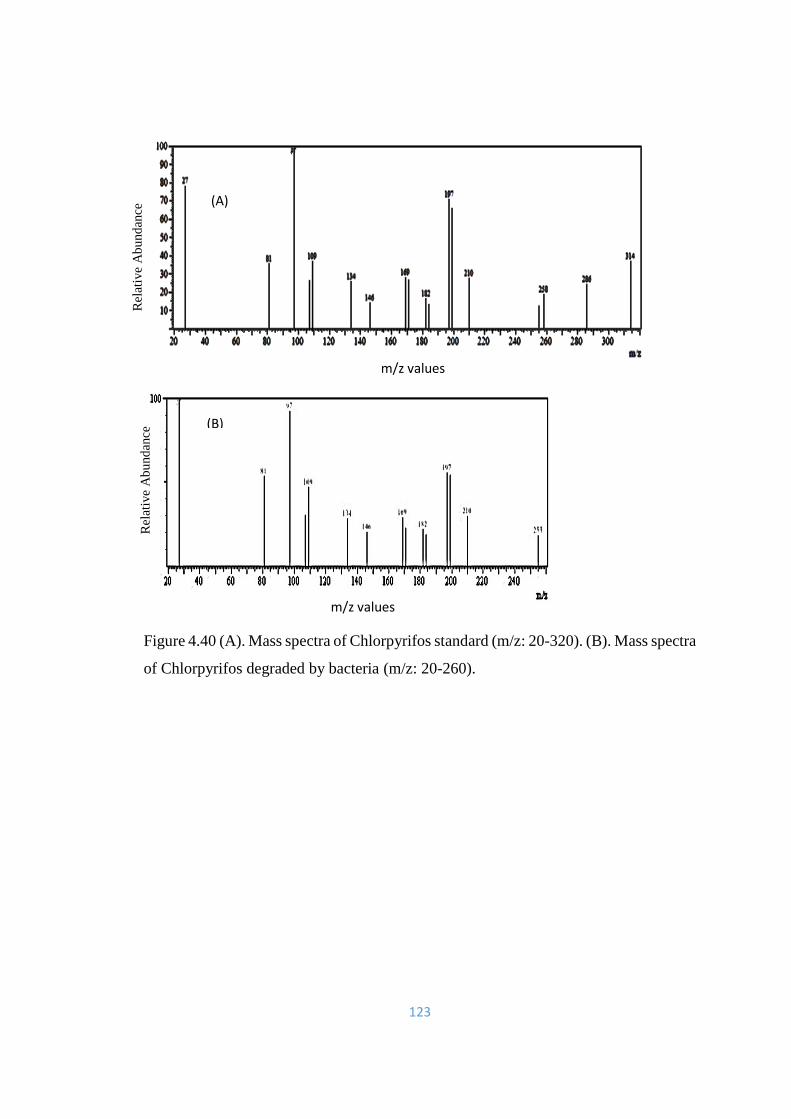
123
Figure 4.40 (A). Mass spectra of Chlorpyrifos standard (m/z: 20-320). (B). Mass spectra
of Chlorpyrifos degraded by bacteria (m/z: 20-260).
m/z values
m/z values
Rel
ativ
e A
bu
nd
ance
R
elat
ive
Ab
und
ance
(A)
(B)
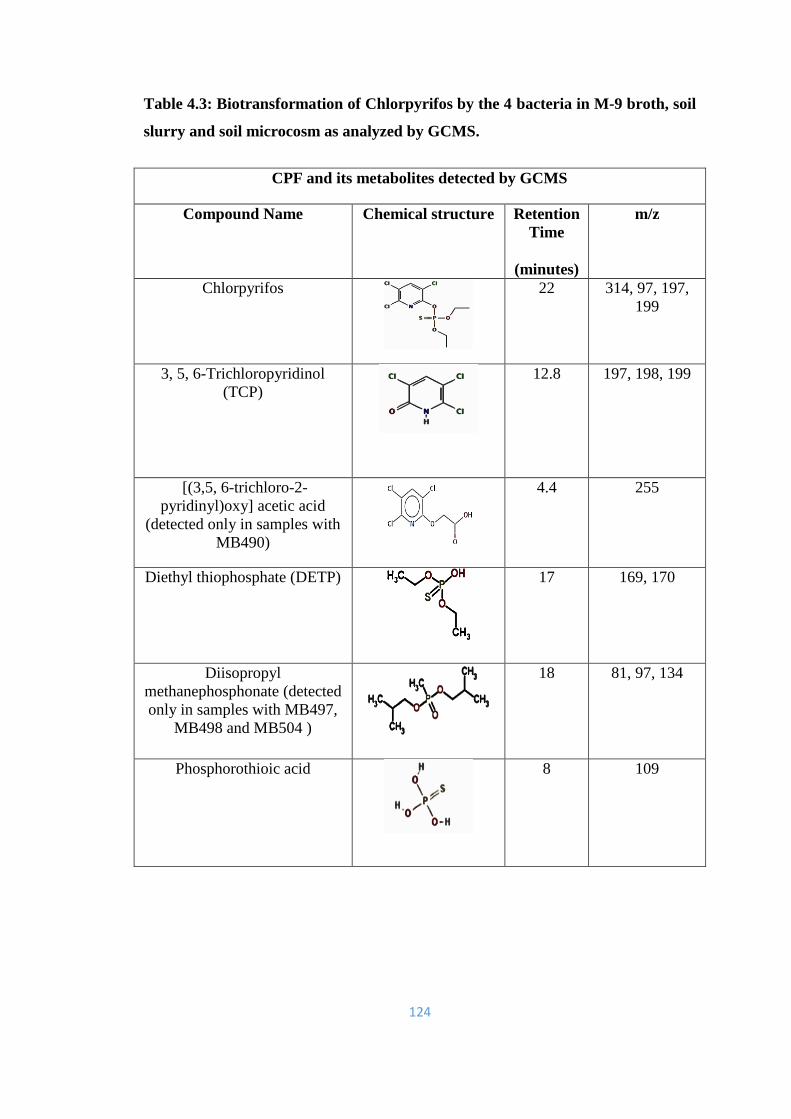
124
Table 4.3: Biotransformation of Chlorpyrifos by the 4 bacteria in M-9 broth, soil
slurry and soil microcosm as analyzed by GCMS.
CPF and its metabolites detected by GCMS
Compound Name Chemical structure Retention
Time
(minutes)
m/z
Chlorpyrifos
22 314, 97, 197,
199
3, 5, 6-Trichloropyridinol
(TCP)
12.8
197, 198, 199
[(3,5, 6-trichloro-2-
pyridinyl)oxy] acetic acid
(detected only in samples with
MB490)
4.4 255
Diethyl thiophosphate (DETP)
17 169, 170
Diisopropyl
methanephosphonate (detected
only in samples with MB497,
MB498 and MB504 )
18 81, 97, 134
Phosphorothioic acid
8 109
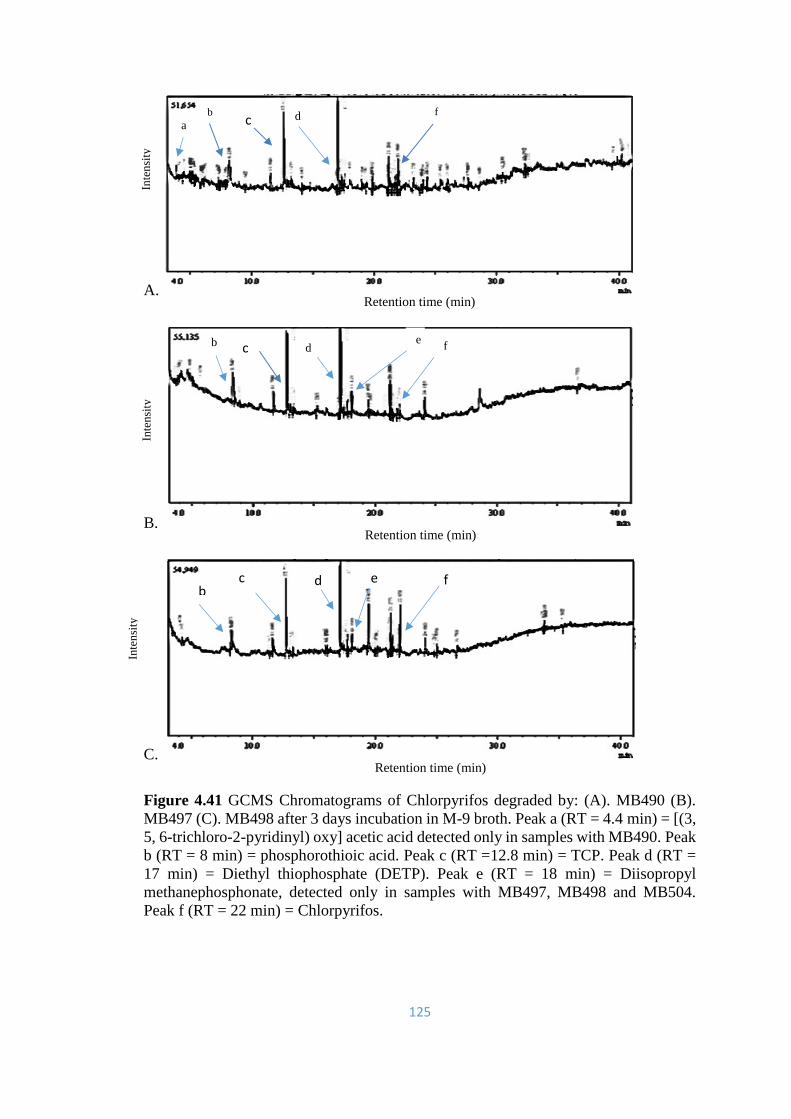
125
A.
B.
C.
Figure 4.41 GCMS Chromatograms of Chlorpyrifos degraded by: (A). MB490 (B).
MB497 (C). MB498 after 3 days incubation in M-9 broth. Peak a (RT = 4.4 min) = [(3,
5, 6-trichloro-2-pyridinyl) oxy] acetic acid detected only in samples with MB490. Peak
b (RT = 8 min) = phosphorothioic acid. Peak c (RT =12.8 min) = TCP. Peak d (RT =
17 min) = Diethyl thiophosphate (DETP). Peak e (RT = 18 min) = Diisopropyl
methanephosphonate, detected only in samples with MB497, MB498 and MB504.
Peak f (RT = 22 min) = Chlorpyrifos.
b f
a d
d b e
f
b c e f
c
c
c
d
Retention time (min)
Retention time (min)
Retention time (min)
Inte
nsi
ty
Inte
nsi
ty
Inte
nsi
ty
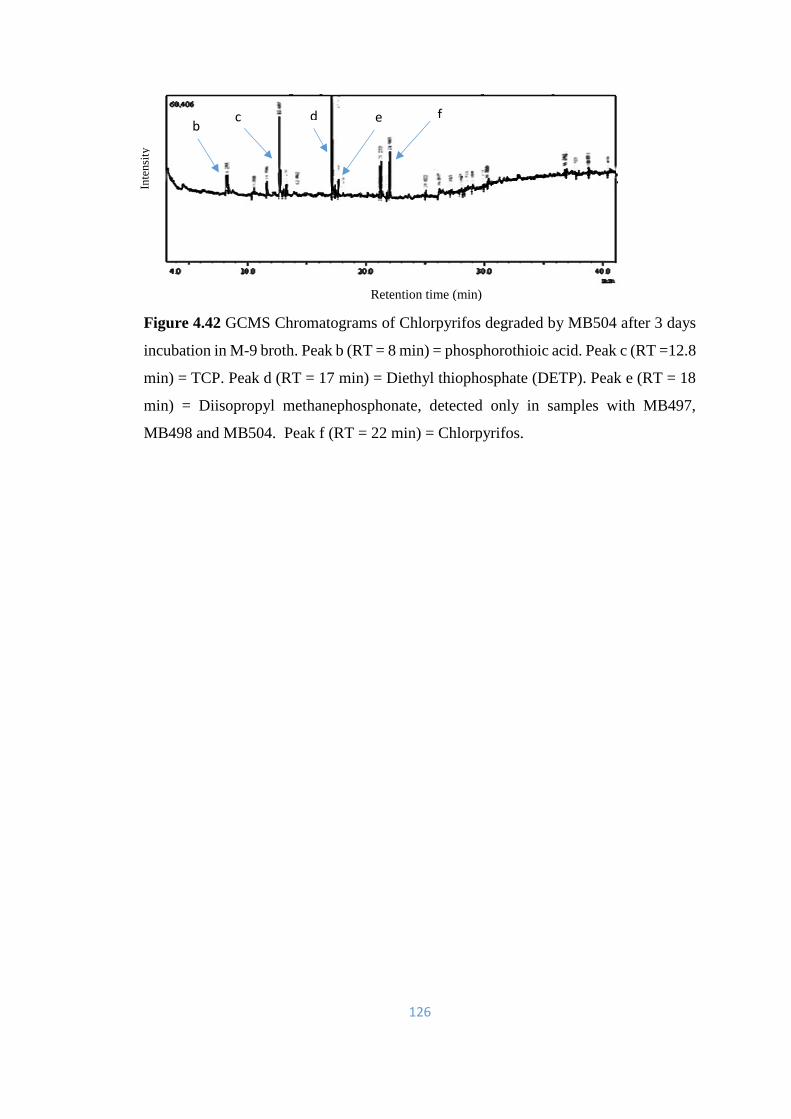
126
Figure 4.42 GCMS Chromatograms of Chlorpyrifos degraded by MB504 after 3 days
incubation in M-9 broth. Peak b (RT = 8 min) = phosphorothioic acid. Peak c (RT =12.8
min) = TCP. Peak d (RT = 17 min) = Diethyl thiophosphate (DETP). Peak e (RT = 18
min) = Diisopropyl methanephosphonate, detected only in samples with MB497,
MB498 and MB504. Peak f (RT = 22 min) = Chlorpyrifos.
b d e f c
Retention time (min)
Inte
nsi
ty
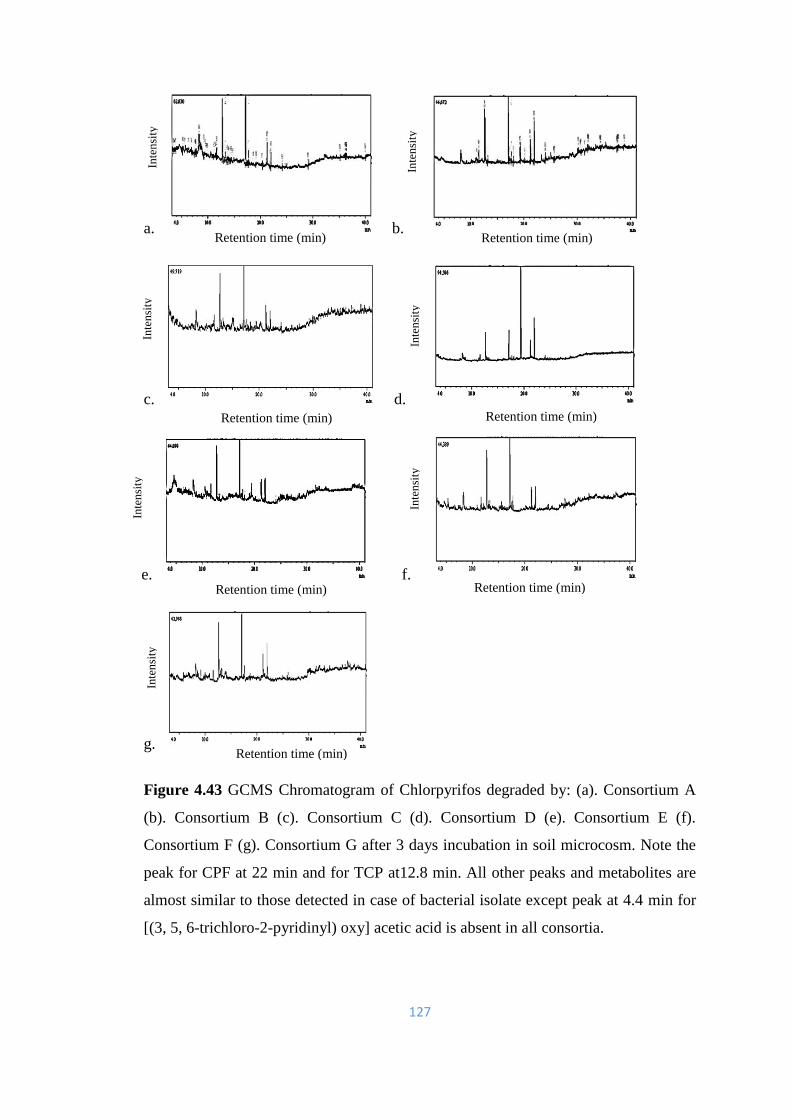
127
a. b.
c. d.
E. e. f.
g.
Figure 4.43 GCMS Chromatogram of Chlorpyrifos degraded by: (a). Consortium A
(b). Consortium B (c). Consortium C (d). Consortium D (e). Consortium E (f).
Consortium F (g). Consortium G after 3 days incubation in soil microcosm. Note the
peak for CPF at 22 min and for TCP at12.8 min. All other peaks and metabolites are
almost similar to those detected in case of bacterial isolate except peak at 4.4 min for
[(3, 5, 6-trichloro-2-pyridinyl) oxy] acetic acid is absent in all consortia.
Retention time (min)
Retention time (min) Retention time (min)
Retention time (min) Retention time (min)
Retention time (min) Retention time (min)
Inte
nsi
ty
Inte
nsi
ty
Inte
nsi
ty
Inte
nsi
ty
Inte
nsi
ty
Inte
nsi
ty
Inte
nsi
ty
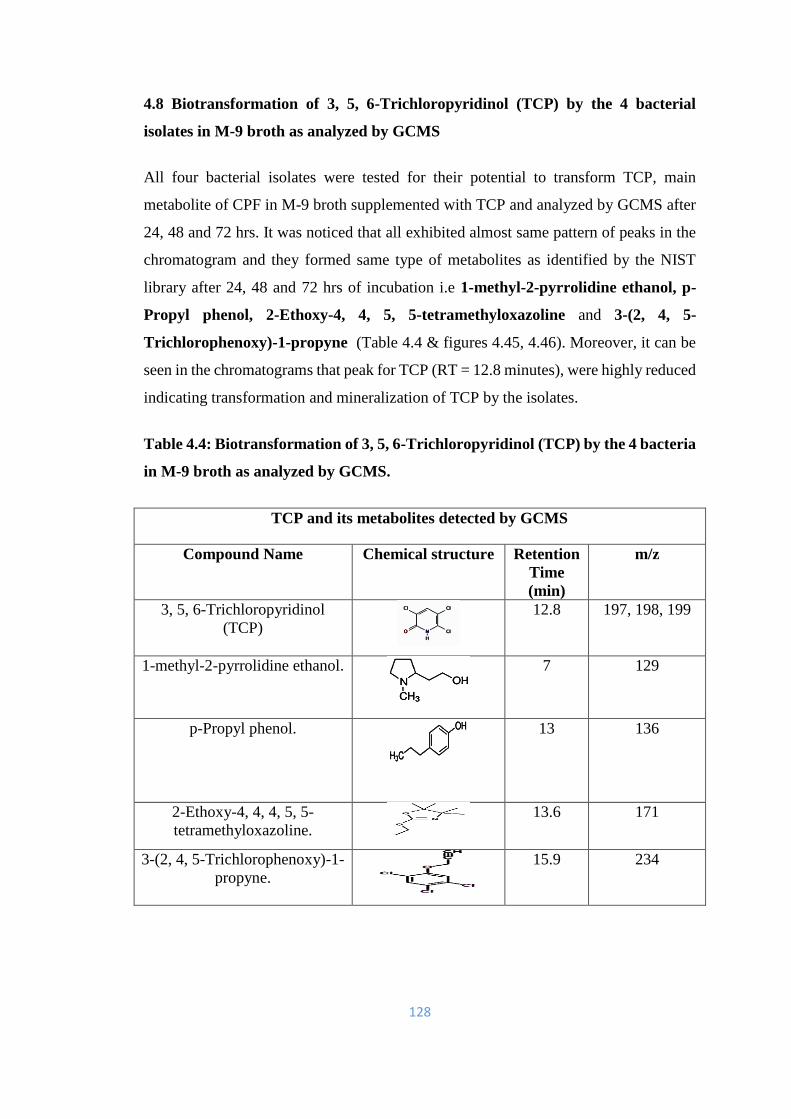
128
4.8 Biotransformation of 3, 5, 6-Trichloropyridinol (TCP) by the 4 bacterial
isolates in M-9 broth as analyzed by GCMS
All four bacterial isolates were tested for their potential to transform TCP, main
metabolite of CPF in M-9 broth supplemented with TCP and analyzed by GCMS after
24, 48 and 72 hrs. It was noticed that all exhibited almost same pattern of peaks in the
chromatogram and they formed same type of metabolites as identified by the NIST
library after 24, 48 and 72 hrs of incubation i.e 1-methyl-2-pyrrolidine ethanol, p-
Propyl phenol, 2-Ethoxy-4, 4, 5, 5-tetramethyloxazoline and 3-(2, 4, 5-
Trichlorophenoxy)-1-propyne (Table 4.4 & figures 4.45, 4.46). Moreover, it can be
seen in the chromatograms that peak for TCP (RT = 12.8 minutes), were highly reduced
indicating transformation and mineralization of TCP by the isolates.
Table 4.4: Biotransformation of 3, 5, 6-Trichloropyridinol (TCP) by the 4 bacteria
in M-9 broth as analyzed by GCMS.
TCP and its metabolites detected by GCMS
Compound Name Chemical structure Retention
Time
(min)
m/z
3, 5, 6-Trichloropyridinol
(TCP)
12.8
197, 198, 199
1-methyl-2-pyrrolidine ethanol.
7
129
p-Propyl phenol.
13
136
2-Ethoxy-4, 4, 4, 5, 5-
tetramethyloxazoline.
13.6 171
3-(2, 4, 5-Trichlorophenoxy)-1-
propyne.
15.9 234
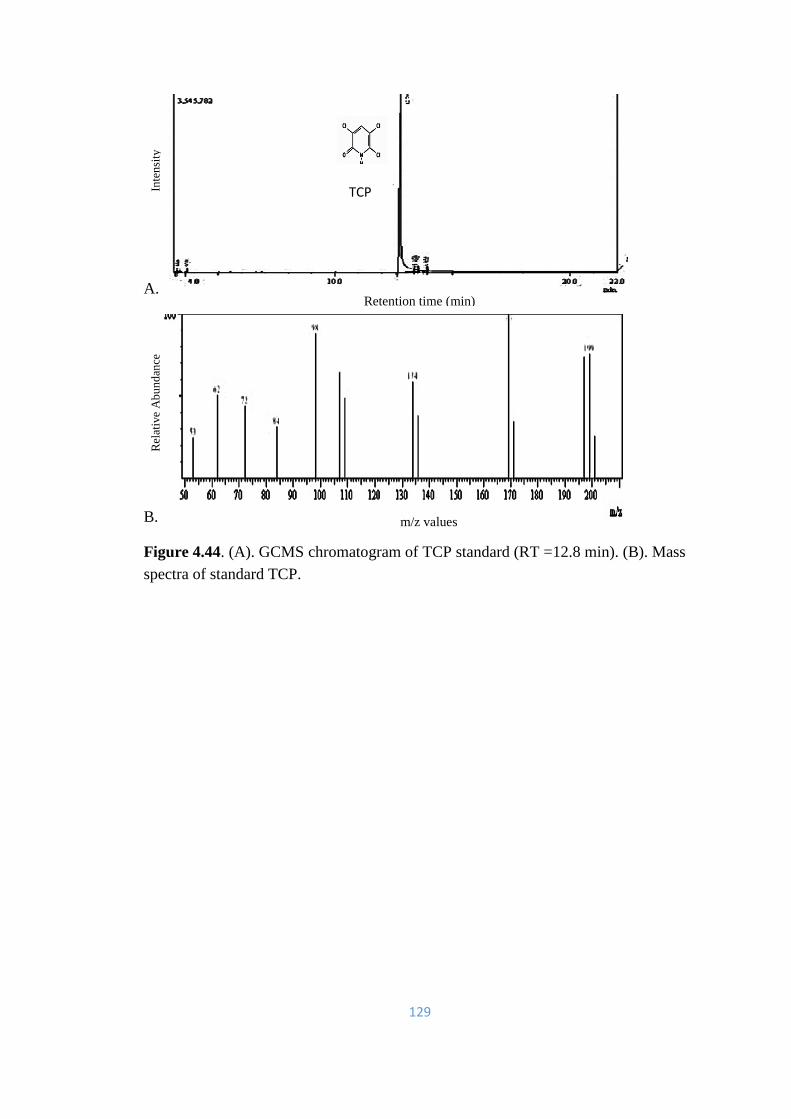
129
A.
B.
Figure 4.44. (A). GCMS chromatogram of TCP standard (RT =12.8 min). (B). Mass
spectra of standard TCP.
Retention time (min)
m/z values
Inte
nsi
ty
Rel
ativ
e A
bu
nd
ance
TCP
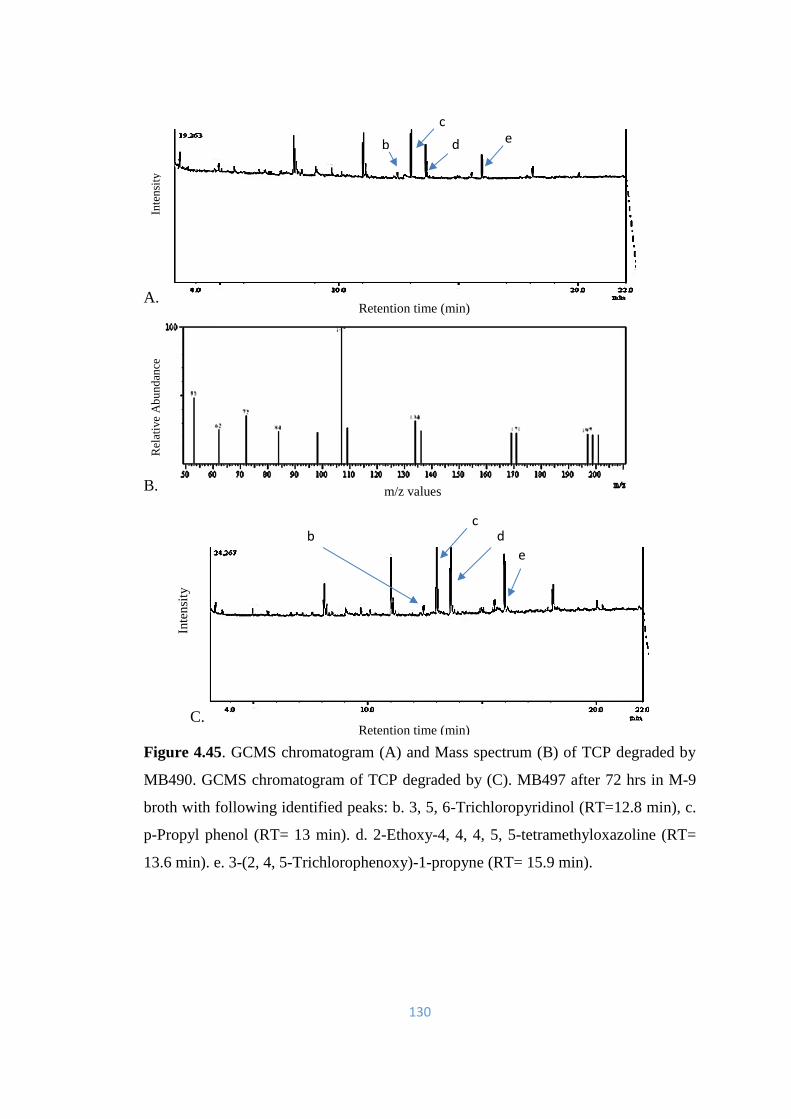
130
A.
B.
C.
Figure 4.45. GCMS chromatogram (A) and Mass spectrum (B) of TCP degraded by
MB490. GCMS chromatogram of TCP degraded by (C). MB497 after 72 hrs in M-9
broth with following identified peaks: b. 3, 5, 6-Trichloropyridinol (RT=12.8 min), c.
p-Propyl phenol (RT= 13 min). d. 2-Ethoxy-4, 4, 4, 5, 5-tetramethyloxazoline (RT=
13.6 min). e. 3-(2, 4, 5-Trichlorophenoxy)-1-propyne (RT= 15.9 min).
b e
b
c
d e
Retention time (min)
Inte
nsi
ty
Retention time (min)
m/z values
Inte
nsi
ty
Rel
ativ
e A
bu
nd
ance
c
e
d
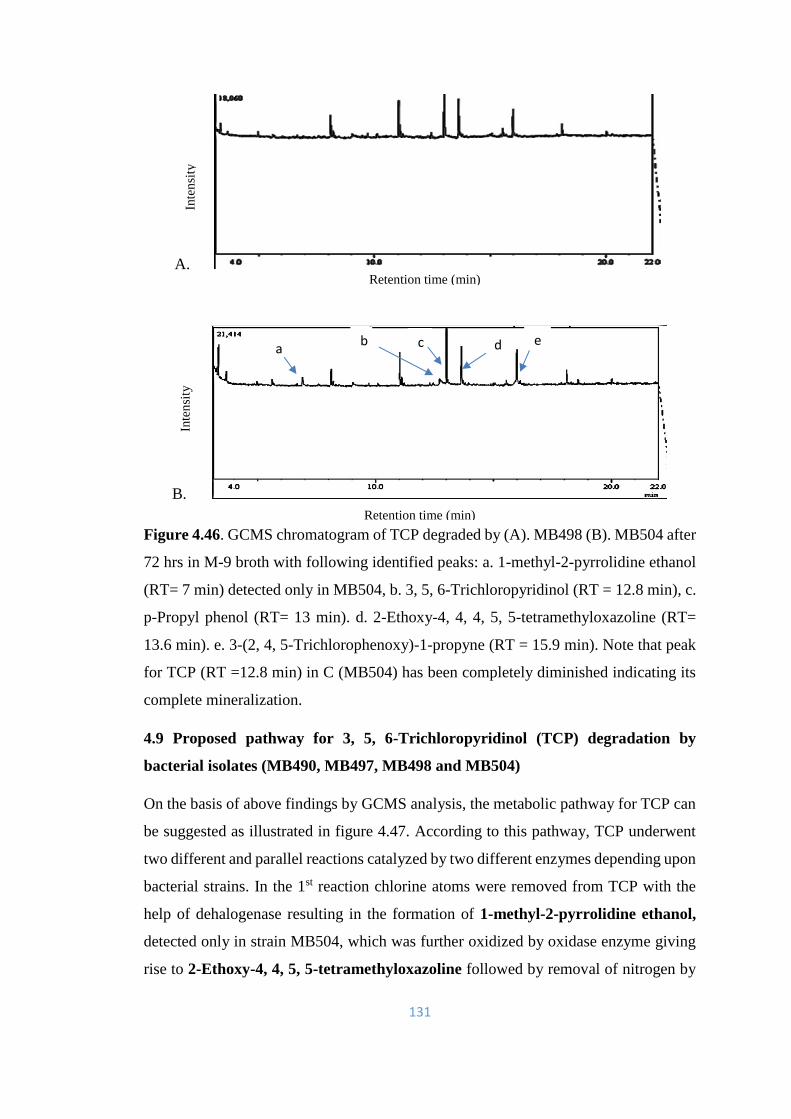
131
A.
B.
Figure 4.46. GCMS chromatogram of TCP degraded by (A). MB498 (B). MB504 after
72 hrs in M-9 broth with following identified peaks: a. 1-methyl-2-pyrrolidine ethanol
(RT= 7 min) detected only in MB504, b. 3, 5, 6-Trichloropyridinol (RT = 12.8 min), c.
p-Propyl phenol (RT= 13 min). d. 2-Ethoxy-4, 4, 4, 5, 5-tetramethyloxazoline (RT=
13.6 min). e. 3-(2, 4, 5-Trichlorophenoxy)-1-propyne (RT = 15.9 min). Note that peak
for TCP (RT =12.8 min) in C (MB504) has been completely diminished indicating its
complete mineralization.
4.9 Proposed pathway for 3, 5, 6-Trichloropyridinol (TCP) degradation by
bacterial isolates (MB490, MB497, MB498 and MB504)
On the basis of above findings by GCMS analysis, the metabolic pathway for TCP can
be suggested as illustrated in figure 4.47. According to this pathway, TCP underwent
two different and parallel reactions catalyzed by two different enzymes depending upon
bacterial strains. In the 1st reaction chlorine atoms were removed from TCP with the
help of dehalogenase resulting in the formation of 1-methyl-2-pyrrolidine ethanol,
detected only in strain MB504, which was further oxidized by oxidase enzyme giving
rise to 2-Ethoxy-4, 4, 5, 5-tetramethyloxazoline followed by removal of nitrogen by
b a c
. d e
Inte
nsi
ty
Inte
nsi
ty
Retention time (min)
Retention time (min)

132
deaminase to give p-Propyl phenol. Similarly in the second parallel reaction in other
three strains, TCP was first converted to 3-(2, 4, 5-Trichlorophenoxy)-1-propyne by
deaminase, followed by removal of three chlorine atoms with the help of dehalogenase
enzyme to form p-Propyl phenol which was ultimately mineralized into CO2 and H2O
(figure 4.46). Li et al. (2010) studied 3, 5, 6-trichloro-2-pyridinol degradation by
Ralstonia sp. strain T6 and identified two metabolites namely 3, 6-dihydroxypyridine-
2, 5-dione and 5-amino-2, 4, 5-trioxopentanoic acid. Many intermediates including 5,
6-DCP, dihydroxypyridine along with pyrrol structures substituted with carboxylic
groups were formed during photocatalytic degradation of TCP (Zabar et al., 2016).
Figure 4.47 Proposed pathway for 3, 5, 6-Trichloropyridinol (TCP) degradation by
bacterial isolates. The metabolite in red box (1-methyl-2-pyrrolidine ethanol) was
observed specifically in samples with MB504.
4.10 Proposed metabolic pathway of Chlorpyrifos degradation by bacterial
isolates (MB490, MB497, MB498 and MB504) and their consortia A, B, C, D, E, F
and G
Based on above mentioned findings by GCMS analysis, a metabolic pathway can be
suggested (figure 4.48) for Chlorpyrifos degradation by bacterial isolates (MB490,
MB497, MB498 and MB504) and their consortia A, B, C, D, E, F and G. The first step
3, 5, 6-trichloropyridinol
1-methyl-2-pyrrolidine ethanol
2-Ethoxy-4, 4, 5, 5-tetramethyloxazoline
3-(2, 4, 5-Trichlorophenoxy)-1-propyne
p-Propyl phenol
Mineralization
Deaminase
Dehalogenase
Dehalogenase
Oxidase
Deaminase
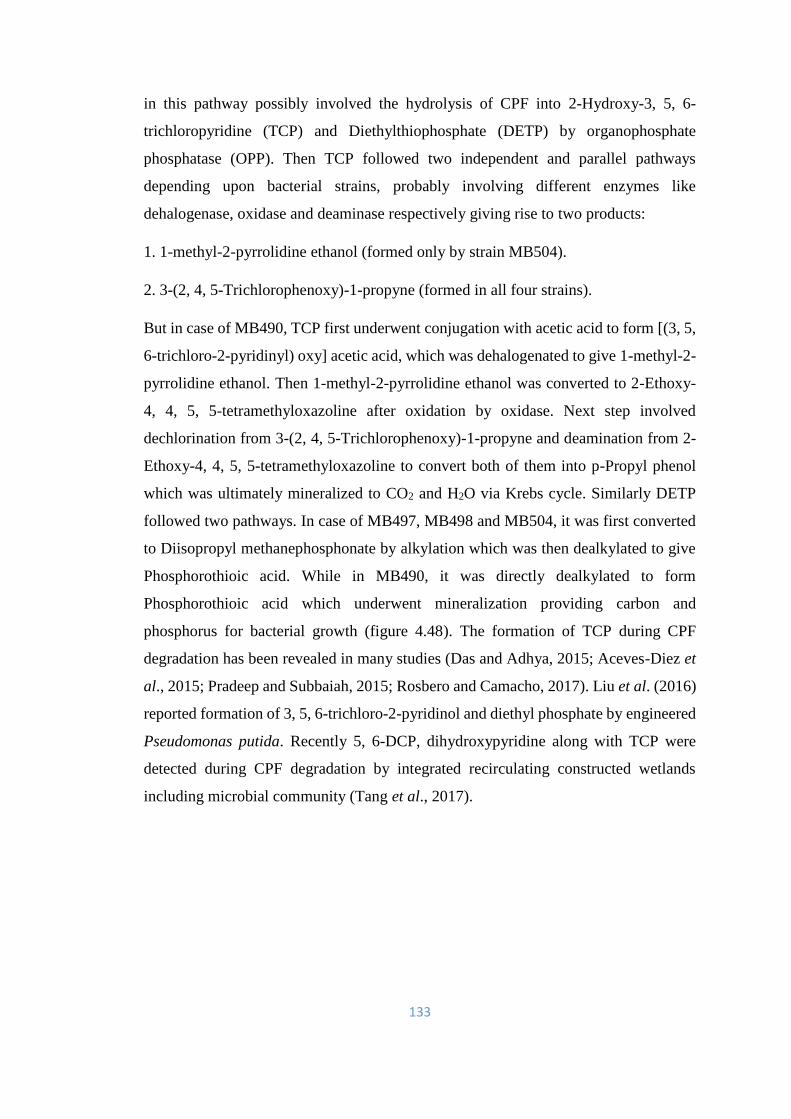
133
in this pathway possibly involved the hydrolysis of CPF into 2-Hydroxy-3, 5, 6-
trichloropyridine (TCP) and Diethylthiophosphate (DETP) by organophosphate
phosphatase (OPP). Then TCP followed two independent and parallel pathways
depending upon bacterial strains, probably involving different enzymes like
dehalogenase, oxidase and deaminase respectively giving rise to two products:
1. 1-methyl-2-pyrrolidine ethanol (formed only by strain MB504).
2. 3-(2, 4, 5-Trichlorophenoxy)-1-propyne (formed in all four strains).
But in case of MB490, TCP first underwent conjugation with acetic acid to form [(3, 5,
6-trichloro-2-pyridinyl) oxy] acetic acid, which was dehalogenated to give 1-methyl-2-
pyrrolidine ethanol. Then 1-methyl-2-pyrrolidine ethanol was converted to 2-Ethoxy-
4, 4, 5, 5-tetramethyloxazoline after oxidation by oxidase. Next step involved
dechlorination from 3-(2, 4, 5-Trichlorophenoxy)-1-propyne and deamination from 2-
Ethoxy-4, 4, 5, 5-tetramethyloxazoline to convert both of them into p-Propyl phenol
which was ultimately mineralized to CO2 and H2O via Krebs cycle. Similarly DETP
followed two pathways. In case of MB497, MB498 and MB504, it was first converted
to Diisopropyl methanephosphonate by alkylation which was then dealkylated to give
Phosphorothioic acid. While in MB490, it was directly dealkylated to form
Phosphorothioic acid which underwent mineralization providing carbon and
phosphorus for bacterial growth (figure 4.48). The formation of TCP during CPF
degradation has been revealed in many studies (Das and Adhya, 2015; Aceves-Diez et
al., 2015; Pradeep and Subbaiah, 2015; Rosbero and Camacho, 2017). Liu et al. (2016)
reported formation of 3, 5, 6-trichloro-2-pyridinol and diethyl phosphate by engineered
Pseudomonas putida. Recently 5, 6-DCP, dihydroxypyridine along with TCP were
detected during CPF degradation by integrated recirculating constructed wetlands
including microbial community (Tang et al., 2017).
134
Figure 4.48. Proposed metabolic pathway of Chlorpyrifos degradation by bacteria.
Metabolite in green box was specific for MB490 and metabolite in yellow box was
noticed in MB497, MB498, and MB504.
Conclusion
Four bacterial strains (Pseudomonas kilonensis MB490, Bacillus thuringiensis MB497,
Pseudomonas kilonensis MB498 and Pseudomonas sp. MB504) and their consortia
proved very efficient for CPF degradation and biotransformation. These strains also
showed the potential to degrade and mineralize TCP. So, keeping in view the prevailing
situation of extensive use of OP pesticides resulting in contamination of agricultural
soil and water resources, these isolated bacterial strains can be applied for the
bioremediation of CPF contaminated places.
Chlorpyrifos
Diethylthiophosphate
Phosphorothioic acid
2-Hydroxy-3,5,6-trichloropyridine
1-methyl-2-pyrrolidine ethanol
2-Ethoxy-4, 4, 5, 5-tetramethyloxazoline
3-(2, 4, 5-Trichlorophenoxy)-1-propyne
p-Propyl phenol
Mineralization
Organophosphate phosphatase
Dehalogenase
Deaminase
Dehalogenase
Oxidase
Deamination
Dealkylation
[(3, 5, 6-trichloro-2-
pyridinyl)oxy] acetic
acid
Diisopropyl
methanephos
phonate
Alkylation
conjugation
135
Chapter 5
Bacterial degradation and transformation of Triazophos (TAP)
Overview
Four bacterial isolates (MB490, MB497, MB498 and MB504) as well as their seven
consortia (A, B, C, D, E, F, and G) were examined for Triazophos (TAP) degradation
and bacterial growth (OD 600nm) at different pHs (6, 7, and 8) and temperatures (25,
30 and 37◦C) after 24 hrs incubation. The Triazophos degradation was also studied in
M-9 broth, soil slurry and soil microcosm after incubating for 1, 3, 6 and 9 days using
HPLC and GCMS for quantitative and qualitative analysis. All the bacterial isolates,
exhibited considerable TAP degradation (70.92 to 86.88%) at all pHs. Strains MB490,
MB497 and MB498 were best at pH 7 while MB504 showed almost equal and
maximum degradation at both pH 6 and pH 8. Strains MB497 and MB498 exhibited
maximum TAP degradation at 25°C, whereas MB490 and MB504 showed best results
at 37°C. Similarly, all the consortia exhibited excellent results for TAP degradation
(91.04 to 99.99%) at all pHs. Consortia A, B, C, F and G showed best degradation at
pH 8, while D and E could degrade maximally at pH 7. Consortia A, B, C, F and G
showed best degradation at 37°C (93.99 to 99.99%), while consortia D and E were
most active at 30 (99.99%) and 25°C (99.40%). Generally both individual isolates and
consortia exhibited more TAP degradation when grown statically. Presence of CPF
improved both TAP degradation and bacterial growth. In M-9 broth, there was 88.4 -
99% TAP degradation, while 98.67 - 99.90% degradation in soil slurry and 90.89 to
99.99% in soil microcosm was observed by bacterial isolates and consortia after 9 days.
During HPLC analysis, retention time (RT) for TAP standard was determined to be 2.4
min, while in GCMS analysis, it increased to 27.8 min. GCMS analysis revealed 7
unique and novel metabolites of TAP according to NIST library i.e 1, 2, 4-Triazole-4—
amine, N-(2-Thienylmethyl), Benzene sulfonic acid hydrazide, Benzene sulfonic acid
methyl ester, 4H-1,2,4-Triazole-4-benzenesulfonamide, 4, 5 dihydro-N-(O-toyl)-3-
furamide, Ethyl 4-phenyldiazenylbenzoate and Dibutyl methanephosphonate. In
general, results revealed the potential of these strains for the degradation/remediation
of TAP contaminated agricultural soils.
136
Background
Triazophos (TAP) is an important OP pesticide which is being extensively used to
protect agricultural crops (paddy rice, cotton, maize and vegetables) from pests
worldwide. There are reports of TAP contamination in soil deposits, water bodies and
food items (Alexis et al., 2001; Li et al., 2008; Ghaffar et al., 2014). As a result of
greater chemical and photochemical stability, TAP has been considered potentially
harmful to aquatic organisms. Zhu et al. (2014) reported the toxic effects of TAP on
the early development of a fish (Gobiocypris rarus) including deformity, slower heart
rate, decreased body length, altered enzymatic functions and changed mRNA levels at
lower concentration (0.05 mg/l for embryos and 0.01 mg/l for larvae). Sharma et al.
(2015) studied harmful effects of triazophos in female Wistar rats and revealed
significant alteration of estrous cycle along with altered activity of various enzymes in
the ovary of treated rats. Triazophos was among most frequently detected pesticides
during 2010-2011 in food samples tested in India (Malik, 2014).
In view of current situation of ever increasing pesticide contamination in environment
and its harmful effects on non-target organisms including humans, bioremediation
using microbes, plants and other organisms has been considered as a less time
consuming, result oriented, economical and ecologically safe technique for clearing up
pollutants from environment. Effective degradation of TAP along with ethoprophos and
fenamiphos by two fungal strains (Fusarium oxysporum and Aspergillus flavus)
isolated from sandy soil was reported (Thabit and El-Naggar, 2014). Bacterial strain
Stenotrophomonas G1 was capable of degrading TAP (50 mg/l) up to 34% during 24
hrs (Deng et al., 2015). Similarly, there had been other reports for the degradation of
TAP by microbes (Dai et al., 2007; Yang et al., 2011; Tang and You, 2012).
The current study was conducted with the objective to investigate the bacterial
degradation of TAP in order to determine the potential of these indigenous bacterial
isolates (MB490, MB497, MB498 and MB504) and their consortia in order to possibly
use them for the remediation of TAP contaminated agricultural soils. For this purpose,
different parameters affecting the growth and degradation activities of the isolate in M-
9 broth, soil slurry as well as in soil microcosm were studied. GCMS analysis was
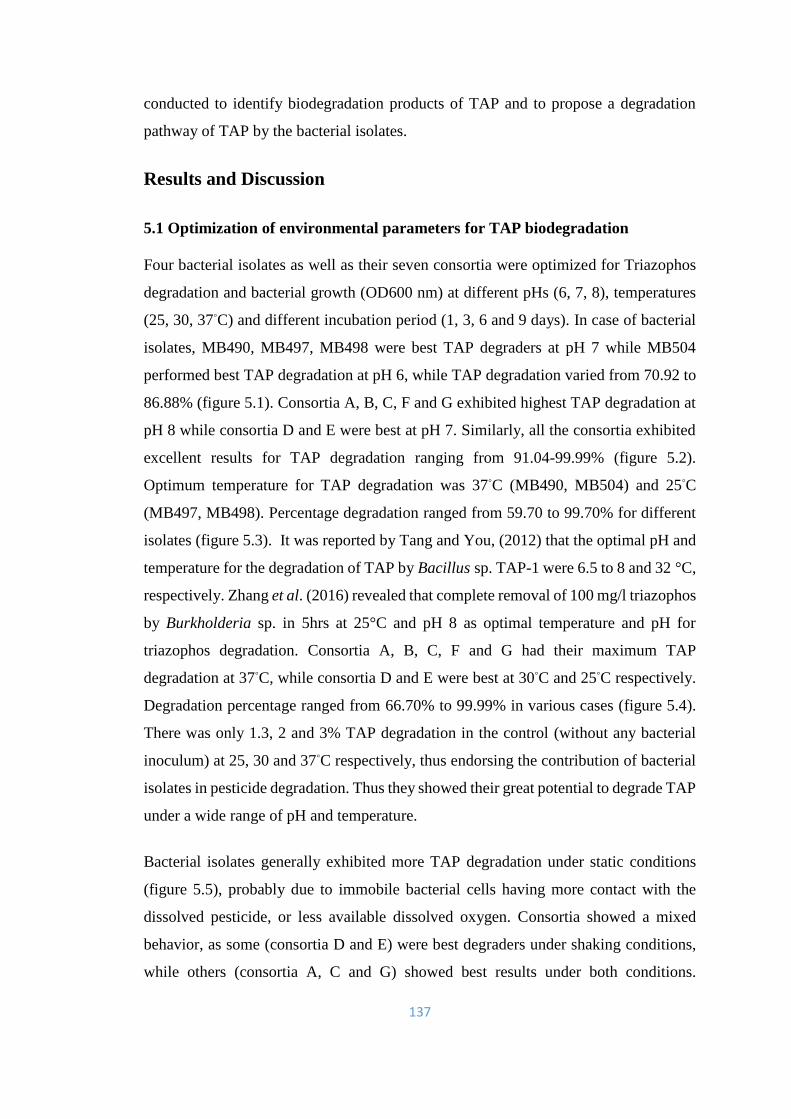
137
conducted to identify biodegradation products of TAP and to propose a degradation
pathway of TAP by the bacterial isolates.
Results and Discussion
5.1 Optimization of environmental parameters for TAP biodegradation
Four bacterial isolates as well as their seven consortia were optimized for Triazophos
degradation and bacterial growth (OD600 nm) at different pHs (6, 7, 8), temperatures
(25, 30, 37◦C) and different incubation period (1, 3, 6 and 9 days). In case of bacterial
isolates, MB490, MB497, MB498 were best TAP degraders at pH 7 while MB504
performed best TAP degradation at pH 6, while TAP degradation varied from 70.92 to
86.88% (figure 5.1). Consortia A, B, C, F and G exhibited highest TAP degradation at
pH 8 while consortia D and E were best at pH 7. Similarly, all the consortia exhibited
excellent results for TAP degradation ranging from 91.04-99.99% (figure 5.2).
Optimum temperature for TAP degradation was 37◦C (MB490, MB504) and 25◦C
(MB497, MB498). Percentage degradation ranged from 59.70 to 99.70% for different
isolates (figure 5.3). It was reported by Tang and You, (2012) that the optimal pH and
temperature for the degradation of TAP by Bacillus sp. TAP-1 were 6.5 to 8 and 32 °C,
respectively. Zhang et al. (2016) revealed that complete removal of 100 mg/l triazophos
by Burkholderia sp. in 5hrs at 25°C and pH 8 as optimal temperature and pH for
triazophos degradation. Consortia A, B, C, F and G had their maximum TAP
degradation at 37◦C, while consortia D and E were best at 30◦C and 25◦C respectively.
Degradation percentage ranged from 66.70% to 99.99% in various cases (figure 5.4).
There was only 1.3, 2 and 3% TAP degradation in the control (without any bacterial
inoculum) at 25, 30 and 37◦C respectively, thus endorsing the contribution of bacterial
isolates in pesticide degradation. Thus they showed their great potential to degrade TAP
under a wide range of pH and temperature.
Bacterial isolates generally exhibited more TAP degradation under static conditions
(figure 5.5), probably due to immobile bacterial cells having more contact with the
dissolved pesticide, or less available dissolved oxygen. Consortia showed a mixed
behavior, as some (consortia D and E) were best degraders under shaking conditions,
while others (consortia A, C and G) showed best results under both conditions.

138
Consortia B and F responded better under static conditions (figure 5.6). There are
reports proving that immobilized cells are much more tolerant to harmful chemicals,
due to which immobilized systems of microbial cells have been predominantly effective
for the removal of pesticide contamination (Ha et al., 2008; Ortiz-Hernandez et al.,
2013). There was little bit more abiotic degradation (5%) under aerobic (shaking)
conditions and only 3% under static conditions probably due to more abiotic oxidation
reactions occurring under agitation.
Figure 5.1. Optical density and % degradation of TAP by four isolates (MB490,
MB497, MB498 and MB504) at different pH after 24 hrs. Error bars represent standard
errors for values of three sample replicates.
Figure 5.2. Optical density and % degradation of TAP by 7 consortia (A, B, C, D, E,
F, and G) at different pH after 24 hrs. Error bars represent standard errors for values
of three sample replicates.
10
30
50
70
90
110
0
0.5
1
1.5
2
2.5
3
3.5
4
pH6 pH7 pH8 pH6 pH7 pH8 pH6 pH7 pH8 pH6 pH7 pH8
MB490 MB497 MB498 MB504
% D
egra
dat
ion
OD
60
0n
m
% Degradation growth
10
30
50
70
90
110
0
0.5
1
1.5
2
2.5
3
6 7 8 6 7 8 6 7 8 6 7 8 6 7 8 6 7 8 6 7 8
A B C D E F G
% D
egra
dat
ion
of
TAP
OD
60
0n
m
pHs% degradation Growth
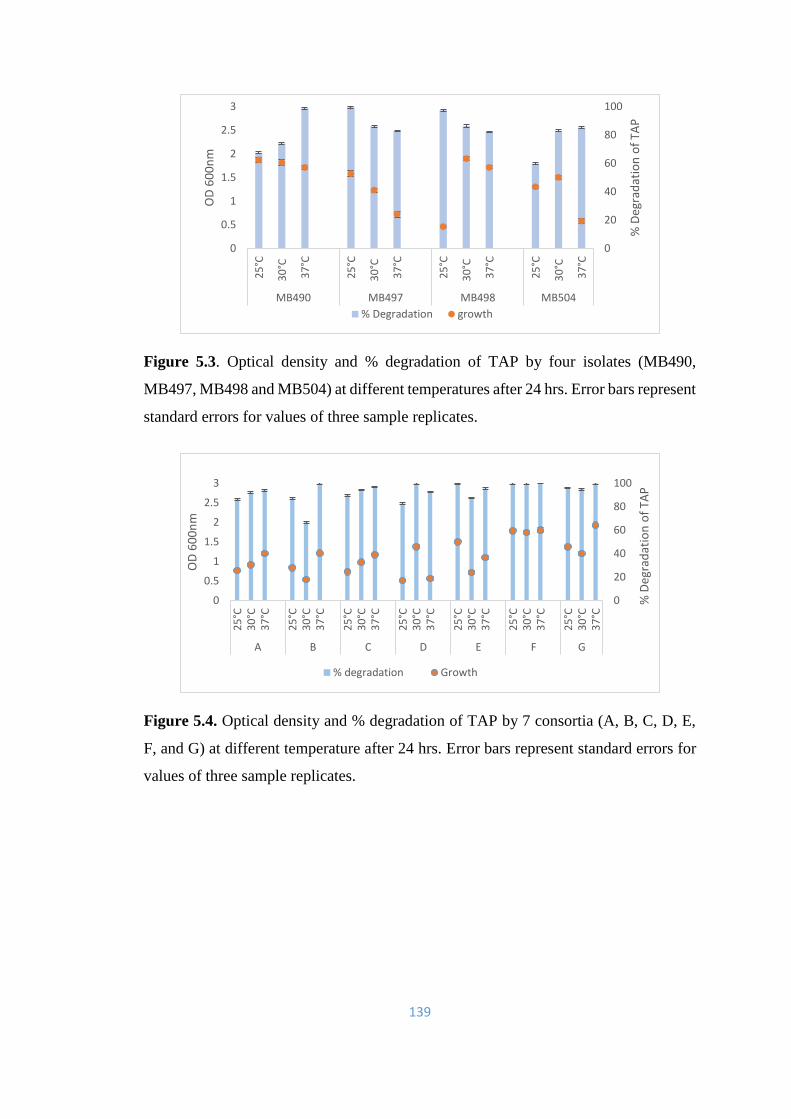
139
Figure 5.3. Optical density and % degradation of TAP by four isolates (MB490,
MB497, MB498 and MB504) at different temperatures after 24 hrs. Error bars represent
standard errors for values of three sample replicates.
Figure 5.4. Optical density and % degradation of TAP by 7 consortia (A, B, C, D, E,
F, and G) at different temperature after 24 hrs. Error bars represent standard errors for
values of three sample replicates.
0
20
40
60
80
100
0
0.5
1
1.5
2
2.5
3
25
°C
30
°C
37
°C
25
°C
30
°C
37
°C
25
°C
30
°C
37
°C
25
°C
30
°C
37
°C
MB490 MB497 MB498 MB504
% D
egra
dat
ion
of
TAP
OD
60
0n
m
% Degradation growth
0
20
40
60
80
100
0
0.5
1
1.5
2
2.5
3
25
°C3
0°C
37
°C
25
°C3
0°C
37
°C
25
°C3
0°C
37
°C
25
°C3
0°C
37
°C
25
°C3
0°C
37
°C
25
°C3
0°C
37
°C
25
°C3
0°C
37
°C
A B C D E F G%
Deg
rad
atio
n o
f TA
P
OD
60
0n
m
% degradation Growth

140
Figure 5.5 Effect of shaking and static conditions on growth and TAP degradation by
bacterial isolates (MB490, MB497, MB498 and MB504). Error bars represent standard
errors for values of three sample replicates.
Figure 5.6 Effect of shaking and static conditions on growth and TAP degradation by
bacterial consortia (A, B, C, D, E, F and G). Error bars represent standard errors for
values of three sample replicates.
5.2 Bacterial growth/ degradation of TAP in the presence of Chlorpyrifos
Four bacterial isolates ((MB490, MB497, MB498, MB504) and consortium G were
cultured in M-9 broth supplemented with 200 mg/l of TAP alone and also with mixture
of TAP and CPF (200 mg/l each). TAP degradation was quantitatively analyzed using
HPLC, after 24 hrs of incubation. The bacterial growth was also checked using UV-
VIS spectrophotometer. It was observed that presence of CPF positively enhanced TAP
10
30
50
70
90
110
0
0.5
1
1.5
2
2.5
3
MB
49
0
MB
49
7
MB
49
8
MB
50
4
MB
49
0
MB
49
7
MB
49
8
MB
50
4
Shaking conditions Static conditions
% D
egra
dat
ion
of
TAP
OD
60
0n
m
%Degradation Growth
10
30
50
70
90
110
0
0.5
1
1.5
2
2.5
3
A B C D E F G A B C D E F G
Shaking conditions Static conditions%
Deg
rad
atio
n
OD
60
0n
m
Incubation conditions
% Degradation Growth
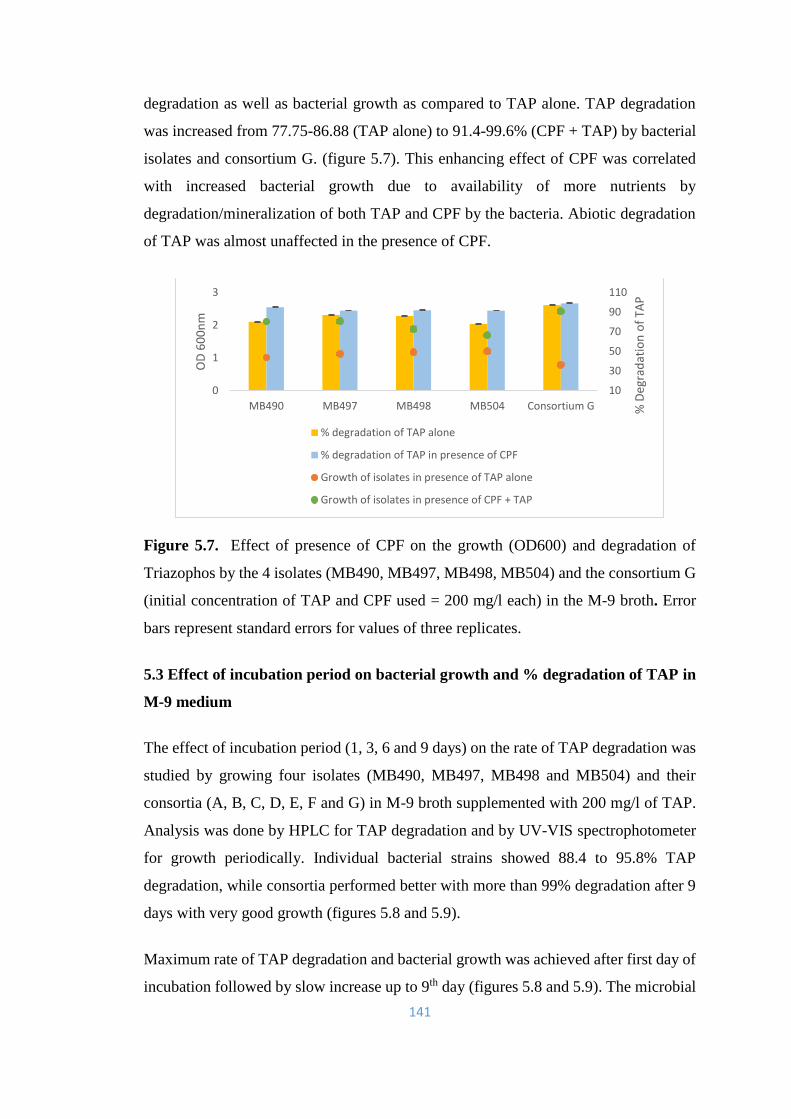
141
degradation as well as bacterial growth as compared to TAP alone. TAP degradation
was increased from 77.75-86.88 (TAP alone) to 91.4-99.6% (CPF + TAP) by bacterial
isolates and consortium G. (figure 5.7). This enhancing effect of CPF was correlated
with increased bacterial growth due to availability of more nutrients by
degradation/mineralization of both TAP and CPF by the bacteria. Abiotic degradation
of TAP was almost unaffected in the presence of CPF.
Figure 5.7. Effect of presence of CPF on the growth (OD600) and degradation of
Triazophos by the 4 isolates (MB490, MB497, MB498, MB504) and the consortium G
(initial concentration of TAP and CPF used = 200 mg/l each) in the M-9 broth. Error
bars represent standard errors for values of three replicates.
5.3 Effect of incubation period on bacterial growth and % degradation of TAP in
M-9 medium
The effect of incubation period (1, 3, 6 and 9 days) on the rate of TAP degradation was
studied by growing four isolates (MB490, MB497, MB498 and MB504) and their
consortia (A, B, C, D, E, F and G) in M-9 broth supplemented with 200 mg/l of TAP.
Analysis was done by HPLC for TAP degradation and by UV-VIS spectrophotometer
for growth periodically. Individual bacterial strains showed 88.4 to 95.8% TAP
degradation, while consortia performed better with more than 99% degradation after 9
days with very good growth (figures 5.8 and 5.9).
Maximum rate of TAP degradation and bacterial growth was achieved after first day of
incubation followed by slow increase up to 9th day (figures 5.8 and 5.9). The microbial
10
30
50
70
90
110
0
1
2
3
MB490 MB497 MB498 MB504 Consortium G % D
egra
dat
ion
of
TAP
OD
60
0n
m
% degradation of TAP alone
% degradation of TAP in presence of CPF
Growth of isolates in presence of TAP alone
Growth of isolates in presence of CPF + TAP
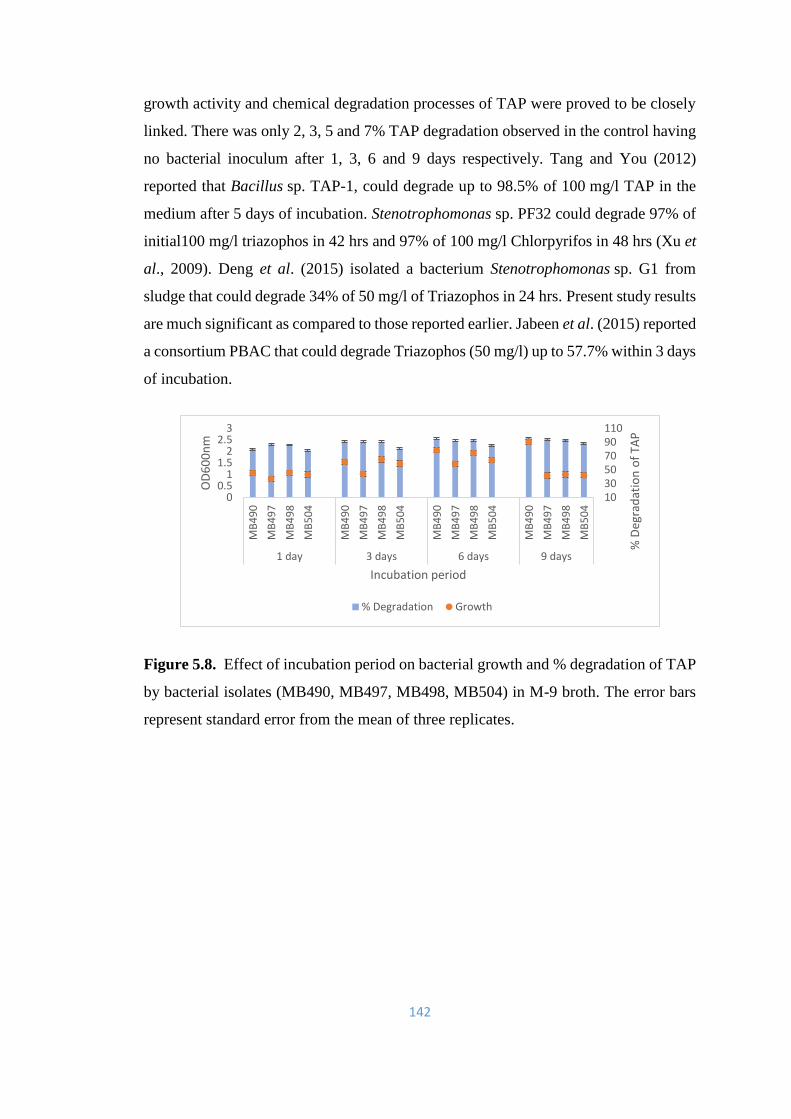
142
growth activity and chemical degradation processes of TAP were proved to be closely
linked. There was only 2, 3, 5 and 7% TAP degradation observed in the control having
no bacterial inoculum after 1, 3, 6 and 9 days respectively. Tang and You (2012)
reported that Bacillus sp. TAP-1, could degrade up to 98.5% of 100 mg/l TAP in the
medium after 5 days of incubation. Stenotrophomonas sp. PF32 could degrade 97% of
initial100 mg/l triazophos in 42 hrs and 97% of 100 mg/l Chlorpyrifos in 48 hrs (Xu et
al., 2009). Deng et al. (2015) isolated a bacterium Stenotrophomonas sp. G1 from
sludge that could degrade 34% of 50 mg/l of Triazophos in 24 hrs. Present study results
are much significant as compared to those reported earlier. Jabeen et al. (2015) reported
a consortium PBAC that could degrade Triazophos (50 mg/l) up to 57.7% within 3 days
of incubation.
Figure 5.8. Effect of incubation period on bacterial growth and % degradation of TAP
by bacterial isolates (MB490, MB497, MB498, MB504) in M-9 broth. The error bars
represent standard error from the mean of three replicates.
1030507090110
00.5
11.5
22.5
3
MB
49
0
MB
49
7
MB
49
8
MB
50
4
MB
49
0
MB
49
7
MB
49
8
MB
50
4
MB
49
0
MB
49
7
MB
49
8
MB
50
4
MB
49
0
MB
49
7
MB
49
8
MB
50
4
1 day 3 days 6 days 9 days
% D
egra
dat
ion
of
TAP
OD
60
0n
m
Incubation period
% Degradation Growth

143
Figure 5.9 Effect of incubation period on the growth and degradation of Triazophos by
the bacterial consortia (A, B, C, D, E, F, and G) in M-9 broth (initial concentration of
TAP used=200 mg/l). Error bars represent standard error from the mean of three
replicates.
5.4 Degradation of Triazophos by the bacterial isolates and their consortia in soil
slurry
The TAP degradation by bacterial isolates and their consortia in soil slurry
supplemented with 200 mg/l of TAP was analyzed using HPLC after 3, 6 and 9 days of
incubation. Maximum TAP degradation (98.67-99.90% and 92.60-99.90%) was
achieved by individual bacterial strains and their consortia respectively in soil slurry
after 9 days of incubation (figure 5.10 and 5.11). Moreover, TAP degradation was most
rapid during first 3 days of incubation in collaboration with bacterial population at peak
growth (Table 5.1), after which it increased slowly reaching highest degradation after
9 days in soil slurry (figure 5.10 and 5.11). Stationary phase of bacterial growth was
observed during 3rd to 9th day indicated by decreased CFU of surviving bacterial cells
(Table 5.2). On contrary, only 2, 4 and 6% TAP degradation in the control was observed
after 3, 6 and 9 days of incubation respectively.
10
30
50
70
90
110
0
0.5
1
1.5
2
2.5
3
A B C D E F G A B C D E F G A B C D E F G A B C D E F G
1 day 3 days 6 days 9 days
% D
egra
dat
ion
of
TAP
OD
60
0n
m
Incubation period% Degradation Growth
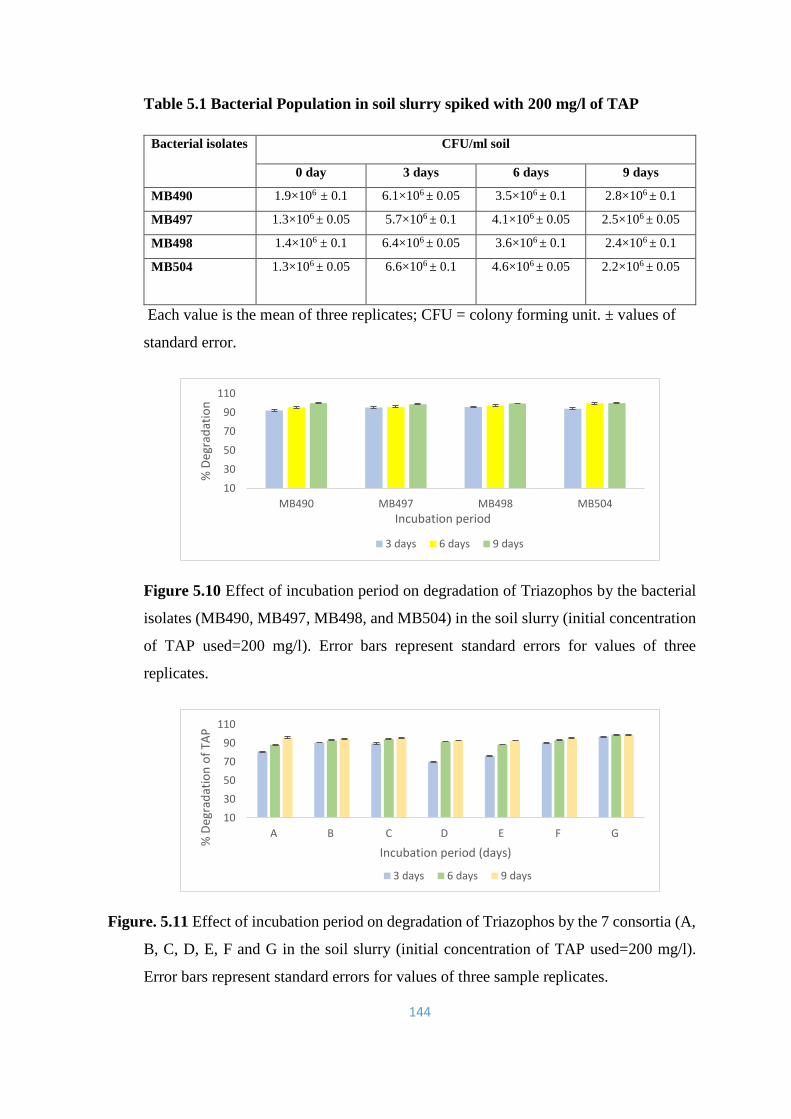
144
Table 5.1 Bacterial Population in soil slurry spiked with 200 mg/l of TAP
Bacterial isolates CFU/ml soil
0 day 3 days 6 days 9 days
MB490 1.9×10⁶ ± 0.1 6.1×10⁶ ± 0.05 3.5×10⁶ ± 0.1 2.8×10⁶ ± 0.1
MB497 1.3×10⁶ ± 0.05 5.7×10⁶ ± 0.1 4.1×10⁶ ± 0.05 2.5×10⁶ ± 0.05
MB498 1.4×10⁶ ± 0.1 6.4×10⁶ ± 0.05 3.6×10⁶ ± 0.1 2.4×10⁶ ± 0.1
MB504 1.3×10⁶ ± 0.05
6.6×10⁶ ± 0.1 4.6×10⁶ ± 0.05 2.2×10⁶ ± 0.05
Each value is the mean of three replicates; CFU = colony forming unit. ± values of
standard error.
Figure 5.10 Effect of incubation period on degradation of Triazophos by the bacterial
isolates (MB490, MB497, MB498, and MB504) in the soil slurry (initial concentration
of TAP used=200 mg/l). Error bars represent standard errors for values of three
replicates.
Figure. 5.11 Effect of incubation period on degradation of Triazophos by the 7 consortia (A,
B, C, D, E, F and G in the soil slurry (initial concentration of TAP used=200 mg/l).
Error bars represent standard errors for values of three sample replicates.
10
30
50
70
90
110
MB490 MB497 MB498 MB504
% D
egra
dat
ion
Incubation period
3 days 6 days 9 days
10
30
50
70
90
110
A B C D E F G
% D
egra
dat
ion
of
TAP
Incubation period (days)
3 days 6 days 9 days
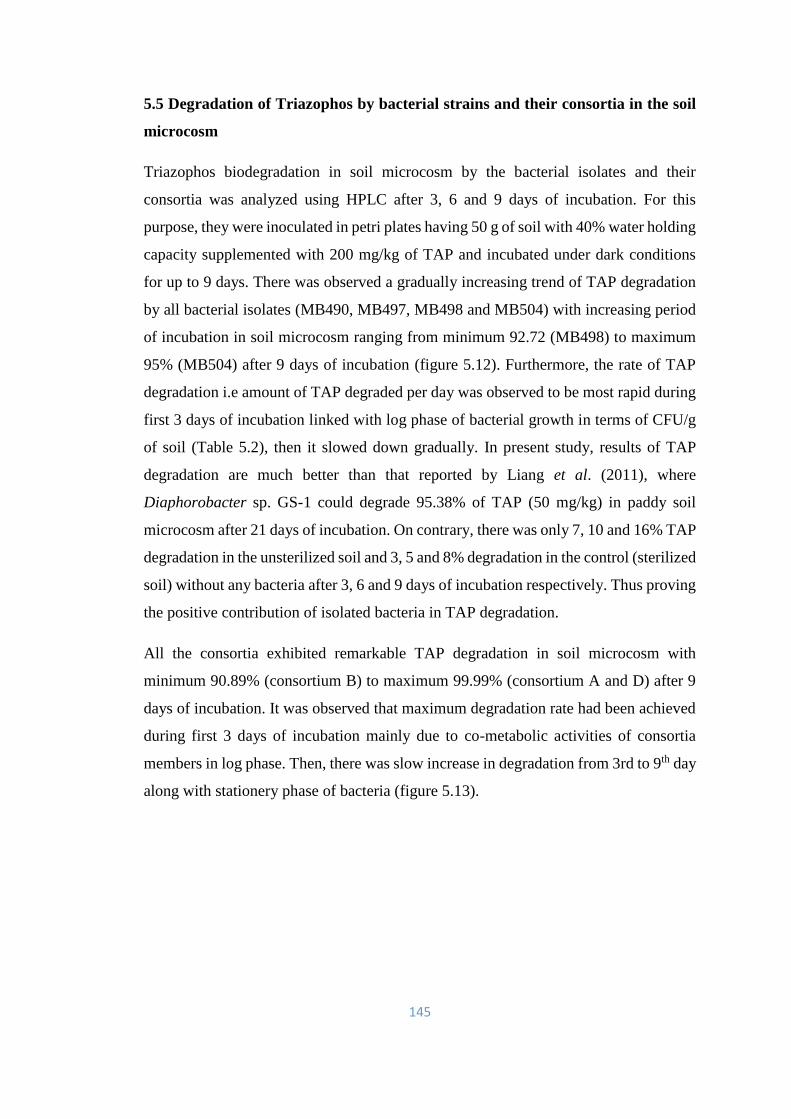
145
5.5 Degradation of Triazophos by bacterial strains and their consortia in the soil
microcosm
Triazophos biodegradation in soil microcosm by the bacterial isolates and their
consortia was analyzed using HPLC after 3, 6 and 9 days of incubation. For this
purpose, they were inoculated in petri plates having 50 g of soil with 40% water holding
capacity supplemented with 200 mg/kg of TAP and incubated under dark conditions
for up to 9 days. There was observed a gradually increasing trend of TAP degradation
by all bacterial isolates (MB490, MB497, MB498 and MB504) with increasing period
of incubation in soil microcosm ranging from minimum 92.72 (MB498) to maximum
95% (MB504) after 9 days of incubation (figure 5.12). Furthermore, the rate of TAP
degradation i.e amount of TAP degraded per day was observed to be most rapid during
first 3 days of incubation linked with log phase of bacterial growth in terms of CFU/g
of soil (Table 5.2), then it slowed down gradually. In present study, results of TAP
degradation are much better than that reported by Liang et al. (2011), where
Diaphorobacter sp. GS-1 could degrade 95.38% of TAP (50 mg/kg) in paddy soil
microcosm after 21 days of incubation. On contrary, there was only 7, 10 and 16% TAP
degradation in the unsterilized soil and 3, 5 and 8% degradation in the control (sterilized
soil) without any bacteria after 3, 6 and 9 days of incubation respectively. Thus proving
the positive contribution of isolated bacteria in TAP degradation.
All the consortia exhibited remarkable TAP degradation in soil microcosm with
minimum 90.89% (consortium B) to maximum 99.99% (consortium A and D) after 9
days of incubation. It was observed that maximum degradation rate had been achieved
during first 3 days of incubation mainly due to co-metabolic activities of consortia
members in log phase. Then, there was slow increase in degradation from 3rd to 9th day
along with stationery phase of bacteria (figure 5.13).
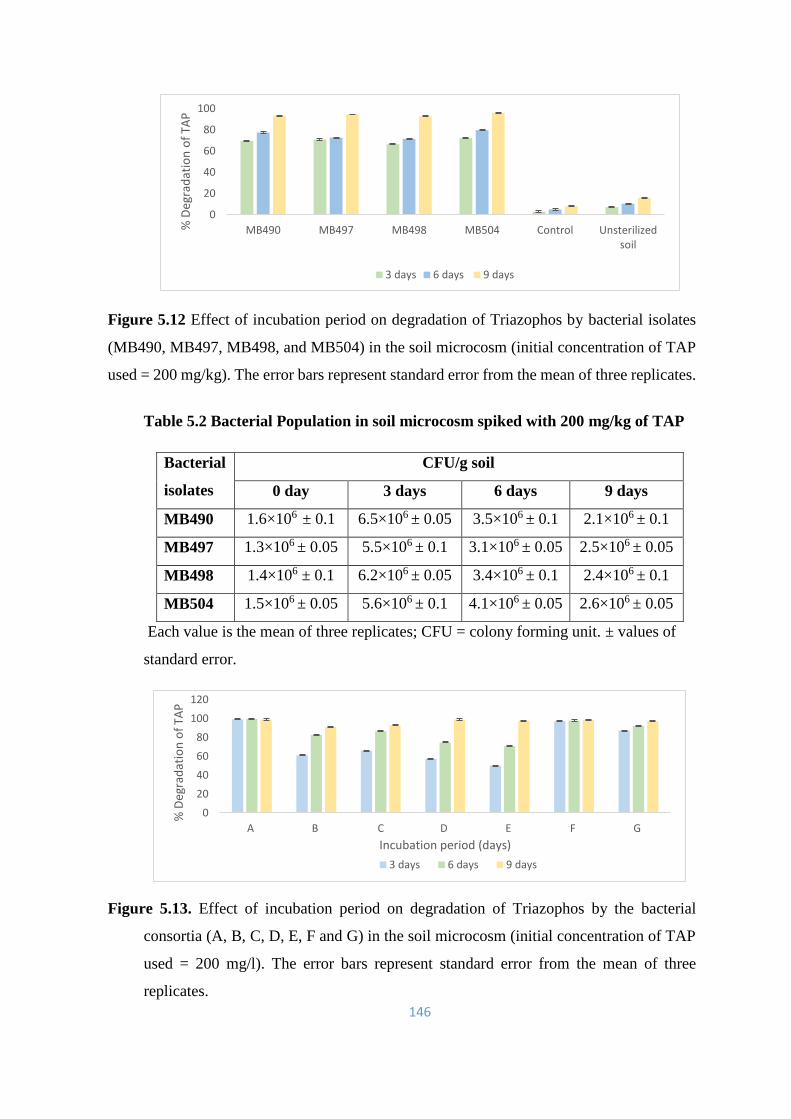
146
Figure 5.12 Effect of incubation period on degradation of Triazophos by bacterial isolates
(MB490, MB497, MB498, and MB504) in the soil microcosm (initial concentration of TAP
used = 200 mg/kg). The error bars represent standard error from the mean of three replicates.
Table 5.2 Bacterial Population in soil microcosm spiked with 200 mg/kg of TAP
Bacterial
isolates
CFU/g soil
0 day 3 days 6 days 9 days
MB490 1.6×10⁶ ± 0.1 6.5×10⁶ ± 0.05 3.5×10⁶ ± 0.1 2.1×10⁶ ± 0.1
MB497 1.3×10⁶ ± 0.05 5.5×10⁶ ± 0.1 3.1×10⁶ ± 0.05 2.5×10⁶ ± 0.05
MB498 1.4×10⁶ ± 0.1 6.2×10⁶ ± 0.05 3.4×10⁶ ± 0.1 2.4×10⁶ ± 0.1
MB504 1.5×10⁶ ± 0.05 5.6×10⁶ ± 0.1 4.1×10⁶ ± 0.05 2.6×10⁶ ± 0.05
Each value is the mean of three replicates; CFU = colony forming unit. ± values of
standard error.
Figure 5.13. Effect of incubation period on degradation of Triazophos by the bacterial
consortia (A, B, C, D, E, F and G) in the soil microcosm (initial concentration of TAP
used = 200 mg/l). The error bars represent standard error from the mean of three
replicates.
0
20
40
60
80
100
MB490 MB497 MB498 MB504 Control Unsterilizedsoil
% D
egra
dat
ion
of
TAP
3 days 6 days 9 days
0
20
40
60
80
100
120
A B C D E F G
% D
egra
dat
ion
of
TAP
Incubation period (days)
3 days 6 days 9 days
147
5.6 Quantitative analysis through HPLC for biodegradation of TAP
5.6.1 Effect of pH on TAP degradation
5.6.1a Effect of pH on TAP degradation by isolate MB490
When TAP degradation by MB490 at different pH was analyzed by HPLC, it was observed
that there was a very sharp decrease in peak area of TAP (RT = 2.4 min) at pH 7 (figure
5.14c) as compared to control (figure 5.14a), corresponding to maximum TAP degradation
at pH 7. Whereas, there was least decrease in peak area (figure 5.14b) and lowest TAP
degradation at pH 6 after 24 hrs of incubation. While, there was considerable decrease in
peak area of TAP at pH 8, thereby indicating considerable degradation as given in (figure
5.14d). Some new peaks appeared at retention time of 1.3, 1.5 and 1.9 min at pH 6, pH 7 and
pH 8 (figure 5.14b, c and d respectively).
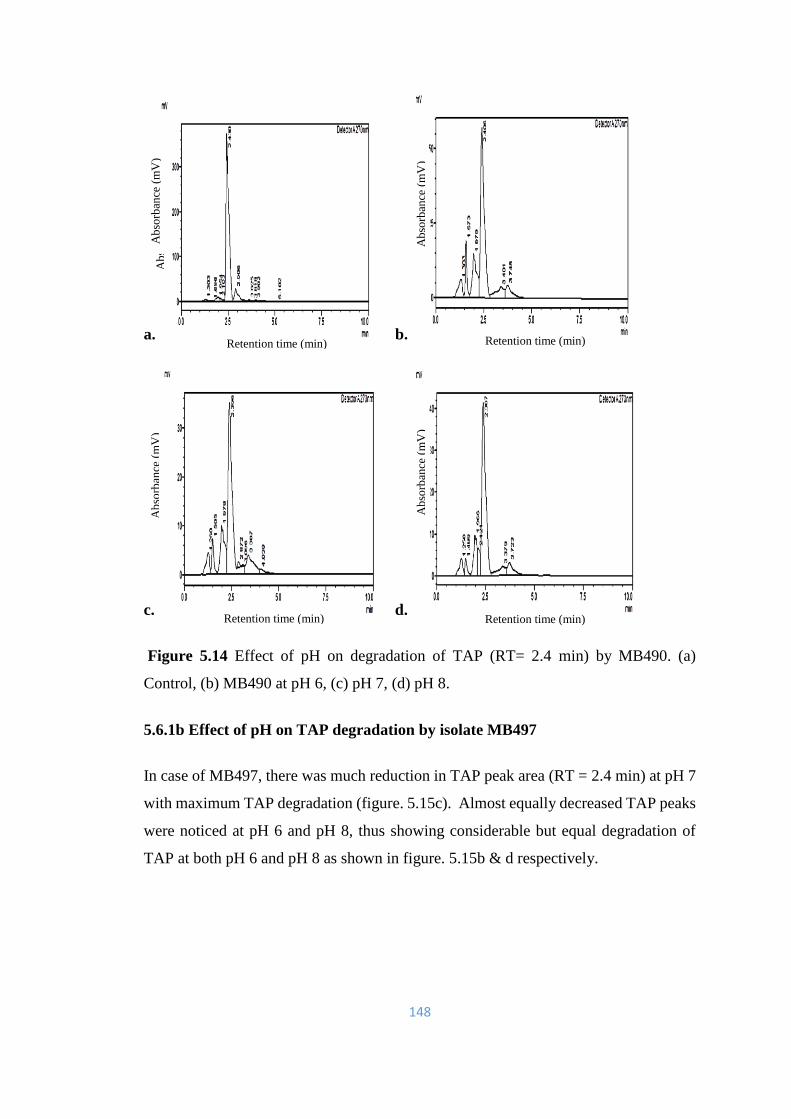
148
a. b.
c. d.
Figure 5.14 Effect of pH on degradation of TAP (RT= 2.4 min) by MB490. (a)
Control, (b) MB490 at pH 6, (c) pH 7, (d) pH 8.
5.6.1b Effect of pH on TAP degradation by isolate MB497
In case of MB497, there was much reduction in TAP peak area (RT = 2.4 min) at pH 7
with maximum TAP degradation (figure. 5.15c). Almost equally decreased TAP peaks
were noticed at pH 6 and pH 8, thus showing considerable but equal degradation of
TAP at both pH 6 and pH 8 as shown in figure. 5.15b & d respectively.
Ab
sorb
ance
(m
V)
Ab
sorb
ance
(m
V)
Retention time (min) Retention time (min)
Retention time (min) Retention time (min)
Ab
sorb
ance
(m
V)
Ab
sorb
ance
(m
V)
Ab
sorb
ance
(m
V)
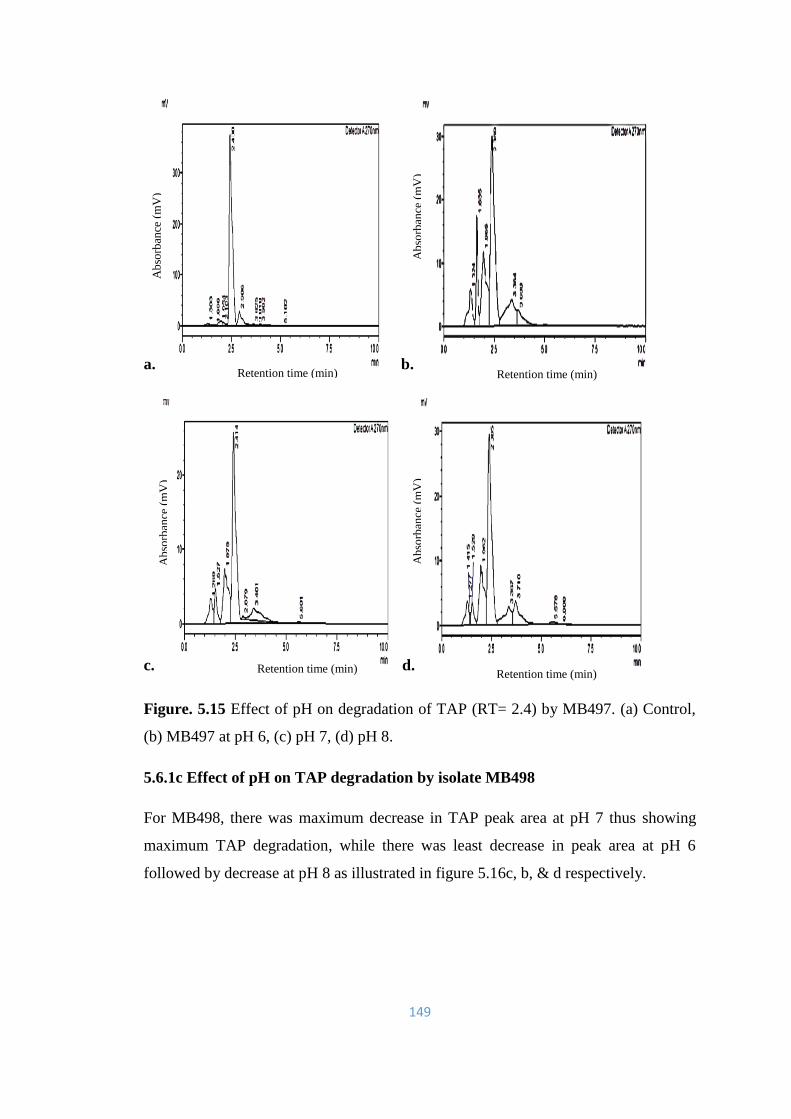
149
a. b.
c. d.
Figure. 5.15 Effect of pH on degradation of TAP (RT= 2.4) by MB497. (a) Control,
(b) MB497 at pH 6, (c) pH 7, (d) pH 8.
5.6.1c Effect of pH on TAP degradation by isolate MB498
For MB498, there was maximum decrease in TAP peak area at pH 7 thus showing
maximum TAP degradation, while there was least decrease in peak area at pH 6
followed by decrease at pH 8 as illustrated in figure 5.16c, b, & d respectively.
Retention time (min) Retention time (min)
Retention time (min) Retention time (min)
Ab
sorb
ance
(m
V)
Ab
sorb
ance
(m
V)
Ab
sorb
ance
(m
V)
Ab
sorb
ance
(m
V)
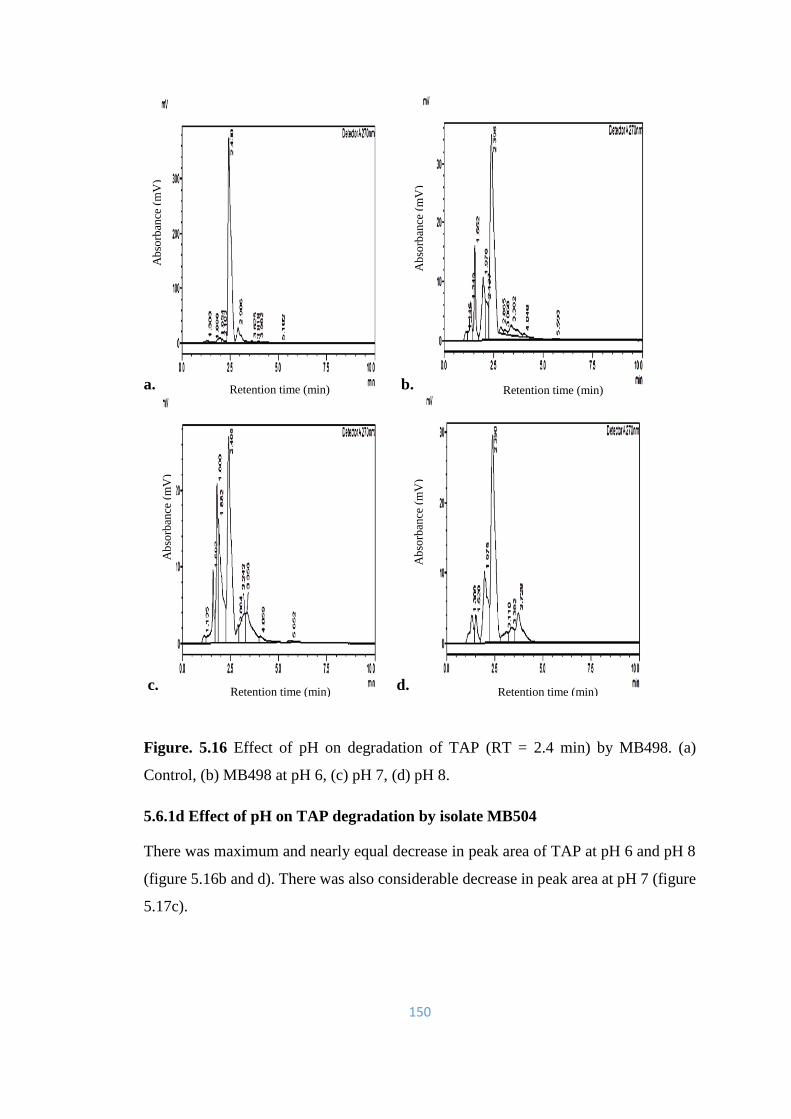
150
a. b.
c. d.
Figure. 5.16 Effect of pH on degradation of TAP (RT = 2.4 min) by MB498. (a)
Control, (b) MB498 at pH 6, (c) pH 7, (d) pH 8.
5.6.1d Effect of pH on TAP degradation by isolate MB504
There was maximum and nearly equal decrease in peak area of TAP at pH 6 and pH 8
(figure 5.16b and d). There was also considerable decrease in peak area at pH 7 (figure
5.17c).
Retention time (min) Retention time (min)
Retention time (min) Retention time (min)
Ab
sorb
ance
(m
V)
Ab
sorb
ance
(m
V)
Ab
sorb
ance
(m
V)
Ab
sorb
ance
(m
V)

151
a. b.
c. d.
Figure. 5.17 Effect of pH on degradation of TAP (RT= 2.4 min) by MB504. (a)
Control, (b) MB504 at pH 6, (c) pH 7, (d) pH 8.
5.6.1e Effect of pH on TAP degradation by consortium A
There was little more decrease in peak area of TAP at pH 8 in case of consortium
indicating higher TAP degradation as compared to that at pH 7 and 6 as shown in figure
5.18d, c & b respectively. Many new peaks can be seen in the chromatograms at pH 6,
7 and 8 denoting some unknown metabolites.
Retention time (min) Retention time (min)
Retention time (min) Retention time (min)
Ab
sorb
ance
(m
V)
Ab
sorb
ance
(m
V)
Ab
sorb
ance
(m
V)
Ab
sorb
ance
(m
V)

152
a. b.
c. d.
Figure. 5.18 Effect of pH on degradation of TAP (RT= 2.4 min) by consortium A. (a)
Control, (b) consortium A, at pH 6, (c) pH 7, (d) pH 8.
5.6.1f Effect of pH on TAP degradation by consortium B
In case of consortium B, maximum decrease in TAP peak area was observed at pH 8
(figure 5.19d), followed by pH 6 and 7 as presented in figure 5.19b & c respectively,
thus it could degrade TAP considerably at all given pH after 24 hrs.
Retention time (min) Retention time (min)
Retention time (min) Retention time (min)
Ab
sorb
ance
(m
V)
Ab
sorb
ance
(m
V)
Ab
sorb
ance
(m
V)
Ab
sorb
ance
(m
V)
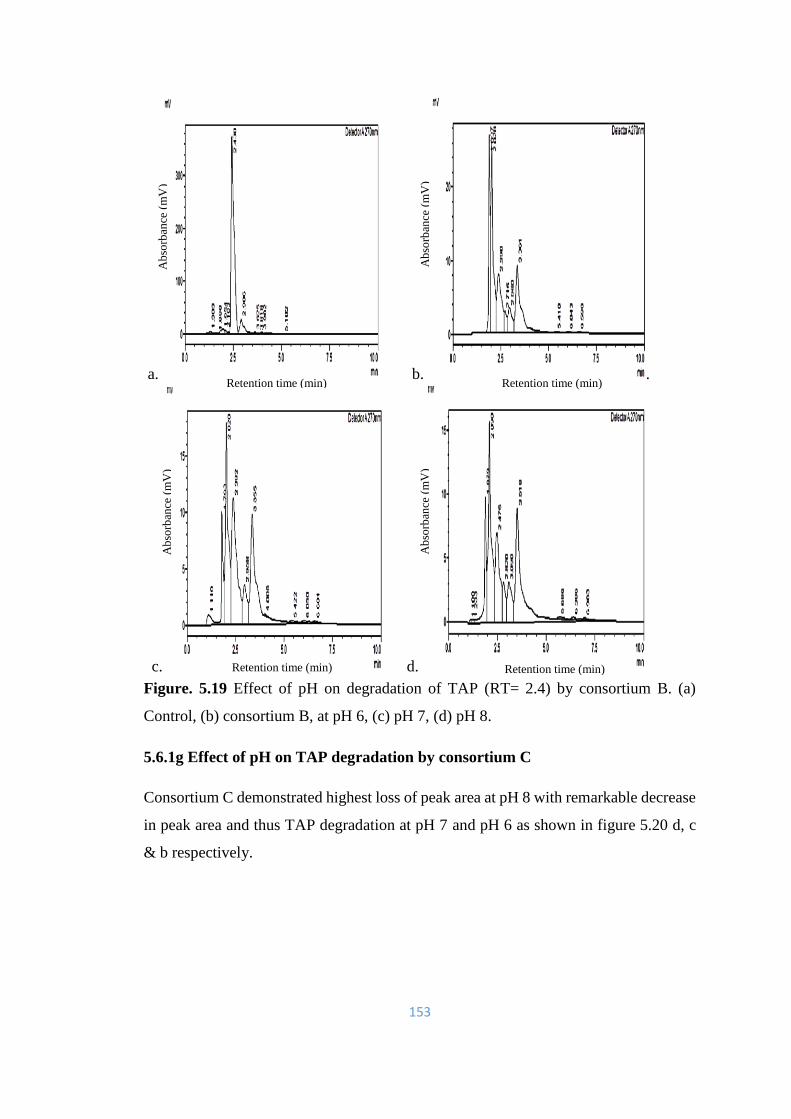
153
a. b. .
c. d.
Figure. 5.19 Effect of pH on degradation of TAP (RT= 2.4) by consortium B. (a)
Control, (b) consortium B, at pH 6, (c) pH 7, (d) pH 8.
5.6.1g Effect of pH on TAP degradation by consortium C
Consortium C demonstrated highest loss of peak area at pH 8 with remarkable decrease
in peak area and thus TAP degradation at pH 7 and pH 6 as shown in figure 5.20 d, c
& b respectively.
Retention time (min) Retention time (min)
Retention time (min) Retention time (min)
Ab
sorb
ance
(m
V)
Ab
sorb
ance
(m
V)
Ab
sorb
ance
(m
V)
Ab
sorb
ance
(m
V)
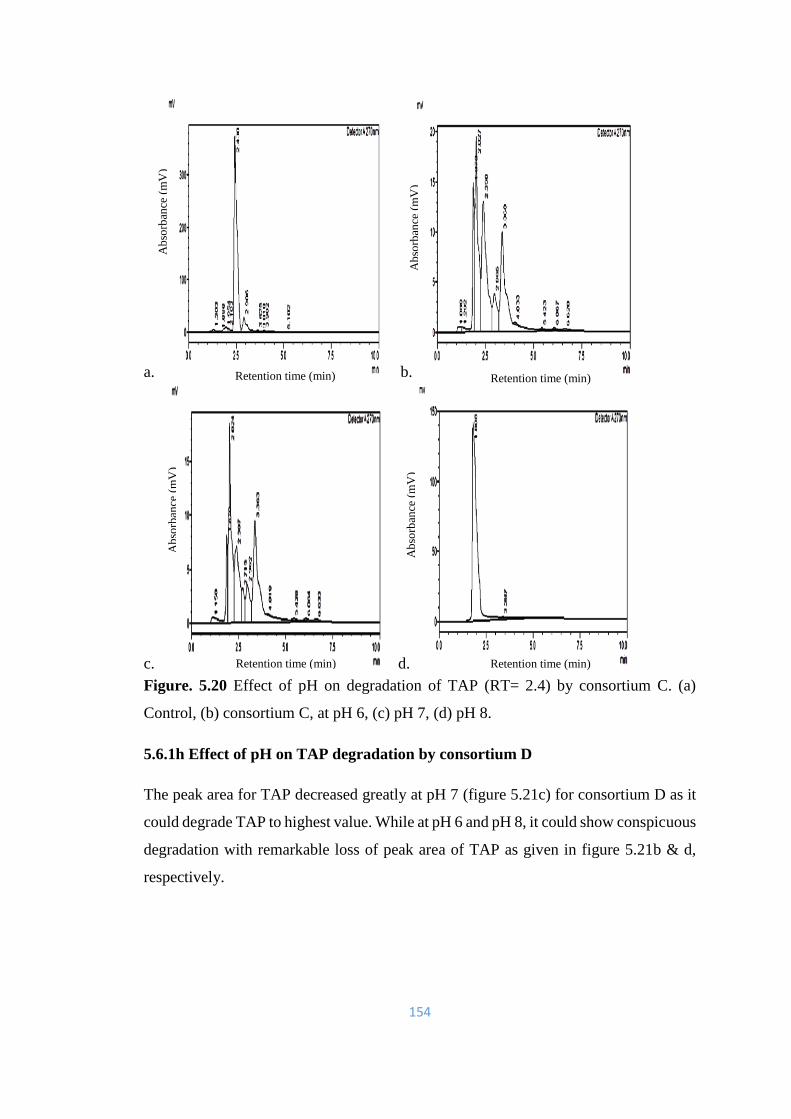
154
a. b.
c. d.
Figure. 5.20 Effect of pH on degradation of TAP (RT= 2.4) by consortium C. (a)
Control, (b) consortium C, at pH 6, (c) pH 7, (d) pH 8.
5.6.1h Effect of pH on TAP degradation by consortium D
The peak area for TAP decreased greatly at pH 7 (figure 5.21c) for consortium D as it
could degrade TAP to highest value. While at pH 6 and pH 8, it could show conspicuous
degradation with remarkable loss of peak area of TAP as given in figure 5.21b & d,
respectively.
Retention time (min) Retention time (min)
Retention time (min) Retention time (min)
Ab
sorb
ance
(m
V)
Ab
sorb
ance
(m
V)
Ab
sorb
ance
(m
V)
Ab
sorb
ance
(m
V)
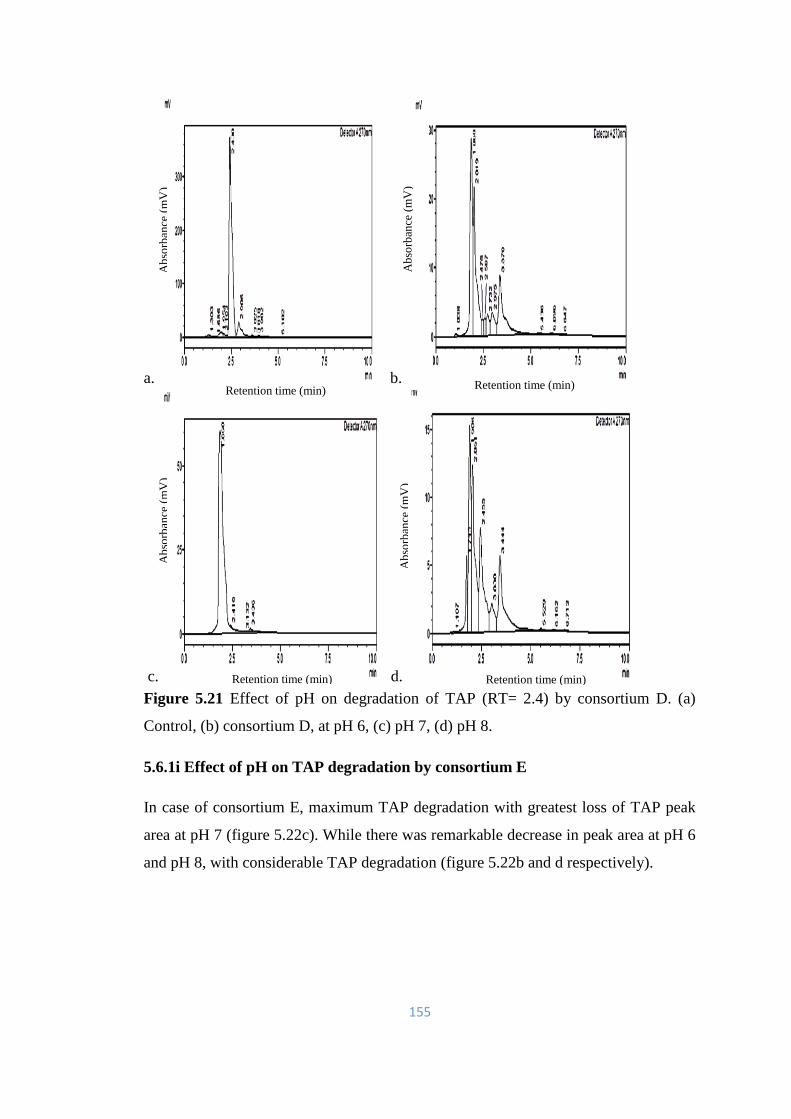
155
a. b.
c. d.
Figure 5.21 Effect of pH on degradation of TAP (RT= 2.4) by consortium D. (a)
Control, (b) consortium D, at pH 6, (c) pH 7, (d) pH 8.
5.6.1i Effect of pH on TAP degradation by consortium E
In case of consortium E, maximum TAP degradation with greatest loss of TAP peak
area at pH 7 (figure 5.22c). While there was remarkable decrease in peak area at pH 6
and pH 8, with considerable TAP degradation (figure 5.22b and d respectively).
Retention time (min) Retention time (min)
Retention time (min) Retention time (min)
Ab
sorb
ance
(m
V)
Ab
sorb
ance
(m
V)
Ab
sorb
ance
(m
V)
Ab
sorb
ance
(m
V)
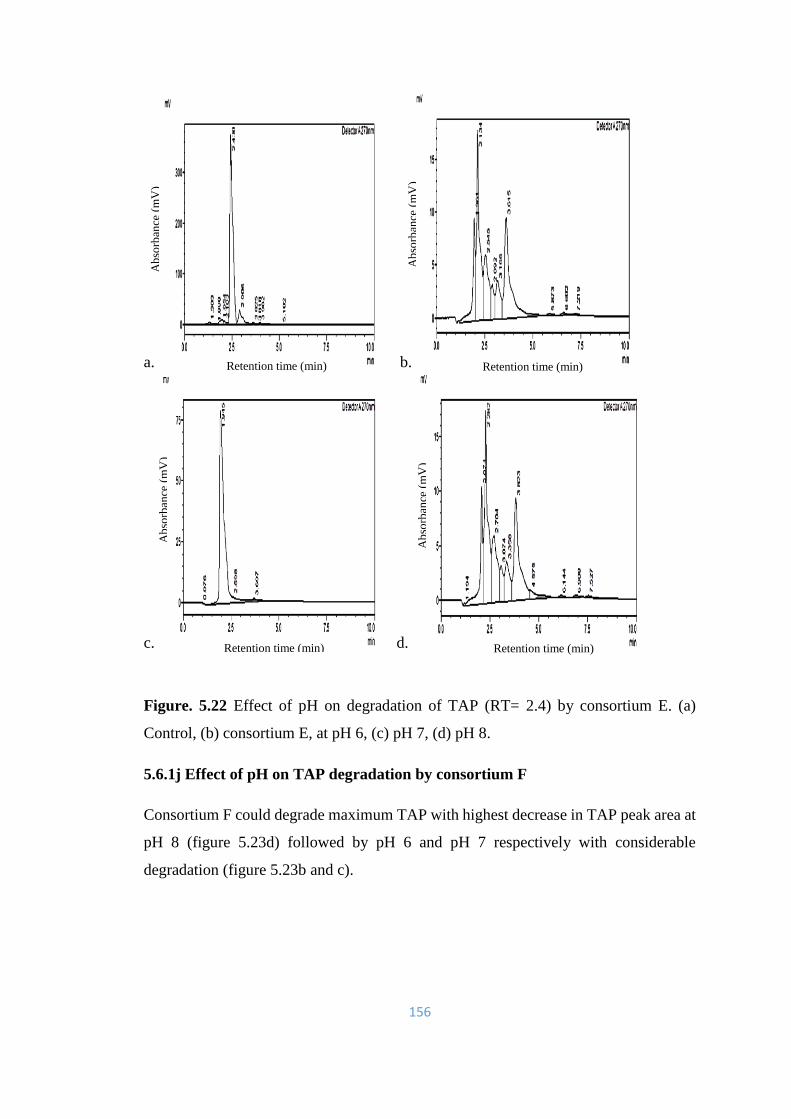
156
a. b.
c. d.
Figure. 5.22 Effect of pH on degradation of TAP (RT= 2.4) by consortium E. (a)
Control, (b) consortium E, at pH 6, (c) pH 7, (d) pH 8.
5.6.1j Effect of pH on TAP degradation by consortium F
Consortium F could degrade maximum TAP with highest decrease in TAP peak area at
pH 8 (figure 5.23d) followed by pH 6 and pH 7 respectively with considerable
degradation (figure 5.23b and c).
Retention time (min) Retention time (min)
Retention time (min) Retention time (min)
Ab
sorb
ance
(m
V)
Ab
sorb
ance
(m
V)
Ab
sorb
ance
(m
V)
Ab
sorb
ance
(m
V)
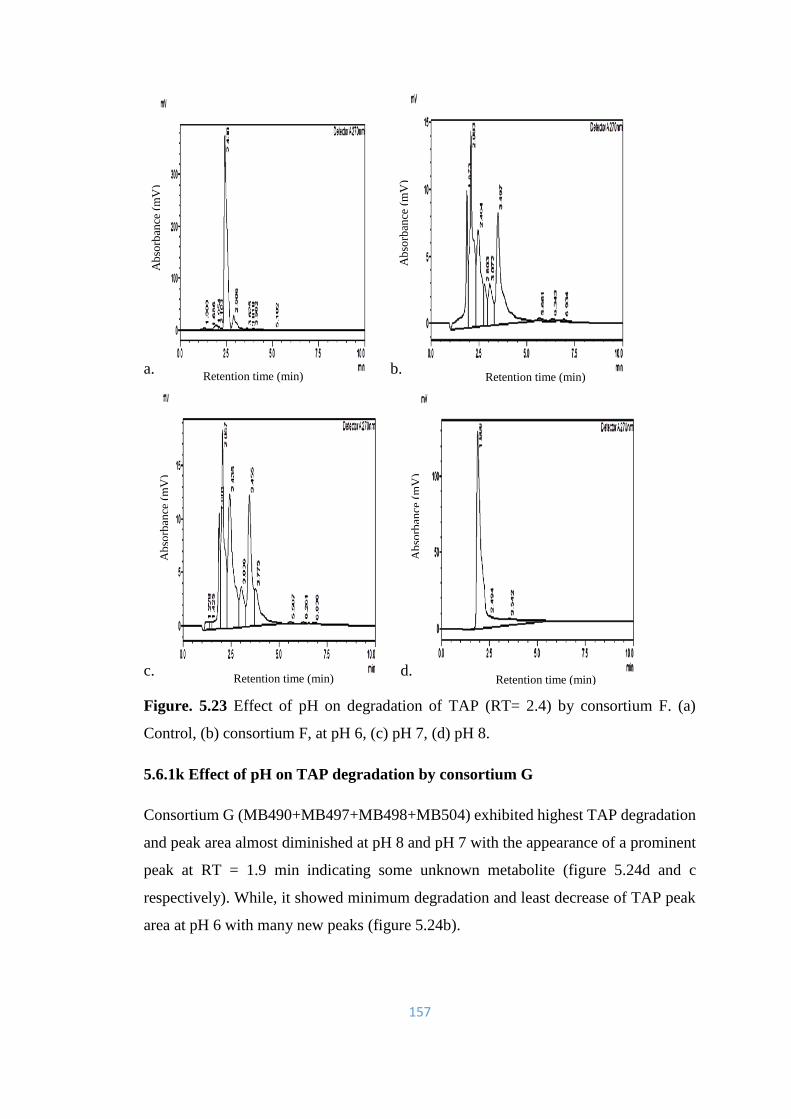
157
a. b.
c. d.
Figure. 5.23 Effect of pH on degradation of TAP (RT= 2.4) by consortium F. (a)
Control, (b) consortium F, at pH 6, (c) pH 7, (d) pH 8.
5.6.1k Effect of pH on TAP degradation by consortium G
Consortium G (MB490+MB497+MB498+MB504) exhibited highest TAP degradation
and peak area almost diminished at pH 8 and pH 7 with the appearance of a prominent
peak at RT = 1.9 min indicating some unknown metabolite (figure 5.24d and c
respectively). While, it showed minimum degradation and least decrease of TAP peak
area at pH 6 with many new peaks (figure 5.24b).
Retention time (min) Retention time (min)
Retention time (min) Retention time (min)
Ab
sorb
ance
(m
V)
Ab
sorb
ance
(m
V)
Ab
sorb
ance
(m
V)
Ab
sorb
ance
(m
V)
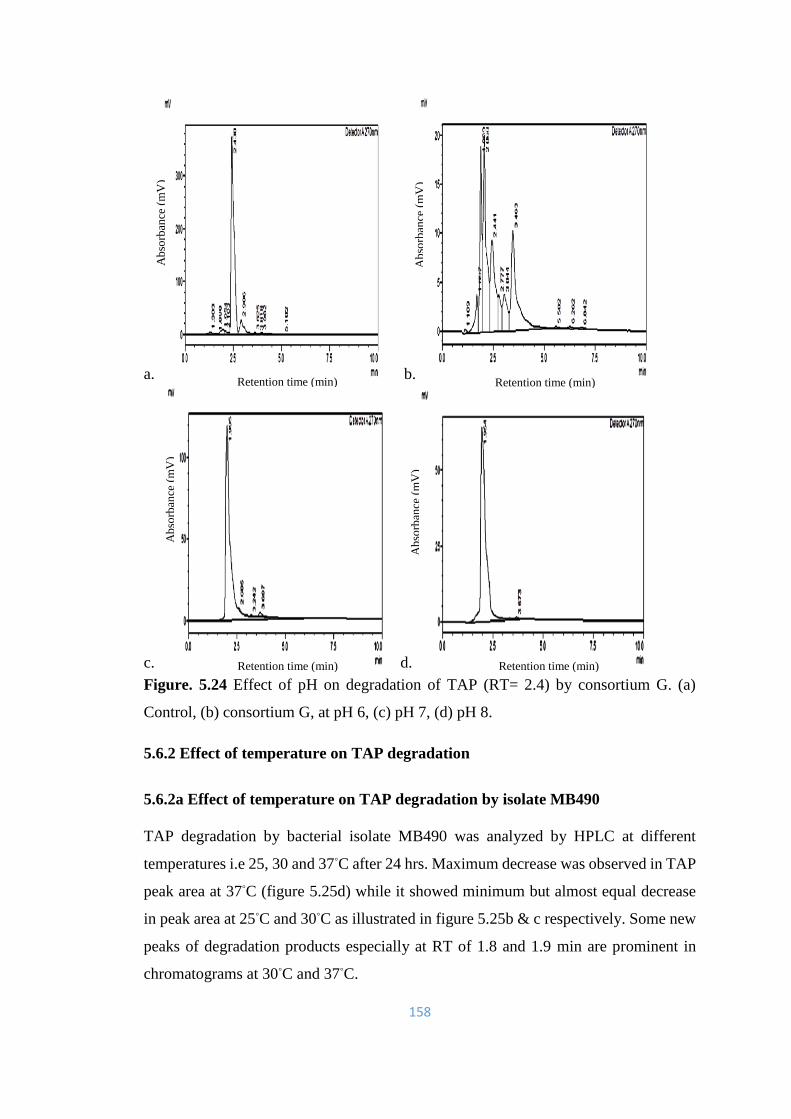
158
a. b.
c. d.
Figure. 5.24 Effect of pH on degradation of TAP (RT= 2.4) by consortium G. (a)
Control, (b) consortium G, at pH 6, (c) pH 7, (d) pH 8.
5.6.2 Effect of temperature on TAP degradation
5.6.2a Effect of temperature on TAP degradation by isolate MB490
TAP degradation by bacterial isolate MB490 was analyzed by HPLC at different
temperatures i.e 25, 30 and 37◦C after 24 hrs. Maximum decrease was observed in TAP
peak area at 37◦C (figure 5.25d) while it showed minimum but almost equal decrease
in peak area at 25◦C and 30◦C as illustrated in figure 5.25b & c respectively. Some new
peaks of degradation products especially at RT of 1.8 and 1.9 min are prominent in
chromatograms at 30◦C and 37◦C.
Retention time (min) Retention time (min)
Retention time (min) Retention time (min)
Ab
sorb
ance
(m
V)
Ab
sorb
ance
(m
V)
Ab
sorb
ance
(m
V)
Ab
sorb
ance
(m
V)
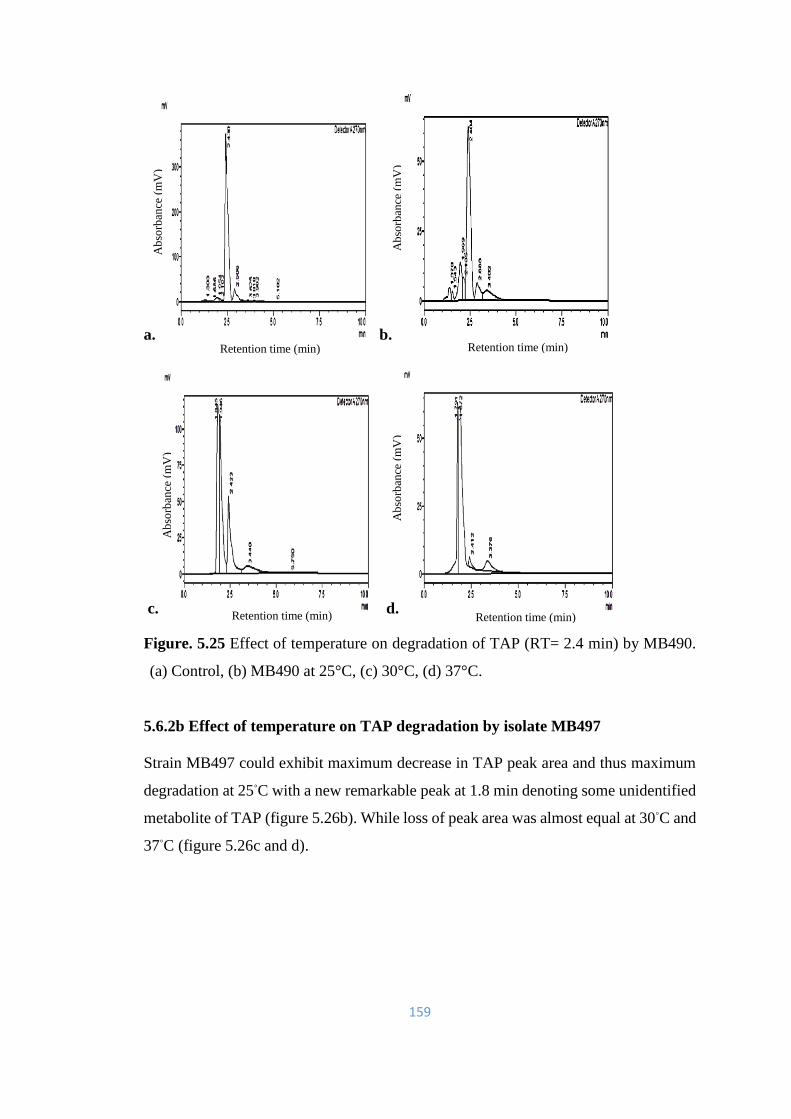
159
a. b.
c. d.
Figure. 5.25 Effect of temperature on degradation of TAP (RT= 2.4 min) by MB490.
(a) Control, (b) MB490 at 25°C, (c) 30°C, (d) 37°C.
5.6.2b Effect of temperature on TAP degradation by isolate MB497
Strain MB497 could exhibit maximum decrease in TAP peak area and thus maximum
degradation at 25◦C with a new remarkable peak at 1.8 min denoting some unidentified
metabolite of TAP (figure 5.26b). While loss of peak area was almost equal at 30◦C and
37◦C (figure 5.26c and d).
Retention time (min) Retention time (min)
Retention time (min) Retention time (min)
Ab
sorb
ance
(m
V)
Ab
sorb
ance
(m
V)
Ab
sorb
ance
(m
V)
Ab
sorb
ance
(m
V)
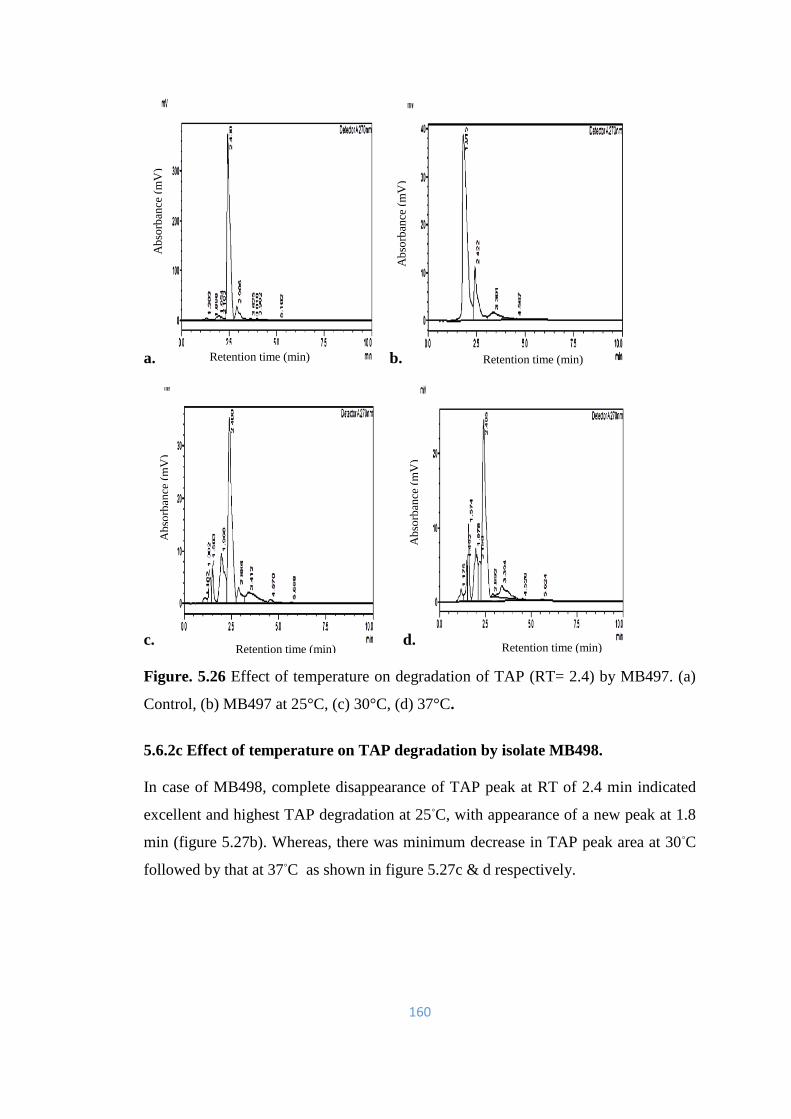
160
a. b.
c. d.
Figure. 5.26 Effect of temperature on degradation of TAP (RT= 2.4) by MB497. (a)
Control, (b) MB497 at 25°C, (c) 30°C, (d) 37°C.
5.6.2c Effect of temperature on TAP degradation by isolate MB498.
In case of MB498, complete disappearance of TAP peak at RT of 2.4 min indicated
excellent and highest TAP degradation at 25◦C, with appearance of a new peak at 1.8
min (figure 5.27b). Whereas, there was minimum decrease in TAP peak area at 30◦C
followed by that at 37◦C as shown in figure 5.27c & d respectively.
Retention time (min) Retention time (min)
Retention time (min) Retention time (min)
Ab
sorb
ance
(m
V)
Ab
sorb
ance
(m
V)
Ab
sorb
ance
(m
V)
Ab
sorb
ance
(m
V)
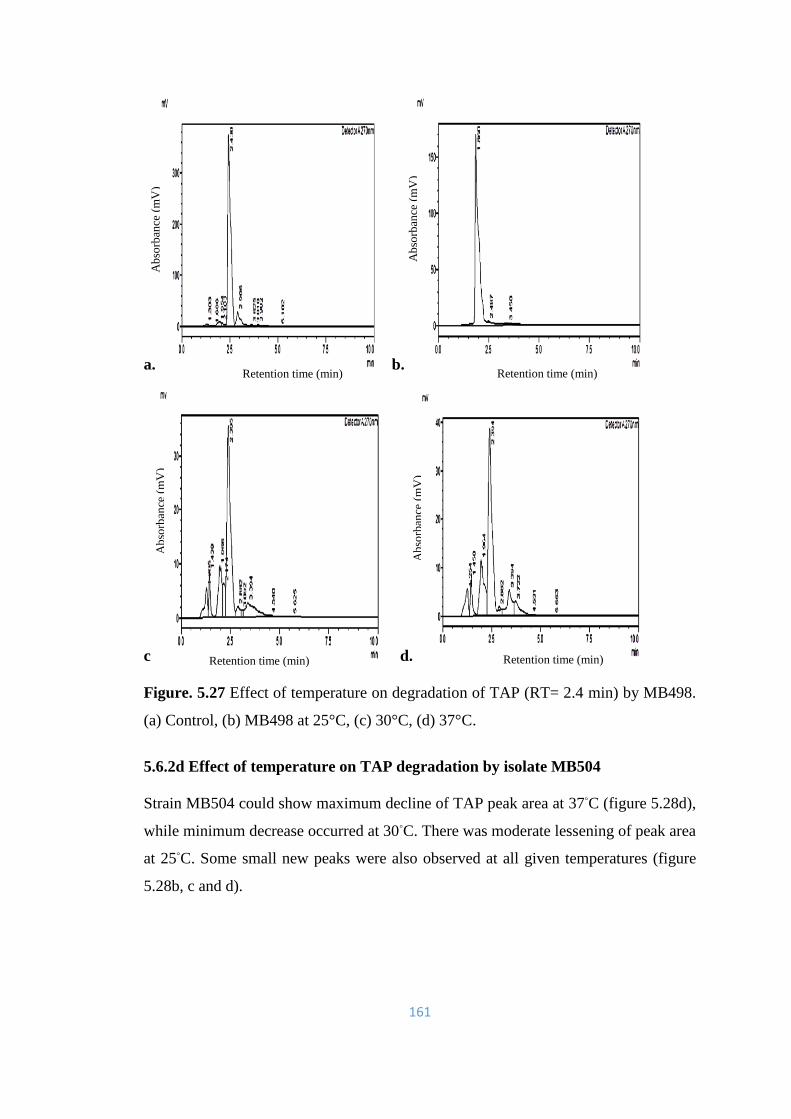
161
a. b.
c d.
Figure. 5.27 Effect of temperature on degradation of TAP (RT= 2.4 min) by MB498.
(a) Control, (b) MB498 at 25°C, (c) 30°C, (d) 37°C.
5.6.2d Effect of temperature on TAP degradation by isolate MB504
Strain MB504 could show maximum decline of TAP peak area at 37◦C (figure 5.28d),
while minimum decrease occurred at 30◦C. There was moderate lessening of peak area
at 25◦C. Some small new peaks were also observed at all given temperatures (figure
5.28b, c and d).
Retention time (min) Retention time (min)
Retention time (min) Retention time (min)
Ab
sorb
ance
(m
V)
Ab
sorb
ance
(m
V)
Ab
sorb
ance
(m
V)
Ab
sorb
ance
(m
V)
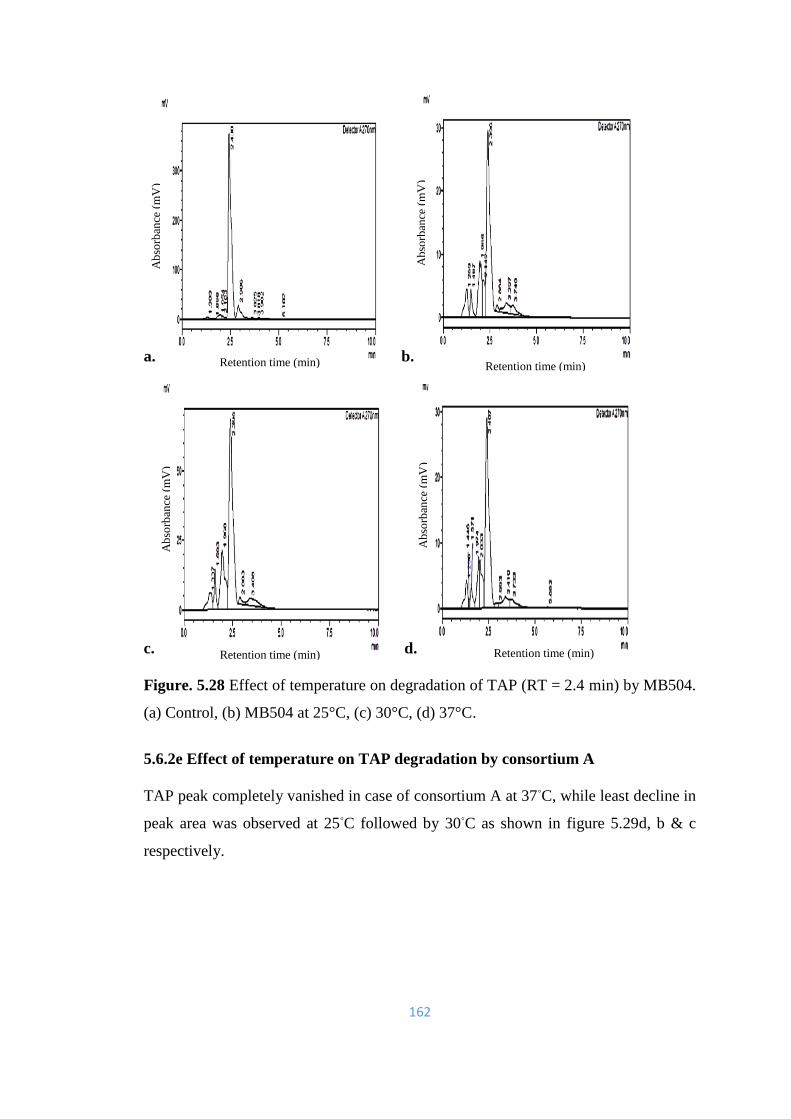
162
a. b.
c. d.
Figure. 5.28 Effect of temperature on degradation of TAP (RT = 2.4 min) by MB504.
(a) Control, (b) MB504 at 25°C, (c) 30°C, (d) 37°C.
5.6.2e Effect of temperature on TAP degradation by consortium A
TAP peak completely vanished in case of consortium A at 37◦C, while least decline in
peak area was observed at 25◦C followed by 30◦C as shown in figure 5.29d, b & c
respectively.
Retention time (min) Retention time (min)
Retention time (min) Retention time (min)
Ab
sorb
ance
(m
V)
Ab
sorb
ance
(m
V)
Ab
sorb
ance
(m
V)
Ab
sorb
ance
(m
V)
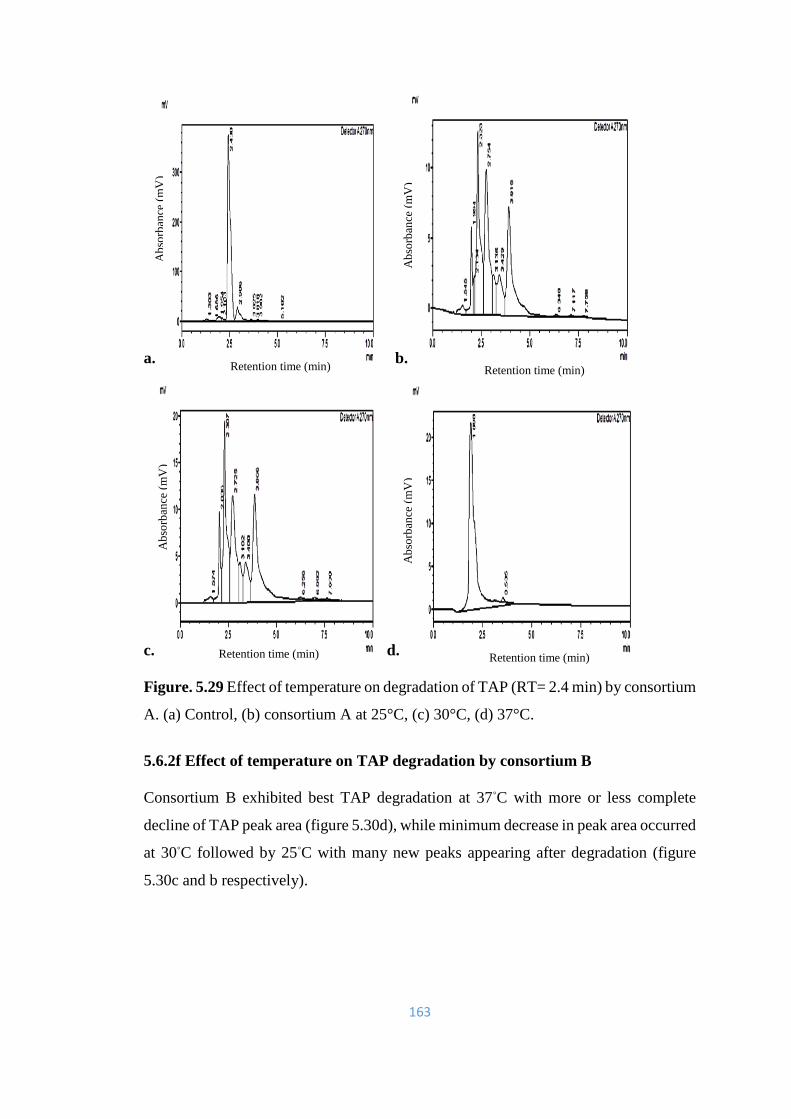
163
a. b.
c. d.
Figure. 5.29 Effect of temperature on degradation of TAP (RT= 2.4 min) by consortium
A. (a) Control, (b) consortium A at 25°C, (c) 30°C, (d) 37°C.
5.6.2f Effect of temperature on TAP degradation by consortium B
Consortium B exhibited best TAP degradation at 37◦C with more or less complete
decline of TAP peak area (figure 5.30d), while minimum decrease in peak area occurred
at 30◦C followed by 25◦C with many new peaks appearing after degradation (figure
5.30c and b respectively).
Ab
sorb
ance
(m
V)
Ab
sorb
ance
(m
V)
Ab
sorb
ance
(m
V)
Ab
sorb
ance
(m
V)
Retention time (min) Retention time (min)
Retention time (min) Retention time (min)

164
a. b.
c. d.
Figure. 5.30 Effect of temperature on degradation of TAP (RT= 2.4) by consortium B.
(a) Control, (b) consortium B at 25°C, (c) 30°C, (d) 37°C.
5.6.2g Effect of temperature on TAP degradation by consortium C
Likewise, consortium C demonstrated maximum reduction of TAP peak area at 37◦C
(figure 5.31d) while minimum decline in peak area was observed at 25◦C followed by
30◦C (figure 5.31b and c respectively). Many new peaks can be seen in figure 5.31b, c
& d.
Ab
sorb
ance
(m
V)
Ab
sorb
ance
(m
V)
Ab
sorb
ance
(m
V)
Ab
sorb
ance
(m
V)
Retention time (min) Retention time (min)
Retention time (min) Retention time (min)

165
a. b.
c d.
Figure. 5.31 Effect of temperature on degradation of TAP (RT= 2.4) by consortium C.
(a) Control, (b) consortium C at 25°C, (c) 30°C, (d) 37°C.
5.6.2h Effect of temperature on TAP degradation by consortium D
Consortium D showed almost diminished peak area of TAP at 30◦C (figure
5.32c).While it exhibited minimum decline in TAP peak area at 25◦C and moderate
reduction at 37◦C as shown in figure 5.32b & d respectively.
Ab
sorb
ance
(m
V)
Ab
sorb
ance
(m
V)
Ab
sorb
ance
(m
V)
Ab
sorb
ance
(m
V)
Retention time (min) Retention time (min)
Retention time (min) Retention time (min)
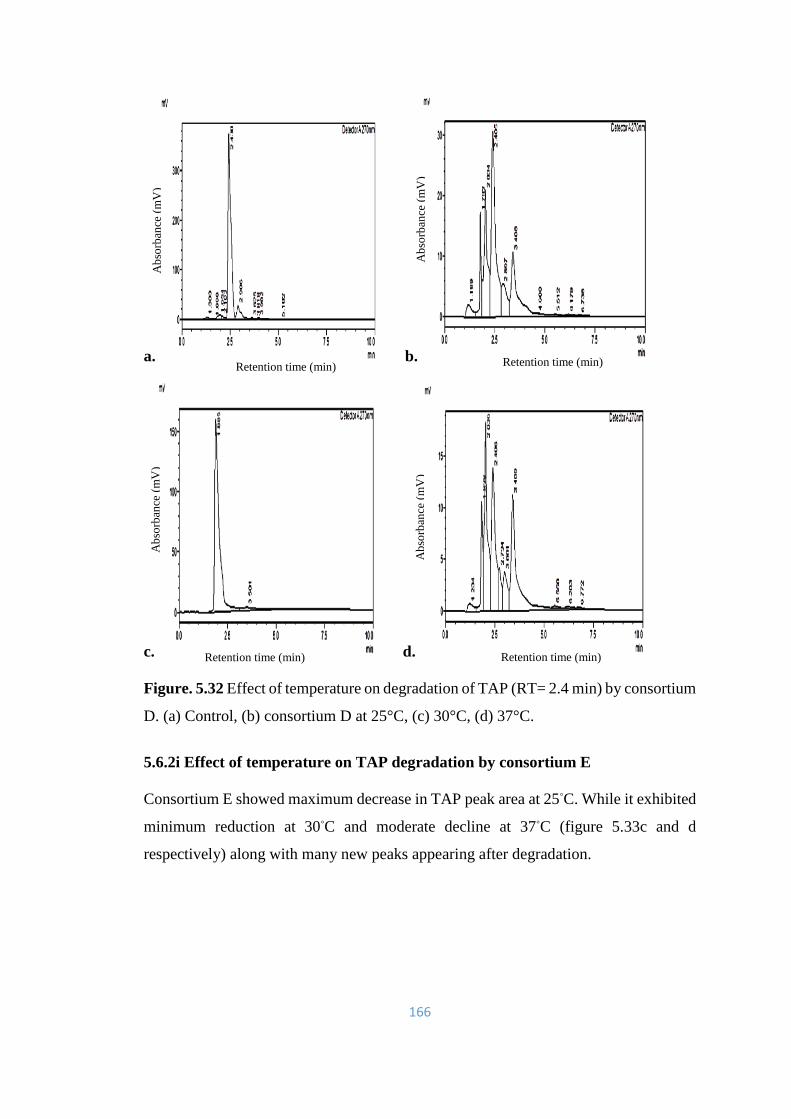
166
a. b.
c. d.
Figure. 5.32 Effect of temperature on degradation of TAP (RT= 2.4 min) by consortium
D. (a) Control, (b) consortium D at 25°C, (c) 30°C, (d) 37°C.
5.6.2i Effect of temperature on TAP degradation by consortium E
Consortium E showed maximum decrease in TAP peak area at 25◦C. While it exhibited
minimum reduction at 30◦C and moderate decline at 37◦C (figure 5.33c and d
respectively) along with many new peaks appearing after degradation.
Ab
sorb
ance
(m
V)
Ab
sorb
ance
(m
V)
Ab
sorb
ance
(m
V)
Ab
sorb
ance
(m
V)
Retention time (min) Retention time (min)
Retention time (min) Retention time (min)
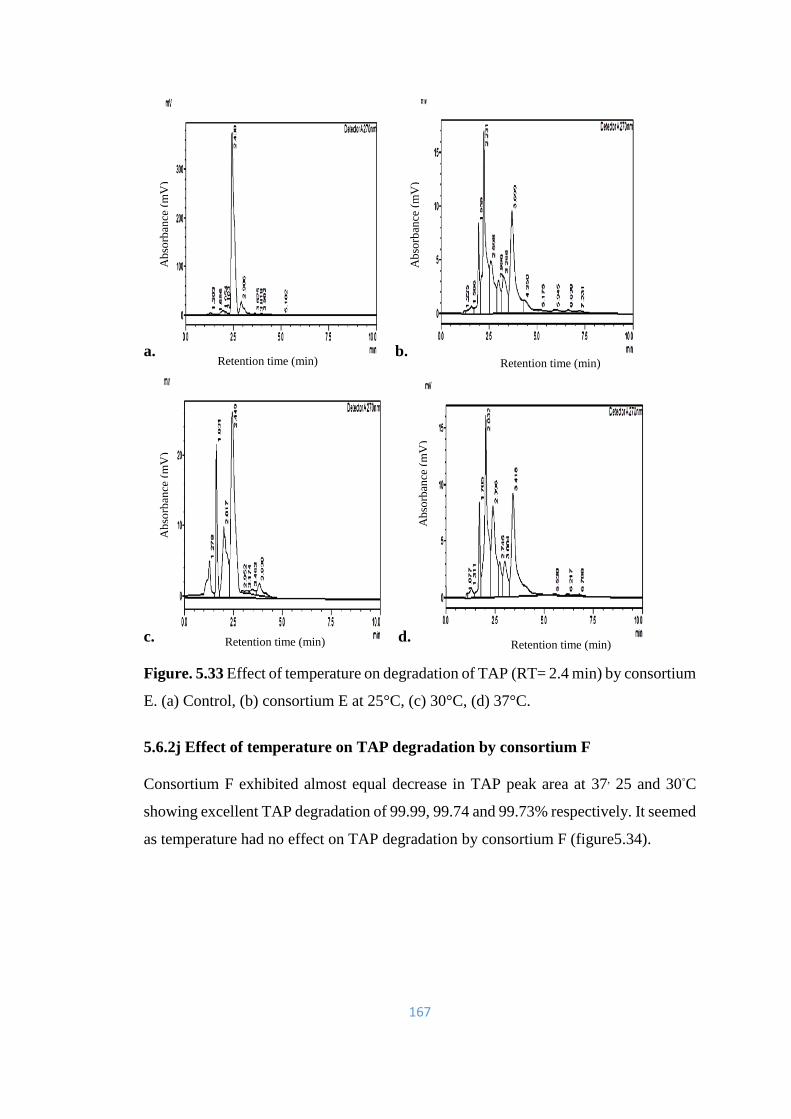
167
a. b.
c. d.
Figure. 5.33 Effect of temperature on degradation of TAP (RT= 2.4 min) by consortium
E. (a) Control, (b) consortium E at 25°C, (c) 30°C, (d) 37°C.
5.6.2j Effect of temperature on TAP degradation by consortium F
Consortium F exhibited almost equal decrease in TAP peak area at 37, 25 and 30◦C
showing excellent TAP degradation of 99.99, 99.74 and 99.73% respectively. It seemed
as temperature had no effect on TAP degradation by consortium F (figure5.34).
Ab
sorb
ance
(m
V)
Ab
sorb
ance
(m
V)
Ab
sorb
ance
(m
V)
Ab
sorb
ance
(m
V)
Retention time (min) Retention time (min)
Retention time (min) Retention time (min)
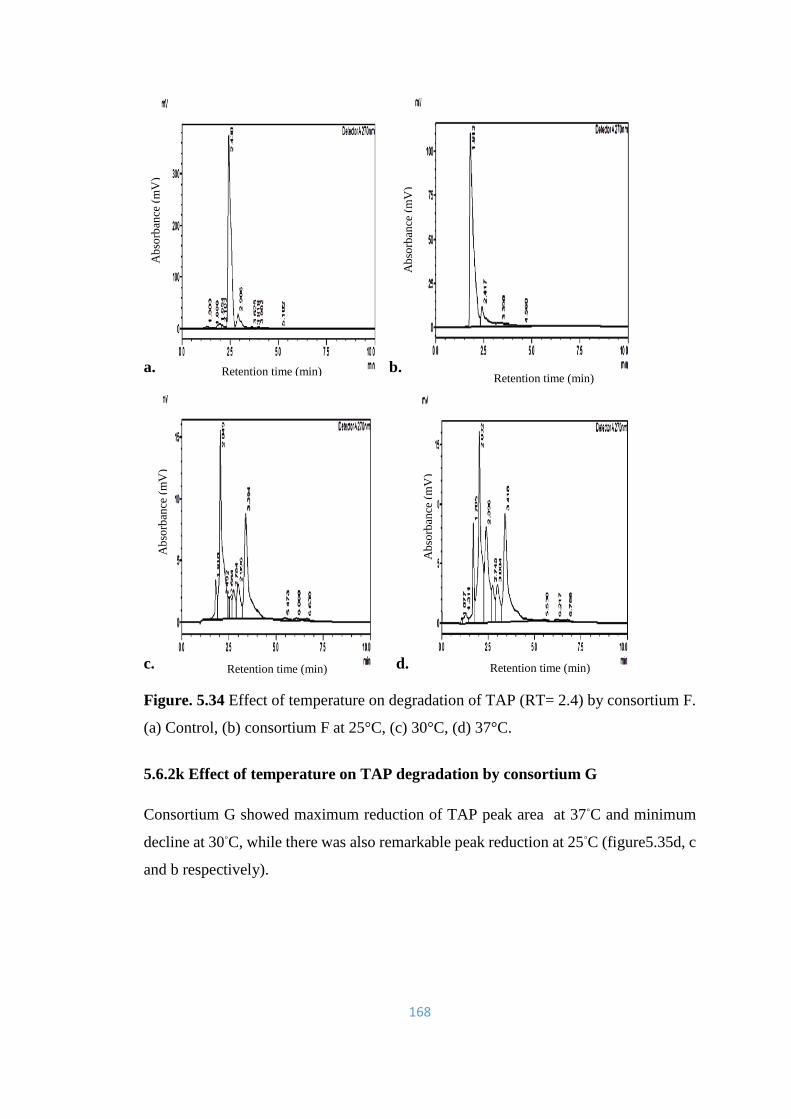
168
a. b.
c. d.
Figure. 5.34 Effect of temperature on degradation of TAP (RT= 2.4) by consortium F.
(a) Control, (b) consortium F at 25°C, (c) 30°C, (d) 37°C.
5.6.2k Effect of temperature on TAP degradation by consortium G
Consortium G showed maximum reduction of TAP peak area at 37◦C and minimum
decline at 30◦C, while there was also remarkable peak reduction at 25◦C (figure5.35d, c
and b respectively).
Ab
sorb
ance
(m
V)
Ab
sorb
ance
(m
V)
Ab
sorb
ance
(m
V)
Ab
sorb
ance
(m
V)
Retention time (min) Retention time (min)
Retention time (min) Retention time (min)
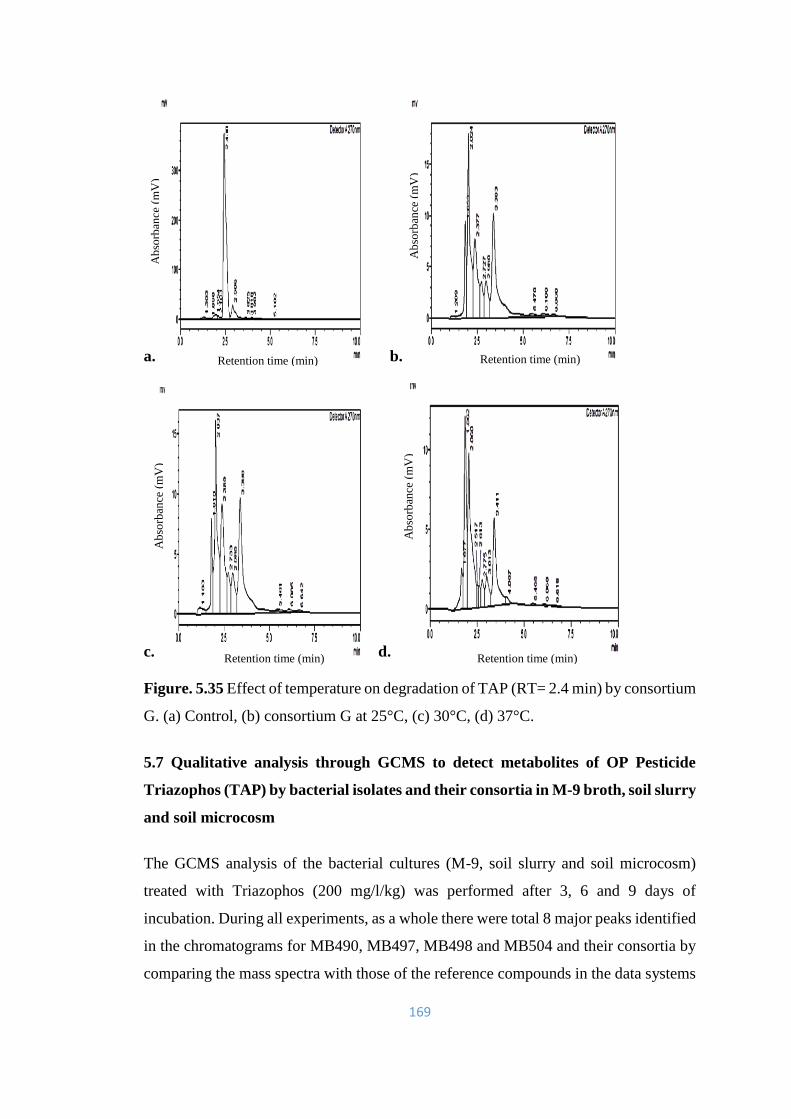
169
a. b.
c. d.
Figure. 5.35 Effect of temperature on degradation of TAP (RT= 2.4 min) by consortium
G. (a) Control, (b) consortium G at 25°C, (c) 30°C, (d) 37°C.
5.7 Qualitative analysis through GCMS to detect metabolites of OP Pesticide
Triazophos (TAP) by bacterial isolates and their consortia in M-9 broth, soil slurry
and soil microcosm
The GCMS analysis of the bacterial cultures (M-9, soil slurry and soil microcosm)
treated with Triazophos (200 mg/l/kg) was performed after 3, 6 and 9 days of
incubation. During all experiments, as a whole there were total 8 major peaks identified
in the chromatograms for MB490, MB497, MB498 and MB504 and their consortia by
comparing the mass spectra with those of the reference compounds in the data systems
Ab
sorb
ance
(m
V)
Ab
sorb
ance
(m
V)
Ab
sorb
ance
(m
V)
Ab
sorb
ance
(m
V)
Retention time (min) Retention time (min)
Retention time (min) Retention time (min)

170
of NIST library. Following compounds were identified (figures 5.37, 5.38 & Table 5.3):
1, 2, 4-Triazole-4—amine, N-(2-Thienylmethyl), Benzene sulfonic acid hydrazide,
Benzene sulfonic acid, methyl ester. 4H-1, 2, 4-Triazole-4-benzenesulfonamide, 4, 5
dihydro-N-(O-toyl)-3-furamide, Ethyl 4-phenyldiazenylbenzoate, Dibutyl
methanephosphonate and parent compound Triazophos.
The metabolites observed in present study are quite different and novel from those
reported earlier due to photo-fenton degradation (Lin et al., 2004), hydrolytic
degradation (Rani et al., 2001; Lin et al., 2004), photocatalytic degradation (Aungpradit
et al., 2007), microbial and soil degradation (Wang et al., 2005; Bajeer et al., 2016).
Similar to current study, glucuronide and sulfate conjugates of 1-phenyl-3-hydroxy-
(1H)-1, 2, 4-triazole were detected in the urine of rats and dogs (Schwalbe-Fehl and
Schmidt, 1986). This suggested the presence of same metabolizing enzymes in both
bacterial isolates and in higher animals like rats and dogs etc.
a.
b.
Figure. 5.36 (a). GCMS chromatogram of Triazophos standard (RT= 27.8 min) (b).
GCMS mass spectrum of Triazophos standard.
Inte
nsi
ty
Rel
ativ
e A
bu
nd
ance
Retention time (min)
m/z values
Triazophos
RT= 27.8 min
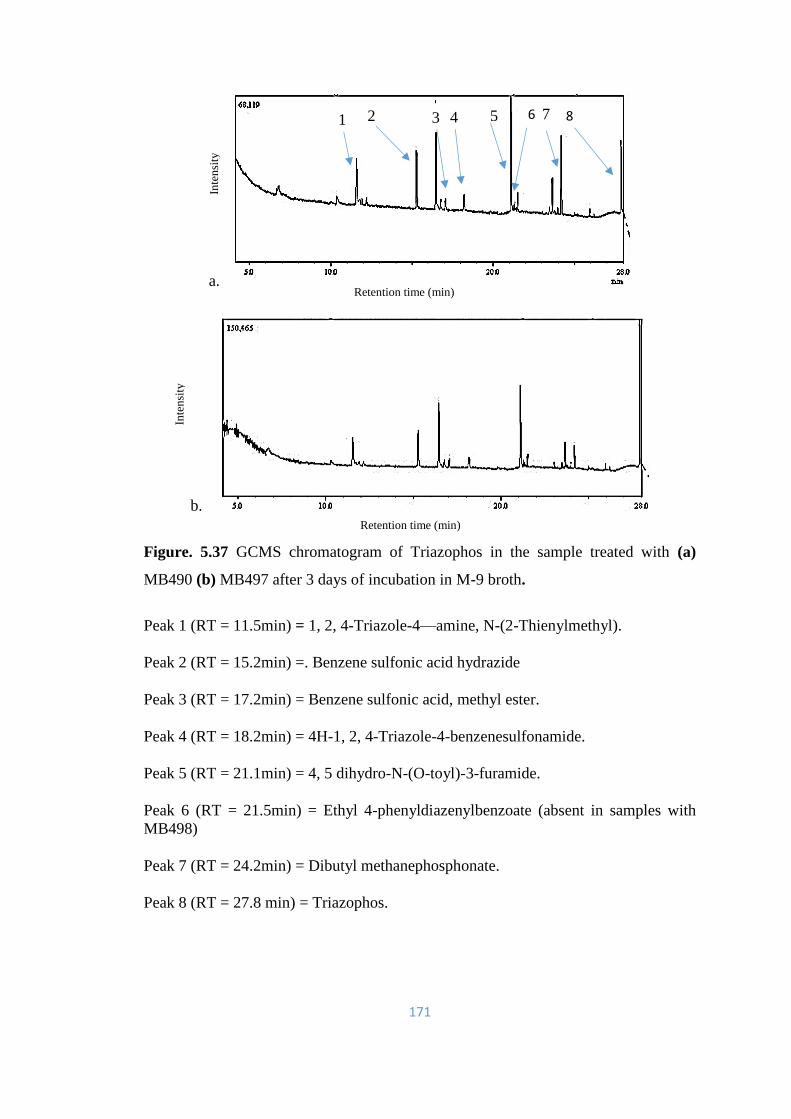
171
a.
b.
Figure. 5.37 GCMS chromatogram of Triazophos in the sample treated with (a)
MB490 (b) MB497 after 3 days of incubation in M-9 broth.
Peak 1 (RT = 11.5min) = 1, 2, 4-Triazole-4—amine, N-(2-Thienylmethyl).
Peak 2 (RT = 15.2min) =. Benzene sulfonic acid hydrazide
Peak 3 (RT = 17.2min) = Benzene sulfonic acid, methyl ester.
Peak 4 (RT = 18.2min) = 4H-1, 2, 4-Triazole-4-benzenesulfonamide.
Peak 5 (RT = 21.1min) = 4, 5 dihydro-N-(O-toyl)-3-furamide.
Peak 6 (RT = 21.5min) = Ethyl 4-phenyldiazenylbenzoate (absent in samples with
MB498)
Peak 7 (RT = 24.2min) = Dibutyl methanephosphonate.
Peak 8 (RT = 27.8 min) = Triazophos.
1 3 4 5 2 7 6 8
Retention time (min)
Retention time (min)
Inte
nsi
ty
Inte
nsi
ty
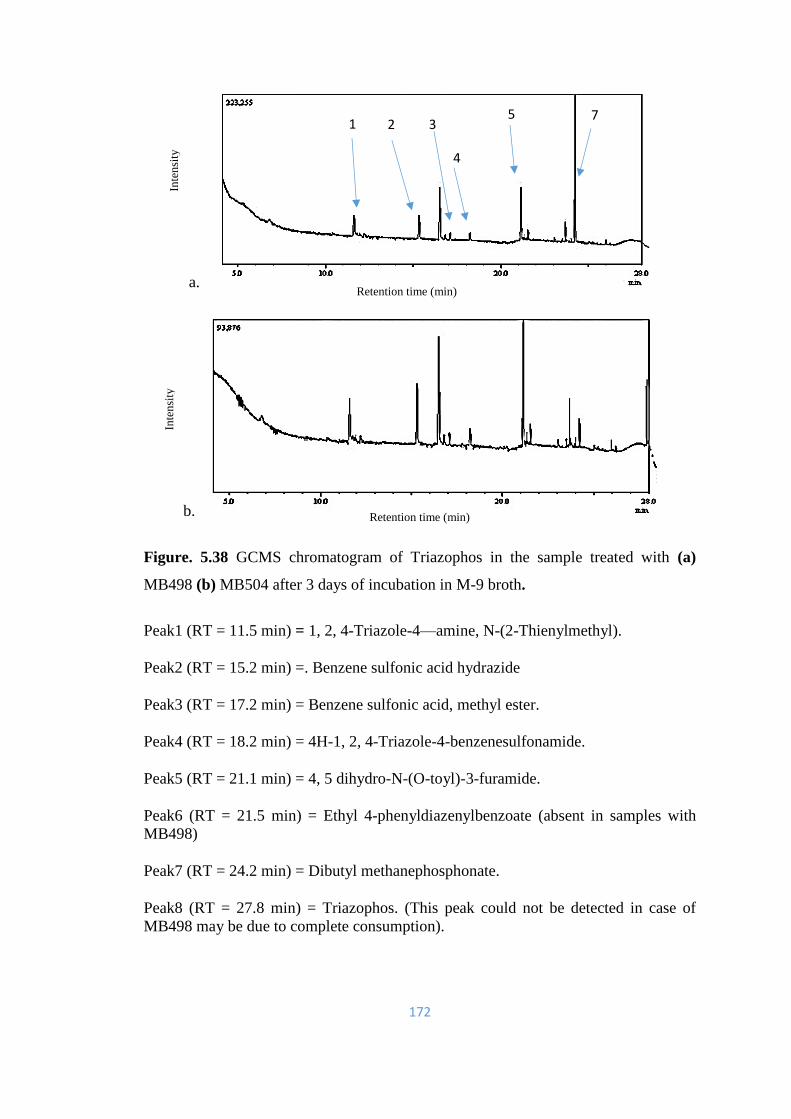
172
a.
b.
Figure. 5.38 GCMS chromatogram of Triazophos in the sample treated with (a)
MB498 (b) MB504 after 3 days of incubation in M-9 broth.
Peak1 (RT = 11.5 min) = 1, 2, 4-Triazole-4—amine, N-(2-Thienylmethyl).
Peak2 (RT = 15.2 min) =. Benzene sulfonic acid hydrazide
Peak3 (RT = 17.2 min) = Benzene sulfonic acid, methyl ester.
Peak4 (RT = 18.2 min) = 4H-1, 2, 4-Triazole-4-benzenesulfonamide.
Peak5 (RT = 21.1 min) = 4, 5 dihydro-N-(O-toyl)-3-furamide.
Peak6 (RT = 21.5 min) = Ethyl 4-phenyldiazenylbenzoate (absent in samples with
MB498)
Peak7 (RT = 24.2 min) = Dibutyl methanephosphonate.
Peak8 (RT = 27.8 min) = Triazophos. (This peak could not be detected in case of
MB498 may be due to complete consumption).
1 2
3
4
5 7
Retention time (min)
Retention time (min)
Inte
nsi
ty
Inte
nsi
ty
1
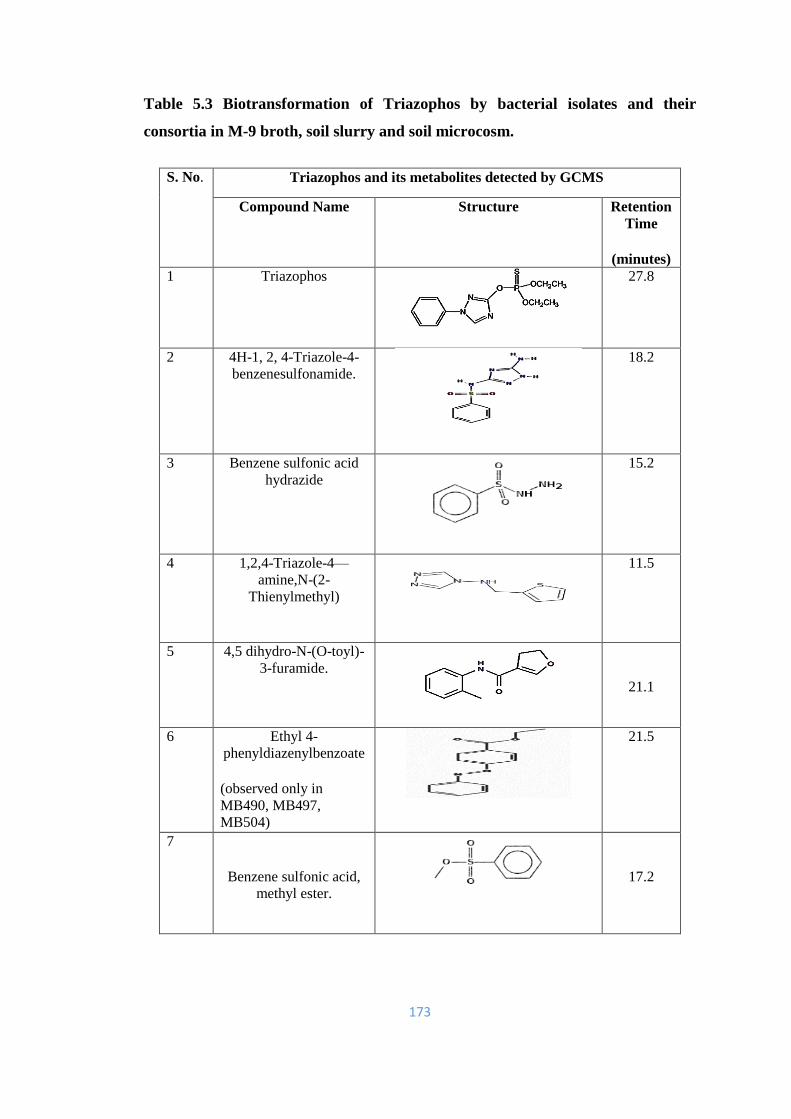
173
Table 5.3 Biotransformation of Triazophos by bacterial isolates and their
consortia in M-9 broth, soil slurry and soil microcosm.
S. No. Triazophos and its metabolites detected by GCMS
Compound Name Structure Retention
Time
(minutes)
1 Triazophos
27.8
2 4H-1, 2, 4-Triazole-4-
benzenesulfonamide.
18.2
3 Benzene sulfonic acid
hydrazide
15.2
4 1,2,4-Triazole-4—
amine,N-(2-
Thienylmethyl)
11.5
5 4,5 dihydro-N-(O-toyl)-
3-furamide.
21.1
6 Ethyl 4-
phenyldiazenylbenzoate
(observed only in
MB490, MB497,
MB504)
21.5
7
Benzene sulfonic acid,
methyl ester.
17.2
174
8 Dibutyl
methanephosphonate
24.2
5.8 Proposed Metabolic Pathway for the biotransformation of TAP by bacterial
isolates MB490, MB497, MB498 and MB504
In the current study, the first step involved in the transformation of Triazophos is the
hydrolytic breakage of the P–O ester bond of Triazophos (figure 5.39) by
organophosphorus phosphatase (OPP) to form 1-phenyl-3-hydroxy-1, 2, 4-triazole (one
of most commonly reported metabolites of TAP though not detected in this form but in
conjugated form in the current study) and Diethylthiophosphate, the most common
initial intermediate of TAP (Wang et al., 2005), though not detected in present study.
It is important to note that Dibutyl methanephosphonate detected at retention time of
24.2 minutes may be formed by alkylation and desulfulrization of Diethylthiophosphate
(figure 5.39). Next 1-phenyl-3-hydroxy-1, 2, 4-triazole is conjugated either with
sulfonamide or thiophene by to form 4H-1, 2, 4-Triazole-4-benzenesulfonamide and 1,
2, 4-Triazole-4—amine, N-(2-Thienylmethyl) respectively by two parallel reactions.
The former of the two products is hydrolyzed/oxidized to Benzene sulfonic acid
hydrazide which is further hydrolyzed in to Benzene sulfonic acid, methyl ester and
hydrazine (not detected in current study). While 1, 2, 4 -Triazole-4—amine, N-(2-
Thienylmethyl) follows two pathways depending upon bacterial strains. Firstly, it is
hydrolyzed to Ethyl 4-phenyldiazenylbenzoate (only in three strains MB490, MB497
and MB504) which ultimately undergoes mineralization. Secondly in general, it is
oxidized to 4, 5 dihydro-N-(O-toyl)-3- furamide followed by desulfurization and
deamination. Further, 4, 5 dihydro-N-(O-toyl)-3- furamide and Benzene sulfonic acid,
methyl ester may undergo mineralization along with Hydrazine and Dibutyl
methanephosphonate. So, most of the products identified in this pathway of TAP
degradation are novel and has been reported first time.
The metabolism of pesticides in bacteria and fungi may involve three phases using
intracellular/extracellular enzymes like hydrolytic enzymes, oxygenases and
peroxidases etc. The phase I may transform the parent compound via oxidation,
reduction, or hydrolysis reactions to give a product that is more water-soluble and
commonly less toxic than the parent compound. In the second phase, a pesticide or its
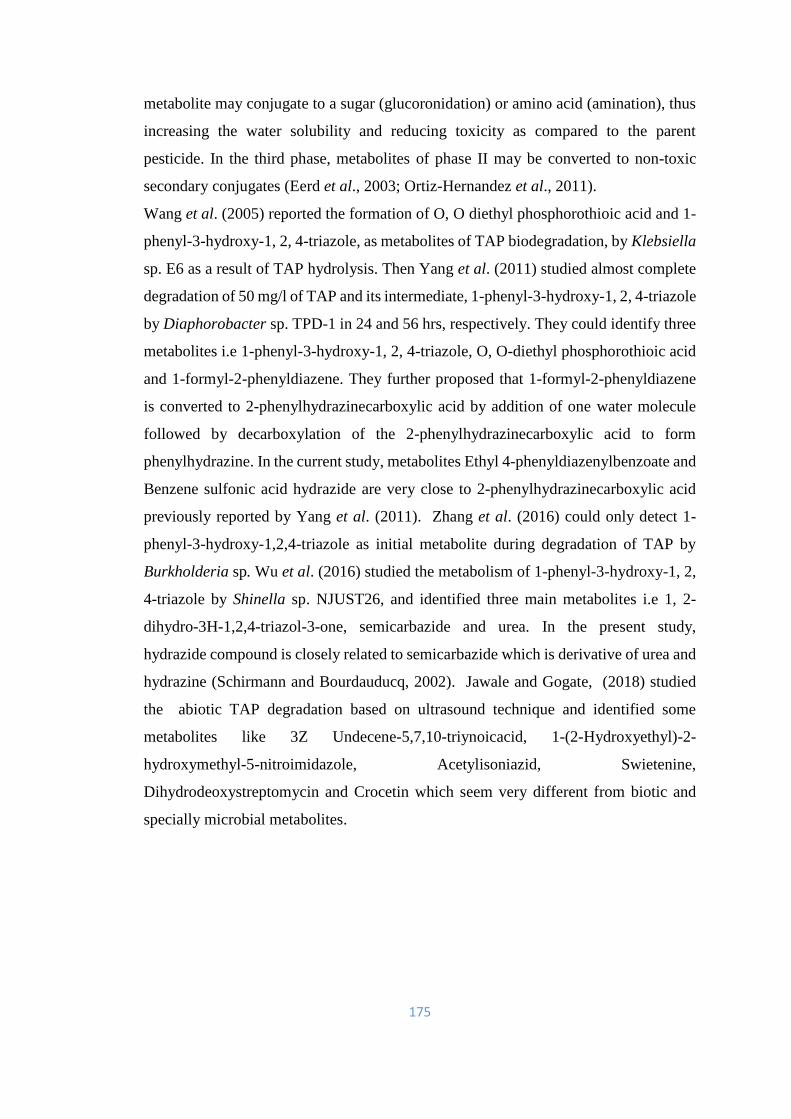
175
metabolite may conjugate to a sugar (glucoronidation) or amino acid (amination), thus
increasing the water solubility and reducing toxicity as compared to the parent
pesticide. In the third phase, metabolites of phase II may be converted to non-toxic
secondary conjugates (Eerd et al., 2003; Ortiz-Hernandez et al., 2011).
Wang et al. (2005) reported the formation of O, O diethyl phosphorothioic acid and 1-
phenyl-3-hydroxy-1, 2, 4-triazole, as metabolites of TAP biodegradation, by Klebsiella
sp. E6 as a result of TAP hydrolysis. Then Yang et al. (2011) studied almost complete
degradation of 50 mg/l of TAP and its intermediate, 1-phenyl-3-hydroxy-1, 2, 4-triazole
by Diaphorobacter sp. TPD-1 in 24 and 56 hrs, respectively. They could identify three
metabolites i.e 1-phenyl-3-hydroxy-1, 2, 4-triazole, O, O-diethyl phosphorothioic acid
and 1-formyl-2-phenyldiazene. They further proposed that 1-formyl-2-phenyldiazene
is converted to 2-phenylhydrazinecarboxylic acid by addition of one water molecule
followed by decarboxylation of the 2-phenylhydrazinecarboxylic acid to form
phenylhydrazine. In the current study, metabolites Ethyl 4-phenyldiazenylbenzoate and
Benzene sulfonic acid hydrazide are very close to 2-phenylhydrazinecarboxylic acid
previously reported by Yang et al. (2011). Zhang et al. (2016) could only detect 1-
phenyl-3-hydroxy-1,2,4-triazole as initial metabolite during degradation of TAP by
Burkholderia sp. Wu et al. (2016) studied the metabolism of 1-phenyl-3-hydroxy-1, 2,
4-triazole by Shinella sp. NJUST26, and identified three main metabolites i.e 1, 2-
dihydro-3H-1,2,4-triazol-3-one, semicarbazide and urea. In the present study,
hydrazide compound is closely related to semicarbazide which is derivative of urea and
hydrazine (Schirmann and Bourdauducq, 2002). Jawale and Gogate, (2018) studied
the abiotic TAP degradation based on ultrasound technique and identified some
metabolites like 3Z Undecene-5,7,10-triynoicacid, 1-(2-Hydroxyethyl)-2-
hydroxymethyl-5-nitroimidazole, Acetylisoniazid, Swietenine,
Dihydrodeoxystreptomycin and Crocetin which seem very different from biotic and
specially microbial metabolites.
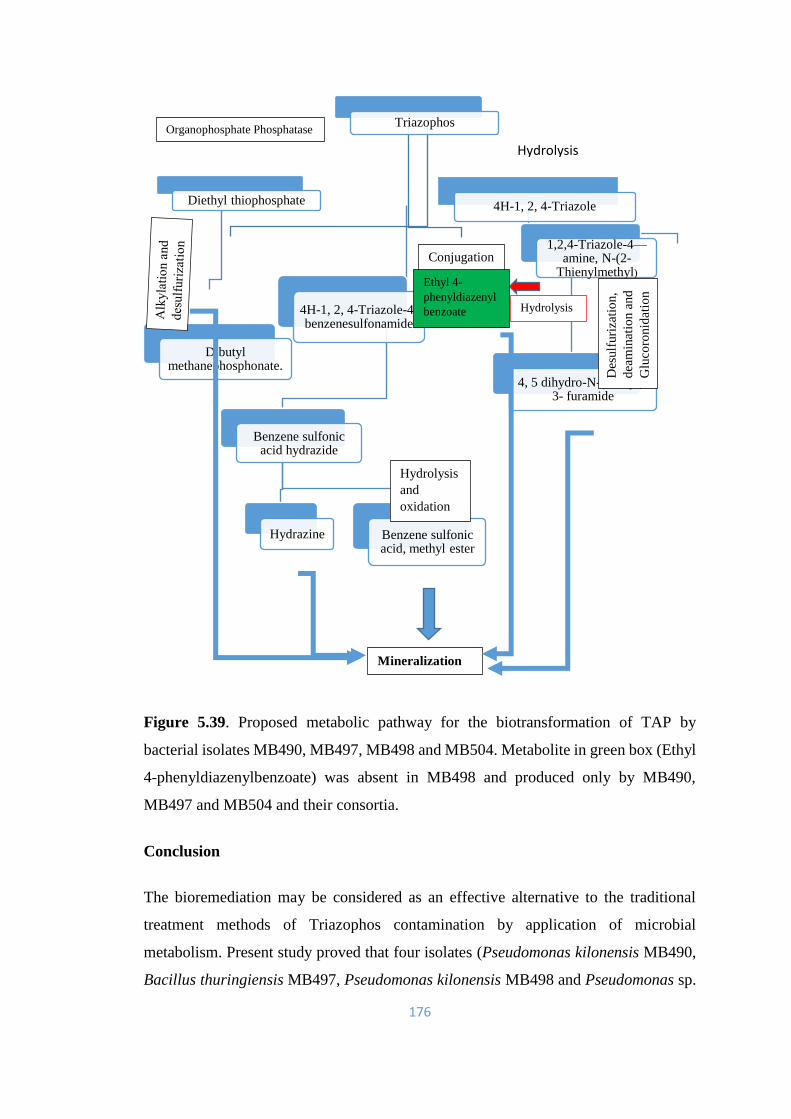
176
Figure 5.39. Proposed metabolic pathway for the biotransformation of TAP by
bacterial isolates MB490, MB497, MB498 and MB504. Metabolite in green box (Ethyl
4-phenyldiazenylbenzoate) was absent in MB498 and produced only by MB490,
MB497 and MB504 and their consortia.
Conclusion
The bioremediation may be considered as an effective alternative to the traditional
treatment methods of Triazophos contamination by application of microbial
metabolism. Present study proved that four isolates (Pseudomonas kilonensis MB490,
Bacillus thuringiensis MB497, Pseudomonas kilonensis MB498 and Pseudomonas sp.
Triazophos
Diethyl thiophosphate
Dibutyl methanephosphonate.
4H-1, 2, 4-Triazole
4H-1, 2, 4-Triazole-4-benzenesulfonamide
Benzene sulfonic acid hydrazide
Hydrazine Benzene sulfonic acid, methyl ester
1,2,4-Triazole-4—amine, N-(2-
Thienylmethyl)
4, 5 dihydro-N-(O-toyl)-3- furamide
Mineralization
Organophosphate Phosphatase
Hydrolysis
Conjugation
Hydrolysis
and
oxidation
Des
ulf
uri
zati
on,
dea
min
atio
n a
nd
Glu
coro
nid
atio
n Ethyl 4-
phenyldiazenyl
benzoate Hydrolysis
177
MB504) and their consortia were capable of degrading and transforming TAP into
simple products. Moreover, novel metabolites (1, 2, 4-Triazole-4—amine, N-(2-
Thienylmethyl), Benzene sulfonic acid hydrazide, Benzene sulfonic acid, methyl ester.
4H-1, 2, 4-Triazole-4-benzenesulfonamide, 4, 5 dihydro-N-(O-toyl)-3-furamide, Ethyl
4-phenyldiazenylbenzoate, Dibutyl methanephosphonate) of TAP were produced by
these bacterial strains indicating presence of some unique genes/enzymes. Therefore
these isolates would be valuable for the investigation of new bioremediation approaches
for TAP contaminated sites like agricultural soils and water bodies.
178
Chapter 6
Biodegradation and biotransformation of OP pesticide Dimethoate
(DM)
Overview
Four isolates and their seven consortia were analyzed by HPLC for Dimethoate (DM)
degradation alongwith their growth being monitored at 600 nm (using UV-VIS
Spectrophotometer) at different pHs (6, 7, and 8) and incubation temperatures (25, 30
and 37◦C) for 24 hrs. The isolates and their consortia exhibited good potential to degrade
DM (200 mg/l) under wider range of pH and temperatures with 40.01 to 77.69%
degradation. The MB490 and MB497 proved best DM degraders at all pHs (6, 7 and 8)
thus showing that DM degradation by these isolates was pH independent. Strains
MB498 and MB504 showed best DM degradation at pH 7. All consortia showed
maximum DM degradation in alkaline pH 8. Optimum temperature for DM degradation
by the isolates and their consortia ranged from 25- 30◦C. More DM degradation under
shaking conditions with more growth was exhibited by all isolates and consortia.
Isolates and their consortia showed 80.1 to 99.90% DM degradation in M-9 broth within
9 days, while it ranged from 77.67 to 93.06% in soil slurry and 77.89 to 89.99% in soil
microcosm. The GCMS analysis of bacterial isolates in M-9 broth, soil slurry and soil
microcosm at different intervals revealed that DM (RT = 17.7 min) was metabolized
into 5 products i.e Methyl diethanol amine, Phosphonothioic acid propyl-O, S-dimethyl
ester, O, O, O- Trimethyl thiophosphate, Omethoate and Aspartylglycine ethyl ester.
Background
Dimethoate is an organophosphate systemic insecticide used to control various insect
pests like Acari, Aphididae, Aleyrodidae, Lepidoptera etc. in cereals, fruits and
vegetables. It is also used for the control of domestic and veterinary insects (Hayes and
Laws, 1990). Dimethoate is toxic to mammals and is declared as a possible carcinogenic
agent in humans, as it caused tumors in exposed mice (US EPA, 2006). Being an
organophosphate, dimethoate is an acetyl cholinesterase inhibitor, and thus is a
neurotoxic agent (Tomlin, 2009). Dimethoate is depleted from the soil by the process
179
of leaching, evaporation and biodegradation with half-life ranging from 4-16 days
(Megeed and El-Nakieb, 2008). It is hydrolyzed to O, O-dimethyl dithiophosphoric acid
in plants and animals (Megeed and Mlilo, 2014). Dimethoate belongs to carbamate
group of organophosphate and thus is not easily degraded. The stability of dimethoate
in the environment depends upon pH, temperature and the type of medium. In the
environment, biotic degradation and metabolic reactions by microbes play a very
important role not only for the removal of the original pesticides, but also for
transformation of pesticide, thus changing their properties and affecting their spread in
various environmental sections (Megeed and El-Nakieb, 2008). Only few bacteria
having potential to degrade Dimethoate have been reported (Liu et al., 2001; Jiang et
al., 2007; DebMandal et al., 2008). The two DM degrading enzymes have been isolated
from Aspergillus niger and Klebsiella sp. (Liu et al., 2001; Jiang et al., 2007). In
Pakistan, Dimethoate and other OP pesticides are extensively being used to control
pests. This has resulted in contamination of agricultural soils, water resources and even
food crops. Earlier, there have been no reports on DM degrading bacteria in Pakistan.
This is the first study in Pakistan about isolation and characterization of indigenous soil
bacteria in order to evaluate their potential to tolerate and degrade DM under local
conditions and to identify the metabolites of Dimethoate formed so as to understand the
transformation pathway of DM in these selected isolates.
Results and Discussion
6.1 Optimization of environmental conditions for Dimethoate biodegradation
Multiple experiments were conducted to optimize the four isolates and their seven
consortia for Dimethoate (DM) degradation at different pH (6, 7, and 8) under shaking
conditions and at different incubation temperatures (25, 30 and 37◦C) under static
conditions within 24 hrs. The isolates and consortia were also monitored for their
growth under different conditions at 600 nm using UV-VIS Spectrophotometer. The
isolates and their consortia exhibited 40.01 to 77.69% DM degradation under wider
range of pH and temperatures. Strains MB490 and MB497 were best DM degraders at
all given pHs i.e 6, 7 and 8 indicating pH had no effect on DM degradation by these
isolates. Strain MB498 was best DM degrader at pH 7 and 8, while MB504 showed
maximum degradation at pH 7 (figure 6.1). In case of consortia, maximum DM
180
degradation was observed at alkaline pH8 (figure 6.3), thus indicating contribution of
alkaline phosphatases or other pH dependent degrading enzymes. Earlier Megeed and
El-Nakieb (2008) reported that acidic pH range support biotransformation of DM which
is in contrast to current study results.
Bacterial strains MB490 and MB497 exhibited maximum DM degradation both at 25
and 30◦C (figure 6.2). While MB498 and MB504 were best degraders of DM at 25◦C.
Consortia A and C exhibited maximum DM degradation at 25◦C, while consortia B, D,
E, F and G showed highest degradation at 30◦C with good growth (figure 6.4). Liang et
al. (2009) isolated a bacterium Raoultella sp. that could degrade DM at 30◦C and pH
6–8. Maximum abiotic DM degradation (2%) was observed at pH 7 and at 37◦C in the
control, thus demonstrating a vital contribution of bacterial isolates in DM degradation.
In some cases, bacterial growth pattern was not in accordance with their rate of
degradation, as least bacterial growth exhibited highest DM degradation and vice versa
(figure 6.1, 6.2, 6.3 & 6.4). This growth pattern may either be due to death of bacteria
by toxic metabolites formed during DM degradation or utilization of all bacterial
machinery and energy for the production of OP degrading enzymes rather than cell
division (Yale et al., 2017). All isolates and consortia exhibited better DM degradation
(49.41- 64.99%) under shaking conditions with more growth after 24 hrs in contrast to
static conditions of incubation (31.87-50.87%), which may be due to more aeration
supporting aerobic bacterial growth and producing more degrading enzymes as well as
shaking conditions, increase solubility and availability of pesticide as depicted (figures
6.5 & 6.6).
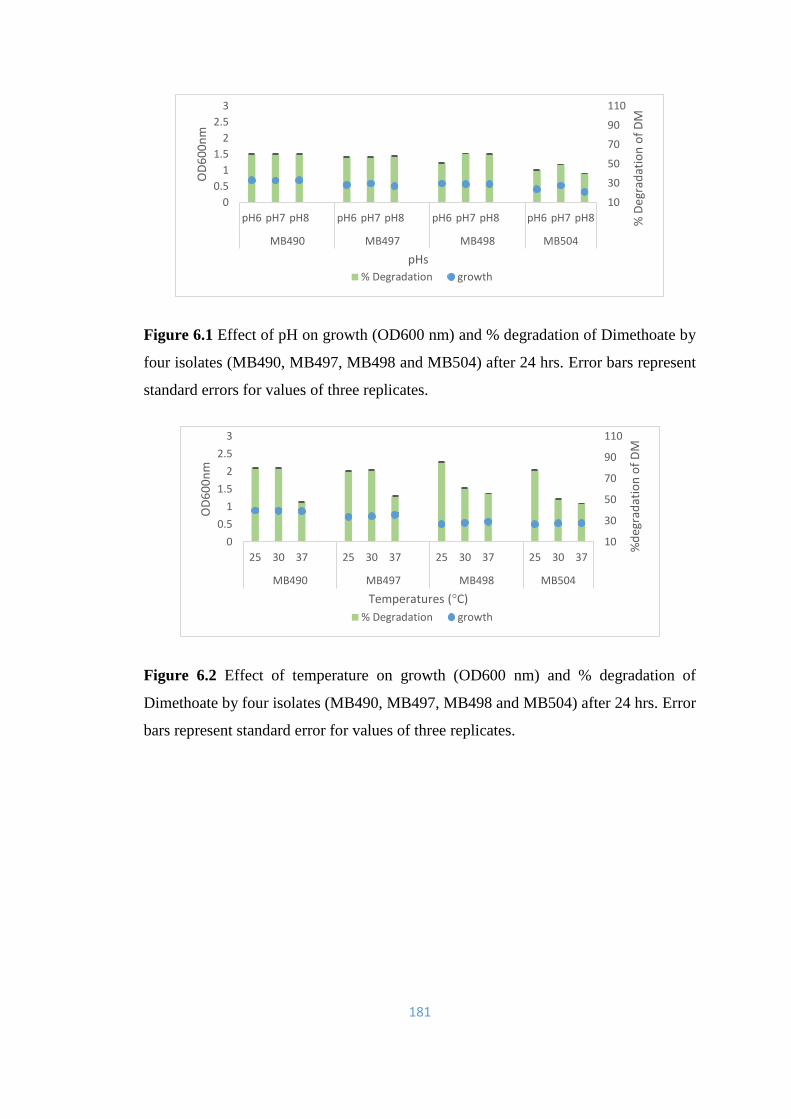
181
Figure 6.1 Effect of pH on growth (OD600 nm) and % degradation of Dimethoate by
four isolates (MB490, MB497, MB498 and MB504) after 24 hrs. Error bars represent
standard errors for values of three replicates.
Figure 6.2 Effect of temperature on growth (OD600 nm) and % degradation of
Dimethoate by four isolates (MB490, MB497, MB498 and MB504) after 24 hrs. Error
bars represent standard error for values of three replicates.
10
30
50
70
90
110
0
0.5
1
1.5
2
2.5
3
pH6 pH7 pH8 pH6 pH7 pH8 pH6 pH7 pH8 pH6 pH7 pH8
MB490 MB497 MB498 MB504
% D
egra
dat
ion
of
DM
OD
60
0n
m
pHs
% Degradation growth
10
30
50
70
90
110
0
0.5
1
1.5
2
2.5
3
25 30 37 25 30 37 25 30 37 25 30 37
MB490 MB497 MB498 MB504
%d
egra
dat
ion
of
DM
OD
60
0n
m
Temperatures (°C)
% Degradation growth

182
Figure 6.3 Effect of pH on growth (OD600 nm) and % degradation of Dimethoate 7
consortia (A, B, C, D, E, F, and G) after 24 hrs. Error bars represent standard errors for
values of three replicates.
Figure 6.4 Effect of temperature on growth (OD600 nm) and % degradation of
Dimethoate by 7 consortia (A, B, C, D, E, F, and G) after 24 hrs. Error bars represent
standard errors for values of three replicates.
10
30
50
70
90
110
0
0.5
1
1.5
2
2.5
3
6 7 8 6 7 8 6 7 8 6 7 8 6 7 8 6 7 8 6 7 8
A B C D E F G
% D
egra
dat
ion
OD
60
0n
m
pHs
% Degradation growth
10
30
50
70
90
110
0
0.5
1
1.5
2
2.5
3
25
30
37
25
30
37
25
30
37
25
30
37
25
30
37
25
30
37
25
30
37
A B C D E F G%
Deg
rad
atio
n o
f D
M
OD
60
0n
m
Temperatures °C
% Degradation growth

183
Figure 6.5 Effect of Shaking versus static conditions on growth and % degradation of
Dimethoate by four isolates (MB490, MB497, MB498 and MB504) after 24 hrs. Error
bars represent standard errors for values of three replicates.
Figure 6.6 Effect of Shaking versus static conditions on growth and % degradation of
Dimethoate by seven consortia (A, B, C, D, E, F, and G) after 24 hrs. Error bars
represent standard errors for values of three replicates.
6.2 Effect of incubation period on bacterial growth and % degradation of DM in
M-9 broth
Isolates MB490, MB497, MB498, MB504 and their consortia (A, B, C, D, E, F and G)
were grown in M-9 broth supplemented with 200 mg/l of DM and analyzed
10
30
50
70
90
110
0
0.5
1
1.5
2
2.5
3
MB490 MB497 MB498 MB504 MB490 MB497 MB498 MB504
Shaking conditions static conditions
%D
M D
egra
dat
ion
OD
60
0n
m
%Degradation Growth
10
30
50
70
90
110
0
0.5
1
1.5
2
2.5
3
A B C D E F G A B C D E F G
Shaking conditions Static conditions
% D
egra
dat
ion
of
DM
OD
60
0n
m
% Degradation Growth
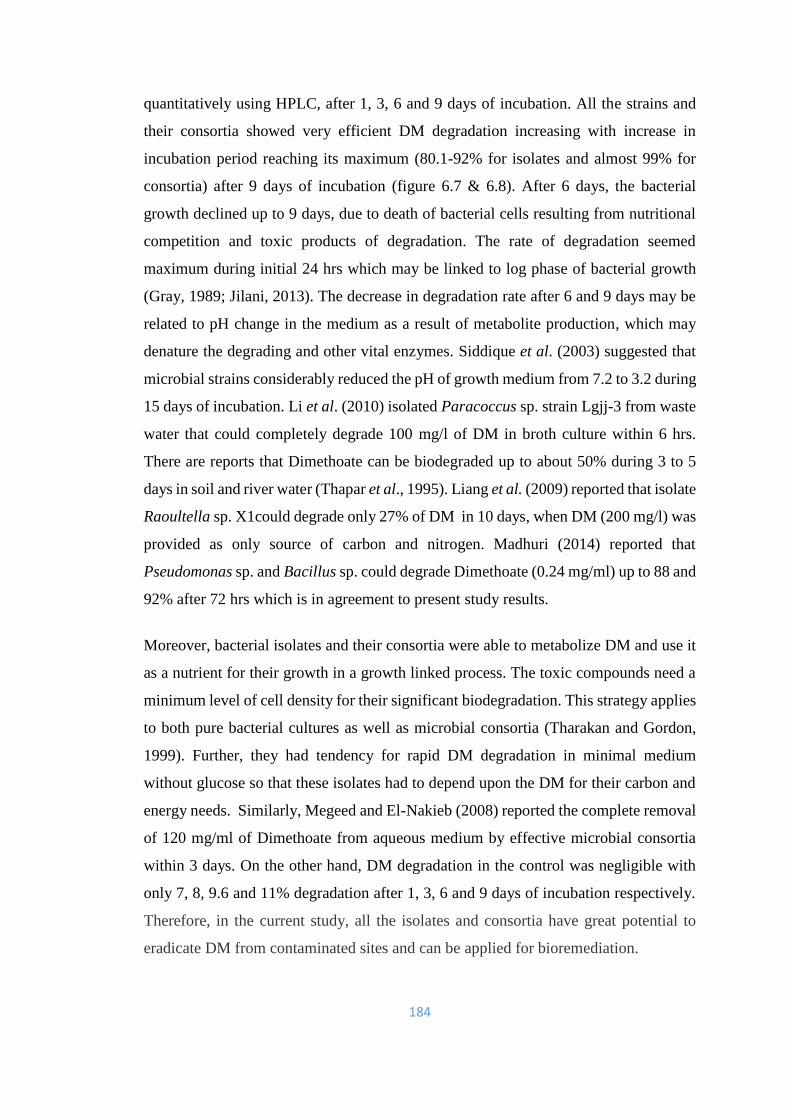
184
quantitatively using HPLC, after 1, 3, 6 and 9 days of incubation. All the strains and
their consortia showed very efficient DM degradation increasing with increase in
incubation period reaching its maximum (80.1-92% for isolates and almost 99% for
consortia) after 9 days of incubation (figure 6.7 & 6.8). After 6 days, the bacterial
growth declined up to 9 days, due to death of bacterial cells resulting from nutritional
competition and toxic products of degradation. The rate of degradation seemed
maximum during initial 24 hrs which may be linked to log phase of bacterial growth
(Gray, 1989; Jilani, 2013). The decrease in degradation rate after 6 and 9 days may be
related to pH change in the medium as a result of metabolite production, which may
denature the degrading and other vital enzymes. Siddique et al. (2003) suggested that
microbial strains considerably reduced the pH of growth medium from 7.2 to 3.2 during
15 days of incubation. Li et al. (2010) isolated Paracoccus sp. strain Lgjj-3 from waste
water that could completely degrade 100 mg/l of DM in broth culture within 6 hrs.
There are reports that Dimethoate can be biodegraded up to about 50% during 3 to 5
days in soil and river water (Thapar et al., 1995). Liang et al. (2009) reported that isolate
Raoultella sp. X1could degrade only 27% of DM in 10 days, when DM (200 mg/l) was
provided as only source of carbon and nitrogen. Madhuri (2014) reported that
Pseudomonas sp. and Bacillus sp. could degrade Dimethoate (0.24 mg/ml) up to 88 and
92% after 72 hrs which is in agreement to present study results.
Moreover, bacterial isolates and their consortia were able to metabolize DM and use it
as a nutrient for their growth in a growth linked process. The toxic compounds need a
minimum level of cell density for their significant biodegradation. This strategy applies
to both pure bacterial cultures as well as microbial consortia (Tharakan and Gordon,
1999). Further, they had tendency for rapid DM degradation in minimal medium
without glucose so that these isolates had to depend upon the DM for their carbon and
energy needs. Similarly, Megeed and El-Nakieb (2008) reported the complete removal
of 120 mg/ml of Dimethoate from aqueous medium by effective microbial consortia
within 3 days. On the other hand, DM degradation in the control was negligible with
only 7, 8, 9.6 and 11% degradation after 1, 3, 6 and 9 days of incubation respectively.
Therefore, in the current study, all the isolates and consortia have great potential to
eradicate DM from contaminated sites and can be applied for bioremediation.
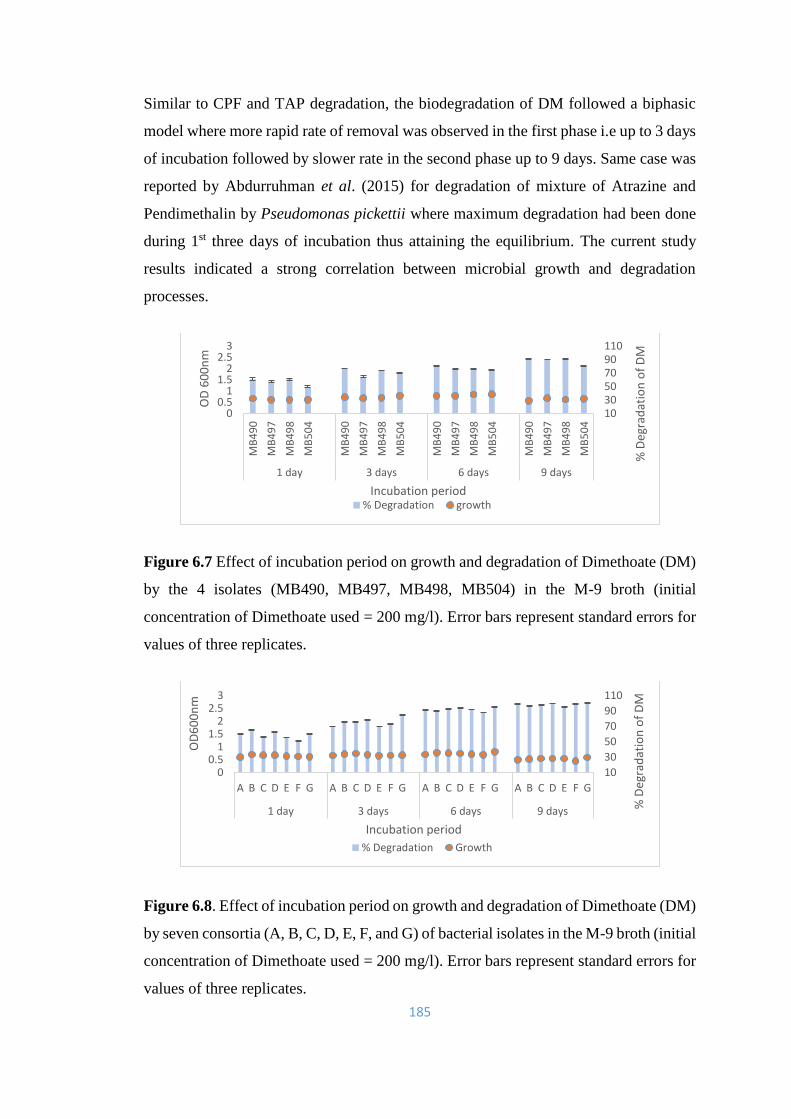
185
Similar to CPF and TAP degradation, the biodegradation of DM followed a biphasic
model where more rapid rate of removal was observed in the first phase i.e up to 3 days
of incubation followed by slower rate in the second phase up to 9 days. Same case was
reported by Abdurruhman et al. (2015) for degradation of mixture of Atrazine and
Pendimethalin by Pseudomonas pickettii where maximum degradation had been done
during 1st three days of incubation thus attaining the equilibrium. The current study
results indicated a strong correlation between microbial growth and degradation
processes.
Figure 6.7 Effect of incubation period on growth and degradation of Dimethoate (DM)
by the 4 isolates (MB490, MB497, MB498, MB504) in the M-9 broth (initial
concentration of Dimethoate used = 200 mg/l). Error bars represent standard errors for
values of three replicates.
Figure 6.8. Effect of incubation period on growth and degradation of Dimethoate (DM)
by seven consortia (A, B, C, D, E, F, and G) of bacterial isolates in the M-9 broth (initial
concentration of Dimethoate used = 200 mg/l). Error bars represent standard errors for
values of three replicates.
1030507090110
00.5
11.5
22.5
3
MB
49
0
MB
49
7
MB
49
8
MB
50
4
MB
49
0
MB
49
7
MB
49
8
MB
50
4
MB
49
0
MB
49
7
MB
49
8
MB
50
4
MB
49
0
MB
49
7
MB
49
8
MB
50
4
1 day 3 days 6 days 9 days
% D
egra
dat
ion
of
DM
OD
60
0n
m
Incubation period% Degradation growth
10
30
50
70
90
110
00.5
11.5
22.5
3
A B C D E F G A B C D E F G A B C D E F G A B C D E F G
1 day 3 days 6 days 9 days % D
egra
dat
ion
of
DM
OD
60
0n
m
Incubation period
% Degradation Growth
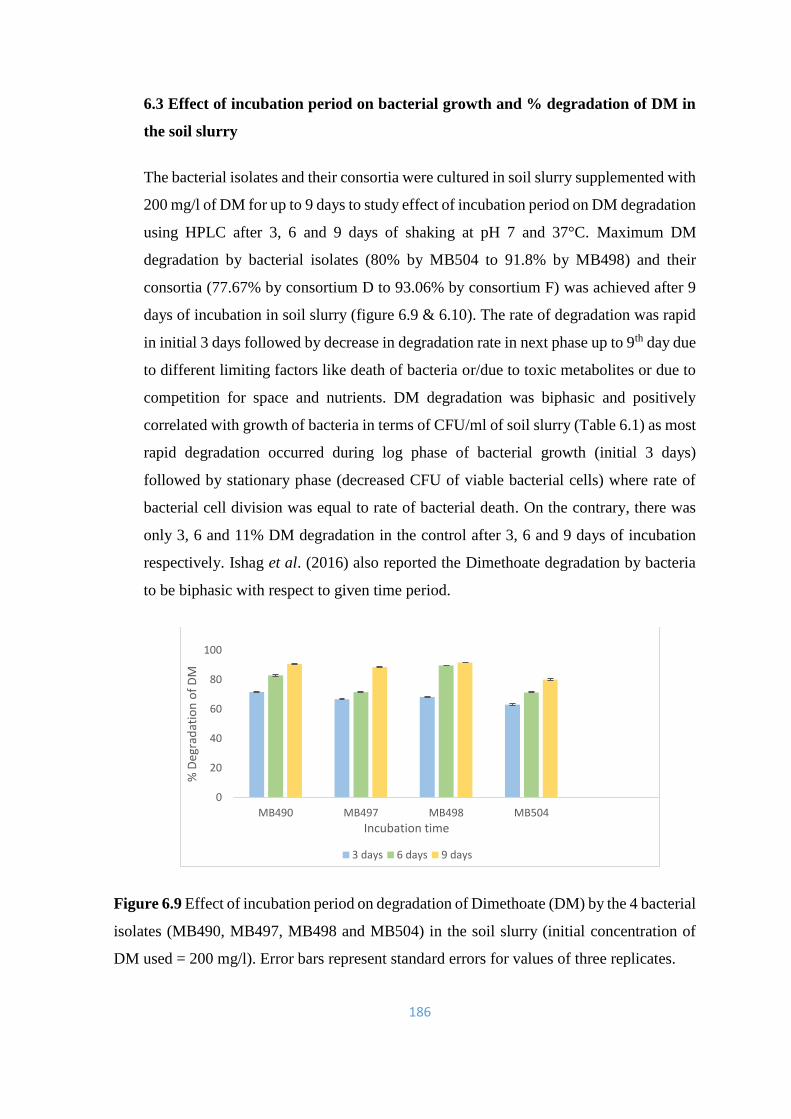
186
6.3 Effect of incubation period on bacterial growth and % degradation of DM in
the soil slurry
The bacterial isolates and their consortia were cultured in soil slurry supplemented with
200 mg/l of DM for up to 9 days to study effect of incubation period on DM degradation
using HPLC after 3, 6 and 9 days of shaking at pH 7 and 37°C. Maximum DM
degradation by bacterial isolates (80% by MB504 to 91.8% by MB498) and their
consortia (77.67% by consortium D to 93.06% by consortium F) was achieved after 9
days of incubation in soil slurry (figure 6.9 & 6.10). The rate of degradation was rapid
in initial 3 days followed by decrease in degradation rate in next phase up to 9th day due
to different limiting factors like death of bacteria or/due to toxic metabolites or due to
competition for space and nutrients. DM degradation was biphasic and positively
correlated with growth of bacteria in terms of CFU/ml of soil slurry (Table 6.1) as most
rapid degradation occurred during log phase of bacterial growth (initial 3 days)
followed by stationary phase (decreased CFU of viable bacterial cells) where rate of
bacterial cell division was equal to rate of bacterial death. On the contrary, there was
only 3, 6 and 11% DM degradation in the control after 3, 6 and 9 days of incubation
respectively. Ishag et al. (2016) also reported the Dimethoate degradation by bacteria
to be biphasic with respect to given time period.
Figure 6.9 Effect of incubation period on degradation of Dimethoate (DM) by the 4 bacterial
isolates (MB490, MB497, MB498 and MB504) in the soil slurry (initial concentration of
DM used = 200 mg/l). Error bars represent standard errors for values of three replicates.
0
20
40
60
80
100
MB490 MB497 MB498 MB504
% D
egra
dat
ion
of
DM
Incubation time
3 days 6 days 9 days
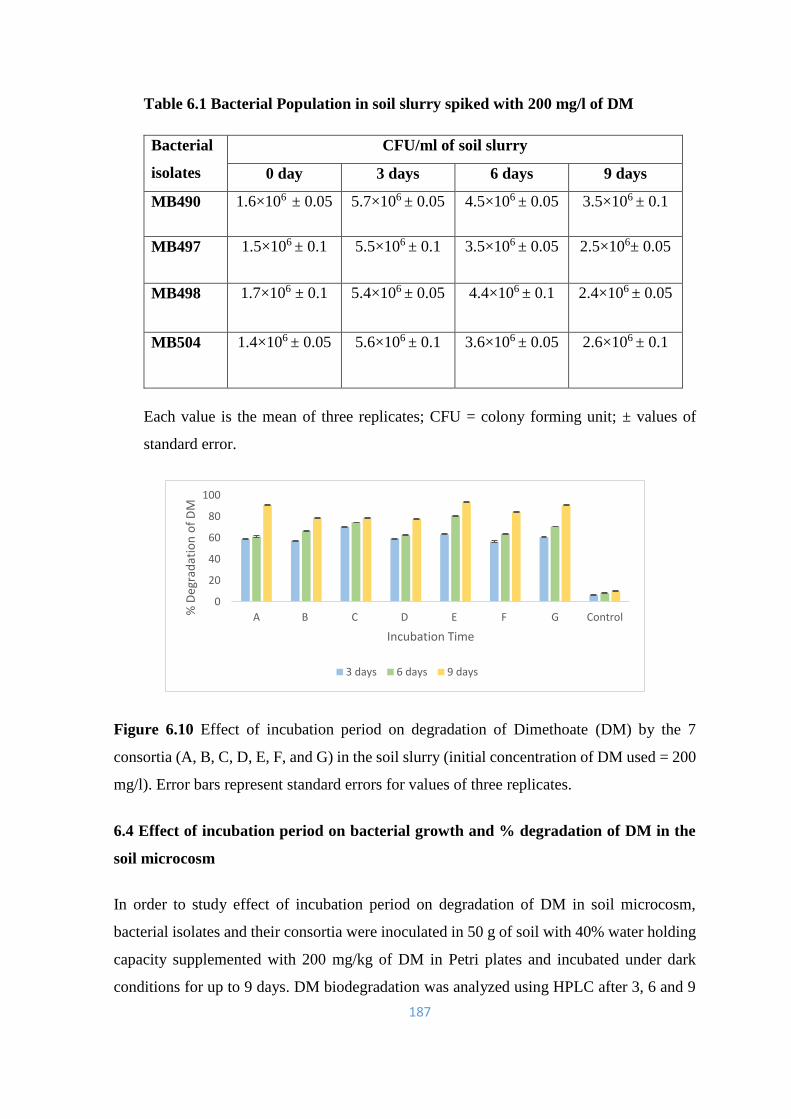
187
Table 6.1 Bacterial Population in soil slurry spiked with 200 mg/l of DM
Bacterial
isolates
CFU/ml of soil slurry
0 day 3 days 6 days 9 days
MB490 1.6×10⁶ ± 0.05 5.7×10⁶ ± 0.05 4.5×10⁶ ± 0.05 3.5×10⁶ ± 0.1
MB497 1.5×10⁶ ± 0.1 5.5×10⁶ ± 0.1 3.5×10⁶ ± 0.05 2.5×10⁶± 0.05
MB498 1.7×10⁶ ± 0.1 5.4×10⁶ ± 0.05 4.4×10⁶ ± 0.1 2.4×10⁶ ± 0.05
MB504 1.4×10⁶ ± 0.05
5.6×10⁶ ± 0.1 3.6×10⁶ ± 0.05 2.6×10⁶ ± 0.1
Each value is the mean of three replicates; CFU = colony forming unit; ± values of
standard error.
Figure 6.10 Effect of incubation period on degradation of Dimethoate (DM) by the 7
consortia (A, B, C, D, E, F, and G) in the soil slurry (initial concentration of DM used = 200
mg/l). Error bars represent standard errors for values of three replicates.
6.4 Effect of incubation period on bacterial growth and % degradation of DM in the
soil microcosm
In order to study effect of incubation period on degradation of DM in soil microcosm,
bacterial isolates and their consortia were inoculated in 50 g of soil with 40% water holding
capacity supplemented with 200 mg/kg of DM in Petri plates and incubated under dark
conditions for up to 9 days. DM biodegradation was analyzed using HPLC after 3, 6 and 9
0
20
40
60
80
100
A B C D E F G Control% D
egra
dat
ion
of
DM
Incubation Time
3 days 6 days 9 days
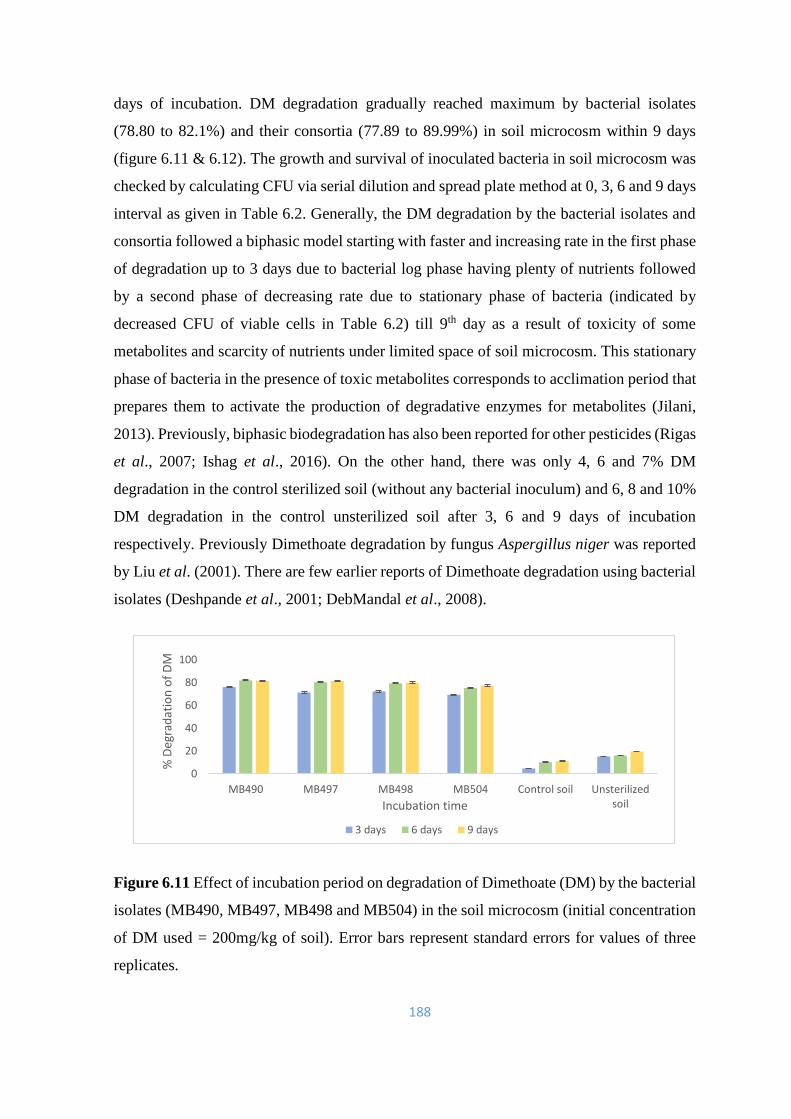
188
days of incubation. DM degradation gradually reached maximum by bacterial isolates
(78.80 to 82.1%) and their consortia (77.89 to 89.99%) in soil microcosm within 9 days
(figure 6.11 & 6.12). The growth and survival of inoculated bacteria in soil microcosm was
checked by calculating CFU via serial dilution and spread plate method at 0, 3, 6 and 9 days
interval as given in Table 6.2. Generally, the DM degradation by the bacterial isolates and
consortia followed a biphasic model starting with faster and increasing rate in the first phase
of degradation up to 3 days due to bacterial log phase having plenty of nutrients followed
by a second phase of decreasing rate due to stationary phase of bacteria (indicated by
decreased CFU of viable cells in Table 6.2) till 9th day as a result of toxicity of some
metabolites and scarcity of nutrients under limited space of soil microcosm. This stationary
phase of bacteria in the presence of toxic metabolites corresponds to acclimation period that
prepares them to activate the production of degradative enzymes for metabolites (Jilani,
2013). Previously, biphasic biodegradation has also been reported for other pesticides (Rigas
et al., 2007; Ishag et al., 2016). On the other hand, there was only 4, 6 and 7% DM
degradation in the control sterilized soil (without any bacterial inoculum) and 6, 8 and 10%
DM degradation in the control unsterilized soil after 3, 6 and 9 days of incubation
respectively. Previously Dimethoate degradation by fungus Aspergillus niger was reported
by Liu et al. (2001). There are few earlier reports of Dimethoate degradation using bacterial
isolates (Deshpande et al., 2001; DebMandal et al., 2008).
Figure 6.11 Effect of incubation period on degradation of Dimethoate (DM) by the bacterial
isolates (MB490, MB497, MB498 and MB504) in the soil microcosm (initial concentration
of DM used = 200mg/kg of soil). Error bars represent standard errors for values of three
replicates.
0
20
40
60
80
100
MB490 MB497 MB498 MB504 Control soil Unsterilizedsoil
% D
egra
dat
ion
of
DM
Incubation time
3 days 6 days 9 days
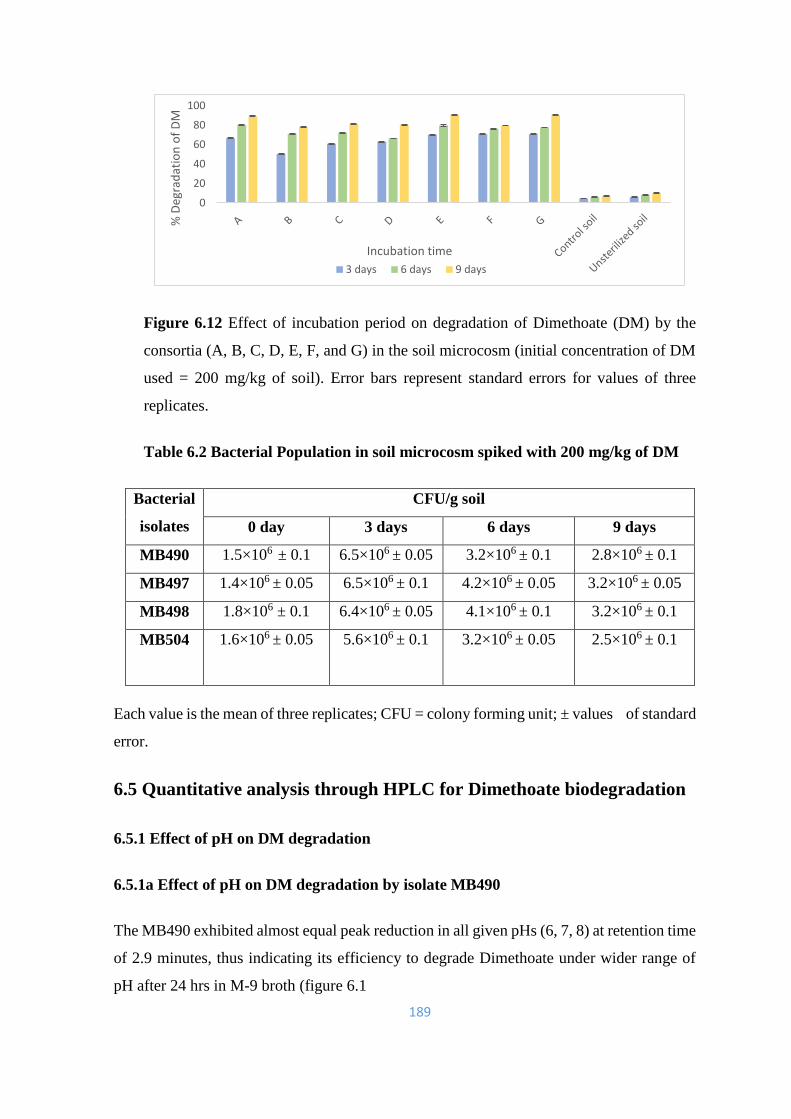
189
Figure 6.12 Effect of incubation period on degradation of Dimethoate (DM) by the
consortia (A, B, C, D, E, F, and G) in the soil microcosm (initial concentration of DM
used = 200 mg/kg of soil). Error bars represent standard errors for values of three
replicates.
Table 6.2 Bacterial Population in soil microcosm spiked with 200 mg/kg of DM
Bacterial
isolates
CFU/g soil
0 day 3 days 6 days 9 days
MB490 1.5×10⁶ ± 0.1 6.5×10⁶ ± 0.05 3.2×10⁶ ± 0.1 2.8×10⁶ ± 0.1
MB497 1.4×10⁶ ± 0.05 6.5×10⁶ ± 0.1 4.2×10⁶ ± 0.05 3.2×10⁶ ± 0.05
MB498 1.8×10⁶ ± 0.1 6.4×10⁶ ± 0.05 4.1×10⁶ ± 0.1 3.2×10⁶ ± 0.1
MB504 1.6×10⁶ ± 0.05
5.6×10⁶ ± 0.1 3.2×10⁶ ± 0.05 2.5×10⁶ ± 0.1
Each value is the mean of three replicates; CFU = colony forming unit; ± values of standard
error.
6.5 Quantitative analysis through HPLC for Dimethoate biodegradation
6.5.1 Effect of pH on DM degradation
6.5.1a Effect of pH on DM degradation by isolate MB490
The MB490 exhibited almost equal peak reduction in all given pHs (6, 7, 8) at retention time
of 2.9 minutes, thus indicating its efficiency to degrade Dimethoate under wider range of
pH after 24 hrs in M-9 broth (figure 6.1
0
20
40
60
80
100
% D
egra
dat
ion
of
DM
Incubation time
3 days 6 days 9 days
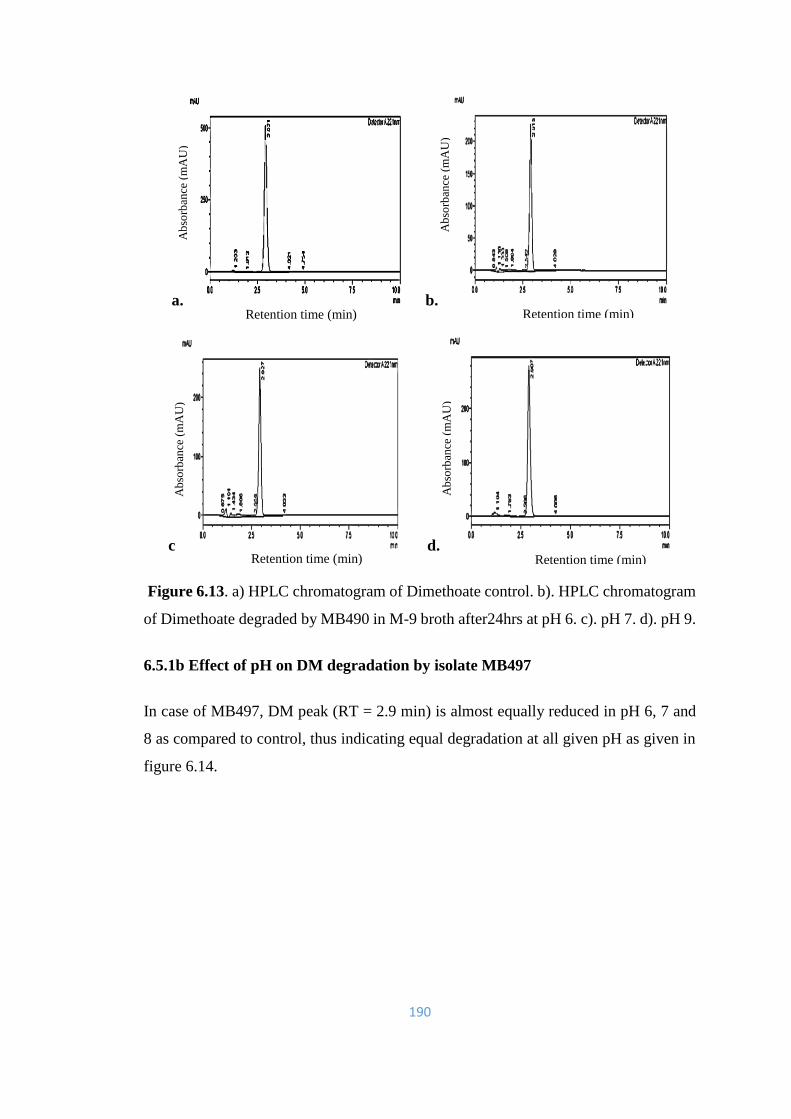
190
a. b.
c d.
Figure 6.13. a) HPLC chromatogram of Dimethoate control. b). HPLC chromatogram
of Dimethoate degraded by MB490 in M-9 broth after24hrs at pH 6. c). pH 7. d). pH 9.
6.5.1b Effect of pH on DM degradation by isolate MB497
In case of MB497, DM peak (RT = 2.9 min) is almost equally reduced in pH 6, 7 and
8 as compared to control, thus indicating equal degradation at all given pH as given in
figure 6.14.
Retention time (min) Retention time (min)
Retention time (min) Retention time (min)
Ab
sorb
ance
(m
AU
)
Ab
sorb
ance
(m
AU
)
Ab
sorb
ance
(m
AU
)
Ab
sorb
ance
(m
AU
)

191
a. b.
c. d.
Figure 6.14. a) HPLC chromatogram of Dimethoate control. b). HPLC chromatogram
of Dimethoate degraded by MB497 in M-9 broth after24hrs at pH 6. c). pH 7. d). pH 9.
6.5.1b Effect of pH on DM degradation by isolate MB498
Isolate MB498 showed same and little more decrease of DM peak (RT = 2.9 min) at
pH 7 and 8 as compared to pH 6 as given in figure 6.15. There are some other peaks at
RT = 1.8 and 1.17 min indicating formation of metabolites.
Retention time (min) Retention time (min)
Retention time (min) Retention time (min)
Ab
sorb
ance
(m
AU
)
Ab
sorb
ance
(m
AU
)
Ab
sorb
ance
(m
AU
)
Ab
sorb
ance
(m
AU
)
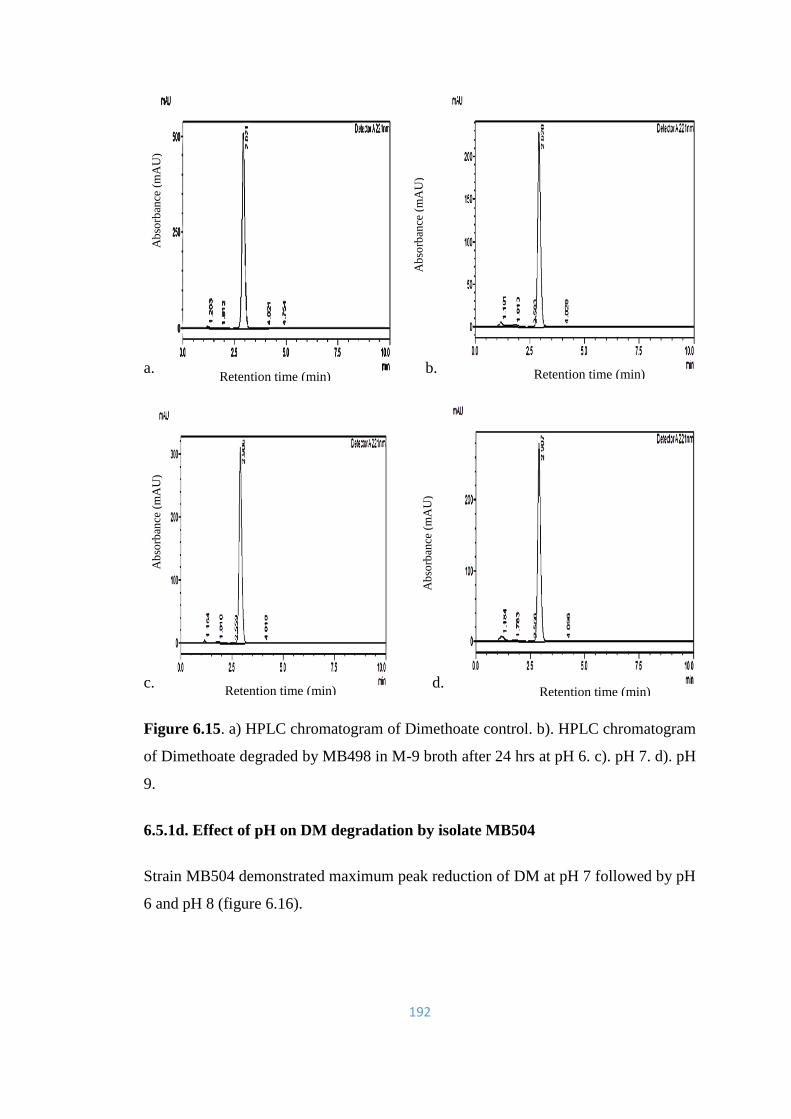
192
a. b.
c. d.
Figure 6.15. a) HPLC chromatogram of Dimethoate control. b). HPLC chromatogram
of Dimethoate degraded by MB498 in M-9 broth after 24 hrs at pH 6. c). pH 7. d). pH
9.
6.5.1d. Effect of pH on DM degradation by isolate MB504
Strain MB504 demonstrated maximum peak reduction of DM at pH 7 followed by pH
6 and pH 8 (figure 6.16).
Retention time (min) Retention time (min)
Retention time (min) Retention time (min)
Ab
sorb
ance
(m
AU
)
Ab
sorb
ance
(m
AU
)
Ab
sorb
ance
(m
AU
)
Ab
sorb
ance
(m
AU
)
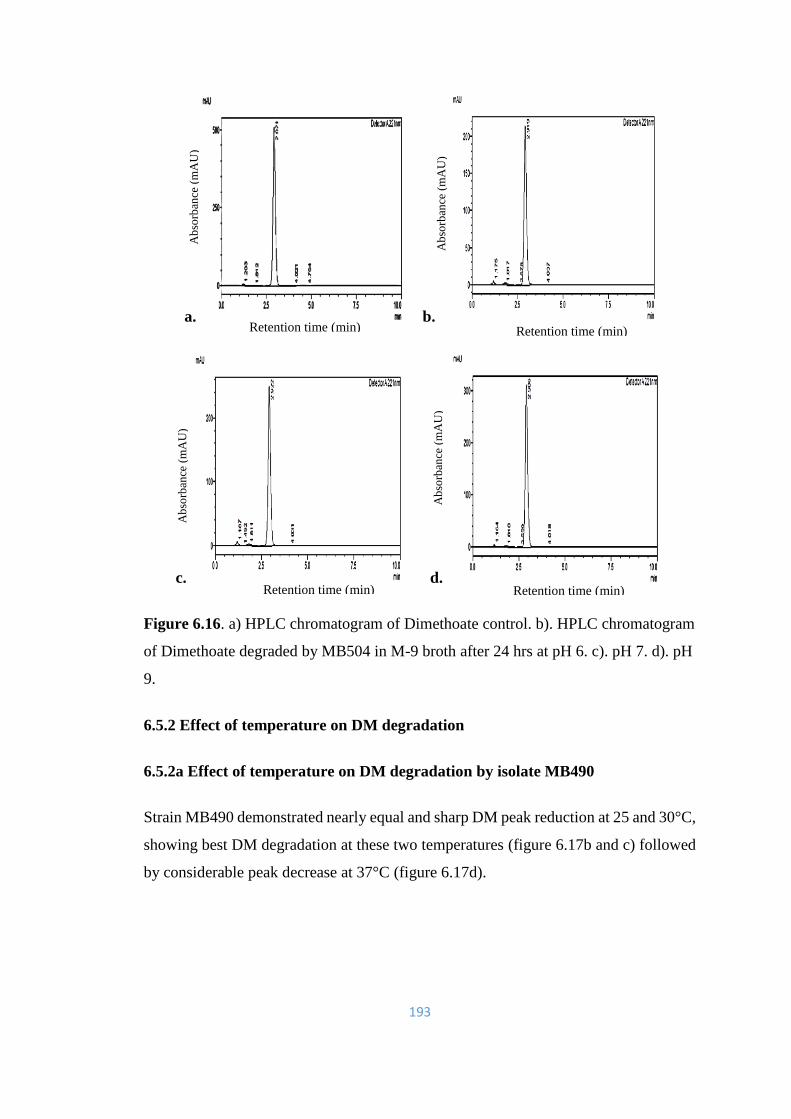
193
a. b.
c. d.
Figure 6.16. a) HPLC chromatogram of Dimethoate control. b). HPLC chromatogram
of Dimethoate degraded by MB504 in M-9 broth after 24 hrs at pH 6. c). pH 7. d). pH
9.
6.5.2 Effect of temperature on DM degradation
6.5.2a Effect of temperature on DM degradation by isolate MB490
Strain MB490 demonstrated nearly equal and sharp DM peak reduction at 25 and 30°C,
showing best DM degradation at these two temperatures (figure 6.17b and c) followed
by considerable peak decrease at 37°C (figure 6.17d).
Retention time (min) Retention time (min)
Retention time (min) Retention time (min)
Ab
sorb
ance
(m
AU
)
Ab
sorb
ance
(m
AU
)
Ab
sorb
ance
(m
AU
)
Ab
sorb
ance
(m
AU
)
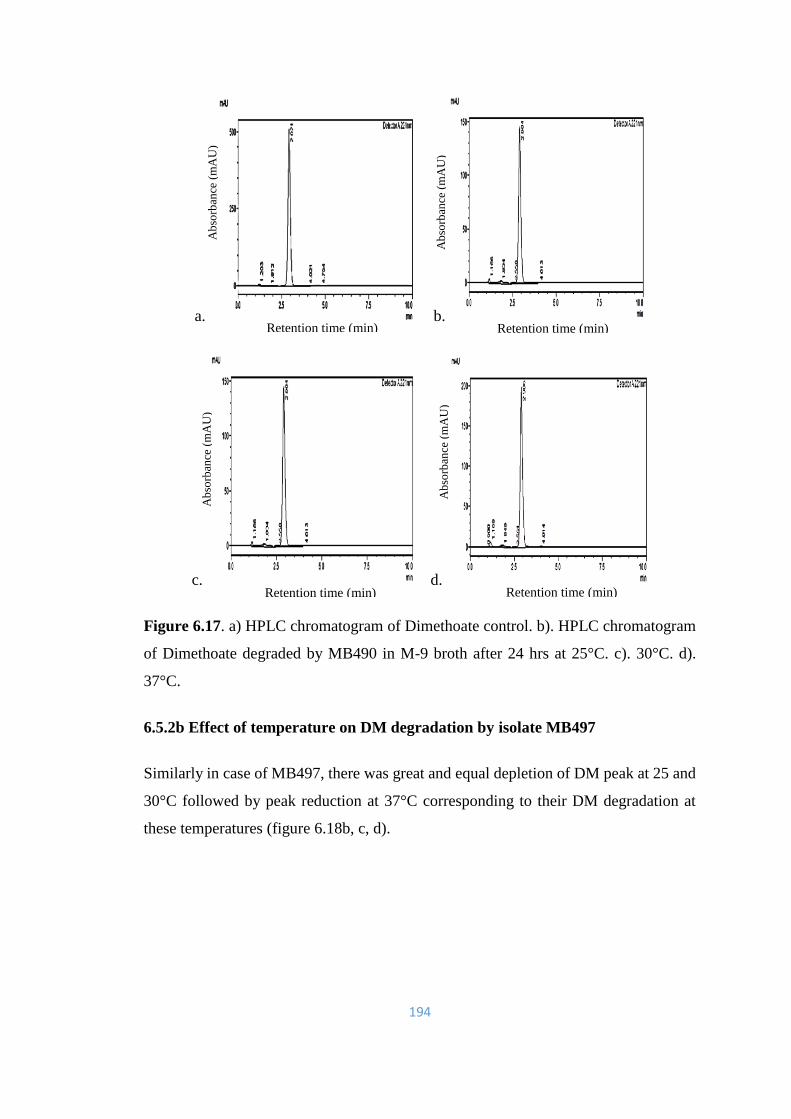
194
a. b.
c. d.
Figure 6.17. a) HPLC chromatogram of Dimethoate control. b). HPLC chromatogram
of Dimethoate degraded by MB490 in M-9 broth after 24 hrs at 25°C. c). 30°C. d).
37°C.
6.5.2b Effect of temperature on DM degradation by isolate MB497
Similarly in case of MB497, there was great and equal depletion of DM peak at 25 and
30°C followed by peak reduction at 37°C corresponding to their DM degradation at
these temperatures (figure 6.18b, c, d).
Retention time (min) Retention time (min)
Retention time (min) Retention time (min)
Ab
sorb
ance
(m
AU
)
Ab
sorb
ance
(m
AU
) A
bso
rban
ce (
mA
U)
Ab
sorb
ance
(m
AU
)
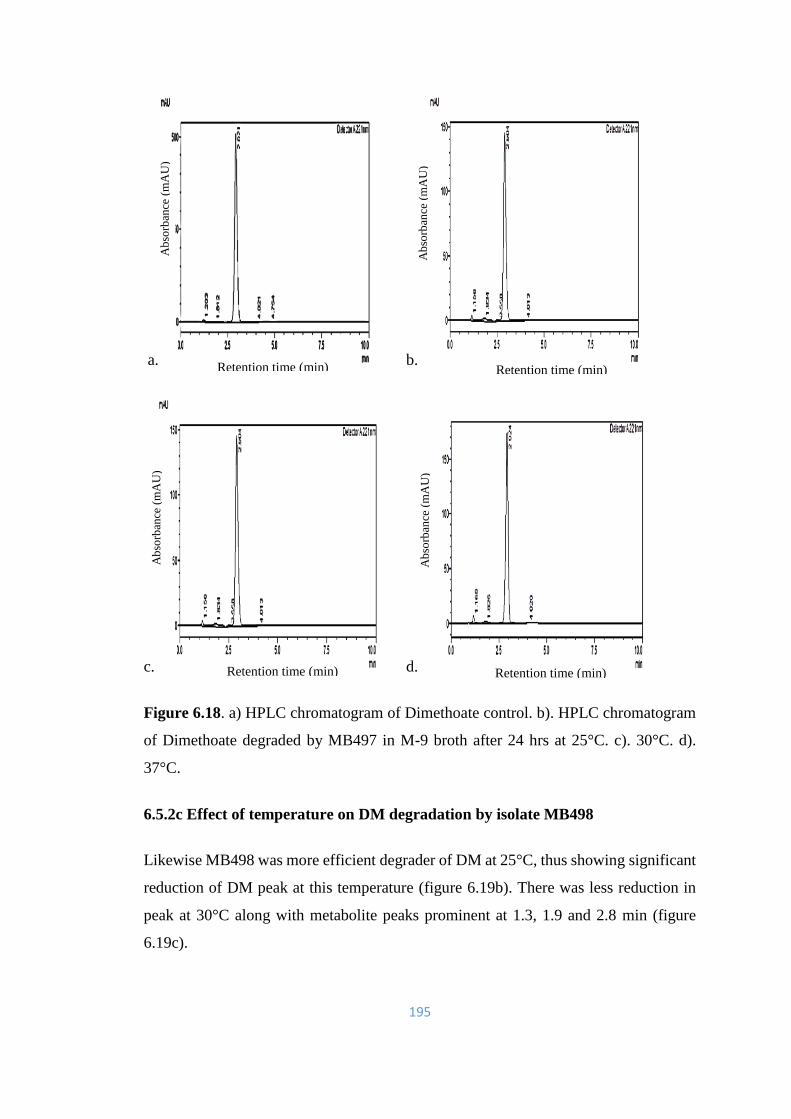
195
a. b.
c. d.
Figure 6.18. a) HPLC chromatogram of Dimethoate control. b). HPLC chromatogram
of Dimethoate degraded by MB497 in M-9 broth after 24 hrs at 25°C. c). 30°C. d).
37°C.
6.5.2c Effect of temperature on DM degradation by isolate MB498
Likewise MB498 was more efficient degrader of DM at 25°C, thus showing significant
reduction of DM peak at this temperature (figure 6.19b). There was less reduction in
peak at 30°C along with metabolite peaks prominent at 1.3, 1.9 and 2.8 min (figure
6.19c).
Retention time (min) Retention time (min)
Retention time (min) Retention time (min)
Ab
sorb
ance
(m
AU
)
Ab
sorb
ance
(m
AU
)
Ab
sorb
ance
(m
AU
)
Ab
sorb
ance
(m
AU
)
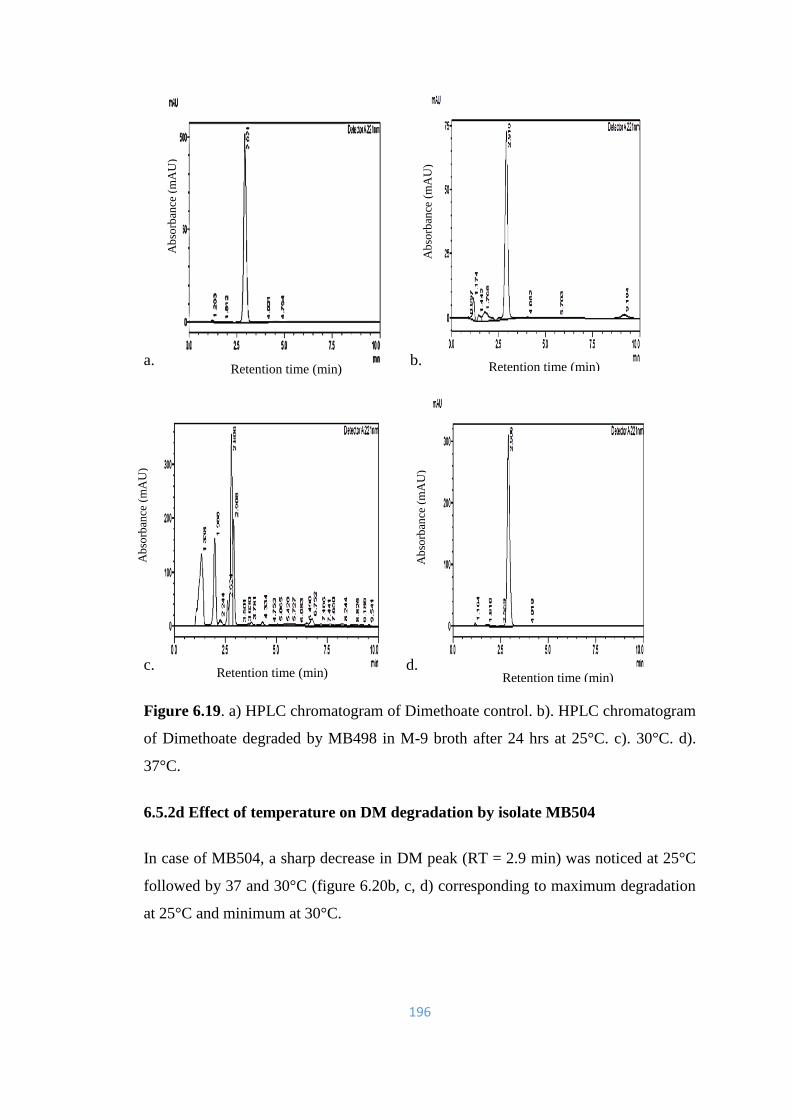
196
a. b.
c. d.
Figure 6.19. a) HPLC chromatogram of Dimethoate control. b). HPLC chromatogram
of Dimethoate degraded by MB498 in M-9 broth after 24 hrs at 25°C. c). 30°C. d).
37°C.
6.5.2d Effect of temperature on DM degradation by isolate MB504
In case of MB504, a sharp decrease in DM peak (RT = 2.9 min) was noticed at 25°C
followed by 37 and 30°C (figure 6.20b, c, d) corresponding to maximum degradation
at 25°C and minimum at 30°C.
Retention time (min) Retention time (min)
Retention time (min) Retention time (min)
Ab
sorb
ance
(m
AU
)
Ab
sorb
ance
(m
AU
)
Ab
sorb
ance
(m
AU
)
Ab
sorb
ance
(m
AU
)
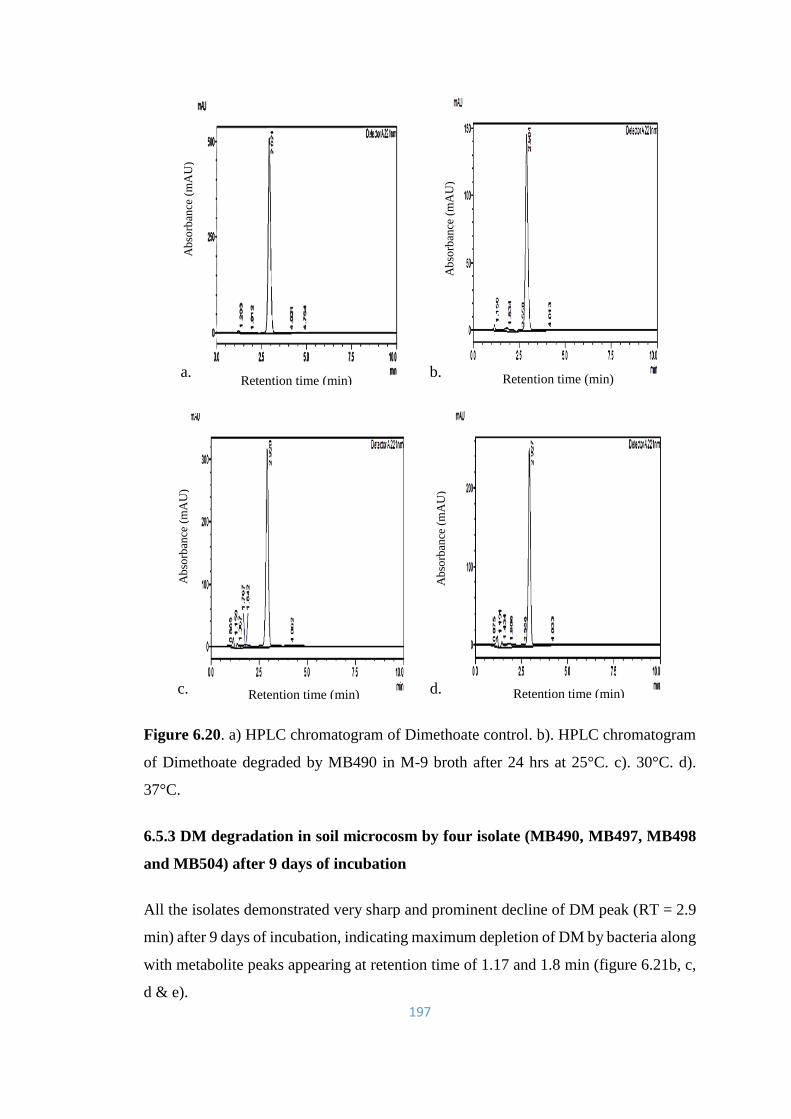
197
a. b.
c. d.
Figure 6.20. a) HPLC chromatogram of Dimethoate control. b). HPLC chromatogram
of Dimethoate degraded by MB490 in M-9 broth after 24 hrs at 25°C. c). 30°C. d).
37°C.
6.5.3 DM degradation in soil microcosm by four isolate (MB490, MB497, MB498
and MB504) after 9 days of incubation
All the isolates demonstrated very sharp and prominent decline of DM peak (RT = 2.9
min) after 9 days of incubation, indicating maximum depletion of DM by bacteria along
with metabolite peaks appearing at retention time of 1.17 and 1.8 min (figure 6.21b, c,
d & e).
Retention time (min) Retention time (min)
Retention time (min) Retention time (min)
Ab
sorb
ance
(m
AU
)
Ab
sorb
ance
(m
AU
)
Ab
sorb
ance
(m
AU
)
Ab
sorb
ance
(m
AU
)
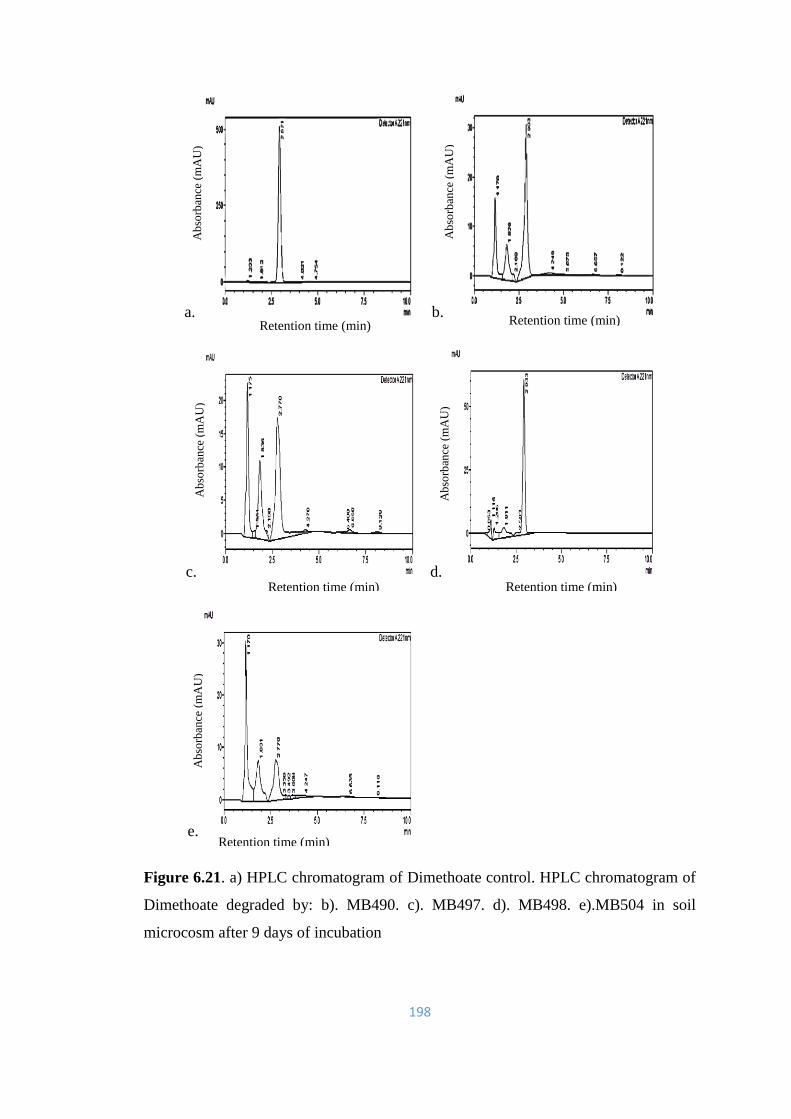
198
a. b.
c. d.
e.
Figure 6.21. a) HPLC chromatogram of Dimethoate control. HPLC chromatogram of
Dimethoate degraded by: b). MB490. c). MB497. d). MB498. e).MB504 in soil
microcosm after 9 days of incubation
Retention time (min) Retention time (min)
Retention time (min) Retention time (min)
Retention time (min)
Ab
sorb
ance
(m
AU
)
Ab
sorb
ance
(m
AU
)
Ab
sorb
ance
(m
AU
)
Ab
sorb
ance
(m
AU
)
Ab
sorb
ance
(m
AU
)
199
6.6 Qualitative analysis through GCMS to detect metabolites of
Dimethoate (DM) by the 4 isolates and their consortia in the M-9
broth, soil slurry and soil microcosm
The bacterial cultures (M-9, soil slurry and soil microcosm) treated with Dimethoate
(200 mg/l/kg) were analyzed by GCMS after 3, 6 and 9 days of incubation. In all
bacterial samples, total 6 main peaks were identified in the chromatograms for MB490,
MB497, MB498 and MB504 and their consortia with the help of NIST library, USA.
These compounds were identified with a resemblance percentage above 90% as follows
(figures 6.23, 6.24 & 6.25): Dimethoate, Methyl diethanol amine, Phosphonothioic
acid, propyl-O, S-dimethyl ester, O, O, O- Trimethyl thiophosphate, Omethoate and
Aspartylglycine ethyl ester (detected only in samples with MB490) (Table 6.3). The
control medium without bacteria incubated for 9 days produced no detectable
compound, other than dimethoate. Earlier in a study. seven metabolites of dimethoate
degradation, including dimethoate carboxylic acid, 2-(hydroxyl (methoxy)
phosphorylthio)acetic acid, O,O,S-trimethyl thiophosphorothioate, O-methyl O,S-
dihydrogen phosphorothioate, phosphorothioic O,O,S-acid, O,O,S-trimethyl
phosphorothiate and O,O,O-trimethyl phosphoric ester, were formed by Paracoccus sp.
strain Lgjj-3 (Li et al., 2010).
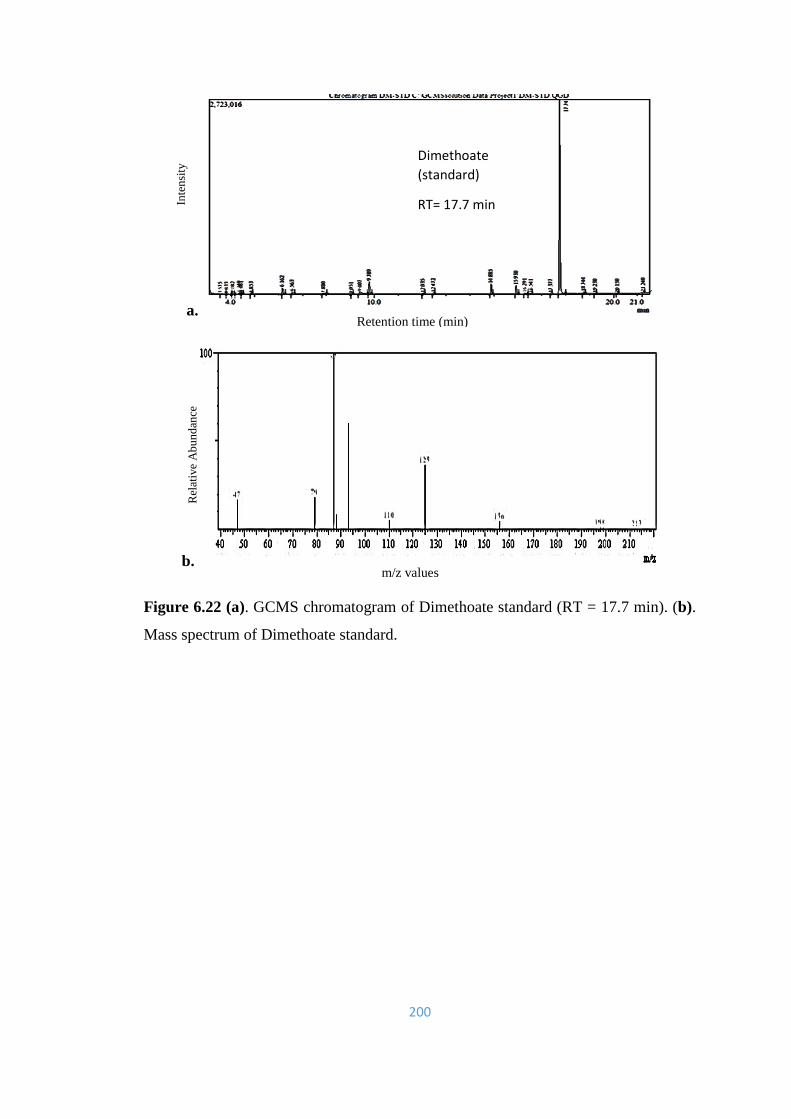
200
a.
b.
Figure 6.22 (a). GCMS chromatogram of Dimethoate standard (RT = 17.7 min). (b).
Mass spectrum of Dimethoate standard.
Retention time (min)
m/z values
Rel
ativ
e A
bu
nd
ance
In
ten
sity
Dimethoate
(standard)
RT= 17.7 min
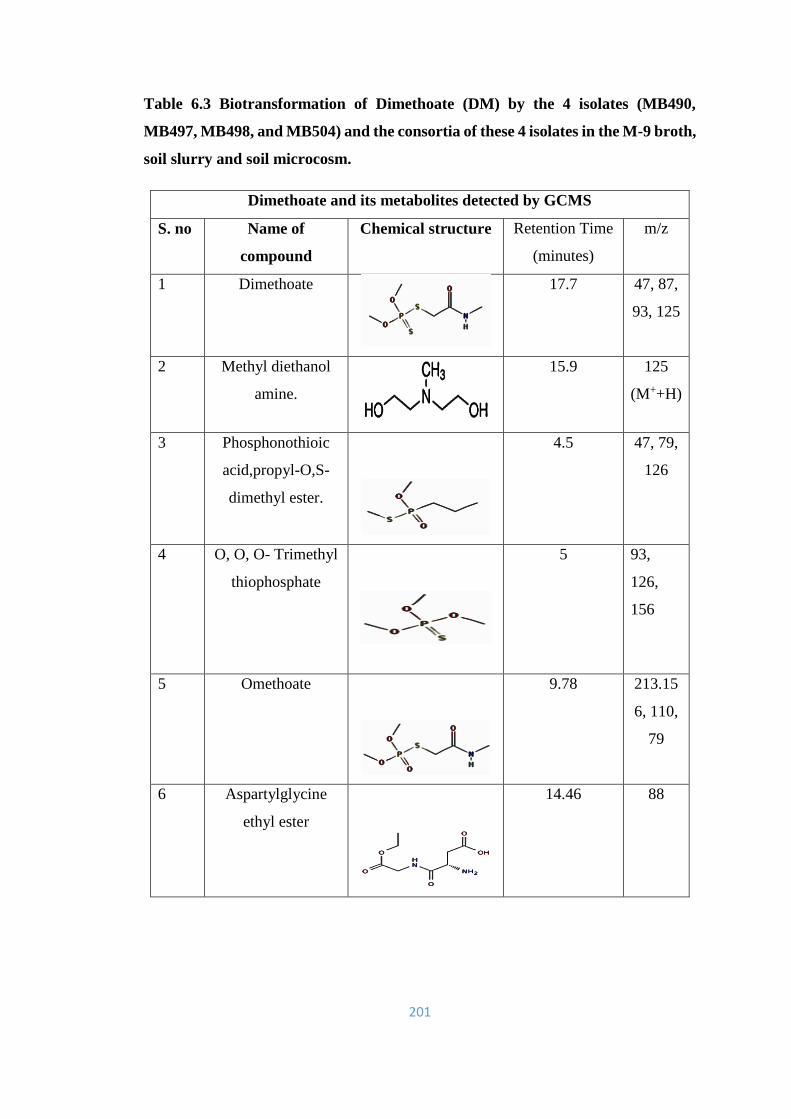
201
Table 6.3 Biotransformation of Dimethoate (DM) by the 4 isolates (MB490,
MB497, MB498, and MB504) and the consortia of these 4 isolates in the M-9 broth,
soil slurry and soil microcosm.
Dimethoate and its metabolites detected by GCMS
S. no Name of
compound
Chemical structure Retention Time
(minutes)
m/z
1 Dimethoate
17.7 47, 87,
93, 125
2 Methyl diethanol
amine.
15.9 125
(M++H)
3 Phosphonothioic
acid,propyl-O,S-
dimethyl ester.
4.5
47, 79,
126
4 O, O, O- Trimethyl
thiophosphate
5
93,
126,
156
5 Omethoate
9.78
213.15
6, 110,
79
6 Aspartylglycine
ethyl ester
14.46 88
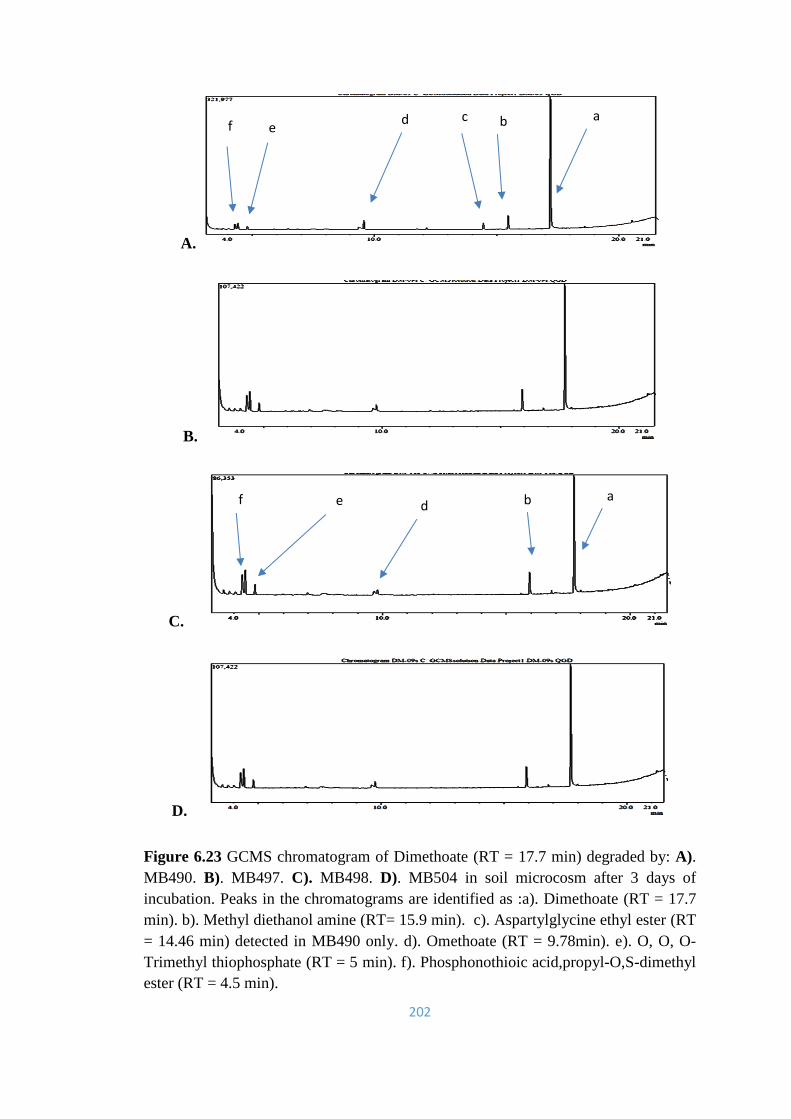
202
A.
B.
C.
D.
Figure 6.23 GCMS chromatogram of Dimethoate (RT = 17.7 min) degraded by: A).
MB490. B). MB497. C). MB498. D). MB504 in soil microcosm after 3 days of
incubation. Peaks in the chromatograms are identified as :a). Dimethoate (RT = 17.7
min). b). Methyl diethanol amine (RT= 15.9 min). c). Aspartylglycine ethyl ester (RT
= 14.46 min) detected in MB490 only. d). Omethoate (RT = 9.78min). e). O, O, O-
Trimethyl thiophosphate (RT = 5 min). f). Phosphonothioic acid,propyl-O,S-dimethyl
ester (RT = 4.5 min).
c
a
d e f
a
b d e f
b
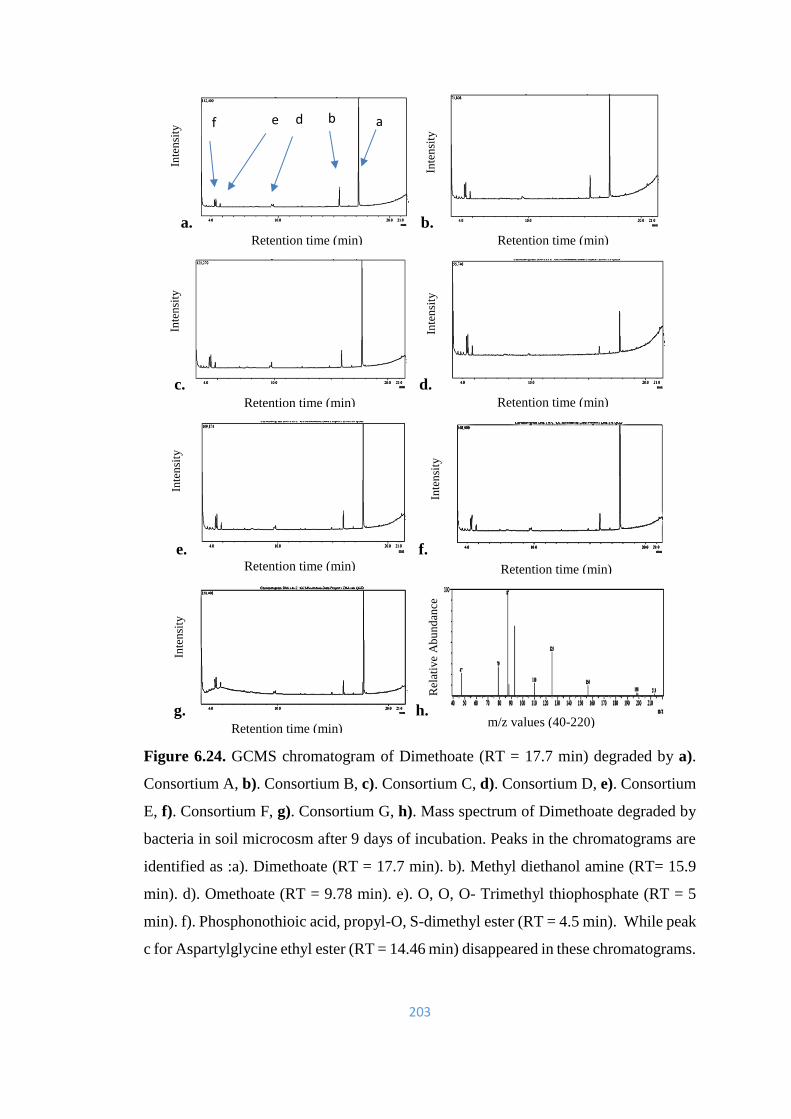
203
a. b.
c. d.
e. f.
g. h.
Figure 6.24. GCMS chromatogram of Dimethoate (RT = 17.7 min) degraded by a).
Consortium A, b). Consortium B, c). Consortium C, d). Consortium D, e). Consortium
E, f). Consortium F, g). Consortium G, h). Mass spectrum of Dimethoate degraded by
bacteria in soil microcosm after 9 days of incubation. Peaks in the chromatograms are
identified as :a). Dimethoate (RT = 17.7 min). b). Methyl diethanol amine (RT= 15.9
min). d). Omethoate (RT = 9.78 min). e). O, O, O- Trimethyl thiophosphate (RT = 5
min). f). Phosphonothioic acid, propyl-O, S-dimethyl ester (RT = 4.5 min). While peak
c for Aspartylglycine ethyl ester (RT = 14.46 min) disappeared in these chromatograms.
a b
. e
c
d f
Retention time (min) Retention time (min)
Retention time (min) Retention time (min)
Retention time (min) Retention time (min)
m/z values (40-220) Retention time (min)
Rel
ativ
e A
bu
nd
ance
Inte
nsi
ty
Inte
nsi
ty
Inte
nsi
ty
Inte
nsi
ty
Inte
nsi
ty
Inte
nsi
ty
Inte
nsi
ty
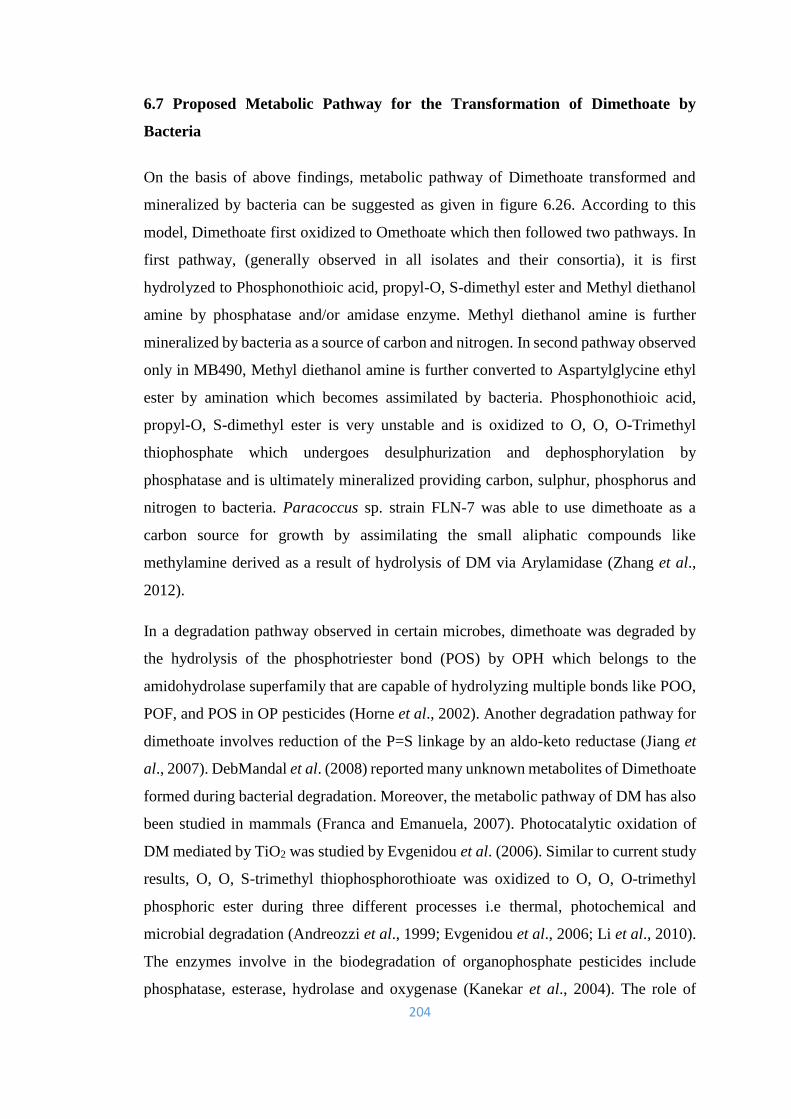
204
6.7 Proposed Metabolic Pathway for the Transformation of Dimethoate by
Bacteria
On the basis of above findings, metabolic pathway of Dimethoate transformed and
mineralized by bacteria can be suggested as given in figure 6.26. According to this
model, Dimethoate first oxidized to Omethoate which then followed two pathways. In
first pathway, (generally observed in all isolates and their consortia), it is first
hydrolyzed to Phosphonothioic acid, propyl-O, S-dimethyl ester and Methyl diethanol
amine by phosphatase and/or amidase enzyme. Methyl diethanol amine is further
mineralized by bacteria as a source of carbon and nitrogen. In second pathway observed
only in MB490, Methyl diethanol amine is further converted to Aspartylglycine ethyl
ester by amination which becomes assimilated by bacteria. Phosphonothioic acid,
propyl-O, S-dimethyl ester is very unstable and is oxidized to O, O, O-Trimethyl
thiophosphate which undergoes desulphurization and dephosphorylation by
phosphatase and is ultimately mineralized providing carbon, sulphur, phosphorus and
nitrogen to bacteria. Paracoccus sp. strain FLN-7 was able to use dimethoate as a
carbon source for growth by assimilating the small aliphatic compounds like
methylamine derived as a result of hydrolysis of DM via Arylamidase (Zhang et al.,
2012).
In a degradation pathway observed in certain microbes, dimethoate was degraded by
the hydrolysis of the phosphotriester bond (POS) by OPH which belongs to the
amidohydrolase superfamily that are capable of hydrolyzing multiple bonds like POO,
POF, and POS in OP pesticides (Horne et al., 2002). Another degradation pathway for
dimethoate involves reduction of the P=S linkage by an aldo-keto reductase (Jiang et
al., 2007). DebMandal et al. (2008) reported many unknown metabolites of Dimethoate
formed during bacterial degradation. Moreover, the metabolic pathway of DM has also
been studied in mammals (Franca and Emanuela, 2007). Photocatalytic oxidation of
DM mediated by TiO2 was studied by Evgenidou et al. (2006). Similar to current study
results, O, O, S-trimethyl thiophosphorothioate was oxidized to O, O, O-trimethyl
phosphoric ester during three different processes i.e thermal, photochemical and
microbial degradation (Andreozzi et al., 1999; Evgenidou et al., 2006; Li et al., 2010).
The enzymes involve in the biodegradation of organophosphate pesticides include
phosphatase, esterase, hydrolase and oxygenase (Kanekar et al., 2004). The role of
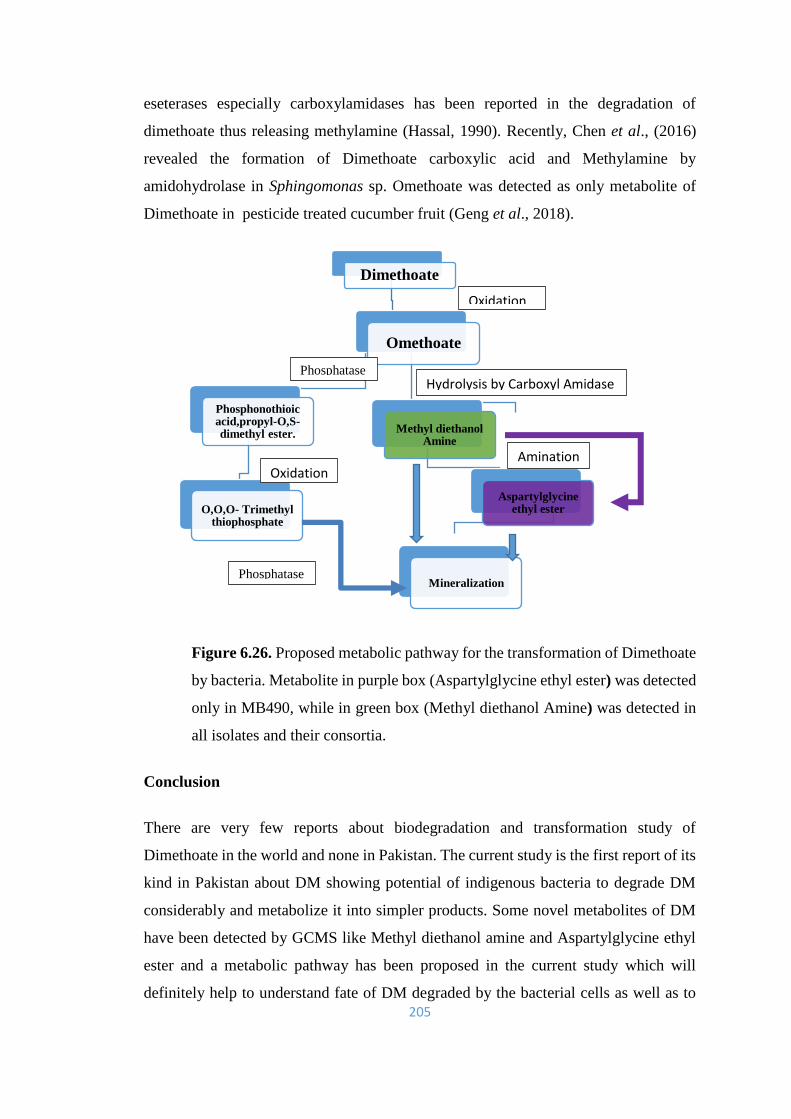
205
eseterases especially carboxylamidases has been reported in the degradation of
dimethoate thus releasing methylamine (Hassal, 1990). Recently, Chen et al., (2016)
revealed the formation of Dimethoate carboxylic acid and Methylamine by
amidohydrolase in Sphingomonas sp. Omethoate was detected as only metabolite of
Dimethoate in pesticide treated cucumber fruit (Geng et al., 2018).
Figure 6.26. Proposed metabolic pathway for the transformation of Dimethoate
by bacteria. Metabolite in purple box (Aspartylglycine ethyl ester) was detected
only in MB490, while in green box (Methyl diethanol Amine) was detected in
all isolates and their consortia.
Conclusion
There are very few reports about biodegradation and transformation study of
Dimethoate in the world and none in Pakistan. The current study is the first report of its
kind in Pakistan about DM showing potential of indigenous bacteria to degrade DM
considerably and metabolize it into simpler products. Some novel metabolites of DM
have been detected by GCMS like Methyl diethanol amine and Aspartylglycine ethyl
ester and a metabolic pathway has been proposed in the current study which will
definitely help to understand fate of DM degraded by the bacterial cells as well as to
Dimethoate
Omethoate
Phosphonothioic acid,propyl-O,S-dimethyl ester.
O,O,O- Trimethyl thiophosphate
Methyl diethanol Amine
Aspartylglycine ethyl ester
Mineralization
Phosphatase
Amination Oxidation
Oxidation
Hydrolysis by Carboxyl Amidase
Phosphatase

206
study the enzymes and genes involved as a future perspective. Therefore these four
bacterial strains MB490 (Pseudomonas kilonensis), MB497 (Bacillus thuringiensis),
MB498 (Pseudomonas kilonensis) and MB504 (Pseudomonas sp.) can be
recommended as strong candidate for application to bioremediate DM contaminated
agricultural soils and water resources.
207
Chapter 7
Organophosphorus phosphatase (OPP) enzyme studies
Overview
Four bacterial strains MB490 (Pseudomonas kilonensis), MB497 (Bacillus
thuringiensis), MB498 (Pseudomonas kilonensis) and MB504 (Pseudomonas sp.) were
studied for the production of intracellular and extracellular organophosphorus
phosphatase enzyme (OPP). All bacterial strains were found positive for phosphate
solubilization and were producing significant amount of extracellular, acidic, neutral
and alkaline phosphatases. Largely, there was more production of acidic and alkaline
phosphatases as compared to neutral phosphatase. For three types of OPP,
Pseudomonas kilonensis MB490 showed maximum production of neutral OPP though
less than alkaline OPP. Bacillus thuringiensis MB497 exhibited maximum production
of alkaline OPP, whereas Pseudomonas sp. MB504 showed highest production of
acidic OPP. The strain Pseudomonas kilonensis MB498 could produce equal and
significant quantity of acidic and alkaline phosphatases. The highest OPP production
was observed at pH 11 by all isolates. Among four strains, Pseudomonas sp. MB504
showed best production of OPP from pH 6-11 (especially at pH 10 and 11). The
maximum OPP enzyme production was exhibited at 50°C by MB490, MB497 and
MB498, whereas at 45°C by MB504. All strains showed minimum enzyme production
at 37°C. In general, OPP production was decreased by all isolates after 48 hrs.
The OPP enzyme activity and stability was maximum at 37⁰C followed by decrease at
higher temperatures but remained still active even at highest given temperature (70⁰C)
by all isolates. Generally, SDS and EDTA proved inhibitors for acidic, neutral and
alkaline OPP activity especially at higher concentrations, while, Zn++, Cu++ and Cd++
greatly enhanced OPP activity. There was 86-100% bioprecipitation of selected metals
(Ni, Mn, Cr and Cd) by all three OPPs. Acidic OPP exhibited 40 to 80% degradation
of given 50 mg/l of three OP pesticides (CPF, TAP and DM), after 30 min of incubation,
while alkaline OPP showed more degradation (80 to 99%).
208
Back ground
The conventional methods used for the removal of OP compounds include physical and
chemical treatment, incineration and deep ocean dumping which are both costly and
pose environmental threats such as release of toxic chemicals (Richins et al., 2000).
Therefore, recently research is focused on new techniques like enzymatic detoxification
in order to remove the OP pesticide residues, which is cheap as well as environmental
friendly (Cheng et al., 1999). It is need of the day to study new enzymes and
biocatalysts that are stable over a wide range of temperature, pH, salts etc. and that do
not represent an environmental hazard in order to find a better solution for degrading
OP compounds. These enzyme characteristics are important in order to determine the
potential use of enzymes in future applications.
La Nauze (1970) isolated the first enzyme capable of degrading phosphonates, from B.
cereus and named as 2-phosphonoacetaldehyde hydrolase (phosphonatase). Its optimal
activity was observed at pH 8 and it is similar to alkaline phosphatase in many respects
except having narrow substrate specificity. According to Kononova and Nesmeyanova,
(2002), phosphonatase could not degrade phosphomonoesters. Yet it is able to degrade
variety of phosphonates like glyphosate and has been isolated from many bacterial
species (Baker et al., 1998). Mazur (1946) isolated the first OP-degrading enzymes
(DFPases and sarinases) from rabbit and human tissue extracts that were able to
hydrolyze diisopropylfluorophosphate (DFP) and Sarin (nerve agents). Later on, in
1992, these were included among Phosphoric triester hydrolases by the Nomenclature
Committee of the International Union of Biochemistry and Molecular Biology (Hill et
al., 2001). Among OP-degrading enzymes, the organophosphorus hydrolases (OPH)
also known as phosphotriesterases isolated from Pseudomonas diminuta and OPAA
from Alteromonas sp. strain JD6.5 are the well-characterized enzymes (Theriot and
Grunden, 2011).
Usually, enzymes exhibit great sensitivity to pH changes. The enzyme activity can be
affected by pH in various ways. The ionization of the enzyme substrate complex can be
altered by pH or, the ionization of various groups within enzyme molecule may be
changed, thus affecting the enzyme-substrate affinity. Moreover, it may affect the
ionization of the substrate itself, thus changing its affinity to the enzyme. Further,
protein structure of enzyme may be denatured at extreme pH (Palmer, 1995).
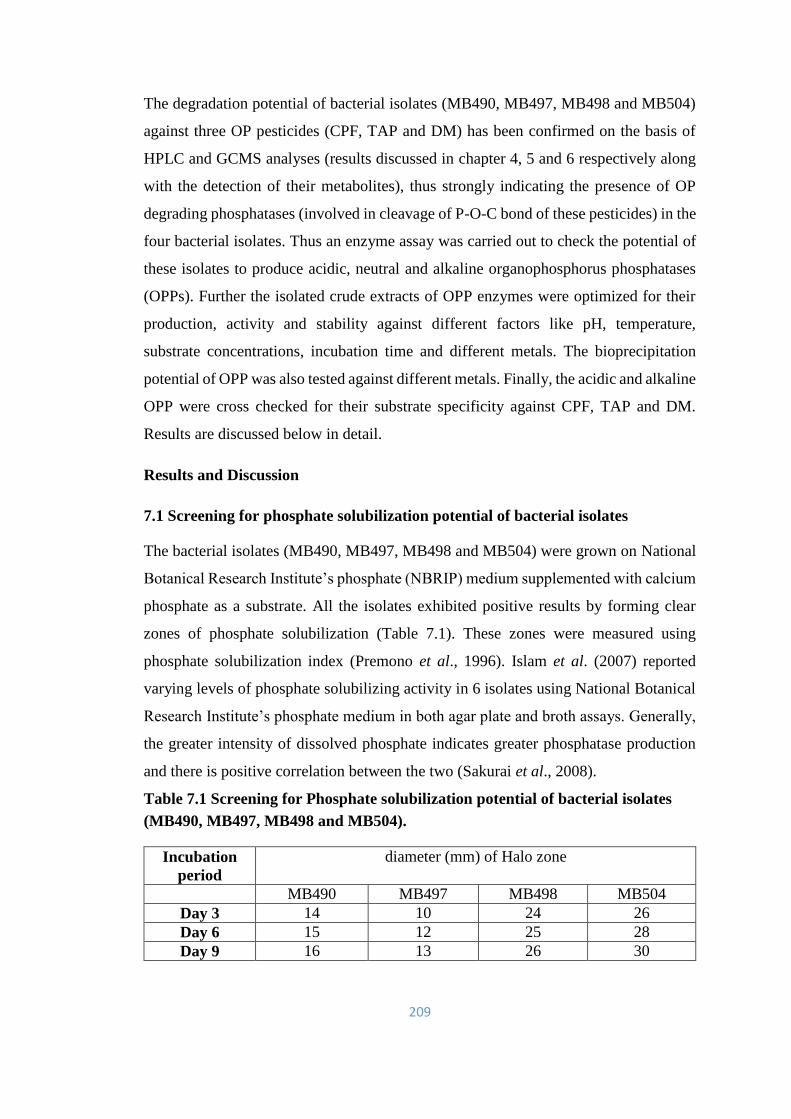
209
The degradation potential of bacterial isolates (MB490, MB497, MB498 and MB504)
against three OP pesticides (CPF, TAP and DM) has been confirmed on the basis of
HPLC and GCMS analyses (results discussed in chapter 4, 5 and 6 respectively along
with the detection of their metabolites), thus strongly indicating the presence of OP
degrading phosphatases (involved in cleavage of P-O-C bond of these pesticides) in the
four bacterial isolates. Thus an enzyme assay was carried out to check the potential of
these isolates to produce acidic, neutral and alkaline organophosphorus phosphatases
(OPPs). Further the isolated crude extracts of OPP enzymes were optimized for their
production, activity and stability against different factors like pH, temperature,
substrate concentrations, incubation time and different metals. The bioprecipitation
potential of OPP was also tested against different metals. Finally, the acidic and alkaline
OPP were cross checked for their substrate specificity against CPF, TAP and DM.
Results are discussed below in detail.
Results and Discussion
7.1 Screening for phosphate solubilization potential of bacterial isolates
The bacterial isolates (MB490, MB497, MB498 and MB504) were grown on National
Botanical Research Institute’s phosphate (NBRIP) medium supplemented with calcium
phosphate as a substrate. All the isolates exhibited positive results by forming clear
zones of phosphate solubilization (Table 7.1). These zones were measured using
phosphate solubilization index (Premono et al., 1996). Islam et al. (2007) reported
varying levels of phosphate solubilizing activity in 6 isolates using National Botanical
Research Institute’s phosphate medium in both agar plate and broth assays. Generally,
the greater intensity of dissolved phosphate indicates greater phosphatase production
and there is positive correlation between the two (Sakurai et al., 2008).
Table 7.1 Screening for Phosphate solubilization potential of bacterial isolates
(MB490, MB497, MB498 and MB504).
Incubation
period
diameter (mm) of Halo zone
MB490 MB497 MB498 MB504
Day 3 14 10 24 26
Day 6 15 12 25 28
Day 9 16 13 26 30
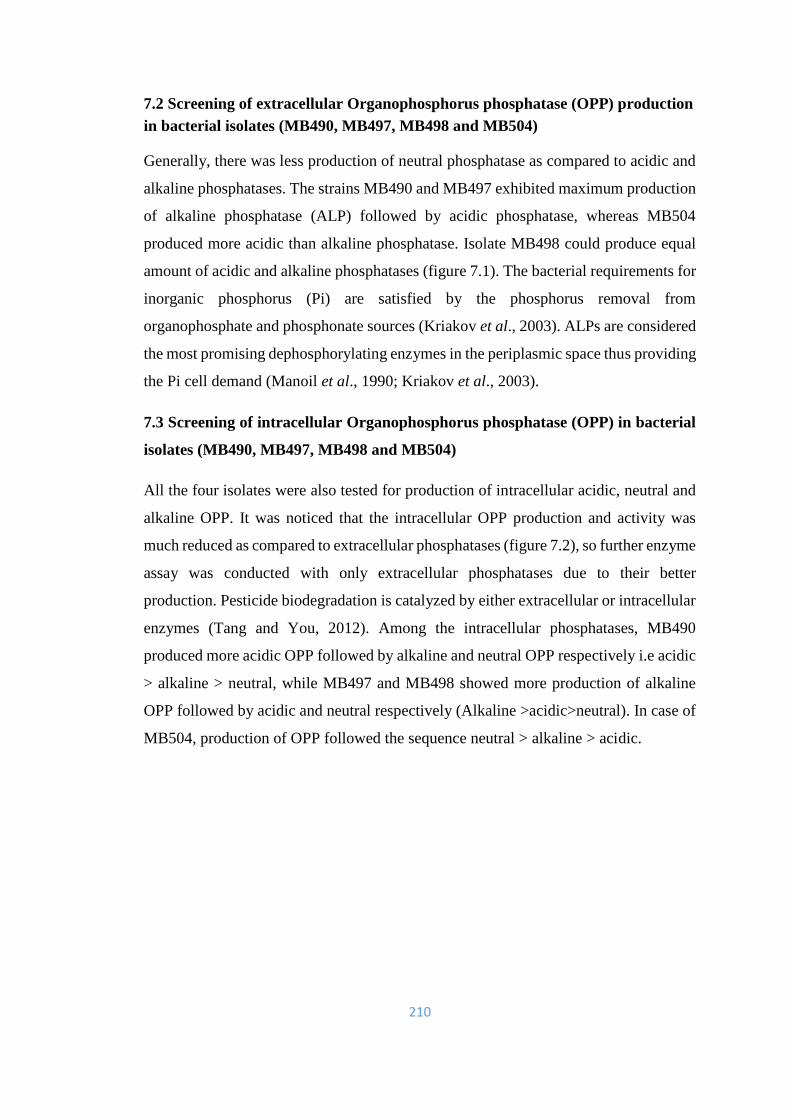
210
7.2 Screening of extracellular Organophosphorus phosphatase (OPP) production
in bacterial isolates (MB490, MB497, MB498 and MB504)
Generally, there was less production of neutral phosphatase as compared to acidic and
alkaline phosphatases. The strains MB490 and MB497 exhibited maximum production
of alkaline phosphatase (ALP) followed by acidic phosphatase, whereas MB504
produced more acidic than alkaline phosphatase. Isolate MB498 could produce equal
amount of acidic and alkaline phosphatases (figure 7.1). The bacterial requirements for
inorganic phosphorus (Pi) are satisfied by the phosphorus removal from
organophosphate and phosphonate sources (Kriakov et al., 2003). ALPs are considered
the most promising dephosphorylating enzymes in the periplasmic space thus providing
the Pi cell demand (Manoil et al., 1990; Kriakov et al., 2003).
7.3 Screening of intracellular Organophosphorus phosphatase (OPP) in bacterial
isolates (MB490, MB497, MB498 and MB504)
All the four isolates were also tested for production of intracellular acidic, neutral and
alkaline OPP. It was noticed that the intracellular OPP production and activity was
much reduced as compared to extracellular phosphatases (figure 7.2), so further enzyme
assay was conducted with only extracellular phosphatases due to their better
production. Pesticide biodegradation is catalyzed by either extracellular or intracellular
enzymes (Tang and You, 2012). Among the intracellular phosphatases, MB490
produced more acidic OPP followed by alkaline and neutral OPP respectively i.e acidic
> alkaline > neutral, while MB497 and MB498 showed more production of alkaline
OPP followed by acidic and neutral respectively (Alkaline >acidic>neutral). In case of
MB504, production of OPP followed the sequence neutral > alkaline > acidic.
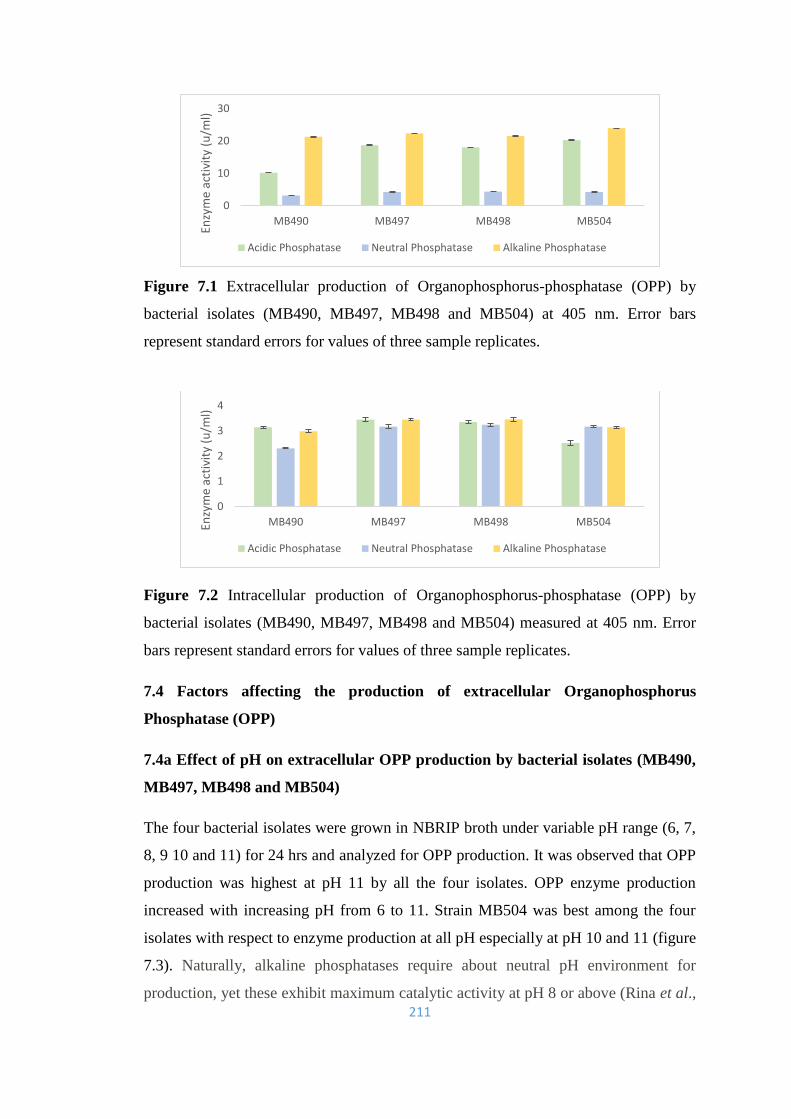
211
Figure 7.1 Extracellular production of Organophosphorus-phosphatase (OPP) by
bacterial isolates (MB490, MB497, MB498 and MB504) at 405 nm. Error bars
represent standard errors for values of three sample replicates.
Figure 7.2 Intracellular production of Organophosphorus-phosphatase (OPP) by
bacterial isolates (MB490, MB497, MB498 and MB504) measured at 405 nm. Error
bars represent standard errors for values of three sample replicates.
7.4 Factors affecting the production of extracellular Organophosphorus
Phosphatase (OPP)
7.4a Effect of pH on extracellular OPP production by bacterial isolates (MB490,
MB497, MB498 and MB504)
The four bacterial isolates were grown in NBRIP broth under variable pH range (6, 7,
8, 9 10 and 11) for 24 hrs and analyzed for OPP production. It was observed that OPP
production was highest at pH 11 by all the four isolates. OPP enzyme production
increased with increasing pH from 6 to 11. Strain MB504 was best among the four
isolates with respect to enzyme production at all pH especially at pH 10 and 11 (figure
7.3). Naturally, alkaline phosphatases require about neutral pH environment for
production, yet these exhibit maximum catalytic activity at pH 8 or above (Rina et al.,
0
10
20
30
MB490 MB497 MB498 MB504
Enzy
me
acti
vity
(u
/ml)
Acidic Phosphatase Neutral Phosphatase Alkaline Phosphatase
0
1
2
3
4
MB490 MB497 MB498 MB504Enzy
me
acti
vity
(u
/ml)
Acidic Phosphatase Neutral Phosphatase Alkaline Phosphatase

212
2000). The alkaline phosphatase isolated from Rhizobium demonstrated a wide range
of pH optimum (6.8-11.8) for the enzymatic reaction with p-NPP having maximum
activity at pH 9.8 (kumar et al., 2008). Bacterial alkaline phosphatases are reported to
have broader pH range which can go beyond physiological pH range when assayed with
p-NPP (Mori et al., 1999). The ALP isolated from Pyrococcus abyssi was reported as
most alkaline working best at pH 11 (Zappa et al., 2001). In the current study maximum
OPP production was observed at pH 11 by MB504, indicating its alkaline behavior.
Figure 7.3 Organophosphorus-phosphatase production by bacterial isolates (MB490,
MB497, MB498 and MB504) at different pHs. Error bars represent standard errors for
values of three sample replicates.
7.4b Effect of temperature on extracellular OPP production by bacterial isolates
(MB490, MB497, MB498 and MB504)
In order to study the effect of temperature on the production of organophosphorus
phosphatase, four isolates were grown in NBRIP broth at different temperatures (37,
45, 50 and 60°C) in a rotary shaker for 24 hrs. Among them MB490, MB497 and
MB498 exhibited maximum OPP enzyme production at 50°C, whereas MB504 showed
highest enzyme production at 45°C (figure 7.4). There was minimum enzyme
production at 37°C by all the isolates. Shah et al. (2008) reported an alkaline
phosphatase isolated from Bacillus subtilis KIBGE-HAS, which exhibited maximum
activity at pH 8 and 37°C.
0
10
20
30
40
50
pH 6 pH 7 pH 8 pH 9 pH 10 pH 11Enzy
me
acti
vity
(u
/ml)
MB490 MB497 MB498 MB504

213
Figure 7.4 Organophosphorus phosphatase production by bacterial isolates (MB490,
MB497, MB498 and MB504) at different temperatures. Error bars represent standard
errors for values of three sample replicates.
7.4c Effect of incubation time on OPP production by bacterial isolates (MB490,
MB497, MB498 and MB504)
In order to study effect of incubation period on the production of acidic, neutral and
alkaline phosphatases, the bacterial isolates (MB490, MB497, MB498 and MB504)
were cultured in NBRIP broth for different time intervals (24, 48 and 72 hrs).
Figure 7.5 Effect of incubation time on Organophosphorus-phosphatase production by
bacterial isolates (MB490, MB497, MB498 and MB504). Error bars represent standard
errors for values of three sample replicates.
Acidic and neutral OPP production after 24 hrs, followed the pattern as MB498>
MB497>MB490>MB504, while in case of alkaline OPP production was as
MB504>MB498> MB497> MB490 (figure 7.5). After 48 hrs, acidic, neutral and
alkaline OPP production decreased by all the isolates, whereas after 72 hrs incubation,
010203040506070
37⁰C 45⁰C 50⁰C 60⁰CEn
zym
e ac
tivi
ty (
u/m
l)
Temperatures
MB490 MB497 MB498 MB504
0123456
Acidic Neutral Alkaline Acidic Neutral Alkaline Acidic Neutral Alkaline
24 hrs 48 hrs 72 hrs
OP
P a
ctiv
ity
(u/m
l)
Incubation Time
MB490 MB497 MB498 MB504
214
it increased a little, especially alkaline OPP production was maximum by MB498.
Mahesh et al. (2015) reported the optimum production of extracellular alkaline OPP
derived from Proteus mirabilis M54 at pH 7-8 and 35°C for 28 hrs incubation time.
The classification of phosphatases into acid, neutral and alkaline phosphatase is based
on the optimum pH required for their catalytic activity (Shahbazkia et al., 2010). Their
production has been reported by prokaryotes as well as eukaryotes and are recognized
to transform insoluble organic phosphorous into soluble and available phosphorous
during their active cellular metabolism (Eshanpour and Amini, 2003; Amlabu et al.,
2009).
7.5 Factors affecting Organophosphorus Phosphatase (OPP) Activity
7.5a Effect of temperature on Organophosphorus phosphatase enzyme activity
and stability
There was considerable enzyme activity and stability observed over a wide range of
temperatures (37, 45, 50, 60 and 70⁰C) as discussed in detail below (figures 7.6 and
7.7). There was decreased enzyme activity by all isolates at higher temperatures but
still active even at 70⁰C. Previously, it was reported that Alkaline phosphatases (ALP)
from the mesophilic Escherichia coli and Pyrococcus abyssi showed activity at 80 and
105°C respectively (Janeway et al., 1993; Zappa et al., 2001). Behera et al. (2017)
studied alkaline phosphatase activity isolated from phosphate solubilizing Alcaligenes
faecalis and reported maximum activity at pH 9.0, at 45 °C and substrate concentration
of 1.75 mg/ml. Shah et al. (2008) reported that the enzyme activity of alkaline
phosphatase was maximum at 37°C and decreased at higher temperatures. The kinetic
energy of the protein molecules in enzyme structure is increased at high temperatures,
breaking the bonds between the active amino acids, thus enzyme activity is lost (Bryan
and Keith, 1994).
7.5a.1 Pseudomonas kilonensis MB490
For MB490, maximum acidic OPP activity was found at 60⁰C, while both neutral and
alkaline OPP activities were highest at 37⁰C (figure 7.6a).
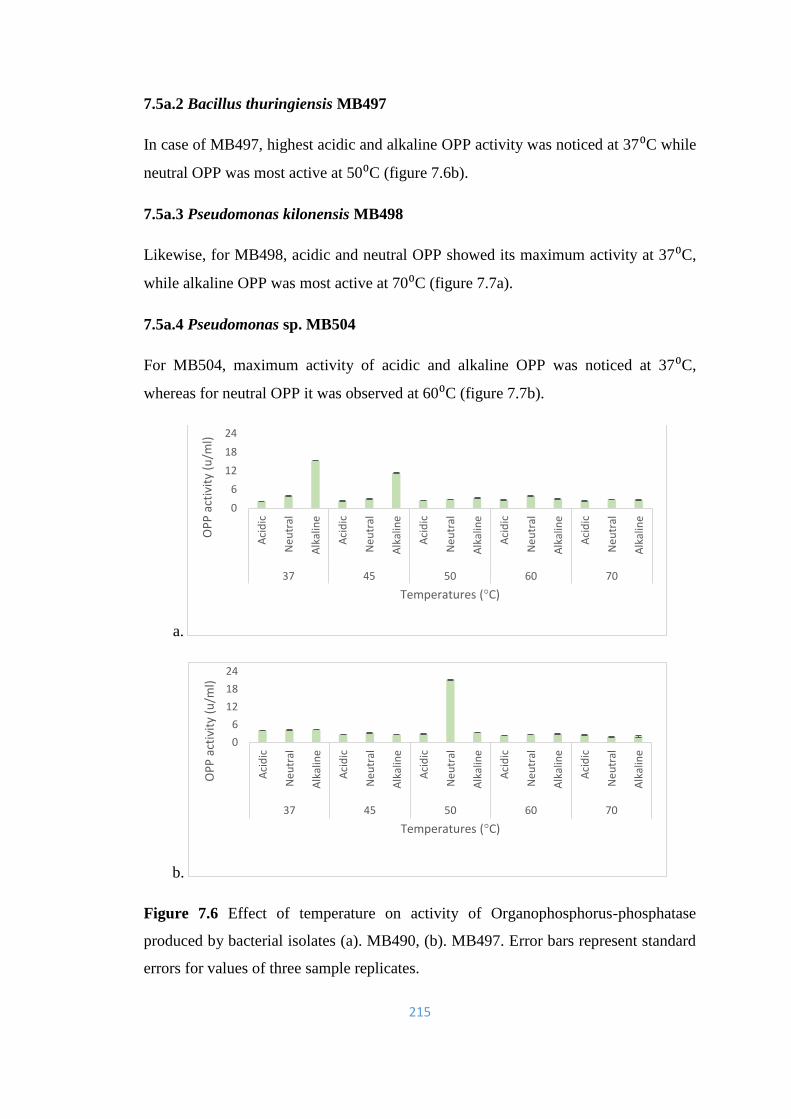
215
7.5a.2 Bacillus thuringiensis MB497
In case of MB497, highest acidic and alkaline OPP activity was noticed at 37⁰C while
neutral OPP was most active at 50⁰C (figure 7.6b).
7.5a.3 Pseudomonas kilonensis MB498
Likewise, for MB498, acidic and neutral OPP showed its maximum activity at 37⁰C,
while alkaline OPP was most active at 70⁰C (figure 7.7a).
7.5a.4 Pseudomonas sp. MB504
For MB504, maximum activity of acidic and alkaline OPP was noticed at 37⁰C,
whereas for neutral OPP it was observed at 60⁰C (figure 7.7b).
a.
b.
Figure 7.6 Effect of temperature on activity of Organophosphorus-phosphatase
produced by bacterial isolates (a). MB490, (b). MB497. Error bars represent standard
errors for values of three sample replicates.
0
6
12
18
24
Aci
dic
Ne
utr
al
Alk
alin
e
Aci
dic
Ne
utr
al
Alk
alin
e
Aci
dic
Ne
utr
al
Alk
alin
e
Aci
dic
Ne
utr
al
Alk
alin
e
Aci
dic
Ne
utr
al
Alk
alin
e
37 45 50 60 70
OP
P a
ctiv
ity
(u/m
l)
Temperatures (°C)
0
6
12
18
24
Aci
dic
Ne
utr
al
Alk
alin
e
Aci
dic
Ne
utr
al
Alk
alin
e
Aci
dic
Ne
utr
al
Alk
alin
e
Aci
dic
Ne
utr
al
Alk
alin
e
Aci
dic
Ne
utr
al
Alk
alin
e
37 45 50 60 70
OP
P a
ctiv
ity
(u/m
l)
Temperatures (°C)
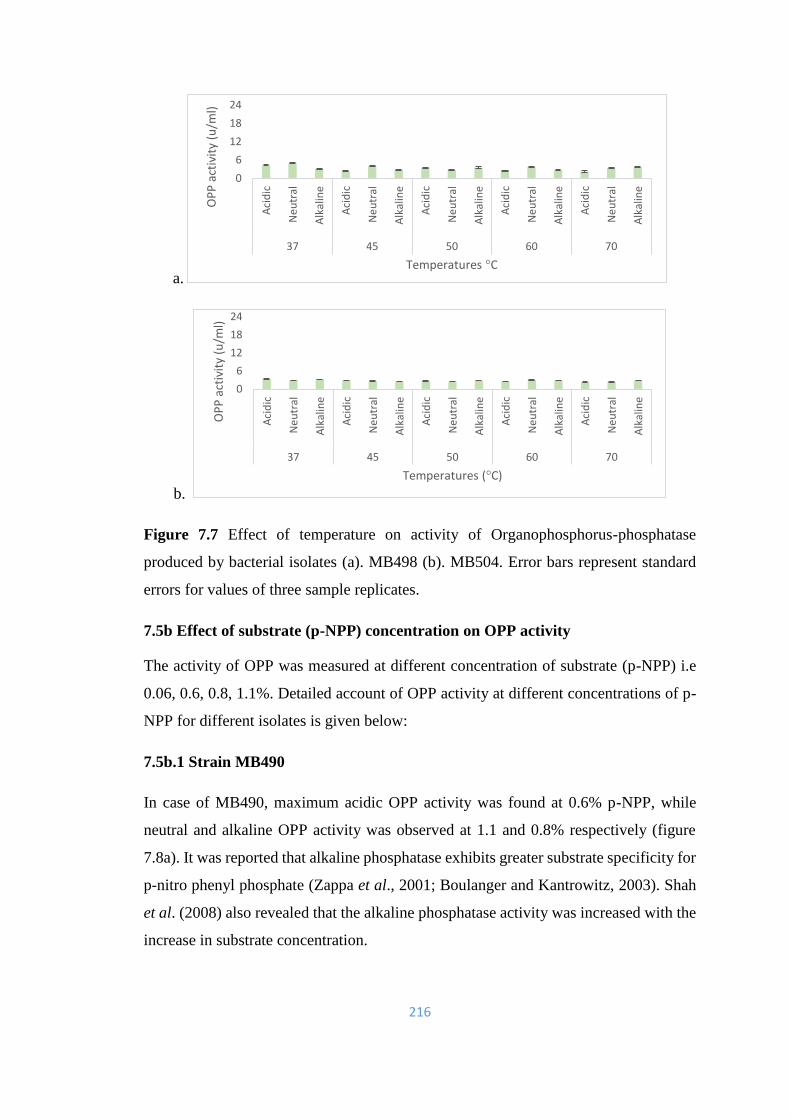
216
a.
b.
Figure 7.7 Effect of temperature on activity of Organophosphorus-phosphatase
produced by bacterial isolates (a). MB498 (b). MB504. Error bars represent standard
errors for values of three sample replicates.
7.5b Effect of substrate (p-NPP) concentration on OPP activity
The activity of OPP was measured at different concentration of substrate (p-NPP) i.e
0.06, 0.6, 0.8, 1.1%. Detailed account of OPP activity at different concentrations of p-
NPP for different isolates is given below:
7.5b.1 Strain MB490
In case of MB490, maximum acidic OPP activity was found at 0.6% p-NPP, while
neutral and alkaline OPP activity was observed at 1.1 and 0.8% respectively (figure
7.8a). It was reported that alkaline phosphatase exhibits greater substrate specificity for
p-nitro phenyl phosphate (Zappa et al., 2001; Boulanger and Kantrowitz, 2003). Shah
et al. (2008) also revealed that the alkaline phosphatase activity was increased with the
increase in substrate concentration.
0
6
12
18
24
Aci
dic
Ne
utr
al
Alk
alin
e
Aci
dic
Ne
utr
al
Alk
alin
e
Aci
dic
Ne
utr
al
Alk
alin
e
Aci
dic
Ne
utr
al
Alk
alin
e
Aci
dic
Ne
utr
al
Alk
alin
e
37 45 50 60 70
OP
P a
ctiv
ity
(u/m
l)
Temperatures °C
0
6
12
18
24
Aci
dic
Ne
utr
al
Alk
alin
e
Aci
dic
Ne
utr
al
Alk
alin
e
Aci
dic
Ne
utr
al
Alk
alin
e
Aci
dic
Ne
utr
al
Alk
alin
e
Aci
dic
Ne
utr
al
Alk
alin
e
37 45 50 60 70
OP
P a
ctiv
ity
(u/m
l)
Temperatures (°C)
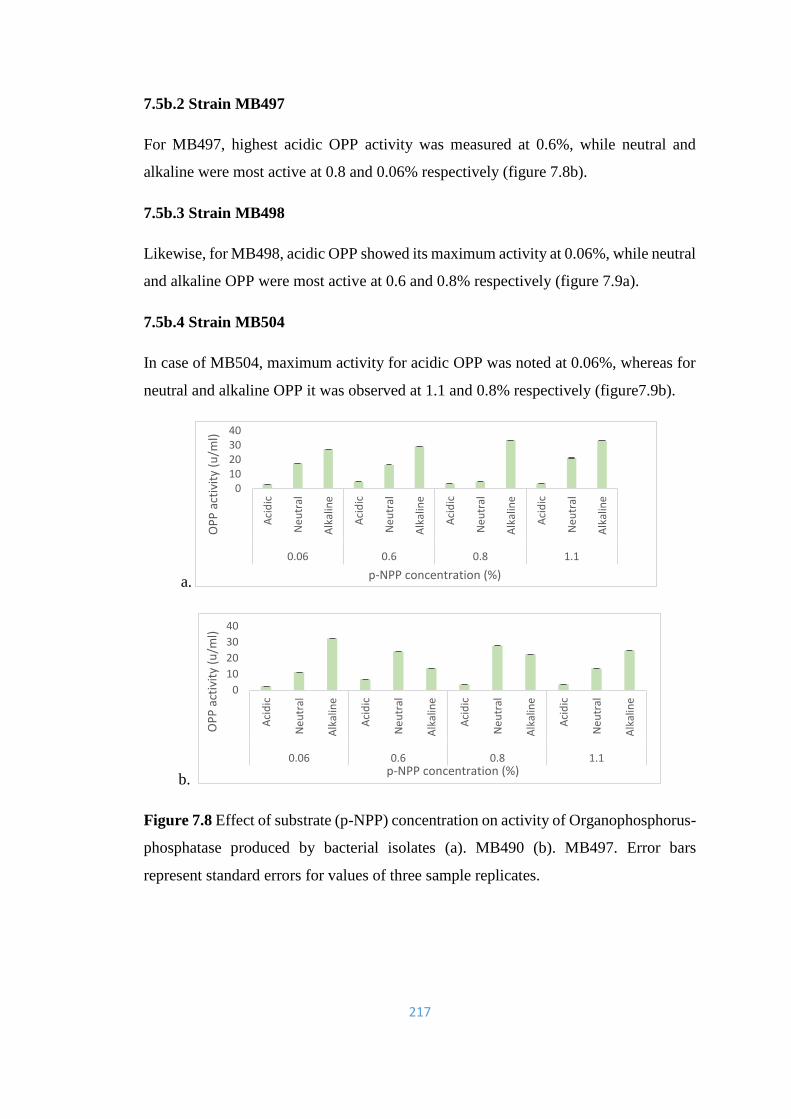
217
7.5b.2 Strain MB497
For MB497, highest acidic OPP activity was measured at 0.6%, while neutral and
alkaline were most active at 0.8 and 0.06% respectively (figure 7.8b).
7.5b.3 Strain MB498
Likewise, for MB498, acidic OPP showed its maximum activity at 0.06%, while neutral
and alkaline OPP were most active at 0.6 and 0.8% respectively (figure 7.9a).
7.5b.4 Strain MB504
In case of MB504, maximum activity for acidic OPP was noted at 0.06%, whereas for
neutral and alkaline OPP it was observed at 1.1 and 0.8% respectively (figure7.9b).
a.
b.
Figure 7.8 Effect of substrate (p-NPP) concentration on activity of Organophosphorus-
phosphatase produced by bacterial isolates (a). MB490 (b). MB497. Error bars
represent standard errors for values of three sample replicates.
010203040
Aci
dic
Ne
utr
al
Alk
alin
e
Aci
dic
Ne
utr
al
Alk
alin
e
Aci
dic
Ne
utr
al
Alk
alin
e
Aci
dic
Ne
utr
al
Alk
alin
e
0.06 0.6 0.8 1.1
OP
P a
ctiv
ity
(u/m
l)
p-NPP concentration (%)
0
10
20
30
40
Aci
dic
Ne
utr
al
Alk
alin
e
Aci
dic
Ne
utr
al
Alk
alin
e
Aci
dic
Ne
utr
al
Alk
alin
e
Aci
dic
Ne
utr
al
Alk
alin
e
0.06 0.6 0.8 1.1
OP
P a
ctiv
ity
(u/m
l)
p-NPP concentration (%)
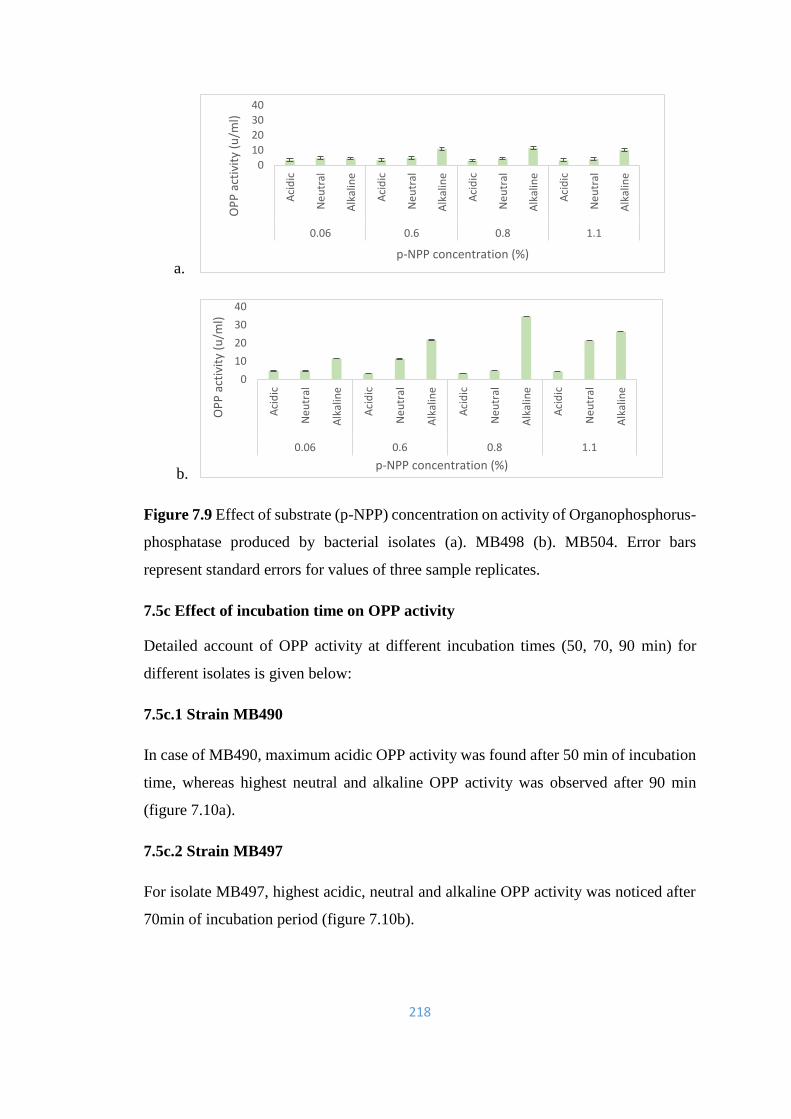
218
a.
b.
Figure 7.9 Effect of substrate (p-NPP) concentration on activity of Organophosphorus-
phosphatase produced by bacterial isolates (a). MB498 (b). MB504. Error bars
represent standard errors for values of three sample replicates.
7.5c Effect of incubation time on OPP activity
Detailed account of OPP activity at different incubation times (50, 70, 90 min) for
different isolates is given below:
7.5c.1 Strain MB490
In case of MB490, maximum acidic OPP activity was found after 50 min of incubation
time, whereas highest neutral and alkaline OPP activity was observed after 90 min
(figure 7.10a).
7.5c.2 Strain MB497
For isolate MB497, highest acidic, neutral and alkaline OPP activity was noticed after
70min of incubation period (figure 7.10b).
0
10
20
30
40
Aci
dic
Ne
utr
al
Alk
alin
e
Aci
dic
Ne
utr
al
Alk
alin
e
Aci
dic
Ne
utr
al
Alk
alin
e
Aci
dic
Ne
utr
al
Alk
alin
e
0.06 0.6 0.8 1.1O
PP
act
ivit
y (u
/ml)
p-NPP concentration (%)
0
10
20
30
40
Aci
dic
Ne
utr
al
Alk
alin
e
Aci
dic
Ne
utr
al
Alk
alin
e
Aci
dic
Ne
utr
al
Alk
alin
e
Aci
dic
Ne
utr
al
Alk
alin
e
0.06 0.6 0.8 1.1
OP
P a
ctiv
ity
(u/m
l)
p-NPP concentration (%)
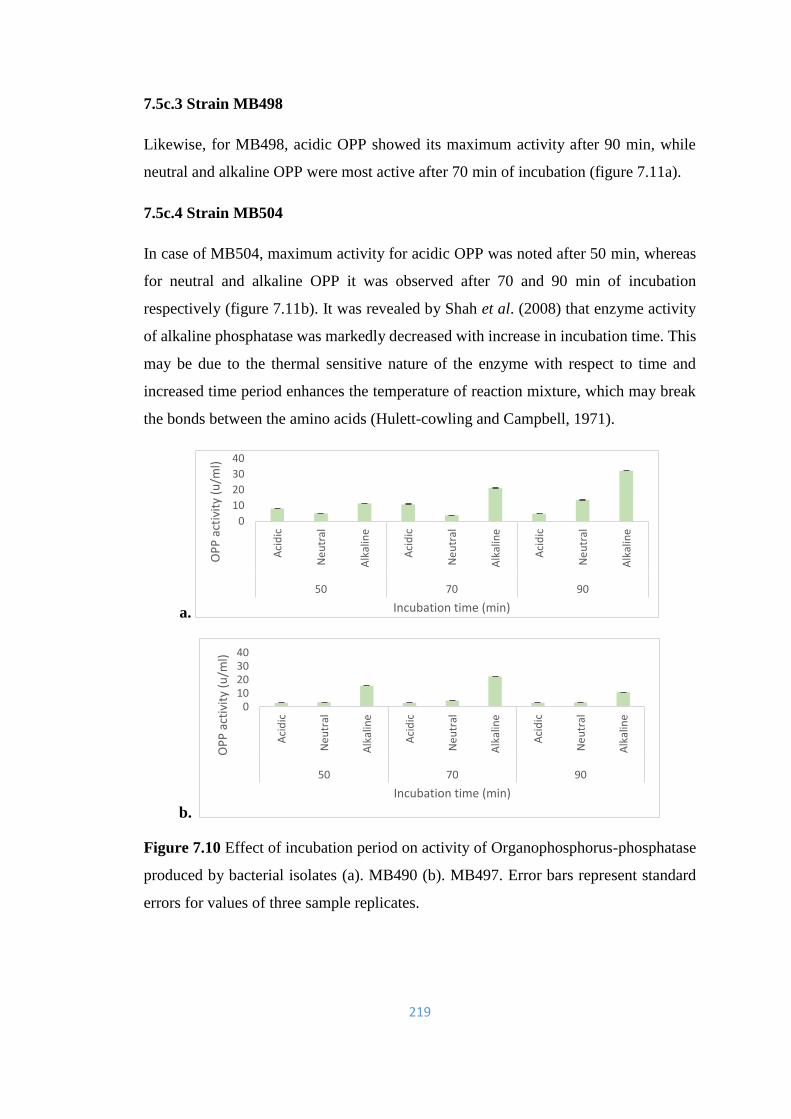
219
7.5c.3 Strain MB498
Likewise, for MB498, acidic OPP showed its maximum activity after 90 min, while
neutral and alkaline OPP were most active after 70 min of incubation (figure 7.11a).
7.5c.4 Strain MB504
In case of MB504, maximum activity for acidic OPP was noted after 50 min, whereas
for neutral and alkaline OPP it was observed after 70 and 90 min of incubation
respectively (figure 7.11b). It was revealed by Shah et al. (2008) that enzyme activity
of alkaline phosphatase was markedly decreased with increase in incubation time. This
may be due to the thermal sensitive nature of the enzyme with respect to time and
increased time period enhances the temperature of reaction mixture, which may break
the bonds between the amino acids (Hulett-cowling and Campbell, 1971).
a.
b.
Figure 7.10 Effect of incubation period on activity of Organophosphorus-phosphatase
produced by bacterial isolates (a). MB490 (b). MB497. Error bars represent standard
errors for values of three sample replicates.
0
10
20
30
40
Aci
dic
Ne
utr
al
Alk
alin
e
Aci
dic
Ne
utr
al
Alk
alin
e
Aci
dic
Ne
utr
al
Alk
alin
e
50 70 90
OP
P a
ctiv
ity
(u/m
l)
Incubation time (min)
010203040
Aci
dic
Ne
utr
al
Alk
alin
e
Aci
dic
Ne
utr
al
Alk
alin
e
Aci
dic
Ne
utr
al
Alk
alin
e
50 70 90
OP
P a
ctiv
ity
(u/m
l)
Incubation time (min)

220
a.
b.
Figure 7.11 Effect of incubation period on activity of Organophosphorus-phosphatase
produced by bacterial isolates (a). MB498 (b). MB504. Error bars represent standard
errors for values of three sample replicates.
7.6 Study of stimulatory or inhibitory effect of chemicals (SDS, EDTA, metals) on
OPP Activity
7.6.1 Effect of Sodium dodecyl sulphate (SDS) on OPP Activity
The effect of different concentrations (2.5, 5 and 7.5%) of SDS on OPP activity for
selected isolates (MB490, MB497, MB498 and MB504) was also checked and detail is
given below:
7.6.1a Strain MB490
In case of MB490, acidic and alkaline OPP activity was found to decrease gradually
thus inhibited at all given concentrations (2.5, 5 and 7.5%) after 30min of incubation
time, whereas neutral OPP activity was enhanced up to 2.5% SDS followed by
inhibition at higher SDS concentrations (figure 7.12a).
0
10
20
30
40
Aci
dic
Ne
utr
al
Alk
alin
e
Aci
dic
Ne
utr
al
Alk
alin
e
Aci
dic
Ne
utr
al
Alk
alin
e
50 70 90O
PP
act
ivit
y (u
/ml)
Incubation time (min)
010203040
Aci
dic
Ne
utr
al
Alk
alin
e
Aci
dic
Ne
utr
al
Alk
alin
e
Aci
dic
Ne
utr
al
Alk
alin
e
50 70 90
OP
P a
ctiv
ity
(u/m
l)
Incubation time (miin)
221
7.6.1b Strain MB497
For isolate MB497, acidic OPP activity was noticed to increase at all given
concentrations of SDS after 30min of incubation period (figure 7.12b), while neutral
OPP activity was enhanced up to 2.5% followed by inhibition at higher concentrations
of SDS. Alkaline OPP activity remained almost unaffected by SDS at all concentration.
7.6.1c Strain MB498
For MB498, acidic and neutral OPP activity was increased by 2.5% SDS followed by
inhibition at higher concentrations, while alkaline OPP activity was enhanced by 2.5%
SDS, after which it remained unaffected by higher SDS concentrations of 5 and 7.5%
(figure 7.12c).
7.6.1d Strain MB504
In case of MB504, acidic and neutral OPP activity was inhibited at all given SDS
concentrations, whereas alkaline OPP activity was increased a little bit at 2.5% SDS
but then it remained unaffected at higher concentrations (figure 7.12d).

222
a.
b.
c.
d.
Figure 7.12 Effect of SDS on activity of Organophosphorus-phosphatase produced by
bacterial isolates (a). MB490 (b). MB497 (c). MB498 (d). MB504. Error bars represent
standard errors for values of three sample replicates.
0
10
20
30
40
Aci
dic
Ne
utr
al
Alk
alin
e
Aci
dic
Ne
utr
al
Alk
alin
e
Aci
dic
Ne
utr
al
Alk
alin
e
Aci
dic
Ne
utr
al
Alk
alin
e
0 2.5 5 7.5
OP
P a
ctiv
ity
(u/m
l)
SDS concentration (%)
0
10
20
30
40
Aci
dic
Ne
utr
al
Alk
alin
e
Aci
dic
Ne
utr
al
Alk
alin
e
Aci
dic
Ne
utr
al
Alk
alin
e
Aci
dic
Ne
utr
al
Alk
alin
e
0 2.5 5 7.5
OP
P a
ctiv
ity
(u/m
l)
SDS concentration (%)
010203040
Aci
dic
Ne
utr
al
Alk
alin
e
Aci
dic
Ne
utr
al
Alk
alin
e
Aci
dic
Ne
utr
al
Alk
alin
e
Aci
dic
Ne
utr
al
Alk
alin
e0 2.5 5 7.5
OP
P a
ctiv
ity
(u/m
l)
SDS concentration (%)
010203040
Aci
dic
Ne
utr
al
Alk
alin
e
Aci
dic
Ne
utr
al
Alk
alin
e
Aci
dic
Ne
utr
al
Alk
alin
e
Aci
dic
Ne
utr
al
Alk
alin
e
0 2.5 5 7.5
OP
P a
ctiv
ity
(u/m
l)
SDS concentration (%)
223
7.6.2 Effect of EDTA on OPP Activity
The study was conducted to check the effect of different concentrations (2.5, 5 and
7.5%) of EDTA on OPP activity for selected isolates (MB490, MB497, MB498 and
MB504) and detail is given below (figures 7.13).
7.6.2a Strain MB490
In case of MB490, acidic OPP activity remained unaffected at 2.5% of EDTA but
inhibited at higher concentrations (5 and 7.5%) after 30min of incubation time, whereas
neutral and alkaline OPP activity was inhibited and decreased at all given
concentrations of EDTA (figure 7.13a).
7.6.2b Strain MB497
For MB497, acidic, neutral and alkaline OPP activities were inhibited by all
concentrations of EDTA (2.5, 5 and 7.5%) after 30min of incubation period (figure
7.13b).
7.6.2c Strain MB498
Likewise in case of MB498, acidic, neutral and alkaline OPP activities were decreased
and inhibited at all concentrations (2.5, 5 and 7.5%) of EDTA (figure 7.13c).
7.6.2d Strain MB504
In case of MB504, acidic OPP activity was promoted by 2.5 and 5% of SDS followed
by inhibition at higher concentration, whereas neutral and alkaline OPP activities were
inhibited at all given concentrations of EDTA (figure 7.13d).

224
a.
b.
c.
d.
Figure 7.13 Effect of EDTA on activity of Organophosphorus-phosphatase produced
by bacterial isolates (a). MB490 (b). MB497 (c). MB498 (d).MB504. Error bars
represent standard errors for values of three sample replicates.
01020304050
Aci
dic
Ne
utr
al
Alk
alin
e
Aci
dic
Ne
utr
al
Alk
alin
e
Aci
dic
Ne
utr
al
Alk
alin
e
Aci
dic
Ne
utr
al
Alk
alin
e
Control 2.5 5 7.5
OP
P a
ctiv
ity
(u/m
l)
EDTA concentration (%)
01020304050
Aci
dic
Ne
utr
al
Alk
alin
e
Aci
dic
Ne
utr
al
Alk
alin
e
Aci
dic
Ne
utr
al
Alk
alin
e
Aci
dic
Ne
utr
al
Alk
alin
e
Control 2.5 5 7.5
OP
P a
ctiv
ity
(u/m
l)
EDTA concentration (%)
01020304050
Aci
dic
Ne
utr
al
Alk
alin
e
Aci
dic
Ne
utr
al
Alk
alin
e
Aci
dic
Ne
utr
al
Alk
alin
e
Aci
dic
Ne
utr
al
Alk
alin
eControl 2.5 5 7.5
OP
P a
ctiv
ity
(u/m
l)
EDTA concentration (%)
01020304050
Aci
dic
Ne
utr
al
Alk
alin
e
Aci
dic
Ne
utr
al
Alk
alin
e
Aci
dic
Ne
utr
al
Alk
alin
e
Aci
dic
Ne
utr
al
Alk
alin
e
Control 2.5 5 7.5
OP
P a
ctiv
ity
(u/m
l)
EDTA concentration (%)
225
7.6.3 Effect of metals on OPP Activity
The inhibitory/stimulatory effect of metals on the activity of acidic, neutral and alkaline
OPP produced by the bacterial isolates was studied by using 100 µl (2.5%) of selected
metals Zn++ (ZnSO4), Cu++ (CuSO4) and Cd++ (CdSO4), with the enzyme extract and
substrate mixture and incubated at 37⁰C for 30 min along with the control without
metal. It was noticed (after UV-VIS Spectrophotometer analysis at 405 nm) that acidic,
neutral and alkaline OPP activity from all isolates was greatly enhanced by all the
metals used. Alkaline OPP activity was stimulated more in the presence of Cu++ in all
the isolates except MB490. Likewise, neutral OPP activity was promoted by Cd++ in all
the isolates, while acidic OPP activity in all isolates was enhanced only to a limited
extent by all the metals (figures 7.14). Alkaline phosphatases are known to be metalo-
dependent enzymes requiring Zn and Mg as essential bivalent cations for their activity
and stability (Mori et al., 1999). Alnuaimi et al. (2012) reported that Hg2+, Cu2+, and
Cd2+ inhibited E. coli ALP, whereas Co2+ had little promoter effect on ALP and divalent
alkaline earth metals like Ca2+ and Mg2+ activated the enzyme.
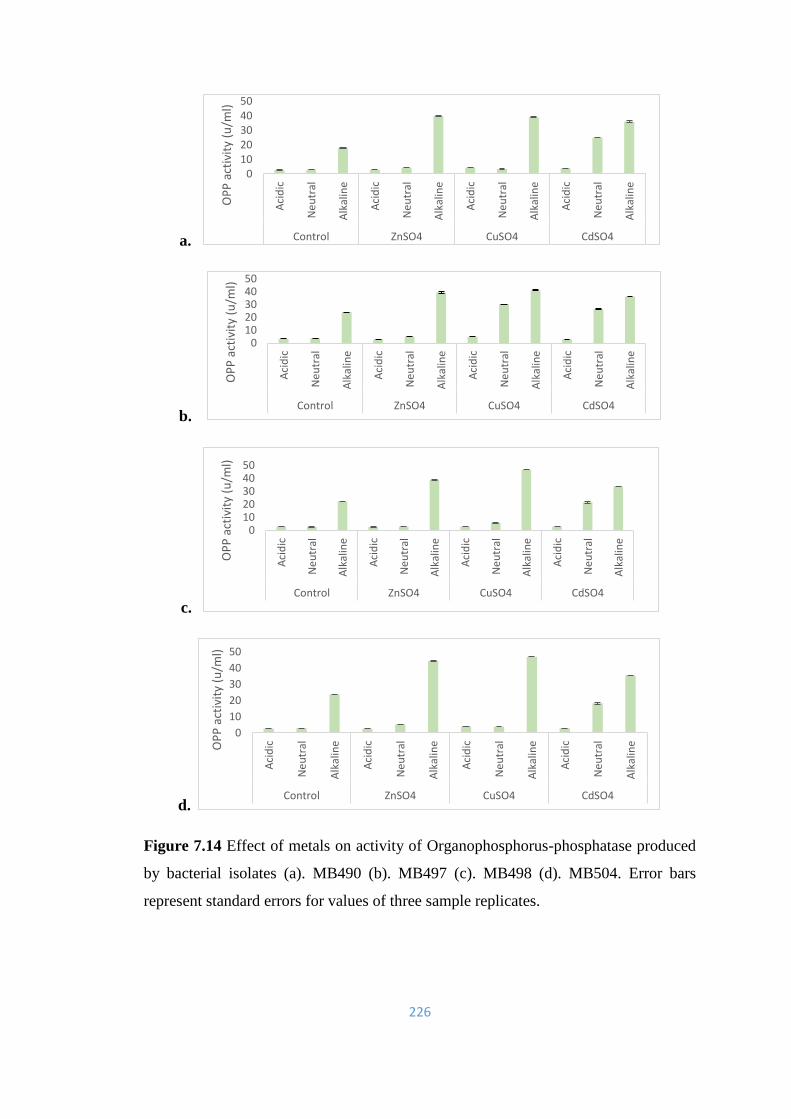
226
a.
b.
c.
d.
Figure 7.14 Effect of metals on activity of Organophosphorus-phosphatase produced
by bacterial isolates (a). MB490 (b). MB497 (c). MB498 (d). MB504. Error bars
represent standard errors for values of three sample replicates.
01020304050
Aci
dic
Ne
utr
al
Alk
alin
e
Aci
dic
Ne
utr
al
Alk
alin
e
Aci
dic
Ne
utr
al
Alk
alin
e
Aci
dic
Ne
utr
al
Alk
alin
e
Control ZnSO4 CuSO4 CdSO4O
PP
act
ivit
y (u
/ml)
01020304050
Aci
dic
Ne
utr
al
Alk
alin
e
Aci
dic
Ne
utr
al
Alk
alin
e
Aci
dic
Ne
utr
al
Alk
alin
e
Aci
dic
Ne
utr
al
Alk
alin
e
Control ZnSO4 CuSO4 CdSO4
OP
P a
ctiv
ity
(u/m
l)
01020304050
Aci
dic
Ne
utr
al
Alk
alin
e
Aci
dic
Ne
utr
al
Alk
alin
e
Aci
dic
Ne
utr
al
Alk
alin
e
Aci
dic
Ne
utr
al
Alk
alin
e
Control ZnSO4 CuSO4 CdSO4
OP
P a
ctiv
ity
(u/m
l)
0
10
20
30
40
50
Aci
dic
Ne
utr
al
Alk
alin
e
Aci
dic
Ne
utr
al
Alk
alin
e
Aci
dic
Ne
utr
al
Alk
alin
e
Aci
dic
Ne
utr
al
Alk
alin
e
Control ZnSO4 CuSO4 CdSO4
OP
P a
ctiv
ity
(u/m
l)
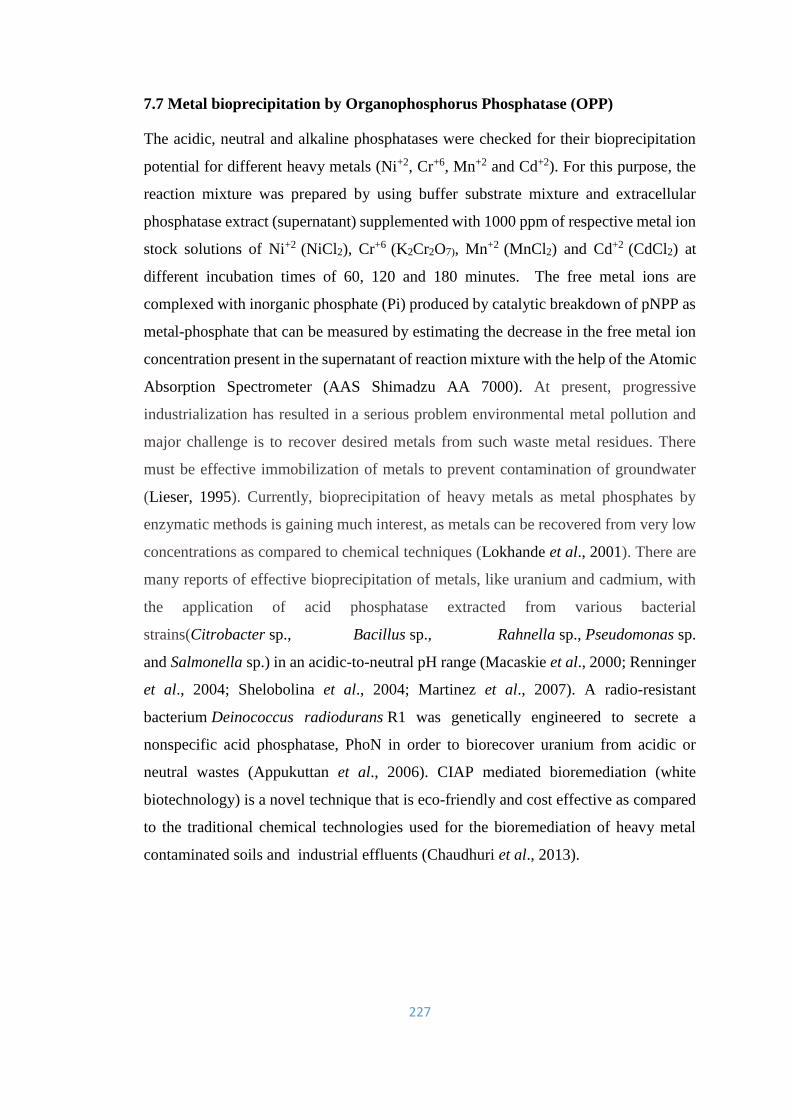
227
7.7 Metal bioprecipitation by Organophosphorus Phosphatase (OPP)
The acidic, neutral and alkaline phosphatases were checked for their bioprecipitation
potential for different heavy metals (Ni+2, Cr+6, Mn+2 and Cd+2). For this purpose, the
reaction mixture was prepared by using buffer substrate mixture and extracellular
phosphatase extract (supernatant) supplemented with 1000 ppm of respective metal ion
stock solutions of Ni+2 (NiCl2), Cr+6 (K2Cr2O7), Mn+2 (MnCl2) and Cd+2 (CdCl2) at
different incubation times of 60, 120 and 180 minutes. The free metal ions are
complexed with inorganic phosphate (Pi) produced by catalytic breakdown of pNPP as
metal-phosphate that can be measured by estimating the decrease in the free metal ion
concentration present in the supernatant of reaction mixture with the help of the Atomic
Absorption Spectrometer (AAS Shimadzu AA 7000). At present, progressive
industrialization has resulted in a serious problem environmental metal pollution and
major challenge is to recover desired metals from such waste metal residues. There
must be effective immobilization of metals to prevent contamination of groundwater
(Lieser, 1995). Currently, bioprecipitation of heavy metals as metal phosphates by
enzymatic methods is gaining much interest, as metals can be recovered from very low
concentrations as compared to chemical techniques (Lokhande et al., 2001). There are
many reports of effective bioprecipitation of metals, like uranium and cadmium, with
the application of acid phosphatase extracted from various bacterial
strains(Citrobacter sp., Bacillus sp., Rahnella sp., Pseudomonas sp.
and Salmonella sp.) in an acidic-to-neutral pH range (Macaskie et al., 2000; Renninger
et al., 2004; Shelobolina et al., 2004; Martinez et al., 2007). A radio-resistant
bacterium Deinococcus radiodurans R1 was genetically engineered to secrete a
nonspecific acid phosphatase, PhoN in order to biorecover uranium from acidic or
neutral wastes (Appukuttan et al., 2006). CIAP mediated bioremediation (white
biotechnology) is a novel technique that is eco-friendly and cost effective as compared
to the traditional chemical technologies used for the bioremediation of heavy metal
contaminated soils and industrial effluents (Chaudhuri et al., 2013).
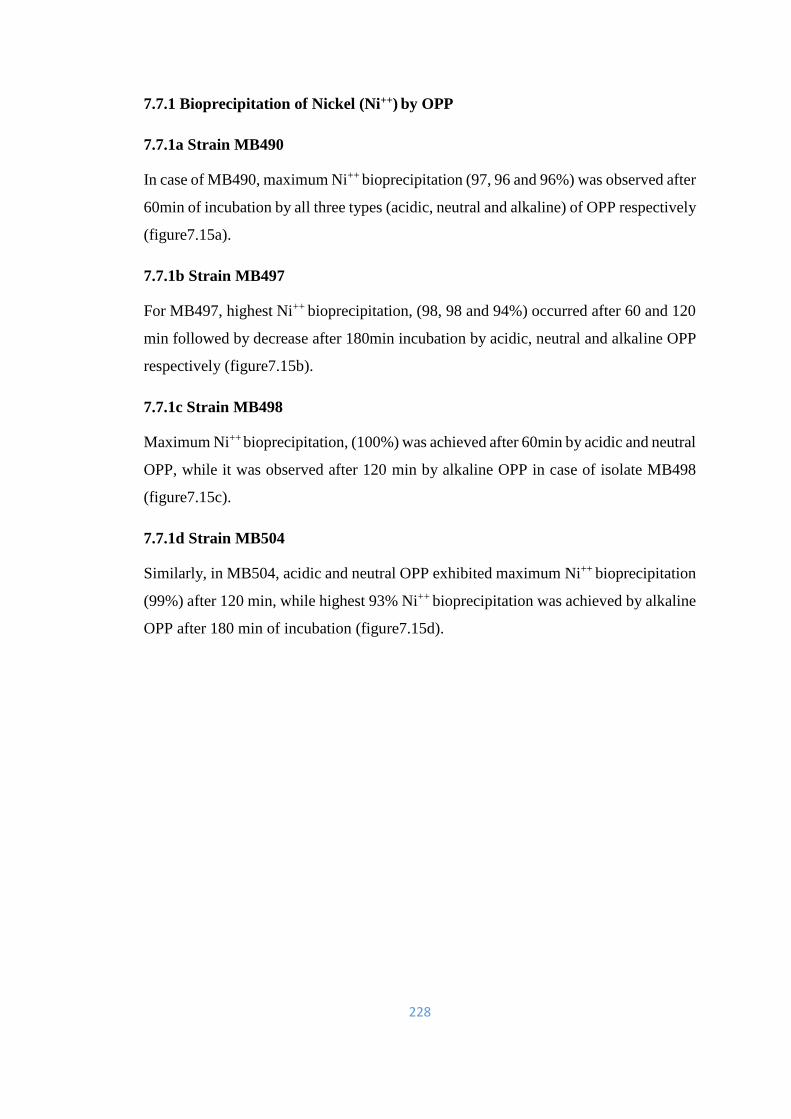
228
7.7.1 Bioprecipitation of Nickel (Ni++) by OPP
7.7.1a Strain MB490
In case of MB490, maximum Ni++ bioprecipitation (97, 96 and 96%) was observed after
60min of incubation by all three types (acidic, neutral and alkaline) of OPP respectively
(figure7.15a).
7.7.1b Strain MB497
For MB497, highest Ni++ bioprecipitation, (98, 98 and 94%) occurred after 60 and 120
min followed by decrease after 180min incubation by acidic, neutral and alkaline OPP
respectively (figure7.15b).
7.7.1c Strain MB498
Maximum Ni++ bioprecipitation, (100%) was achieved after 60min by acidic and neutral
OPP, while it was observed after 120 min by alkaline OPP in case of isolate MB498
(figure7.15c).
7.7.1d Strain MB504
Similarly, in MB504, acidic and neutral OPP exhibited maximum Ni++ bioprecipitation
(99%) after 120 min, while highest 93% Ni++ bioprecipitation was achieved by alkaline
OPP after 180 min of incubation (figure7.15d).

229
a. b.
c. d.
Figure 7.15 Effect of incubation period on Metal bioprecipitation of Ni++ (1000 ppm)
by OPP produced by a). MB490. b). MB497. c). MB498. d). MB504. Error bars
represent standard errors for values of three sample replicates.
7.7.2 Bioprecipitation of Manganese (Mn++) by OPP
7.7.2a Strain MB490
In case of MB490, acidic OPP achieved maximum Mn++ bioprecipitation (99%) after
120 min, while neutral and alkaline OPP obtained their maximum (100 and 97%) after
180 min of incubation respectively (figure7.16a).
7.7.2b Strain MB497
For MB497, highest Mn++ bioprecipitation by acidic OPP (99%) occurred after 120 min
while neutral and alkaline OPP achieved their maximum value (93%) after 60 min
(figure7.16b).
020406080
100
Aci
dic
Ne
utr
al
Alk
alin
e
Aci
dic
Ne
utr
al
Alk
alin
e
Aci
dic
Ne
utr
al
Alk
alin
e
60 120 180
% b
iop
reci
pit
atio
n o
f N
i
Incubation time (min)
0
20
40
60
80
100
Aci
dic
Ne
utr
al
Alk
alin
e
Aci
dic
Ne
utr
al
Alk
alin
e
Aci
dic
Ne
utr
al
Alk
alin
e
60 120 180
% b
iop
reci
pit
atio
n o
f N
i
Incubation time (min)
0
20
40
60
80
100
Aci
dic
Ne
utr
al
Alk
alin
e
Aci
dic
Ne
utr
al
Alk
alin
e
Aci
dic
Ne
utr
al
Alk
alin
e
60 120 180
% b
iop
reci
pit
atio
n o
f N
i
Incubation time (min)
0
20
40
60
80
100
Aci
dic
Ne
utr
al
Alk
alin
e
Aci
dic
Ne
utr
al
Alk
alin
e
Aci
dic
Ne
utr
al
Alk
alin
e
60 120 180
% b
iop
reci
pit
atio
n o
f N
i
Incubation time (min)
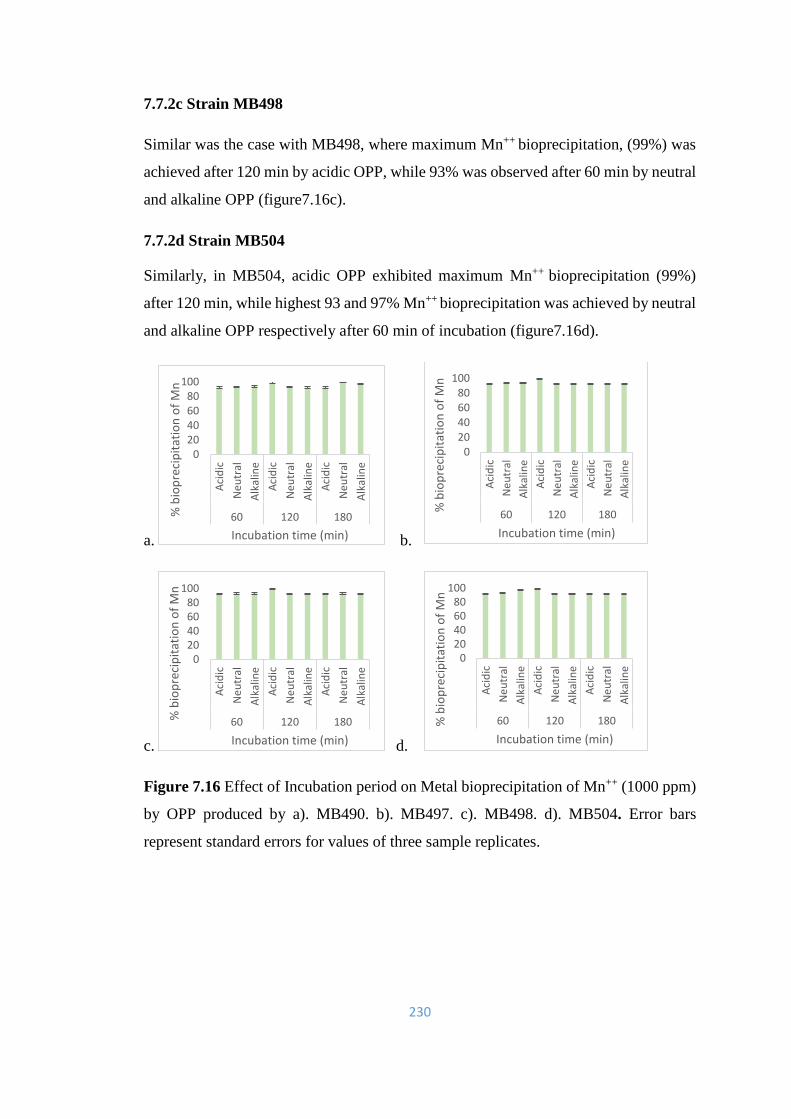
230
7.7.2c Strain MB498
Similar was the case with MB498, where maximum Mn++ bioprecipitation, (99%) was
achieved after 120 min by acidic OPP, while 93% was observed after 60 min by neutral
and alkaline OPP (figure7.16c).
7.7.2d Strain MB504
Similarly, in MB504, acidic OPP exhibited maximum Mn++ bioprecipitation (99%)
after 120 min, while highest 93 and 97% Mn++ bioprecipitation was achieved by neutral
and alkaline OPP respectively after 60 min of incubation (figure7.16d).
a. b.
c. d.
Figure 7.16 Effect of Incubation period on Metal bioprecipitation of Mn++ (1000 ppm)
by OPP produced by a). MB490. b). MB497. c). MB498. d). MB504. Error bars
represent standard errors for values of three sample replicates.
020406080
100
Aci
dic
Ne
utr
al
Alk
alin
e
Aci
dic
Ne
utr
al
Alk
alin
e
Aci
dic
Ne
utr
al
Alk
alin
e
60 120 180% b
iop
reci
pit
atio
n o
f M
n
Incubation time (min)
020406080
100
Aci
dic
Ne
utr
al
Alk
alin
e
Aci
dic
Ne
utr
al
Alk
alin
e
Aci
dic
Ne
utr
al
Alk
alin
e
60 120 180
% b
iop
reci
pit
atio
n o
f M
n
Incubation time (min)
020406080
100
Aci
dic
Ne
utr
al
Alk
alin
e
Aci
dic
Ne
utr
al
Alk
alin
e
Aci
dic
Ne
utr
al
Alk
alin
e
60 120 180% b
iop
reci
pit
atio
n o
f M
n
Incubation time (min)
020406080
100
Aci
dic
Ne
utr
al
Alk
alin
e
Aci
dic
Ne
utr
al
Alk
alin
e
Aci
dic
Ne
utr
al
Alk
alin
e
60 120 180% b
iop
reci
pit
atio
n o
f M
n
Incubation time (min)
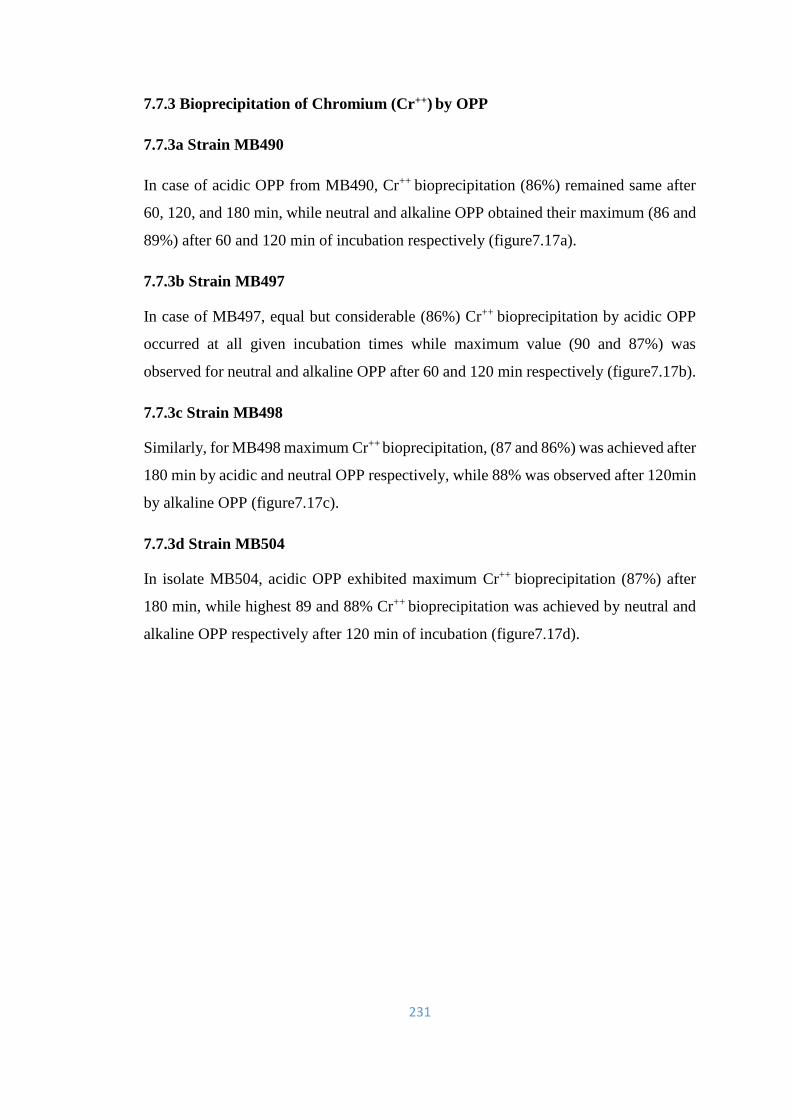
231
7.7.3 Bioprecipitation of Chromium (Cr++) by OPP
7.7.3a Strain MB490
In case of acidic OPP from MB490, Cr++ bioprecipitation (86%) remained same after
60, 120, and 180 min, while neutral and alkaline OPP obtained their maximum (86 and
89%) after 60 and 120 min of incubation respectively (figure7.17a).
7.7.3b Strain MB497
In case of MB497, equal but considerable (86%) Cr++ bioprecipitation by acidic OPP
occurred at all given incubation times while maximum value (90 and 87%) was
observed for neutral and alkaline OPP after 60 and 120 min respectively (figure7.17b).
7.7.3c Strain MB498
Similarly, for MB498 maximum Cr++ bioprecipitation, (87 and 86%) was achieved after
180 min by acidic and neutral OPP respectively, while 88% was observed after 120min
by alkaline OPP (figure7.17c).
7.7.3d Strain MB504
In isolate MB504, acidic OPP exhibited maximum Cr++ bioprecipitation (87%) after
180 min, while highest 89 and 88% Cr++ bioprecipitation was achieved by neutral and
alkaline OPP respectively after 120 min of incubation (figure7.17d).
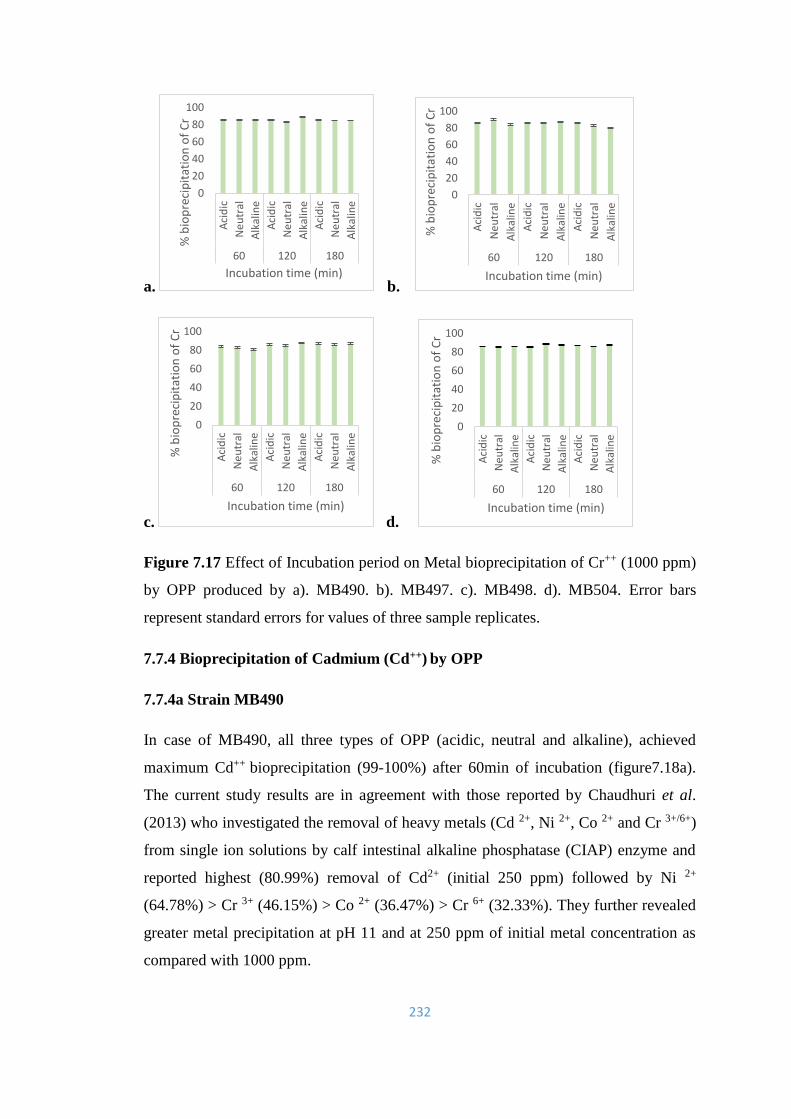
232
a. b.
c. d.
Figure 7.17 Effect of Incubation period on Metal bioprecipitation of Cr++ (1000 ppm)
by OPP produced by a). MB490. b). MB497. c). MB498. d). MB504. Error bars
represent standard errors for values of three sample replicates.
7.7.4 Bioprecipitation of Cadmium (Cd++) by OPP
7.7.4a Strain MB490
In case of MB490, all three types of OPP (acidic, neutral and alkaline), achieved
maximum Cd++ bioprecipitation (99-100%) after 60min of incubation (figure7.18a).
The current study results are in agreement with those reported by Chaudhuri et al.
(2013) who investigated the removal of heavy metals (Cd 2+, Ni 2+, Co 2+ and Cr 3+/6+)
from single ion solutions by calf intestinal alkaline phosphatase (CIAP) enzyme and
reported highest (80.99%) removal of Cd2+ (initial 250 ppm) followed by Ni 2+
(64.78%) > Cr 3+ (46.15%) > Co 2+ (36.47%) > Cr 6+ (32.33%). They further revealed
greater metal precipitation at pH 11 and at 250 ppm of initial metal concentration as
compared with 1000 ppm.
0
20
40
60
80
100
Aci
dic
Ne
utr
al
Alk
alin
e
Aci
dic
Ne
utr
al
Alk
alin
e
Aci
dic
Ne
utr
al
Alk
alin
e
60 120 180
% b
iop
reci
pit
atio
n o
f C
r
Incubation time (min)
0
20
40
60
80
100
Aci
dic
Ne
utr
al
Alk
alin
e
Aci
dic
Ne
utr
al
Alk
alin
e
Aci
dic
Ne
utr
al
Alk
alin
e
60 120 180
% b
iop
reci
pit
atio
n o
f C
r
Incubation time (min)
0
20
40
60
80
100
Aci
dic
Ne
utr
al
Alk
alin
e
Aci
dic
Ne
utr
al
Alk
alin
e
Aci
dic
Ne
utr
al
Alk
alin
e
60 120 180
% b
iop
reci
pit
atio
n o
f C
r
Incubation time (min)
0
20
40
60
80
100
Aci
dic
Ne
utr
al
Alk
alin
e
Aci
dic
Ne
utr
al
Alk
alin
e
Aci
dic
Ne
utr
al
Alk
alin
e
60 120 180
% b
iop
reci
pit
atio
n o
f C
r
Incubation time (min)
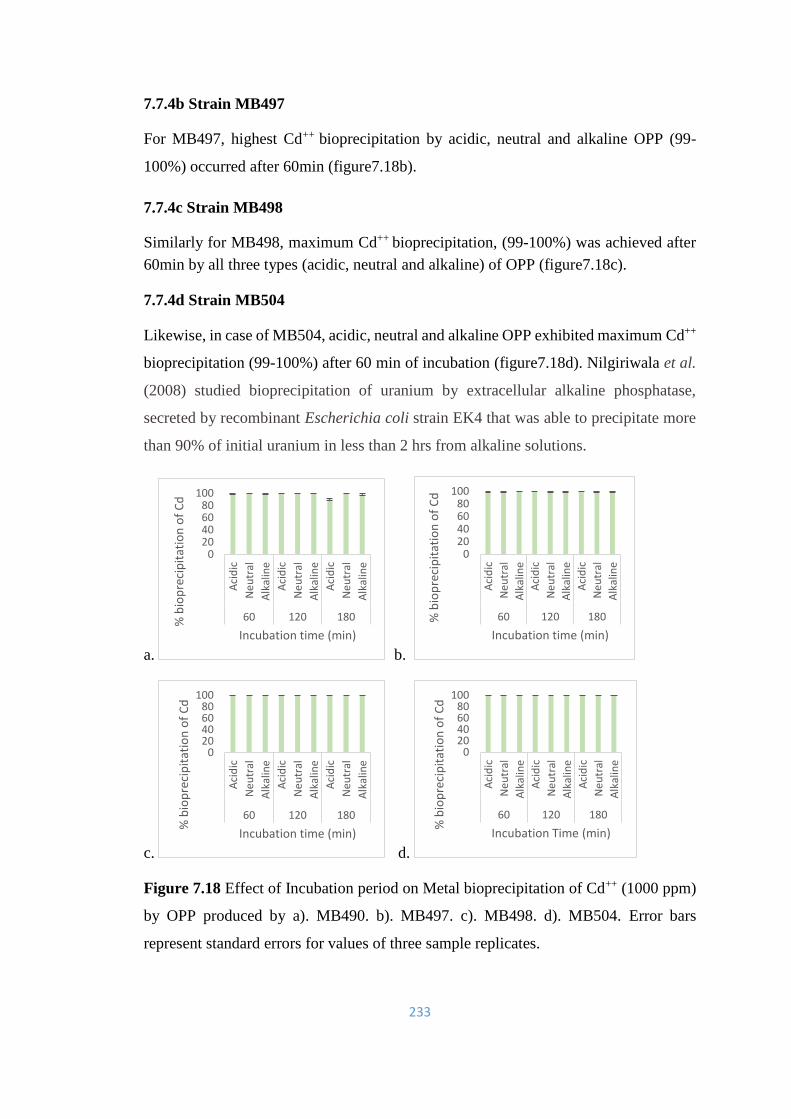
233
7.7.4b Strain MB497
For MB497, highest Cd++ bioprecipitation by acidic, neutral and alkaline OPP (99-
100%) occurred after 60min (figure7.18b).
7.7.4c Strain MB498
Similarly for MB498, maximum Cd++ bioprecipitation, (99-100%) was achieved after
60min by all three types (acidic, neutral and alkaline) of OPP (figure7.18c).
7.7.4d Strain MB504
Likewise, in case of MB504, acidic, neutral and alkaline OPP exhibited maximum Cd++
bioprecipitation (99-100%) after 60 min of incubation (figure7.18d). Nilgiriwala et al.
(2008) studied bioprecipitation of uranium by extracellular alkaline phosphatase,
secreted by recombinant Escherichia coli strain EK4 that was able to precipitate more
than 90% of initial uranium in less than 2 hrs from alkaline solutions.
a. b.
c. d.
Figure 7.18 Effect of Incubation period on Metal bioprecipitation of Cd++ (1000 ppm)
by OPP produced by a). MB490. b). MB497. c). MB498. d). MB504. Error bars
represent standard errors for values of three sample replicates.
020406080
100
Aci
dic
Ne
utr
al
Alk
alin
e
Aci
dic
Ne
utr
al
Alk
alin
e
Aci
dic
Ne
utr
al
Alk
alin
e
60 120 180% b
iop
reci
pit
atio
n o
f C
d
Incubation time (min)
020406080
100A
cid
ic
Ne
utr
al
Alk
alin
e
Aci
dic
Ne
utr
al
Alk
alin
e
Aci
dic
Ne
utr
al
Alk
alin
e60 120 180%
bio
pre
cip
itat
ion
of
Cd
Incubation time (min)
020406080
100
Aci
dic
Ne
utr
al
Alk
alin
e
Aci
dic
Ne
utr
al
Alk
alin
e
Aci
dic
Ne
utr
al
Alk
alin
e
60 120 180
% b
iop
reci
pit
atio
n o
f C
d
Incubation time (min)
020406080
100
Aci
dic
Ne
utr
al
Alk
alin
e
Aci
dic
Ne
utr
al
Alk
alin
e
Aci
dic
Ne
utr
al
Alk
alin
e
60 120 180
% b
iop
reci
pit
atio
n o
f C
d
Incubation Time (min)

234
7.8 Substrate specificity of acidic and alkaline OPP for CPF, TAP and DM
Substrate specificity against different organophosphorus insecticides (Chlorpyrifos,
Dimethoate and Triazophos) was determined by measuring the acidic and alkaline OPP
activity (as neutral OPP production was negligible by the isolates) against 50 mg/l of
respective pesticides after 30 min of incubation at 37°C followed by HPLC and GCMS
analyses (Liang et al., 2005; Gao et al., 2012). Recently, the degradation of pesticides
by using enzymes is being considered as a more effective technology for
bioremediations (Cycon et al., 2013). As phosphatase enzyme hydrolyzes its substrate
and cleaves a phosphoric acid monoester into a phosphate ion and an alcohol by the
addition of water, thus it belongs to hydrolases (Liberti et al., 2012).
Previously, there are many reports of enzymatic degradation of OP pesticides.
Thengodkar and Sivakami (2010) reported 50 and 85% degradation of 10 ppm CPF by
intracellular alkaline phosphatase (extracted from Spirulina sp.) after 1 and 2hrs of
incubation respectively. Similarly, Tang and You (2012) revealed 84.4%, degradation
of TAP by intracellular cell extracts of Bacillus sp. TAP-1 respectively after 1hr of
incubation, and suggested that the Triazophos hydrolase expression was mainly
intracellular and constitutive. Gothwal et al. (2014) extracted and purified
organophosphorus hydrolase (OPH) from Brevundimonas diminuta capable of
degrading methyl parathion up to 500 μM with Vmax of 50 μM/min indicating a
hyperbolic relationship. They further reported the maximum activity of cell free OPH
at optimum pH 7.5 and at 35°C with incubation time of 8 min.
7.7.1 Strain MB490
In case of OPP extracted from MB490, there was less degradation of CPF, TAP and
DM (47, 43 and 40% respectively) by acidic OPP as compared to alkaline OPP i.e 98.8,
94.58 and 90% degradation of CPF, TAP and DM respectively (figure 7.19a).
7.7.2 Strain MB497
Similarly, for MB497, there was less degradation of CPF (70%), TAP (65%) and DM
(60%) by acidic OPP as compared to that degraded by alkaline OPP (94.94, 92.5 and
80% degradation of CPF, TAP and DM respectively). However, acidic OPP seemed
more active in MB497 than in MB490 (figure 7.19b).
235
7.7.3 Strain MB498
Organophosphorus phosphatase from MB498 exhibited the same trend as there was
more degradation of CPF (99.32%), TAP (95.5%) and DM (92%) by alkaline OPP than
by acidic OPP i.e 75, 70 and 65% respectively (figure 7.19c). Furthermore, acidic and
alkaline OPP from MB498 showed more active degradation of three pesticide than
MB490 and MB497.
7.7.4 Strain MB504
In case of MB504, there was less degradation of CPF (80%), TAP (75%) and DM (69%)
by acidic OPP than by alkaline OPP (98.12, 96.82 and 94% respectively). Among the
four isolates, acidic OPP extracted from MB504 proved most efficient against CPF,
TAP and DM (figure 7.19d). Alkaline OPP was more efficient in MB504 against CPF
than in MB497 but less than in MB498 and MB490, while it was most active in MB504
against TAP and DM as compared to other three isolates as shown in figure 7.19.
HPLC chromatograms for TAP degradation by alkaline OPP are shown in figure 7.20.
GCMS analyses of the enzymatic reaction mixtures with the three pesticides again
confirmed the formation of same metabolites as observed earlier with OPs treated
bacterial samples (chapters 4, 5 & 6).
Phosphatases belong to the Organophosphorus hydrolases (OPH) and play significant
role in the degradation of OPs alongwith MPH and OpdA. OPH (organophosphorus
hydrolase) is involved in the hydrolysis of organophosphates and has been much
studied (Chaudhry et al., 1988; Mulbry and Karns 1989a; Raushel, 2002; Pinto et al.,
2017). It was reported by Barik et al. (1984) that parathion-hydrolase could hydrolyze
parathion efficiently and was found to be constitutive in nature. Tang and You (2012)
revealed the triazophos-hydrolase activity of crude cell free extracts of strain TAP-1,
thus indicating the enzymatic degradation of triazophos. They further demonstrated that
enzyme involved are intracellular and constitutive.
The main bacterial pathways for degradation of OP pesticides involved the cleavage of
phosphorus ester bond (P-O), which ultimately results in the release of inorganic
phosphorus that is utilized by bacteria as a sole source of phosphorus (Horne.et al.,
2002). Generally phosphotriestrases (PTE) are the enzymes catalyzing breakdown of
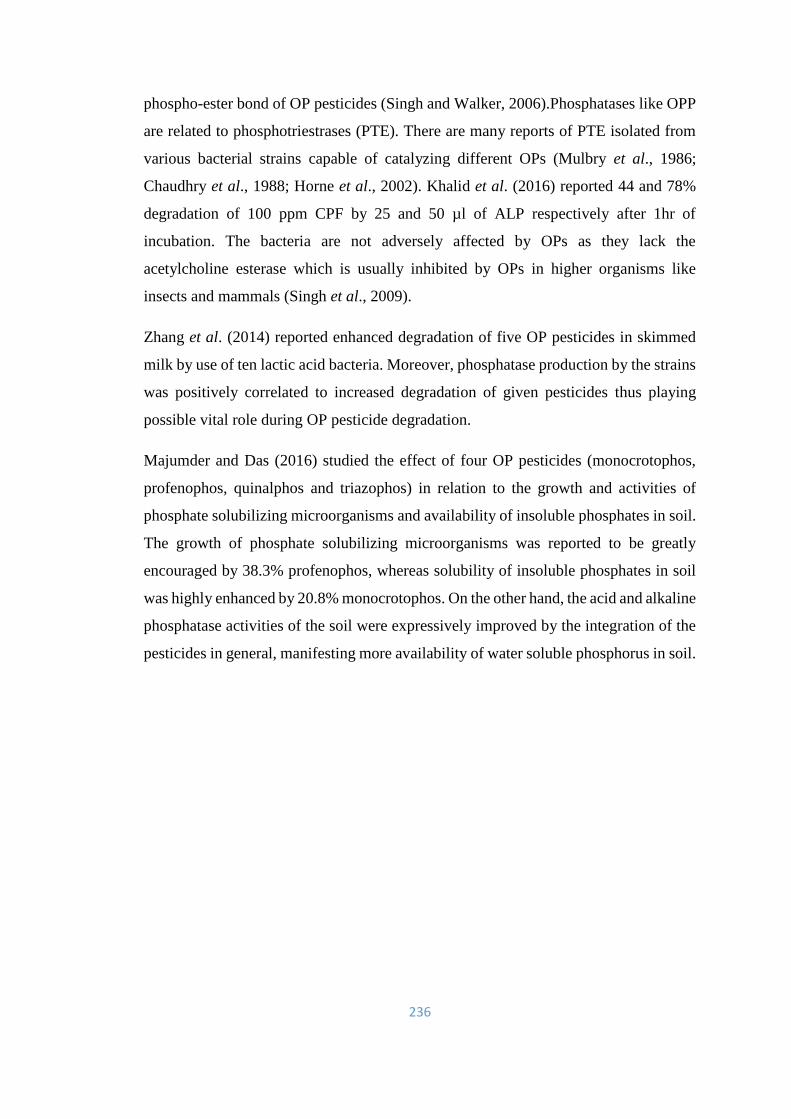
236
phospho-ester bond of OP pesticides (Singh and Walker, 2006).Phosphatases like OPP
are related to phosphotriestrases (PTE). There are many reports of PTE isolated from
various bacterial strains capable of catalyzing different OPs (Mulbry et al., 1986;
Chaudhry et al., 1988; Horne et al., 2002). Khalid et al. (2016) reported 44 and 78%
degradation of 100 ppm CPF by 25 and 50 µl of ALP respectively after 1hr of
incubation. The bacteria are not adversely affected by OPs as they lack the
acetylcholine esterase which is usually inhibited by OPs in higher organisms like
insects and mammals (Singh et al., 2009).
Zhang et al. (2014) reported enhanced degradation of five OP pesticides in skimmed
milk by use of ten lactic acid bacteria. Moreover, phosphatase production by the strains
was positively correlated to increased degradation of given pesticides thus playing
possible vital role during OP pesticide degradation.
Majumder and Das (2016) studied the effect of four OP pesticides (monocrotophos,
profenophos, quinalphos and triazophos) in relation to the growth and activities of
phosphate solubilizing microorganisms and availability of insoluble phosphates in soil.
The growth of phosphate solubilizing microorganisms was reported to be greatly
encouraged by 38.3% profenophos, whereas solubility of insoluble phosphates in soil
was highly enhanced by 20.8% monocrotophos. On the other hand, the acid and alkaline
phosphatase activities of the soil were expressively improved by the integration of the
pesticides in general, manifesting more availability of water soluble phosphorus in soil.
237
a. b.
c. d.
Figure 7.19 Degradation of OP pesticides by acidic and alkaline OPP as analyzed by
HPLC after 30min of incubation. a). MB490. b). MB497, c). MB498. d). MB504. Error
bars represent standard errors for values of three sample replicates.
0
20
40
60
80
100
CPF TAP DM
% D
egra
dat
ion
MB490
AcidicOPP
AlkalineOPP
0
20
40
60
80
100
CPF TAP DM
% D
egra
dat
ion
MB497
AcidicOPP
AlkalineOPP
0
20
40
60
80
100
CPF TAP DM
% D
egra
dat
ion
MB498
AcidicOPP
AlkalineOPP
0
20
40
60
80
100
CPF TAP DM
% D
egra
dat
ion
MB504
AcidicOPP
AlkalineOPP

238
a. b.
c. d.
e.
Figure 7.20 HPLC chromatograms showing degradation of 50 mg/l of TAP (RT = 2.4
min) by alkaline OPP as analyzed by HPLC after 30 min of incubation. a). Control b).
MB490. c).MB497. d). MB498. e). MB504.
239
Conclusion
The four bacterial strains MB490 (Pseudomonas kilonensis), MB497 (Bacillus
thuringiensis), MB498 (Pseudomonas kilonensis) and MB504 (Pseudomonas sp.) were
proved to be phosphate solubilizing bacteria with the production of extracellular acidic,
neutral and alkaline phosphatases. The three types of OPP were further found active
and stable over a wide range of pH, temperature, substrate (p-NPP) concentrations,
metal ions and different chemicals like SDS and EDTA. The acidic, neutral and alkaline
OPP further exhibited great potential for bioprecipitation of different metals like Ni,
Mn, Cd and Cr. Finally, acidic and alkaline OPP showed a broad substrate specificity
against three OP pesticides (CPF, TAP and DM) with significant degradation and
metabolites formation as analyzed by HPLC and GCMS. Therefore, the phosphate
solubilizing potential and phosphatase production activity of the bacteria in the current
study, strongly recommend these four strains for their application in the bioremediation
of soil and water resources contaminated with OP pesticides and heavy metals. These
strains can even be used as biofertilizers due to their phosphate solubilization ability.
240
Chapter 8
Discussion
Organophosphate pesticides are playing vital role in the control of domestic and
agricultural pests and insects, but their over use has adversely affected our environment.
Recently, the OP pesticides have been comprehensively studied with respect to their
chemistry, mechanism of action and classification (Carr et al., 2001; Caceres et al.,
2007; Raposo et al., 2010). There may be both acute and chronic effects when humans
are exposed to OP pesticides. The acute effects are definitely fatal due to direct
poisoning, while the long-term effects may harm the peripheral and central nervous
system in mammals due to inhibition of acetylcholinesterase. According to Costa
(2006), this phenomenon is medically termed as organophosphate-induced delayed
neuropathy (OPIDN). Furthermore, it is a known fact that OP pesticides may be
potential teratogens and carcinogens for human (Chambers et al., 2001; De Silva et al.,
2006).
Recently biotechnological approaches are being used to degrade recalcitrant pesticide
residues present in our environment including soil and water resources. These
bioremediation techniques depend upon both natural and cultivated organisms like
bacteria, fungi, cyanobacteria and even higher plants for the transformation of
pollutants and are considered more effective, economical and environment friendly as
compared to conventional physical and chemical methods (Singh and Walker, 2006).
There are variety of fungal and bacterial microbes found capable of degrading OP
compounds e.g among bacteria Enterobacter B-14, Alcaligens faecalis DSP3,
Stenotrophomonas sp.YC-1, Sphingomonas Dsp-2, Paracoccus sp. TRP, Bacillus
pumilus C2A1, Serratia sp. (Singh et al., 2004; Yang et al., 2005; Yang et al., 2006;
Xu et al., 2008; Anwar et al., 2009; Li et al., 2010; Li et al., 2013). Similarly fungal
OP degraders include Verticillium sp. DSP, Acremonium sp. GFRC-1 and
Cladosporium cladosporioides Hu-0 (Fang et al., 2008; Kulshrestha and Kumari, 2011;
Chen et al., 2012).
The microbes, especially the common inhabitant of polluted sites are bestowed upon
natural mechanisms like enzymes to consume and transform toxic chemicals including
pesticides in to non- toxic or less toxic forms. Bioremediation using bacteria has been
241
more focused by researchers mainly due to their easy handling, rapid growth and
minimum nutritional requirements. Therefore, in the present study, OP pesticide
degrading bacteria were isolated from agricultural fields of Mianwali with a previous
history of repeated application of OP pesticides. The main objective was to check the
potential of these indigenous bacteria to degrade and transform three OP pesticides
(CPF, TAP and DM) and to evaluate their ability to be utilized for the bioremediation
of Pakistani agricultural soils which have been contaminated with OP pesticides.
Plate assay for pesticide tolerance of four isolates Pseudomonas kilonensis MB490,
Bacillus thuringiensis MB497, Pseudomonas kilonensis MB498 and Pseudomonas sp.
MB504 revealed that MB497 was most tolerant for CPF up to 8 g/l, followed by MB490
and MB498 up to 6 g/l and then by MB504 up to 0.8 g/l of CPF. In case of TAP, MB490,
MB497 and MB498 showed good growth up to 4 g/l, whereas MB504 was least tolerant
up to 2 g/l of TAP. Dimethoate proved more toxic for isolates as MB490, MB497 and
MB498 showed growth only up to 0.4 g/l of Dimethoate, while MB504 was least
tolerant (up to 0.22 g/l) for DM. For three pesticides, these isolates showed tolerance
as CPF>TAP>DM and MB504 proved least tolerant among four isolates. For CPF,
tolerance of isolates followed the order MB497>MB490= MB498>MB504, while for
TAP and DM toleratance, the order was MB490=MB497=MB498>MB504. Previously
bacterial tolerance to different concentrations of various pesticides is well documented.
Azotobacter chroococcum was capable of tolerating carbofuran up to 5 ppm (Kale et
al., 1989). It was reported by Harishankar et al. (2013) that L. fermentum, L. lactis and
E. coli could tolerate CPF up to 1400 µg/ml while E. faecalis and L. plantarum showed
tolerance up to 400 and 100 µg/ml respectively. Similarly Shafiani and Malik (2003)
reveled that a Pseudomonas sp. was able to resist endosulfan, carbofuran and malathion
up to 800, 1600 and 1600 µg/ml respectively.
The four selected strains MB490 (Pseudomonas kilonensis), MB497 (Bacillus
thuringiensis), MB498 (Pseudomonas kilonensis) and MB504 (Pseudomonas sp.) out
of a number of isolates showed their growth as well as pesticides (CPF, TAP and DM)
degradation under a wide range of temperatures (25◦C-37◦C) and pH (6-9) which are
mostly prevalent under local environment of Pakistan. The heavy metals and organic
pollutants other than pesticides are also being continuously accumulated in the soil
sediments and water bodies as a result of different human activities like industrial
242
effluents or biochemical spills. The selected isolates were able to tolerate significant
concentration of different heavy metals like Ni, Cr, Cu, Zn, Pb and Mn (Table 3.11)
and also organic compounds such as Benzene, Toluene, Xylene, Aniline, Biphenyl and
Naphthalene (Table 3.12).
Wang et al. (2005) reported that isolate Klebsiella sp. E6 exhibited good growth at pH
7–8 under a broader temperature range of 32 to 37◦C. Furthermore, it was capable of
utilizing methanol and TAP as carbon source and nitrogen source respectively. In case
of CPF, there was 83.74 to 99.48% degradation at all given temperatures (25, 30 and
37◦C) and 67.22 to 99.39% at all given pH (6, 7, 8) by all the four isolates. Maximum
CPF degradation was observed at 30 and 37◦C and at pH 8 in most isolates, which
corresponds to prevailing average temperature and soil pH in Pakistan. The soils in
Pakistan are considered mostly dry and alkaline (with pH almost 8 or above) due to the
presence of high quantities of calcium carbonate and a lower amount of organic matter
(Khalid et al., 2012). It is suggested that pH of experimental biological systems must
be maintained within range of 6.5-8.0 (Tyagi, 1991; Tano-Debrah et al., 1999).
Similarly, Singh et al. (2003) reported more rapid Chlorpyrifos biodegradation in the
two alkaline soils having pH 7.7 and 8.4 as compared to acidic and neutral pH. The
degradation of fenitrothion which is a nitrophenolic pesticide, by Burkholderia sp.
FDS-1, was reported to be more rapid at 30 °C and at slightly alkaline pH (Hong et al.,
2007).
Present study results are in agreement with Anwar et al. (2009) who reported more
efficient (80%) CPF degradation by Bacillus pumilus isolated from Pakistani
agricultural soils at alkaline and neutral pH as compared to lesser (only 50%)
degradation at acidic pH. On the other hand, there was higher CPF degradation at acidic
pH by a fungus, Cladosporium cladosporioides Hu-01 as revealed by Chen et al.
(2012).
During modern age, treatment of soils and sediments in slurry bioreactors (SBs) under
controlled environmental conditions is being considered as one of the most significant
ways of in situ and ex situ bioremediation techniques (Mueller et al., 1991; Mohan et
al., 2006). The main purpose to use SBs is to determine the practicability and real
potential of a certain biological approach in the final refurbishment of a polluted soil or
243
place (Fava et al., 2004). Indeed, the rates of removal of a pollutant with in slurry
environment are determined chiefly by the degradation potential of the microorganisms
existing in the system (Cookson, 1995).
Soil microcosms are like the miniaturized ecosystems that make it possible for the
researchers to probe the effects of presence of selective recalcitrant on natural microbial
populations under precise conditions (Grenni et al., 2012). The laboratory microcosms
are considered as model ecosystem having a part of the natural environment like soil or
water (Benton et al., 2007; Drake and Kramer, 2012). These models possess natural
biotic communities which are retained, under controlled environmental conditions like
temperature, light, humidity etc. equivalent to natural ones.
When the four isolates MB490 (Pseudomonas kilonensis), MB497 (Bacillus
thuringiensis), MB498 (Pseudomonas kilonensis) and MB504 (Pseudomonas sp.) were
compared for their potential to degrade CPF, TAP and DM in M-9 broth, soil slurry and
soil microcosm with respect to time period, it was noticed that all of these exhibited
outstanding consumption of CPF, TAP and DM within 9 days of incubation (figure
8.1a, b, c). In M-9 broth, all isolates consumed three given pesticides in the order
CPF>TAP>DM with CPF degraded up to almost 100%, TAP 88.4-95.8% and DM 80.1-
92% within 9 days. In soil slurry, all the strains exhibited CPF and TAP degradation up
to 99% or above, while these could degrade DM from 80 to 91.8%. When grown in
soil microcosm, these isolates could degrade more CPF (99 to 99.8%) followed by TAP
(92.72 to 95%) and then DM (78.8 to 82.1%), which corresponds well with their
tolerance behavior against CPF, TAP and DM. So, it can be noticed that CPF proved
more easy and favorite substrate for the isolates in all the three given media (M-9 broth,
soil slurry and soil microcosm), followed by TAP and then DM. When degradation
performance of individual bacterial strains was compared in the given media for each
of three pesticides, it was observed that all four strains showed >99% degradation of
CPF in all media (figure 8.1). Present study results are in strong agreement with those
revealed by Cho et al. (2009) who reported 83.3% degradation of CPF (200 mg/l)
within 3 days and 100% degradation after 9 days by four strains of lactic acid bacteria
(Leuconostoc mesenteroides WCP907, Lactobacillus brevis WCP902, Lactobacillus
plantarum WCP931, and Lactobacillus sakei WCP904). These strains were also
capable of degrading Coumaphos, diazinon, parathion, and methylparathion. Abraham
244
and Silambarasan (2013) studied CPF degradation in soil microcosm (100 g of soil)
with and without supplementing nutrients by Sphingobacterium sp. JAS3 and reported
complete degradation of CPF within 24 hrs in both soils along with complete
degradation of TCP (product of CPF degradation) achieved in 5 days of incubation.
During present study, four individual strains MB490 (Pseudomonas kilonensis),
MB497 (Bacillus thuringiensis), MB498 (Pseudomonas kilonensis) and MB504
(Pseudomonas sp.) showed > 99% degradation of initial 200 mg/l of CPF in sterilized
soil within just 9 days of incubation which can be compared with that reported by Akbar
and Sultan (2016) who stated that Achromobacter xylosoxidans (JCp4) and
Ochrobactrum sp. (FCp1) could degrade 200 mg/kg of initial CPF in both sterilized
and non-sterilized soils up to 93–100% but within 42 days. Stenotrophomonas sp. YC-
1 was reported to degrade 100 mg/l of CPF up to 100% within 24 hrs (Yang et al.,
2006), while 93.8% degradation of initial supplemented 5 mg/l CPF was demonstrated
by Synechocystis sp. PUPCCC 64 within 5 days (Singh et al., 2011). Similarly, it was
revealed by Singh et al. (2004) that Enterobacter strain B-14 could degrade CPF (25
mg/l) up to 40% in 48 hrs of treatment.
For TAP degradation in M-9 broth, the isolates followed the order
MB490>MB497>MB498>MB504, while in soil slurry these were degrading TAP as
MB490=MB504>MB498>MB497 and in soil microcosm these isolates consumed TAP
as MB504>MB497>MB490>MB498 but with very minor difference (figure 8.1). There
are only few earlier reports about TAP degradation by bacteria. Wang et al. (2005)
reported bacterial degradation of TAP for the first time by Klebsiella sp. E6 which was
able to consume 100 mg/l of TAP as well as its metabolite 1-phenyl-3-hydroxy-1, 2, 4-
triazole as a carbon and nitrogen source within 7 days. Similarly, Bacillus sp., TAP-1
was reported to degrade 100 mg/l of TAP up to 98.5% in the minimal liquid medium
after 5 days of incubation (Tang and You, 2012). Yang et al. (2011) reported the
complete removal of 50 mg/l of TAP and its metabolite 1-phenyl-3-hydroxy-1, 2, 4-
triazole (PHT) by Diaphorobacter sp. TPD-1in mineral salt broth within 24 and 56 hrs
respectively. Stenotrophomonas sp. PF32 and Stenotrophomonas sp. G1 could degrade
100 mg/l and 50 mg/l of triazophos up to 97 and 34% respectively within 42 and 24 hrs
respectively (Xu et al., 2009; Deng et al., 2015).
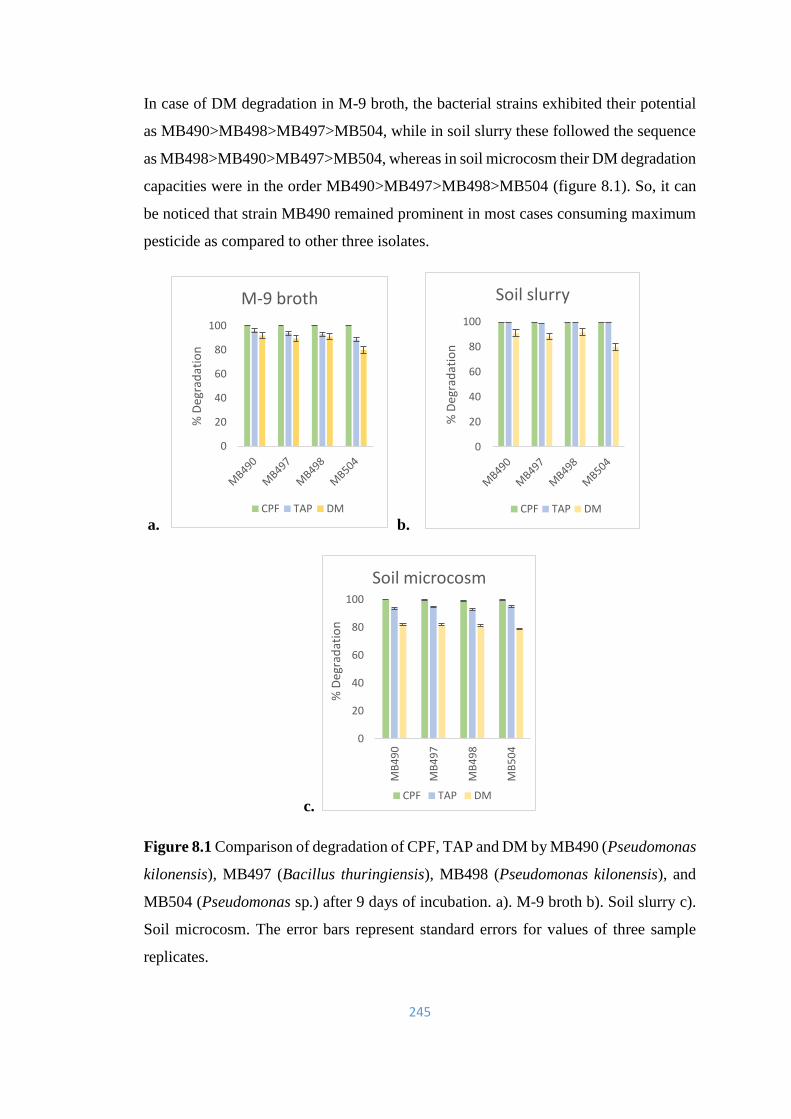
245
In case of DM degradation in M-9 broth, the bacterial strains exhibited their potential
as MB490>MB498>MB497>MB504, while in soil slurry these followed the sequence
as MB498>MB490>MB497>MB504, whereas in soil microcosm their DM degradation
capacities were in the order MB490>MB497>MB498>MB504 (figure 8.1). So, it can
be noticed that strain MB490 remained prominent in most cases consuming maximum
pesticide as compared to other three isolates.
a. b.
c.
Figure 8.1 Comparison of degradation of CPF, TAP and DM by MB490 (Pseudomonas
kilonensis), MB497 (Bacillus thuringiensis), MB498 (Pseudomonas kilonensis), and
MB504 (Pseudomonas sp.) after 9 days of incubation. a). M-9 broth b). Soil slurry c).
Soil microcosm. The error bars represent standard errors for values of three sample
replicates.
0
20
40
60
80
100
% D
egra
dat
ion
M-9 broth
CPF TAP DM
0
20
40
60
80
100
% D
egra
dat
ion
Soil slurry
CPF TAP DM
0
20
40
60
80
100
MB
49
0
MB
49
7
MB
49
8
MB
50
4
% D
egra
dat
ion
Soil microcosm
CPF TAP DM

246
One of the unique feature of the selected four bacterial isolates MB490 (Pseudomonas
kilonensis), MB497 (Bacillus thuringiensis), MB498 (Pseudomonas kilonensis) and
MB504 (Pseudomonas sp.) was their ability to consume and degrade primary
metabolite of CPF i.e 3, 5, 6 Trichloropyridinol (TCP), which previously had been
considered recalcitrant due to its antimicrobial effect (Armbrust, 2001; Caceres et al.,
2007). At lower concentration (14 mg/l) of TCP, the four bacterial isolates showed more
degradation (93.80 to 98%) of TCP as compared to higher (28 mg/l) concentration of
TCP i.e 60.39 to 90.57% within 72 hrs of incubation (Figure 8.2), which was observed
to be positively correlated with bacterial growth during this period. At 14 mg/l, TCP
was degraded by isolates in the sequence MB490>MB504>MB497>MB498, while at
28 mg/l, TCP degradation followed the order: MB497>MB504>MB490>MB498. On
the other hand, there was only negligible (2-5%) TCP degradation in control without
inoculum.
Figure 8.2 Comparison of degradation of 3, 5, 6 Trichloropyridinol (TCP) at two
different concentrations (14 mg/l and 28 mg/l) by bacterial isolates MB490
(Pseudomonas kilonensis), MB497 (Bacillus thuringiensis), MB498 (Pseudomonas
kilonensis) and MB504 (Pseudomonas sp.). The error bars represent standard errors for
values of three sample replicates.
In the past, only a small number of microorganisms have been reported which were
capable of TCP degradation along with its parent compound CPF e.g Alcaligenes
Faecalis, Bacillus pumilus C2A1, Cladosporium cladosporioides Hu-01, Cupriavidus
sp. DT-1, Xanthomonas sp. 4R3-M1 and Pseudomonas sp. 4H1-M3 (Yang et al., 2005;
Anwar et al., 2009; Chen et al., 2012; Lu et al., 2013; Rayu et al., 2017). Current study
0
20
40
60
80
100
14 mg/l 28 mg/l 14 mg/l 28 mg/l 14 mg/l 28 mg/l
24 hrs 48 hrs 72 hrs
% D
egra
dat
ion
of
TCP
Incubation time
MB490
MB497
MB498
MB504
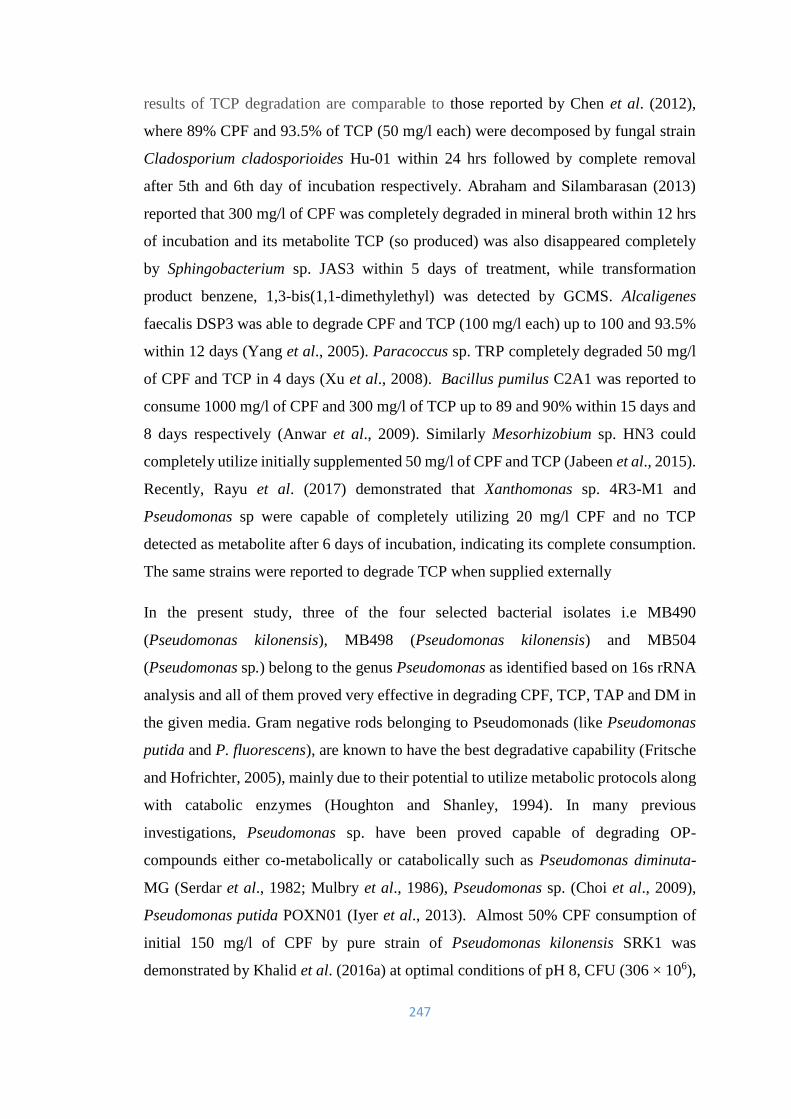
247
results of TCP degradation are comparable to those reported by Chen et al. (2012),
where 89% CPF and 93.5% of TCP (50 mg/l each) were decomposed by fungal strain
Cladosporium cladosporioides Hu-01 within 24 hrs followed by complete removal
after 5th and 6th day of incubation respectively. Abraham and Silambarasan (2013)
reported that 300 mg/l of CPF was completely degraded in mineral broth within 12 hrs
of incubation and its metabolite TCP (so produced) was also disappeared completely
by Sphingobacterium sp. JAS3 within 5 days of treatment, while transformation
product benzene, 1,3-bis(1,1-dimethylethyl) was detected by GCMS. Alcaligenes
faecalis DSP3 was able to degrade CPF and TCP (100 mg/l each) up to 100 and 93.5%
within 12 days (Yang et al., 2005). Paracoccus sp. TRP completely degraded 50 mg/l
of CPF and TCP in 4 days (Xu et al., 2008). Bacillus pumilus C2A1 was reported to
consume 1000 mg/l of CPF and 300 mg/l of TCP up to 89 and 90% within 15 days and
8 days respectively (Anwar et al., 2009). Similarly Mesorhizobium sp. HN3 could
completely utilize initially supplemented 50 mg/l of CPF and TCP (Jabeen et al., 2015).
Recently, Rayu et al. (2017) demonstrated that Xanthomonas sp. 4R3-M1 and
Pseudomonas sp were capable of completely utilizing 20 mg/l CPF and no TCP
detected as metabolite after 6 days of incubation, indicating its complete consumption.
The same strains were reported to degrade TCP when supplied externally
In the present study, three of the four selected bacterial isolates i.e MB490
(Pseudomonas kilonensis), MB498 (Pseudomonas kilonensis) and MB504
(Pseudomonas sp.) belong to the genus Pseudomonas as identified based on 16s rRNA
analysis and all of them proved very effective in degrading CPF, TCP, TAP and DM in
the given media. Gram negative rods belonging to Pseudomonads (like Pseudomonas
putida and P. fluorescens), are known to have the best degradative capability (Fritsche
and Hofrichter, 2005), mainly due to their potential to utilize metabolic protocols along
with catabolic enzymes (Houghton and Shanley, 1994). In many previous
investigations, Pseudomonas sp. have been proved capable of degrading OP-
compounds either co-metabolically or catabolically such as Pseudomonas diminuta-
MG (Serdar et al., 1982; Mulbry et al., 1986), Pseudomonas sp. (Choi et al., 2009),
Pseudomonas putida POXN01 (Iyer et al., 2013). Almost 50% CPF consumption of
initial 150 mg/l of CPF by pure strain of Pseudomonas kilonensis SRK1 was
demonstrated by Khalid et al. (2016a) at optimal conditions of pH 8, CFU (306 × 106),
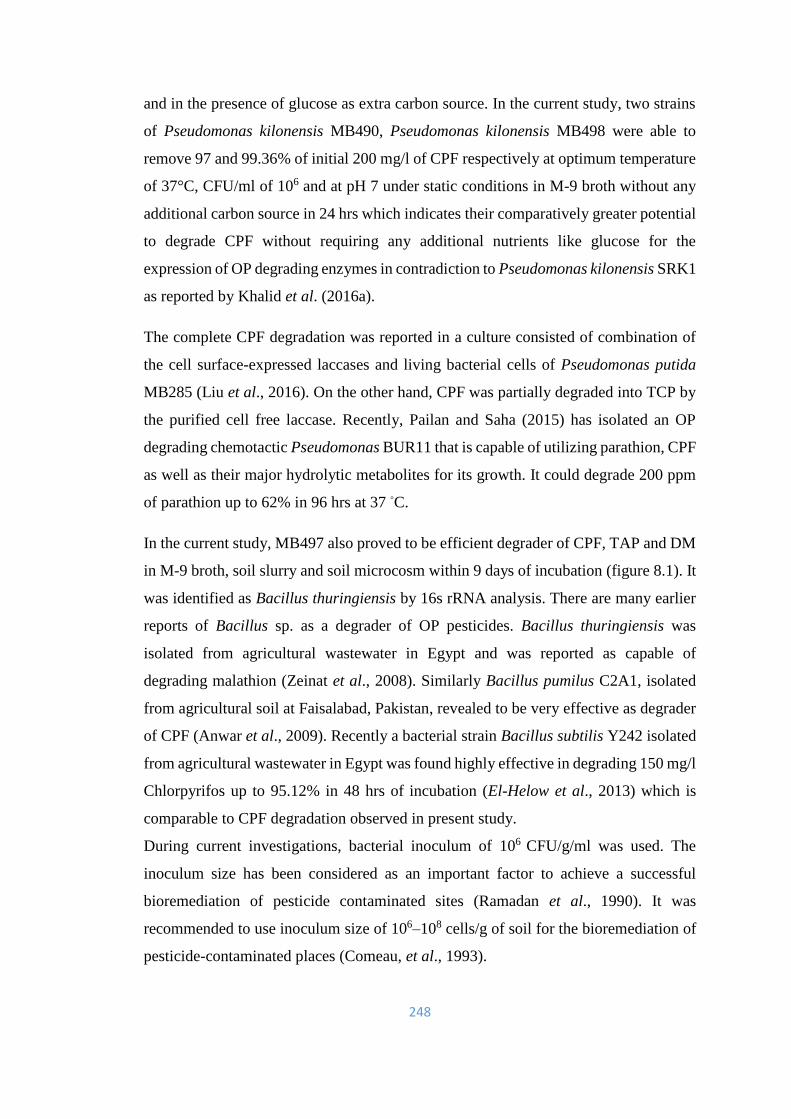
248
and in the presence of glucose as extra carbon source. In the current study, two strains
of Pseudomonas kilonensis MB490, Pseudomonas kilonensis MB498 were able to
remove 97 and 99.36% of initial 200 mg/l of CPF respectively at optimum temperature
of 37°C, CFU/ml of 106 and at pH 7 under static conditions in M-9 broth without any
additional carbon source in 24 hrs which indicates their comparatively greater potential
to degrade CPF without requiring any additional nutrients like glucose for the
expression of OP degrading enzymes in contradiction to Pseudomonas kilonensis SRK1
as reported by Khalid et al. (2016a).
The complete CPF degradation was reported in a culture consisted of combination of
the cell surface-expressed laccases and living bacterial cells of Pseudomonas putida
MB285 (Liu et al., 2016). On the other hand, CPF was partially degraded into TCP by
the purified cell free laccase. Recently, Pailan and Saha (2015) has isolated an OP
degrading chemotactic Pseudomonas BUR11 that is capable of utilizing parathion, CPF
as well as their major hydrolytic metabolites for its growth. It could degrade 200 ppm
of parathion up to 62% in 96 hrs at 37 ◦C.
In the current study, MB497 also proved to be efficient degrader of CPF, TAP and DM
in M-9 broth, soil slurry and soil microcosm within 9 days of incubation (figure 8.1). It
was identified as Bacillus thuringiensis by 16s rRNA analysis. There are many earlier
reports of Bacillus sp. as a degrader of OP pesticides. Bacillus thuringiensis was
isolated from agricultural wastewater in Egypt and was reported as capable of
degrading malathion (Zeinat et al., 2008). Similarly Bacillus pumilus C2A1, isolated
from agricultural soil at Faisalabad, Pakistan, revealed to be very effective as degrader
of CPF (Anwar et al., 2009). Recently a bacterial strain Bacillus subtilis Y242 isolated
from agricultural wastewater in Egypt was found highly effective in degrading 150 mg/l
Chlorpyrifos up to 95.12% in 48 hrs of incubation (El-Helow et al., 2013) which is
comparable to CPF degradation observed in present study.
During current investigations, bacterial inoculum of 106 CFU/g/ml was used. The
inoculum size has been considered as an important factor to achieve a successful
bioremediation of pesticide contaminated sites (Ramadan et al., 1990). It was
recommended to use inoculum size of 106–108 cells/g of soil for the bioremediation of
pesticide-contaminated places (Comeau, et al., 1993).
249
In previous findings, microbial consortia have been proven an efficient tool for
pesticide degradation because of the fact that a solitary bacterium might not have all
the enzymes required to remove whole or even majority of the organic compounds in a
polluted site. The consortia are composed of mixture of microbial communities so that
different genes and their enzymes having the maximum potential for biodegradation
can be used to degrade the composite mixtures of recalcitrant organic compounds often
present in contaminated locations (Fritsche and Hofrichter, 2005). Abraham et al.
(2014) reported the complete biodegradation of a mixture of two OP pesticides
(Chlorpyrifos, monocrotophos) and an organochlorine pesticide (endosulfan) by a
consortium consisting of 10 bacterial species in a fermenter–bioreactor system within
24 hrs of treatment. It was revealed by Ortiz-Hernandez and Sanchez-Salinas (2010)
that a bacterial consortium consisting of six bacterial strains was able to degrade
tetrachlorvinphos (TCV) up to 57% in 36 hrs. While only one individual strain A3 could
remove 49% TCV in mineral medium, other strains could utilize it only in rich medium.
Degradation potential of individual strains (MB490, MB497, MB498 and MB504) for
CPF, TAP and DM was compared with their respective consortia i.e A
(MB490+MB498), B (MB490+MB497), C (MB490+MB504), D (MB498+MB497), E
(MB498+MB504), F (MB497+MB504), and G (MB490+MB497+MB498+MB504) in
M-9 broth, soil slurry and soil microcosm after 9 days of incubation. It was observed
that all the consortia and individual pure strains were equally effective in degrading
CPF (up to 99% or more), in all given media after 9 days of incubation. Barathidasan
et al. (2014) used a consortium consisting of a bacterium Cellulomonas fimi (capable
of transforming CPF to TCP) and a fungal strain Phanerochaete chrysosporium that
could consume both CPF and TCP. The consortium was able to completely mineralize
50 mg/l of CPF within 16hrs which was otherwise possible in 6 days by the fungus
alone. Present investigation results are much better than those recently reported by
Akbar and Sultan (2016) that two bacterial isolates Achromobacter xylosoxidans JCp4
and Ochrobactrum sp. FCp1 could degrade up to 84.4% and 78.6% respectively of
initially supplemented 100 mg/l of CPF in a treatment period of 10 days. Recently a
consortium consisting of five strains (Pseudomonas kilonensis SRK1, Serratia
marcescens SRK2, Bacillus pumilus SRK4, Achromobacter xylosoxidans SRK5 and
Klebsiella sp. T13) was reported to consume 400 mg/l of CPF up to 98 % within
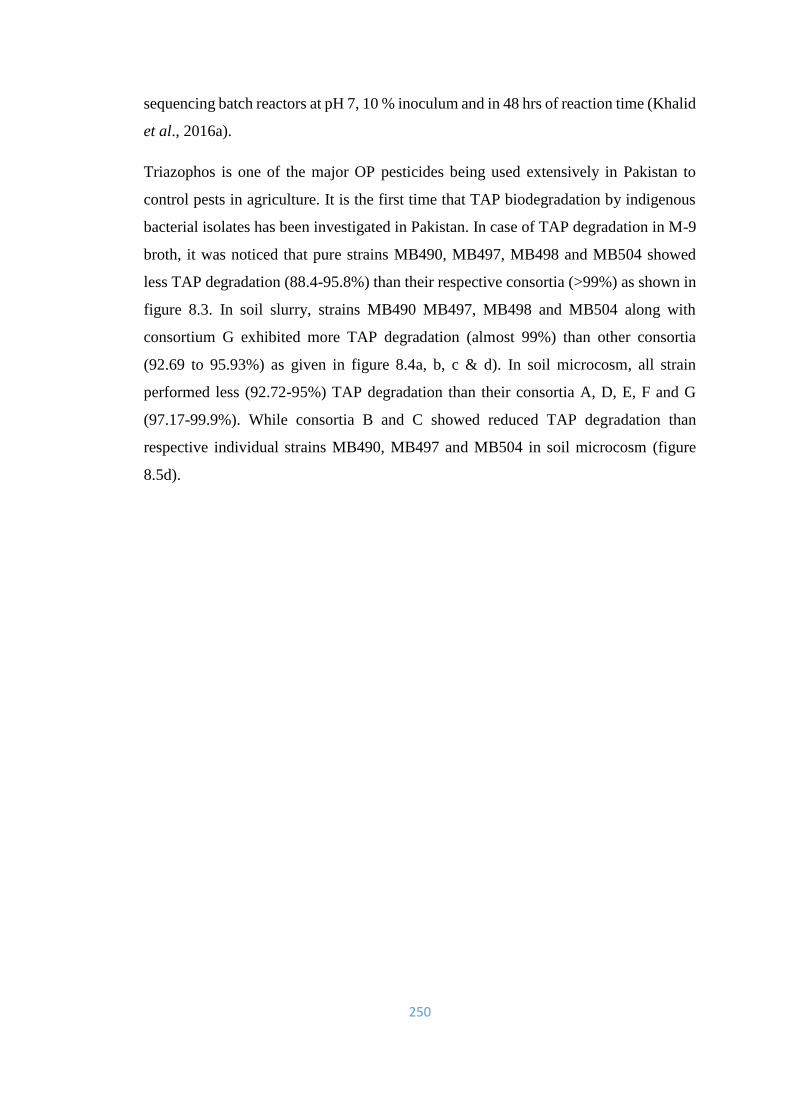
250
sequencing batch reactors at pH 7, 10 % inoculum and in 48 hrs of reaction time (Khalid
et al., 2016a).
Triazophos is one of the major OP pesticides being used extensively in Pakistan to
control pests in agriculture. It is the first time that TAP biodegradation by indigenous
bacterial isolates has been investigated in Pakistan. In case of TAP degradation in M-9
broth, it was noticed that pure strains MB490, MB497, MB498 and MB504 showed
less TAP degradation (88.4-95.8%) than their respective consortia (>99%) as shown in
figure 8.3. In soil slurry, strains MB490 MB497, MB498 and MB504 along with
consortium G exhibited more TAP degradation (almost 99%) than other consortia
(92.69 to 95.93%) as given in figure 8.4a, b, c & d). In soil microcosm, all strain
performed less (92.72-95%) TAP degradation than their consortia A, D, E, F and G
(97.17-99.9%). While consortia B and C showed reduced TAP degradation than
respective individual strains MB490, MB497 and MB504 in soil microcosm (figure
8.5d).
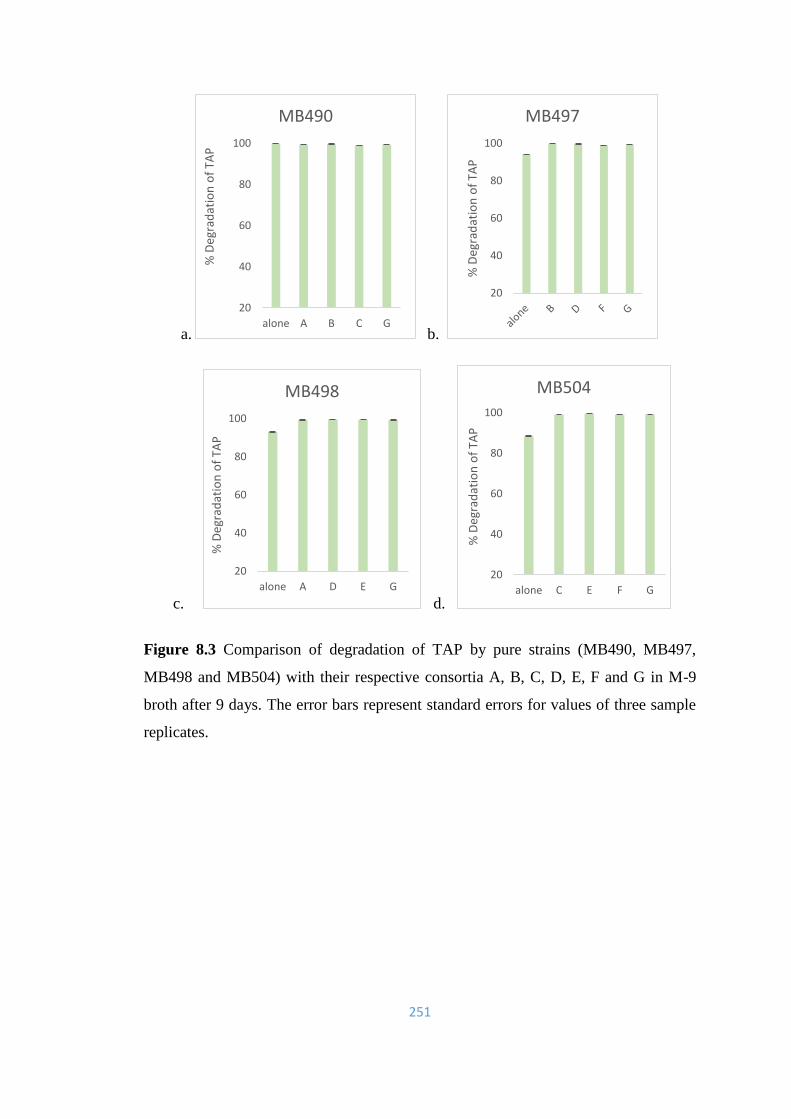
251
a. b.
c. d.
Figure 8.3 Comparison of degradation of TAP by pure strains (MB490, MB497,
MB498 and MB504) with their respective consortia A, B, C, D, E, F and G in M-9
broth after 9 days. The error bars represent standard errors for values of three sample
replicates.
20
40
60
80
100
alone A B C G
% D
egra
dat
ion
of
TAP
MB490
20
40
60
80
100
% D
egra
dat
ion
of
TAP
MB497
20
40
60
80
100
alone A D E G
% D
egra
dat
ion
of
TAP
MB498
20
40
60
80
100
alone C E F G
% D
egra
dat
ion
of
TAP
MB504
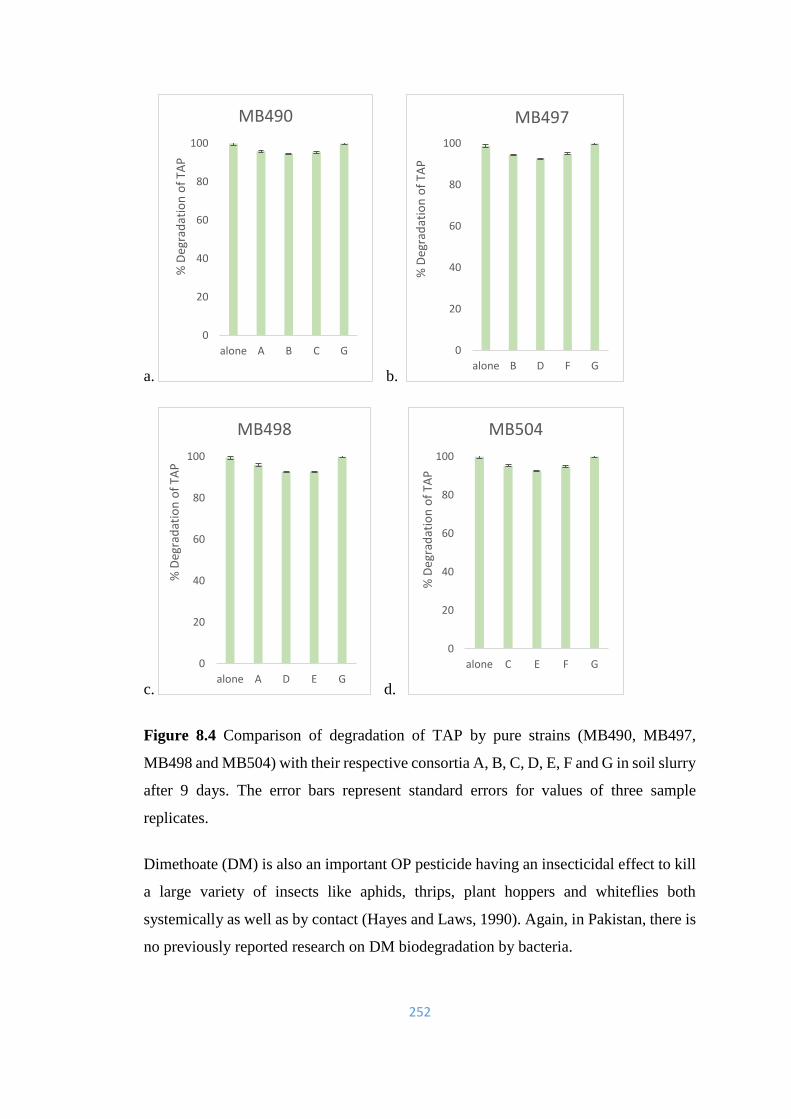
252
a. b.
c. d.
Figure 8.4 Comparison of degradation of TAP by pure strains (MB490, MB497,
MB498 and MB504) with their respective consortia A, B, C, D, E, F and G in soil slurry
after 9 days. The error bars represent standard errors for values of three sample
replicates.
Dimethoate (DM) is also an important OP pesticide having an insecticidal effect to kill
a large variety of insects like aphids, thrips, plant hoppers and whiteflies both
systemically as well as by contact (Hayes and Laws, 1990). Again, in Pakistan, there is
no previously reported research on DM biodegradation by bacteria.
0
20
40
60
80
100
alone A B C G
% D
egra
dat
ion
of
TAP
MB490
0
20
40
60
80
100
alone B D F G
% D
egra
dat
ion
of
TAP
MB497
0
20
40
60
80
100
alone A D E G
% D
egra
dat
ion
of
TAP
MB498
0
20
40
60
80
100
alone C E F G
% D
egra
dat
ion
of
TAP
MB504
253
a. b.
c. d.
Figure 8.5 Comparison of degradation of TAP by pure strains (MB490, MB497,
MB498 and MB504) with their respective consortia A, B, C, D, E, F and G in soil
microcosm after 9 days. The error bars represent standard errors for values of three
sample replicates.
So, the present investigation is novel in the sense that DM biodegradation by indigenous
bacterial isolates has been focused for the first time in Pakistan along with identification
of its metabolites suggesting a novel and unique pathway for its transformation in
bacteria. For DM degradation in M-9 broth after 9 days, more (95-99.9%) DM
degradation was observed by consortia as compared to pure strains (80.1-92%) (figure
8.6), probably due to more availability and solubility of pesticide in liquid media as
well as synergistic effect of all consortial members to degrade DM. In case of soil
0
20
40
60
80
100
alone A B C G
% D
egra
dat
ion
of
TAP
MB490
0
20
40
60
80
100
alone B D F G
% D
egra
dat
ion
of
TAP
MB497
0
20
40
60
80
100
alone A D E G
% D
egra
dat
ion
of
TAP
MB498
0
20
40
60
80
100
alone C E F G
% D
egra
dat
ion
of
TAP
MB504
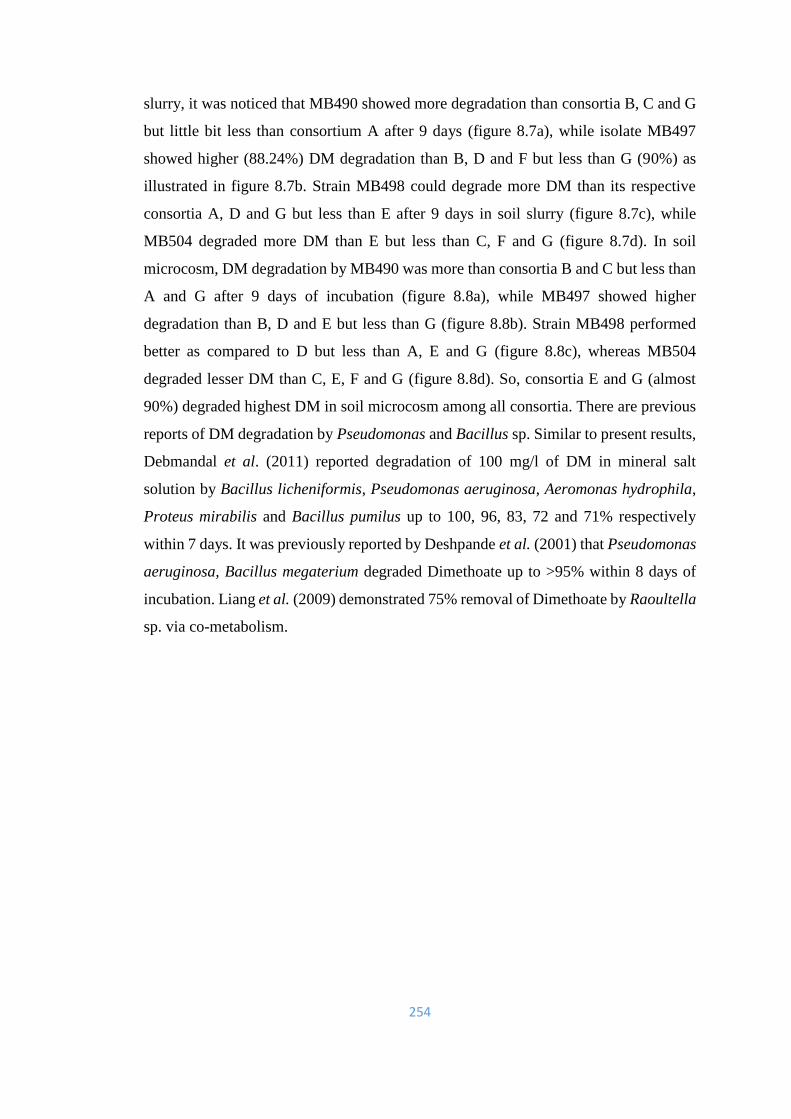
254
slurry, it was noticed that MB490 showed more degradation than consortia B, C and G
but little bit less than consortium A after 9 days (figure 8.7a), while isolate MB497
showed higher (88.24%) DM degradation than B, D and F but less than G (90%) as
illustrated in figure 8.7b. Strain MB498 could degrade more DM than its respective
consortia A, D and G but less than E after 9 days in soil slurry (figure 8.7c), while
MB504 degraded more DM than E but less than C, F and G (figure 8.7d). In soil
microcosm, DM degradation by MB490 was more than consortia B and C but less than
A and G after 9 days of incubation (figure 8.8a), while MB497 showed higher
degradation than B, D and E but less than G (figure 8.8b). Strain MB498 performed
better as compared to D but less than A, E and G (figure 8.8c), whereas MB504
degraded lesser DM than C, E, F and G (figure 8.8d). So, consortia E and G (almost
90%) degraded highest DM in soil microcosm among all consortia. There are previous
reports of DM degradation by Pseudomonas and Bacillus sp. Similar to present results,
Debmandal et al. (2011) reported degradation of 100 mg/l of DM in mineral salt
solution by Bacillus licheniformis, Pseudomonas aeruginosa, Aeromonas hydrophila,
Proteus mirabilis and Bacillus pumilus up to 100, 96, 83, 72 and 71% respectively
within 7 days. It was previously reported by Deshpande et al. (2001) that Pseudomonas
aeruginosa, Bacillus megaterium degraded Dimethoate up to >95% within 8 days of
incubation. Liang et al. (2009) demonstrated 75% removal of Dimethoate by Raoultella
sp. via co-metabolism.
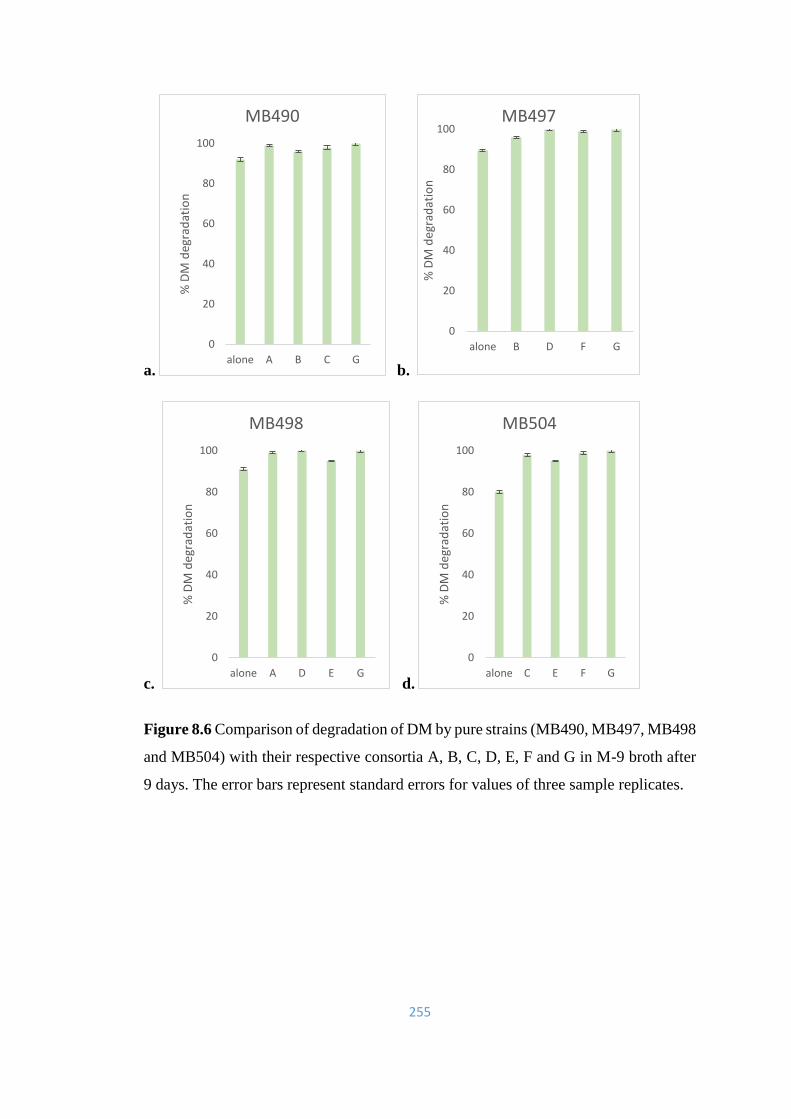
255
a. b.
c. d.
Figure 8.6 Comparison of degradation of DM by pure strains (MB490, MB497, MB498
and MB504) with their respective consortia A, B, C, D, E, F and G in M-9 broth after
9 days. The error bars represent standard errors for values of three sample replicates.
0
20
40
60
80
100
alone A B C G
% D
M d
egra
dat
ion
MB490
0
20
40
60
80
100
alone B D F G
% D
M d
egra
dat
ion
MB497
0
20
40
60
80
100
alone A D E G
% D
M d
egra
dat
ion
MB498
0
20
40
60
80
100
alone C E F G
% D
M d
egra
dat
ion
MB504
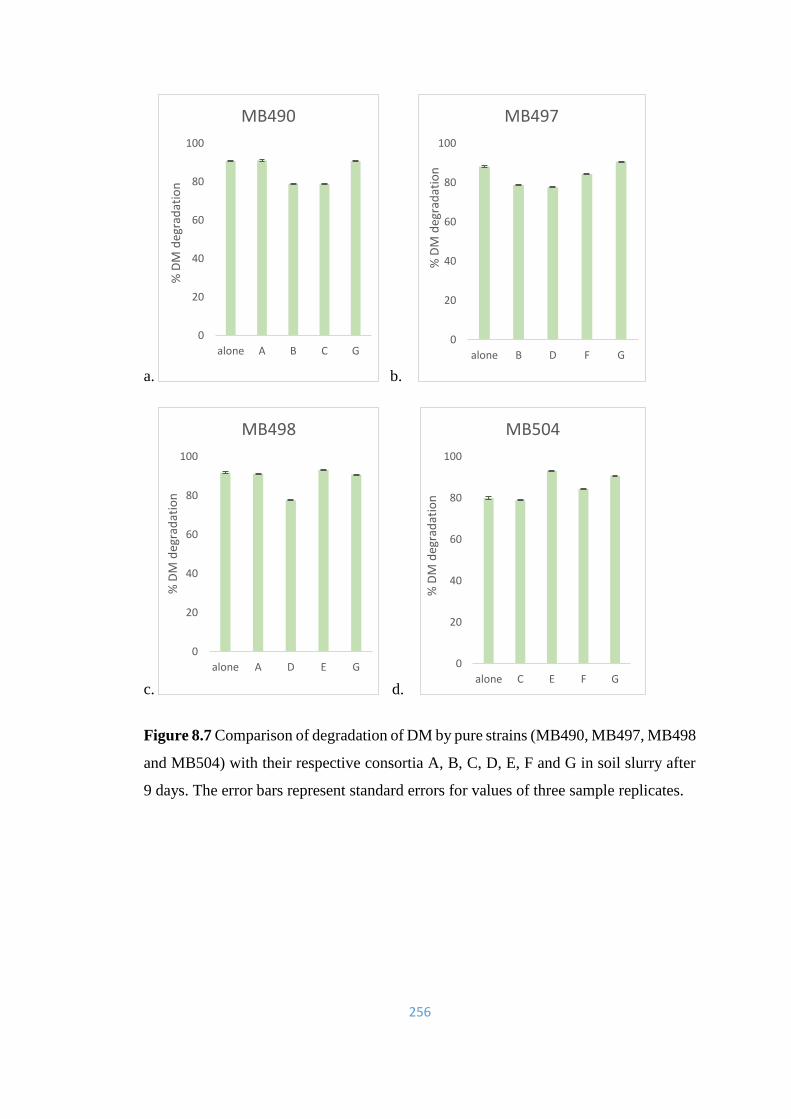
256
a. b.
c. d.
Figure 8.7 Comparison of degradation of DM by pure strains (MB490, MB497, MB498
and MB504) with their respective consortia A, B, C, D, E, F and G in soil slurry after
9 days. The error bars represent standard errors for values of three sample replicates.
0
20
40
60
80
100
alone A B C G
% D
M d
egra
dat
ion
MB490
0
20
40
60
80
100
alone B D F G
% D
M d
egra
dat
ion
MB497
0
20
40
60
80
100
alone A D E G
% D
M d
egra
dat
ion
MB498
0
20
40
60
80
100
alone C E F G
% D
M d
egra
dat
ion
MB504
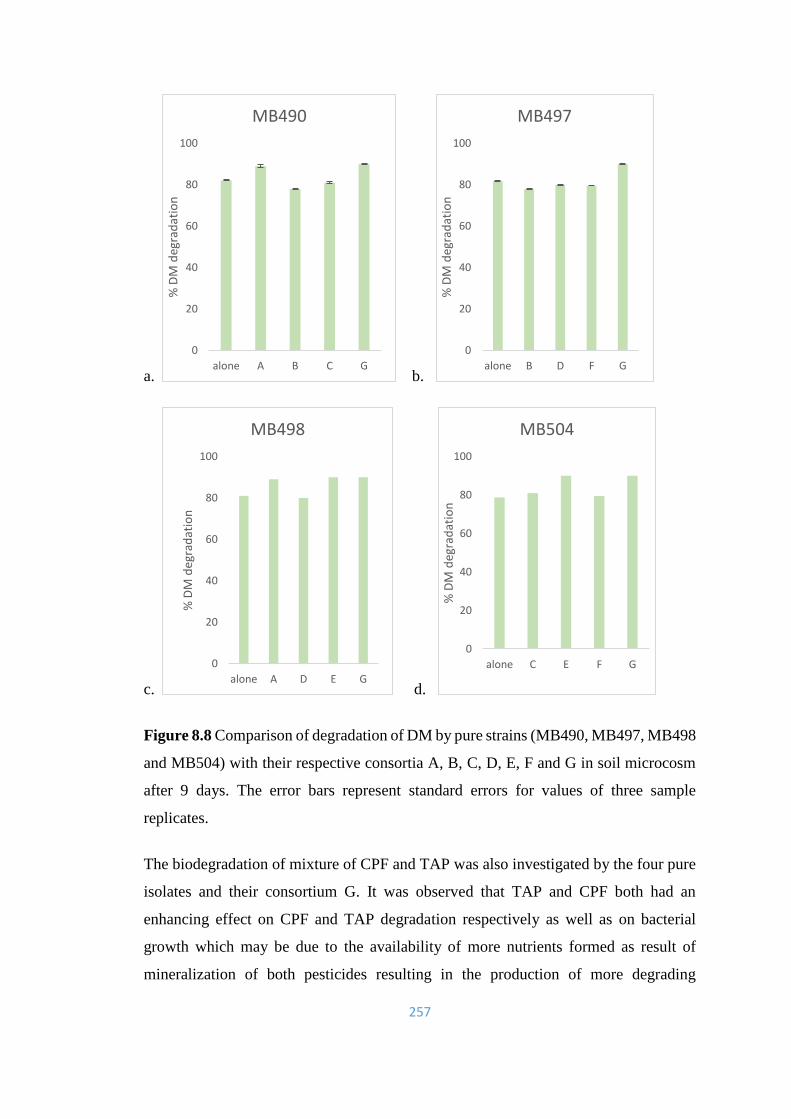
257
a. b.
c. d.
Figure 8.8 Comparison of degradation of DM by pure strains (MB490, MB497, MB498
and MB504) with their respective consortia A, B, C, D, E, F and G in soil microcosm
after 9 days. The error bars represent standard errors for values of three sample
replicates.
The biodegradation of mixture of CPF and TAP was also investigated by the four pure
isolates and their consortium G. It was observed that TAP and CPF both had an
enhancing effect on CPF and TAP degradation respectively as well as on bacterial
growth which may be due to the availability of more nutrients formed as result of
mineralization of both pesticides resulting in the production of more degrading
0
20
40
60
80
100
alone A B C G
% D
M d
egra
dat
ion
MB490
0
20
40
60
80
100
alone B D F G
% D
M d
egra
dat
ion
MB497
0
20
40
60
80
100
alone A D E G
% D
M d
egra
dat
ion
MB498
0
20
40
60
80
100
alone C E F G
% D
M d
egra
dat
ion
MB504
258
enzymes. It was reported by Deng et al. (2015) that a bacterial strain Stenotrophomonas
G1 had the ability to degrade 50 mg/l of multiple OP pesticides i.e methyl parathion,
methyl paraoxon, diazinon, and phoxim (100% each), parathion (95%), CPF (63%),
profenofos (38%) and triazophos (34%) within 24 hrs. This report is comparable to
current learning, where four bacterial strains MB490 (Pseudomonas kilonensis),
MB497 (Bacillus thuringiensis), MB498 (Pseudomonas kilonensis) and MB504
(Pseudomonas sp.) were capable of effectively degrading three given OP pesticides
(CPF, TAP and DM) separately as well as these strains degraded CPF and TAP in a
mixture very efficiently.
In current investigation, there was only 11.7 and 45.5% CPF degradation, 10 and 28%
TAP degradation, 12 and 20% DM degradation in non-inoculated sterile and non-
sterilized soil after 9 days of incubation, thus suggesting a strong role of bacterial
isolates MB490, MB497, MB498 and MB504 in CPF, TAP and DM biodegradation in
soil. So, the data obtained in the current investigation about the existence of
autochthonous bacterial communities bestowed with a natural remediation capability,
which can be utilized to develop site-specific tactics to achieve natural reduction of
pollution in soil and water resources as well as a potential application of selective
identified bacterial strains for the purpose of bioremediation.
GCMS analysis of the samples treated with bacterial isolates MB490, MB497, MB498
and MB504 and their consortia separately in all given media (M-9 broth, soil slurry and
soil microcosm) treated with CPF indicated the formation of 2-Hydroxy-3, 5, 6-
trichloropyridine (TCP), Diethyl thiophosphate (DETP) and phosphorothioic acid
in all bacterial samples. While two metabolites were novel and detected first time. [(3,
5, 6-trichloro-2-pyridinyl) oxy] acetic acid was noted specifically in samples with
MB490 and Diisopropyl methanephosphonate was detected in samples of MB497,
MB498 and MB504. TCP, DETP and phosphorothioic acid have been stated in many
previous reports (Reddy et al., 2012; Jabeen et al., 2015; Khalid et al., 2016; Rayu et
al., 2017).
It is important to be noted here that 3, 5, 6 Trichloropyridinol production during CPF
biodegradation was also verified by HPLC analysis. During GCMS analysis, retention
259
time (RT) for CPF and TCP standard was determined to be 22 and12.8 min respectively,
while by HPLC analysis it was determined to be 5.4 and 1.77 min respectively.
Another important feature of the present study is that the bacterial isolates (MB490,
MB497, MB498 and MB504) were capable of metabolizing and mineralizing TCP
(main metabolite of CPF) added externally in M-9 broth as analyzed by GCMS. All the
four isolates formed four metabolites (1-methyl-2-pyrrolidine ethanol, p-Propyl
phenol, 2-Ethoxy-4, 4, 5, 5-tetramethyloxazoline and 3-(2, 4, 5-Trichlorophenoxy)-
1-propyne), based on NIST library identification after 24, 48 and 72 hrs of incubation
as shown in in Table 4.4. Metabolic pathways for TCP and CPF and have been proposed
in the current study and represented in the figures 4.47 & 4.48 respectively.
During GCMS and HPLC analysis, retention time (RT) for TAP standard was
determined to be 27.8 min and 2.4 min respectively. The GCMS analysis of TAP
supplemented bacterial samples after 3, 6 and 9 days of incubation in given media
indicated the following 7 metabolites of TAP, which are very novel and have not been
reported elsewhere before current study:
1. 1, 2, 4-Triazole-4—amine, N-(2-Thienylmethyl).
2. 4-Benzyl-4, 5-dihydroisoxazole.
3. Benzene sulfonic acid, methyl ester.
4. 4H-1, 2, 4-Triazole-4-benzenesulfonamide.
5. 4, 5 dihydro-N-(O-toyl)-3-furamide.
6. Ethyl 4-phenyldiazenylbenzoate.
7. Dibutyl methanephosphonate.
So all the four bacterial strains MB490 (Pseudomonas kilonensis), MB497 (Bacillus
thuringiensis), MB498 (Pseudomonas kilonensis) and MB504 (Pseudomonas sp.) in
the current study have been proved to be very promising towards degradation and
metabolization of TAP and can be considered as suitable for practical remediation of
TAP contaminated agricultural soils and other resources. Ishag et al. (2016) have
demonstrated that initial 400 mg/l of CPF, malathion and DM were removed up to >87,
>80 and 76% respectively from the mineral media by consortium of three bacterial
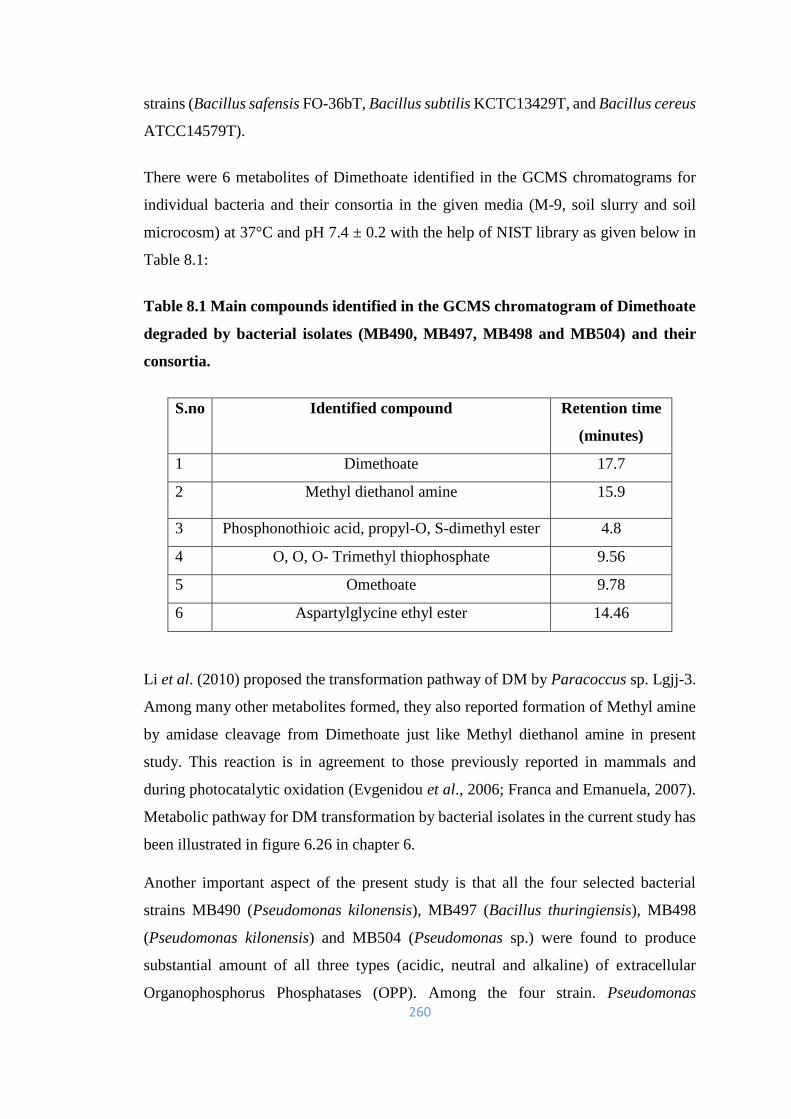
260
strains (Bacillus safensis FO-36bT, Bacillus subtilis KCTC13429T, and Bacillus cereus
ATCC14579T).
There were 6 metabolites of Dimethoate identified in the GCMS chromatograms for
individual bacteria and their consortia in the given media (M-9, soil slurry and soil
microcosm) at 37°C and pH 7.4 ± 0.2 with the help of NIST library as given below in
Table 8.1:
Table 8.1 Main compounds identified in the GCMS chromatogram of Dimethoate
degraded by bacterial isolates (MB490, MB497, MB498 and MB504) and their
consortia.
S.no Identified compound Retention time
(minutes)
1 Dimethoate 17.7
2 Methyl diethanol amine 15.9
3 Phosphonothioic acid, propyl-O, S-dimethyl ester 4.8
4 O, O, O- Trimethyl thiophosphate 9.56
5 Omethoate 9.78
6 Aspartylglycine ethyl ester 14.46
Li et al. (2010) proposed the transformation pathway of DM by Paracoccus sp. Lgjj-3.
Among many other metabolites formed, they also reported formation of Methyl amine
by amidase cleavage from Dimethoate just like Methyl diethanol amine in present
study. This reaction is in agreement to those previously reported in mammals and
during photocatalytic oxidation (Evgenidou et al., 2006; Franca and Emanuela, 2007).
Metabolic pathway for DM transformation by bacterial isolates in the current study has
been illustrated in figure 6.26 in chapter 6.
Another important aspect of the present study is that all the four selected bacterial
strains MB490 (Pseudomonas kilonensis), MB497 (Bacillus thuringiensis), MB498
(Pseudomonas kilonensis) and MB504 (Pseudomonas sp.) were found to produce
substantial amount of all three types (acidic, neutral and alkaline) of extracellular
Organophosphorus Phosphatases (OPP). Among the four strain. Pseudomonas

261
kilonensis MB490 was observed to produce maximum amount of neutral OPP. While,
Bacillus thuringiensis MB497 displayed highest production of alkaline OPP,
Pseudomonas sp. MB504 showed highest production of acidic OPP, whereas
Pseudomonas kilonensis MB498 was found to produce significant amount of both
acidic and alkaline phosphatases. On the whole, acidic and alkaline OPP production
was greater than neutral OPP.
There had been previous findings of extracellular alkaline phosphatase production in
various microbes like Pyrococus abyssi, Streptomyces griseus, Bacillus subtilis
KIBGE-HAS (Zappa et al., 2001; Moura et al., 2001; Shah et al., 2008). Bacterial
extracellular alkaline phosphatase production is induced under low phosphate
availability thus indicating its involvement in phosphate breakdown (Combs Jr. et al.,
1979). Phosphatases are considered as subclass of Organophosphorus hydrolases due
to similarity of mechanism of hydrolytic action to breakdown organophosphates
(Gandhi and Chandra. 2012).
Moreover, phosphatase activity is considered to comprise of activities of
phosphodiesterase (PDE) and phosphomonoesterase (PME) which are two
corresponding though discrete enzymes. PDE is responsible for the hydrolysis of
intricate P containing organic compounds like nucleic acids and phospholipids to form
phosphomonoesters such as inositol phosphates and mononucleotides, which are then
decomposed by PME into orthophosphate to make them available for direct uptake by
plants and microbes (Rejmankova et al., 2011; Stone and Plante, 2014).
In the current findings, OPP production was maximum at pH 11 by all isolates. Gothwal
(2014) reported that OPH extracted from Brevundimonas diminuta was optimized at
pH 7.5, while for OPH NL01 isolated from Pseudomonas aeruginosa NL01, optimum
pH was reported to be at pH 8 (Najavand et al., 2012), and for His6-OPH extracted
from E. coli, it was found to be at pH 10.5 (Votchitseva et al., 2006).
Among four strains, Pseudomonas sp. MB504 was noticed for significant production
of OPP at wide pH range of pH 6 to 11 and at 45°C, while Pseudomonas kilonensis
MB490, Bacillus thuringiensis MB497, Pseudomonas kilonensis MB498 showed
noteworthy OPP production even at 50°C. Enzyme production was minimum by all
strains at 37°C, thus indicating that enzyme producing gene was highly expressed under
262
stress conditions of high pH and high temperature. Generally, the OPP (acidic, neutral
and alkaline) production was decreased by all isolates after 48 hrs of incubation.
As far as OPP enzyme activity and stability is concerned, it was significant over a wide
range of temperatures (37, 45, 50, 60 and 70⁰C), though it was maximum at 37⁰C and
remained still active even at highest temperature of 70⁰C by all isolates. Likewise,
generally the activity for acidic OPP was increased at lower substrate (p-NPP)
concentrations (0.06-0.6%), while for neutral and alkaline OPP it was enhanced at
higher (0.8-1.1%) substrate concentrations. Shah et al. (2008) reported an increase in
the alkaline phosphatase activity when the substrate concentration was increased up to
20 mM. Alkaline phosphatase (EC 3.1.3.1) exhibits optimal activity at alkaline pH and
is related with non-specific phosphomonoesterase activity hydrolyzing the
phosphomonoester to give inorganic phosphate and corresponding alcohol (Boulanger
and Kantrowitz, 2003). Alkaline phosphatase has been used as a vital tool in molecular
cloning and DNA sequencing and ELISA base kits (Shah et al., 2008).
In general, acidic neutral and alkaline OPP activity in all isolates was observed to be
increased with increase in incubation time up to 90 min of incubation. It is known that
phosphatase activity is affected by SDS (Rotenberg and Brautigan, 1987). Mostly,
enzyme activities are inhibited by SDS (Husberg et al., 2012). But in present study,
very diverse effects of SDS were observed on acidic, neutral and alkaline OPP derived
from four isolates. Acidic and neutral, alkaline OPP activity in MB490 and MB504 was
inhibited or remained unaffected by SDS at all given concentrations up to 300 µl, while
activity was enhanced or remained unaffected in most of the isolates at lower
concentrations. Generally, activity of acidic, neutral and alkaline OPP derived from all
isolates was inhibited by EDTA particularly at higher concentrations. Wojciechowski
et al. (2002) reported inhibitory effect of 0.1 mM EDTA on the activity of alkaline
phosphatase extracted from hyperthermophilic bacterium Thermotoga maritima.
Similarly activity of alkaline phosphatase from Saccharomyces cerevisiae was
inhibited by 5 mM of EDTA and 1 mM of vanadate (Fernandes et al., 2008).
It was noticed that divalent metal ions (Zn++, Cu++ and Cd++) increased the activity of
acidic, neutral and alkaline OPP derived from all isolates. Zinc (Zn) is known to be the
most commonly needed metal ion for alkaline phosphatase activity (Cho et al., 2007).
The activity of alkaline phosphatase derived from a hyperthermophilic archaeon
263
Pyrococcus abyssi was reported to be enhanced by the addition of Zn, Mg and Co
(Zappa et al., 2001).
There are international environmental rules and regulations to decrease the
concentration of heavy metals in the industrial effluents to acceptable levels before their
discharging into soil and water bodies. The precipitation of heavy metals mediated by
enzymes is an innovative and eco‐friendly technique for removal of deadly heavy
metals from different industrial wastes including dye, tannery, and electroplating
industries. Recently, phosphatase‐mediated bioremediation of toxic heavy metals has
been proved to play a very promising role in the treatment of municipal, industrial, and
nuclear wastewater (Chaudhuri et al., 2017). Phosphatase being a hydrolase enzyme, is
considered to have a very vital contribution in the phosphate breakdown of living
organisms through hydrolysis of organic phosphates and polyphosphates (Pasqualini et
al., 1992). So, in the current findings, all three types (acidic, neutral and alkaline) of
OPP showed their ability to bioprecipitate selected metals (Ni, Mn, Cr and Cd) up to
86-90%. Alkaline phosphatases are nonspecific reacting with a diverse types (both
natural and synthetic) of substrates and have been found in various organisms from
bacteria to higher mammals. They are capable of effectively hydrolyzing numerous
mono‐ and diesters (Chaudhuri et al., 2017). Kulkarni et al. (2016) revealed uranium
bio-immobilization by extracellular alkaline phosphatase. Alkaline phosphatase
extracted from Escherichia coli and calf‐intestine was reported to enhance
bioprecipitation of Cd2+, Ni 2+, Co 2+, Cr 3+ and Cr6+ from both single‐ion metal solutions
and industrial effluents (Chaudhuri et al., 2017). Martinez et al. (2007) reported 73-
95% precipitation of uranium by the intracellular phosphatase extracted from
Arthrobacter, Bacillus and Rahnella.
The acidic and alkaline OPP derived from all four isolates were proved to have a
broader substrate specificity against three OP pesticides (CPF, TAP and DM). Among
the two types, acidic OPP exhibited 40 to 80% degradation of CPF, TAP and DM at 50
mg/l substrate concentration within 30 min of reaction time, while alkaline OPP was
observed more active with 80 to 99% degradation. Enzymatic degradation of given
pesticides was also confirmed by GCMS analyses with the detection of same respective
metabolites of CPF, TAP and DM as discussed in previous chapters (4, 5 and 6).
264
Present results are in agreement with that reported by Thengodkar and Sivakami (2010)
where 80% of CPF was degraded by alkaline phosphatase extracted from
cyanobacterium Spirulina platensis within one hour of incubation along with detection
of TCP as metabolite. Zhang et al. (2014) studied the degradation of five OPs
(Chlorpyrifos, diazinon, fenitrothion, malathion and methyl parathion) by phosphatase
enzyme produced by ten strains of lactic acid bacteria (LAB) and reported that
phosphatase production by the isolated strains was the main factor involved for the
rapid degradation of OPs. Gothwal (2014) isolated OPH from Brevundimonas
diminuta, which was found very active against methyl parathion. Earlier, phosphatase
extracted from fungal strains (Aspergillus flavus, A. fumigatus, A. niger, A. sydowii, A.
terreus, Emericella nidulans, Fusarium oxysporum and Penicillium chrysogenum) was
reported to effectively degrade three OPs pyrazophos, lancer and malathion (Hasan,
1999). Islam et al. (2010) revealed that organophosphorus hydrolase (OpdB) extracted
from Lactobacillus brevis WCP902 effectively degraded chlorpyrifos, coumaphos,
diazinon, methylparathion, and parathion.
Zhang et al. (2016) reported the expression of a cloned gene for Triazophos hydrolase
from Burkholderia sp. SZL-1 which was found very active against TAP degradation.
Kumar (1996) revealed that microbial degradation of dimethoate depends upon
esterases and phosphatases. Megeed and El-Nakieb (2008) suggested degradation of
Dimethoate by phosphotriestrase.
Conclusion
The current research study revealed the microbial diversity of the agricultural soils of
Pakistan. Selected indigenous bacterial strains (Pseudomonas kilonensis MB490,
Bacillus thuringiensis MB497, Pseudomonas kilonensis MB498 and Pseudomonas sp.
MB504) were able to tolerate high concentrations of OP pesticides (CPF, TAP and
DM), heavy metals (Pb, Ni, Cu, Zn, Mn, Cr, Fe), and organic pollutants (Benzene,
toluene, Xylene, Naphthalene, biphenyl).
These strains were capable of effectively degrading Chlorpyrifos, Triazophos and
Dimethoate under a wide range of pH (6, 7, 8), temperature (25, 30, 37°C) and other
incubation conditions. Moreover, another distinctive and rare feature of these strains
was their capability to tolerate and transform highly recalcitrant metabolite of

265
Chlorpyrifos, namely 3, 5, 6-Trichloropyridinol. GCMS analyses confirmed the
biotransformation of three given pesticides by the detection of many unique and novel
metabolites along with known byproducts.
In addition to have nitro reductase, oxygenase and peroxidase, all the selected strains
were found to produce significant amount of acidic, neutral and alkaline
organophosphorus phosphatase (OPP) enzyme which showed stability and activity
under a broad range of pH, temperature and metal ions. This OPP enzyme showed great
capability for metal bioprecipitation and a diverse substrate specificity against the three
OP pesticides (CPF, TAP and DM). On the basis of all these facts, the four indigenous
bacterial isolates can be suggested as very strong candidates for the practical application
to bioremediate OP pesticide contaminated agricultural soils of Pakistan under local
climatic conditions for which these are better adopted.
Future Perspective
The four selected strains in the current study possibly possess genes encoding
phosphatase and other enzymes needed for degradation of OP pesticides. Further
studies are required to explore these OP degrading genes involved in the regulation of
concerned enzymes vital for OP biodegradation like OPPs, Oxidases, Nitro reductase,
Amidase etc. in the given strains through gene based sequencing which could not be
achieved in the present study due to limitation of time and funds. This would lead to
genetic basis of biodegradation. Genes once traced could be used to improve OP
degrading potential of other bacteria which are currently non-degrading or less-
degrading through genetic transformation. Furthermore, detailed open field studies of
present bacterial strains must be conducted to evaluate their practical application under
open natural field conditions.
266
References
Abdurruhman, A., Abdelbagi, A. and Ahmed, A. (2015). Biodegradation of pendimethalin and
atrazine by Pseudomonas pickettii isolated from pesticides polluted soil under
laboratory conditions. J. Biotechnol. Sci. Res., 2(3): 94-102.
Abhilash, P. C., Singh, N. (2009). Pesticide use and application: An Indian scenario. J. Haz.
Mat., 165: 1–12. 10.1016/j.jhazmat.2008.10.061.
Abraham, J. and Silambarasan, S. (2013). Biodegradation of chlorpyrifos and its hydrolyzing
metabolite 3, 5, 6-trichloro-2-pyridinol by Sphingobacterium sp. JAS3. Process
Biochem., 48(10): 1559-1564.
Abraham, J., Silambarasan, S. and Logeswari, P. (2014). Simultaneous degradation of
organophosphorus and organochlorine pesticides by bacterial consortium. J. Taiwan
Inst. Chem. Eng., 45(5): 2590-2596. https://doi.org/10.1016/j.jtice.2014.06.014.
Aceves-Diez, A. E., Estrada-Castañeda, K. J. and Castaneda-Sandoval, L. M. (2015). Use of
Bacillus thuringiensis supernatant from a fermentation process to improve
bioremediation of chlorpyrifos in contaminated soils. J. Environ. Manage., 157: 213-
219.
Adams, G. O., Fufeyin, P. T., Okoro, S. E. and Ehinomen, I. (2015). Bioremediation,
biostimulation and bioaugmention: a review. Inter. J. Environ. Bioremed. Biodegrad.,
3(1), 28-39.
Adamson, R. H. (2016). The acute lethal dose 50 (LD50) of caffeine in albino rats. Regul.
Toxicol. Pharmacol., 80: 274-276.
Ajaz, M., Jabeen, N., Akhtar, S. and Rasool, S. A. (2005). Chlorpyrifos resistant bacteria from
pakistani soils: isolation, identification, resistance profile and growth kinetics. Pak. J.
Bot., 37(2): 381-388.
Ajaz, M., Rasool, S. A., Sherwani, S. K. and Ali, T. A. (2012). High profile chlorpyrifos
degrading Pseudomonas putida MAS-1 from indigenous soil: Gas chromatographic
analysis and molecular characterization. Int. J. Basic Med. Sci. Pharm., 2(2): 58–61.
Akbar, S., Sultan, S. (2016). Soil bacteria showing a potential of chlorpyrifos degradation and
plant growth enhancement. Braz. J. Microbiol., 47(3): 563–570.
Alamdar, A., Syed, J. H., Malik, R. N., Katsoyiannis, A., Liu, J., Li, J. and Jones, K. C. (2014).
Organochlorine pesticides in surface soils from obsolete pesticide dumping ground in
Hyderabad City, Pakistan: contamination levels and their potential for air–soil
exchange. Sci. Total environ., 470: 733-741.
Alexis, J. H., Li, C. and Ian, C. S. (2001). Thermal stability of organophosphorus pesticide
triazophos and its relevance in the assessment of risk to the consumer of triazophos
residues in food. J. Agric. Food Chem., 49: 103–106.
Alnuaimi, M. M., Saeed, I. A. and Ashraf, S. S. (2012). Effect of various heavy metals on the
enzymatic activity of E. coli alkaline phosphatase. Int. J. Biotechnol. Biochem., 8: 47-
59.
Alvarenga, N., Birolli, W. G., Nitschke, M., de O Rezende, M. O., Seleghim, M. H. R. and
Porto, A. L. M. (2015). Biodegradation of chlorpyrifos by whole cells of marine-
derived fungi Aspergillus sydowii and Trichoderma sp. J. Microb. Biochem. Technol.,
7: 133-139. doi: 10.4172/1948-5948.1000194.
267
Ambrosini, R., Ferrario, C., Pittino, F., Tagliaferri, I., Gandolfi, I., Bestetti, G. and Villa, S.
(2017). Microbial degradation on glacier surface is the missing piece of environmental
fate of pesticides in cold areas. In: EGU General Assembly Conference Abstracts.
Geophysical Research Abstracts., 19: pp. 6142.
Amitai, G., Adani R., Sod-Moriah G., Rabinovitz I., Vincze A., Leader H., Chefetz B.,
Leiovitz-Persky L., Friesem D. and Hadar Y. (1998). Oxidative biodegradation of
phosphorothiolates by fungal laccase. FEBS. Lett.. 438(3): 195–200.
Amlabu, E., Nok, A. J., Sallau, A. B. (2009). Purification and biochemical characterization of
lysosomal acid phosphatases (E.C. 3.1.3.2) from blood stream forms, Trypanosome
brucei. Parasitol. Int., 58:238-242.
Andreozzi, R., Ialongo, G., Marotta, R., Sanchirico, R., (1999). The thermal decomposition of
dimethoate. J. Hazard. Mater., 64: 283-294.
Anwar, S., Liaquat, F., Khan, Q. M., Khalid, Z. M. and Iqbal, S. (2009). Biodegradation of
chlorpyrifos and its hydrolysis product 3, 5, 6-trichloro-2-pyridinol by Bacillus pumilus
strain C2A1. J. Hazard Mater., 168(1): 400-405.
Anwar, T., Ahmad, I. and Tahir, S. (2011). Determination of pesticide residues in fruits of
Nawabshah district, Sindh, Pakistan. Pak. J. Bot., 43(2): 1133-1139.
Anwar, T., Ahmad, I. and Tahir, S. (2012). Determination of pesticide residues in soil of
Nawabshah district, Sindh, Pakistan. Pakistan J. Zool., 44(1): 87-93.
Anyusheva, M., Lamers, M., La, N., Nguyen, V. V. and Streck, T. (2016). Persistence and
leaching of two pesticides in a paddy soil in northern Vietnam. Clean–S. A. W., 44(7):
858-866.
Appukuttan, D., Rao, A. S. and Apte, S. K. (2006). Engineering of Deinococcus radiodurans
R1 for bioprecipitation of uranium from dilute nuclear waste. Appl. Environ.
Microbiol., 72: 7873-7878.
Armbrust, K. L. (2001). Chlorothalonil and chlorpyrifos degradation products in golf course
leachate. Pest Manag Sci., 57(9): 797–802,
Aslanturk, O. S. and Çelik, T. A. (2016). Protective effect of lycopene against cytotoxic and
genotoxic effects induced by mixture of two pesticides (dimethoate and lambda-
cyhalothrin) on human peripheral blood lymphocytes. Caryologia., 69(1): 20-28.
Aungpradit, T., Sutthivaiyakit, P., Martens, D., Sutthivaiyakit, S. and Kettrup, A. A. F. (2007).
Photocatalytic degradation of triazophos in aqueous titanium dioxide suspension:
identification of intermediates and degradation pathways. J. Hazard. Mater., 146(1):
204–213.
Awad, N.S., Sabit, H. H., Salah E. M., Abo-Aba, S. E. M. and Bayoumi, R. A. (2011). Isolation,
characterization and fingerprinting of some chlorpyrifos-degrading bacterial strains
isolated from Egyptian pesticides-polluted soils. Afr. J. Microbiol. Res., 5(18): 2855-
2862. DOI: 10.5897/AJMR11.044.
Baba, O. K., Darzi, M. M., Mir, M. S., Kamil, S. A., Khan, H. M. and Shafi, M. (2015).
Pathology of dimethoate induced acute toxicity in rabbits. Indian J. Vet. Pathol., 39(3):
272-276.
268
Bagyalakshmi, J., Kavitha, G. and Ravi, T. K. (2011). Residue determination of dimethoate in
leafy vegetables (spinach) using RP-HPLC. Inter. J. Pharm. Sci. Res., 2(2): 62-64.
Bajeer, M, A., Mallah, M. A., Sherazi, S. T. H., Bhanger, M. I. and Nizamani, S. M. (2015).
Investigation of dissipation, adsorption, degradation, and leaching of triazophos
pesticide in various soils. Polycycl. Aromat. Comp., 36(3): 229-241.
http://dx.doi.org/10.1080/10406638.2014.964424.
Baker, A. S., Ciocci, M. J., Metcaf, W. W., Kim, J., Bobbitt, P. C., Wanner, B. L., Martin, B.
M. and Dunaway-Mariano, D. (1998). Insight into the mechanism of catalysis by the
P-C bond-cleaving enzyme phosphonoacetaldehyde hydrolase derived gene sequence
analysis and mutagenesis. Biochem., 37(26): 9305–9315
Barathidasan, K., Reetha, D., Milton, D. J., Sriram, D. and Govindammal, M. (2014).
Biodegradation of chlorpyrifos by co-culture of Cellulomonas fimi and Phanerochaete
chrysosporium. Afr. J. Microbiol. Res., 8(9): 961-966. DOI: 10.5897/AJMR2013.6530.
Barik, S., Munnecke, D. M., Flecher, J. S. (1984). Bacterial degradation of three dithio
pesticides. Agric. Wastes., 10(2): 81-94
Barton, J. W., Kuritz, T., O’Connor, L. E., Ma, C. Y., Maskarinec, M. P. and Davison, B. H.
(2004) Reductive transformation of methyl parathion by the cyanobacterium Anabaena
sp. strain PCC7120. Appl. Microbiol. Biotechnol., 65(3):330–335. doi:
10.1007/s00253-004-1557-y
Baskaran, S., Kookana, R. S., Naidu, R., (2003). Contrasting behaviour of chlorpyrifos and its
primary metabolite, TCP (3, 5, 6-trichloro-2-pyridinol), with depth in soil profiles. Aust.
J. Soil Res., 41(4): 749-760.
Begum, S. M., Rajesh, G. and Narendran, R. R. (2016). Isolation, characterization and
identification of dimethoate degrading bacteria from soil series of Tamil Nadu. Int. J.
Adv. Sci. Tech. Res., 3: 220-230.
Begum, S. S., and Aundhati, A. (2016). Heavy metals tolerance and in vitro bioremediation
potential in Pseudomonas sp r2. Int. J. Pharm. Chem. Biol. Sci., 6(2).
Behera, B. C., Yadav, H., Singh, S. K., Bijay Kumar Sethi, B. K., Rashmi Ranjan Mishra, R.
R., Kumari, S., Thatoi. H. (2017). Alkaline phosphatase activity of a phosphate
solubilizing Alcaligenes faecalis, isolated from Mangrove soil. Biotechnol. Res. Innov.,
1(1):101-113. http://dx.doi.org/10.1016/j.biori.2017.01.003.
Benbrook, C. M. (2016). Trends in glyphosate herbicide use in the United States and globally.
Environ. Sci. Eur., 28(3). https://doi.org/10.1186/s12302-016-0070-0.
Benimeli, C. S., Amoroso, M. J., Chaile, A. P. and Castro, G. R. (2003). Isolation of four
aquatic streptomycetes strains capable of growth on organochlorine pesticides.
Bioresource Technol., 89(2): 133-138.
Benimeli, C. S., Fuentes, M. S., Abate, C. M., Amoroso, M. J. (2008). Bioremediation of
lindane-contaminated soil by Streptomyces sp. M7 and its effects on Zea mays growth.
Int. Biodeter. Biodegr., 61(3): 233-239.

269
Benton, T. G., Solan, M., Travis, J. M. J. and Sait, S. M. (2007). Microcosm experiments can
inform global ecological problems. Trends Ecol. Evol., 22(10): 516–521.
Bhagobaty, R. K. and Malik, A. (2008). Utilization of chlorpyrifos as a sole source of carbon
by bacteria isolated from wastewater irrigated agricultural soils in an industrial area of
western Uttar Pradesh, India. Res. J. Microbiol., 3(5): 293-307. DOI:
10.3923/jm.2008.293.307
Bhamore, J. R., Ganguly, P. and Kailasa, S. K. (2016). Molecular assembly of 3-
mercaptopropinonic acid and guanidine acetic acid on silver nanoparticles for selective
colorimetric detection of triazophos in water and food samples. Sens. Actuators B
Chem., 233: 486-495.
Bigley, A. N. and Raushel, F. M. (2013). Catalytic mechanisms for phosphotriesterases.
Biochim. Biophys. Acta (Proteins and Proteomics)., 1834(1): 443-453.
Bishnoi, K., Sain, U., Kumar, R., Singh, R., Bishnoi, N. R. (2009). Distribution and
biodegradation of polycyclic aromatic hydrocarbons in contaminated sites of Hisar
(India). Indian. J. Exp. Biol., 47(3): 210-217.
Bock, K. D., Bock, R., Fischer, H. (1975). Triazophos (active substance in the sales product
Hostathion) environmental impact (degradation on/ in plants, in soil and in warm-
blooded animals). J. Environ. Qual. Safe Suppl., 3: 833-839.
Bouchard, M. F., Bellinger, D. C., Wright, R. O. and Weisskopf, M. G. (2010). Attention
deficit/ hyperactivity disorder and urinary metabolites of organophosphate pesticides.
Pediatrics., 125(6): 1216-1226.
Boulanger, R. R. and Kantrowitz, E. R. (2003). Characterization of a monomeric Escherichia
coli alkaline phosphatase formed upon a single amino acid substitution. J. Biol. Chem.,
278(26): 23497-23501.
Brzak, K. A., Harms, D. W., Bartels, M. J. and Nolan, R. J. (1998). Determination of
chlorpyrifos, chlorpyrifos oxon, and 3, 5, 6-trichloro-2-pyridinol in rat and human
blood. J. Anal. Toxicol., 22(3): 203-210.
Briceno, G., Fuentes, M. S., Palma, G., Jorquera, M. A., Amoroso, M. J. and, M. C. (2012).
Chlorpyrifos biodegradation and 3, 5, 6-trichloro-2-pyridinol production by
actinobacteria isolated from soil. Int. Biodeter. Biodegrad., 73: 1-7.
Bryan, L.W. and Keith W. (1994). General principles of biochemical investigation. In:
Principles and techniques of practical biochemistry. Wilson, K. and Walker, J. (eds.).
Cambridge University Press; Cambridge, 2nd edition, pp.586.
Burns, R. G. (1982). Enzyme activity in soil: location and a possible role in microbial ecology.
Soil Biol. Biochem., 14(5): 423-427. doi: 10.1016/0038-0717(82)90099-2.
Caceres, T., He, W., Naidu, R. and M. Megharaj. (2007). Toxicity of chlorpyrifos and TCP
alone and in combination to Daphnia carinata: the influence of microbial degradation
in natural water. Water Res., 41(19): 4497–4503,
Cao, L., Liu, H., Zhang, H., Huang, K., Gu, T., Ni, H., Hong, Q. and Li, S. (2012).
Characterization of a Newly Isolated Highly Effective 3, 5, 6-Trichloro-2-pyridinol
270
Degrading Strain Cupriavidus pauculus P2. Curr. Microbiol., 65:231–236. DOI
10.1007/s00284-012-0150-3
Carr, R. L., Chambers, H. W., Guarisco, J. A., Richardson, J. R., Tang, J. and Chambers, J. E.
(2001). Effects of repeated oral postnatal exposure to chlorpyrifos on open-field
behavior in juvenile rats. Toxicol. Sci., 59: 260-267.
Castro-Silva M. A., Lima A. O. S., Gerchenski A. V., Jaques D. B., Rodrigues A. L., Lima de
Souza, L. D. P. and Rorig L. R. (2003). Heavy metal resistance of microorganisms
isolated from coal mining environments of Santa Catarina. Braz. J. Microbiol., 34(1):
45–47.
Chambers, H. W., Boone, J. S., Carr, R. L. and Chambers, J. E. (2001). Chemistry of
organophosphorus insecticides. In: Krieger R (ed). Handbook of Pesticide Toxicology,
2nd edn. Academic Press, San Diego. pp. 913–917.
Chaudhry, G. R., Ali, A. N. and Wheeler, W. B. (1988). Isolation of a methyl parathion-
degrading Pseudomonas sp. that possesses DNA homologous to the Opd gene from
a Flavobacterium sp. Appl. Environ. Microbiol., 54: 288-293.
Chaudhuri, G. 1., Shah, G. A., Dey, P. S. G., Venu-Babu, P., Thilagaraj, W. R. (2013).
Enzymatically mediated bioprecipitation of heavy metals from industrial wastes and
single ion solutions by mammalian alkaline phosphatase. J. Environ. Sci. Health. A.
48(1): 79-85. doi: 10.1080/10934529.2012.707851.
Chaudhuri, G., Chatterjee, S., Venu-Babu, P., Ramasamy, K. and Thilagaraj, W. R. (2013).
Kinetic behaviour of calf intestinal alkaline phosphatase with pNPP. Indian J. Biochem.
Biophys., 50(1):64-71.
Chaudhuri, G., Selvaraj, U., Venu Babu, V. and Richard W. Thilagaraj, R. W. (2017). Recent
trends in phosphatase-mediated bioremediation. Chapter 2. In: Phosphoric Acid
Industry - Problems and Solutions. Schorr , M. and Valdez, B (ed.)., ISBN 978-953-
51-3354-4, Print ISBN 978-953-51-3353-7. DOI: 10.5772/intechopen.68658.
Chen, Q., Chen, K., Ni, H., Zhuang, W., Wang, H., Zhu, J. and He, J. (2016). A novel
amidohydrolase (DmhA) from Sphingomonas sp. that can hydrolyze the
organophosphorus pesticide dimethoate to dimethoate carboxylic acid and
methylamine. Biotechnol. lett., 38(4): 703-710.
Chen, Q., Sun, L. N., Zhang, X. X., He, J., Kwon, S. W., Zhang, J. and Gu, J. G. (2014).
Roseomonas rhizosphaerae sp. nov., a triazophos-degrading bacterium isolated from
soil. Int. J. Syst. Evol. Microbiol., 64(4): 1127-1133.
Chen, S. H., Hu, M. Y., Liu, J. J., Zhong, G. H. and Yang, L. (2011) Biodegradation of beta-
cypermethrin and 3-phenoxybenzoic acid by a novel Ochrobactrum lupine DG-S-01.
J. Hazard. Mater., 187(1-3): 433–440.
Chen, S. H., Yang, L., Hu, M. Y. and Liu, J. J. (2011) Biodegradation of fenvalerate and 3-
phenoxybenzoic acid by a novel Stenotrophomonas sp. strain ZS-S-01 and its use in
bioremediation of contaminated soils. Appl Microbiol Biotechnol., 90: 755–767.
271
Chen, S., Liu, C., Peng, C., Liu, H. and Hu, M. (2012). Biodegradation of chlorpyrifos and its
hydrolysis product 3, 5, 6-trichloro-2-pyridinol by a new fungal strain Cladosporium
cladosporioides Hu-01. PLoS ONE., 7(10): e47205.
doi:10.1371/journal.pone.0047205.
Chen, Y., Zhang, Q., Wang, S., Yang, Y., Meng, B., Hu, D. and Lu, P. (2018). Residue
dynamics and risk assessment of dimethoate in sweet potato, purple flowering stalk,
Chinese kale, celery, and soil. Hum. Ecol. Risk Assess., 24(3): 767-783.
Cheng, S., Xiao, J. and Xiao, H. (2007). Technical note phytoremediation of triazophos by
Canna indica Linn. in a hydroponic system. Int. J. Phytoremed., 9:453–463.
Cheng, T. C., DeFrank, J. J. and Rastogi, V. K. (1999). Alteromonas prolidase for
organophosphorus G-agent decontamination. Chem. Biol. Interact., 120: 455–462.
Cheng, T. C., Rastogi, V. K., DeFrank, J. J., Anderson, D. M. and Hamilton, A. B. (1997)
Nucleotide sequence of a gene encoding and organophosphorus never agent degrading
enzyme from Alteromonas haloplanktis. J. Ind. Microbiol. Biotechnol., 18(1): 49–55.
Cherukuri, S. R., Bhushan, S., Reddy, H., Hymavathy, M., Ravindranath, D. and Aruna, M.
(2015). Dissipation dynamics and risk assessment of profenofos, triazophos and
cypermethrin residues on tomato for food safety. Int. J. Agric. For., 5(1): 60-67.
Chirnside, A., Ritter, W. and Radosevich, M. (2007). Isolation of a selected microbial
consortium from a pesticide-contaminated mix-load site soil capable of degrading the
herbicides atrazine and alachlor. Soil Biol. Biochem., 39: 3056-3065.
Chishti, Z. and Arshad, M. (2012). Growth linked biodegradation of chlorpyrifos by
Agrobacterium and Enterobacter spp. Int. J. Agric Biol., 15: 19‒26.
Cho, K., Math, R. K., Islam, S. M. A. and Lim, W.J. (2009). Biodegradation of chlorpyrifos by
lactic acid bacteria during kimchi fermentation, J. Agr. Food. Chem., 57: 1882-1889.
Cho, Y. E., Lomeda, R. A. R., Ryu, S. H., Sohn, H. Y., Shin, H. I., Beattie, J. H., and Kwun, I.
S. (2007). Zinc deficiency negatively affects alkaline phosphatase and the concentration
of Ca, Mg and P in rats. Nutr. Res. Pract., 1(2): 113-119.
Choi, M. K., Kim, K. D., Ahn, K. M., Shin, D. H., Hwang, J. H., Seong, C. N. and Ka, J. O.
(2009). Genetic and phenotypic diversity of parathion-degrading bacteria isolated from
rice paddy soils. J. Microbiol. Biotechnol., 19(12): 1679-1687. DOI
10.4014/jmb.0905.05057.
Christensen, K., Harper, B., Luukinen, B., Buhl, K. and Stone, D. (2009). Chlorpyrifos
Technical Fact Sheet; National pesticide information center, Oregon State University
extension services. http://npic.orst.edu/factsheets/archive/chlorptech.html.
Chu, X., Fang, H., Pan, X., Wang, X., Shan, M., Feng, B. and Yu, Y. (2008). Degradation of
chlorpyrifos alone and in combination with chlorothalonil and their effects on soil
microbial populations. J. Environ. Sci., 20: 464-469.
Claus, H., Bausinger, T., Lehmler, I., Perret, N,, Fels, G., Dehner, U., Preuss, J. and Konig, H.
(2007). Transformation of 2, 4, 6-trinitrotoluene (TNT) by Raoultella terrigena.
Biodegradation., 18(1): 27–35. doi:10.1007/s10532-005-9033-7.

272
Combs Jr, G. F., Parsons, A. H. and Ross, M. B. (1979). Calcium homeostasis in pullets of two
lines selected for differences in eggshell strength. Poult. Sci., 58(5): 1250-1256.
Comeau, Y., Greer, C. W. and Samson, R. (1993). Role of inoculum preparation and density
on the bioremediation of 2, 4-D-contaminated soil by bioaugmentation. Appl.
Microbiol. Biotechnol., 38(5): 681-687.
Cookson Jr, J. T. (1995). Bioremediation Engineering: Design and Application. McGraw-Hill,
Inc. New York, USA.
Corbitt, R.A. (1998). Standard Handbook of Environmental Engineering. (second ed.).
McGraw Hill, New York.
Costa, L. G. (2006). Current issues in organophosphate toxicology. Clin. Chim. Acta., 366(1-
2):1–13.
Cycon, M., Wojcik, M. and Piotrowska-Seget, Z. (2009). Biodegradation of the
organophosphorus insecticide diazinon by Serratia sp. and Pseudomonas sp. and their
use in bioremediation of contaminated soil. Chemosphere., 76(4): 494–501.
Cycon, M., Zmijowska, A., Wojcik, M. and Piotrowska-Seget, Z. (2013). Biodegradation and
bioremediation potential of diazinon-degrading Serratia marcescens to remove other
organophosphorus pesticides from soils. J. Environ. Manage., 117: 7–16. doi:
10.1016/j.jenvman.2012.12.031.
Dai, Q. H., Zhang, R. F. and Jiang, J. D. (2007). Cloning of triazophos hydrolase gene and the
determination of the hydrolysate. China. Environ. Sci. 27:777–780.
Dai, Q. H., Zhang, R. F., Jiang, J. D., Gu, L. F. and Li, S. P. (2005). Isolation, identification
and characterization of triazophos degrading bacterium mp-4. Acta. Pedol. Sin., 42(1):
111-115.
Damalas, C. A. and Koutroubas, S. D. (2016). Farmers’ exposure to pesticides: toxicity types
and ways of prevention. Toxics., 4(1): 1. doi: 10.3390/toxics4010001.
Das, S. and Adhya, T. K. (2015). Degradation of chlorpyrifos in tropical rice soils. J. Environ.
Manage., 152: 36–42.
Davies, B. E. (1974). Loss on ignition as an estimate of soil organic matter. Soil Sci. Soc. Am.
Proc., 38: 150–151.
De Felice, A., Greco, A., Calamandrei, G. and Minghetti, L. (2016). Prenatal exposure to the
organophosphate insecticide chlorpyrifos enhances brain oxidative stress and
prostaglandin E 2 synthesis in a mouse model of idiopathic autism. J.
Neuroinflammation., 13(1): 149.
De Silva, H. J., Samarawickrema, N. A. and Wickremasinghe, A. R. (2006). Toxicity due to
organophosphorus compounds: what about chronic exposure? Trans. R. Soc. Trop.
Med. Hyg., 100(9): 803-806
DebMandal, M., Mandal, S. and Pal, N. K. (2002). Evaluation of bioremediation potential of
organophosphorus pesticide dimethoate 30% EC by heavy metal and antibiotic resistant

273
Proteus vulgaris isolated from Ganges at Sreerampore, Indian. Res. J. Chem. Environ.,
6: 49–52.
DebMandal, M., Mandal, S. and Pal, N. K. (2005). Plasmid mediated dimethoate degradation
by Bacillus licheniformis isolated from a fresh water fish Labeo rohita. J. Biomed.
Biotechnol., 2005(3): 280–286. https://doi.org/10.1155/JBB.2005.280.
DebMandal, M., Mandal, S. and Pal, N. K. (2011). Kinetics of dimethoate biodegradation in
bacterial system. Microbiol. Res., 2(e 20): 1-3. DOI: 10.4081/mr.2011-e20
DebMandal, M., Mandal, S., Pal, N. K. and Aich, A. (2008). Potential metabolites of
dimethoate produced by bacterial degradation. World. J. Microbiol. Biotechnol., 24(1):
69–72.
Deeba, F., Raza, I., Muhammad, N., Rahman, H., Rehman, Z., Azizullah, A. and Daud, M. K.
(2017). Chlorpyrifos and lambda cyhalothrin-induced oxidative stress in human
erythrocytes: In vitro studies. Toxicol. Indus. health., 33(4): 297-307.
Deng, S., Chena, Y., Wang, D., Shia, T., Wua, X., Ma, X., Li, X., Hua, R, Tang, X. and Li, Q,
X. (2015). Rapid biodegradation of organophosphorus pesticides by Stenotrophomonas
sp. G1. J. Hazard. Mater., 297: 17–24.
Deshpande, N. M., Dhakephalkar, P. K., and Kanekar, P. P. (2001) Plasmid mediated
dimethoate degradation in Pseudomonas aeruginosa MCMB-427. Lett Appl
Microbiol., 33:275–279.
Deshpande, N. M., Sarnaik, S. S., Paranjpe, S. A. and Kanekar, P. P. (2004). Optimization of
dimethoate degradation by Brevundimonas sp. MCM B-427 using factorial design:
studies on interactive effects of environmental factors. World. J. Microbiol. Biotechnol.
20(5): 455-462.
Díaz-Cruz, M, S. and Barcelo, D. (2006). Highly selective sample preparation and gas
chromatographic–mass spectrometric analysis of chlorpyrifos, diazinon and their major
metabolites in sludge and sludge-fertilized agricultural soils. J. Chromatogr. A.,
1132(1–2): 21–27.
Diez, M. C. (2010). Biological aspects involved in the degradation of organic pollutants. J.
Soil. Sci. Plant Nutr., 10(3): 244-267.
Dominah, G. A., McMinimy, R. A., Kallon, S. and Kwakye, G. F. (2017). Acute exposure to
chlorpyrifos caused NADPH oxidase mediated oxidative stress and neurotoxicity in a
striatal cell model of Huntington’s disease. Neurotoxicol., 60: 54-69.
Drake, J. M. and Kramer, A. M. (2012). Mechanistic analogy: how microcosms explain nature,
Theor. Ecol., 5(3): 433-444. DOI: 10.1007/s12080-011-0134-0.
Dubia, K. K. and Fulekar, D.M.H. (2012). Chlorpyrifos bioremediation in Pennisetum
rhizosphere by a novel potential degrader Stenotrophomonas maltophilia MHF ENV20.
World J. Microbiol. Biotechnol., 28(4): 1715–1725.
274
Eaton, D. L., R. B., Daroff, L., Autrup and J. Bridges. (2008). Review of the toxicology of
chlorpyrifos with an emphasis on human exposure and neurodevelopment, Crit. Rev.
Toxicol., 38(2): 1-125.
Eerd, L. L. V, Hoagland, R. E., Zablotowicz, R. M., Hall, J. C. (2003). Pesticide metabolism
in plants and microorganisms. Weed Sci., 51(4): 472–495.
Eissa, F, I., Mahmoud, H, A., Massoud, O, N., Ghanem, K, M. and Gomaa, I, M. (2014).
Biodegradation of chlorpyrifos by microbial strains isolated from agricultural
wastewater. J. Am. Sci., 10(3):98-108. (ISSN: 1545-1003).
http://www.jofamericanscience.org.
Eizuka, E., Ito, A. and Chida, T. (2003). Degradation of ipconazole by microorganisms isolated
from paddy soil, J. Pest. Sci., 28(2): 200-207.
El-Bestawy, E., Sabir, J., Mansy, A. H. and Zabermawi, N. (2014). Comparison among the
efficiency of different bioremediation technologies of atrazine–contaminated soils. J.
Bioremed. Biodeg., (5)5: 1-7.
El-Helow, E. R., Badawy, M. E., Mabrouk, M. E., Mohamed, E. A. and El-Beshlawy, Y. M.
(2013). Biodegradation of chlorpyrifos by a newly isolated Bacillus subtilis strain,
Y242. Bioremediat. J., 17(2): 113-123.
Eshanpour, A. and Amini, F. (2003). Effect of salt and drought stress on acid phosphatase
activities in alfalfa (Medigo sativa L.) explants under in vitro culture. Afr. J. Biotechnol.
2(5):133-135.
Evgenidou, E., Konstantinou, I., Fytianos, K. and Albanis, T. (2006). Study of the removal of
dichlorvos and dimethoate in a titanium dioxide mediated photocatalytic process
through the examination of intermediates and the reaction mechanism. J. Hazard.
Mater., 137(2): 1056-1064.
Fang, H., Xiang, Y. Q., Hao, Y. J., Chu, X. Q., Pan, X. D., Yu, J. Q. and Yu, Y. L. (2008).
Fungal degradation of chlorpyrifos by Verticillium sp. DSP in pure cultures and its use
in bioremediation of contaminated soil and pakchoi. Int. Biodeterior. Biodegrad.,
61(4): 294-303.
Farhan, M., Butt, Z. A., Khan, A. U., Wahid, A., Ahmad, M. and Kanwal, A. (2017).
Restoration of pesticide contaminated agricultural soil through bio-augmentation and
its kinetics. Pak. J. Agric. Sci., 54(3): 1-5.
Farhan, M., Khan, A., Wahid, A., Ahmad, M. and Ahmad, F. (2012). Biodegradation of
chlorpyrifos using indigenous Pseudomonas sp. isolated from industrial drain. Pak. J.
Nutr., 11(12): 1183-1189.
Fava, F., Berselli, S., Conte, P., Piccolo, A.and Marchetti, L. (2004). Effects of humic
substances and soya lecithin on the aerobic bioremediation of a soil historically
contaminated by polycyclic aromatic hydrocarbons (PAHs). Biotechnol. Bioeng.,
88(2): 214-223.
Feng, F., Ge, J., Li, Y., Cheng, J., Zhong, J. and Yu, X. (2017). Isolation, colonization, and
chlorpyrifos degradation mediation of the endophytic bacterium Sphingomonas strain
275
HJY in Chinese chives (Allium tuberosum). J. Agric. Food Chem., 65(6): 1131-1138.
DOI: 10.1021/acs.jafc.6b05283
Feng, Y., Minard, R. D., Bollag, J. M. (1998). Photolytic and microbial degradation of 3, 5, 6-
trichloro-2-pyridinol. Environ. Toxicol. Chem., 17(5):814–819.
Feng, Y., Racke, K. D. and Bollag, J. M. (1997) Isolation and characterization of a chlorinated
pyridinol degrading bacterium. Appl. Environ. Microbiol., 63(10): 4096–4098.
Fernandes, J., Amorim, R., Azevedo, I., and Martins, M. J. (2008). In vitro modulation of
alkaline phosphatase activity of Saccharomyces cerevisiae grown in low or high
phosphate medium. Braz. J. Med. Biol. Res., 41(1): 41-46.
Fontana, A. R., Camargo, A. B. and Altamirano, J. C. (2010). Coacervative microextraction
ultrasound-assisted back-extraction technique for determination of organophosphates
pesticides in honey samples by gas chromatography-mass spectrometry. J.
Chromatogr. A., 1217(41): 6334-6341.
Franca, M. B. and Emanuela, T. (2007). Evidences for CYP3A4 autoactivation in the
desulfuration of dimethoate by the human liver. Toxicol., 241: 33-46.
Fritsche, W. and Hofrichter, M. (2005). Aerobic degradation of recalcitrant organic compounds
by microorganisms. In: Environmental Biotechnology: Concepts and Applications
(Jordening, H. J. and Winter, J. eds.), Wiley-VCH Verlag GmbH & Co. KGaA,
Weinheim, FRG. doi: 10.1002/3527604 286.ch7.
Fuentes, M. S., Briceño, G. E., Saez, J. M., Benimeli, C. S., Diez, M. C. and Amoroso, M. J.
(2013). Enhanced removal of a pesticides mixture by single cultures and consortia of
free and immobilized Streptomyces strains. BioMed. Res. Int., 2013: 1-9.
http://dx.doi.org/10.1155/2013/392573.
Fulekar, M, H. and Geetha, M. (2008). Bioremediation of Chlorpyrifos by Pseudomonas
aeruginosa using scale up technique. J. Appl. Biosci., 12: 657 – 660.
Gandhi, K., Lari, S., Tripathi, D. and Kanade, G. (2015). Advanced oxidation processes for the
treatment of chlorpyrifos, dimethoate and phorate in aqueous solution. J. Water Reuse
Desal., 6 (1):195-203.
Gandhi, N. U and Chandra, S. B. (2012). A comparative analysis of three classes of bacterial
non-specific acid phosphatases and archaeal phosphoesterases: Evolutionary
perspective. Acta. Inform. Med.. 20(3): 167–173. doi: 10.5455/aim.2012.20.167-173.
Gao, Y., Chen, S., Hu, M., Hu, Q., Luo, J. and Li, Y. (2012). Purification and characterization
of a novel chlorpyrifos hydrolase from Cladosporium cladosporioides Hu-01. PLoS
One., 7(6): e38137. doi:10.1371/journal.pone.0038137
Gao, Y., Truong, Y. B., Cacioli, P., Butler, P. and Kyratzis, I. L. (2014). Bioremediation of
pesticide contaminated water using an organophosphate degrading enzyme
immobilized on nonwoven polyester textiles. Enzyme. Microb. Tchnol,, 54: 38-44.
Garcia-Garcia, C. R., Parron, T., Requena, M., Alarcon, R., Tsatsakis, A. M. and Hernandez,
A. F. (2016). Occupational pesticide exposure and adverse health effects at the clinical,
hematological and biochemical level. Life sci., 145: 274-283.

276
Gavrilescu, M., Demnerova, K., Aamand, J., Agathos, S. and Fava, F. (2015). Emerging
pollutants in the environment: present and future challenges in biomonitoring,
ecological risks and bioremediation. New biotechnol., 32(1): 147-156.
Geng, Y., Jiang, L., Zhang, Y., He, Z., Wang, L., Peng, Y. and Xu, Y. (2018). Dissipation, pre‐harvest interval estimation, and dietary risk assessment of carbosulfan, dimethoate, and
their relevant metabolites in greenhouse cucumber (Cucumis sativus L.). Pest Manage.
sci., https://doi.org/10.1002/ps.4857.
Ghaffar, A. S., Hussain, A. R., Hussain, T., Shafique, M., Noreen, S. and Aslam, S. (2014).
Clinico- hematological disparities induced by triazophos (organophosphate) in
Japanese quail. Pak. Vet. J., 34(2): 257-259.
Ghanem, I., Orfi, M. and Shamma, M. (2007). Biodegradation of chlorphyrifos by Klebsiella
sp. isolated from an activated sludge sample of waste water treatment plant in
damascus. Folia Microbiol. (Praha)., 52(4): 423-427.
Giesy, J. P., Solomon, K. R., Cutler, G. C., Giddings, J. M., Mackay, D., Moore, D. R. and
Williams, W. M. (2014). Ecological risk assessment of the uses of the
organophosphorus insecticide chlorpyrifos, in the United States. In: Ecological Risk
Assessment for Chlorpyrifos in Terrestrial and Aquatic Systems in The United States.
Reviews of environmental contamination and toxicology (continuation of residue
reviews), vol. 231. Giesy, J., Solomon, K. (eds). Springer, Cham, pp. 1-11.
https://doi.org/10.1007/978-3-319-03865-0_1.
Gill, H. K. and Garg, H. (2014). Pesticides: Environmental Impacts and Management
Strategies. In: Pesticides-toxic aspects. Soloneski, S (ed.), In Tech. pp. 187-230. DOI:
10.5772/57399.
Gonzalez-Alzaga, B., Lacasana, M., Aguilar-Garduno, C., Rodriguez-Barranco, M., Ballester,
F., Rebagliato, M. and Hernandez, A. F. (2014). A systematic review of
neurodevelopmental effects of prenatal and postnatal organophosphate pesticide
exposure. Toxicol. Lett., 230(2): 104-121.
Gothwal, A., Dahiya, M., Beniwa, P. and Hooda, V. (2014). Purification and kinetic studies of
organophosphorus hydrolase from B. diminuta. Int. J. Pharm. Pharm. Sci., 6(10): 341-
344.
Grandjean, P. and Landrigan, P. J. (2014). Neurobehavioural effects of developmental toxicity.
Lancet Neurol., 13(3): 330-338.
Gray, N. F., (1989). The effect of small changes in incubation temperature on the five day
biochemical oxygen demand test. Environ.Technol. Lett., 10(3): 253–258. DOI:
10.1080/09593338909384739.
Grenni, P., Falconi, F. and Caracciolo, A. B. (2012). Microcosm experiments for evaluating
natural bioremediation of contaminated ecosystems. Chem. Eng. Trans., 28: 7-12. DOI;
10.3303/CET1228002.
Gu, T., Sun, L. N., Zhang, J., Sui, X. H. and Li, S. P. (2014). Rhizobium flavum sp. nov., a
triazophos-degrading bacterium isolated from soil under the long-term application of
triazophos. Int, J. Syst. Evol. Microbiol., 64(6): 2017-2022.
277
Gupta, R. C. (Ed.). (2015). Handbook of toxicology of chemical warfare agents. Academic
Press, pp. 1198.
Ha, J., Engler, C. R. and Lee, S. J. (2008). Determination of diffusion coefficients and diffusion
characteristics for chlorferon and diethylthiophosphate in Ca-alginate gel beads.
Biotechnol. Bioeng., 100(4): 698-706. DOI:10.1002/bit.21761.
Halimah, M., Ismail, B. S., Nashriyah, M. and Maznah, Z. (2016). Mobility studies of 14 C-
chlorpyrifos in malaysian oil palm soils. Bull. Environ. Contam. Toxicol., 96(1): 120-
124.
Hallenbeck, W. H. and Cunningham-Burns, K. M. (1985). Pesticides and human health.
Springer-Verlag, New York, pp. 166.
Hamsavathani, V., Aysha, O. S. and Ajith, A. R. (2017). Isolation and identification of
chlorpyrifos degrading bacteria from agricultural soil. Int. J. Adv. Res., 5 (5): 1209-
1221.
Han, Y., Mo, R., Yuan, X., Zhong, D., Tang, F., Ye, C. and Liu, Y. (2017). Pesticide residues
in nut-planted soils of China and their relationship between nut/soil. Chemosphere.,
180: 42-47.
Harishankar, M. K., Sasikala, C. and Ramya, M. (2013). Efficiency of the intestinal bacteria in
the degradation of the toxic pesticide, chlorpyrifos. 3 Biotech., 3(2):137–142. DOI
10.1007/s13205-012-0078-0.
Hasan, H. A. H. (1999). Fungal utilization of organophosphate pesticides and their degradation
by Aspergillus flavus and A. sydowii in soil. Folia Microbiol., 44(1):77-84.
Hashimoto, M., Fukui, M., Hayano, K. and Hayatsu, M. (2002). Nucleotide sequence and
genetic structure of a novel carbaryl hydrolase gene (cehA) from Rhizobium sp. strain
AC100. Appl. Environ. Microbiol., 68:1220–1227.
Hassal, A. K., 1990. Organophosphorous insecticides. In: The Biochemistry and Uses of
Pesticides. ELBS, London, pp. 81-124.
Hayatsu, M., Hirano, M. and Tokuda, S. (2000). Involvement of two plasmids in fenitrothion
degradation by Burkholderia sp. strain NF 100. Appl. Environ. Microbiol., 66 (4):
1737–1740.
Hayes, W. J. (1982). Pesticides studied in man. Baltimore, MD: Williams & Wilkins, pp. 672.
Hayes, W. J. and Laws, E.R. (ed.). (1990). Handbook of Pesticide Toxicology. Classes of
Pesticides. Academic Press, Inc., NY. pp. 1576.
Hernandez, I., Fernandez, J. A. and Niell, F. X. (1995). A comparative study of alkaline
phosphatase activity in two species of Gelidium (Gelidiales, Rhodophyta). Eur. J.
Phycol., 30(1): 69-77. 69-77, DOI: 10.1080/09670269500650811.
Hett, E. C. and Eric J. Rubin, E. J. (2008). Bacterial growth and cell division: a mycobacterial
perspective. Microbiol. Mol. Biol. Rev., 72(1): 126–156. doi: 10.1128/MMBR.00028-
07
278
Hill, C. M., Li, W. S., Cheng, T. C., DeFrank, J. J. and Raushel, F. M. (2001). Stereochemical
specificity of organophosphorus acid anhydrolase toward p-nitrophenyl analogs of
soman and sarin. Bioorg. Chem., 29(1): 27–35.
Hong, Q., Zhanga, Z., Hong, Y. and Li, S. (2007). A microcosm study on bioremediation of
fenitrothion-contaminated soil using Burkholderia sp. FDS-1. Int. Biodeterior.
Biodegradation., 59(1): 55–61.
Hopkins, E. H., Hippe, D. J., Frick, E. A. and Buell, G. R. (2000). Organophosphorus pesticide
occurrence and distribution in surface and ground water of the United States, 1992-97.
US Geological Survey.
Horne I, Harcourt, R. L., Sutherland, T. D., Russell, R. J. and Oakeshott, J. G. (2002). Isolation
of a Pseudomonas monteilli strain with a novel phosphotriesterase. FEMS. Microbiol.
Lett. 206(1): 51–55.
Hossain, M. S., Chowdhury, M. A. Z., Pramanik, M. K., Rahman, M. A., Fakhruddin, A. N.
M. and Alam, M. K. (2015). Determination of selected pesticides in water samples
adjacent to agricultural fields and removal of organophosphorus insecticide
chlorpyrifos using soil bacterial isolates. Appl. water sci., 5(2): 171-179.
Hou, R., Tong, M., Gao, W., Wang, L., Yang, T. and He, L. (2017). Investigation of
degradation and penetration behaviors of dimethoate on and in spinach leaves using in
situ SERS and LC-MS. Food Chem., 237: 305-311.
Houghton, J. E. and Shanley, M. S. (1994). Catabolic potential of pseudomonads: a regulatory
perspective. In: Biological Degradation and Bioremediation of Toxic Chemicals
(Chaudhry, G. R., ed.), London: Chapman Hall, pp. 11–32.
How, V., Hashim, Z., Ismail, P., Md Said, S., Omar, D. and Bahri Mohd Tamrin, S. (2014).
Exploring cancer development in adulthood: cholinesterase depression and genotoxic
effect from chronic exposure to organophosphate pesticides among rural farm children.
J. Agromedicine., 19(1): 35-43.
Howard, P. H. (ed.). (1991). Handbook of Environmental Fate and Exposure Data for Organic
Chemicals, Vol. III: Pesticides. Lewis Publishers, Chelsea, MI, pp. 712.
Hudson, R. H., Haegele, M. A. and Tucker, R. K. (1984). Handbook of Toxicity of Pesticides
to Wildlife. Resource publication/United States Department of the Interior, Fish and
Wildlife Service (USA), pp. 90.
Hulett-cowling, F. M. and Campbell, L. L. (1971). Purification and properties of an alkaline
phosphate of Bacillus. licheniformis. Biochem., 10(8): 1364-1371.
Husberg, C., Agnetti, G., Ronald J. Holewinski, R. J., Geir Christensen, G. and Eyk, J. E. V.
(2012). Dephosphorylation of cardiac proteins in vitro - a matter of phosphatase
specificity. Proteomics. 12(7): 1-16. 10.1002/pmic.201100116. doi:
10.1002/pmic.201100116.
Ibrahim, W. M., Karam, M. A., El-Shahat, R. M. and Adway, A. A. (2014). Biodegradation
and utilization of organophosphorus pesticide malathion by cyanobacteria. BioMed.
Res. int,. 2014: 1-6. http://dx.doi.org/10.1155/2014/392682.
279
Ishag, A. E. S. A., Azhari, O. Abdelbagi, A. O., Hammad, A. M. A., Elsiddig A. E. Elsheikh,
E, A. E., Elsaid, O. E., Hur, J. H. and Laing, M. D. (2016). Biodegradation of
chlorpyrifos, malathion, and dimethoate by three strains of bacteria isolated from
pesticide-polluted soils in Sudan. J. Agric. Food. Chem., 64(45): 8491−8498. DOI:
10.1021/acs.jafc.6b03334.
Islam, S. M. 1., Math, R. K., Cho, K. M., Lim, W. J., Hong, S. Y., Kim, J. M., Yun, M. G.,
Cho, J. J., Yun, H. D. (2010). Organophosphorus hydrolase (Opd B) of Lactobacillus
brevis WCP902 from kimchi is able to degrade organophosphorus pesticides. J. Agric.
Food. Chem., 58(9):5380-5386. doi: 10.1021/jf903878eli.
Islam, T. M., Deora, A., Hashidoko, Y., Atiqur Rahman, A., Ito, T. and Tahara, S. (2007).
Isolation and identification of potential phosphate solubilizing bacteria from the
rhizoplane of Oryza sativa L. cv. BR29 of Bangladesh. Z. Naturforsch. C., 62(1-2):
103-110.
Ivashina, S. A. (1986). Interaction of Dursban with soil micro-organisms. Agrokhimia., 8: 75-
76.
Iyer, R., Stepanov, V. G. and Iken, B. (2013). Isolation and molecular characterization of a
novel pseudomonas putida strain capable of degrading organophosphate and aromatic
compounds. Adv. Biol. Chem., 3(06): 564-578.
Jabbar, A. and Mallick, S. (1994). Pesticides and Environment Situation in Pakistan. Working
Paper Series # 19. PP 1-39.
Jabeen, H., Iqbal, S. and Anwar, S. (2015). Biodegradation of chlorpyrifos and 3, 5, 6-trichloro-
2-pyridinol by a novel rhizobial strain Mesorhizobium sp. HN3. Water Environ. J., 29:
151–160.
Jabeen, H., Iqbal, S., Anwar, S. and Parales, R. E. (2015). Optimization of profenofos
degradation by a novel bacterial consortium PBAC using response surface
methodology. Int. Biodeterior. Biodegradation., 100: 89-97.
Jacquet, P., Daude, D., Bzdrenga, J., Masson, P., Elias, M. and Chabriere, E. (2016). Current
and emerging strategies for organophosphate decontamination: special focus on
hyperstable enzymes. Environ. Sci. Pollut. Res., 23(9): 8200-8218.
Jadhav, V. D. (2014). Physical parameters such as pH and temperature influencing dimethoate
biodegradation by Pseudomonas sutzeri. J. Adv. Med. Life Sci., 1(1): 1-3.
Jaiswal, S., Bara, J. K., Soni, R. and Shrivastava, K. (2017). Bioremediation of chlorpyrifos
contaminated soil by microorganism. Int. J. of Environ. Agric. Biotechnol., 2(4).
Janeway, C. M., Xu, X., Murphy, J. E., Chaidaroglou, A. and Kantrowitz, E. R. (1993).
Magnesium in the active site of Escherichia coli alkaline phosphatase is important for
both structural stabilization and catalysis. Biochem., 32(6): 1601-1609.
Jawale, R. H. and Gogate, P. R. (2018). Combined treatment approaches based on ultrasound
for removal of triazophos from wastewater. Ultrason. Sonochem., 40(B): 89-96.
280
Jiang, H., Yang, C., Qu, H., Liu, Z., Fu, Q. S. and Qiao, C. (2007). Cloning of a novel aldo-
keto reductase gene from Klebsiella sp. strain F51-1-2 and its functional expression in
Escherichia coli. Appl. Environ. Microbiol., 73(15): 4959–4965.
Jilani, S. (2013). Comparative assessment of growth and biodegradation potential of soil isolate
in the presence of pesticides. Saudi. J. Biol. Sci., 20(3): 257–264. doi:
10.1016/j.sjbs..02.007
John, E. M. and Shaike, J. M. (2015). Chlorpyrifos: pollution and remediation. Environ. Chem.
Lett., 13(3): 269-291.
John, E. M., Rebello. S., and Jisha, M. S. (2014) Chlorpyrifos degradation using bacterial
consortium obtained from soil. Int. J. Environ. Eng., (4): 91–94.
John, E. M., Sreekumar, J. and Jisha, M.S. (2016): Optimization of chlorpyrifos degradation
by assembled bacterial consortium using response surface methodology. Soil and
Sediment Contam., 25(6): 668-682. DOI:10.1080/15320383.2016.1190684.
Kale, S. P., Munhy, N. B. K. and Raghu, K. (1989). Effect of carbofuran, carbaryl and their
metabolites on the growth of Rhizobium sp. and Azotobacter chroococcum. Bull.
Environ. Contam. Toxicol., 42(5): 769-772.
Kanekar, P. P., Bhadbhade, B. J., Deshpande, N. M. and Sarnaik, S. S. (2004). Biodegradation
of organophosphorus pesticides. Proc. Indian natn. Sci. Acad., 70(1): 57-70.
Kang, D. G., Choi, S. S. and Cha, H. J. (2006). Enhanced biodegradation of toxic
organophosphate compounds using recombinant Escherichia coli with sec pathway-
driven periplasmic secretion of organophosphorus hydrolase. Biotechnol. Prog., 22(2):
406-410.
Karanth, S. and Pope, C. (2000). Carbosylesterase and a-esterase activities during maturation
and aging: relationship to the toxicity of chlorpyrifos and parathion in rats. Toxicol.
Sci., 58(2): 282-289.
Karpouzas, D. G. and Walker, A. (2000). Factors influencing the ability of Pseudomonas
putida epI to degrade ethoprophos in soil. Soil Biol. Biochem., 32(11-12): 1753–1762.
Kazemi, M., Tahmasbi, A. M., Valizadeh, R., Naserian, A. A. and Soni, A. (2012).
Organophosphate pesticides: a general review. Agric. Sci. Res. J., 2(9): 512-522.
Kettler, T, A., Doran, J, W. and Gibbert, T. (2001). Simplified method for Soil particle-Size
determination to accompany soil quality Analysis. Soil. Sci. Soc. Am. J., 65(3): 849-
852.
Khalid, M., Rasul, S., Hussain, J., Raza, A., Zia, A., Bilal, M. and Naqvi, T. A. (2016).
Biodegradation of organophosphorus insecticide chlorpyrifos, by Pseudomonas putida
CP-1. Pak. J. Zool., 48(5): 1453-1458.
Khalid, R., Mahmood, T., Bibi, R., Siddique, M. T., Alvi, S. and Naz, S. Y. (2012). Distribution
and indexation of plant available nutrients of rainfed calcareous soils of Pakistan. Soil
Environ., 31(2): 146-151.
281
Khalid, S., Hashmi, I. and Khan, S. J. (2016a). Bacterial assisted degradation of chlorpyrifos:
The key role of environmental conditions, trace metals and organic solvents. J. Environ.
Manage., 168: 1-9.
Khalid, S., Hashmi, I., Khan, S. J., Qazi, I. A. and Nasir, H. (2016b). Effect of metal ions and
petrochemicals on bioremediation of chlorpyrifos in aerobic sequencing batch
bioreactor (ASBR). Environ. Sci. Pollut. Res., 23(20): 20646-20660.
https://doi.org/10.1007/s11356-016-7153-8.
Khan, M., Mahmood, H. Z., and Damalas, C. A. (2015). Pesticide use and risk perceptions
among farmers in the cotton belt of Punjab, Pakistan. Crop Protection, 67: 184-190.
Kim, J. R. and Ahn, Y. J. (2009). Identification and characterization of chlorpyrifos-methyl
and 3, 5, 6-trichloro-2-pyridinol degrading Burkholderia sp. strain KR100.
Biodegradation., 20(4): 487–497.
Kim, K., Kabir, E. and Shamin Ara Jahan, S. A. (2017). Exposure to pesticides and the
associated human health effects. Sci. Total Environ., 575: 525-535.
Kononova, S. V. and Nesmeyanova, M. A. (2002) Phosphonates and their degradation by
microorganisms. Biochem., (Mosc.) 67: 184–195.
Kotinagu, K. and Krishnaiah, N. (2015). Organochlorine and organophosphorus pesticide
residues in fodder and milk samples along Musi river belt, India. Vet. world., 8(4): 545.
Kriakov, J., Lee, S.H. and Jacobs, W.R. (2003). Identification of a regulated alkaline
phosphatase, a cell surface-associated lipoprotein, in mycobacterium smegmatis. J.
Bacteriol., 185(16): 4983-4991.
Kulkarni, S., Misra, C. S., Gupta, A., Ballal, A. and Apte, S. K. (2016). Interaction of uranium
with bacterial cell surfaces: inferences from phosphatase-mediated uranium
precipitation. Appl. Environ. Microbiol., 82(16): 4965-4974. doi:
10.1128/AEM.00728-16.
Kulshrestha, G. and Kumari, A. (2011). Fungal degradation of chlorpyrifos by Acremonium
sp. strain (GFRC-1) isolated from a laboratory-enriched red agricultural soil. Biol. Fert.
Soils. 47(2): 219–225.
Kumar, M., Kaur, P. P. and Ganjewala, D. (2008). Isolation of periplasmic alkaline
phosphatase from Rhizobium bacteria. Res. J. Microbiol., 3(3): 157-162. DOI:
10.3923/jm.2008.157.162.
Kumar, S. (2011). Bioremediation of chlorpyrifos by bacteria isolated from the cultivated soils.
Int. J. Pharma. Bio. Sci., 2(3): 359-366.
Kumar, S., Mukerji, K. G. and Lal, R. (1996). Molecular aspects of pesticides biodegradation
by microorganisms. Crit. Rev. Microbiol. 22(1): 1-26.
La Nauze, J. M., Rosenberg, H. and Shaw, D. C. (1970). The enzymic cleavage of the carbon-
phosphorus bond: purification and properties of phosphonatase. Biochimic. Biophys.
Acta -Enzymol., 212(2): 332-350.

282
Lakshmi, C.V., Kumar, M. and S. Khanna. (2008). Biotransformation of chlorpyrifos and
bioremediation of contaminated soil. Int. Biodeterior. Biodegradation., 62(2): 204-209.
Latifi, A, M., Khodi, S., Mirzaei, M., Miresmaeili, M. and Babavalian, H. (2012). Isolation and
characterization of five chlorpyrifos degrading bacteria. Afr. J. Biotechnol., 11(13):
3140-3146. DOI: 10.5897/AJB11.2814.
Lewis, S. E., Silburn, D. M., Kookana, R. S. and Shaw, M. (2016). Pesticide behavior, fate,
and effects in the tropics: an overview of the current state of knowledge. J. Agric. Food
Chem., 64 (20): 3917–3924. DOI: 10.1021/acs.jafc.6b01320
Li, C., Lan, Y., Zhang, J., Chen, Z., Tang, D., and Xu, H. (2013). Biodegradation of
methidathion by Serratia sp. in pure cultures using an orthogonal experiment design,
and its application in detoxification of the insecticide on crops. Ann. Microbiol., 63(2):
451–459.
Li, J., Liu, J., Shen, W., Zhao, X., Hou, Y., Cao, H. and Cui, Z. (2010). Isolation and
characterization of 3, 5, 6-trichloro-2- pyridinol-degrading Ralstonia sp. strain T6.
Bioresour. Technol., 101(19): 7479-7483.
Li, R., Zheng, J., Wang, R., Song, Y., Chen, Q., Yang, X. and Jiang, J. (2010). Biochemical
degradation pathway of dimethoate by Paracoccus sp. Lgjj-3 isolated from treatment
wastewater. Int. Biodeterior. Biodegradation., 64(1): 51-57.
Li, W., Qiu, S. P. and Wu, Y. J. (2008). Triazophos residues and dissipation rates in wheat
crops and soil. Ecotoxicol. Environ. Saf., 69(2): 312–316.
Li, X., He, J. and Li, S. (2007). Isolation of a chlorpyrifos-degrading bacterium, Sphingomonas
sp. strain Dsp-2, and cloning of the mpd gene. Res. Microbiol. 158(2): 143–149.
Li, Y., Ma, S., Wang, M., Han, P. and Feng, X. (2017). Determination of chlorpyrifos and its
metabolites in strawberry using QuEChERS-liquid chromatography-tandem mass
spectrometry. J. Food Saf. Quality., 8(9): 3531-3535.
Li, R., He, L., Zhou, T., Ji, X., Qian, M., Zhou, Y. and Wang, Q. (2014). Simultaneous
determination of chlorpyrifos and 3, 5, 6-trichloro-2-pyridinol in duck muscle by
modified QuEChERS coupled to gas chromatography tandem mass spectrometry (GC-
MS/MS). Anal. Bioanal. Chem., 406(12): 2899-2907.
Liang, B., Yang, C., Gong, M., Zhao, Y., Zhang, J., Zhu, C., Jiang, J. and Li, S. (2011).
Adsorption and degradation of triazophos, chlorpyrifos and their main hydrolytic
metabolites in paddy soil from Chaohu Lake, China. J. Environ. Manage., 92(9): 2229-
2234.
Liang, W. Q., Wang, Z. Y., Li, H., Wu, P. C., Hu, J. M., Luo, N. and Liu, Y. H. (2005).
Purification and characterization of a novel pyrethroid hydrolase from Aspergillus niger
ZD11. J. Agric. Food Chem., 53(19): 7415–7420.
Liang, Y., Zeng, F., Qiu, G., Lu, X., Liu, X. and Gao, H. (2009). Co-metabolic degradation of
dimethoate by Raoultella sp. X1. Biodegradation., 20(3): 363-373. DOI
10.1007/s10532-008-9227-x
Liberti, S., Sacco, F., Calderone, A., Perfetto, L., Iannuccelli, M., Panni, S. and Cesareni, G.
(2012). HuPho: the human phosphatase portal. The FEBS J., 280(2): 379-387.
doi:10.1111/j.1742-4658.2012.08712.
283
Lieser, K. H. (1995). Radionuclides in the geosphere: sources, mobility, reactions in natural
waters and interactions with solids. Radiochim. Acta., 70-71: 355-375.
Lin, K. and Dongxing, Y. (2005). Degradation kinetics and products of triazophos in intertidal
sediments. J. Environ. Sci., 17(6): 933-936.
Lin, K., Dongxing, Y., Meng, C. and yongzhi, D. (2004). Kinetics and products of Photo-
Fenton degradation of triazophos. J. Agric. Food Chem. 52(25): 7614–7620.
Lin, K., Dongxing, Y., Yongzhi, D. and Meng, C. (2004). Hydrolytic products and kinetics of
triazophos in buffered and alkaline solutions with different values of pH. J. Agric. Food
Chem., 52(17): 5404–5411.
Liu, J., Tan, L., Wang, J., Wang, Z., Ni, H. and Li, L. (2016). Complete biodegradation of
chlorpyrifos by engineered Pseudomonas putida cells expressing surface-immobilized
laccases. Chemosphere., 157: 200-207. DOI: 10.1016/j.chemosphere.2016.05.031.
Liu, Y. H., Chung, Y. C. and Xiong, Y. (2001). Purification and characterization of a
dimethoate-degrading enzyme of Aspergillus niger ZHY256, isolated from sewage.
Appl. Environ. Microbiol., 67(8): 3746–3749.
Liu, Y. H., Liu, Y., Chen, Z. S., Lian, J., Huang, X. and Chung, Y. C. (2004). Purification and
characterization of a novel organophosphorus pesticide hydrolase from Penicillium
lilacinum BP303. Enzyme Microb. Technol., 34(3-4): 297–303.
Liu, Z. Y., Chen, X., Shi, Y. and Su, Z. C. (2012). Bacterial degradation of chlorpyrifos by
Bacillus cereus. Adv. Mat. Res., 356-360: 676-680.
Lokhande, M., Achuthan, P. V., Jambunathan, U., Ramanujam, A., Rao, A. S. and Mahajan,
S. K. (2001). Studies on the recovery of uranium using enzyme mediated and chemical
methods. In: Proceedings of BRNS-DAE National Symposium on Nuclear And
Radiochemistry. Department of Chemistry, University of Pune, Pune, India, pp. 224-
225.
Lozowicka, B., Mojsak, P., Jankowska, M., Kaczynski, P., Hrynko, I., Rutkowska, E. and
Borusiewicz, A. (2016). Toxicological studies for adults and children of insecticide
residues with common mode of action (MoA) in pome, stone, berries and other small
fruit. Sci. Total Environ., 566: 144-156.
Lu, P., Li, Q., Liu, H., Feng, Z., Yan, X., Hong, Q. and Li, S. (2013). Biodegradation of
chlorpyrifos and 3, 5, 6-trichloro-2-pyridinol by Cupriavidus sp. DT-1. Bioresour.
Technol., 127(C): 337-342.
Macaskie, L. E., Bonthrone, K. M., Yong, P. and Goddard, D. T. (2000). Enzymically mediated
bioprecipitation of uranium by a Citrobacter sp.: a concerted role for exocellular
lipopolysaccharide and associated phosphatase in biomineral formation. Microbiol.,
146:1855-1867.
Mackay, D., Giesy, J. P. and Solomon, K. R. (2014). Fate in the environment and long-range
atmospheric transport of the organophosphorus insecticide, chlorpyrifos and its oxon.
In: Ecological Risk Assessment for Chlorpyrifos in Terrestrial and Aquatic Systems in
the United States. Springer, Cham, pp. 35-76.
284
Madhuri, R. J. (2014). Degradation of dimethoate by cellulolytic bacteria in cotton soils.
Global J. Med. Res., 14(1): 1-5.
Mahboob, S., Al-Ghanim, K. A., Sultana, S., Al-Balawi, H. A., Sultana, T., Al-Misned, F. and
Ahmed, Z. (2015). A study on acute toxicity of triazophos, profenofos, carbofuran and
carbaryl pesticides on Cirrhinus mrigala. Pak. J. Zool., 47(2): 461-466.
Mahesh, M., Somashekhar, R., Bagchi, P. and Puttaiah, E. T. (2015). Optimization for the
production of extracellular Alkaline phosphatase from Proteus mirabilis. J. Bioprocess.
Biotech., 5(3): 1-5. doi: 10.4172/2155-9821.1000213
Majumder, S. P. and Das, A. C. (2016). Phosphate-solubility and phosphatase activity in
Gangetic alluvial soil as influenced by organophosphate insecticide residues.
Ecotoxicol. Environ. Saf., 126: 56-61. doi: 10.1016/j.ecoenv.2015.12.018.
Malik, P. (2014). Environmental pollution by pesticides: sources and solution. Int. J. Innov.
Res. Dev., 3(3): 1-5.
Manco, G., Porzio, E. and Suzumoto, Y. (2018). Enzymatic detoxification: a sustainable means
of degrading toxic organophosphate pesticides and chemical warfare nerve agents. J.
Chem. Technol. Biotechnol., 93(8): 2064-2082.
Manoil, C., Mekalanos J. J. and Beckwith, J. (1990). Alkaline phosphatase fusions: Sensors of
subcellular location. J. Bacteriol., 172(2): 515-518.
Marrs, T. (2002). Pesticide residues in food-2002-Joint FAO/WHO Meeting on Pesticide
Residues: Triazophos. http://www.inchem.org/documents/j.
Martinez, R. J., Beazley, M. J., Taillefert, M., Arakaki, A. K., Skolnick, J. and Sobecky, P. A.
(2007). Aerobic uranium (VI) bioprecipitation by metal‐resistant bacteria isolated from
radionuclide‐and metal‐contaminated subsurface soils. Environ. Microbiol., 9(12):
3122-3133.
Martin-Reina, J., Duarte, J. A., Cerrillos, L., Bautista, J. D. and Moreno, I. (2017). Insecticide
reproductive toxicity profile: organophosphate, carbamate and pyrethroids. J. Toxins.,
4(1): 1-7.
Matthews, G. (2015). Pesticides: health, safety and the environment. John Wiley & Sons. pp.
296
Mattos, E and Larripa, I. (1982). Effects of an accidental exposure to dimethoate and
derivatives. Medicina. 42(4): 381-384.
Maya, K., Singh, R. S., Upadhyay, S. N. and Dubey, S. K. (2011). Kinetic analysis reveals
bacterial efficacy for biodegradation of chlorpyrifos and its hydrolyzing metabolite
TCP. Process Biochem., 46(11): 2130-2136.
Mazur, A. (1946). An enzyme in animal tissues capable of hydrolyzing the phosphorus–
fluorine bond of alkyl fluorophosphates. J. Biol. Chem., 164(1): 271–289.
Megeed, A. A., and El-Nakieb, F. A. (2008). Bioremediation of dimethoate by effective
microorganisms in water. Terr. Aquat. Environ. Toxicol., 2(1):1-4.
285
Megeed, M. F. and Mlilo, J. (2014). Speciation and persistence of dimethoate in the aquatic
environment: characterization in terms of a rate model that takes into account
hydrolysis, photolysis, microbial degradation and adsorption of the pesticide by
colloidal and sediment particles. S. Afr. J. Chem., 67: 233-240.
Meghesan-Breja, A., Cimpoiu, C., and Hosu, A. (2017). Identification and quantification of
some pesticide metabolites from vegetables by GC-TOF-MS and LC-MS-QQQ. Studia
UBB. Chemia, 62(3): 19-34. DOI:10.24193/subbchem.2017.3.02
Meister, R.T. (ed.). (1992). Farm Chemicals Handbook. Meister Publishing Company,
Willoughby, OH, pp. 134.
Mohan, S. V., Shailaja, S., Krishna, M. R., Reddy, K. B. and Sarma, P. N. (2006). Bioslurry
phase degradation of di-ethyl phthalate (DEP) contaminated soil in periodic
discontinuous mode operation: Influence of bioaugmentation and substrate partition.
Process Biochem., 41(3): 644-652.
Mohan, S. V., Sirisha, K., Rao, N. C., Sarma, P. N. and Reddy, S. J. (2004). Degradation of
chlorpyrifos contaminated soil by bioslurry reactor operated in sequencing batch mode:
bioprocess monitoring. J. Hazard. Mater., 116(1-2): 39-48.
Moorman, T. B. (2018). Pesticide degradation by soil microorganisms: environmental,
ecological, and management effects. In: Soil Biology. Hatfield, J. L. (ed.). CRC Press,
pp. 175.
Mori, S., Okamoto, M., Nishibori, M., Ichimura, M., Sakiyama, J. and Endo, H. (1999).
Purification and characterization of alkaline phosphatase from Bacillus
stearothermophilus. Biotechnol. Appl. Biochem., 29(3): 235-239.
Moura, R. S., Martı́n, J. F., Martı́n, A. and Liras, P. (2001). Substrate analysis and molecular
cloning of the extracellular alkaline phosphatase of Streptomyces griseus. Microbiol.,
147(6), 1525-1533.
Mueller, J. G., Lantz, S. E., Blattmann, B. O. and Chapman, P. J. (1991). Bench-scale
evaluation of alternative biological treatment processes for the remediation of
pentachlorophenol-and creosote-contaminated materials. Solid-phase bioremediation.
Environ. Sci. Technol., 25(6): 1045-1055.
Mulbry, W. W and Karns, J. S. (1989a). Purification and characterization of three parathion
hydrolase from Gram-negative bacterial strains. Appl. Environ. Microbiol. 55(2): 289–
293.
Mulbry, W. W. (1992). The aryldialkyl phosphatase-encoding gene adpB from Nocardia sp.
strain B-1: cloning, sequencing and expression in Escherichia coli. Gene., 121(1): 149–
153.
Mulbry, W. W. (2000). Characterization of a novel organophosphorus hydrolase from
Nocardiodes simplex NRRL B-24074. Microbiol. Res., 154(4): 285–288.
Mulbry, W. W., Karns, J. S., Kearney, P. C., Nelson, J. O., McDaniel, C. S. and Wild, J. R.
(1986). Identification of a plasmid-borned parathion hydrolase gene from
Flavobacterium sp. by southern hybridization with opd from Pseudomonas diminuta.
Appl. Environ. Microbiol., 51(5): 926-930.
286
Najavand, S., Lotfi, A. S., Noghabi, K. A., Mohsenifar, A., Milani, M. M., Mota-Kalvanagh,
A. and Masoumi, F. (2012). A high potential organophosphorus pesticide-degrading
enzyme from a newly characterized, Pseudomonas aeruginosa NL01. Afr. J. Microbiol.
Res., 6(20): 4261-4269.
Nautiyal, C. S. (1999). An efficient microbiological growth medium for screening phosphate
solubilizing microorganisms. FEMS Microbiol. Lett. 170(1): 265–270.
Negi, G., Pankaj, S. A. and Sharma, A. (2014). In situ biodegradation of endosulfan,
imidacloprid, and carbendazim using indigenous bacterial cultures of agriculture fields
of Uttarakhand, India. Int. J. Biol. Food Vat. Agric. Eng., 8(9): 935-943.
Nilgiriwala, K. S., Alahari, A., Rao, A. S. and Apte, S. K. (2008). Cloning and overexpression
of alkaline phosphatase PhoK from Sphingomonas sp. strain BSAR-1 for
Bioprecipitation of Uranium from Alkaline Solutions. Appl. Environ. Microbiol.,
74(17): 5516-5523.
O'Brien, R. D. (2016). Toxic Phosphorus Esters: Chemistry, Metabolism, and Biological
Effects. Elsevier. pp. 446.
Occupational Health Services, Inc. (1991). MSDS for Dimethoate. OHS Inc., Secaucus, NJ.
Ortiz-Hernandez, M. L and Sanchez-Salinas, E. (2010). Biodegradation of the
organophosphate pesticide tetrachlorvinphos by bacteria isolated from agricultural soils
in mexico. Rev. Int. Contam. Ambient., 26 (1): 27-38.
Ortiz‐Hernandez, M. L., Quintero‐Ramirez, R., Nava‐Ocampo, A. A. and Bello‐Ramírez, A.
M. (2003). Study of the mechanism of Flavobacterium sp. for hydrolyzing
organophosphate pesticides. Fundam. Clin. Pharmacol., 17(6): 717-723.
Ortiz-Hernandez, M. L., Sanchez-Salinas, E., Olvera-Velona, A. and Folch-Mallol, J. L.
(2011). Pesticides in the environment: impacts and its biodegradation as a strategy for
residues treatment. In: Pesticides-Formulations, Effects, Fate. Stoytcheva, M. (ed.). In
Tech, pp. 808. doi: 10.5772/13534.
Ortiz-Hernandez. M. L., Sanchez-Salinas, E., Dantan-Gonzalez, E. and Castrejon-Godinez, M.
L. (2013). Pesticide biodegradation: mechanisms, genetics and strategies to enhance the
process. In: Biodegradation - Life of Science. (edition 1st). (Chamy, R. and Rosenkranz,
F. eds.). In Tech Publishers. pp. 251-287.
Pailan, S. and Saha, P. (2015). Chemotaxis and degradation of organophosphate compound by
a novel moderately thermo-halo tolerant Pseudomonas sp. strain BUR11: evidence for
possible existence of two pathways for degradation. Peer J., 3: 1-16. doi
10.7717/peerj.1378.
Pailan, S., Gupta, D., Apte, S., Krishnamurthi, S. and Saha, P. (2015). Degradation of
organophosphate insecticide by a novel Bacillus aryabhattai strain SanPS1, isolated
from soil of agricultural field in Burdwan, West Bengal, India. Int. Biodeterior.
Biodegradation., 103: 191-195. doi 10.1016/j.ibiod.2015.05.006.
Palmer, T. (1995). Understanding Enzymes. Ellis Horwood Ltd. Chichester, UK, pp. 400.
Pandey, G., Dorrian, S. J., Russell, R. J., Brearley, C., Kotsonis, S. and Oakeshott, J. G. (2010).
Cloning and biochemical characterization of a novel carbendazim (methyl-1H-
287
benzimidazol-2-ylcarbamate)-hydrolyzing esterase from the newly isolated
Nocardioides sp. strain SG-4G and its potential for use in enzymatic bioremediation.
Appl. Environ. Microbiol., 76(9): 2940-2945.
Parte, S. G., Mohekar, A. D. and Kharat, A. S. (2017). Microbial degradation of pesticide: A
review. Afr. J. Microbiol. Res., 11(24): 992-1012.
Pasqualini, S., Panara, F. and Antonielli, M. (1992). Acid phosphatase activity in Pinus pinea–
Tuber albidum ectomycorrhizal association. Can. J. Bot., 70(7): 1377-1383.
Pawar, K.R. and G.V. Mali. (2014). Biodegradation of Quinolphos insecticide by
Pseudomonas strain isolated from grape rhizosphere soils. Int. J. Curr. Microbiol. Appl.
Sci., 3(1): 606-613.
Peris-Sampedro, F., Basaure, P., Reverte, I., Cabré, M., Domingo, J. L. and Colomina, M. T.
(2015). Chronic exposure to chlorpyrifos triggered body weight increase and memory
impairment depending on human apoE polymorphisms in a targeted replacement mouse
model. Physiol. Behav., 144: 37-45.
Pesce, S., Wunderlin, D. (2004). Biodegradation of lindane by a native bacterial consortium
isolated from contaminated river sediment. Int. Biodeterior. Biodegradation., 54(4):
255- 260.
Pham, H., Michelle D. Lingao, M. D., Anuradha Ganesh, A., Jenina E. Capasso, J. E., Rosanne
Keep, R., Karthikeyan A. Sadagopan, K. A. and Alex V. Levin,A. V. (2016).
Organophosphate retinopathy. Oman j. ophthalmol., 9(1): 49.
Pino, N., and Penuela, G. (2011). Simultaneous degradation of the pesticides methyl parathion
and chlorpyrifos by an isolated bacterial consortium from a contaminated site.
Int. Biodeterior. Biodegradation., 65(6): 827-831.
Pinto, G., Mazzone, G., Russo, N. and Toscano, M. (2017). Trimethylphosphate and
Dimethylphosphate Hydrolysis by Binuclear CdII, MnII, and ZnII–FeII Promiscuous
Organophosphate‐Degrading Enzyme: Reaction Mechanisms. Chem. Eur. J., 23(55):
13742-13753.
Plisova, E. Y., Balabanova, L. A., Ivanova, E. P., Kozhemyako, V. B., Mikhailov, V. V.,
Agafonova, E. V. and Rasskazov, V. A. (2005). A highly active alkaline phosphatase
from the marine bacterium Cobetia. Mar. Biotechnol., 7(3): 173-178.
doi:10.1007/s10126-004-3022-4.
Polese, L., Dores, E. F. G. D. C., Jardim, E. F. G., Navickiene, S. And Ribeiro, M. L. (2002).
Determination of herbicides residues in soil by small scale extraction. Eclet. Quím., 27:
http://dx.doi.org/10.1590/S0100-46702002000100021.
Pradeep, V. and Subbaiah, U. M. (2015). Repeated batch and continuous degradation of
chlorpyrifos by Pseudomonas putida. J. Environ. Sci. Health Part B., 50(5): 346-360.
Prapamontol, T., Sutan, K., Laoyang, S., Hongsibsong, S., Lee, G., Yano, Y. and Panuwet, P.
(2014). Cross validation of gas chromatography-flame photometric detection and gas
chromatography–mass spectrometry methods for measuring dialkylphosphate
metabolites of organophosphate pesticides in human urine. Int. J. Hygiene Environ.
Health., 217(4-5): 554-566.
288
Premono, M. E., Moawad, A. M. and Vlek, P. L. G. (1996), Effect of phosphate-solubilizing
Pseudomonas putida on the growth of maize and its survival in the rhizosphere.
Indones. J. Crop Sci., 11(1): 13-23
Racke, K. D. (1993). Environmental fate of chlorpyrifos. Rev. Environ. Contam. Toxicol., 131:
1-150.
Racke, K. D., Coats, T. R. and Titus, K. R. (1988). Degradation of chlorpyrifos and its
hydrolysis products, 3, 5, 6-trichloro-2-pyridinol, in soil. J. Environ. Sci. Health B.,
23(6): 527–539.
Racke, K. D., Fontaine, D. D., Yoder, R. N. and Miller, J. R. (1994). Chlorpyrifos degradation
in soil at termiticidal application rates. Pest Manag. Sci., 42: 43–51.
Ramadan, M. A., El-Tayeb, O. M. and Alexander, M. (1990). Inoculum size as a factor limiting
success of inoculation for biodegradation. Appl. Environ. Microbiol., 56(5), 1392-1396.
Ramu, S. and Seetharaman, B. (2013). Biodegradation of acephate and methamidophos by a
soil bacterium Pseudomonas aeruginosa strain Is-6. J. Environ. Sci. B., 49(1): 23-34.
Rani, S. and Dhiraj, S. (2015). Development and validation of HPLC method for determination
of triazophos pesticide in water. Int. J. Res. Chem. Environ., 5(4): 65-69.
Rani, S., Madan, V. K. and Kathpal, T. S. (2001). Persistence and dissipation behavior of
triazophos in canal water under Indian climatic conditions. Ecotoxicol. Environ. Saf.,
50(1): 82-84.
Raposo, R., Barroso, M., Fonseca, S., Costa, S., Queiroz, J. A., Gallardo, E. and Dias, M.
(2010). Determination of eight selected organophosphorus insecticides in postmortem
blood samples using solid‐phase extraction and gas chromatography/mass
spectrometry. Rapid. Commun. Mass Spectrom., 24(21): 3187-3194.
Raushel, F. M. (2002). Bacterial detoxification of organophosphate nerve agents. Curr. Opin.
Microbiol. 5(3): 288–295.
Rayment, G. E. and Higginson, F. R. (1992). Australian Laboratory Handbook of Soil and
Water Chemical Methods. Melbourne, Inkata Press, pp. 330.
Rayu, S., Nielsen, U. N., Nazaries, L. and Singh, B. K. (2017). Isolation and molecular
characterization of novel chlorpyrifos and 3, 5, 6-trichloro-2-pyridinol-degrading
bacteria from sugarcane farm soils. Front. Microbiol., 8: 518. doi:
10.3389/fmicb.2017.00518.
Reddy, A., Madhavi, V., Reddy, K. G. and Madhavi, G. (2012). Remediation of chlorpyrifos-
contaminated soils by laboratory-synthesized zero-valent nano iron particles: effect of
pH and aluminium salts. J. Chem., 2013: 1-8. http://dx.doi.org/10.1155/2013/521045.
Rejmankova, E., Sirová, D. and Carlson, E. (2011). Patterns of activities of root
phosphomonoesterase and phosphodiesterase in wetland plants as a function of
macrophyte species and ambient phosphorus regime. New Phytol., 190(4): 968-976.
Renninger, N., R. Knopp, H. Nitsche, D. S. Clark, and J. D. Keasling. (2004). Uranyl
precipitation by Pseudomonas aeruginosa via controlled polyphosphate metabolism.
Appl. Environ. Microbiol. 70: 7404-7412.
289
Richins, R. D., Mulchandani, A. and Chen, W. (2000). Expression, immobilization, and
enzymatic characterization of cellulose-binding domain-organophosphorus hydrolase
fusion enzymes. Biotechnol. Bioeng., 69(6): 591-596. doi: 10.1002/1097-0290.
Rigas, F., Papadopoulou, K., Dritsa, V. and Doulia, D. (2007). Bioremediation of a soil
contaminated by lindane utilizing the fungus Ganoderma australe via response surface
methodology. J. Hazard. Mater., 140(1-2): 325-332.
Rina, M., Pozidis, C., Mavromatis, K., Tzanodaskalaki, M., Kokkinidis, M., and Bouriotis, V.
(2000). Alkaline phosphatase from the Antarctic strain TAB5. Eur. J. Biochem., 267(4):
1230-1238.
Roberts, J. R. and Reigart, J. R. (2013). Recognition and management of pesticide poisonings.
(6th ed.). U.S Environmental Protection Agency. U.S. Government Printing Office:
Washington, DC, pp. 277.
Robles-Gonzalez, I. V., Fava, F. and Poggi-Varaldo, H. M. (2008). A review on slurry
bioreactors for bioremediation of soils and sediments. Microb. Cell Fact., 7(5): 1-16.
doi:10.1186/1475-2859-7-5.
Rokade, K. B. and Mali, G. V. (2013). Biodegradation of chlorpyrifos by Pseudomonas
desmolyticum NCIM 2112. Int. J. Pharm. Bio. Sci., 4(2): 609-616.
Rosbero, T. M. S. and Camacho, D. H. (2017). Green preparation and characterization of
tentacle-like silver/copper nanoparticles for catalytic degradation of toxic chlorpyrifos
in water. J. Environ. Chem. Eng., 5(3): 2524-2532.
Rotenberg, S. A., and Brautigan, D. L. (1987). Membrane protein phosphotyrosine phosphatase
in rabbit kidney. Proteolysis activates the enzyme and generates soluble catalytic
fragments. Biochem. J., 243(3): 747-754.
Sabourmoghaddam, N., Zakaria, M. P. and Omar, D. (2015). Evidence for the microbial
degradation of imidacloprid in soils of Cameron Highlands. J. Saudi Soc. Agric, Sci.,
14(2): 182-188.
Sakurai, M., Wasaki, J., Tomizawa, Y., Shinano, T. and Osaki, M. (2008). Analysis of bacterial
communities on alkaline phosphatase gene in soil supplied with organic matter. Soil
Sci. Plant Nutr., 54(1): 62-71.
Salam, L. B., Ilori, M. O. and Amund, O. O. (2015). Carbazole degradation in the soil
microcosm by tropical bacterial strains. Braz. J. Microbiol., 46(4): 1037-1044. doi:
10.1590/S1517-838246420140610.
Salem, A. B., Azzouz, S., Mougou, A., Salghi, R., Chaabane, H. and Fattouch, S. (2016).
Biochemical characterisation and bioremediation study of dimethoate and chlorpyrifos
tolerant bacterial strains isolated from an agricultural soil. J. New Sci. Agric.
Biotechnol., 33(3): 1901-1909.
Samuels, T. A and Obare, S. O. (2011). Advances in Analytical Methods for
Organophosphorus Pesticide Detection. Chapter 6. In: Pesticides in the Modern World
- Trends in Pesticides Analysis. (Stoytcheva, M. ed.). In Tech, pp. 526. DOI:
10.5772/701.

290
Sanchez-Hernandez, J. C., del Pino, J. N., Capowiez, Y., Mazzia, C. and Rault, M. (2018). Soil
enzyme dynamics in chlorpyrifos-treated soils under the influence of earthworms. Sci.
Total Environ., 612: 1407-1416.
Santos, V. M. R. D., Donnici, C. L., Costa, J. B. N. D. and Caixeiro, J. M. R. (2007).
Pentavalent organophosphorus compounds: history, synthetic preparation methods and
applications as insecticides and antitumor agents. Quim. Nova., 30(1):159-170.
Sasikala, C., Jiwal, S., Rout, P. and Ramya, M. (2012). Biodegradation of chlorpyrifos by
bacterial consortium isolated from agriculture soil. World J. Microbiol. Biotechnol.,
28(3): 1301-1308. doi 10.1007/s11274-011-0879-z.
Schenk, G., Mateen, I., Ng, T. K., Pedroso, M. M., Mitić, N., Jafelicci Jr, M. and Ollis, D. L.
(2016). Organophosphate-degrading metallohydrolases: Structure and function of
potent catalysts for applications in bioremediation. Coord. Chem. Rev., 317: 122-131.
Schirmann, J., Bourdauducq, P. (2002). "Hydrazine" In: Ullmann's Encyclopedia of Industrial
Chemistry. Wiley-VCH, Weinheim. doi:10.1002/14356007.
Schwalbe-Fehl, M. and Schmidt, E. (1986). Hoe 002960-14-C, triazophos, comparative
metabolism study in rats and dogs. Unpublished report No. CM048/85 from Hoechst
AG, Frankfurt am Main, Germany. Aventis document A32754. Submitted to WHO by
Aventis Crop Science, Frankfurt am Main,
Germany. http://www.inchem.org/pages/jmpr.html .
Scoy, A. V., Pennell, A. and Zhang, X. (2016). Environmental fate and toxicology of
dimethoate. Rev. Environ. Contam. Toxicol., 237: 53-70.
Selleck, C., Guddat, L. W., Ollis, D. L., Schenk, G. and Pedroso, M. M. (2017). High resolution
crystal structure of a fluoride-inhibited organophosphate-degrading metallohydrolase.
J. Inorg. Biochem., 177: 287-290.
Serdar, C. M., Gibson, D. T., Munnecke, D. M. and Lancaster, J. H. (1982). Plasmid
involvement in parathion hydrolysis by Pseudomonas diminuta. Appl. Environ.
Microbiol., 44(1): 246-249.
Serdar, C., Murdock, D. and Rohde, M. (1989). Parathion hidrolase gene from Pseudomonas
diminuta MG: subcloning, complete nucleotide sequence and expression of the mature
portion of the enzime in Escherichia coli. Nat. Biotechnol., 7(11): 1151-1155.
Shaer, I., Abdelbagi, A., Elmustafa, A., Ahmed, A. and Osama, G. (2013). Biodegradation of
pendimethalin by three strains of bacteria isolated from pesticides polluted soils. U. K.
J. Agric. Sci., 21(2): 233-252.
Shafiani, S., and Malik, A. (2003). Tolerance of pesticides and antibiotic resistance in bacteria
isolated from wastewater-irrigated soil. World J. Microbiol. Biotechnol., 19(9): 897-
901.
Shah, A. Q., Iqbal, S., Niazi, Z. (2008). Partial purification and characterization of intracellular
alkaline phosphatase from newly isolated strain of Bacillus subtilis KIBGE-HAS.
Internet J. Microbiol ., 7(1):1-6.
Shahbazkia, H. R., Sharifi, S. and Shareghi, B. (2010). Purification and kinetic study of bone
and liver alkaline phosphatase isoenzymes in the dog. Comp. Clin. Path., 19(1): 81-84.

291
Shaker, N., Abo-Donia, S., El-Shaheed, Y. and Ismail, A. (1988). Effect of lactic acid bacteria
and heat treatments on pesticides contaminated milk. Egypt. J. Dairy Sci., 16: 309-317.
Sharma, D., Sangha, G. K. and Khera, K. S. (2015). Triazophos-induced oxidative stress and
histomorphological changes in ovary of female Wistar rats. Pest. Biochem. Physiol.,
117: 9-18.
Sharma, S., Singh, B. and Gupta, V. K. (2014). Assessment of imidacloprid degradation by
soil-isolated Bacillus alkalinitrilicus. Environ. Monit. Assess., 186(11): 7183-7193.
Shelobolina, E. S., Sullivan, S. A., O'Neill, K. R., Nevin, K. P. and Lovley, D. R. (2004).
Isolation, characterization, and U (VI)-reducing potential of a facultatively anaerobic,
acid-resistant bacterium from Low-pH, nitrate-and U (VI)-contaminated subsurface
sediment and description of Salmonella subterranea sp. nov. Appl. Environ. Microbiol.,
70(5): 2959-2965.
Shelton, D.R. and Somich, C.J. (1988). Isolation and identification of coumaphos metabolizing
bacteria from cattle dip. AppI. Environ. Microbiol., 54: 2566-2571.
Shi, Y. H., Ren, L., Jia, Y. and Yan, Y. C. (2015). Genome sequence of organophosphorus
pesticide-degrading bacterium Pseudomonas stutzeri strain YC-YH1. Genome
announc., 3(2): e00192-15.
Shinde, S. R., Bhailume, M. V., Patil, N. B., Patil, N. N. and Hamde, V. S. (2015). Screening,
characterization and identification of soil isolates for degradation of organophosphorus
group of pesticides (Dimethoate and Parathion). Int. J. Curr. Microbiol. App. Sci., 2:
240-244.
Siddique, T., Okeke, B. C., Arshad, M. and Frankenberger, W. T. (2003). Biodegradation
kinetics of endosulfan by Fusarium ventricosum and a Pandoraea species. J. Agric.
Food Chem., 51(27): 8015-8019. doi: 10.1021/jf030503z.
Silva, A. A. L., Pereira, M. P., Filho, R. G. S., Hofer, E. (2007). Utilization of phenol in the
presence of heavy metals by metal-tolerant nonfermentative Gram-negative bacteria
isolated from wastewater. Rev. Latinoam. Microbiol., 49(3–4): 68–73.
Silva, N. A. D., Birolli, W. G., Seleghim, M. H. R. and Porto, A. L. M. (2013). Biodegradation
of the organophosphate pesticide profenofos by marine fungi. In: Applied
Bioremediation-Active and Passive Approaches. (Patil, Y. B and Rao, P. eds.). In Tech,
pp. 406. DOI: 10.5772/50859 Chapter 7.
Singh, B. K. (2009). Organophosphorus-degrading bacteria: ecology and industrial
applications. Nat. Rev. Microbiol., 7(2): 156.
Singh, B. K., Kuhad, R. C., Singh, A., Lal, R. and Tripathi, K. K. (1999). Biochemical and
molecular basis of pesticide degradation by microorganisms. Crit Rev Biotechnol.,
19(3): 197-225.
Singh, B. K., Walker, A. and Wright, D. J. (2006). Bioremedial potential of fenamiphos and
chlorpyrifos degrading isolates: influence of different environmental conditions. Soil
Biol. Biochem., 38(9): 2682-2693.
292
Singh, B. K., Walker, A., Morgan, J. A. W. and Wright, D. J. (2003). Effects of soil pH on the
biodegradation of chlorpyrifos and isolation of a chlorpyrifos-degrading bacterium.
Appl. Environ. Microbiol., 69(9): 5198-5206.
Singh, B. K., Walker, A., Morgan, J. A. W. and Wright, D. J. (2004). Biodegradation of
chlorpyrifos by Enterobacter strain B-14 and its use in bioremediation of contaminated
soils. Appl. Environ. Microbiol., 70(8): 4855-4863.
Singh, B.K and A. Walker. (2006). Microbial degradation of organophosphorus compounds.
FEMS.
Singh, D. K. (2008). Biodegradation and bioremediation of pesticide in soil: concept, method
and recent developments. Indian j. Microbiol., 48(1): 35-40.
Singh, D. P., Khattar, J. I. S., Nadda, J., Singh, Y., Garg, A., Kaur, N. and Gulati, A. (2011).
Chlorpyrifos degradation by the cyanobacterium Synechocystis sp. strain PUPCCC 64.
Environ. Sci. Pollut. Res., 18(8): 1351-1359. DOI 10.1007/s11356-011-0472-x.
Singh, P. B., Sharma, S., Saini, H. S. and Chadha, B. S. (2009). Biosurfactant production by
Pseudomonas sp. and its role in aqueous phase partitioning and biodegradation of
chlorpyrifos. Lett Appl Microbiol., 49(3): 378-383.
Smegal, D. C. (2000). Human Health Risk Assessment. Chlorpyrifos. US Environmental
Protection Agency, Office of Prevention, Pesticides and Toxic Substances, Office of
Pesticide Programs, Health Effects Division, US Government Printing Office:
Washington, DC, USA, pp. 1-131.
Solomon, K. R., Williams, W. M., Mackay, D., Purdy, J., Giddings, J. M. and Giesy, J. P.
(2014). Properties and uses of chlorpyrifos in the United States. In: Ecological Risk
Assessment for Chlorpyrifos in Terrestrial and Aquatic Systems in the United States.
Springer, Cham, pp. 13-34.
Soni, R., Khanna, A., Gokhale, M. and Gautam, D. (2016). A study of the toxicity of
dimethoate on human lymphocytes and the ameliorative effect of root extract of
Oroxylum indicum (L.) Vent. Pharm. Biol. Eval., 3(4): 424-430.
Stone M. M. and Plante A. F. (2014). Changes in phosphatase kinetics with soil depth across a
variable tropical landscape. Soil Biol. Biochem., 71: 61–67.
Supreeth, M. and Raju, N. S. (2016). Bio-mineralization of organophosphorous insecticide-
chlorpyrifos and its hydrolyzed product 3, 5, 6-trichloro-2-pyridinol by Staphylococcus
Sp. ES-2. Curr. World Environ., 11(2): 486-491.
Suratman, S., Edwards, J. W. and Babina, K. (2015). Organophosphate pesticides exposure
among farmworkers: pathways and risk of adverse health effects. Rev. Environ. health.,
30(1): 65-79.
Talwar, M. P., Mulla, S. I. and Ninnekar, H. Z. (2014). Biodegradation of organophosphate
pesticide quinalphos by Ochrobactrum sp. strain HZM. J. Appl. Microbial., 117(5):
1283-1292.
Tamura, K., Stecher, G., Peterson, D., Filipski, A., and Kumar, S. (2013). MEGA6: molecular
evolutionary genetics analysis version 6.0. Mol. Biol. Evol., 30(12): 2725-2729.
293
Tang, M. and You, M. (2012). Isolation, identification and characterization of a novel
triazophos-degrading Bacillus sp. (TAP-1). Microbiol. Res., 167(5), 299-305.
Tang, X., Yang, Y., Huang, W., McBride, M. B., Guo, J., Tao, R. and Dai, Y. (2017).
Transformation of chlorpyrifos in integrated recirculating constructed wetlands
(IRCWs) as revealed by compound-specific stable isotope (CSIA) and microbial
community structure analysis. Bioresource Technol., 23: 264-270.
Tano-Debrah, K., Fukuyama, S., Otonari, N., Taniguchi, F. and Ogura, M. (1999). An
inoculum for the aerobic treatment of wastewaters with high concentrations of fats and
oils. Bioresour. Technol., 69(2): 133-139.
Tette, P. A. S., Guidi, L. R., de Abreu Glória, M. B. and Fernandes, C. (2016). Pesticides in
honey: A review on chromatographic analytical methods. Talanta., 149: 124-141.
Thabit, T. M. and El-Naggar, M. A. (2014). Potential impact of some soil borne fungi on
biodegradation of some organophosphorous nematicides. Am. J. Environ. Protection.,
3(6): 299-304.
Thapar, S., Bhushan, R. and Mathur, R. P. (1995). Degradation of organophosphorus and
carbamate pesticides in soils—HPLC determination. Biomed. Chromatogr., 9(1): 18-
22.
Tharakan, J. P. and Gordon, J. A. (1999). Co-metabolic biotransformation of trinitrotoluene
(tnt) supported by aromatic and non-aromatic co-substrates. Chemosphere.,
38(6):1323-1330. doi:10.1016/S0045-6535(98)00533-5.
Thengodkar, R. R. M. and Sivakami, S. (2010). Degradation of chlorpyrifos by an alkaline
phosphatase from the cyanobacterium Spirulina platensis. Biodegradation., 21(4): 637-
644. doi 10.1007/s10532-010-9331-6.
Theriot, C. M. and Grunden, A. M. (2011). Hydrolysis of organophosphorus compounds by
microbial enzymes. Appl. Microbiol. Biotechnol., 89(1): 35-43.
Thomas, G. W. (1996). Soil pH and soil acidity. (Chapter 16). In: Methods of Soil Analysis
Part 3—Chemical Methods. Soil science society of America, Madison USA, pp. 475-
490.
Tomlin, C. D. S. (2009). The Pesticide Manual, A World Compendium. (15th ed.) British Crop
Protection Council, Alton, Hampshire, UK. pp.1457.
Turner, N. W., Bramhmbhatt, H., Szabo-Vezse, M., Poma, A., Coker, R. and Piletsky, S. A.
(2015). Analytical methods for determination of mycotoxins: An update (2009–2014).
Analytica chimica acta., 901: 12-33.
Tuzimski, T. and Sherma, J. (2015). High performance liquid chromatography versus other
modern analytical methods for determination of pesticides. In: High Performance
Liquid Chromatography in Pesticide Residue Analysis. CRC Press, PP: 582.
Tyagi, R. D. (1991). Biological treatment of petroleum refinery wastewater. In: Biological
degradation of wastes. (Martin, A. M. ed.). Springer Netherlands, pp. 419.
294
Ueno, A., Hasanuzzaman, M., Yumoto, I. and Okuyama, H. (2006). Verification of degradation
of n-alkanes in diesel oil by Pseudomonas aeruginosa strain WatG in soil microcosms.
Curr. Microbiol., 52(3): 182-185.
US EPA. (2006). Interim Re-registration Eligibility Decision for Dimethoate. US EPA,
Washington DC 20460.
USDA (U. S. Department of Agriculture) Soil Conservation Service. (1990). SCS/ARS/CES
Pesticide Properties Database: Version 2.0 (Summary). USDA - Soil Conservation
Service, Syracuse, NY.
Verma, J. P., Jaiswal, D. K. and Sagar, R. (2014). Pesticide relevance and their microbial
degradation: a-state-of-art. Rev. Environ. Sci. Biotechnol., 13(4): 429-466.
Vermeire, T., MacPhail, R. and Waters, M. (2003). Integrated human and ecological risk
assessment: A case study of organophosphorous pesticides in the environment. Hum.
Ecol. Risk Assess., 9(1): 343-357.
Vijayalakshmi, P. and Usha, M. S. (2012). Optimization of chlorpyrifos degradation by
Pseudomonas putida. J. Chem. Pharm. Res., 4(5), 2532-2539.
Votchitseva, Y. A., Efremenko, E. N., Aliev, T. K. and Varfolomeyev, S. D. (2006). Properties
of hexahistidine-tagged organophosphate hydrolase. Biochem. (Mosc.)., 71(2): 167-
172.
Wagh, G. S., Chavhan, D. M. and Sayyed, M. R. G. (2013). Physicochemical analysis of soils
from eastern part of pune city. Univers. J. Environ. Res. Technol., 3(1): 93-99.
Wang, L., Zhang, L., Chen, H., Tian, Q. and Zhu, G. (2005). Isolation of a triazophos-degrading
strain Klebsiella sp. E6 effectively utilizing triazophos as sole nitrogen source. FEMS.
Microbiol. Lett., 253(2): 259–265.
Weinberg, R. A. and Zusman, D. R. (1990). Alkaline, acid, and neutral phosphatase activities
are induced during development in Myxococcus xanthus. J. Bacteriol., 172(5): 2294-
2302.
Williams, W. M., Giddings, J. M., Purdy, J., Solomon, K. R. and Giesy, J. P. (2014). Exposures
of aquatic organisms to the organophosphorus insecticide, chlorpyrifos resulting from
use in the United States. In: Ecological risk assessment for chlorpyrifos in terrestrial
and aquatic systems in the United States. Springer, Cham, pp. 77-117.
Wojciechowski, C. L., Cardia, J. P. and Kantrowitz, E. R. (2002). Alkaline phosphatase from
the hyperthermophilic bacterium T. maritima requires cobalt for activity. Protein Sci.,
11(4): 903–911. doi: 10.1110/ps.4260102.
Wu, H., Shen, J., Wu, R., Sun, X., Li, J., Han, W. and Wang, L. (2016). Biodegradation
mechanism of 1H-1, 2, 4-triazole by a newly isolated strain Shinella sp. NJUST26. Sci.
Rep., 6(29675): 1-10. doi:10.1038/srep29675.
Wu, J., Feng, Y., Dai, Y., Cui, N., Anderson, B. and Cheng, S. (2016). Biological mechanisms
associated with triazophos (TAP) removal by horizontal subsurface flow constructed
wetlands (HSFCW). Sci. Total Environ., 553: 13-19.
295
Wu, L., Song, Y., Hu, M., Zhang, H., Yu, A., Yu, C. and Wang, Z. (2015). Application of
magnetic solvent bar liquid-phase microextraction for determination of
organophosphorus pesticides in fruit juice samples by gas chromatography mass
spectrometry. Food Chem., 176: 197-204.
Wu, S., Li, X., Liu, X., Yang, G., An, X., Wang, Q. and Wang, Y. (2018). Joint toxic effects
of triazophos and imidacloprid on zebrafish (Danio rerio). Environ. Pollut., 235: 470-
481.
Wu, X., Yang, X., Majumder, A., Swetenburg, R., Goodfellow, F. T., Bartlett, M. G. and Stice,
S. L. (2017). Astrocytes are Protective against Chlorpyrifos Developmental
Neurotoxicity in Human Pluripotent Stem Cell-Derived Astrocyte-Neuron Cocultures.
Toxicol. Sci., 157(2).
Xiao, H. P, Cheng, S. P., Wu, Z. B. (2010) Microbial community variation in phytoremediation
of triazophos by Canna indica Linn. In a hydroponic system. J. Environ. Sci., 22(8):
1225–1231.
Xu, F., Garcia-Bermejo, Á., Malarvannan, G., Gómara, B., Neels, H. and Covaci, A. (2015).
Multi-contaminant analysis of organophosphate and halogenated flame retardants in
food matrices using ultrasonication and vacuum assisted extraction, multi-stage cleanup
and gas chromatography–mass spectrometry. J. Chromatogr A., 1401: 33-41.
Xu, G., Li, Y., Zheng, W., Peng, X., Li, W. and Yan, Y. (2007). Mineralization of chlorpyrifos
by co-culture of Serratia and Trichosporon spp. Biotechnol. lett,, 29(10): 1469-1473.
Xu, G., Zheng, W., Li, Y., Wang, S., Zhang, J. and Yan, Y. (2008). Biodegradation of
chlorpyrifos and 3, 5, 6-trichloro-2-pyridinol by a newly isolated Paracoccus sp. strain
TRP. Int. Biodeterior. Biodegradation., 62(1): 51-56.
Xu, Y. X., Feng, Z. Z., Lu, P., Zhang, J., Li, S. P. and Huang, X. (2009). Isolation and
characterization of capable of degrading parathion-methyl bacterium
Stenotrophomonas sp. PF32. Chin. J. Pestic. Sci., 3: 329–334.
Yale, R. L., Sapp, M., Sinclair, C. J. and Moir, J. W. B. (2017). Microbial changes linked to
the accelerated degradation of the herbicide atrazine in a range of temperate soils.
Environ. Sci. Pollut. Res. Int., 24(8): 7359-7374. doi: 10.1007/s11356-017-8377-y.
Yanez-Ocampo, G., Sanchez-Salinas, E., Jimenez-Tobon, G. A., Penninckx, M. and Ortiz-
Hernandez, M. L. (2009). Removal of two organophosphate pesticides by a bacterial
consortium immobilized in alginate or tezontle. J. Hazard. Mater., 168(2-3): 1554-
1561.
Yang, C., Cai, N., Dong, M., Jiang, H., Li, J., Qiao, C. and Chen, W. (2008). Surface display
of MPH on Pseudomonas putida JS444 using ice nucleation protein and its application
in detoxification of organophosphates. Biotechnol. Bioeng., 99(1): 30-37.
Yang, C., Li, R., Song, Y., Chen, K., Li, S. and Jiang, J. (2011). Identification of the
biochemical degradation pathway of triazophos and its intermediate in Diaphorobacter
sp. TPD-1. Curr. Microbiol., 62(4): 1294-1301. doi 10.1007/s00284-010-9859-z.
296
Yang, C., Liu, N., Guo, X. and Qiao, C. (2006). Cloning of mpd gene from a chlorpyrifos-
degrading bacterium and use of this strain in bioremediation of contaminated soil.
FEMS. Microbiol. Lett., 265(1): 118-125.
Yang, H., Carr, P. D., McLoughlin, S. Y., Liu, J. W., Horne, I., Qiu, X. and Ollis, D. L. (2003).
Evolution of an organophosphate-degrading enzyme: a comparison of natural and
directed evolution. Protein Eng., 16(2): 135-145.
Yang, L., Zhao, Y. H., Zhang, B. X., Yang, C. H. and Zhang, X. (2005). Isolation and
characterization of a chlorpyrifos and 3, 5, 6-trichloro-2-pyridinol degrading bacterium.
FEMS. Microbiol. Lett., 251(1): 67-73.
Yang, M., Yu, T., Wang, C., Sun, H., Liu, J. and Wu, Z. (2016). Isolation and identification of
bacteria degrading soy lecithin and dimethoate and comparision of enzyme activities.
J. S. China Agric. Univ., 37(2): 65-72.
Yu, Y. L., Fang, H., Wang, X., Wu, X. M., Shan, M. and Yu, J. Q. (2006). Characterization of
a fungal strain capable of degrading chlorpyrifos and its use in detoxification of the
insecticide on vegetables. Biodegradation., 17(5): 487-494.
Zabar, R., Sarakha, M., Lebedev, A. T., Polyakova, O. V. and Trebse, P. (2016). Photochemical
fate and photocatalysis of 3, 5, 6-trichloro-2-pyridinol, degradation product of
chlorpyrifos. Chemosphere., 144: 615-620.
Zappa, S., Rolland, J. L., Flament, D., Gueguen, Y., Boudrant, J. and Dietrich, J. (2001).
Characterization of a highly thermostable alkaline phosphatase from the euryarchaeon
Pyrococcus abyssi. Appl. Env. Microbiol., 67(10): 4504-4511.
Zeinat, K. M., Nashwa, A. H., Mohamed, A. I. and Sherif, E. N. (2008). Biodegradation and
detoxification of malathion by of Bacillus thuringiensis MOS-5. Aus. J. Basic Appl.
Sci., 2(3): 724-732.
Zhang, H., Li, Q., Guo, S. H., Cheng, M. G., Zhao, M. J., Hong, Q. and Huang, X. (2016).
Cloning, expression and mutation of a triazophos hydrolase gene from Burkholderia
sp. SZL-1. FEMS. Microbiol. lett., 363(11): 1-7.
https://doi.org/10.1093/femsle/fnw108.
Zhang, J., Yin, J. G., Hang, B. J., Cai, S., He, J., Zhou, S. G. and Li, S. P. (2012). Cloning of a
novel arylamidase gene from Paracoccus sp. strain FLN-7 that hydrolyzes amide
pesticides. Appl. Environ. Microbiol., 78(14): 4848-4855.
Zhang, J., Zheng, J. W., Liang, B., Wang, C. H., Cai, S., Ni, Y. Y. and Li, S. P. (2011).
Biodegradation of chloroacetamide herbicides by Paracoccus sp. FLY-8 in vitro. J.
Agric. Food Chem., 59(9): 4614-4621.
Zhang, Y. H., Xu, D., Liu, J. Q. and Zhao, X. H. (2014). Enhanced degradation of five
organophosphorus pesticides in skimmed milk by lactic acid bacteria and its potential
relationship with phosphatase production. Food Chem., 164: 173-178.
Zhang, J., Presley, G. N., Hammel, K. E., Ryu, J. S., Menke, J. R., Figueroa, M. and Schilling,
J. S. (2016). Localizing gene regulation reveals a staggered wood decay mechanism for
the brown rot fungus Postia placenta. Proc. Natl. Acad. Sci., 113(39): 10968-10973.

297
Zhao, L., Wang, F. and Zhao, J. (2014). Identification and functional characteristics of
chlorpyrifos‐degrading and plant growth promoting bacterium Acinetobacter
calcoaceticus. J. basic Microbiol., 54(5): 457-463.
Zhong, W. J., Ying, X. P., Ma, G. Y., Xiao, P. and Dong, J. W. (2005). Differential Genes
Expression Analysis of Liver in Rats Exposed to Triazophos Using Oligonucleotide
Microarrays. J. Labour Med., 22(5): 395–398.
Zhong, Z., Liu, Q., Gu, B. Q., Liu, S. Z., Guo, Y. M. and Chen, X. C. (2006). GC determine
the triazophos pesticides residual in aquatic product. J. Zhejiang Ocean Univ. (Nat.
Sci.)., 25(2): 196–199.
Zhu, B., Gong, Y. X., Liu, L., Li, D. L., Wang, Y., Ling, F. and Wang, G. X. (2014). Toxic
effects of triazophos on rare minnow (Gobiocypris rarus) embryos and larvae.
Chemosphere., 108: 46-54.
298
299
300
301