bios 230 lecture title
TRANSCRIPT

BIOS 230Properties of Populations
Lecture #21

Ecology
• Ecology is the scientific study of the distribution and abundance of organisms and the interactions that determine distribution and abundance.
Evolution provides the mechanism (natural selection) that explains why and how adaptation occurs
Ecology demonstrates how adaptations that arose by natural selection explain the distribution and abundance of organisms
Ecology and Evolution are Closely Connected

• The interactions that determine an organism's distribution and abundance include energy flow, growth, reproduction, predation, competition and many others.
• Biotic: living interactions• Abiotic: nonliving (physical and chemical) interactions
Ecology

Introduction to Ecology
• Biotic components:– Spruce trees, mosses,
understory layer, bacteria & fungi, bald eagle
• Abiotic components:– Sunlight, Nutrients, Water
• Ecosystems include many complex interactions
Spruce forest in coastal SE Alaska

The Hierarchy of Ecological Systems
Individual
Population
Community
Ecosystem
Landscape
Biome
Biosphere

Individual
Ramets and Genets
Is an individual a rametor a genet? Is the population size the number of ramets or genets?

Individual
Population
Community
Ecosystem
Landscape
Biome
Biosphere
A group of individuals of the same species that occupy a given area
Populations of different species interacting within an ecosystem
Incorporates biotic and abiotic components
An area of land or water composed of a patchwork of communities and ecosystems
A geographic region with similar geological and climatic conditions
The thin layer surrounding the Earth that supports all of life

Populations
• A population is a group of individuals of the same species that inhabit a given area– There is a potential for interbreeding among members of the
population (focus of Evolution)– Populations have sizes and spatial distributions that can be
characterized in different ways (focus of Ecology)

Populations
• Key characteristics:– Abundance– Density– Dispersion– Proportion of individuals of
various ages and stages– Birth, death, and movement of
individuals Monarch Butterfly Danaus plexippus

Population Distributions
• The distribution of a species or population describes its spatial location– Influenced by the occurrence of suitable environmental conditions– Influenced by interactions with other species– Different ways to describe distribution
• The broadest description of distribution is geographic range. Geographic range is the area that encompasses all individuals of a species
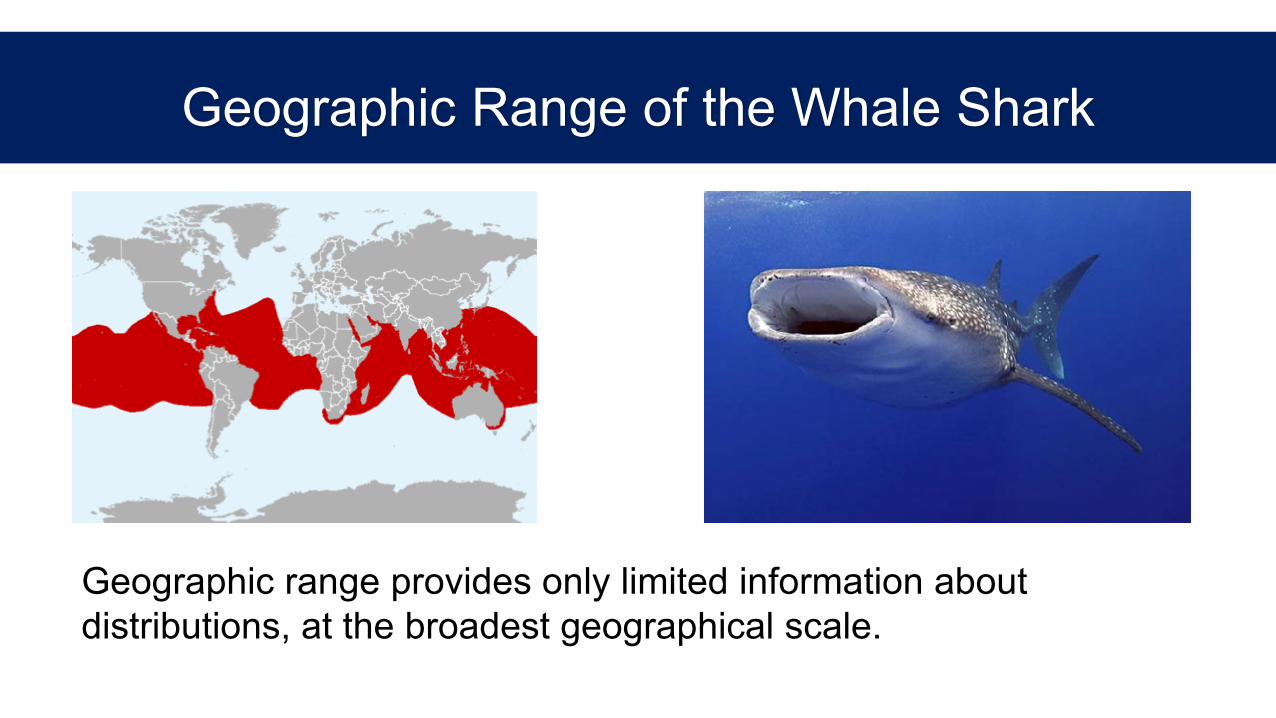
Geographic Range of the Whale Shark
Geographic range provides only limited information about distributions, at the broadest geographical scale.

Geographic Range of Orangutan
• Historical distribution throughout Southeast Asia, southern China and on the island of Java.
• Current distribution only on islands of Borneo and Sumatra
• Tropical rainforests at altitudes of less than 3,281 feet above sea level.
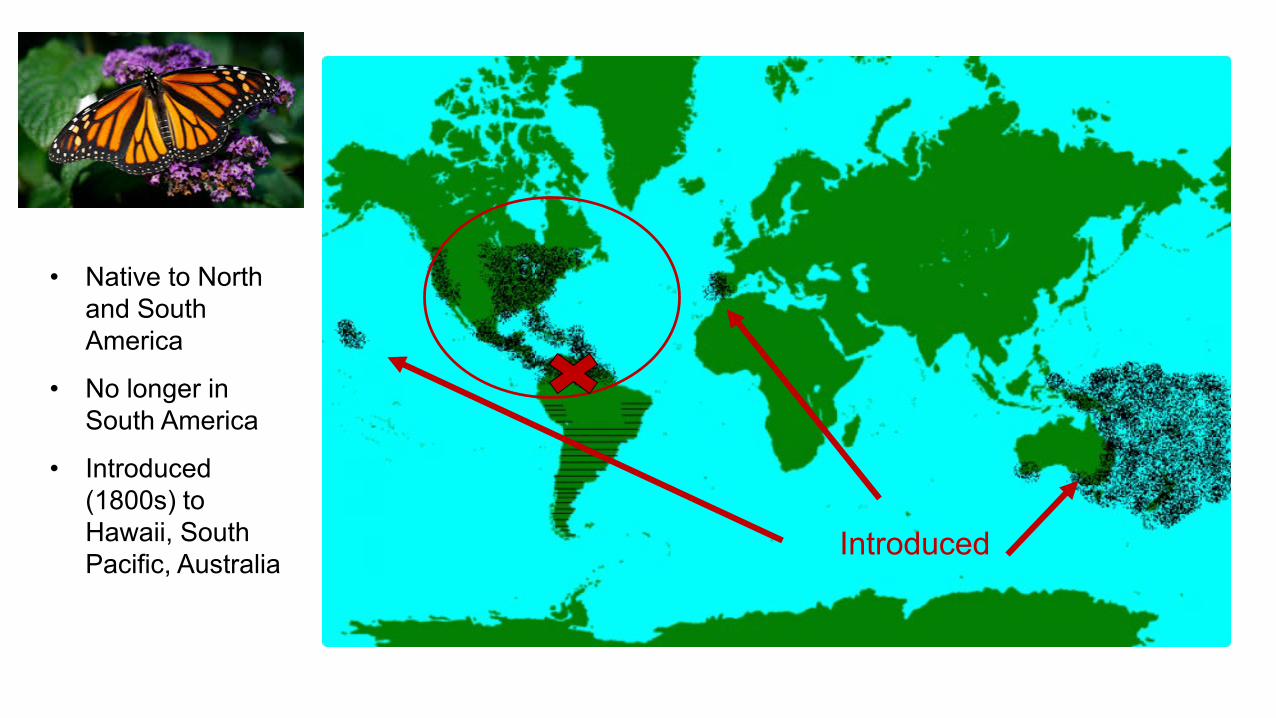
• Native to North and South America
• No longer in South America
• Introduced (1800s) to Hawaii, South Pacific, Australia
Introduced

Population Distributions
• Individuals are not distributed evenly throughout their geographic range
• Individuals can only occupy areas that can meet their requirements
• Many factors influence distributions within the geographic range

Population Distributions• Crude density is simply the
number of individuals per unit area
• But population density can vary from location to location
Density = 5 individuals/m2 Density =
2 individuals/m2
Density = 0 individuals/m2
A hypothetical population with uneven distribution
Abundance = total number of individuals
(red dots)

Population Distributions
• Dispersion refers to the evenness of the population's distribution through space. There are three population disperson patterns– Random—an individual’s position is independent of others– Uniform—results from negative interaction among individuals– Aggregated (or clumped)—results from patchy resources, social groupings

Uniformly distributed shrubs in the Kara Kum desert of central Asia

Population Distributions
• Spatial distributions may vary at different spatial scales– The shrub Euclea in the savanna ecosystems of Southern Africa
are clumped under Acacia trees, – The Acacia trees are uniformly spaced– Spatial pattern of Euclea is aggregated at one scale and uniform
at another scale

Spatial distribution of Euclea divinorum in African savannas. Individuals are aggregated under the canopy of Acacia trees, which are uniformly distributed themselves.

Population Abundance
• Abundance is the number of individuals in the population and defines its size
• Abundance is a function of:– Population density, or the number of individuals per unit area– The area over which the population is distributed

Estimating Abundance
• Abundance can rarely be directly measured
• In most cases, abundance must be estimated by sampling a portion of the population
• Sampling methods for plants and sessile animals– Counting the organisms in a subsample (quadrats)– Abundance estimates may be skewed by a clumped spatial
distribution

Estimating Abundance - Plants
Abundance estimates may be skewed by an aggregated (clumped) spatial distribution

Estimating Abundance for Mobile Animals: Mark-Recapture Method
• Want to know N, total population size
• Capture animals and mark them, release back to population
• Wait, let animals re-assimilate into population
• Now capture new sample and count the number marked
• Assume that the ratio of marked to sampled individuals in second sample represents the ratio for entire population

• Capture 100 robins, mark and release all, wait• Capture new sample of 50 birds; 10 are marked• Marked ratio is 10/50• In whole population we marked 100 out of N, or 100/N• So 10/50 = 100/N• N=500
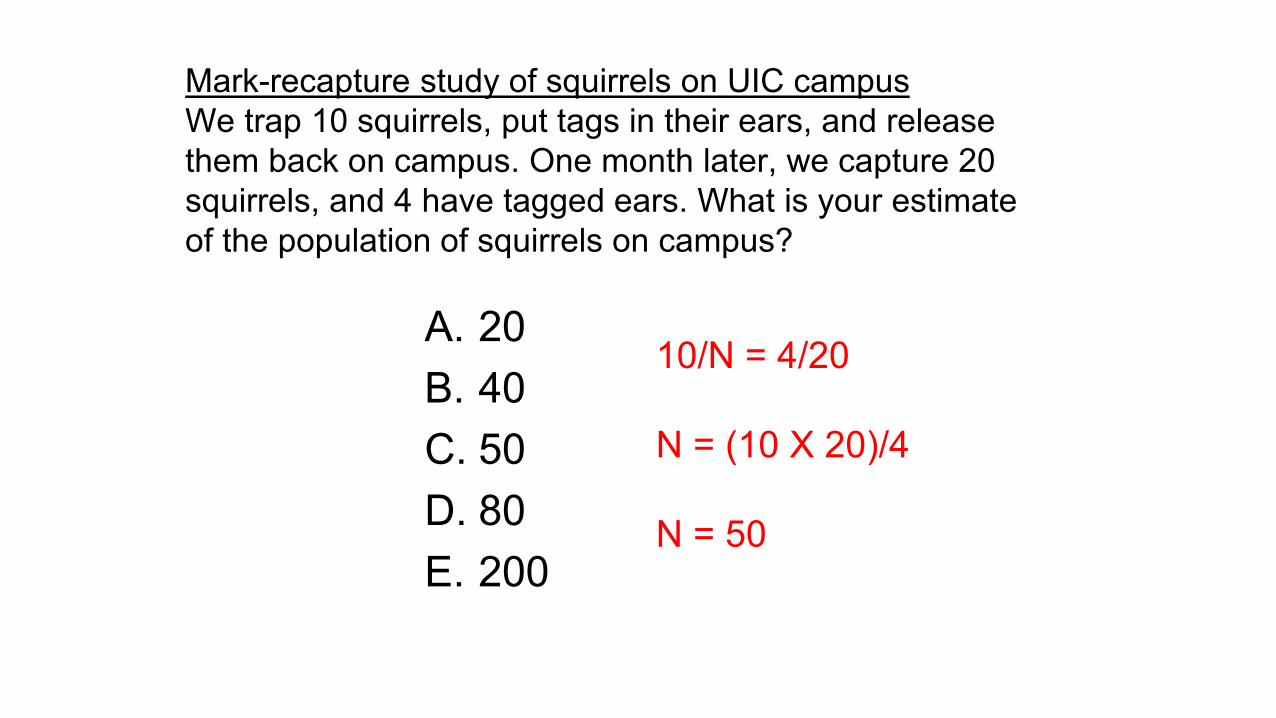
Mark-recapture study of squirrels on UIC campusWe trap 10 squirrels, put tags in their ears, and release them back on campus. One month later, we capture 20 squirrels, and 4 have tagged ears. What is your estimate of the population of squirrels on campus?
A. 20B. 40C. 50D. 80E. 200
10/N = 4/20
N = (10 X 20)/4
N = 50