biosensor-based approach identifies four distinct calmodulin
TRANSCRIPT
Biosensor-Based Approach Identifies Four DistinctCalmodulin-Binding Domains in the G Protein-CoupledEstrogen Receptor 1Quang-Kim Tran*, Mark VerMeer
Department of Physiology & Pharmacology, Des Moines University Osteopathic Medical Center, Des Moines, Iowa, United States of America
Abstract
The G protein-coupled estrogen receptor 1 (GPER) has been demonstrated to participate in many cellular functions, but itsregulatory inputs are not clearly understood. Here we describe a new approach that identifies GPER as a calmodulin-bindingprotein, locates interaction sites, and characterizes their binding properties. GPER coimmunoprecipitates with calmodulin inprimary vascular smooth muscle cells under resting conditions, which is enhanced upon acute treatment with either specificligands or a Ca2+-elevating agent. To confirm direct interaction and locate the calmodulin-binding domain(s), we designed aseries of FRET biosensors that consist of enhanced cyan and yellow fluorescent proteins flanking each of GPER’ssubmembrane domains (SMDs). Responses of these biosensors showed that all four submembrane domains directly bindcalmodulin. Modifications of biosensor linker identified domains that display the strongest calmodulin-binding affinities andlargest biosensor dynamics, including a.a. 83–93, 150–175, 242–259, 330–351, corresponding respectively to SMDs 1, 2, 3,and the juxta-membranous section of SMD4. These biosensors bind calmodulin in a strictly Ca2+-dependent fashion andwith disparate affinities in the order SMD2.SMD4.SMD3.SMD1, apparent Kd values being 0.4460.03, 1.4060.16,8.0160.29, and 136.6266.56 mM, respectively. Interestingly, simultaneous determinations of biosensor responses andsuitable Ca2+ indicators identified separate Ca2+ sensitivities for their interactions with calmodulin. SMD1-CaM complexesdisplay a biphasic Ca2+ response, representing two distinct species (SMD1 sp1 and SMD1 sp2) with drastically different Ca2+
sensitivities. The Ca2+ sensitivities of CaM-SMDs interactions follow the order SMD1sp1.SMD4.SMD2.SMD1sp2.SMD3,EC50(Ca2+) values being 0.1360.02, 0.7560.05, 2.3860.13, 3.7160.13, and 5.1560.25 mM, respectively. These data indicatethat calmodulin may regulate GPER-dependent signaling at the receptor level through multiple interaction sites. FRETbiosensors represent a simple method to identify unknown calmodulin-binding domains in G protein-coupled receptorsand to quantitatively assess binding properties.
Citation: Tran Q-K, VerMeer M (2014) Biosensor-Based Approach Identifies Four Distinct Calmodulin-Binding Domains in the G Protein-Coupled EstrogenReceptor 1. PLoS ONE 9(2): e89669. doi:10.1371/journal.pone.0089669
Editor: Karl-Wilhelm Koch, University of Oldenburg, Germany
Received November 13, 2013; Accepted January 22, 2014; Published February 21, 2014
Copyright: � 2014 Tran, VerMeer. This is an open-access article distributed under the terms of the Creative Commons Attribution License, which permitsunrestricted use, distribution, and reproduction in any medium, provided the original author and source are credited.
Funding: This work was supported by National Institutes of Health grant HL112184 to Q-K Tran. The funder had no role in study design, data collection andanalysis, decision to publish, or preparation of the manuscript.
Competing Interests: The authors have declared that no competing interests exist.
* E-mail: [email protected]
Introduction
Plasma estrogen concentrations are closely related to cardio-
vascular health. Along with menopause comes a substantial
increase in the risk of cardiovascular diseases [1,2]. Estrogen
modulates gene expression, growth, development and immune
responses, and has many cardiovascular protective effects. The
actions of estrogen are extensive and include effects that are both
dependent and independent of transcriptional activities [3,4]. The
mechanisms underlying these effects are still far from being
completely understood [5,6]. Indeed, two classical estrogen
receptors, ERa and ERb, which function as transcriptional factors
that bind estrogen responsive elements in promoters of target
genes [3], were thought to be totally responsible for estrogen’s
effects. However, a novel G protein-coupled receptor, GPR30,
was cloned around 1997 as an orphan receptor [7–11], and was
demonstrated to be an estrogen receptor in 2005 [12,13]. It was
subsequently termed G protein-coupled estrogen receptor 1
(GPER) by International Union of Basic and Clinical Pharmacol-
ogy (IUPHAR). GPER has since been shown to be involved in
many cellular activities, including Ca2+ mobilization [13,14],
cAMP production [12,14], activation of protein kinases [13,15],
and activation of transcription [16–19]. Clarifying the regulation
of GPER and related pathways will enhance our knowledge of
how estrogen works and provide grounds to target estrogen
receptor subtypes for preventive and therapeutic purposes.
Calmodulin (CaM) is a highly conserved 148-a.a. protein that
contains four EF-hand Ca2+-binding motifs. Ca2+-bound CaM has
a dumbbell conformation with two EF-hand motifs on either end
connected by a central helix. This central helix functions as a
tether that is bent upon target interaction while the two lobes exert
concerted effects [20]. Ca2+ binding exposes hydrophobic patches,
promoting CaM’s interaction with its target proteins. In this
fashion, CaM is the ubiquitous transducer of cellular Ca2+ signals
and is involved in virtually all aspects of cellular functions due to its
interaction with and requirement for the activities of hundreds of
target proteins [21–23]. The expression of CaM fluctuates with
cell cycle [24], but has been shown to be insufficient to saturate all
targets’ binding sites in a significant number of cell types, including
vascular endothelial cells [25,26], smooth muscle cells [27], and
PLOS ONE | www.plosone.org 1 February 2014 | Volume 9 | Issue 2 | e89669
cardiomyocytes [28,29]. This insufficiency of CaM has been
demonstrated to generate functional coupling among its targets
due simply to competition for CaM [25,26], and suggests that
factors controlling CaM expression and dynamics can vastly alter
cellular functions.
G protein-coupled receptors (GPCRs) represent a superfamily
of cell surface proteins that convey extracellular inputs to vast
changes in cellular functions via dynamic associations with
heterotrimeric G proteins and numerous other partners at their
submembrane domains. Recently, CaM has been demonstrated to
interact with a number of G protein-coupled receptors (GPCRs),
such as the metabotropic glutamate receptors mGluR1 and
mGluR5 [30,31], the opioid m receptor [32], the parathyroid
hormone receptor 1 [33], the 5-HT(2C) and 5-HT(1A) receptors
[34,35], the D2 dopamine receptor [36], and the angiotensin II
receptor type 1A [37,38]. In the case of the 5HT(1A) receptor,
CaM binding to the third submembrane domain alters the
receptor’s phosphorylation or interaction with G protein subunit(s)
[35], while for the 5-HT(2C) receptor, CaM binding to the C
terminal tail has been demonstrated to be important for b-arrestin
recruitment and for receptor-operated extracellular signal-regu-
lated kinase [39]. Nevertheless, the roles of CaM in GPCR biology
at the receptor level is still not entirely clear. Part of the reason for
this is the lack of an approach to exhaustively identify all
interaction sites for CaM on a GPCR. For example, a CaM-
binding domain in the juxtamembrane region of the cytoplasmic
tail of the angiotensin II receptor type 1A was first identified in
1999 using a peptide deduced from a sequence-based comparison
with known CaM-binding motifs [37]. More than a decade later,
another CaM-binding domain in the third submembrane domain
in the same receptor was recently identified using a similar
approach [38]. In addition, while the interactions between CaM
and these GPCRs are Ca2+-dependent, information regarding the
specific Ca2+ sensitivities of these interactions is lacking. Knowl-
edge of the Ca2+ sensitivities of GPCR-CaM interactions will be of
value in determining the roles of CaM interaction with each
submembrane domain at different physiological scenarios in cells.
With respect to estrogen biology, it is completely unknown if
CaM plays a role GPER-dependent signaling. We have begun to
test the idea that CaM is directly involved in GPER-dependent
signaling in the vasculature at both the receptor level and
downstream effectors. In this paper, we describe a new approach
to identify GPER as a novel CaM-binding protein, locate all of its
CaM-binding domains, and determine their binding characteris-
tics including Kd and Ca2+ sensitivities. Using FRET-based
biosensors designed to scan all submembrane domains of GPER,
we identified up to four binding sites located each in submem-
brane domains 1, 2, 3 and 4 of GPER that have distinct binding
affinities for CaM. In addition, we simultaneously incorporated
these biosensors and suitable Ca2+ indicators in single assays to
precisely determine the Ca2+ sensitivities of the interactions
between CaM and these different domains in GPER. This
approach in turn revealed quite distinct sensitivities to Ca2+ of
the interactions between CaM and GPER’s submembrane
domains. Interestingly, submembrane domain 1 interacts with
CaM with biphasic Ca2+ dependency, representing two distinct
populations of complexes formed at drastically different free Ca2+
values that range from cytoplasmic resting levels to those that
occur during Ca2+ entry. The results demonstrate that FRET
biosensor-based screening is an effective and efficient approach to
identify unknown CaM-binding domains in GPCRs that allows for
highly quantitative assessment of their binding properties.
Materials and Methods
Ethics StatementThe protocol to isolate primary vascular smooth muscle cells
from porcine aortas (obtained commercially from a local slaughter
house) was approved by the Des Moines University Institutional
Biosafety Committee.
Cell Isolation and CultureDescending segments of porcine thoracic aortas were freshly
collected from a local slaughter house. Primary vascular smooth
muscle cells (VSMCs) were isolated from these aortas using a
modification of the methods published by Bolzon [40], Ulrich-
Merzenich [41], and Leik [42]. Briefly, endothelial cells were
initially completely removed by a sequence of mechanical
scraping, short enzyme incubation (0.02% collagenase, 0.1%
papain, and 4 mM dithiothreitol) and re-scraping. After rinsing in
sterile PBS, aortas were cut into rectangular strips and the luminal
surface was incubated with the same enzyme mix for 90 minutes.
The luminal surface was then scraped again, and cells from this
enzyme treatment and scraping were grown in M-199 containing
10% fetal bovine serum and 2% penicillin/streptomycin in 90%
humidified condition with 5% CO2 at 37uC for one week. This
procedure consistently yields highly homologous populations
VSMCs, verified by both morphological properties and smooth
muscle a-actin immunofluorescence staining. This protocol was
approved by Des Moines University Institutional Biosafety
Committee.
Co-immunoprecipitationCo-immunoprecipitation was performed using a Pierce immu-
noprecipitation kit (Rockford, IL) as per manufacturer’s instruc-
tions. The use of an amino-reactive resin in this approach prevents
the co-elution of the antibody heavy and light chains that may co-
migrate with the bands of the proteins of interest. Typically, 10 mL
of resin was conjugated with appropriate amounts of primary
antibody. After appropriate treatment, cell lysis was performed on
monolayer cells without trypsinization to avoid complications
having to do with shear during the process. Cells were lysed on ice
for 15 minutes and the lysate was centrifuged at 21,0006g for
5 min at 4uC. Following pre-clearing, the protein content of the
eluant was determined using the BCA assay (Pierce). One
milligram of total cellular proteins was then rocked with the
resin-antibody conjugates for 3 hours in 1-mL columns at 4uCprior to eluting. Following electrophoresis and transfer, mem-
branes were cut between the levels of the bait and the prey
proteins prior to incubation with separate primary antibodies
against CaM (EMD Millipore Corp., MA) and GPER (R&D
System, MN; GeneTex Inc., Irvine CA, or Santa Cruz Biotech,
CA).
Construction of Biosensors to Identify GPER’sCaM-binding Domains
Biosensors to screen for CaM-binding domains in GPER were
constructed based on the principle of fluorescent resonance energy
transfer (FRET). Sub-membrane domains (SMDs) 1–4 from
human GPER (Fig. 1A), corresponding to a.a. 83–93, 150–175,
242–259, 330–375, and shorter fragments of these domains were
PCR amplified from the human GPER cDNA (Genecopoeia Inc.,
Rockville, MD) and inserted between enhanced variants of cyan
and yellow fluorescent proteins as a donor–acceptor FRET pair.
We termed these biosensors BSGPERx, where x denotes the
amino acid numbering of the GPER insert between the
fluorophores. In total, the BSGPERx made were BSGPER83–93,
New Method to Locate CaM-Binding Domains in GPCRs
PLOS ONE | www.plosone.org 2 February 2014 | Volume 9 | Issue 2 | e89669
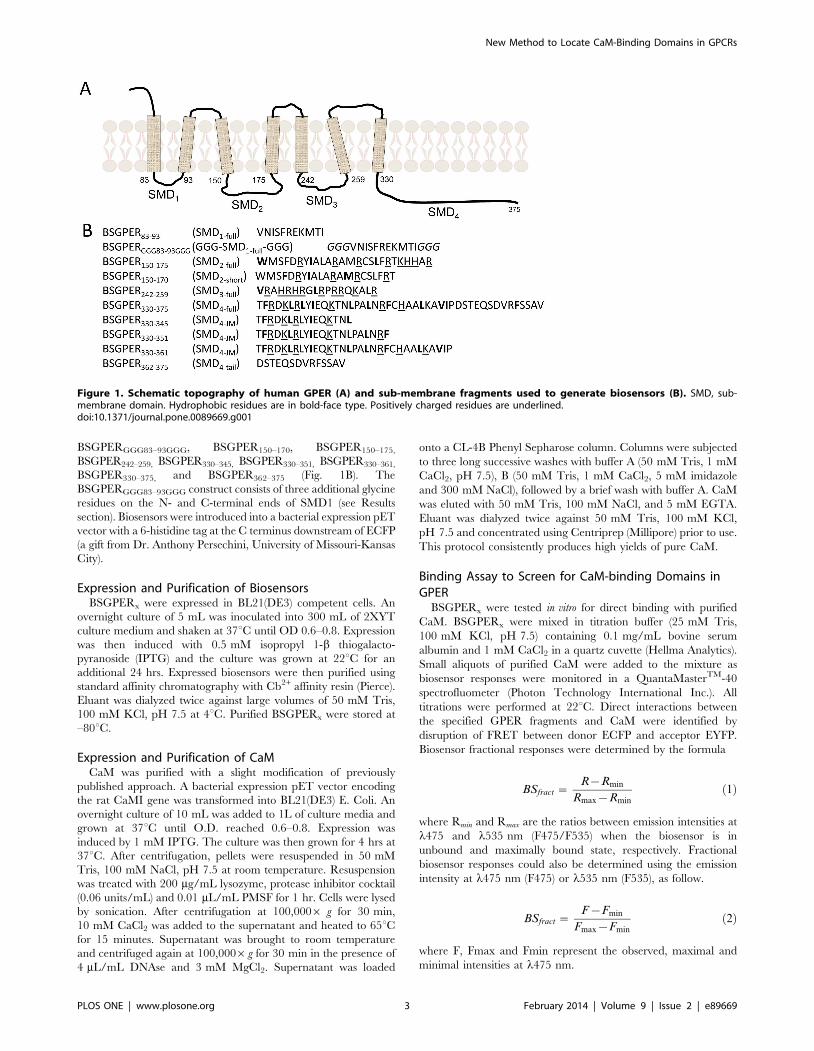
BSGPERGGG83–93GGG, BSGPER150–170, BSGPER150–175,
BSGPER242–259, BSGPER330–345, BSGPER330–351, BSGPER330–361,
BSGPER330–375, and BSGPER362–375 (Fig. 1B). The
BSGPERGGG83–93GGG construct consists of three additional glycine
residues on the N- and C-terminal ends of SMD1 (see Results
section). Biosensors were introduced into a bacterial expression pET
vector with a 6-histidine tag at the C terminus downstream of ECFP
(a gift from Dr. Anthony Persechini, University of Missouri-Kansas
City).
Expression and Purification of BiosensorsBSGPERx were expressed in BL21(DE3) competent cells. An
overnight culture of 5 mL was inoculated into 300 mL of 2XYT
culture medium and shaken at 37uC until OD 0.6–0.8. Expression
was then induced with 0.5 mM isopropyl 1-b thiogalacto-
pyranoside (IPTG) and the culture was grown at 22uC for an
additional 24 hrs. Expressed biosensors were then purified using
standard affinity chromatography with Cb2+ affinity resin (Pierce).
Eluant was dialyzed twice against large volumes of 50 mM Tris,
100 mM KCl, pH 7.5 at 4uC. Purified BSGPERx were stored at
–80uC.
Expression and Purification of CaMCaM was purified with a slight modification of previously
published approach. A bacterial expression pET vector encoding
the rat CaMI gene was transformed into BL21(DE3) E. Coli. An
overnight culture of 10 mL was added to 1L of culture media and
grown at 37uC until O.D. reached 0.6–0.8. Expression was
induced by 1 mM IPTG. The culture was then grown for 4 hrs at
37uC. After centrifugation, pellets were resuspended in 50 mM
Tris, 100 mM NaCl, pH 7.5 at room temperature. Resuspension
was treated with 200 mg/mL lysozyme, protease inhibitor cocktail
(0.06 units/mL) and 0.01 mL/mL PMSF for 1 hr. Cells were lysed
by sonication. After centrifugation at 100,0006 g for 30 min,
10 mM CaCl2 was added to the supernatant and heated to 65uCfor 15 minutes. Supernatant was brought to room temperature
and centrifuged again at 100,0006g for 30 min in the presence of
4 mL/mL DNAse and 3 mM MgCl2. Supernatant was loaded
onto a CL-4B Phenyl Sepharose column. Columns were subjected
to three long successive washes with buffer A (50 mM Tris, 1 mM
CaCl2, pH 7.5), B (50 mM Tris, 1 mM CaCl2, 5 mM imidazole
and 300 mM NaCl), followed by a brief wash with buffer A. CaM
was eluted with 50 mM Tris, 100 mM NaCl, and 5 mM EGTA.
Eluant was dialyzed twice against 50 mM Tris, 100 mM KCl,
pH 7.5 and concentrated using Centriprep (Millipore) prior to use.
This protocol consistently produces high yields of pure CaM.
Binding Assay to Screen for CaM-binding Domains inGPER
BSGPERx were tested in vitro for direct binding with purified
CaM. BSGPERx were mixed in titration buffer (25 mM Tris,
100 mM KCl, pH 7.5) containing 0.1 mg/mL bovine serum
albumin and 1 mM CaCl2 in a quartz cuvette (Hellma Analytics).
Small aliquots of purified CaM were added to the mixture as
biosensor responses were monitored in a QuantaMasterTM-40
spectrofluometer (Photon Technology International Inc.). All
titrations were performed at 22uC. Direct interactions between
the specified GPER fragments and CaM were identified by
disruption of FRET between donor ECFP and acceptor EYFP.
Biosensor fractional responses were determined by the formula
BSfract ~R{Rmin
Rmax{Rmin
ð1Þ
where Rmin and Rmax are the ratios between emission intensities at
l475 and l535 nm (F475/F535) when the biosensor is in
unbound and maximally bound state, respectively. Fractional
biosensor responses could also be determined using the emission
intensity at l475 nm (F475) or l535 nm (F535), as follow.
BSfract ~F{Fmin
Fmax{Fmin
ð2Þ
where F, Fmax and Fmin represent the observed, maximal and
minimal intensities at l475 nm.
Figure 1. Schematic topography of human GPER (A) and sub-membrane fragments used to generate biosensors (B). SMD, sub-membrane domain. Hydrophobic residues are in bold-face type. Positively charged residues are underlined.doi:10.1371/journal.pone.0089669.g001
New Method to Locate CaM-Binding Domains in GPCRs
PLOS ONE | www.plosone.org 3 February 2014 | Volume 9 | Issue 2 | e89669
Or,
BSfract ~Fmax{F
Fmax{Fmin
ð3Þ
where F, F, Fmax and Fmin represent the observed, maximal and
minimal intensities at l535 nm, as described previously [43].
Dilution factors were tightly calculated for each addition of CaM
using a detailed excel spreadsheet algorithm and applied for
intensity correction when the F475 or F535 values were used to
derive BSfract; however, we determined that the use of ratiometric
responses (formula (1)) negated this necessity. Precise fractional
biosensor responses were plotted against titrated CaM concentra-
tions. Apparent Kd values for BSGPERx-CaM interactions were
obtained by fitting biosensor’s fractional responses as a function of
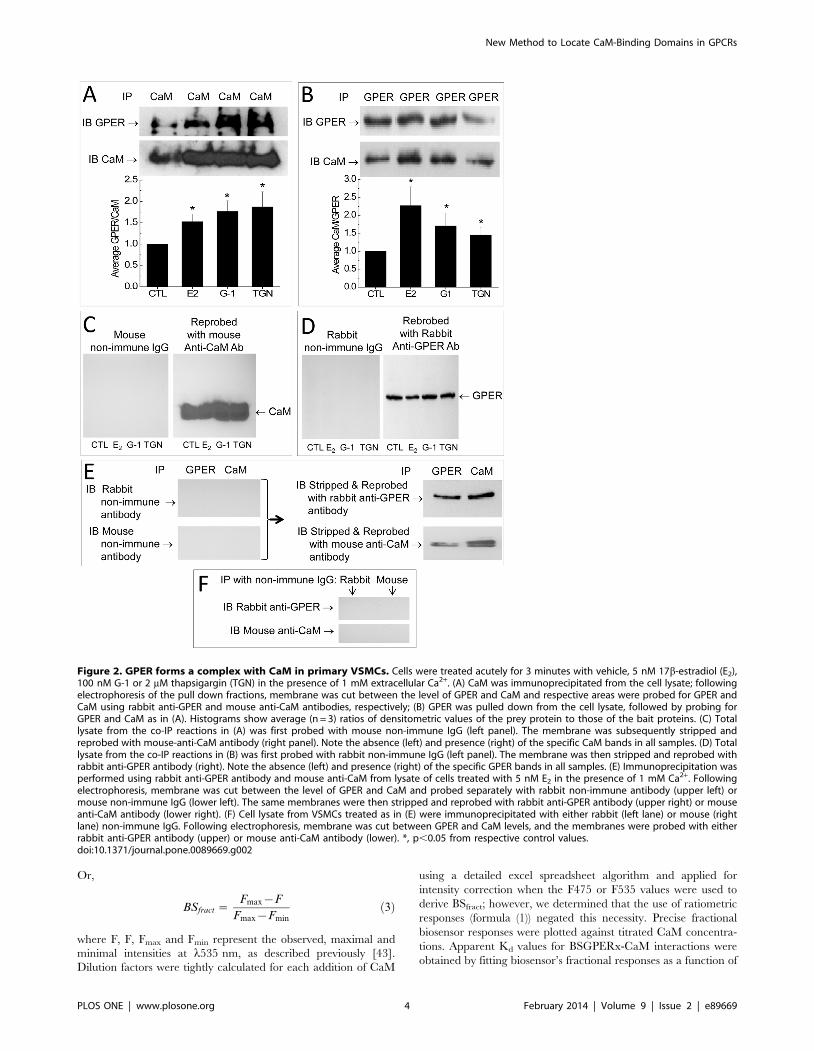
Figure 2. GPER forms a complex with CaM in primary VSMCs. Cells were treated acutely for 3 minutes with vehicle, 5 nM 17b-estradiol (E2),100 nM G-1 or 2 mM thapsigargin (TGN) in the presence of 1 mM extracellular Ca2+. (A) CaM was immunoprecipitated from the cell lysate; followingelectrophoresis of the pull down fractions, membrane was cut between the level of GPER and CaM and respective areas were probed for GPER andCaM using rabbit anti-GPER and mouse anti-CaM antibodies, respectively; (B) GPER was pulled down from the cell lysate, followed by probing forGPER and CaM as in (A). Histograms show average (n = 3) ratios of densitometric values of the prey protein to those of the bait proteins. (C) Totallysate from the co-IP reactions in (A) was first probed with mouse non-immune IgG (left panel). The membrane was subsequently stripped andreprobed with mouse-anti-CaM antibody (right panel). Note the absence (left) and presence (right) of the specific CaM bands in all samples. (D) Totallysate from the co-IP reactions in (B) was first probed with rabbit non-immune IgG (left panel). The membrane was then stripped and reprobed withrabbit anti-GPER antibody (right). Note the absence (left) and presence (right) of the specific GPER bands in all samples. (E) Immunoprecipitation wasperformed using rabbit anti-GPER antibody and mouse anti-CaM from lysate of cells treated with 5 nM E2 in the presence of 1 mM Ca2+. Followingelectrophoresis, membrane was cut between the level of GPER and CaM and probed separately with rabbit non-immune antibody (upper left) ormouse non-immune IgG (lower left). The same membranes were then stripped and reprobed with rabbit anti-GPER antibody (upper right) or mouseanti-CaM antibody (lower right). (F) Cell lysate from VSMCs treated as in (E) were immunoprecipitated with either rabbit (left lane) or mouse (rightlane) non-immune IgG. Following electrophoresis, membrane was cut between GPER and CaM levels, and the membranes were probed with eitherrabbit anti-GPER antibody (upper) or mouse anti-CaM antibody (lower). *, p,0.05 from respective control values.doi:10.1371/journal.pone.0089669.g002
New Method to Locate CaM-Binding Domains in GPCRs
PLOS ONE | www.plosone.org 4 February 2014 | Volume 9 | Issue 2 | e89669
CaM concentration to hyperbolic or quadratic binding equations
[43]:
BSfract ~½CaM�tot
½CaM�tot{Kd
ð4Þ
BSfract~
½BS�{½CaM�{Kd {
ffiffiffiffiffiffiffiffiffiffiffiffiffiffiffiffiffiffiffiffiffiffiffiffiffiffiffiffiffiffiffiffiffiffiffiffiffiffiffiffiffiffiffiffiffiffiffiffiffiffiffiffiffiffiffiffiffiffiffiffiffiffiffiffiffiffiffiffiffiffiffiffiffiffi(½BS�z½CaM�zKd )2{4½BS�½CaM�
q
2½BS�
ð5Þ
where BSfract, [BS] and [CaM] are fractional response of
BSGPERx (equation (1)) and the total concentration of biosensor
and CaM in the mixture, respectively.
Dynamic range (DR) in biosensor responses to CaM, opera-
tionally defined as the fold difference between Rmax and Rmin,
reflects the conformational change that occurs upon CaM binding
to the linker. This parameter was used as additional indicator of
the location of the CaM-binding domain.
Determination of Ca2+ Sensitivity of the Interactionbetween BSGPERx and CaM
Ca2+ sensitivities of the interactions between CaM and the
different submembrane domains of GPER were determined by
simultaneous spectrofluorometric measurements of the responses
of a suitable Ca2+ indicator and BSGPERx in the presence of
saturating CaM concentration and incremental increases in free
Ca2+. Saturating CaM concentrations were obtained from
determinations of apparent Kd values of interactions
between BSGPERx and Ca2+-CaM described above. Free Ca2+
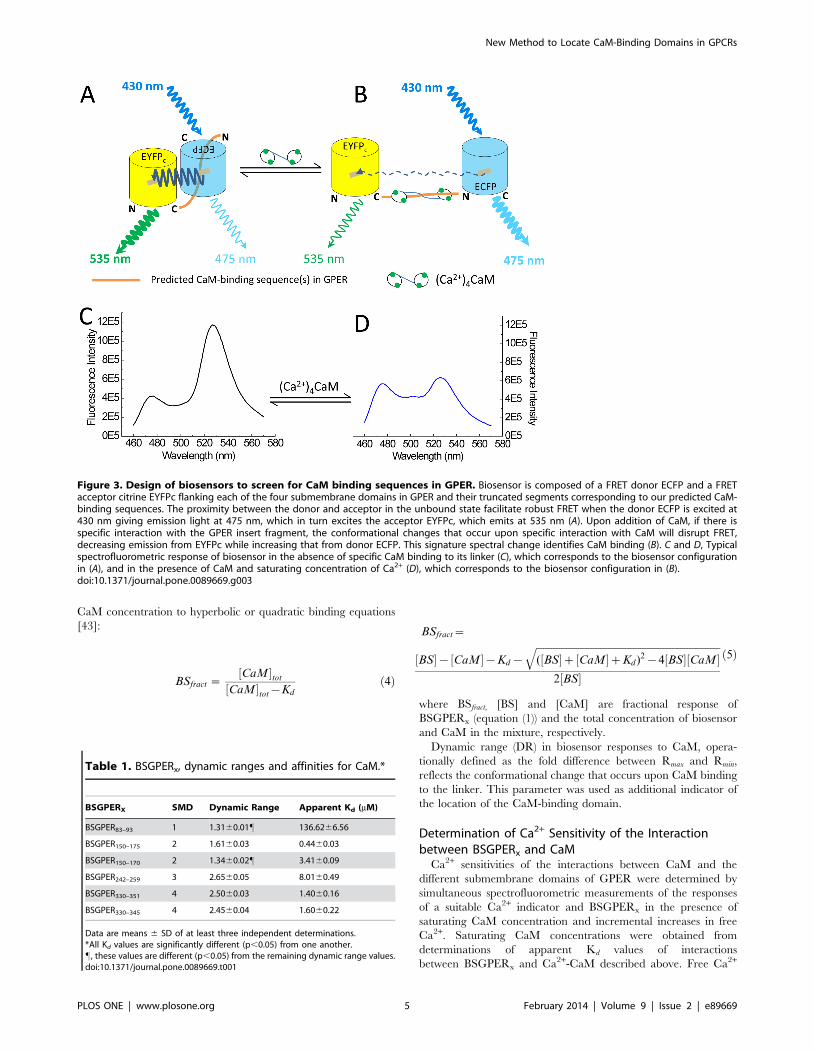
Figure 3. Design of biosensors to screen for CaM binding sequences in GPER. Biosensor is composed of a FRET donor ECFP and a FRETacceptor citrine EYFPc flanking each of the four submembrane domains in GPER and their truncated segments corresponding to our predicted CaM-binding sequences. The proximity between the donor and acceptor in the unbound state facilitate robust FRET when the donor ECFP is excited at430 nm giving emission light at 475 nm, which in turn excites the acceptor EYFPc, which emits at 535 nm (A). Upon addition of CaM, if there isspecific interaction with the GPER insert fragment, the conformational changes that occur upon specific interaction with CaM will disrupt FRET,decreasing emission from EYFPc while increasing that from donor ECFP. This signature spectral change identifies CaM binding (B). C and D, Typicalspectrofluorometric response of biosensor in the absence of specific CaM binding to its linker (C), which corresponds to the biosensor configurationin (A), and in the presence of CaM and saturating concentration of Ca2+ (D), which corresponds to the biosensor configuration in (B).doi:10.1371/journal.pone.0089669.g003
Table 1. BSGPERx, dynamic ranges and affinities for CaM.*
BSGPERX SMD Dynamic Range Apparent Kd (mM)
BSGPER83–93 1 1.3160.01" 136.6266.56
BSGPER150–175 2 1.6160.03 0.4460.03
BSGPER150–170 2 1.3460.02" 3.4160.09
BSGPER242–259 3 2.6560.05 8.0160.49
BSGPER330–351 4 2.5060.03 1.4060.16
BSGPER330–345 4 2.4560.04 1.6060.22
Data are means 6 SD of at least three independent determinations.*All Kd values are significantly different (p,0.05) from one another.", these values are different (p,0.05) from the remaining dynamic range values.doi:10.1371/journal.pone.0089669.t001
New Method to Locate CaM-Binding Domains in GPCRs
PLOS ONE | www.plosone.org 5 February 2014 | Volume 9 | Issue 2 | e89669
concentrations were determined by the responses of X-Rhod5F
emission intensity at l600 nm with excitation at l580 nm, which
were simultaneously monitored with biosensor response. Biosensor
FRET emission ratio (F475/F535) following excitation at
l430 nm were concurrently monitored in a QuantaMaster-40
spectrofluorometer. Typically, starting reaction mixture contained
0.5 mM GPER biosensor, 2 mM X-Rhod5F, 0.1 mg/mL BSA,
0.25 mM Br2BAPTA and saturating CaM concentrations
(obtained from Kd titrations) in 25 mM Tris, 100 mM KCl,
pH 7.5 at 22uC. In some assays with high saturating CaM
concentrations, the concentration of Br2BAPTA was increased to
guarantee chelation of Ca2+ prior to the start of Ca2+ titrations (see
Results). In this nominally Ca2+-free condition, there was no
interaction between CaM and BSGPERx. Incremental Ca2+ was
then titrated into the reaction mix. Free Ca2+ values were
calculated using the formula
½Ca2z�(mM) ~ 1:6|F{Fmin
Fmax{Fð6Þ
where 1.6 is the in vitro Kd value (mM) of X-Rhod5F for Ca2+; Fmin
and Fmax are its fluorescence intensities measured at l600 nm
under nominally Ca2+-free and Ca2+-saturating conditions,
respectively.
The Ca2+ sensitivities of biosensor-CaM interactions were then
determined as the EC50(Ca2+) values, which were derived from fits
of biosensor fractional responses (BSfract) against corresponding free
Ca2+ concentration using the equation:
BSfract ~½Ca2z�nfree
½Ca2z�nfreez½EC50(Ca2z)�n ð7Þ
where BSfract is obtained from equation (1); n is the Hill coefficient.
Statistical AnalysisData are expressed as means 6 SD of at least three independent
experiments. Statistical analysis was performed using Student’s
t-test, assuming unequal variances between control and treated
groups. Statistical significance was determined as P,0.05.
Results
Complex Formation between GPER and CaM in PrimaryVascular Smooth Muscle Cells
Estrogen activates many CaM-dependent processes. We con-
sidered the possibility that CaM might be involved in estrogen
actions through GPER at the receptor level. We asked whether
GPER interacts with CaM and whether this interaction requires
GPER activation by specific ligand binding. To test this, primary
VSMCs were acutely treated with vehicle or the endogenous
ligand 17b-estradiol (E2, 5 nM), the GPER agonist G-1 (100 nM),
or the SERCA pump inhibitor thapsigargin (2 mM) for 3 minutes
in the presence of 1 mM extracellular Ca2+. Both E2 and G-1 have
been demonstrated to trigger intracellular Ca2+ signals [13,14,44–
48], and thapsigargin is a well-known stimulator of store-operated
Ca2+ entry. GPER was immunoprecipitated from the lysate and
the pull-down fractions were probed for CaM (Fig. 2A). Recip-
rocally, CaM was immunoprecipitated from the lysate and the
pulled down fractions were subsequently probed for GPER
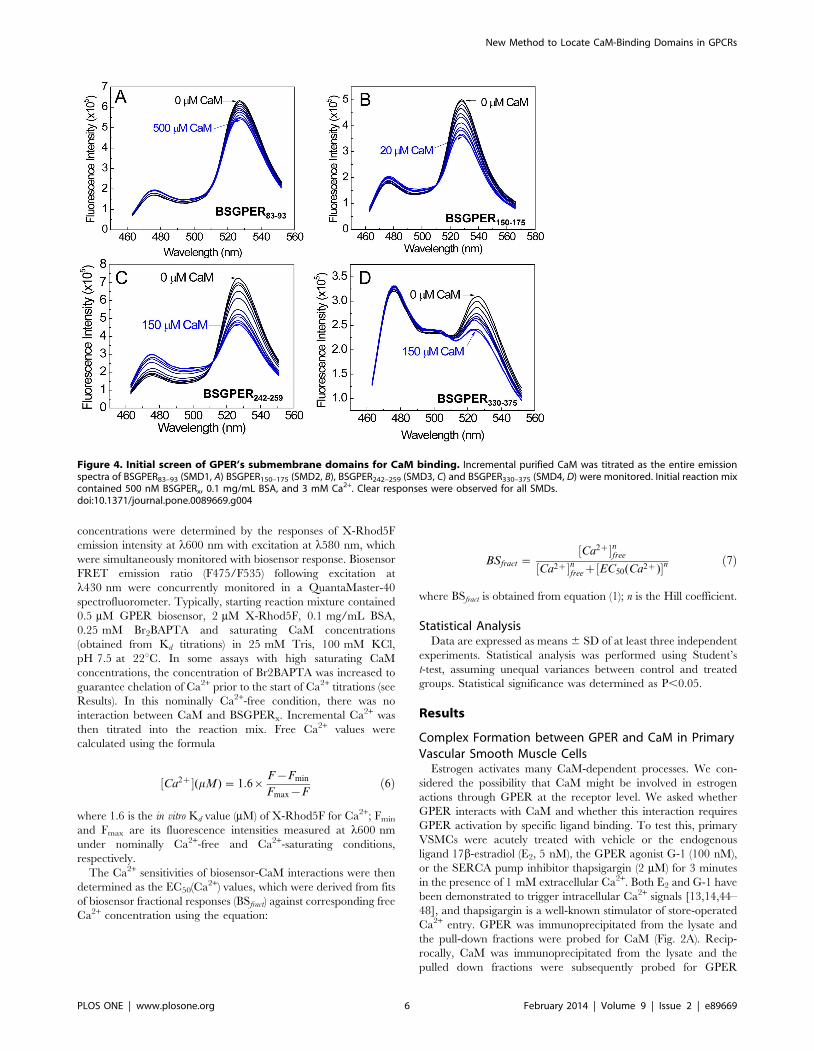
Figure 4. Initial screen of GPER’s submembrane domains for CaM binding. Incremental purified CaM was titrated as the entire emissionspectra of BSGPER83–93 (SMD1, A) BSGPER150–175 (SMD2, B), BSGPER242–259 (SMD3, C) and BSGPER330–375 (SMD4, D) were monitored. Initial reaction mixcontained 500 nM BSGPERx, 0.1 mg/mL BSA, and 3 mM Ca2+. Clear responses were observed for all SMDs.doi:10.1371/journal.pone.0089669.g004
New Method to Locate CaM-Binding Domains in GPCRs
PLOS ONE | www.plosone.org 6 February 2014 | Volume 9 | Issue 2 | e89669
(Fig. 2B). In both co-IP directions, CaM appears to associate with
GPER under resting conditions. Both 17b-estradiol and GPER
agonist G-1 apparently enhanced the association between GPER
and CaM. Interestingly, thapsigargin, which stimulates Ca2+ entry
independently of GPER activation, also produced a similar effect
(Fig. 2A and 2B). To confirm specificity of the co-IPs, total cell
lysate from a set of samples used in the co-IP reactions in Fig. 2A
and 2B was first probed with non-immune IgGs from both mouse
(Fig. 2C, left panel, species compatible with that of the anti-CaM
antibody) and rabbit (Fig. 2D, left panel, species compatible with
that of the anti-GPER antibody). These panels, predictably,
showed no detectible bands. Following probing with the non-
immune IgGs, the same membranes were stripped and re-probed
with mouse anti-CaM antibody (Fig. 2C, right panel) or rabbit
anti-GPER antibody (Fig. 2D, right panel). These panels now
showed clear GPER and CaM bands, confirming the specificity of
the antibodies used for GPER and CaM. To further confirm the
specificity of the co-IPs in Fig. 2A and 2B, a control co-IP
paradigm was tested in which GPER and CaM were immuno-
precipitated from lysate of cells treated acutely with 5 nM E2,
followed by immunoblotting with non-immune rabbit antibody
(Fig. 2E, left upper panel) and mouse non-immune IgG (Fig. 2E.
left lower panel). As predicted, these panels showed no detectible
immunoprecipitates. The same membranes were then stripped
and immunoblotted with rabbit anti-GPER antibody (Fig. 2E,
right upper panel) and mouse anti-CaM antibody (Fig. 2E, right
lower panel). Additionally, immunoprecipitation of lysate from
E2-treated cells using the non-immune IgGs showed no detectible
GPER or CaM upon immunoblotting with their specific
antibodies (Fig. 2F, upper and lower panels, respectively).
Identification of GPER’s CaM-binding DomainsThe co-immunoprecipitation of GPER and CaM in VSMCs
suggested that GPER might directly interact with CaM. In
general, CaM-binding sequences do not belong to a common
motif, so it is challenging to define CaM-binding domains in
different proteins using sequence alignment [49]. For a GPCR,
sub-membrane domains represent logical site(s) for these interac-
tions. To confirm direct GPER-CaM interaction and locate the
CaM-binding domains, we decided to use FRET technology as a
new approach to confirm direct interaction and identify CaM-
binding sites. The typical length of CaM-binding sequences, ,20
amino acids, and the large conformational change produced upon
CaM binding are ideal for FRET technology. FRET biosensors
based on known CaM-binding sequences have been developed,
modified and used successfully to monitor free Ca2+-CaM signals
in cells [25,26,28,43,50]. However, FRET technique has not been
used to locate unknown CaM-binding sequences. We believe that
this technique could also be used to cost-effectively and precisely
locate unknown CaM-binding domains in GPCRs and quantita-
tively determine their binding properties. Figure 3 recapitulates
the principle of this approach. Given sufficient proximity of the
energy donor ECFP and acceptor EYFPc, FRET is formed
between these moieties upon excitation of ECFP at 430 nm
(Fig. 3A). Specific binding of CaM to the linker causes a
conformational change between the two fluorescent proteins and
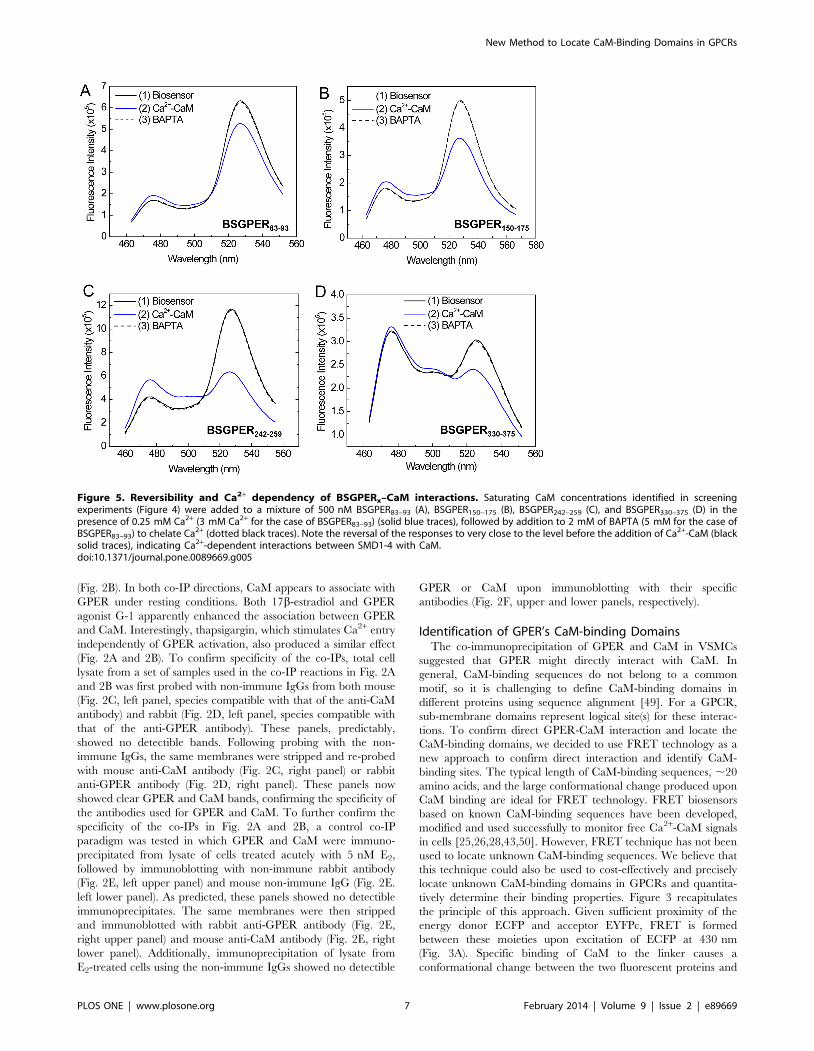
Figure 5. Reversibility and Ca2+ dependency of BSGPERx–CaM interactions. Saturating CaM concentrations identified in screeningexperiments (Figure 4) were added to a mixture of 500 nM BSGPER83–93 (A), BSGPER150–175 (B), BSGPER242–259 (C), and BSGPER330–375 (D) in thepresence of 0.25 mM Ca2+ (3 mM Ca2+ for the case of BSGPER83–93) (solid blue traces), followed by addition to 2 mM of BAPTA (5 mM for the case ofBSGPER83–93) to chelate Ca2+ (dotted black traces). Note the reversal of the responses to very close to the level before the addition of Ca2+-CaM (blacksolid traces), indicating Ca2+-dependent interactions between SMD1-4 with CaM.doi:10.1371/journal.pone.0089669.g005
New Method to Locate CaM-Binding Domains in GPCRs
PLOS ONE | www.plosone.org 7 February 2014 | Volume 9 | Issue 2 | e89669
disrupts FRET, manifesting as an increase in the emission intensity
of the donor (475 nm) and a corresponding decrease in that of the
acceptor (535 nm, Fig. 3B). This signature behavior is specific for
direct CaM-linker interaction. Ca2+ dependency of the interac-
tions can be easily assessed by whether biosensor produces a
response to CaM in the absence of Ca2+, or whether biosensor
response in the presence of Ca2+ is abolished upon chelation of
Ca2+ using a chelator such as BAPTA. Biosensor responses
obtained in the presence of saturating Ca2+ level and incremental
increases in purified CaM allow precise determination of apparent
affinity of the interaction. Figures 3C and 3D show representative
spectral changes that correspond to the scenarios depicted in
Fig. 3A and Fig. 3B, respectively. We decided to use this approach
to identify sequences in GPER that produce the lowest apparent
Kd values for their interactions with CaM. Another parameter of
FRET-based biosensors is the dynamic range (DR) of their
responses, operationally defined as the fold difference between the
observed Rmin and Rmax (equation (1)). This value reflects the
conformational change of the linker that occurs upon binding and
was used as an additive factor in determining the precise location
of the CaM-binding domains.
As an initial screen, we inserted the sub-membrane domains
(SMDs) of GPER as linkers between the FRET donor ECFP and
acceptor EYFPc and screened for direct interactions with purified
CaM. Fig. 4 shows the emission spectral changes of these
biosensors upon incremental additions of Ca2+-saturated CaM
(Ca2+-CaM). BSGPER83–93, whose linker corresponds to GPER’s
SMD1, showed reciprocal responses in its emission at l475 nm
and l535 nm only to fairly high CaM concentrations (Fig. 4A),
and was saturated at 500 mM. BSGPER150–175, BSGPER242–259
and BSGPER330–375, whose linker sequences correspond to
GPER’s SMDs 2–4, also display reciprocal changes in its emission
intensities at l475 nm and l535 nm upon additions of Ca2+-CaM
(Fig. 4B–D), albeit with different dynamic ranges (Table 1). The
lower dynamic range of BSGPER330–375 (Fig. 4D) is likely due to
its longer linker sequence. To confirm Ca2+-dependency of these
interactions, saturating concentrations of CaM determined from
titrations similar to those shown in Fig. 4 were added to a mixture
of 500 nM BSGPERx and 250 mM Ca2+ (3 mM Ca2+ for
BSGPER83–93). After maximal responses were obtained for
BSGPER83–93, BSGPER150–175, BSGPER242–259, BSGPER330–375
(solid blue traces, Fig. 5A–D), 2 mM BAPTA (5 mM for
BSGPER83–93) was added to chelate Ca2+ in the mixture. This
addition completely reversed the responses for these biosensors
(dotted traces, Fig. 5A–D). These data indicate direct Ca2+
-dependent interaction between CaM and GPER’s submembrane
domains 1–4.
To narrow down the precise CaM-binding domains in GPER,
our strategy was to adjust the length of the linker sequences in
keeping if possible with common CaM-binding motifs [51] and
then screen for biosensors that yield the lowest Kd values for CaM
and largest dynamic ranges. BSGPER83–93 (SMD1) represents a
fairy short sequence (11 residues) that does not follow any known
CaM-binding motifs and yet apparently binds CaM in a strictly
Ca2+-dependent fashion, albeit with relatively low affinity.
BSGPER150–175 (SMD2) contains a 20-a.a. segment (a.a. 150–
170) of hydrophobic residues interspersed among positively
charged residues, while the remaining part (a.a. 170–175) is a
patch of dense basic, positively charged residues (Fig. 1B).
Although the positions of bulky hydrophobic residues in the
150–170 segment do not fit any common CaM-binding motifs
[51], the composition of hydrophobic and positively charged
residues does suggest potential of a CaM-binding domain.
BSGPER150–170 was thus constructed for comparison with
BSGPER150–175. This comparison would also reveal the role of
the basic patch (a.a. 170–175) in CaM binding to SMD2.
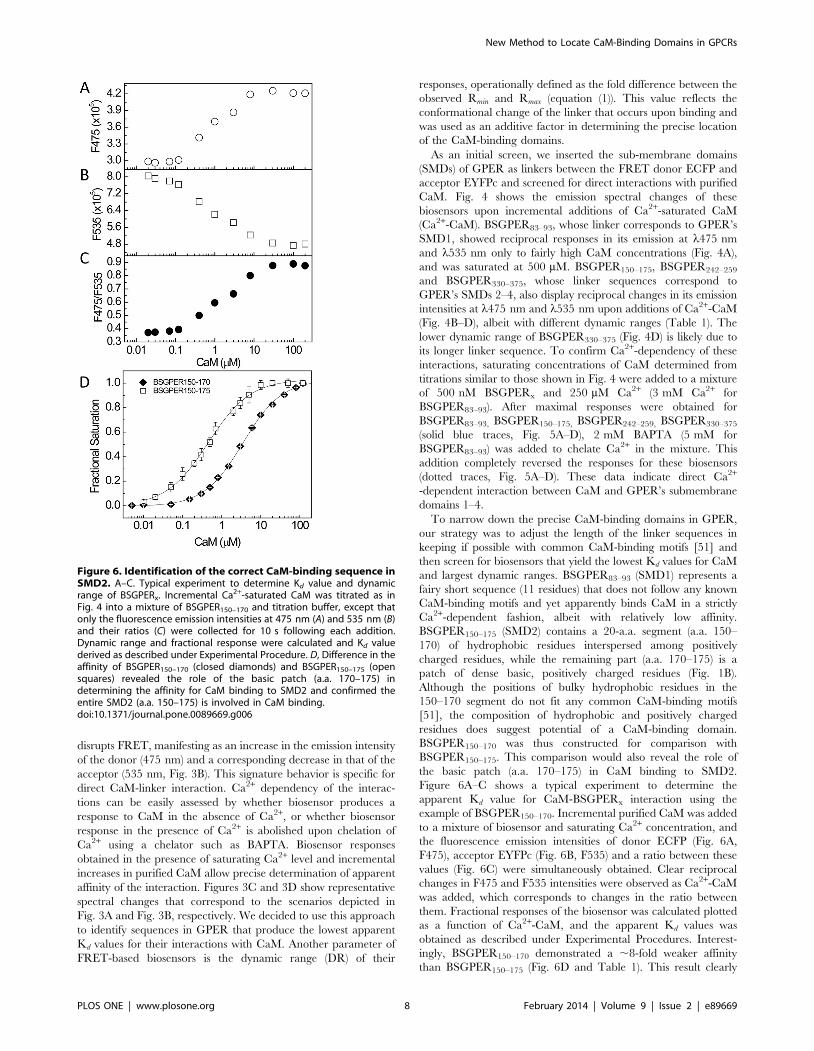
Figure 6A–C shows a typical experiment to determine the
apparent Kd value for CaM-BSGPERx interaction using the
example of BSGPER150–170. Incremental purified CaM was added
to a mixture of biosensor and saturating Ca2+ concentration, and
the fluorescence emission intensities of donor ECFP (Fig. 6A,
F475), acceptor EYFPc (Fig. 6B, F535) and a ratio between these
values (Fig. 6C) were simultaneously obtained. Clear reciprocal
changes in F475 and F535 intensities were observed as Ca2+-CaM
was added, which corresponds to changes in the ratio between
them. Fractional responses of the biosensor was calculated plotted
as a function of Ca2+-CaM, and the apparent Kd values was
obtained as described under Experimental Procedures. Interest-
ingly, BSGPER150–170 demonstrated a ,8-fold weaker affinity
than BSGPER150–175 (Fig. 6D and Table 1). This result clearly
Figure 6. Identification of the correct CaM-binding sequence inSMD2. A–C. Typical experiment to determine Kd value and dynamicrange of BSGPERx. Incremental Ca2+-saturated CaM was titrated as inFig. 4 into a mixture of BSGPER150–170 and titration buffer, except thatonly the fluorescence emission intensities at 475 nm (A) and 535 nm (B)and their ratios (C) were collected for 10 s following each addition.Dynamic range and fractional response were calculated and Kd valuederived as described under Experimental Procedure. D, Difference in theaffinity of BSGPER150–170 (closed diamonds) and BSGPER150–175 (opensquares) revealed the role of the basic patch (a.a. 170–175) indetermining the affinity for CaM binding to SMD2 and confirmed theentire SMD2 (a.a. 150–175) is involved in CaM binding.doi:10.1371/journal.pone.0089669.g006
New Method to Locate CaM-Binding Domains in GPCRs
PLOS ONE | www.plosone.org 8 February 2014 | Volume 9 | Issue 2 | e89669
indicates that the entire SMD2 participates in CaM interaction. It
also demonstrates the importance of the patch of basic, positively
charged residues (170–175) in CaM binding to SMD2.
The 18-residue SMD3 (a.a. 242–259) contains several hydro-
phobic residues interspersed among a very dense group of basic
residues. The hydrophobic residues here again do not appear to
follow any of the common motifs of CaM-binding sequences.
Given the short length of this submembrane domain, it is likely
that the entire domain interacts with CaM (Fig. 4C). As for SMD4,
we noted that BSGPER330–375 showed limited dynamic range, due
probably to its long linker sequence (Fig. 4D). The SMD4
sequence shows in its juxtamembrane region a potential CaM-
binding domain. Additional BSGPERx were thus constructed with
linkers corresponding to fragments a.a. 330–345, 330–351, and
330–361. To rule out a role of the C-terminal end of SMD4 in its
interaction with CaM, a biosensor was also generated based on
a.a. 362–375. As shown in Fig. 7A–C, BSGPER330–345,
BSGPER330–351 and BSGPER330–361 all display robust responses
to Ca2+-CaM, in agreement with the prediction that the CaM-
binding domain in SMD4 is located in its juxtamembrane
segment. Consistently, BSGPER362–375 does not respond to
Ca2+-CaM, even at such high concentration as 700 mM CaM
(Fig. 7D); this serves as a negative control that CaM does not affect
ECFP and EYFP fluorescence. BSGPER330–351 displays slightly
larger dynamic range and higher affinity than BSGPER330–345,
while BSGPER330–361 shows a limited dynamic range. These data
indicate that a.a. 330–351 represents the CaM-binding sequence
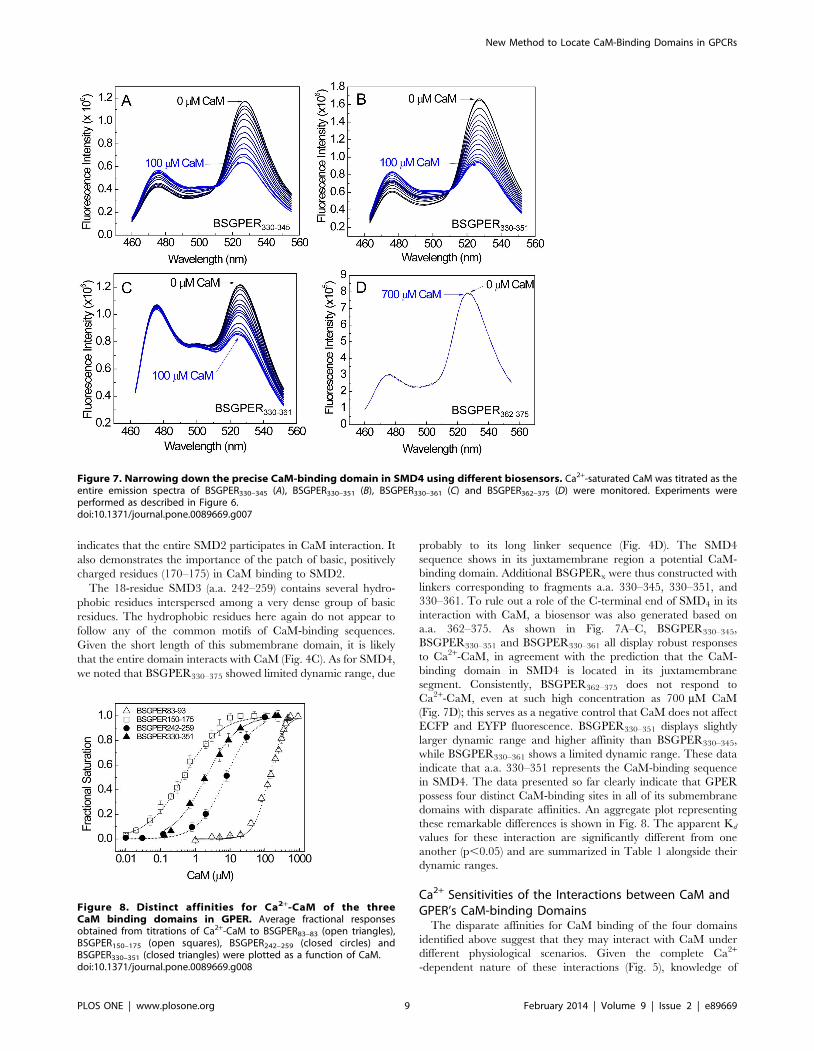
in SMD4. The data presented so far clearly indicate that GPER
possess four distinct CaM-binding sites in all of its submembrane
domains with disparate affinities. An aggregate plot representing
these remarkable differences is shown in Fig. 8. The apparent Kd
values for these interaction are significantly different from one
another (p,0.05) and are summarized in Table 1 alongside their
dynamic ranges.
Ca2+ Sensitivities of the Interactions between CaM andGPER’s CaM-binding Domains
The disparate affinities for CaM binding of the four domains
identified above suggest that they may interact with CaM under
different physiological scenarios. Given the complete Ca2+
-dependent nature of these interactions (Fig. 5), knowledge of
Figure 7. Narrowing down the precise CaM-binding domain in SMD4 using different biosensors. Ca2+-saturated CaM was titrated as theentire emission spectra of BSGPER330–345 (A), BSGPER330–351 (B), BSGPER330–361 (C) and BSGPER362–375 (D) were monitored. Experiments wereperformed as described in Figure 6.doi:10.1371/journal.pone.0089669.g007
Figure 8. Distinct affinities for Ca2+-CaM of the threeCaM binding domains in GPER. Average fractional responsesobtained from titrations of Ca2+-CaM to BSGPER83–83 (open triangles),BSGPER150–175 (open squares), BSGPER242–259 (closed circles) andBSGPER330–351 (closed triangles) were plotted as a function of CaM.doi:10.1371/journal.pone.0089669.g008
New Method to Locate CaM-Binding Domains in GPCRs
PLOS ONE | www.plosone.org 9 February 2014 | Volume 9 | Issue 2 | e89669
their Ca2+ sensitivities would be very helpful in determining the
roles of CaM binding to each submembrane domain when
studying GPER’s physiological functions. The best approach was
to simultaneously monitor BSGPERx fractional responses and free
Ca2+ concentrations in the presence of saturating CaM and
increasing amounts of free Ca2+ measured using an appropriate
Ca2+ indicator. Based on the Kd values determined (Table 1),
saturating CaM concentrations for the biosensors were known.
The choice of a suitable Ca2+ indicator to do this depends on two
factors. First, its excitation and emission spectra should not
interfere with those of the biosensors. Second, it must have an
apparent Kd for Ca2+ that is close enough to the Ca2+ sensitivity of
the biosensor being tested, which could be quickly assessed by
simultaneous measurement of both biosensor and the Ca2+
indicator responses as Ca2+ is titrated to the mixture. A wide
range of commercially available Ca2+ indicators made this task
relatively easy. A few Ca2+ indicators were tested, including indo-
1, Mag-indo1, and XRhod-5F. XRhod-5F represented an ideal
Ca2+ indicator for use with these biosensors, due to the closeness of
its Kd values to the estimated Ca2+ sensitivities of the biosensors
and the fact that both excitation (l580 nm) and emission
(l605 nm) peaks are far to the right to the emission peak of the
EYFPc moiety of the biosensors. Figure 9A and B show changes in
XRhod-5F (A) and biosensor ratio (B) simultaneously monitored as
Ca2+ was titrated to a mixture of biosensor, saturating concentra-
tion of CaM. Starting mixture contained 0.25–3 mM BAPTA to
guarantee nominally Ca2+-free condition at the beginning of the
titration.
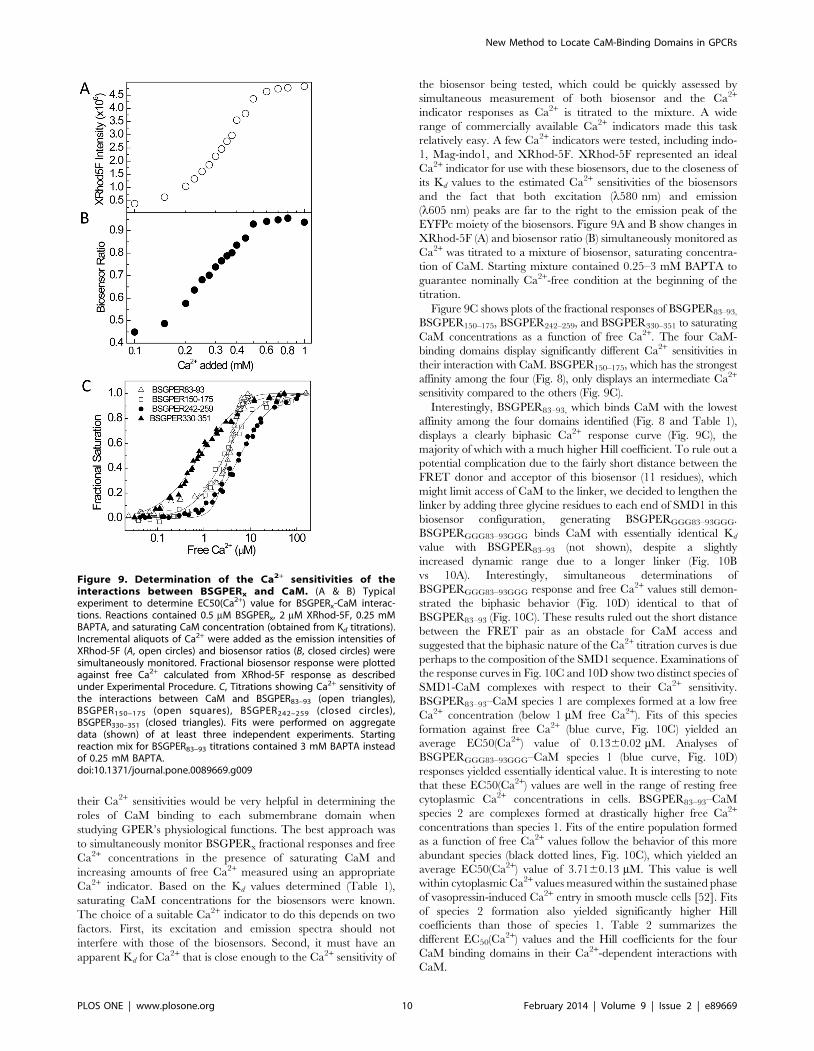
Figure 9C shows plots of the fractional responses of BSGPER83–93,
BSGPER150–175, BSGPER242–259, and BSGPER330–351 to saturating
CaM concentrations as a function of free Ca2+. The four CaM-
binding domains display significantly different Ca2+ sensitivities in
their interaction with CaM. BSGPER150–175, which has the strongest
affinity among the four (Fig. 8), only displays an intermediate Ca2+
sensitivity compared to the others (Fig. 9C).
Interestingly, BSGPER83–93, which binds CaM with the lowest
affinity among the four domains identified (Fig. 8 and Table 1),
displays a clearly biphasic Ca2+ response curve (Fig. 9C), the
majority of which with a much higher Hill coefficient. To rule out a
potential complication due to the fairly short distance between the
FRET donor and acceptor of this biosensor (11 residues), which
might limit access of CaM to the linker, we decided to lengthen the
linker by adding three glycine residues to each end of SMD1 in this
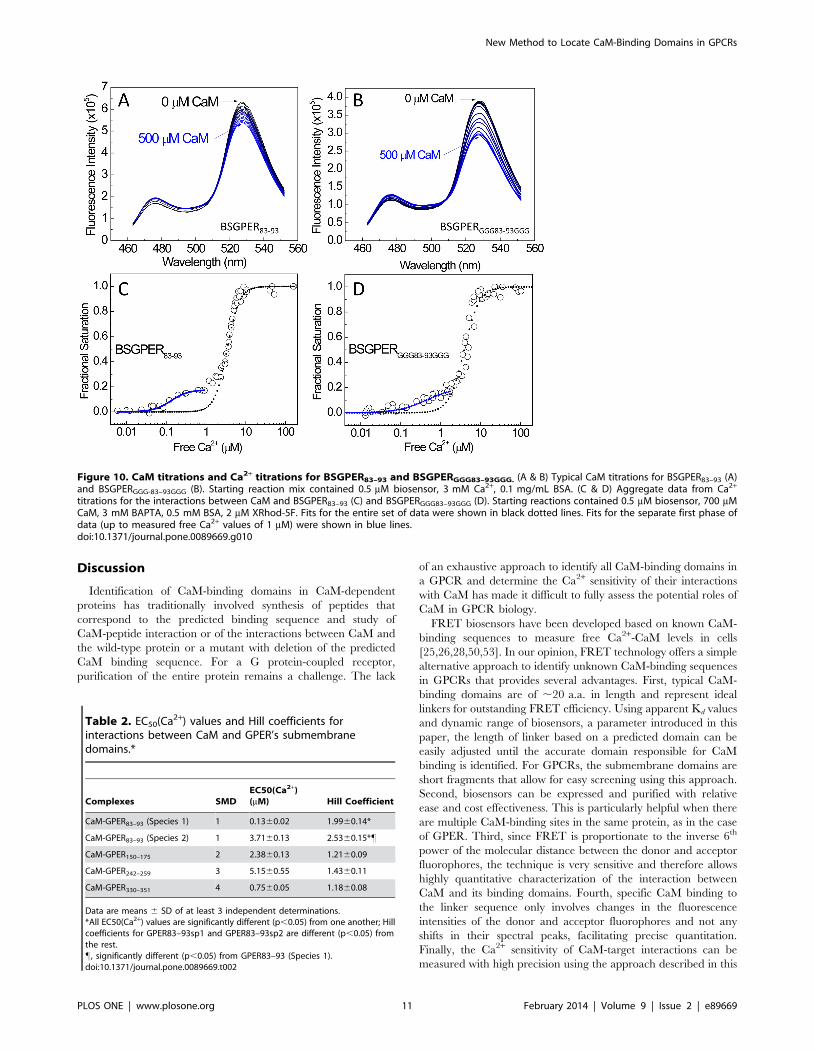
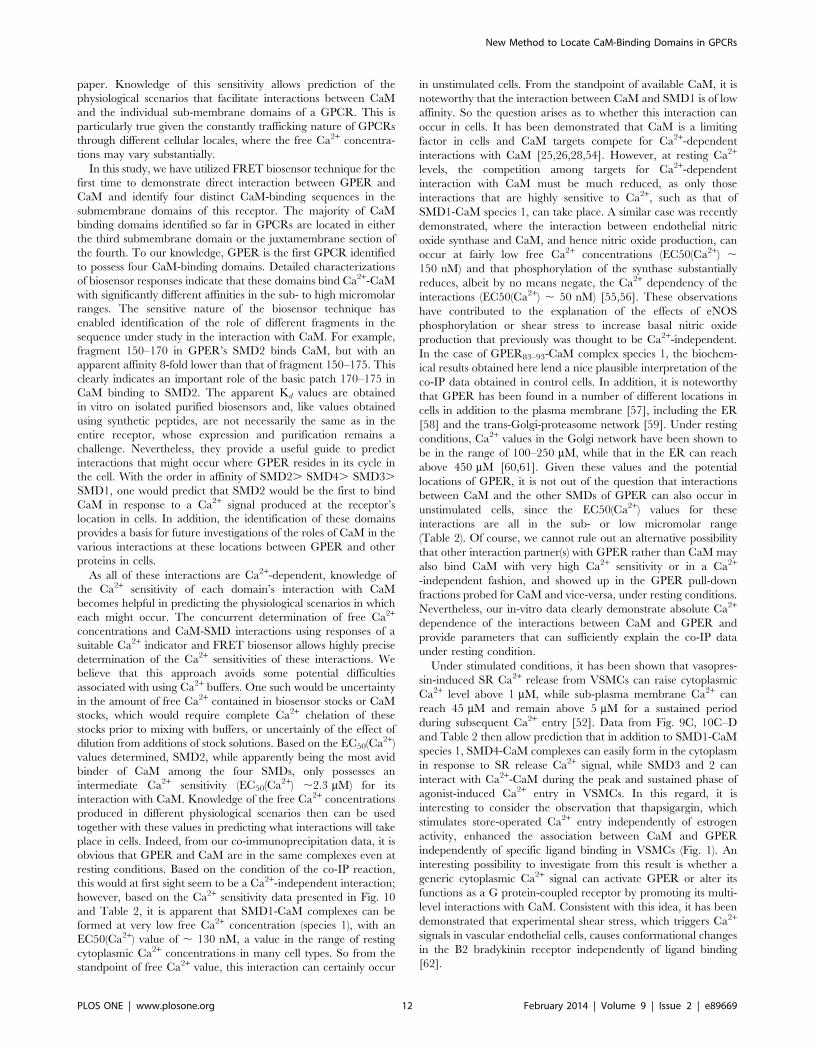
biosensor configuration, generating BSGPERGGG83–93GGG.
BSGPERGGG83–93GGG binds CaM with essentially identical Kd
value with BSGPER83–93 (not shown), despite a slightly
increased dynamic range due to a longer linker (Fig. 10B
vs 10A). Interestingly, simultaneous determinations of
BSGPERGGG83–93GGG response and free Ca2+ values still demon-
strated the biphasic behavior (Fig. 10D) identical to that of
BSGPER83–93 (Fig. 10C). These results ruled out the short distance
between the FRET pair as an obstacle for CaM access and
suggested that the biphasic nature of the Ca2+ titration curves is due
perhaps to the composition of the SMD1 sequence. Examinations of
the response curves in Fig. 10C and 10D show two distinct species of
SMD1-CaM complexes with respect to their Ca2+ sensitivity.
BSGPER83–93–CaM species 1 are complexes formed at a low free
Ca2+ concentration (below 1 mM free Ca2+). Fits of this species
formation against free Ca2+ (blue curve, Fig. 10C) yielded an
average EC50(Ca2+) value of 0.1360.02 mM. Analyses of
BSGPERGGG83–93GGG–CaM species 1 (blue curve, Fig. 10D)
responses yielded essentially identical value. It is interesting to note
that these EC50(Ca2+) values are well in the range of resting free
cytoplasmic Ca2+ concentrations in cells. BSGPER83–93–CaM
species 2 are complexes formed at drastically higher free Ca2+
concentrations than species 1. Fits of the entire population formed
as a function of free Ca2+ values follow the behavior of this more
abundant species (black dotted lines, Fig. 10C), which yielded an
average EC50(Ca2+) value of 3.7160.13 mM. This value is well
within cytoplasmic Ca2+ values measured within the sustained phase
of vasopressin-induced Ca2+ entry in smooth muscle cells [52]. Fits
of species 2 formation also yielded significantly higher Hill
coefficients than those of species 1. Table 2 summarizes the
different EC50(Ca2+) values and the Hill coefficients for the four
CaM binding domains in their Ca2+-dependent interactions with
CaM.
Figure 9. Determination of the Ca2+ sensitivities of theinteractions between BSGPERx and CaM. (A & B) Typicalexperiment to determine EC50(Ca2+) value for BSGPERx-CaM interac-tions. Reactions contained 0.5 mM BSGPERx, 2 mM XRhod-5F, 0.25 mMBAPTA, and saturating CaM concentration (obtained from Kd titrations).Incremental aliquots of Ca2+ were added as the emission intensities ofXRhod-5F (A, open circles) and biosensor ratios (B, closed circles) weresimultaneously monitored. Fractional biosensor response were plottedagainst free Ca2+ calculated from XRhod-5F response as describedunder Experimental Procedure. C, Titrations showing Ca2+ sensitivity ofthe interactions between CaM and BSGPER83–93 (open triangles),BSGPER150–175 (open squares), BSGPER242–259 (closed circles),BSGPER330–351 (closed triangles). Fits were performed on aggregatedata (shown) of at least three independent experiments. Startingreaction mix for BSGPER83–93 titrations contained 3 mM BAPTA insteadof 0.25 mM BAPTA.doi:10.1371/journal.pone.0089669.g009
New Method to Locate CaM-Binding Domains in GPCRs
PLOS ONE | www.plosone.org 10 February 2014 | Volume 9 | Issue 2 | e89669
Discussion
Identification of CaM-binding domains in CaM-dependent
proteins has traditionally involved synthesis of peptides that
correspond to the predicted binding sequence and study of
CaM-peptide interaction or of the interactions between CaM and
the wild-type protein or a mutant with deletion of the predicted
CaM binding sequence. For a G protein-coupled receptor,
purification of the entire protein remains a challenge. The lack
of an exhaustive approach to identify all CaM-binding domains in
a GPCR and determine the Ca2+ sensitivity of their interactions
with CaM has made it difficult to fully assess the potential roles of
CaM in GPCR biology.
FRET biosensors have been developed based on known CaM-
binding sequences to measure free Ca2+-CaM levels in cells
[25,26,28,50,53]. In our opinion, FRET technology offers a simple
alternative approach to identify unknown CaM-binding sequences
in GPCRs that provides several advantages. First, typical CaM-
binding domains are of ,20 a.a. in length and represent ideal
linkers for outstanding FRET efficiency. Using apparent Kd values
and dynamic range of biosensors, a parameter introduced in this
paper, the length of linker based on a predicted domain can be
easily adjusted until the accurate domain responsible for CaM
binding is identified. For GPCRs, the submembrane domains are
short fragments that allow for easy screening using this approach.
Second, biosensors can be expressed and purified with relative
ease and cost effectiveness. This is particularly helpful when there
are multiple CaM-binding sites in the same protein, as in the case
of GPER. Third, since FRET is proportionate to the inverse 6th
power of the molecular distance between the donor and acceptor
fluorophores, the technique is very sensitive and therefore allows
highly quantitative characterization of the interaction between
CaM and its binding domains. Fourth, specific CaM binding to
the linker sequence only involves changes in the fluorescence
intensities of the donor and acceptor fluorophores and not any
shifts in their spectral peaks, facilitating precise quantitation.
Finally, the Ca2+ sensitivity of CaM-target interactions can be
measured with high precision using the approach described in this
Figure 10. CaM titrations and Ca2+ titrations for BSGPER83–93 and BSGPERGGG83–93GGG. (A & B) Typical CaM titrations for BSGPER83–93 (A)and BSGPERGGG-83–93GGG (B). Starting reaction mix contained 0.5 mM biosensor, 3 mM Ca2+, 0.1 mg/mL BSA. (C & D) Aggregate data from Ca2+
titrations for the interactions between CaM and BSGPER83–93 (C) and BSGPERGGG83–93GGG (D). Starting reactions contained 0.5 mM biosensor, 700 mMCaM, 3 mM BAPTA, 0.5 mM BSA, 2 mM XRhod-5F. Fits for the entire set of data were shown in black dotted lines. Fits for the separate first phase ofdata (up to measured free Ca2+ values of 1 mM) were shown in blue lines.doi:10.1371/journal.pone.0089669.g010
Table 2. EC50(Ca2+) values and Hill coefficients forinteractions between CaM and GPER’s submembranedomains.*
Complexes SMDEC50(Ca2+)(mM) Hill Coefficient
CaM-GPER83–93 (Species 1) 1 0.1360.02 1.9960.14*
CaM-GPER83–93 (Species 2) 1 3.7160.13 2.5360.15*"
CaM-GPER150–175 2 2.3860.13 1.2160.09
CaM-GPER242–259 3 5.1560.55 1.4360.11
CaM-GPER330–351 4 0.7560.05 1.1860.08
Data are means 6 SD of at least 3 independent determinations.*All EC50(Ca2+) values are significantly different (p,0.05) from one another; Hillcoefficients for GPER83–93sp1 and GPER83–93sp2 are different (p,0.05) fromthe rest.", significantly different (p,0.05) from GPER83–93 (Species 1).doi:10.1371/journal.pone.0089669.t002
New Method to Locate CaM-Binding Domains in GPCRs
PLOS ONE | www.plosone.org 11 February 2014 | Volume 9 | Issue 2 | e89669
paper. Knowledge of this sensitivity allows prediction of the
physiological scenarios that facilitate interactions between CaM
and the individual sub-membrane domains of a GPCR. This is
particularly true given the constantly trafficking nature of GPCRs
through different cellular locales, where the free Ca2+ concentra-
tions may vary substantially.
In this study, we have utilized FRET biosensor technique for the
first time to demonstrate direct interaction between GPER and
CaM and identify four distinct CaM-binding sequences in the
submembrane domains of this receptor. The majority of CaM
binding domains identified so far in GPCRs are located in either
the third submembrane domain or the juxtamembrane section of
the fourth. To our knowledge, GPER is the first GPCR identified
to possess four CaM-binding domains. Detailed characterizations
of biosensor responses indicate that these domains bind Ca2+-CaM
with significantly different affinities in the sub- to high micromolar
ranges. The sensitive nature of the biosensor technique has
enabled identification of the role of different fragments in the
sequence under study in the interaction with CaM. For example,
fragment 150–170 in GPER’s SMD2 binds CaM, but with an
apparent affinity 8-fold lower than that of fragment 150–175. This
clearly indicates an important role of the basic patch 170–175 in
CaM binding to SMD2. The apparent Kd values are obtained
in vitro on isolated purified biosensors and, like values obtained
using synthetic peptides, are not necessarily the same as in the
entire receptor, whose expression and purification remains a
challenge. Nevertheless, they provide a useful guide to predict
interactions that might occur where GPER resides in its cycle in
the cell. With the order in affinity of SMD2. SMD4. SMD3.
SMD1, one would predict that SMD2 would be the first to bind
CaM in response to a Ca2+ signal produced at the receptor’s
location in cells. In addition, the identification of these domains
provides a basis for future investigations of the roles of CaM in the
various interactions at these locations between GPER and other
proteins in cells.
As all of these interactions are Ca2+-dependent, knowledge of
the Ca2+ sensitivity of each domain’s interaction with CaM
becomes helpful in predicting the physiological scenarios in which
each might occur. The concurrent determination of free Ca2+
concentrations and CaM-SMD interactions using responses of a
suitable Ca2+ indicator and FRET biosensor allows highly precise
determination of the Ca2+ sensitivities of these interactions. We
believe that this approach avoids some potential difficulties
associated with using Ca2+ buffers. One such would be uncertainty
in the amount of free Ca2+ contained in biosensor stocks or CaM
stocks, which would require complete Ca2+ chelation of these
stocks prior to mixing with buffers, or uncertainly of the effect of
dilution from additions of stock solutions. Based on the EC50(Ca2+)
values determined, SMD2, while apparently being the most avid
binder of CaM among the four SMDs, only possesses an
intermediate Ca2+ sensitivity (EC50(Ca2+) ,2.3 mM) for its
interaction with CaM. Knowledge of the free Ca2+ concentrations
produced in different physiological scenarios then can be used
together with these values in predicting what interactions will take
place in cells. Indeed, from our co-immunoprecipitation data, it is
obvious that GPER and CaM are in the same complexes even at
resting conditions. Based on the condition of the co-IP reaction,
this would at first sight seem to be a Ca2+-independent interaction;
however, based on the Ca2+ sensitivity data presented in Fig. 10
and Table 2, it is apparent that SMD1-CaM complexes can be
formed at very low free Ca2+ concentration (species 1), with an
EC50(Ca2+) value of , 130 nM, a value in the range of resting
cytoplasmic Ca2+ concentrations in many cell types. So from the
standpoint of free Ca2+ value, this interaction can certainly occur
in unstimulated cells. From the standpoint of available CaM, it is
noteworthy that the interaction between CaM and SMD1 is of low
affinity. So the question arises as to whether this interaction can
occur in cells. It has been demonstrated that CaM is a limiting
factor in cells and CaM targets compete for Ca2+-dependent
interactions with CaM [25,26,28,54]. However, at resting Ca2+
levels, the competition among targets for Ca2+-dependent
interaction with CaM must be much reduced, as only those
interactions that are highly sensitive to Ca2+, such as that of
SMD1-CaM species 1, can take place. A similar case was recently
demonstrated, where the interaction between endothelial nitric
oxide synthase and CaM, and hence nitric oxide production, can
occur at fairly low free Ca2+ concentrations (EC50(Ca2+) ,150 nM) and that phosphorylation of the synthase substantially
reduces, albeit by no means negate, the Ca2+ dependency of the
interactions (EC50(Ca2+) , 50 nM) [55,56]. These observations
have contributed to the explanation of the effects of eNOS
phosphorylation or shear stress to increase basal nitric oxide
production that previously was thought to be Ca2+-independent.
In the case of GPER83–93-CaM complex species 1, the biochem-
ical results obtained here lend a nice plausible interpretation of the
co-IP data obtained in control cells. In addition, it is noteworthy
that GPER has been found in a number of different locations in
cells in addition to the plasma membrane [57], including the ER
[58] and the trans-Golgi-proteasome network [59]. Under resting
conditions, Ca2+ values in the Golgi network have been shown to
be in the range of 100–250 mM, while that in the ER can reach
above 450 mM [60,61]. Given these values and the potential
locations of GPER, it is not out of the question that interactions
between CaM and the other SMDs of GPER can also occur in
unstimulated cells, since the EC50(Ca2+) values for these
interactions are all in the sub- or low micromolar range
(Table 2). Of course, we cannot rule out an alternative possibility
that other interaction partner(s) with GPER rather than CaM may
also bind CaM with very high Ca2+ sensitivity or in a Ca2+
-independent fashion, and showed up in the GPER pull-down
fractions probed for CaM and vice-versa, under resting conditions.
Nevertheless, our in-vitro data clearly demonstrate absolute Ca2+
dependence of the interactions between CaM and GPER and
provide parameters that can sufficiently explain the co-IP data
under resting condition.
Under stimulated conditions, it has been shown that vasopres-
sin-induced SR Ca2+ release from VSMCs can raise cytoplasmic
Ca2+ level above 1 mM, while sub-plasma membrane Ca2+ can
reach 45 mM and remain above 5 mM for a sustained period
during subsequent Ca2+ entry [52]. Data from Fig. 9C, 10C–D
and Table 2 then allow prediction that in addition to SMD1-CaM
species 1, SMD4-CaM complexes can easily form in the cytoplasm
in response to SR release Ca2+ signal, while SMD3 and 2 can
interact with Ca2+-CaM during the peak and sustained phase of
agonist-induced Ca2+ entry in VSMCs. In this regard, it is
interesting to consider the observation that thapsigargin, which
stimulates store-operated Ca2+ entry independently of estrogen
activity, enhanced the association between CaM and GPER
independently of specific ligand binding in VSMCs (Fig. 1). An
interesting possibility to investigate from this result is whether a
generic cytoplasmic Ca2+ signal can activate GPER or alter its
functions as a G protein-coupled receptor by promoting its multi-
level interactions with CaM. Consistent with this idea, it has been
demonstrated that experimental shear stress, which triggers Ca2+
signals in vascular endothelial cells, causes conformational changes
in the B2 bradykinin receptor independently of ligand binding
[62].
New Method to Locate CaM-Binding Domains in GPCRs
PLOS ONE | www.plosone.org 12 February 2014 | Volume 9 | Issue 2 | e89669
At the moment we do not have a complete explanation for the
biphasic nature of the Ca2+ response curve of SMD1-CaM
complex formation. It is possible that sequential binding of the
C-terminal lobe and N-terminal lobes of CaM to SMD1 is
responsible for this behavior and that the short nature of GPER’s
submembrane domain 1 sequence sets the stage such property to
be discerned. In a speculative scheme, at low Ca2+ concentrations,
such as at rest in cells, CaM’s C-terminal lobe may interact with
SMD1, causing a small conformational change in this domain; as
free Ca2+ increases, such as during SR Ca2+ release or Ca2+ entry,
the N-terminal lobe may now contribute to the interaction,
causing a much larger conformational change. Consistent with this
possibility, Ca2+ binding to separate N- and C-terminal halves of
CaM in the presence of a peptide from the CaM-binding domain
of the plasma membrane Ca2+-ATPase has been shown to be of
biphasic nature [63]. These possibilities represent interesting
potential for future studies to delineate the biochemical basis for
interactions between CaM and SMD1 and their roles in GPER
function, especially at basal conditions in cells.
In summary, we have used a novel approach to identify four
CaM-binding domains in GPER and characterize properties of
their interactions with CaM. Our data demonstrate that this
approach can be used with ease to locate CaM binding sequences
in GPCRs in particular and perhaps in other proteins in general.
The results of our study suggest that CaM may play a regulatory
role in actions of estrogen mediated by GPER. It is interesting to
note that the nuclear estrogen receptor ERa has been demon-
strated to be a Ca2+-dependent CaM-binding protein, whose
interaction with CaM stabilizes its dimerization, modulates the
interaction with estrogen responsive element and activates
transcription [64–69]. Together with these earlier findings, the
presence of multiple CaM-binding domains in GPER suggests that
CaM is important for estrogen signaling at multiple levels. With
the large differences in affinity and Ca2+ sensitivity, the effects of
CaM binding to each of the sub-membrane domains on GPER’s
functions present an interesting and necessary area of investiga-
tions.
Acknowledgments
The authors thank Drs. Anthony Persechini and DJ Black (University of
Missouri-Kansas City) for the CaMI and BSCaM2 plasmids. We also thank
Jennifer Giles for preparation of a number of plasmids.
Author Contributions
Conceived and designed the experiments: Q-KT. Performed the
experiments: Q-KT MVM. Analyzed the data: Q-KT. Wrote the paper:
Q-KT.
References
1. Stampfer MJ, Colditz GA (1991) Estrogen replacement therapy and coronary
heart disease: a quantitative assessment of the epidemiologic evidence. Prev Med
20: 47–63.
2. Grady D, Rubin SM, Petitti DB, Fox CS, Black D, et al. (1992) Hormone
therapy to prevent disease and prolong life in postmenopausal women. Ann
Intern Med 117: 1016–1037.
3. Edwards DP (2005) Regulation of signal transduction pathways by estrogen and
progesterone. Annu Rev Physiol 67: 335–376.
4. Mendelsohn ME, Karas RH (2010) Rapid progress for non-nuclear estrogen
receptor signaling. J Clin Invest 120: 2277–2279.
5. Murphy E, Lagranha C, Deschamps A, Kohr M, Nguyen T, et al. (2011)
Mechanism of Cardioprotection: What Can We Learn from Females? Pediatr
Cardiol.
6. Prossnitz ER, Barton M (2009) Signaling, physiological functions and clinical
relevance of the G protein-coupled estrogen receptor GPER. Prostaglandins
Other Lipid Mediat 89: 89–97.
7. Carmeci C, Thompson DA, Ring HZ, Francke U, Weigel RJ (1997)
Identification of a gene (GPR30) with homology to the G-protein-coupled
receptor superfamily associated with estrogen receptor expression in breast
cancer. Genomics 45: 607–617.
8. Takada Y, Kato C, Kondo S, Korenaga R, Ando J (1997) Cloning of cDNAs
encoding G protein-coupled receptor expressed in human endothelial cells
exposed to fluid shear stress. Biochem Biophys Res Commun 240: 737–741.
9. Kvingedal AM, Smeland EB (1997) A novel putative G-protein-coupled receptor
expressed in lung, heart and lymphoid tissue. FEBS Lett 407: 59–62.
10. Owman C, Blay P, Nilsson C, Lolait SJ (1996) Cloning of human cDNA
encoding a novel heptahelix receptor expressed in Burkitt’s lymphoma and
widely distributed in brain and peripheral tissues. Biochem Biophys Res
Commun 228: 285–292.
11. O’Dowd BF, Nguyen T, Marchese A, Cheng R, Lynch KR, et al. (1998)
Discovery of three novel G-protein-coupled receptor genes. Genomics 47: 310–
313.
12. Thomas P, Pang Y, Filardo EJ, Dong J (2005) Identity of an estrogen membrane
receptor coupled to a G protein in human breast cancer cells. Endocrinology
146: 624–632.
13. Revankar CM, Cimino DF, Sklar LA, Arterburn JB, Prossnitz ER (2005)
A transmembrane intracellular estrogen receptor mediates rapid cell signaling.
Science 307: 1625–1630.
14. Filardo E, Quinn J, Pang Y, Graeber C, Shaw S, et al. (2007) Activation of the
novel estrogen receptor G protein-coupled receptor 30 (GPR30) at the plasma
membrane. Endocrinology 148: 3236–3245.
15. Filardo EJ, Quinn JA, Bland KI, Frackelton AR Jr (2000) Estrogen-induced
activation of Erk-1 and Erk-2 requires the G protein-coupled receptor homolog,
GPR30, and occurs via trans-activation of the epidermal growth factor receptor
through release of HB-EGF. Mol Endocrinol 14: 1649–1660.
16. Kanda N, Watanabe S (2003) 17beta-estradiol inhibits oxidative stress-induced
apoptosis in keratinocytes by promoting Bcl-2 expression. J Invest Dermatol 121:
1500–1509.
17. Maggiolini M, Vivacqua A, Fasanella G, Recchia AG, Sisci D, et al. (2004) The
G protein-coupled receptor GPR30 mediates c-fos up-regulation by 17beta-
estradiol and phytoestrogens in breast cancer cells. J Biol Chem 279: 27008–
27016.
18. Albanito L, Madeo A, Lappano R, Vivacqua A, Rago V, et al. (2007) G protein-
coupled receptor 30 (GPR30) mediates gene expression changes and growth
response to 17beta-estradiol and selective GPR30 ligand G-1 in ovarian cancer
cells. Cancer Res 67: 1859–1866.
19. Vivacqua A, Bonofiglio D, Albanito L, Madeo A, Rago V, et al. (2006) 17beta-
estradiol, genistein, and 4-hydroxytamoxifen induce the proliferation of thyroid
cancer cells through the g protein-coupled receptor GPR30. Mol Pharmacol 70:
1414–1423.
20. Persechini A, Kretsinger RH (1988) The central helix of calmodulin functions as
a flexible tether. J Biol Chem 263: 12175–12178.
21. Shen X, Valencia CA, Szostak JW, Dong B, Liu R (2005) Scanning the human
proteome for calmodulin-binding proteins. Proc Natl Acad Sci U S A 102:
5969–5974.
22. Jurado LA, Chockalingam PS, Jarrett HW (1999) Apocalmodulin. Physiol Rev
79: 661–682.
23. Levitan IB (1999) It is calmodulin after all! Mediator of the calcium modulation
of multiple ion channels. Neuron 22: 645–648.
24. Lu KP, Means AR (1993) Regulation of the cell cycle by calcium and
calmodulin. Endocr Rev 14: 40–58.
25. Tran QK, Black DJ, Persechini A (2003) Intracellular coupling via limiting
calmodulin. J Biol Chem 278: 24247–24250.
26. Tran QK, Black DJ, Persechini A (2005) Dominant affectors in the calmodulin
network shape the time courses of target responses in the cell. Cell Calcium 37:
541–553.
27. Luby-Phelps K, Hori M, Phelps JM, Won D (1995) Ca(2+)-regulated dynamic
compartmentalization of calmodulin in living smooth muscle cells. J Biol Chem
270: 21532–21538.
28. Song Q, Saucerman JJ, Bossuyt J, Bers DM (2008) Differential integration of
Ca2+-calmodulin signal in intact ventricular myocytes at low and high affinity
Ca2+-calmodulin targets. J Biol Chem 283: 31531–31540.
29. Maier LS, Ziolo MT, Bossuyt J, Persechini A, Mestril R, et al. (2006) Dynamic
changes in free Ca-calmodulin levels in adult cardiac myocytes. J Mol Cell
Cardiol 41: 451–458.
30. O’Connor V, El Far O, Bofill-Cardona E, Nanoff C, Freissmuth M, et al. (1999)
Calmodulin dependence of presynaptic metabotropic glutamate receptor
signaling. Science 286: 1180–1184.
31. Minakami R, Jinnai N, Sugiyama H (1997) Phosphorylation and calmodulin
binding of the metabotropic glutamate receptor subtype 5 (mGluR5) are
antagonistic in vitro. J Biol Chem 272: 20291–20298.
32. Wang D, Sadee W, Quillan JM (1999) Calmodulin binding to G protein-
coupling domain of opioid receptors. J Biol Chem 274: 22081–22088.
33. Mahon MJ, Shimada M (2005) Calmodulin interacts with the cytoplasmic tails
of the parathyroid hormone 1 receptor and a sub-set of class b G-protein
coupled receptors. FEBS Lett 579: 803–807.
New Method to Locate CaM-Binding Domains in GPCRs
PLOS ONE | www.plosone.org 13 February 2014 | Volume 9 | Issue 2 | e89669
34. Becamel C, Alonso G, Galeotti N, Demey E, Jouin P, et al. (2002) Synaptic
multiprotein complexes associated with 5-HT(2C) receptors: a proteomicapproach. EMBO J 21: 2332–2342.
35. Turner JH, Gelasco AK, Raymond JR (2004) Calmodulin interacts with the
third intracellular loop of the serotonin 5-hydroxytryptamine1A receptor at twodistinct sites: putative role in receptor phosphorylation by protein kinase C.
J Biol Chem 279: 17027–17037.36. Bofill-Cardona E, Kudlacek O, Yang Q, Ahorn H, Freissmuth M, et al. (2000)
Binding of calmodulin to the D2-dopamine receptor reduces receptor signaling
by arresting the G protein activation switch. J Biol Chem 275: 32672–32680.37. Thomas WG, Pipolo L, Qian H (1999) Identification of a Ca2+/calmodulin-
binding domain within the carboxyl-terminus of the angiotensin II (AT1A)receptor. FEBS Lett 455: 367–371.
38. Zhang R, Liu Z, Qu Y, Xu Y, Yang Q (2013) Two Distinct Calmodulin BindingSites in the Third Intracellular Loop and Carboxyl Tail of Angiotensin II
(AT1A) Receptor. PLoS One 8: e65266.
39. Labasque M, Reiter E, Becamel C, Bockaert J, Marin P (2008) Physicalinteraction of calmodulin with the 5-hydroxytryptamine2C receptor C-terminus
is essential for G protein-independent, arrestin-dependent receptor signaling.Mol Biol Cell 19: 4640–4650.
40. Bolzon BJ, Cheung DW (1989) Isolation and characterization of single vascular
smooth muscle cells from spontaneously hypertensive rats. Hypertension 14:137–144.
41. Ulrich-Merzenich G, Metzner C, Bhonde RR, Malsch G, Schiermeyer B, et al.(2002) Simultaneous isolation of endothelial and smooth muscle cells from
human umbilical artery or vein and their growth response to low-densitylipoproteins. In Vitro Cell Dev Biol Anim 38: 265–272.
42. Leik CE, Willey A, Graham MF, Walsh SW (2004) Isolation and culture of
arterial smooth muscle cells from human placenta. Hypertension 43: 837–840.43. Persechini A (2002) Monitoring the intracellular free Ca(2+)-calmodulin
concentration with genetically-encoded fluorescent indicator proteins. MethodsMol Biol 173: 365–382.
44. Improta-Brears T, Whorton AR, Codazzi F, York JD, Meyer T, et al. (1999)
Estrogen-induced activation of mitogen-activated protein kinase requiresmobilization of intracellular calcium. Proc Natl Acad Sci U S A 96: 4686–4691.
45. Bologa CG, Revankar CM, Young SM, Edwards BS, Arterburn JB, et al. (2006)Virtual and biomolecular screening converge on a selective agonist for GPR30.
Nat Chem Biol 2: 207–212.46. Sheng JZ, Arshad F, Braun JE, Braun AP (2008) Estrogen and the Ca2+-
mobilizing agonist ATP evoke acute NO synthesis via distinct pathways in an
individual human vascular endothelium-derived cell. Am J Physiol Cell Physiol294: C1531–1541.
47. Wu TW, Wang JM, Chen S, Brinton RD (2005) 17Beta-estradiol induced Ca2+influx via L-type calcium channels activates the Src/ERK/cyclic-AMP response
element binding protein signal pathway and BCL-2 expression in rat
hippocampal neurons: a potential initiation mechanism for estrogen-inducedneuroprotection. Neuroscience 135: 59–72.
48. Haas E, Bhattacharya I, Brailoiu E, Damjanovic M, Brailoiu GC, et al. (2009)Regulatory role of G protein-coupled estrogen receptor for vascular function and
obesity. Circ Res 104: 288–291.49. O’Neil KT, DeGrado WF (1990) How calmodulin binds its targets: sequence
independent recognition of amphiphilic alpha-helices. Trends Biochem Sci 15:
59–64.50. Persechini A, Cronk B (1999) The relationship between the free concentrations
of Ca2+ and Ca2+-calmodulin in intact cells. J Biol Chem 274: 6827–6830.
51. Yap KL, Kim J, Truong K, Sherman M, Yuan T, et al. (2000) Calmodulin
target database. J Struct Funct Genomics 1: 8–14.52. Marsault R, Murgia M, Pozzan T, Rizzuto R (1997) Domains of high Ca2+
beneath the plasma membrane of living A7r5 cells. Embo J 16: 1575–1581.
53. Romoser VA, Hinkle PM, Persechini A (1997) Detection in living cells of Ca2+-dependent changes in the fluorescence emission of an indicator composed of two
green fluorescent protein variants linked by a calmodulin-binding sequence.A new class of fluorescent indicators. J Biol Chem 272: 13270–13274.
54. Kim SA, Heinze KG, Waxham MN, Schwille P (2004) Intracellular calmodulin
availability accessed with two-photon cross-correlation. Proc Natl Acad Sci U S A101: 105–110.
55. Tran QK, Leonard J, Black DJ, Nadeau OW, Boulatnikov IG, et al. (2009)Effects of combined phosphorylation at Ser-617 and Ser-1179 in endothelial
nitric-oxide synthase on EC50(Ca2+) values for calmodulin binding and enzymeactivation. J Biol Chem 284: 11892–11899.
56. Tran QK, Leonard J, Black DJ, Persechini A (2008) Phosphorylation within an
autoinhibitory domain in endothelial nitric oxide synthase reduces the Ca(2+)concentrations required for calmodulin to bind and activate the enzyme.
Biochemistry 47: 7557–7566.57. Sanden C, Broselid S, Cornmark L, Andersson K, Daszkiewicz-Nilsson J, et al.
(2010) G Protein-Coupled Estrogen Receptor 1 (GPER1)/GPR30 Localizes in
the Plasma Membrane and Trafficks Intracellularly on Cytokeratin IntermediateFilaments. Mol Pharmacol.
58. Otto C, Rohde-Schulz B, Schwarz G, Fuchs I, Klewer M, et al. (2008) Gprotein-coupled receptor 30 localizes to the endoplasmic reticulum and is not
activated by estradiol. Endocrinology 149: 4846–4856.59. Cheng SB, Quinn JA, Graeber CT, Filardo EJ (2011) Downmodulation of the
G-protein-coupled estrogen receptor, GPER, from the cell surface occurs via a
transgolgi-proteasome pathway. J Biol Chem.60. Pinton P, Pozzan T, Rizzuto R (1998) The Golgi apparatus is an inositol 1,4,5-
trisphosphate-sensitive Ca2+ store, with functional properties distinct from thoseof the endoplasmic reticulum. Embo J 17: 5298–5308.
61. Pizzo P, Lissandron V, Capitanio P, Pozzan T (2011) Ca(2+) signalling in the
Golgi apparatus. Cell Calcium 50: 184–192.62. Chachisvilis M, Zhang YL, Frangos JA (2006) G protein-coupled receptors sense
fluid shear stress in endothelial cells. Proc Natl Acad Sci U S A 103: 15463–15468.
63. Yazawa M, Vorherr T, James P, Carafoli E, Yagi K (1992) Binding of calciumby calmodulin: influence of the calmodulin binding domain of the plasma
membrane calcium pump. Biochemistry 31: 3171–3176.
64. Bouhoute A, Leclercq G (1992) Antagonistic effect of triphenylethylenicantiestrogens on the association of estrogen receptor to calmodulin. Biochem
Biophys Res Commun 184: 1432–1440.65. Bouhoute A, Leclercq G (1995) Modulation of estradiol and DNA binding to
estrogen receptor upon association with calmodulin. Biochem Biophys Res
Commun 208: 748–755.66. Li L, Li Z, Howley PM, Sacks DB (2006) E6AP and calmodulin reciprocally
regulate estrogen receptor stability. J Biol Chem 281: 1978–1985.67. Li Z, Joyal JL, Sacks DB (2001) Calmodulin enhances the stability of the
estrogen receptor. J Biol Chem 276: 17354–17360.68. Li L, Li Z, Sacks DB (2005) The transcriptional activity of estrogen receptor-
alpha is dependent on Ca2+/calmodulin. J Biol Chem 280: 13097–13104.
69. Zhang Y, Li Z, Sacks DB, Ames JB (2012) Structural basis for Ca2+-inducedactivation and dimerization of estrogen receptor alpha by calmodulin. J Biol
Chem 287: 9336–9344.
New Method to Locate CaM-Binding Domains in GPCRs
PLOS ONE | www.plosone.org 14 February 2014 | Volume 9 | Issue 2 | e89669