biosensors and bioelectronics - bmp...
TRANSCRIPT
Biosensors and Bioelectronics 87 (2017) 646–653
Contents lists available at ScienceDirect
Biosensors and Bioelectronics
http://d0956-56
n CorrColorad
E-m1 Co
journal homepage: www.elsevier.com/locate/bios
A sensitive DNA capacitive biosensor using interdigitated electrodes
Lei Wang a,1, Milena Veselinovic b,1, Lang Yang c, Brian J. Geiss a,b, David S. Dandy a,d,Tom Chen a,c,n
a School of Biomedical Engineering, Colorado State University, Fort Collins, CO 80523, USAb Department of Microbiology, Immunology & Pathology, Colorado State University, Fort Collins, CO 80523, USAc Department of Electrical & Computer Engineering, Colorado State University, Fort Collins, CO 80523, USAd Department of Chemical & Biological Engineering, Colorado State University, Fort Collins, CO 80523, USA
a r t i c l e i n f o
Article history:Received 17 June 2016Received in revised form18 August 2016Accepted 1 September 2016Available online 2 September 2016
Keywords:Affinity-based capacitive biosensorInterdigitated electrodesNucleic acid-based biosensorViral diagnosticsPathogen detectionPoint-of-care diagnostics
x.doi.org/10.1016/j.bios.2016.09.00663/& 2016 Elsevier B.V. All rights reserved.
esponding author at: Department of Electrico State University, Fort Collins, CO 80523, USAail address: [email protected] (T. Chenntributed equally to this work.
a b s t r a c t
This paper presents a label-free affinity-based capacitive biosensor using interdigitated electrodes. Usingan optimized process of DNA probe preparation to minimize the effect of contaminants in commercialthiolated DNA probe, the electrode surface was functionalized with the 24-nucleotide DNA probes basedon the West Nile virus sequence (Kunjin strain). The biosensor has the ability to detect complementaryDNA fragments with a detection limit down to 20 DNA target molecules (1.5 aM range), making it sui-table for a practical point-of-care (POC) platform for low target count clinical applications without theneed for amplification. The reproducibility of the biosensor detection was improved with efficientcovalent immobilization of purified single-stranded DNA probe oligomers on cleaned gold microelec-trodes. In addition to the low detection limit, the biosensor showed a dynamic range of detection from1 mL�1 to 105 mL�1 target molecules (20 to 2 million targets), making it suitable for sample analysis in atypical clinical application environment. The binding results presented in this paper were validated usingfluorescent oligomers.
& 2016 Elsevier B.V. All rights reserved.
1. Introduction
As universal biological information storage entities, nucleicacids (DNA and RNA) are unique biorecognition molecules, and thedetection of pathogen genomic DNA or RNA provides one of themost reliable methods for viral infectious disease diagnostics.Emerging and remerging infectious pathogens, such as Ebola,Middle East Respiratory Syndrome (MERS), West Nile, dengue andZika viruses create a strong need for a low-cost, point-of-care(POC) diagnostic platform that would enable rapid and sensitivepathogen detection (Woolhouse et al., 2015; Zumla et al., 2015;Daep et al., 2014; Petersen et al., 2016). Early and accurate detec-tion of viral infectious diseases is of crucial importance in pre-venting epidemic disease outbreaks as well as in improving theefficacy of POC diagnostic technologies (Peeling and McNerney,2014; Sin et al., 2014). In use since the early 1990s, quantitativereal-time polymerase chain reaction (qPCR) amplification has beena gold standard in viral diagnostics (Yang and Rothman, 2004;Espy et al., 2006). While qPCR offers high specificity with lowlimits of detection, it and other similar existing diagnostic
al & Computer Engineering,.
).
methods have their drawbacks, such as the use of expensive de-vices for repeated thermal cycling, specialized non-reusable re-agents, the need for sensitive fluorescence detection optics, andlaborious assay preparation steps requiring trained personnel(Timmer and Villalobos, 1993). For example, a typical qPCR willrequire highly trained technicians 4–8 h from sample preparationto completion using reagents such as specific TaqMan probes andmatching master mixes with reverse transcriptase enzymes andDNA polymerase, costing up to hundreds of dollars per assay de-pending on sample number and origin. Consequently, such ana-lytical methods do not align with the need for a rapid, inexpensive,highly specific and sensitive point-of-care platform (Craw andBalachandran, 2012; Peeling and McNerney, 2014; Sin et al., 2014).
One of the cost-effective alternatives to PCR-based detection ofpathogen genomic DNA relies on measurement of electricalproperty changes (resistance, capacitance, and complex im-pedance) due to DNA-DNA hybridization at probe-target bindingsites without labeling. Such a sensing modality has been usedsuccessfully to detect specific DNA molecules in complex mixturesin a number of different assays, making it attractive for reliableclassification of target DNA (Boyd, 2013; Ventimiglia and Petralia,2013; Drummond et al., 2003; Byron et al., 2016; Marzancola et al.,2016). Electrode configuration and geometry can have a significanteffect on sensor performance (Pettine et al., 2012). One of thewidely used electrode configurations, especially for sensors
L. Wang et al. / Biosensors and Bioelectronics 87 (2017) 646–653 647
measuring capacitance changes due to DNA-DNA hybridization(capacitive biosensors), is the interdigitated microelectrode. Mi-croelectrodes are often made using modern photolithographic anddeposition techniques on glass, silicon, or other solid substrates(Blanda, 1991; Gawad et al., 2009; Pettine et al., 2012). When theyare tightly integrated with the back-end measurement circuits,they have significant advantages over conventional carbon-basedelectrodes (Li and Miao, 2012) for analytical measurements, suchas low resistance, high signal-to-noise ratio, rapid attainment ofsteady state, and the use of small solution volumes (Dandy et al.,2007; Yang and Bashir, 2008; Wydallis et al., 2015).
Operating modalities of biosensors using interdigitated elec-trodes (IDEs) can be non-faradaic (Stagni et al., 2006) or faradaic(Chornokur et al., 2011). The biosensor presented in this paperoperates in the non-faradaic mode based on changes in capaci-tance between interdigitated electrodes to indicate molecularbinding events at the electrode surface. Biosensors operating inthe faradaic mode are often based on electrochemical impedancespectroscopy (EIS) (Daniels and Pourmand, 2007; Lisdat andSchäfer, 2008) by measuring electron transfer resistance anddouble layer capacitance within a frequency range. Comparing tocapacitive biosensors, biosensors based on EIS have been widelyexplored for their ability to capture complex resistance changesdue to binding events at biosensor's electrode sites. However, theyare more complex from an electronics and experimental protocolperspective, requiring a wide-range frequency sweep and the useof a potentially hazardous redox couple (e.g. Fe(CN)63� /4�) formeasuring faradaic current. With the simplicity of measuring ca-pacitance change between electrodes due to DNA-DNA hy-bridization between targets and probes, combined with low limitof detection (LOD) and high specificity, the results from this papershow that label-free capacitive biosensors have the potential as abaseline technology for low-cost, low-power, easy to use rapiddetection POC platform (Bracke et al., 2007).
To date, capacitive biosensors developed for DNA/RNA classifi-cation and pathogen detection have focused on improving theelectrode surface modification process, achieving better transdu-cer sensitivity, and increasing detection circuit sensitivity andsignal-to-noise ratio (SNR). Berggren et al. (1999) reported a label-free capacitive detection method for DNA detection, and pushedthe limit of detection down to 25 complementary DNA targets permL. Moreno-Hagelsieb et al. (2004) demonstrated the use of aninexpensive Al/Al2O3 hybrid electrode to achieve good sensitivity.Guiducci et al. (2006) elucidated a number of important detailsrelevant to charge-based capacitance measurements, and providedinsights into CMOS compatible implementation for integratedelectronics. Stagni et al. (2006) demonstrated a capacitive bio-sensor design with a detection range of 330 pF to 10 mF with goodlinearity. Lee et al. (2010) developed CMOS circuitry based oncharge/discharge theory for detecting capacitive signals to de-monstrate its ability to detect 2 nM of target nucleic acid fromH5N1 Influenza viruses. Qureshi et al. (2010) achieved multiplexeddetection using an interdigitated electrode array, with 25 pg/mLsensitivity to the complementary target. Eberhardt et al. (2011)reported a bio-inspired artificial whisker to monitor fluid motionusing capacitive sensing. Kallempudi and Gurbuz (2011) proposeda capacitance detection method using Fourier transform infraredspectroscopy (FT-IR) at high frequency, and achieved a 1 ng/mLdetection limit. Wright and Chen (2015) demonstrated an ultra-sensitive read-out circuit for measuring capacitance changes cap-able of sub-fF detection limit.
However, even with more than a decade of progress in capa-citive biosensor development, significant challenges remain. Anumber of studies (Berggren et al., 1999; Qureshi et al., 2010) re-ported poor sensor-to-sensor reproducibility. Non-uniformity ofthe self-assembled monolayer (SAM) and the covalently attached
DNA probes on the sensor surface is a major contributing factor topoor sensor-to-sensor reproducibility. Sensor surface cleanlinessgreatly affects the uniformity of SAM layers (Love et al., 2005).Covalently attached ssDNA probes are largely affected by thepresence of common contaminants in commercial thiolated DNAprobes (Lee et al., 2010). The lack of emphasis on electrodecleaning prior to assay functionalization may have also con-tributed to significant variations of the reported results. Stagniet al. (2006) elucidated the importance of electrode surfacecleaning in order to achieve uniform covalent binding of thiolatedDNA probes. In addition, the total surface area of microelectrodesand the geometric relationship between two electrodes in a bio-sensor are other factors which directly affect sensor sensitivity andreproducibility, as measured capacitance output represents aver-aged values from all the fingers of the microelectrodes (Guiducciet al., 2004).
Here, a label-free, affinity-based capacitive IDE sensor is de-veloped for unamplified nucleic acid detection, with high sensi-tivity and reproducibility. The proposed platform technology usescapacitance changes resulting from the solid-phase hybridizationof nucleic acid targets with ssDNA probes immobilized on micro-electrodes as the means of detection and identification. A 24-nu-cleotide DNA probe and target set was designed based on the WestNile virus sequence (Kunjin strain) and was applied as a model fornucleic acid based viral recognition and detection on the proposedcapacitive biosensor (Steel et al., 2000; Oliveira et al., 2015). Theprocess of DNA probe preparation for the biosensor has been op-timized to include steps to minimize the effect of contaminantsassociated with commercial thiolated DNA probes. It is demon-strated here that this new biosensor produces an output of morethan 70 nF in capacitance change in response to as few as 20complementary DNA targets (0.25 attogram) at a concentration of�1.5 aM. Due to the optimized cleaning process for the capacitivebiosensor, including a pre-cleaning protocol, to improve covalentimmobilization of purified single-stranded DNA probe oligomersonto the microelectrodes, the biosensor's reproducibility was im-proved compared to the reported results. In addition to the lowdetection limit, the biosensor showed a good dynamic range ofdetection from 1 mL�1 to 105 mL�1 target molecules (20 to 2 mil-lion total targets), making it suitable for sample analysis in a ty-pical clinical application environment. The capacitance resultsobtained in this study were verified using fluorescently labeledoligonucleotides on a fluorescence scanner. Capacitive affinity-based assays have long been considered highly sensitive (Mat-tiasson and Hedstrom, 2016), but low specificity and reproduci-bility (Berggren et al., 1999) hinder further improvement in theirsensitivity. The results presented in this paper provide a potentialpath for practical use of capacitive sensing technology for viralpathogen detection in clinical settings.
2. Materials and methods
2.1. DNA oligonucleotides and reagents
Validated HPLC purified DNA oligonucleotides were purchasedfrom Integrated DNA Technologies (IDT, Inc., Coralville, IA). Thesequences for single-strand DNA (ssDNA) oligonucleotides werebased on the sequence of the West Nile Kunjin strain (GenbankAccession # AY274504) and were as follows:
DNA probe (Oligo 1):5′-ThioMC6-D-TAGTATGCACTGGTGTCTATCCCT-3′Complementary DNA target – 100% complementarity (Oligo 2):5′-AGGGATAGACACCAGTGCATACTA-3′Noncomplementary DNA target (Oligo 3):5′-GCAATATAGATAACGCCAGATGGC-3′
L. Wang et al. / Biosensors and Bioelectronics 87 (2017) 646–653648
Probe and target DNAs were resuspended in 1 ×TE-MgSO4
buffer (TE stands for Tris–HCI and EDTA), which contained 100 mMmagnesium sulfate (MgSO4), 1 mM Tris-Hydrochloride (Tris–HCl)and 0.1 mM Ethylenediaminetetraacetic acid (EDTA), and were fil-tered through a 0.45 mm syringe filter (Millipore) prior to use. The24-mer oligonucleotide DNA probe (Oligo1) was selected to form astable duplex with its complementary target (Oligo 2) at roomtemperature, with minimal interference due to self-com-plementarity or secondary structure. The non-complementarytarget (Oligo 3) has 1 out of 24 base pairs complementary witholigo1 (4.16% complementarity).
For fluorescence detection, a second probe was generated thatwas 5′-thiolated (C6 propyl spacer) with a 3′-fluorescent AlexaFluor 488 label (5′-ThioMC6-D/TAGTATGCACTGGTGTCTATCCCT/AlexF488N/-3′), while complementary and non-complementarytargets were 5′-labeled with fluorescent Alexa Fluor 594 dye (5′-Alex594N/AGGGATAGACACCAGTGCATACTA-3′ or 5′-Alex594N/GCAATATAGATAACGCCAGATGGC-3′). The 11-Mercapto-1-un-decanol (MCU) (97%; Sigma-Aldrich, St. Louis, MO) was dissolvedin water and filtered through a 0.45 mm syringe filter (Millipore)prior to use. Potassium hydroxide (KOH) and hydrogen peroxide(H2O2, 30% w/w in H2O) (Sigma-Aldrich, St. Louis, MO) were usedas received. Milli-Q water from Millipore (Billerica, MA)(18.2 MΩ cm) was used in all experiments.
2.2. Gold interdigitated microelectrodes sensor
Commercial gold coated IDE sensors were purchased fromDropSens (Asturias, Spain). Each IDE has a finger width and spa-cing of 10 mm, with a total number of 125 fingers, a total electrodelength of 6760 mm, and electrode surface area of 8.45 mm2. Tita-nium is present as an adhesive layer.
2.3. Capacitance measurement setup
Capacitance measurement data were collected using the InstekLCR-821 benchtop LCR meter (New Taipei City, Taiwan), whichinterfaces with a PC for data acquisition. A graphical user interface(GUI) on the PC was used for sending command signals to the LCRmeter. Since the measurement is obtained from non-faradaiccurrent, a 0 V DC bias voltage was applied across the IDE sensor. A20 mV root mean square (RMS) AC voltage with 20 Hz frequencywas applied to the IDE sensors. All capacitance readouts were re-corded under 20 mL of 100 mM 1×TE-MgSO4 buffer on the inter-digitated electrodes and 50 data points were collected per reading.Capacitance data were analyzed using Matlab (Mathworks) andstatistical tests were carried out with R (www.r-project.org). Onlypo0.05 values were considered as statistically significant.
2.4. Melt curve generation for buffer optimization
A CFX 96 Real Time system (C1000 Thermal cycler, Bio-Rad)was used to generate melt curves in order to follow DNA probeinteractions with complementary and non-complementary targetoligos through double stranded DNA (dsDNA) formation underdifferent buffer types and concentrations. For each case fluores-cence emission was detected every 5 s from 4 °C to 95 °C at 0.5 °Cdegree increments. The duplex (dsDNA) formation reaction wascarried out under different buffer conditions, specifically, in 1 Mand 100 mM 1×TE-NaCl, and 1 mM and 100 mM 1×TE-MgSO4. TheDNA probe to DNA target ratio was fixed at 1:1 for 1 mg/mL oligosfor all reactions. SYBR Green nucleic acid gel stain (Life Technol-ogies, Carlsbad, CA) was included in all reactions as a real timeindicator of the presence of dsDNA.
2.5. Pretreatment of the gold electrodes surface
Upon exposure to ambient conditions the gold microelectrodesurface is subject to a variety of uncontrolled conditions andcontaminants, which can affect thiol reaction kinetics and there-fore the probe attachment chemistry; because of this variability, acleaning step is required immediately prior to functionalization. Toprepare the surfaces, the chips with the gold microelectrodes wereimmersed in a solution of 50 mM KOH and 25% H2O2 for 10 min(Fischer et al., 2009), and thoroughly rinsed in Milli-Q water toremove the reagents, followed by oxygen plasma treatment.Baseline capacitance was recorded immediately following chemi-cal cleaning and prior to plasma cleaning and probeimmobilization.
2.6. Pretreatment of thiolated single-stranded DNA oligomers
In order for thiol bond formation between the oligo and thegold surface to proceed as expected, the 5′ thiol-modified oligo-mers require a reduction of the disulfide bonds prior to applica-tion. Immobilized TCEP Disulfide Reducing Gel (Thermo FisherScientific, Waltham, MA) was washed several times with 100 mM1×TE-MgSO4 buffer prior to oligo addition in a 2:1 TCEP gel:oligoratio, and the mixture was incubated for 1 h on a rocker platformat 23 °C. After incubation and a 1500 rpm spin for 2 min, the su-pernatant with reduced thiol-modified oligomers was transferredto a clean tube.
2.7. SH-modified DNA probe oligonucleotide immobilization
Gold IDE sensors were plasma-cleaned for 5 min in an O2
Plasma Etch PE-25 (Plasma Etch, Carson City, NV, USA) at a pres-sure of 200 mTorr and 150 W applied to the RF coil immediatelybefore DNA probe incubation. The 10 mM ssDNA probe solutionwas prepared in 100 mM 1 ×TE-MgSO4 buffer, and the gold mi-croelectrodes were immersed overnight (15–17 h) in 30 mL of thesolution, then rinsed copiously with 100 mM 1×TE-MgSO4 bufferand Milli-Q water, and dried with N2. The IDE sensors were thenpassivated with 20 mL MCU (5 mM in water) for 45 min to fill va-cant gold sites and promote linear orientation of the ssDNA probemolecules. After MCU passivation, the electrodes were rinsed withwater and dried with N2. All reactions were carried out at 23 °C.
2.8. DNA target hybridization
The IDA sensors were immersed in 20 mL target DNA solutionsfor 30 min at room temperature, at target concentrations rangingfrom 1 mL�1 to 105 mL�1 in 100 mM 1×TE-MgSO4 buffer. Followingincubation, electrodes were copiously rinsed with 100 mM 1×TE-MgSO4 buffer and dried with N2.
2.9. Fluorescence scanning
Gold IDA sensors were scanned using a FLUOstar Omegafluorescence scanner (BMG LABTECH, Cary, NC). Fluorescent AlexaFluor 488 and Alexa Fluor 594 signals from the sensors werequantified and analyzed using the FLUOstar Omega softwareagainst experimental controls. The paired t-test was used for sta-tistical analysis and only po0.05 values were considered to bestatistically significant.
L. Wang et al. / Biosensors and Bioelectronics 87 (2017) 646–653 649
3. Results and discussion
3.1. Measurement setup
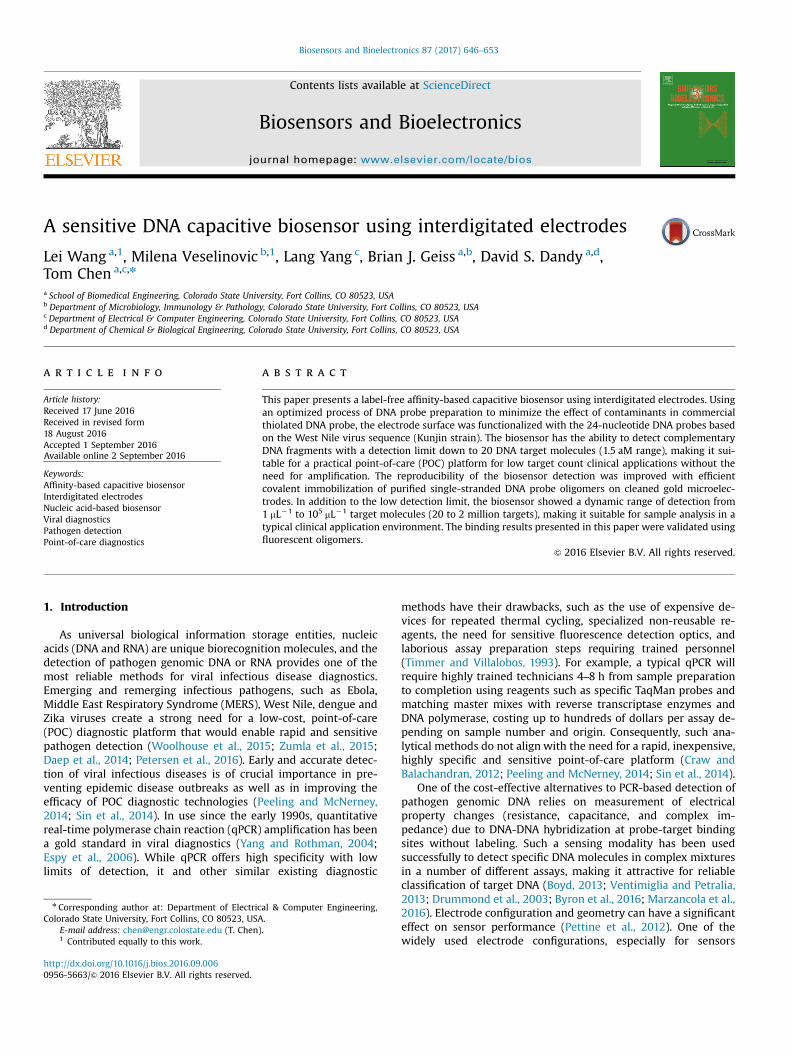
The experiments carried out using the functionalized IDE sen-sors focus on quantifying the key sensor performance metrics ofsensitivity and selectivity. To obtain these data, capacitance valuesof the IDE sensors were measured at four different stages of thesensing process:
1. Cleaned bare gold electrode surfaces. The initial cleaning stepwas always applied to provide a baseline capacitance response.
2. Electrodes after covalent attachment of thiolated ssDNA probes.The layer of immobilized DNA probes has the intrinsic ability tocapture complementary single-stranded target oligonucleotides.
3. Electrodes after incubation with MCU. The measured capaci-tance at this stage is with the presence of buffer without any
Fig. 1. Equivalent circuit models on interdigitated electrode (IDE) sensors. (A) Bare(C) Equivalent circuit model after probe immobilization. (D) Equivalent circuit model aftetarget hybridization for complementary targets.
target DNA present in the buffer. The MCU is used to block anyremaining unoccupied sites on the sensor surface and to alignthe probes perpendicular to the sensor surface in order to im-prove hybridization efficiency (Herne and Tarlov, 1997).
4. Electrodes after incubation and hybridization with ssDNA tar-gets, both complementary and non-complementary.
Capacitance between IDE pairs was obtained by applying a20 mV RMS AC voltage with a fixed frequency (stimulus) and bymeasuring the resulting current through the sensor IDE pair (re-sponse). The measurements of capacitance with the bare cleanelectrodes and with immobilized probes are mainly intended forverifying the state of probe immobilization. Unless otherwisestated, the change in capacitance after hybridization with eithercomplementary or non-complementary targets is referred to as thedifference between the capacitances before and after hybridization(i.e. capacitance difference between stage 3 and stage 4).
IDEs with multiple fingers. (B) Equivalent circuit model for bare IDE sensors.r MCU incubation and before target hybridization. (E) Equivalent circuit model after
L. Wang et al. / Biosensors and Bioelectronics 87 (2017) 646–653650
Fig. 1A shows a schematic of the IDE sensor and Fig. 1B–E showthe equivalent circuits for stages 1, 2, 3, and 4, respectively. Thequantity Rsol is the intrinsic buffer solution resistance; Rleak is anequivalent resistance representing a leakage current goingthrough the electrode-electrolyte interface; Cdl is the double layercapacitance created between the IDEs and adjacent buffer (Fig. 1B)resulting from the applied voltage; and Cgeo is the geometric ca-pacitance which depends on the geometry of the electrodes andtheir configuration, which may be negligible relative to the doublelayer capacitance (Stagni et al., 2006). The quantity △Cdl probe, is theamount of change in double layer capacitance after probe im-mobilization, and is different from Cdl because the ssDNA attach-ment modifies the surface capacitive characteristics of the elec-trodes. The additional double layer capacitance ∆Cdl M, results fromincubation with MCU, and ∆Cdl T, is the double layer capacitancechange due to target hybridization.
Because the MCU blocking agent acts as an insulation layer thatpushes mobile ions away from the electrode into the solution, thetotal double layer capacitance is expected to decrease after theMCU step in stage 3. Similarly, after incubation and hybridizationwith the complementary and non-complementary target DNA instage 4, the resulting duplex structures should act to repel addi-tional ions away from the electrode surface, resulting in furtherdecreases in the double layer capacitance. These behaviors are il-lustrated in Fig. 1C and D, where the sequential decreases in totaldouble layer capacitance after the MCU and target incubation aredenoted by ∆Cdl M, and ∆Cdl T, in a series configuration, and con-nected to the baseline double layer capacitance, Cdl.
3.2. Effect of buffer composition and temperature on hybridization
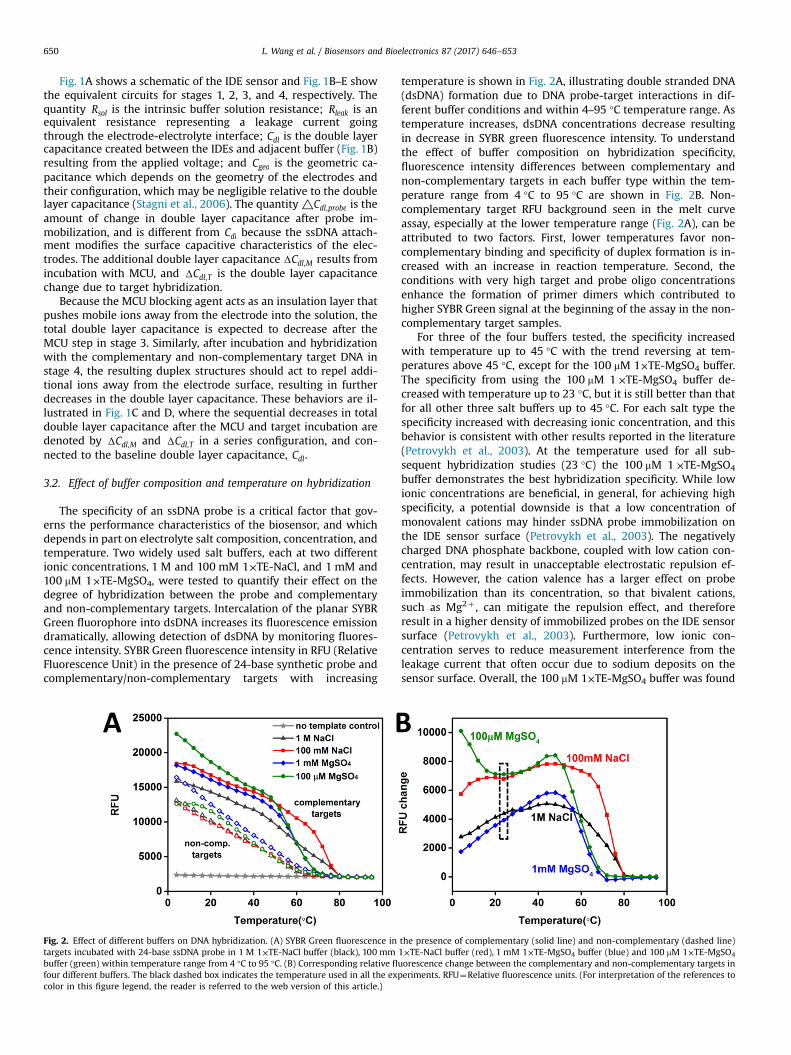
The specificity of an ssDNA probe is a critical factor that gov-erns the performance characteristics of the biosensor, and whichdepends in part on electrolyte salt composition, concentration, andtemperature. Two widely used salt buffers, each at two differentionic concentrations, 1 M and 100 mM 1×TE-NaCl, and 1 mM and100 mM 1×TE-MgSO4, were tested to quantify their effect on thedegree of hybridization between the probe and complementaryand non-complementary targets. Intercalation of the planar SYBRGreen fluorophore into dsDNA increases its fluorescence emissiondramatically, allowing detection of dsDNA by monitoring fluores-cence intensity. SYBR Green fluorescence intensity in RFU (RelativeFluorescence Unit) in the presence of 24-base synthetic probe andcomplementary/non-complementary targets with increasing
Fig. 2. Effect of different buffers on DNA hybridization. (A) SYBR Green fluorescence intargets incubated with 24-base ssDNA probe in 1 M 1×TE-NaCl buffer (black), 100 mmbuffer (green) within temperature range from 4 °C to 95 °C. (B) Corresponding relative flufour different buffers. The black dashed box indicates the temperature used in all the expcolor in this figure legend, the reader is referred to the web version of this article.)
temperature is shown in Fig. 2A, illustrating double stranded DNA(dsDNA) formation due to DNA probe-target interactions in dif-ferent buffer conditions and within 4–95 °C temperature range. Astemperature increases, dsDNA concentrations decrease resultingin decrease in SYBR green fluorescence intensity. To understandthe effect of buffer composition on hybridization specificity,fluorescence intensity differences between complementary andnon-complementary targets in each buffer type within the tem-perature range from 4 °C to 95 °C are shown in Fig. 2B. Non-complementary target RFU background seen in the melt curveassay, especially at the lower temperature range (Fig. 2A), can beattributed to two factors. First, lower temperatures favor non-complementary binding and specificity of duplex formation is in-creased with an increase in reaction temperature. Second, theconditions with very high target and probe oligo concentrationsenhance the formation of primer dimers which contributed tohigher SYBR Green signal at the beginning of the assay in the non-complementary target samples.
For three of the four buffers tested, the specificity increasedwith temperature up to 45 °C with the trend reversing at tem-peratures above 45 °C, except for the 100 mM 1×TE-MgSO4 buffer.The specificity from using the 100 mM 1 ×TE-MgSO4 buffer de-creased with temperature up to 23 °C, but it is still better than thatfor all other three salt buffers up to 45 °C. For each salt type thespecificity increased with decreasing ionic concentration, and thisbehavior is consistent with other results reported in the literature(Petrovykh et al., 2003). At the temperature used for all sub-sequent hybridization studies (23 °C) the 100 mM 1 ×TE-MgSO4
buffer demonstrates the best hybridization specificity. While lowionic concentrations are beneficial, in general, for achieving highspecificity, a potential downside is that a low concentration ofmonovalent cations may hinder ssDNA probe immobilization onthe IDE sensor surface (Petrovykh et al., 2003). The negativelycharged DNA phosphate backbone, coupled with low cation con-centration, may result in unacceptable electrostatic repulsion ef-fects. However, the cation valence has a larger effect on probeimmobilization than its concentration, so that bivalent cations,such as Mg2þ , can mitigate the repulsion effect, and thereforeresult in a higher density of immobilized probes on the IDE sensorsurface (Petrovykh et al., 2003). Furthermore, low ionic con-centration serves to reduce measurement interference from theleakage current that often occur due to sodium deposits on thesensor surface. Overall, the 100 mM 1×TE-MgSO4 buffer was found
the presence of complementary (solid line) and non-complementary (dashed line)1×TE-NaCl buffer (red), 1 mM 1×TE-MgSO4 buffer (blue) and 100 mM 1×TE-MgSO4
orescence change between the complementary and non-complementary targets ineriments. RFU¼Relative fluorescence units. (For interpretation of the references to
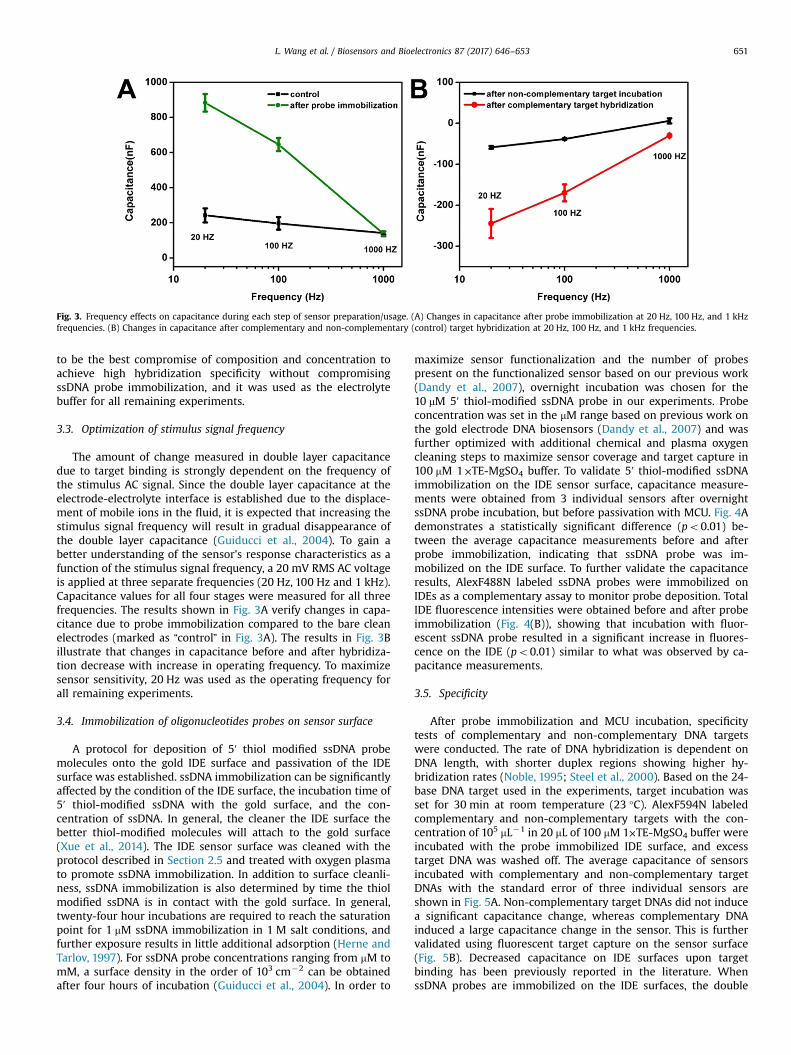
Fig. 3. Frequency effects on capacitance during each step of sensor preparation/usage. (A) Changes in capacitance after probe immobilization at 20 Hz, 100 Hz, and 1 kHzfrequencies. (B) Changes in capacitance after complementary and non-complementary (control) target hybridization at 20 Hz, 100 Hz, and 1 kHz frequencies.
L. Wang et al. / Biosensors and Bioelectronics 87 (2017) 646–653 651
to be the best compromise of composition and concentration toachieve high hybridization specificity without compromisingssDNA probe immobilization, and it was used as the electrolytebuffer for all remaining experiments.
3.3. Optimization of stimulus signal frequency
The amount of change measured in double layer capacitancedue to target binding is strongly dependent on the frequency ofthe stimulus AC signal. Since the double layer capacitance at theelectrode-electrolyte interface is established due to the displace-ment of mobile ions in the fluid, it is expected that increasing thestimulus signal frequency will result in gradual disappearance ofthe double layer capacitance (Guiducci et al., 2004). To gain abetter understanding of the sensor's response characteristics as afunction of the stimulus signal frequency, a 20 mV RMS AC voltageis applied at three separate frequencies (20 Hz, 100 Hz and 1 kHz).Capacitance values for all four stages were measured for all threefrequencies. The results shown in Fig. 3A verify changes in capa-citance due to probe immobilization compared to the bare cleanelectrodes (marked as “control” in Fig. 3A). The results in Fig. 3Billustrate that changes in capacitance before and after hybridiza-tion decrease with increase in operating frequency. To maximizesensor sensitivity, 20 Hz was used as the operating frequency forall remaining experiments.
3.4. Immobilization of oligonucleotides probes on sensor surface
A protocol for deposition of 5′ thiol modified ssDNA probemolecules onto the gold IDE surface and passivation of the IDEsurface was established. ssDNA immobilization can be significantlyaffected by the condition of the IDE surface, the incubation time of5′ thiol-modified ssDNA with the gold surface, and the con-centration of ssDNA. In general, the cleaner the IDE surface thebetter thiol-modified molecules will attach to the gold surface(Xue et al., 2014). The IDE sensor surface was cleaned with theprotocol described in Section 2.5 and treated with oxygen plasmato promote ssDNA immobilization. In addition to surface cleanli-ness, ssDNA immobilization is also determined by time the thiolmodified ssDNA is in contact with the gold surface. In general,twenty-four hour incubations are required to reach the saturationpoint for 1 mM ssDNA immobilization in 1 M salt conditions, andfurther exposure results in little additional adsorption (Herne andTarlov, 1997). For ssDNA probe concentrations ranging from mM tomM, a surface density in the order of 103 cm�2 can be obtainedafter four hours of incubation (Guiducci et al., 2004). In order to
maximize sensor functionalization and the number of probespresent on the functionalized sensor based on our previous work(Dandy et al., 2007), overnight incubation was chosen for the10 mM 5′ thiol-modified ssDNA probe in our experiments. Probeconcentration was set in the mM range based on previous work onthe gold electrode DNA biosensors (Dandy et al., 2007) and wasfurther optimized with additional chemical and plasma oxygencleaning steps to maximize sensor coverage and target capture in100 mM 1×TE-MgSO4 buffer. To validate 5′ thiol-modified ssDNAimmobilization on the IDE sensor surface, capacitance measure-ments were obtained from 3 individual sensors after overnightssDNA probe incubation, but before passivation with MCU. Fig. 4Ademonstrates a statistically significant difference (po0.01) be-tween the average capacitance measurements before and afterprobe immobilization, indicating that ssDNA probe was im-mobilized on the IDE surface. To further validate the capacitanceresults, AlexF488N labeled ssDNA probes were immobilized onIDEs as a complementary assay to monitor probe deposition. TotalIDE fluorescence intensities were obtained before and after probeimmobilization (Fig. 4(B)), showing that incubation with fluor-escent ssDNA probe resulted in a significant increase in fluores-cence on the IDE (po0.01) similar to what was observed by ca-pacitance measurements.
3.5. Specificity
After probe immobilization and MCU incubation, specificitytests of complementary and non-complementary DNA targetswere conducted. The rate of DNA hybridization is dependent onDNA length, with shorter duplex regions showing higher hy-bridization rates (Noble, 1995; Steel et al., 2000). Based on the 24-base DNA target used in the experiments, target incubation wasset for 30 min at room temperature (23 °C). AlexF594N labeledcomplementary and non-complementary targets with the con-centration of 105 mL�1 in 20 mL of 100 mM 1×TE-MgSO4 buffer wereincubated with the probe immobilized IDE surface, and excesstarget DNA was washed off. The average capacitance of sensorsincubated with complementary and non-complementary targetDNAs with the standard error of three individual sensors areshown in Fig. 5A. Non-complementary target DNAs did not inducea significant capacitance change, whereas complementary DNAinduced a large capacitance change in the sensor. This is furthervalidated using fluorescent target capture on the sensor surface(Fig. 5B). Decreased capacitance on IDE surfaces upon targetbinding has been previously reported in the literature. WhenssDNA probes are immobilized on the IDE surfaces, the double
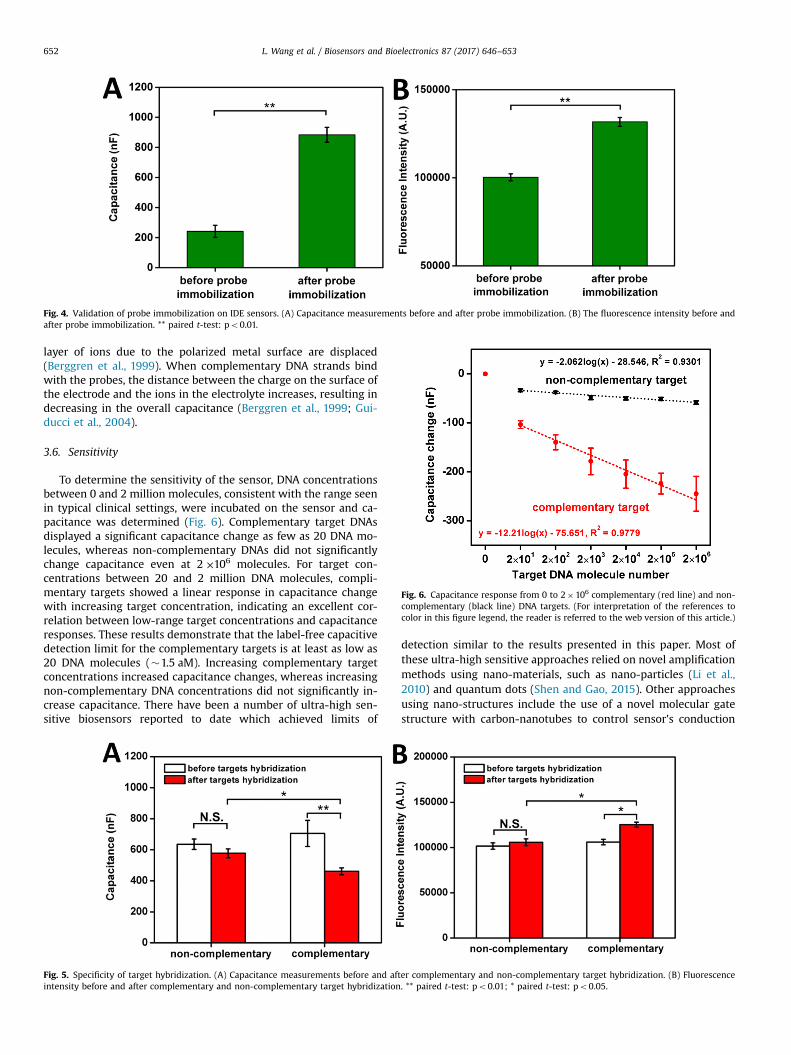
Fig. 4. Validation of probe immobilization on IDE sensors. (A) Capacitance measurements before and after probe immobilization. (B) The fluorescence intensity before andafter probe immobilization. ** paired t-test: po0.01.
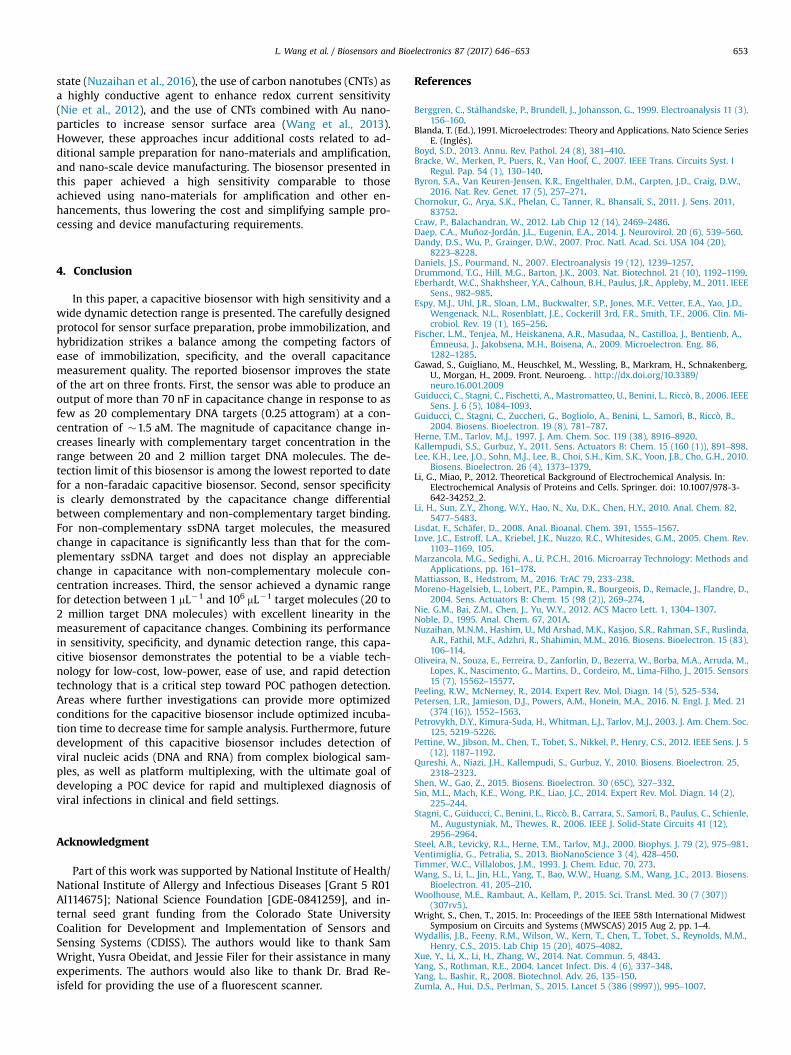
Fig. 6. Capacitance response from 0 to 2�106 complementary (red line) and non-complementary (black line) DNA targets. (For interpretation of the references tocolor in this figure legend, the reader is referred to the web version of this article.)
L. Wang et al. / Biosensors and Bioelectronics 87 (2017) 646–653652
layer of ions due to the polarized metal surface are displaced(Berggren et al., 1999). When complementary DNA strands bindwith the probes, the distance between the charge on the surface ofthe electrode and the ions in the electrolyte increases, resulting indecreasing in the overall capacitance (Berggren et al., 1999; Gui-ducci et al., 2004).
3.6. Sensitivity
To determine the sensitivity of the sensor, DNA concentrationsbetween 0 and 2 million molecules, consistent with the range seenin typical clinical settings, were incubated on the sensor and ca-pacitance was determined (Fig. 6). Complementary target DNAsdisplayed a significant capacitance change as few as 20 DNA mo-lecules, whereas non-complementary DNAs did not significantlychange capacitance even at 2 ×10⁶ molecules. For target con-centrations between 20 and 2 million DNA molecules, compli-mentary targets showed a linear response in capacitance changewith increasing target concentration, indicating an excellent cor-relation between low-range target concentrations and capacitanceresponses. These results demonstrate that the label-free capacitivedetection limit for the complementary targets is at least as low as20 DNA molecules (�1.5 aM). Increasing complementary targetconcentrations increased capacitance changes, whereas increasingnon-complementary DNA concentrations did not significantly in-crease capacitance. There have been a number of ultra-high sen-sitive biosensors reported to date which achieved limits of
Fig. 5. Specificity of target hybridization. (A) Capacitance measurements before and aftintensity before and after complementary and non-complementary target hybridization
detection similar to the results presented in this paper. Most ofthese ultra-high sensitive approaches relied on novel amplificationmethods using nano-materials, such as nano-particles (Li et al.,2010) and quantum dots (Shen and Gao, 2015). Other approachesusing nano-structures include the use of a novel molecular gatestructure with carbon-nanotubes to control sensor's conduction
er complementary and non-complementary target hybridization. (B) Fluorescence. ** paired t-test: po0.01; * paired t-test: po0.05.
L. Wang et al. / Biosensors and Bioelectronics 87 (2017) 646–653 653
state (Nuzaihan et al., 2016), the use of carbon nanotubes (CNTs) asa highly conductive agent to enhance redox current sensitivity(Nie et al., 2012), and the use of CNTs combined with Au nano-particles to increase sensor surface area (Wang et al., 2013).However, these approaches incur additional costs related to ad-ditional sample preparation for nano-materials and amplification,and nano-scale device manufacturing. The biosensor presented inthis paper achieved a high sensitivity comparable to thoseachieved using nano-materials for amplification and other en-hancements, thus lowering the cost and simplifying sample pro-cessing and device manufacturing requirements.
4. Conclusion
In this paper, a capacitive biosensor with high sensitivity and awide dynamic detection range is presented. The carefully designedprotocol for sensor surface preparation, probe immobilization, andhybridization strikes a balance among the competing factors ofease of immobilization, specificity, and the overall capacitancemeasurement quality. The reported biosensor improves the stateof the art on three fronts. First, the sensor was able to produce anoutput of more than 70 nF in capacitance change in response to asfew as 20 complementary DNA targets (0.25 attogram) at a con-centration of �1.5 aM. The magnitude of capacitance change in-creases linearly with complementary target concentration in therange between 20 and 2 million target DNA molecules. The de-tection limit of this biosensor is among the lowest reported to datefor a non-faradaic capacitive biosensor. Second, sensor specificityis clearly demonstrated by the capacitance change differentialbetween complementary and non-complementary target binding.For non-complementary ssDNA target molecules, the measuredchange in capacitance is significantly less than that for the com-plementary ssDNA target and does not display an appreciablechange in capacitance with non-complementary molecule con-centration increases. Third, the sensor achieved a dynamic rangefor detection between 1 mL�1 and 106 mL�1 target molecules (20 to2 million target DNA molecules) with excellent linearity in themeasurement of capacitance changes. Combining its performancein sensitivity, specificity, and dynamic detection range, this capa-citive biosensor demonstrates the potential to be a viable tech-nology for low-cost, low-power, ease of use, and rapid detectiontechnology that is a critical step toward POC pathogen detection.Areas where further investigations can provide more optimizedconditions for the capacitive biosensor include optimized incuba-tion time to decrease time for sample analysis. Furthermore, futuredevelopment of this capacitive biosensor includes detection ofviral nucleic acids (DNA and RNA) from complex biological sam-ples, as well as platform multiplexing, with the ultimate goal ofdeveloping a POC device for rapid and multiplexed diagnosis ofviral infections in clinical and field settings.
Acknowledgment
Part of this work was supported by National Institute of Health/National Institute of Allergy and Infectious Diseases [Grant 5 R01AI114675]; National Science Foundation [GDE-0841259], and in-ternal seed grant funding from the Colorado State UniversityCoalition for Development and Implementation of Sensors andSensing Systems (CDISS). The authors would like to thank SamWright, Yusra Obeidat, and Jessie Filer for their assistance in manyexperiments. The authors would also like to thank Dr. Brad Re-isfeld for providing the use of a fluorescent scanner.
References
Berggren, C., Stålhandske, P., Brundell, J., Johansson, G., 1999. Electroanalysis 11 (3),156–160.
Blanda, T. (Ed.), 1991. Microelectrodes: Theory and Applications. Nato Science SeriesE. (Inglés).
Boyd, S.D., 2013. Annu. Rev. Pathol. 24 (8), 381–410.Bracke, W., Merken, P., Puers, R., Van Hoof, C., 2007. IEEE Trans. Circuits Syst. I
Regul. Pap. 54 (1), 130–140.Byron, S.A., Van Keuren-Jensen, K.R., Engelthaler, D.M., Carpten, J.D., Craig, D.W.,
2016. Nat. Rev. Genet. 17 (5), 257–271.Chornokur, G., Arya, S.K., Phelan, C., Tanner, R., Bhansali, S., 2011. J. Sens. 2011,
83752.Craw, P., Balachandran, W., 2012. Lab Chip 12 (14), 2469–2486.Daep, C.A., Muñoz-Jordán, J.L., Eugenin, E.A., 2014. J. Neurovirol. 20 (6), 539–560.Dandy, D.S., Wu, P., Grainger, D.W., 2007. Proc. Natl. Acad. Sci. USA 104 (20),
8223–8228.Daniels, J.S., Pourmand, N., 2007. Electroanalysis 19 (12), 1239–1257.Drummond, T.G., Hill, M.G., Barton, J.K., 2003. Nat. Biotechnol. 21 (10), 1192–1199.Eberhardt, W.C., Shakhsheer, Y.A., Calhoun, B.H., Paulus, J.R., Appleby, M., 2011. IEEE
Sens., 982–985.Espy, M.J., Uhl, J.R., Sloan, L.M., Buckwalter, S.P., Jones, M.F., Vetter, E.A., Yao, J.D.,
Wengenack, N.L., Rosenblatt, J.E., Cockerill 3rd, F.R., Smith, T.F., 2006. Clin. Mi-crobiol. Rev. 19 (1), 165–256.
Fischer, L.M., Tenjea, M., Heiskanena, A.R., Masudaa, N., Castilloa, J., Bentienb, A.,Émneusa, J., Jakobsena, M.H., Boisena, A., 2009. Microelectron. Eng. 86,1282–1285.
Gawad, S., Guigliano, M., Heuschkel, M., Wessling, B., Markram, H., Schnakenberg,U., Morgan, H., 2009. Front. Neuroeng. . http://dx.doi.org/10.3389/neuro.16.001.2009
Guiducci, C., Stagni, C., Fischetti, A., Mastromatteo, U., Benini, L., Riccò, B., 2006. IEEESens. J. 6 (5), 1084–1093.
Guiducci, C., Stagni, C., Zuccheri, G., Bogliolo, A., Benini, L., Samorì, B., Riccò, B.,2004. Biosens. Bioelectron. 19 (8), 781–787.
Herne, T.M., Tarlov, M.J., 1997. J. Am. Chem. Soc. 119 (38), 8916–8920.Kallempudi, S.S., Gurbuz, Y., 2011. Sens. Actuators B: Chem. 15 (160 (1)), 891–898.Lee, K.H., Lee, J.O., Sohn, M.J., Lee, B., Choi, S.H., Kim, S.K., Yoon, J.B., Cho, G.H., 2010.
Biosens. Bioelectron. 26 (4), 1373–1379.Li, G., Miao, P., 2012. Theoretical Background of Electrochemical Analysis. In:
Electrochemical Analysis of Proteins and Cells. Springer. doi: 10.1007/978-3-642-34252_2.
Li, H., Sun, Z.Y., Zhong, W.Y., Hao, N., Xu, D.K., Chen, H.Y., 2010. Anal. Chem. 82,5477–5483.
Lisdat, F., Schäfer, D., 2008. Anal. Bioanal. Chem. 391, 1555–1567.Love, J.C., Estroff, L.A., Kriebel, J.K., Nuzzo, R.C., Whitesides, G.M., 2005. Chem. Rev.
1103–1169, 105.Marzancola, M.G., Sedighi, A., Li, P.C.H., 2016. Microarray Technology: Methods and
Applications, pp. 161–178.Mattiasson, B., Hedstrom, M., 2016. TrAC 79, 233–238.Moreno-Hagelsieb, L., Lobert, P.E., Pampin, R., Bourgeois, D., Remacle, J., Flandre, D.,
2004. Sens. Actuators B: Chem. 15 (98 (2)), 269–274.Nie, G.M., Bai, Z.M., Chen, J., Yu, W.Y., 2012. ACS Macro Lett. 1, 1304–1307.Noble, D., 1995. Anal. Chem. 67, 201A.Nuzaihan, M.N.M., Hashim, U., Md Arshad, M.K., Kasjoo, S.R., Rahman, S.F., Ruslinda,
A.R., Fathil, M.F., Adzhri, R., Shahimin, M.M., 2016. Biosens. Bioelectron. 15 (83),106–114.
Oliveira, N., Souza, E., Ferreira, D., Zanforlin, D., Bezerra, W., Borba, M.A., Arruda, M.,Lopes, K., Nascimento, G., Martins, D., Cordeiro, M., Lima-Filho, J., 2015. Sensors15 (7), 15562–15577.
Peeling, R.W., McNerney, R., 2014. Expert Rev. Mol. Diagn. 14 (5), 525–534.Petersen, L.R., Jamieson, D.J., Powers, A.M., Honein, M.A., 2016. N. Engl. J. Med. 21
(374 (16)), 1552–1563.Petrovykh, D.Y., Kimura-Suda, H., Whitman, L.J., Tarlov, M.J., 2003. J. Am. Chem. Soc.
125, 5219–5226.Pettine, W., Jibson, M., Chen, T., Tobet, S., Nikkel, P., Henry, C.S., 2012. IEEE Sens. J. 5
(12), 1187–1192.Qureshi, A., Niazi, J.H., Kallempudi, S., Gurbuz, Y., 2010. Biosens. Bioelectron. 25,
2318–2323.Shen, W., Gao, Z., 2015. Biosens. Bioelectron. 30 (65C), 327–332.Sin, M.L., Mach, K.E., Wong, P.K., Liao, J.C., 2014. Expert Rev. Mol. Diagn. 14 (2),
225–244.Stagni, C., Guiducci, C., Benini, L., Riccò, B., Carrara, S., Samorí, B., Paulus, C., Schienle,
M., Augustyniak, M., Thewes, R., 2006. IEEE J. Solid-State Circuits 41 (12),2956–2964.
Steel, A.B., Levicky, R.L., Herne, T.M., Tarlov, M.J., 2000. Biophys. J. 79 (2), 975–981.Ventimiglia, G., Petralia, S., 2013. BioNanoScience 3 (4), 428–450.Timmer, W.C., Villalobos, J.M., 1993. J. Chem. Educ. 70, 273.Wang, S., Li, L., Jin, H.L., Yang, T., Bao, W.W., Huang, S.M., Wang, J.C., 2013. Biosens.
Bioelectron. 41, 205–210.Woolhouse, M.E., Rambaut, A., Kellam, P., 2015. Sci. Transl. Med. 30 (7 (307))
(307rv5).Wright, S., Chen, T., 2015. In: Proceedings of the IEEE 58th International Midwest
Symposium on Circuits and Systems (MWSCAS) 2015 Aug 2, pp. 1–4.Wydallis, J.B., Feeny, R.M., Wilson, W., Kern, T., Chen, T., Tobet, S., Reynolds, M.M.,
Henry, C.S., 2015. Lab Chip 15 (20), 4075–4082.Xue, Y., Li, X., Li, H., Zhang, W., 2014. Nat. Commun. 5, 4843.Yang, S., Rothman, R.E., 2004. Lancet Infect. Dis. 4 (6), 337–348.Yang, L., Bashir, R., 2008. Biotechnol. Adv. 26, 135–150.Zumla, A., Hui, D.S., Perlman, S., 2015. Lancet 5 (386 (9997)), 995–1007.