biosimilars entry and price development in europemarket access conditions in europe, a sample of ten...
TRANSCRIPT

Biosimilars entry and price development in Europe
Elena Dacheva
Erasmus University Rotterdam The Netherlands
14th August 2015
Master’s Graduation Thesis
International Economics
Abstract
In light of the increasing interest in pricing and entry of biosimilars in Europe, this research has found that the market of filgrastim biosimilars is dominated by the entry effect, while that of epoetins is driven by the competition effect. The epoetins market gets saturated relatively faster in terms of number of local competitors, which can be explained by the molecular complexity of that medicine. For both filgrastim and epoetins, the effect of biosimilar prices on originator prices is weak. This outcome is amplified by the impossibility of direct substitution for biosimilars in Europe.
Acknowledgements The author would like to thank Teva Pharmaceuticals Europe B.V., Amsterdam, the Netherlands, and particularly the Market Access department of the organisation for the kind assistance. Their database, resources and other general input have proved immensely important and pivotal to the writing of this thesis. The author also expresses gratitude to Vladimir Karamychev, professor at Erasmus University Rotterdam, the Netherlands, for his guidance and support for the academic aspects of this research.
1. Introduction

It is a prominent feature of the continuous evolution of science to search for more effective,
comprehensive and neater solutions for all fields of human activity. That same zeal for improvement
has included the search for more effective cures for ailments and diseases. Yet, while most innovations
have been driven by forces favouring shrinkage in size, such as microchips, medicines for human use
have surprisingly been moving in the opposite direction: towards increase in size.
The past several decades have seen the pharmaceutical industry make enormous leaps in research,
discovery and development, with a particular development of complex biologic medicines. While the
first drugs were based on chemical synthesis and represented small, compact pills, the formulations
and production techniques of medicines have evolved enormously since then. The molecules which
initially revolutionised medicine by providing treatment for some wide-spread diseases were relatively
simple in terms of chemical components (Dranitsaris, 2011). Later on, however, with the advent of
technical innovation, more efficient, intricate and precise devices were introduced in R&D labs across
the developed world. This has allowed the pharmaceutical industry to enter an entirely new phase of
its development – that of producing medicines based on living organisms, namely the so-called
biologics. Typically, this type of medicines is capable of treating serious, life-threatening or
degenerative diseases, such as cancer or multiple sclerosis, and are usually better absorbed by the
human body. Thus, doctors and pharmacists have seen the drugs they provide to their patients grow
in effectiveness, as well as in size and molecular weight.
While the benefits of all these innovations for patients and society at large are indisputable, the
economic and financial considerations open up an arena for competition on part of manufacturers.
The problems which define the commercial decisions of producers of biologic medicines are somewhat
different from those of producers of simple chemical drugs. Some of the main concerns of biotech
companies are how to price their products in a way which allows them to realise earnings (that account
also for substantial return on investment), to be reinvested in new biologic medicines, and at the same
time keep on providing the products at an affordable price to those who need them most.
Importantly, as soon as the patent on an originator biologic expires, the market is open to the so-called
biosimilars, which represent a close approximation of the original molecule. In this sense, a parallel
can be drawn with originator pharmaceutical drugs, which, once their patent protection has expired,
are similarly exposed to competition by generic drugs. However, from an industry and societal
perspective, given the high cost associated with biologics and biosimilars, the price behaviour of that
2

class of medicines is particularly relevant. In some cases, price erosion of biosimilars may reach up to
72%, as happened in Norway with an infliximab biosimilar (GaBI, 2015).
It is the subject of this study to explore exactly what may influence the pricing decisions of biotech and
biosimilar companies and how the different local market considerations across Europe may play a role
in this process. In order to evaluate the impact of the country-specific regulatory environment and the
market access conditions in Europe, a sample of ten countries is considered: Bulgaria, France,
Germany, Greece, Hungary, the Netherlands, Norway, Poland, and the UK. Although the biosimilars
market has been receiving increasingly more attention, there are relatively few studies which explore
the impact of a wide collection of non-numeric variables. What the present research aims to achieve
is show how price erosion of biosimilar products cannot be solely ascribed to the number of local
competitors as main determinants of price development. Researchers on the topic of biosimilars in
Europe are unanimous in recognizing the diversity of regulatory structures (Roediger, 2015; Grabowski
et al., 2014). Therefore, it is interesting to see which variables are most potent in determining the
pricing decisions of biotech companies. The regulatory and market access environments in Europe are
complex and constantly evolving. The purely regulatory elements involve discussions about risk-
benefit analyses of new medicines and are typically conducted with regulatory agencies such as the
European Medicines Agency (EMA). Market access, in turn, deals with multiple other tasks, and one of
them is to achieve the right price and reimbursement (P&R) level of medicines in a certain country.
Given that each country has a unique market access environment in terms of procedures and
requirements, biotech and biosimilar companies devote special attention to these factors. In that
sense, governments often introduce multiple mechanisms for price control (such as mandatory price
cuts) or purchasing (such as tenders). Since that environment is constantly evolving, it is important to
understand what type of policies may be introduced in certain European markets, based on the success
of these very policies in other countries. Thus, the conclusions drawn from this research inform the
understanding of the magnitude of impact of certain drivers of biosimilars price erosion in a
heterogeneous group of European countries, while also taking heed of regulatory parameters.
In order to provide a clear industry-specific context in which the economic conclusions can be
interpreted, it is important that some background information on the considered medicines should be
given. The specific terminology used throughout this paper is left to Subsection A in the Appendix. The
other characteristics which build up the profile of small molecules and biologics are briefly explained
here. Due to the higher molecular complexity of biologic drugs (Table 1), the potential side effects of
these products on patients may be more or less severe. This in turn affects physicians’ willingness to
prescribe biosimilars should such be present on the market at any time. The main reason for this
3

reluctance is the lack of accumulated medical evidence, for instance gathered as part of
pharmacovigilance. Being a type of ‘experience goods,’ medicines need to build a history of safe and
efficacious use. If doctors feel comfortable with the usage of an established originator biologic product,
they will not be easily convinced to switch all their patients to a newly-developed biosimilar product,
even when the latter has been subjected to strict regulatory review and has met the marketing
authorization criteria (Dranitsaris et al., 2011). Hence, the threat of low market uptake may turn out
to be an important consideration for manufacturers and limit the number of incumbents.
Since the present research will look into the price erosion of two biosimilars – for filgrastim and
epoetins – it is worthwhile to represent their location on a “molecular complexity” scale, as shown on
Figure 1. The reason for this classification is that some product characteristics may define the market
uptake of a given drug, and that effect spills over to the pricing decisions of manufacturers. By outlining
the obstacles which each next wave of biosimilars may encounter, starting with filgrastim and
continuing on to epoetins, it is possible to derive better-informed conclusions about the next wave of
products, or in this case, monoclonal antibodies (mAbs). Although filgrastim and epoetin are not the
only biosimilars currently present on the European market, they have been chosen here because they
have experienced the highest number of entrants. As of 2014, there are four marketed biosimilars of
epoetins, and seven of filgrastim. That allows for a better investigation of the interplay between
number of competitors and price changes. In comparison, there are only two biosimilars of
somatropin, which is one of the few other marketed biosimilars in general.
Figure 1: General categorisation of biologic products Increasing level of molecular complexity Rising number of indications Rising doctors’ reluctance to prescribe Table 1: Comparative characteristics of some small-molecule drugs and biologics
INN Molecular size (Da) Number of indications Paclitaxel (SM) 854
4

Filgrastim biosimilar 18 000 Three Epoetin biosimilar 34 000 Four mAbs 145 000 – 160 000 Six (infliximab)
Source: Dranitsaris et al. (2011); EMA (2015) Filgrastim is used for the treatment of cancer, neutropenia (expressed in low levels of a type of white
blood cells) and hematopoietic stem cell transplantation (the transplantation of specific stem cells). It
is administered by means of an injection under the skin or by direct infusion into a vein. Epoetin can
be of several subtypes, such as alfa, beta, theta and zeta. The distinct names indicate slight molecular
differences. Epoetins are used to treat anemia (low levels of red blood cells), cancer, autologous blood
transfusion (self-donation of blood prior to surgery) and chronic kidney failure. The medicine is
administered with an injection under the skin or into a vein (EMA, 2015).
The main findings of this research are that, on the biosimilars terrain, while for filgrastim it is
competitors’ prices which drive further market entry, for epoetin the opposite direction of causality
holds. In addition, although the number of biosimilar competitors currently present on the market has
an impact on the prices of the incumbent, this is not necessarily the case for both INNs. In other words,
beside direct competition, there is a myriad of other factors which exert influence on price erosion of
the originator. These regulatory parameters are addressed in due course throughout the present
study.
The rest of the paper is organised as follows: Section 2 presents a literature review of the publications
which underlie some of the key model assumptions. Section 3 contains a description of the theoretical
model. Section 4 is devoted to an overview of the data and methodology. Section 5 presents the
empirical results. Section 6 offers a discussion of the outcomes. Lastly, section 7 provides a conclusion.
2. Literature review
In order to obtain a good overview of the existing publications on the economic performance of
biosimilars, multiple sources have been utilised. Beside the search into academic open-source journals,
the publications released by international agencies and organisations, such as the European
Commission (EC) and the European Medicines Agency (EMA), have been used as well. In addition, some
opinion papers and short articles from online journals, such as the Generics and Biosimilars Initiative
(GaBI) Online, have been taken into account. Keeping in mind the dynamic nature of the biosimilars
industry and the correspondingly complex market access environment, one of the main criteria in
5

selecting appropriate literature has been that it be published after 2006, when the first biosimilars
were approved in Europe.
Academic literature which examines the development of biosimilars prices is generally scarce. So far,
most of the attention has been devoted to the market for generics. In addition, where scholars have
looked into biologics and biosimilars, most of the studies have been performed as qualitative and
descriptive analyses of the current market access environment surrounding these products. The
quantitative studies which utilise numerical data remain few and they are often limited in scope,
focusing on theoretical constructs without reference to real-life pricing data. In this sense, the current
study represents a contribution to the existing literature. The most relevant papers are discussed
below.
Some publications adopt an approach whereby they draw a rough parallel between generics and
biosimilars and attempt at constructing a predictive model on biosimilars entry to the market. One
such article on entry and competition of biosimilars is that by Grabowski, Ridley and Schulman (2007),
who focus on the USA market. They acknowledge that the biosimilars market is relatively young and it
might take a while before enough experience is built up and sufficient pricing data is made available
before robust conclusions on price trends can be drawn. Nevertheless, in order to create an informed
opinion on how prices of biosimilar products may evolve in time, Grabowski et al. (2007) look at the
market dynamics of generics in order to build an understanding of the biosimilars market. In the
process, they take into account the differences between these two categories of drugs. Firstly, they
estimate the elasticity of entry of biosimilar companies represented in terms of fixed costs. This is done
because biologics and biosimilars generally involve very high initial investments and this in turn might
be an effective barrier to entry. Secondly, they compare the different costs associated with the two
industries – for small-molecule pharmaceuticals and biologics. The importance of this element boils
down to highlighting the difference between the R&D costs in these two sectors of the drugs industry.
The authors (Grabowski et al., 2007) take three main elements into consideration, namely the cost for
clinical trials, the capital costs for manufacturing facilities, and the cost of the manufacturing process
itself. Thirdly, they use market size as a variable explaining the number of entrants of generic
pharmaceutical manufacturers, and then translate the estimates for the market entry of biosimilars.
The model involves representing the natural logarithm of the number of new competitors as a function
of the natural logarithm of sales of the originator product up to the period preceding generic entry.
This element in the model measures the attractiveness of the market in terms of anticipated revenues
by the prospective entrants. Fourthly, Grabowski et al. (2007) determine the relative prices of generics,
explained by the number of market participants. Lastly, the same model with the relevant inferences
6

is used for biosimilars in order to make projections about market entry and pricing behaviour of
manufacturers.
The study is informative as it utilises knowledge of the generics market, where a lot of empirical data
is available. Importantly, it shows that although generics and biosimilars are significantly different,
some of the assumptions on price development are transposable from one market to the other. What
is key about the model developed by Grabowski et al. (2007) is that it is fairly simple, using only three
control variables: number of competitors, time trend, and therapeutic class. Still, the number of
competitors incorporates fixed costs and market size. Some elements of this model will be borrowed
for the purposes of the present study on biosimilars entry and price development, namely the
expression of the number of market participants as a function of prices, but with a modification: rather
than using the prices of the incumbent prior to biosimilars entry, the prices of currently marketed
biosimilars will be used in order to see their impact on the entry decision of new biosimilar
competitors. In this way, for filgrastim, the attractiveness of the market will again be measured in
terms of anticipated revenues, but taking into account the potential price erosion which would have
already settled in. Furthermore, for epoetin, the effect of the number of current market participants
on the prices of marketed biosimilars will be studied. Thus while Grabowski et al. (2007) control for
drugs’ therapeutic class by means of dummy variables, the present study performs separate
regressions for the two molecules under consideration, in order to account for the differences in
market dynamics and causality between the variables in a more complicated way. Next to that, the
current paper will explore the European market, thus adding to the paper of Grabowski et al. (2007)
by means of an expanded geographical scope of the investigation.
More recently, Rovira et al. (2013) have performed an insightful study into the market dynamics of
biosimilars for three INNs in Europe – somatropin, epoetin alfa/zeta, and filgrastim – by looking at the
national markets of 24 EU member states, as well as Norway and Switzerland. The time period covers
the years 2007 to 2010, reflecting the pricing and market uptake behaviour of biosimilars in their
infancy. The scholars (Rovira et al., 2013) employ an econometric linear-regressions model. Beside
numerical variables, such as market penetration (in %) and time period between EMA approval and
market entry of the biosimilar (in months), they look at many qualitative parameters, mostly in terms
of dummy control variables. A downside of their model, however, is that they run predominately
bivariate regressions, which fail to evaluate the effect of certain characteristics of the market in their
togetherness. The reason pointed out by the authors (Rovira et al., 2013) is that the preliminary
multivariate regression had not reported any statistical significance, thus bivariate regression was
adopted as a solution. Still, the fact that Rovira et al. (2013) have decided to consider some regulatory
7

variables (Table 2), beside prices, lends credence to the incorporation of such variables into the present
study for the interpretation of the regression results later on. The country-specific characteristics
discussed by Rovira et al. (2013) largely fall into the following categories: demographic, economic and
pharmaceutical policy variables.
Table 2: Regulatory variables impacting biosimilars’ prices Continuous variables Dichotomous variables Pharmaceutical market value Population size Gross national income (GNI) Price level index of medicines Total expenditure on health (% of GNI) Total expenditure on health (absolute) Government expenditure on health
Generics price control Use of European Price Referencing (EPR) Tendering Generics substitution (Pharmacist level) International Nonproprietary Name (INN) prescribing National procedure for P&R Use of National Price Referencing (NPR)
Source: Rovira et al. (2013)
Some of the key findings of Rovira et al. (2013) are that generics price controls have a statistically
significant influence (with a coefficient of -21,533) on the market penetration of biosimilars, measured
in percentages. This is an important finding, as the presence of mandatory price cuts for generics in
some European markets indicate an extrapolation of these rules onto the biosimilars market as well.
This variable will therefore be taken into account in the discussion section of this paper later on, in
order to account for some differences across the European countries in terms of pricing and entry. In
addition, Rovira et al. (2013) find that the timing of market entry of biosimilars measured against the
moment of EMA market approval is influenced by the gross national income (GNI) (with a coefficient
of +0,002), total expenditure on health as % GNI (+1,156), total expenditure on health (+0,002),
government expenditure on health (+0,0019), pharmaceutical generics substitution (-3,08), and price
level index of medicines (+0,082) (measuring the relative price levels of medicines across countries
expressed in terms of purchasing power parities and nominal exchange rates). Still, in light of the
present study and the current market environment, substitution is not likely to be impactful on the
decision of market entry of biosimilars. The reason is that most countries do not allow biosimilars
substitution at the pharmacy level, although the strictness of the controls varies across the countries
(Roediger, 2015). Where substitution and switching do occur, this is mainly at the hospital level, where
tenders may lead to the switching from an originator biologic to a biosimilar of either all patients or
only of new, treatment-naïve patients (Roediger, 2015). An important finding of the study by Rovira et
al. (2013) is that, per INN, biosimilars have demonstrated faster uptake on the European market
compared to the originator biologics which they reference. This is a compelling insight, as it
8

demonstrates how the lower prices arguably drive the higher willingness on behalf of doctors and
national regulatory bodies to utilise biosimilars, while also building upon the accumulated experience
with the reference product.
Given the importance of these variables for the market uptake and the entry decision and pricing
behaviour of biosimilars across different European countries, it is important to incorporate these into
the present analysis. Moreover, the current study will encompass a broader time period, starting from
2008 and continuing well until the end of 2014. Therefore, some of the latest policy changes in the
sample of countries will be incorporated into the interpretation of the regression outcomes. It is
important to mention, however, that the current study will look into a smaller number of countries (10
instead of 26). Notwithstanding, the countries selected here are sufficiently heterogeneous and have
been selected with consideration of their different national market environment.
Another key article on which this research is based on is by Grabowski, Guha and Salgado (2014) who
investigate the price erosion of two of biosimilars that represent the first wave of biosimilar approvals
in the EU. These medicines are filgrastim and epoetins (alpha, beta, theta, zeta). The authors explore
the market uptake of the biosimilar products compared to the originator (reference) products. They
find out that there is cross-country, as well as cross-indication, heterogeneity of biosimilars uptake. In
order to account for this disparity within a sample of five European countries (Germany, France, Italy,
UK, and Sweden), Grabowski et al. (2014) take certain regulatory and cultural parameters into account.
For example, countries with traditionally high generics uptake, such as Germany, Sweden and the UK,
exhibit higher willingness to utilize biosimilars compared to other countries. At the other end of the
spectrum they find France and Italy who have some historically high resistance to generics use.
Apparently, such cultural characteristics of the pharmaceutical market can be transposed onto the
market of biologic products. For this reason, the present study shall incorporate some of those same
factors into the analysis.
Another element of interest from the study by Grabowski et al. (2014) is that the market uptake of
biosimilars appears to be relatively promising when agglomerated with the reference 1st-generation
product. However, when looking at the market of the respective INN including the 2nd-generation
product (usually a long-lasting version), the biosimilars uptake appears almost negligible. In this sense,
just as the authors (Grabowski et al., 2014) point out, it would be worthwhile to investigate how this
tendency applies to the market of monoclonal antibodies, since these are products with enormous
revenue and several patents are expected to expire in the near future. It is expected that by 2020,
9

biologics which are worth US$54 billion will lose their patent and be exposed to biosimilars competition
(GaBI Online, 2011). Although the scope of the present study may not reach so far as to cover the
questions posed by Grabowski et al. (2014), it will remain interesting from an industry as well as ‘payer’
perspective to answer to what extent the threat of 2nd-generation biologic products can be considered
a significant threat to the uptake of biosimilar products referencing 1st-generation biologics. In
addition, it is interesting whether the same considerations and market dynamics apply to the mAbs
market, given the specific characteristics of these products which set them apart from other biologics.
Answering these questions is important because they can inform our understanding of whether
investors and biotech companies perceive 2nd-generation biologics as a great threat to market share
growth of biosimilars referencing 1st-generation products. Also, the conclusions can be used to form
anticipations as to whether the industry’s willingness to invest in 1st-generation-referencing biosimilars
is declining, in light of any pipeline 2nd-generation products. In other words, is the paradigm shifting
towards investments in 2nd-generation products or is there still persistent interest in 1st-generation
products? It may well be that the current paper does not succeed in answering all these questions, yet
some of the conclusions in the later sections may represent a small step on the way of addressing mAb-
related topics.
The main factors identified by Grabowski et al. (2014) for the rate of market penetration of biosimilars
in Europe are presented in Table 3 below.
Table 3: Factors impacting biosimilars market penetration in Europe
Relevant variables (mostly as dummy) History of high generics usage Quotas (for prescriptions) Reference price system for biosimilars Mandatory price cuts for biologics Presence of patient co-payments
Source: Grabowski et al. (2014) Therefore, some of the variables, e.g. especially reference pricing, which recurs in most of the
academic publications on biosimilars pricing, are considered in the interpretation of the estimates of
the present study. Once again, similar to other respectable publications, the one by Grabowski et al.
(2014) offers a valuable yet limited glimpse into the dynamics of the biosimilars market, since its
geographical scope is limited to five countries. The current research offers an extension in that respect.
A report compiled by Roediger (2015) based on a survey by the European Biopharmaceutical
Enterprises (EBE) organisation looks at a number of regulatory variables for biosimilars in all 28 EU
10

member states, as well as Norway, Serbia and Switzerland. Although that publication does not look at
any numerical variables, it still examines regulatory parameters which are particularly relevant for the
market penetration, hence pricing, of biologic drugs in general. More specifically, the types of tenders
conducted in the different European countries are identified in several dimensions. Therefore, the
insights provided by the report are used here mainly in terms of the factors which might explain
country differences in the final results. Furthermore, the current research provides a more rigorous
estimation of the effect of these regulatory variables on biosimilars price erosion by testing them in a
regression model, instead of relying on a descriptive account only.
Similar to the EBE report (Roediger, 2015), Tele and Groot (2009) look into a variety of cost
containment measures which the authorities in different countries have adopted throughout the
years, so as to minimise the healthcare expenditure costs. It is important to note that these measures
can set the price development of biosimilars, or any medicines for that matter, on a downward spiral
(Table 4).
Table 4: Cost containment measures in Europe Relevant variables Use of positive list Reference pricing schemes Use of negative list Fostering the use of generics Price controls Substitution by pharmacists Profit controls Economic evaluation Individual or global budgets for doctors Monitoring of prescription practices Delay in Market Authorisation approval Patient co-payments Education for health Financial incentives for physicians Non-financial incentives for physicians
Source: Tele and Groot (2009) Since some of these variables have been considered also by Grabowski et al. (2014) in their analysis of
biosimilars market share development, it is worthwhile to consider at least some of them and
incorporate them, where possible, in the interpretation of the regression results.
3. Theory The empirical analysis in this paper rests upon a theoretical model, inspired by Industrial Organisation.
It is assumed that the attractiveness of any given market is determined by the anticipated stream of
revenues (Brekke et al., 2007). In other words, the entry decision of firms is motivated by whether the
prices charged for their products would be sufficiently high in order to recoup the initial investment.
11

In light of the high R&D costs associated with the pharmaceutical industry as a whole (Grabowski et
al., 2007), the value that can be assigned to the medicines bears particular importance. The
development costs necessary for small-molecule drugs are much lower compared to those for biologic
medicines (Grabowski et al., 2007). The reason for this difference lies, firstly, in the manufacturing
process in terms of research and clinical trials, and secondly, in the requirements necessary to obtain
marketing authorisation, in terms of evidence on quality, safety and efficacy. Generic pharmaceuticals
can be easily replicated by means of standard chemical processes, while for biosimilars a separate and
uniquely engineered cell line must be developed. Furthermore, unlike small-molecule producers, who
need not demonstrate bioequivalence via clinical trials, manufacturers of biosimilars must show
comparable pharmacokinetic and pharmacodynamics properties as proof of quality, and conduct
costly Phase III clinical trials as proof of efficacy and safety (Barosi et al., 2011). Some of the associated
differences in terms of costs and duration are summarized in Table 5 below.
Table 5: Costs and timeline for development of generics and biosimilars
Drug type Clinical trial costs Development time Generic pharmaceuticals $ 1 – 2 million 2 – 3 years Biosimilars $ 10 – 40 million 5 – 8 years
Sources: Grabowski et al. (2007); Grabowski et al. (2006); Declerck and Simoens (2012)
Table 5 shows that biosimilars prices need to be sufficiently high in order to make the R&D investments
worthwhile. Furthermore, there are other significant costs associated with commercialisation activities
for biosimilars. Typically, these expenditures involve the sales representatives, medical science liaison
officers (taking care of medical affairs and providing educational services), and key participants in
marketing activities. Furthermore, post-approval safety studies may be necessitated as well, and their
costs can be substantial too. Therefore, it has been assumed that the price premium offered by
biosimilars upon launch and for a period afterwards would be smaller than the one for generics. An
additional factor fostering the maintenance of high prices for biologics are the incentives of innovator
companies. The R&D costs which they have accumulated prior to launch of a biologic are in the range
of $100 million (Dalgaard, 2013). These include the development of a cell line, but also the
performance of a full round of clinical trials, i.e. from Phase I to Phase III. In this sense, it is in their
interest to continue to reap large enough profits even beyond the patent protection period of about
20 years. Moreover, originators would not like to see their blockbuster products devalue quickly, but
would rather sustain the profitability of the therapeutic-area-specific market.
The interplay of potential revenues, pricing behaviour and entry decisions is complemented by the
interests of governments and P&R agencies, who largely represent ‘the payers’. Not only do national
12

authorities try to curb launch prices of medicines, including biosimilars, but they also attempt to put
downward pressure on prices throughout product lifecycle. Thus, given the high regulation of the drugs
market in general, price erosion typically ensues much quicker, can be much more severe and driven
by forces other than competitive pressure alone.
In their attempt to make savings and manage the progressively shrinking budgets, European payers
have implemented a series of cost containment measures (CCMs). Within the EU, where each national
government has the autonomy of creating its own market conditions, on the one hand, there is much
heterogeneity in terms of measures used, and on the other hand, there are quite a few elements in
common. Given that the biosimilars market is relatively young and evidence on price development is
sparse (Rovira et al., 2013), it could be argued that a large number of the cost containment measures
have been directly borrowed or generally inspired by the generic pharmaceuticals market. In addition,
European nations often look at their ‘neighbor’ to borrow ideas on how to reduce healthcare costs.
Table 6 gives a thorough overview of the cost containment measures which are most commonly
implemented in Europe, as well as some of the parameters with greatest impact on biosimilars entry
and pricing.
Table 6: Some commonly used cost containment measures and regulatory parameters impacting entry
Cost containment measures in Europe Other regulatory variables
Use of positive list Substitution of biosimilars
Use of EPR for biologics
Availability of national legislation on biologics
Use of negative list Mandatory discounts for pharmaceutical originators
Use of NPR for biologics
Average duration of P&R for biosimilars (in months)
Profit control Mandatory discounts for biologic originators
Type of NPR for biologics (generic or therapeutic reference)
Delays in biosimilars Marketing Authorisation approval
Cost containment measures in Europe (cont.) Other regulatory variables (cont.)
Presence of budgets (for doctors)
Mandatory discounts for generic entrants
Tenders for biologics Level at which substitution is prohibited
Financial incentives for doctors
Mandatory discounts for biosimilar entrants
Type of tenders (single or multiple win)
13

Information campaign on generics / biosimilars use
Monitoring of prescription patterns
Fostering the use of generics / historically high use
Another characteristic which may determine the attractiveness of a given market is price volatility. It
can be measured by the variance, or standard deviation, of the prices of a particular drug throughout
time. In principle, it is assumed that markets where prices fluctuate less are more attractive, since the
stream of revenues is more stable, secure and, arguably, predictable. Because most EU markets are
highly regulated, it is difficult to speak of frequent and unexpected price changes. Where price changes
do occur, they are mostly downward adjustments in response to competitive pressure or as a result of
strategic action. This is largely due to the binding contracts or other trade agreements which
manufacturers make with retailers or hospitals, thus price increases are basically not observed. Still,
these are the conditions which apply to price management throughout product lifecycle. At launch,
the possibilities for price responses are different for originators and biosimilars.
When bringing a product to the market, originators set the price more or less freely, as in most cases
there is no specific price ceiling or price tunnel for innovative products. Nevertheless, this free-price
period may last only for a while, until the negotiations with the national authorities have been finalised.
The duration of this process is not standardized, and may vary per country and per product. It has been
estimated that for oncology products, for example, the negotiations in the period after obtaining
marketing authorisation may last from 6 to 32 months, depending on the country and the respective
medicine (Swilling, 2014). However, even if some price fluctuation and possibly increases are observed
in the period up till a price agreement has been reached, originator prices are not revised too
frequently. Except for some instances where originator prices were increased upon entry of the first
biosimilar on the local market, there is an overarching tendency for downward price evolution. For
biosimilars, on the contrary, certain price cuts may be applied already upon launch. Such measures
successfully push prices down and cause price erosion to occur even absent immediate competitive
pressure. Mandatory price cuts for biosimilars exist in Hungary, Italy, Poland, while non-mandatory
cuts are applied in France. In one of these markets, Hungary, there is a meticulous regulation on price
cuts of consecutive generics entrants and, interestingly, there also exists a similar step-wise approach
to biosimilars pricing upon launch. Still, the regulation explicitly stipulates the mandatory reductions
up to the 7th generic entrant, while for biosimilars the list stops at the 4th entrant. This is an important
insight, as it suggests that national authorities implicitly recognize the relatively smaller number of
biosimilar market participants compared to the generics market. As a result of mandatory price cuts,
biosimilars price erosion may ensue much quicker, and be more severe, than if left to competition
14

alone. It is even more challenging to achieve a sustainable price at launch as well as to maintain that
price throughout the years afterwards in the countries where European Price Referencing (EPR) is
used. Within the sample of countries considered here, EPR is used in Bulgaria, France (only for highly
innovative medicines), Greece, Hungary (only for originators), the Netherlands, Norway and Poland.
Undoubtedly, all forces which may trigger a reduction of biosimilars prices exert a pull-effect on
originator prices, since the two types of products enter direct competition. Competitive pressure is a
potent mechanism leading to price reduction despite the fact that the two types of products are
considered comparable (Barosi et al., 2011), but are not perfect substitutes (EC, 2013). Therefore, the
prices of marketed biosimilars directly impact the price of originators.
From the above theory and description of real-life market access conditions, the following predictions
can be made from the model:
1. Prices of the currently marketed biosimilars determine the attractiveness of the market and
impact the entry decisions of other manufacturers.
2. A measure of the price volatility must provide additional insights into the attractiveness of
the biosimilars market for potential entrants, over and above the currently charged prices by
the other competitors.
3. The prices of originators are directly affected by the prices of biosimilar entrants.
4. Price volatility of biosimilar prices may influence the prices of originators.
These predictions are tested by means of econometric regressions, as described in the next section.
4. Data and methodology
a. Data and resources For the empirical model, the sample includes 10 European countries: Bulgaria, France, Germany,
Greece, Hungary, Italy, the Netherlands, Norway, Poland, and the UK. Only one of them, Norway, is
not a member of the European Union (EU). Yet, due to the country’s advanced economy and healthcare
sector, Norway is not anticipated to exhibit significantly different market environment based on non-
EU membership alone.
The insights needed for the analysis are collected from semi-structured interviews within Teva
Pharmaceuticals Europe, one of the largest pharmaceutical manufacturers in Europe. In addition, a
15

survey focusing on regulatory and pricing information has been dispatched to country affiliates. This
input is used in order to obtain an understanding of the market access conditions in each country and
is complemented by literature findings from desk research, as outlined in the previous section.
The econometric model utilizes average manufacturer selling prices per product from the IMS MIDAS
database. A key feature of this source is the regular and mostly intermittent frequency of the
observations. The reason why this category of prices is preferred is that they reflect the public price
level, since in most cases the negotiations between manufacturers and national authorities are over
prices which are eventually to be made available on official price lists. Moreover, as is confirmed by
the semi-structured interviews, practically in all countries it is exactly the published price which is used
for EPR, at least for generics. This is why it is considered appropriate to determine entry decisions and
track price development with respect to public prices. Still, it should be taken into account that there
are numerous types of undisclosed agreements and discounts between manufacturers and other
participants in the distribution channel. Thus, the reader is invited to factor that element of price
erosion into the picture prior to drawing any deterministic conclusions about biosimilars pricing.
b. Econometric model design
The econometric model adopted here is Ordinary Least Squares (OLS) regression with country fixed
effects. The reason for this choice lies in the intrinsic differences displayed by the countries in the
sample, which may account for the unexplained variation in the estimates. The model specification is
tested with the Granger causality test.
The methodology can be summarized as follows. Firstly, the number of biosimilar entrants (N) is
represented as a function of the prices of other marketed biosimilars (CP for ‘competitor prices’) –
current as well as with one period lag, and the number of competitors in the previous period. The
equation takes the following form:
∆𝑁𝑁 = 𝛽𝛽0 + 𝛽𝛽1∆𝐿𝐿𝐿𝐿𝐿𝐿 + 𝛽𝛽2𝑁𝑁(−1) + 𝛽𝛽3𝐿𝐿𝐿𝐿𝐿𝐿(−1) (1)
In order to obtain the estimates in percentages, the competitor prices in equation (1) are expressed in
logarithms (LCP). In addition, first differences of that independent variable are taken (ΔLCP) so as to
measure the effect of the growth rate of the variable on the number of competitors. In addition, the
first differences remove any time invariant omitted variables. This is applied to the dependent variable
as well. Equation (1) corresponds to the underlying assumption in this study, namely that the prices of
16

currently marketed biosimilars define the attractiveness of the market and impact the entry decision
of further competitors.
Secondly, equation (1) is extended by adding a measure of price dispersion or volatility. A log of the
standard deviation of competitor prices (LSTD) is used and it is represented by the first differences and
a one-period lag, as follows:
∆𝑁𝑁 = 𝛽𝛽0 + 𝛽𝛽1∆𝐿𝐿𝐿𝐿𝐿𝐿 + 𝛽𝛽2𝑁𝑁(−1) + 𝛽𝛽3𝐿𝐿𝐿𝐿𝐿𝐿(−1) + 𝛽𝛽4∆𝐿𝐿𝐿𝐿𝐿𝐿𝐿𝐿 + 𝛽𝛽5𝐿𝐿𝐿𝐿𝐿𝐿𝐿𝐿(−1) (2)
Once again, in equation (2), the first difference in the log of the standard deviation is used, in order to
measure the effect of the growth rate of the variable on the number of competitors.
Thirdly, the prices of originators are represented as a function of the number of biosimilar competitors
on the market – current and with one period lag (LOP, for log of ‘originator prices’), and the originator
prices in the previous period:
∆𝐿𝐿𝐿𝐿𝐿𝐿 = 𝛽𝛽0 + 𝛽𝛽1∆𝐿𝐿𝑁𝑁 + 𝛽𝛽2𝐿𝐿𝐿𝐿𝐿𝐿(−1) + 𝛽𝛽3𝐿𝐿𝑁𝑁(−1) (3)
Lastly, equation (3) is extended by adding price volatility (LSTD) in order to improve the estimates by
controlling for the attractiveness of the market for originators, given the presence of biosimilar
entrants:
∆𝐿𝐿𝐿𝐿𝐿𝐿 = 𝛽𝛽0 + 𝛽𝛽1∆𝐿𝐿𝑁𝑁 + 𝛽𝛽2𝐿𝐿𝐿𝐿𝐿𝐿(−1) + 𝛽𝛽3𝐿𝐿𝑁𝑁(−1) + 𝛽𝛽4∆𝐿𝐿𝐿𝐿𝐿𝐿𝐿𝐿 + 𝛽𝛽5𝐿𝐿𝐿𝐿𝐿𝐿𝐿𝐿(−1) (4)
For all estimation equations, cross-section and period fixed effects are used. The single exception is
equation (2) for filgrastim, where fixed effects are applied only for the cross-sections, but not for the
periods. The initial attempt to use fixed effects for both parameters has not rendered a feasible
outcome, which is why the fixed effects for the periods have been removed.
Each regression, from (1) to (4), which constitutes part of the model, is run separately for the two
molecules. This is necessary because of the different nature of the medicines in terms of uptake, ease
of manufacturing, doctors’ willingness to prescribe them, and overall pricing strategy. In their
togetherness, these factors define the different dynamics on each product’s market. Therefore, it is
anticipated that different results may be obtained for the two molecules. Indeed, market research on
the rate of biosimilars entry across Europe has indicated that it differs per INN. For example, there are
17

generally many more competitors of filgrastim than there are for epoetins (Grabowski et al., 2014). In
addition, the same trend is observed for the uptake of these medicines, where the molecular
complexity and the relative manufacturing ease of filgrastim biosimilars compared to epoetin
biosimilars may have facilitated their wider usage in clinical practice.
5. Empirical results
The following section demonstrates the empirical findings from the analysis. More specifically, the
interconnection between the number of biosimilar competitors and their prices on the one hand, and
between the number of biosimilar competitors and the prices of originator biologics on the other hand,
is displayed.
a. Effect of competitor prices on biosimilars entry decision
Table 7 presents the estimates obtained for the effect of marketed biosimilar prices on the entry
decision of further competitors, based on equation (1).
Table 7: Estimation of equation (1): ∆𝑵𝑵 = 𝜷𝜷𝟎𝟎 + 𝜷𝜷𝟏𝟏∆𝑳𝑳𝑳𝑳𝑳𝑳+ 𝜷𝜷𝟐𝟐𝑵𝑵(−𝟏𝟏) + 𝜷𝜷𝟑𝟑𝑳𝑳𝑳𝑳𝑳𝑳(−𝟏𝟏). Dependent variable: ΔN, the first-difference of the number of biosimilar competitors. Filgrastim:
18

Epoetins:
Unlike the estimates for filgrastim, which show satisfactory statistical significance for all independent
variables except for the constant, those for epoetin render p-values of 0,0122 and 0,0033 for ΔLCP and
LCP(-1), respectively. These values indicate that the equation may not have been defined in the most
appropriate way. In order to avoid any misconstruction of the direction of causality, it is important that
the equation specification should be examined. For that purpose, a sensitivity test is performed and
reported in the next section. Nevertheless, the outcomes for filgrastim merit a brief discussion. The
coefficient for ΔLCP indicates, in combination with the intercept value, that 1% increase in competitor
prices will lead to βΔLCP = 0,435% increase in the growth rate of biosimilar entrants. Last period’s
19

competitor prices have a positive effect on the number of competitors today. This suggests that
although the overall effect is not too strong, a potential rise in prices would attract more competitors.
If prices were to increase by 1%, the rate at which competitors will enter the market would increase
by 0,435%. Still, increases in biosimilar prices are hardly ever observed throughout product lifecycle.
The number of competitors in the last period has a negative effect on this period’s number, so that if
there were one more competitor in the last period, this would lead to 100(-0,316)%, or 31,6%, fewer
competitors this period. Clearly, the market cannot tolerate an indefinite increase in the number of
competitors. While a potential price increase attracts entrants, this is counterbalanced by the fact that
too many current competitors disincentivize further entry.
In order to obtain a clearer picture of the trend, the effect is represented by means of (three-month)
moving averages of the period fixed effects (Figure 2). The advantage of this method is that it
smoothens out the fluctuations which may arise in each month, thus clearing “the noise”. The left-
hand axis on Figure 2 is only used in order to visualise the evolution of the effect, thus the actual
intervals of the scale do not have meaningful interpretation. Clearly, in the first periods the effect of
the price increases of biosimilars on the number of further entrants is stronger, but eventually the
number of firms on the market converges to equilibrium. Throughout this paper, the formula for the
calculation of the three-month moving average is the following:
𝑀𝑀𝑀𝑀𝑀𝑀𝑀𝑀𝑀𝑀𝑀𝑀 𝐴𝐴𝑀𝑀𝐴𝐴𝐴𝐴𝐴𝐴𝑀𝑀𝐴𝐴 = 𝑚𝑚𝑡𝑡−1+ 𝑚𝑚𝑡𝑡+𝑚𝑚𝑡𝑡+13
, (5)
where ‘m’ stands for a ‘month’ with observations. Figure 2: Period fixed effects: LCP on N (filgrastim)
20

b. Sensitivity analysis – Granger causality test
Given the results obtained for epoetin where competitors’ prices turn out to be insignificant, a Granger
causality test is performed. An additional motive for the test is that the results for the two molecules
suggest different causality between the variables under consideration. Admittedly, in both situations,
there are two effects at play – the entry effect, where higher prices attract more competitors by means
of higher anticipated profits, and the competition effect, where an increase in the number of firms
triggers a price reduction. What is of interest here is the relative strength of these effects for filgrastim
and epoetins.
The Granger test provides inconclusive results for filgrastim and no evidence for reverse causality has
been rendered. The relatively high p-values suggest that the regressors in the equation are significant.
Thus, the standard hypothesis for the Granger test whereby the two variables – ΔN and ΔLCP – are
unrelated, could not be rejected. For epoetin, on the contrary, there is strong evidence that the
number of firms, N, affects the market prices, LCP, while there is no such evidence for the reverse.
Consequently, it is necessary to switch the dependent variable and the main independent one, since
the interplay of the two variables in epoetin is better explained by reverse causality. Importantly, the
trend for that molecule cannot be explained by competition alone.
There may be an additional justification for the results obtained from the Granger test. The direction
of causality running from the number of competitors to prices is consistent with economic logic,
because as more competitors enter the market, the cohort of patients, or ‘customers’, who are
potential candidates for the medicinal product, remains largely unchanged (abstracting from any
possible change in disease incidence rates). In this way, in order to serve the same patient population
21

for a certain disease, companies may need to differentiate their medicines based on price. It is
important to note that biosimilars, unlike generic pharmaceuticals, are not considered direct
substitutes. While in some cases doctors may be reluctant to prescribe a generic, this is largely due to
brand loyalty, rather than any clinical consideration. Conversely, many physicians are very cautious
about treating their patients with biosimilars out of fear that some adverse reactions may be provoked
or the treatment may overall not be as efficacious as that delivered by the originator product. This
particularity is due to two main reasons: first, biosimilars do exhibit molecular variability, even within
the same batch (European Commission, 2013), and second, stakeholders have accumulated relatively
little experience with biosimilars, given that the first such product was approved in Europe in 2006
(EMA, 2014). In this sense, epoetins biosimilar prices may be more susceptible to change as a result of
competitor entry. Thus, the very nature of the products may be the reason why on the epoetins market
it is the number of competitors which influences the currently charged prices for biosimilars and not
the other way round. The revised equation for epoetins is the following:
∆(𝐿𝐿𝐿𝐿𝐿𝐿) = 𝛽𝛽0 + 𝛽𝛽1∆𝑁𝑁 + 𝛽𝛽2𝑁𝑁(−1) + 𝛽𝛽3𝐿𝐿𝐿𝐿𝐿𝐿(−1) + 𝛽𝛽4∆𝐿𝐿𝐿𝐿𝐿𝐿𝐿𝐿 + 𝛽𝛽5𝐿𝐿𝐿𝐿𝐿𝐿𝐿𝐿(−1) (6) Similarly to the previous equations, cross-section and period fixed effects have been used for equation
(6).
c. Effect of price volatility on entry and competitor prices
In order to strengthen the results and check to what extent price volatility may be an impactful factor
in biosimilars entry, the regression equation is extended with the edition of standard deviation (Table
8). The new regression reflects the modification for epoetins, in response to the outcomes of the
Granger test. By including standard deviation, the results have been improved, as is seen by the
increase in R2.
Table 8: Estimation of equations (2) and (6) Filgrastim:
22

Estimation of equation (2): ∆𝑵𝑵 = 𝜷𝜷𝟎𝟎 + 𝜷𝜷𝟏𝟏∆𝑳𝑳𝑳𝑳𝑳𝑳+ 𝜷𝜷𝟐𝟐𝑵𝑵(−𝟏𝟏) + 𝜷𝜷𝟑𝟑𝑳𝑳𝑳𝑳𝑳𝑳(−𝟏𝟏) + 𝜷𝜷𝟒𝟒∆𝑳𝑳𝑳𝑳𝑳𝑳𝑳𝑳+ 𝜷𝜷𝟓𝟓𝑳𝑳𝑳𝑳𝑳𝑳𝑳𝑳(−𝟏𝟏)
Dependant variable: ΔN, the first-difference of the number of biosimilar competitors.
Long-run effects LCP(-1) 0,929 LSTD(-1) 0,191
Epoetins: Estimation of equation (6):
∆(𝑳𝑳𝑳𝑳𝑳𝑳) = 𝜷𝜷𝟎𝟎 + 𝜷𝜷𝟏𝟏∆𝑵𝑵 + 𝜷𝜷𝟐𝟐𝑵𝑵(−𝟏𝟏) + 𝜷𝜷𝟑𝟑𝑳𝑳𝑳𝑳𝑳𝑳(−𝟏𝟏) + 𝜷𝜷𝟒𝟒∆𝑳𝑳𝑳𝑳𝑳𝑳𝑳𝑳+ 𝜷𝜷𝟓𝟓𝑳𝑳𝑳𝑳𝑳𝑳𝑳𝑳(−𝟏𝟏)
23

Dependant variable: ΔLCP, the first-difference of the log of competitor prices.
Long-run effects LCP(-1) -0,045 LSTD(-1) -0,059
From the results, it can be concluded that for filgrastim, a 1% increase in last-month’s growth rate of
competitors’ prices leads to approximately 38,5% increase in the number of competitors this month.
This suggests that the entry effect dominates the filgrastim market, so that an increase in the current
prices attracts more entrants. The outcome is consistent with the fact that there are more approved
biosimilars of filgrastim in Europe, namely seven (EMA, 2014). Obviously, at least in the initial periods
when only a few products had been granted marketing authorisation, the anticipated revenues
remained sufficiently high, hence attractive, for future entrants. In other words, it had taken more
time until the market for filgrastim got saturated. Indeed, it would be difficult to predict when exactly,
if ever, profits on that market would decline so as to preclude further entry. In some countries, for
example, local regulations in the recent years have led to such a severe price decrease and curbed
profits to such an extent that it has led some manufacturers to actually exit the market. This is
confirmed by the long-term effect of biosimilars prices on number of competitors, where a sustained
increase in prices would lead to approximately 93% increase in the number of competitors, which is
more than what the market can reasonably sustain.
24
For epoetins, where the causality runs in the opposite direction, that is, the number of competitors
influences biosimilar prices, each next entrant in the current month leads to a 7% decrease in the price
growth rate next month. In the long run, the sustained effect is of 4%. Price volatility does not seem to
have too high an impact on price growth rate, yet in the long run, last-period’s increase in price
volatility rate by 1 unit may lead to almost 6% decrease in biosimilars price growth rate in this period.
It is clear that for epoetin, the competition effect predominates, whereby each consecutive entrant
has the power to drive prices down. This suggests that the epoetins market gets saturated much faster,
compared to the filgrastim market, and this is confirmed by real-world facts: although seven products
of the epoetins class have been granted marketing authorisation in Europe (EMA, 2015), most markets
have fewer competitors locally, namely up to 4, whereas for filgrastim the number can reach 7. The
faster market saturation for epoetin generally means that an optimal point of market participants has
been reached sooner than it has been for filgrastim.
It is important to have obtained an insight into the strength of the effect in the longer term, spanning
years rather than months, because this is a way to capture the persistence of a given control variable’s
influence. The long-run effects have been calculated from the following formulas:
For filgrastim:
𝐿𝐿𝑀𝑀𝑀𝑀𝑀𝑀 − 𝐴𝐴𝑟𝑟𝑀𝑀 𝐿𝐿𝐿𝐿𝐿𝐿(−1) = −𝑆𝑆ℎ𝑜𝑜𝑜𝑜𝑜𝑜−𝑜𝑜𝑟𝑟𝑟𝑟 𝐿𝐿𝐿𝐿𝐿𝐿(−1)𝑆𝑆ℎ𝑜𝑜𝑜𝑜𝑜𝑜−𝑜𝑜𝑟𝑟𝑟𝑟 𝑁𝑁(−1)
(7)
𝐿𝐿𝑀𝑀𝑀𝑀𝑀𝑀 − 𝐴𝐴𝑟𝑟𝑀𝑀 𝐿𝐿𝐿𝐿𝐿𝐿𝐿𝐿 = − 𝑆𝑆ℎ𝑜𝑜𝑜𝑜𝑜𝑜−𝑜𝑜𝑟𝑟𝑟𝑟 𝐿𝐿𝑆𝑆𝐿𝐿𝐿𝐿(−1)𝑆𝑆ℎ𝑜𝑜𝑜𝑜𝑜𝑜−𝑜𝑜𝑟𝑟𝑟𝑟 𝑁𝑁(−1)
(8)
For epoetins:
𝐿𝐿𝑀𝑀𝑀𝑀𝑀𝑀 − 𝐴𝐴𝑟𝑟𝑀𝑀 𝑁𝑁(−1) = − 𝑠𝑠ℎ𝑜𝑜𝑜𝑜𝑜𝑜−𝑜𝑜𝑟𝑟𝑟𝑟 𝑁𝑁(−1)𝑆𝑆ℎ𝑜𝑜𝑜𝑜𝑜𝑜−𝑜𝑜𝑟𝑟𝑟𝑟 𝐿𝐿𝐿𝐿𝐿𝐿(−1)
(9)
𝐿𝐿𝑀𝑀𝑀𝑀𝑀𝑀 − 𝐴𝐴𝑟𝑟𝑀𝑀 𝐿𝐿𝐿𝐿𝐿𝐿𝐿𝐿(−1) = − 𝑆𝑆ℎ𝑜𝑜𝑜𝑜𝑜𝑜−𝑜𝑜𝑟𝑟𝑟𝑟 𝐿𝐿𝑆𝑆𝐿𝐿𝐿𝐿(−1)𝑆𝑆ℎ𝑜𝑜𝑜𝑜𝑜𝑜−𝑜𝑜𝑟𝑟𝑟𝑟 𝐿𝐿𝐿𝐿𝐿𝐿(−1)
(10)
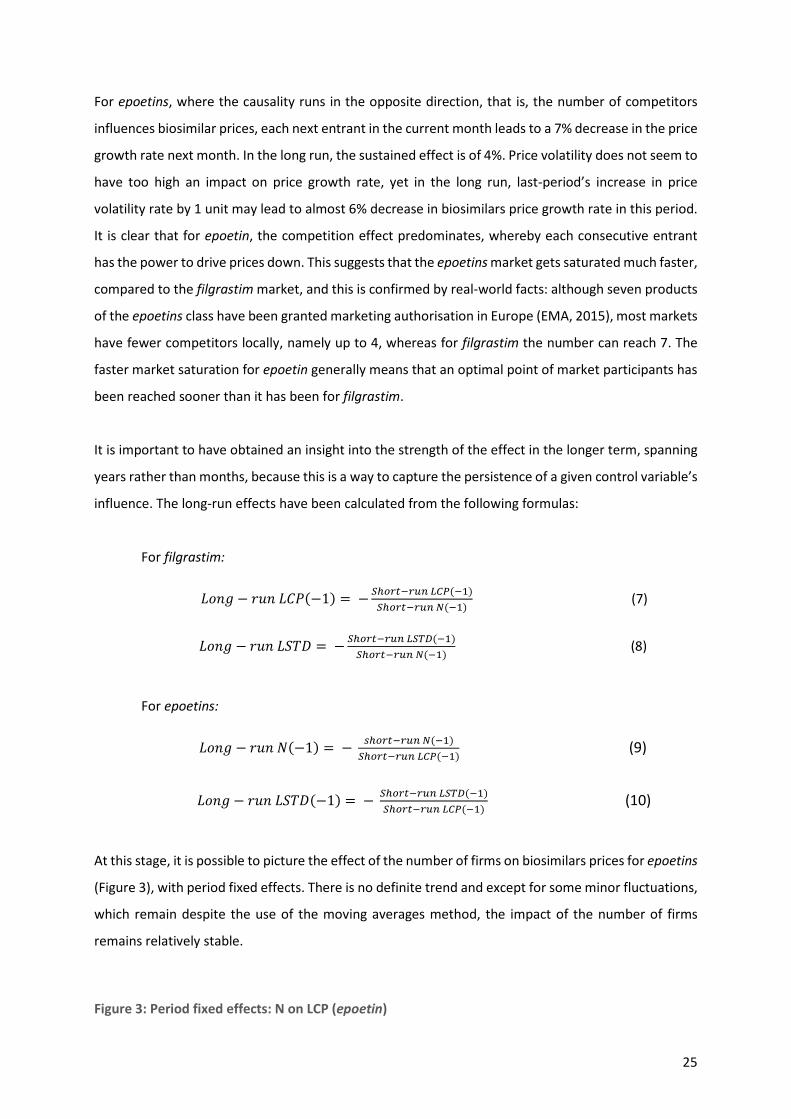
At this stage, it is possible to picture the effect of the number of firms on biosimilars prices for epoetins
(Figure 3), with period fixed effects. There is no definite trend and except for some minor fluctuations,
which remain despite the use of the moving averages method, the impact of the number of firms
remains relatively stable.
Figure 3: Period fixed effects: N on LCP (epoetin)
25

d. Effect of number of biosimilar competitors on incumbent’s prices
Once the relationship between the number of biosimilar competitors and the market prices has been
established, the next step is to find out how the number of competitors influences prices of the
incumbent manufacturer. This is important in order to understand to what extent the originator may
expect to sustain its market share by downward price adjustment, rather than by any other type of
product differentiation. In some geographies, the prices of originators may be subjected to a
regulation, for instance via mandatory price cuts upon biosimilars entry, or explicit EPR referencing.
Table 9: Estimation of equation (3): ∆𝑳𝑳𝑳𝑳𝑳𝑳 = 𝜷𝜷𝟎𝟎 + 𝜷𝜷𝟏𝟏∆𝑳𝑳𝑵𝑵+ 𝜷𝜷𝟐𝟐𝑳𝑳𝑳𝑳𝑳𝑳(−𝟏𝟏) + 𝜷𝜷𝟑𝟑𝑳𝑳𝑵𝑵(−𝟏𝟏) Dependent variable: ΔLN, the first difference of the log of number of marketed biosimilars. Filgrastim:
26

Epoetin:
Although for both molecules the estimated effect is found to be considerably weak, the results for
epoetin are even insignificant (Table 9). This has been partially anticipated given the specificity of
epoetin in terms of physicians’ lower willingness to use biosimilars in place of the originator’s product.
In this sense, regardless of how many market entrants there are, the incumbent can afford more
sustainable pricing given a certain number of competitors, ceteris paribus on other factors.
27

The outcomes of this regression become more meaningful once the measure of price volatility has
been added, which is why the interpretation is postponed to the next sub-section.
e. Effect of price volatility on incumbent’s prices In an attempt to improve on the rigorousness of the results, as well as to control for an additional
variable, the regression is extended by the addition of price volatility (Table 10). Arguably, that
parameter did improve the outcomes with respect to the p-values and the coefficient estimates for
filgrastim, yet it failed to lend credence to the epoetin estimates, which remained insignificant.
Table 10: Estimation of equation (4): ∆𝑳𝑳𝑳𝑳𝑳𝑳 = 𝜷𝜷𝟎𝟎 + 𝜷𝜷𝟏𝟏∆𝑳𝑳𝑵𝑵 + 𝜷𝜷𝟐𝟐𝑳𝑳𝑳𝑳𝑳𝑳(−𝟏𝟏) + 𝜷𝜷𝟑𝟑𝑳𝑳𝑵𝑵(−𝟏𝟏) + 𝜷𝜷𝟒𝟒∆𝑳𝑳𝑳𝑳𝑳𝑳𝑳𝑳 + 𝜷𝜷𝟓𝟓𝑳𝑳𝑳𝑳𝑳𝑳𝑳𝑳(−𝟏𝟏). Dependent variable: ΔLOP, the first difference of the log of the originator prices. Filgrastim:
Long-run effects LN(-1) -0,129 LSTD(-1) -0,008
Epoetins:
28

Long-run effects LN(-1) -0,003 LSTD(-1) -0,009
The long run effects have been calculated according to following formulas:
For both molecules:
𝐿𝐿𝑁𝑁(−1) = − 𝐿𝐿𝑁𝑁(−1)𝐿𝐿𝐿𝐿𝐿𝐿(−1)
(11)
𝐿𝐿𝐿𝐿𝐿𝐿𝐿𝐿(−1) = −𝐿𝐿𝑆𝑆𝐿𝐿𝐿𝐿(−1)𝐿𝐿𝐿𝐿𝐿𝐿(−1)
(12)
The results indicate that for filgrastim, an increase by 1 in the log of the number of competitors (that
is, an increase by 2,78 times), leads to about 10% decrease in originator prices in the long run. Thus,
strictly speaking, in order to bring about a 10% change in the prices, competitors need to almost triple
in number. Naturally, prices across Europe have eroded by more than 10% even prior to the entry of
three biosimilar competitors. While in some cases originator prices have decreased indeed, for
example in anticipation of biosimilar entries or right afterwards, in other instances biologic originators
have managed to sustain high prices even after biosimilars were marketed. Arguably, this strategy is
more successful in cases where either the brand loyalty in the country is high, or when the molecular
profile of the medicine compels physicians to abstain from prescribing it.
29

A visualisation of the results demonstrates that the effect of the number of firms on the incumbents’
prices is relatively stable throughout time (Figure 4). The trend for epoetins can be defined as stable,
although the line exhibits a slight downward bend. It is not possible to represent the effects for
filgrastim in a similar fashion, since for equation (4) the period effects are not fixed.
Figure 4: Period fixed effects: LN on LOP (epoetin)
6. Discussion The attempt to provide insightful conclusions about the entry decisions and price erosion of biosimilars
in Europe should always be complemented by the specific regulatory environment in each country.
Despite the overall general tendency of biosimilar prices to be influenced by the number of local
competitors (epoetin), or for the number of competitors to be driven by anticipated profits (filgrastim),
there still exists cross-country heterogeneity. The estimates derived from the model allow for a
somewhat deeper discussion.
The per-country fixed effect of the regression for filgrastim – where competitor prices influence the
number of entrants – demonstrates that the dependent variables are highest in Poland and Bulgaria,
while they are lowest in the Netherlands and Norway (Appendix, Table 11). Interestingly, the highest
values are observed in two countries in Central-Eastern Europe, while the lowest are in the North-
Western part of the continent. This indicates that price erosion is more severe in North-Western
Europe. While this result is surprising given the higher economic strength of countries in that area, it
correspond to the use of tenders for biologics (Roediger, 2015). One striking example of the effect of
tendering practices in Norway is the 72% discount provided for biosimilar infliximab in early 2015
30

(GaBI, 2015). At the same time, the fact that multiple cost containment measures have been adopted
in the less affluent Central and Eastern European countries and have not led to such a substantial price
erosion suggests that those markets hold high enough potential for biosimilars revenues. Naturally,
this effect is attenuated by the smaller population size of those nations.
In the regression describing how the number of competitors impacts biosimilars prices for epoetin, the
highest values are observed in Norway and France, while the lowest are in Italy and Bulgaria. In this
case, the geographical division is less clear-cut; still, it is interesting to note that the highest values are
found in Western Europe, while the lowest – in Southern. It can be concluded that the number of
competitors in Norway and France is relatively higher than that in Bulgaria and Italy, as respective
outliers. At first glance, this seems to contradict the results obtained for filgrastim, however, given the
different nature of the two categories of biosimilar products, it can be anticipated that the observed
distribution will be similarly distinct. As Grabowski et al. (2014) have established, Italy has a relatively
lower biosimilars uptake as there is persistent reluctance on behalf of physicians to prescribe these
products. Possibly, the situation in Bulgaria is similar. As far as the two Western countries are
concerned, the results are inconclusive and somewhat contradictory – although France is known for
its brand loyalty (Grabowski et al., 2014), it nevertheless has a higher number of competitors in relative
terms. This leads to the conclusion that other factors, such as the regulatory environment, can serve
to explain why the local market tolerates a higher number of manufacturers.
For the examination of the effect of the number of competitors on originator prices, for filgrastim, the
highest values of the numbers are observed in Greece and Hungary, while the lowest are in Bulgaria
and Poland (Appendix, Table 12). For epoetin, despite the insignificance of the regression estimates,
the highest numbers occur in Hungary and the UK, while the lowest are encountered in Bulgaria and
Italy. Thus, Hungary appears twice in the category of highest values, while Bulgaria – twice in the
category of the lowest ones. The differences between the countries with the highest and the lowest
values are not substantial. Rather, they demonstrate the country-specific characteristics which do not
vary in time with the main dependent variables.
It should be noted that what influences the entry decision of firms is not only the prices of currently
marketed biosimilars but also whether the market access environment in a certain country allows for
the easy coexistence of multiple competitors. In this sense, if national authorities strictly regulate the
prices of each consecutive biosimilar entrant, for instance via mandatory price cuts, EPR or tendering,
some markets may have a limited number of competitors. Furthermore, for instance in the
Netherlands, although currently biologics are not subjected to tendering, there is a perceived high
31

likelihood of its introduction in the future. From among the sample of countries, there is a historically
high use of generics in Germany, Hungary, the Netherlands, Norway and the UK. Still, campaigns
encouraging generics use are taking place in France, as well as in Greece and Italy, although in the
latter two countries the success of the campaigns has not been very high. Explicit campaigns
encouraging biosimilars uptake are taking place in Norway and Italy, but in the latter they are again
evaluated as coming short of achieving truly successful results. In some other countries, such as Greece
and Hungary, the undertaken campaigns for biosimilars are not initiated by the national authorities.
Another interesting market that is anticipating more stringent regulations is Bulgaria: mandatory price
cuts are currently under discussion for all four sub-categories of manufacturers, i.e. pharmaceutical
originators, generic entrants, biologic originators and biosimilar entrants. Therefore, when evaluating
the attractiveness of the market for a biotech company, the decision to enter is inevitably motivated
by the regulatory environment, beside the already predominant prices of competitors.
Admittedly, there are some limitations in the present study. The research has used average
manufacturer prices which exhibit some variation throughout time. The fact that the averages contain
several products of the same brand and those are sold in different formulations, may occasionally
cause additional fluctuation in the average prices due to the corresponding sales volumes. Another
element which would add value to the findings is the inclusion of a regulatory parameter in the
regression. More specifically, this can be a (national) policy which has been introduced in the recent
years, such as the adoption of EPR for biologics, the implementation of a mandatory price cut for
originators or biosimilar entrants, the establishment of tendering as a standard means of procurement
of biologics, or another type of cost containment measure. The evaluation of the total impact of such
a policy on market share, uptake, and price evolution can be informative for payers as well as for
biotech companies. Leopold1 et al. (2014) have prepared such a list of the cost containment measures
introduced in eight European countries in the period 2008 to 2011. They reach the conclusion that
countries can be divided into two categories: more economically stable and less economically stable.
Not surprisingly, the authors (Leopold1 et al., 2014) have found that less economically stable countries
had implemented more policy changes (10 to 22 each), compared to more stable ones (2 to 7 each).
Furthermore, the policy measures had positively impacted the sales volumes, while the effect on
medicine prices was negative. In a following study, Leopold2 et al. (2014) have delved deeper into the
actual impact of certain policy measures, focusing on Portugal and Finland as representatives of each
category of countries according to economic stability. By means of segmented regression analysis of
interrupted time series, the authors (Leopold2 et al., 2014) have been able to measure the effect of
introducing EPR system in Finland, and of harmonization of reimbursement rates, radio and TV
campaigns for generics promotion and a flat reduction on maximum retail price in Portugal. The
32

measurements have been made in terms of change of slope in the established sales volumes for certain
medicines, and change of level of sales following the policy phase-in period. In order to perform such
an evaluation in the context of the present research, specific policies which bear direct impact on
biosimilars prices and market entry would have to be identified. Given the current heterogeneity of
the regulatory environments in each European country, it would be worthwhile to estimate the effect
of policies which have already been implemented. In this way, should a certain cost containment
measure gain popularity and be adopted by more than one country, it is important to be aware of the
magnitude of its impact within the geographies where it has been in place for at least some years.
Consequently, the outcomes of such a research could provide a substantial arsenal of arguments in
the hands of the government and the industry, who may argue in favour or against the adoption of
such a policy, respectively.
Given the different direction of causality between biosimilar prices and the number of competitors, it
is difficult to make predictions about the market behaviour of new biosimilars which are to enter the
market in the future. Arguably, the next wave of entrants referencing mAbs might resemble the market
of epoetin, rather than the one for filgrastim. The reason lies in the molecular complexity and the
potential uptake. On the other hand, exactly as a result of the low willingness to prescribe these
biosimilars, lower prices might be needed in order to incentivise doctors to adopt them and payers to
undertake campaigns favouring them. Thus, steeper and faster price erosion may be anticipated.
Ultimately, manufacturers should be cognizant of the constant interplay between doctors’ inelastic
demand, which pulls prices upwards or at least makes them more sustainable, and payers’ insistence
on making savings, which generally drives medicinal prices down.
7. Conclusion
The results from the present study have informed the understanding of the causality of price erosion
and market entry decisions for two INNs in Europe. In addition, there have been convincing indications
for cross-country differences with respect to number of biosimilar competitors. Since the regression
results for filgrastim and epoetin indicate a different direction of causality regarding the relation
between number of competitors and biosimilar prices, no radical conclusion can be drawn for
biosimilars of other INNs. On the market of filgrastim, the entry effect predominates, while on the
market of epoetins, the competition effect holds the upper hand. A 1% increase in filgrastim biosimilar
prices leads to 38,5% increase in the number of competitors from one month to the next. Each next
epoetin entrant would bring about 7% decrease in the price growth rate of biosimilars of that product
from one month to the next.
33

In terms of the effect of the number of biosimilar competitors on the prices of incumbents, an
important insight is that competition is not the single factor defining originators’ price decrease. For
filgrastim, the model predicts that a long-term 10% price erosion is reached when the competitors
have tripled in number. Given that in reality such price erosion can be reached much earlier, it can be
concluded that many of the drivers of price erosion remain in the hands of national authorities who
exercise much leverage via regulations on biosimilar prices.
The nature of the topic studied here does not easily lend itself to a numerical estimation. Due to the
fact that biosimilars are still in their infancy, the rigorousness of the results obtained with this approach
will be rising proportionately with the products’ longevity on the medicines market. Thus, whether the
growth of molecular size of the next wave of biosimilars will be able to bring about more sizeable
profits as well, remains to be seen.
APPENDIX
A. Glossary of terminology
34

Biologic medicine Biologic medicines are based on proteins (hormones, enzymes, or monoclonal antibodies). Some of them are naturally encountered in the human body. Biologic medicines have a very complex molecular structure and high molecular mass. They are not easily replicable and variability of the structure of the medicines may occur even within the same batch produced by a given company.
Biologic originator The producer of a biologic drug who also holds a patent on it. Biosimilar manufacturer The producer of a medicine which is based
(‘references’) a biologic product which has lost patent protection.
Biosimilar medicine Biosimilar medicines are based on originator
biologic medicines but as it is not possible to replicate the ‘reference product’ completely, biosimilars are not considered exactly the same as the originator product. Thus, their market dynamics are much different from that of small-molecule drugs. The product cannot be considered completely equivalent to the originator.
Biotech company A company which produces medicines
explicitly based on biologic organisms, such as proteins.
Cost containment measures Practices generally adopted by European
national authorities in response to shrinking budgets and attempts to cut down costs on healthcare expenditure. There is a wide variety of CCMs and they can be applied to different members of the value chain (manufacturers, wholesalers, pharmacists).
European Biopharmaceutical Enterprises (EBE) An organisation of some members of the
biotech industry in Europe. Beside organising some workshops and initiatives, they also
35

publish position papers and write reports on relevant biopharmaceutical topics.
European Medicines Agency (EMA) The main European regulatory body which grants marketing authorisation for medicines on a pan-European level. It also issues guidelines for the use of certain medicines. European Price Referencing (EPR) The system of international price comparison
of medicines which can be based on INN prices or the respective manufacturer’s own prices abroad.
Generic medicine A small-molecule medicine which has the
same molecular structure as an originator product (‘reference product’) that is off patent. The product can be considered an equivalent to the originator.
Indication The specific disease or condition for which
the respective medicine is used. Some medicines receive marketing authorisation for more than one indication.
International non-proprietary name (INN) The name which is given to the molecule of a
certain innovative drug and this name is used for all medicines with the same molecule which are produced after the patent expiration of the originator.
mAbs A specific type of biologic medicines which is
said to lead the next big wave of products on the drugs market. The revenues brought about by these products are considerable (accounting to billions of euros), thus there is increasing interest on behalf of the entire industry in the pricing and market share development of these products.
National price referencing (NPR) The system of price referencing on a national
level, whereby the prices of products in the same therapeutic or INN class are compared and the lowest one is used to set the
36

reimbursement level for that class of medicines.
Pharmaceutical originator The manufacturer of a small-molecule
medicine who still holds patent rights on it (usually for the duration of about 20 years).
Pharmacovigilance The practice of monitoring the medical
performance on patients of a certain drug in terms of side effects, adverse reactions or any life-threatening issues. Biosimilar products are normally subjected to such strict monitoring.
Small-molecule medicine / pharmaceutical Chemical medicines which have relatively
simple molecular structure. Being based on simple chemical synthesis, they are easily replicable in laboratory environment.
Substitution The practice of fulfilling the prescription at
the pharmacy and dispensing a drug based on the INN, regardless of the brand name. In most European countries it is possible to substitute generic medicines, but it is hardly anywhere the case for biosimilars.
Switching The practice of changing the brand of the
medicine, but not the active ingredient (or INN) with which a patient is treated. This is usually performed by physicians and is particularly important for biologics and biosimilars, since biosimilars are not considered to be exact copies of the originator (or ‘reference’) product. Safety and tolerability are among the ain concerns when switching patients from an originator biologic product to a biosimilar or vice versa.
B. Country effects from regression estimates Table 11: Country fixed effects*
filgrastim epoetin
37

COUNTRY EFFECT COUNTRY EFFECT 1 Bulgaria 0.245176 1 Bulgaria -0.579337 2 France 0.456326 2 France 0.000294 3 Germany -0.287050 3 Germany 0.186414 4 Greece -0.317019 4 Greece 0.248465 5 Hungary -0.010674 5 Hungary 0.244722 6 Italy 0.343748 6 Italy -0.312923 7 Netherlands -0.474200 7 Netherlands 0.192242 8 Norway -0.336114 8 Norway 0.078872 9 Poland 0.096841 9 Poland -0.226839
10 UK 0.282965 10 UK 0.168088 * Filgrastim, equation (2):
∆(𝑁𝑁) = 𝛽𝛽0 + 𝛽𝛽1∆𝐿𝐿𝐿𝐿𝐿𝐿 + 𝛽𝛽2𝑁𝑁(−1) + 𝛽𝛽3𝐿𝐿𝐿𝐿𝐿𝐿(−1) + 𝛽𝛽4∆𝐿𝐿𝐿𝐿𝐿𝐿𝐿𝐿 + 𝛽𝛽5𝐿𝐿𝐿𝐿𝐿𝐿𝐿𝐿(−1) Epoetin, equation (6):
∆(𝐿𝐿𝐿𝐿𝐿𝐿) = 𝛽𝛽0 + 𝛽𝛽1∆𝑁𝑁 + 𝛽𝛽2𝑁𝑁(−1) + 𝛽𝛽3𝐿𝐿𝐿𝐿𝐿𝐿(−1) + 𝛽𝛽4∆𝐿𝐿𝐿𝐿𝐿𝐿𝐿𝐿 + 𝛽𝛽5𝐿𝐿𝐿𝐿𝐿𝐿𝐿𝐿(−1) Table 12: Country fixed effects**
filgrastim epoetin COUNTRY EFFECT COUNTRY EFFECT
1 Bulgaria -0.365478 1 Bulgaria -0.939750 2 France -0.080849 2 France -0.007868 3 Germany 0.275615 3 Germany 0.300269 4 Greece 0.066545 4 Greece 0.259049 5 Hungary 0.104203 5 Hungary 0.126254 6 Italy -0.247829 6 Italy -0.268472 7 Netherlands 0.120619 7 Netherlands 0.201047 8 Norway 0.174328 8 Norway 0.308939 9 Poland -0.251951 9 Poland -0.158310
10 UK 0.129675 10 UK 0.178842 ** Filgrastim, equation (4):
∆𝐿𝐿𝐿𝐿𝐿𝐿 = 𝛽𝛽0 + 𝛽𝛽1∆𝐿𝐿𝑁𝑁 + 𝛽𝛽2𝐿𝐿𝐿𝐿𝐿𝐿(−1) + 𝛽𝛽3𝐿𝐿𝑁𝑁(−1) + 𝛽𝛽4∆𝐿𝐿𝐿𝐿𝐿𝐿𝐿𝐿 + 𝛽𝛽5𝐿𝐿𝐿𝐿𝐿𝐿𝐿𝐿(−1) Epoetin, equation (4):
∆𝐿𝐿𝐿𝐿𝐿𝐿 = 𝛽𝛽0 + 𝛽𝛽1∆𝐿𝐿𝑁𝑁 + 𝛽𝛽2𝐿𝐿𝐿𝐿𝐿𝐿(−1) + 𝛽𝛽3𝐿𝐿𝑁𝑁(−1) + 𝛽𝛽4∆𝐿𝐿𝐿𝐿𝐿𝐿𝐿𝐿 + 𝛽𝛽5𝐿𝐿𝐿𝐿𝐿𝐿𝐿𝐿(−1)
References Barosi, G., Bosi, A., Abbracchio, M., Danesi, R., Genazzani, A., Corradini, P., Pane, F. and Tura, S. (2011). Key concepts and critical issues on epoetin and filgrastim biosimilars. A position paper from the Italian
38

Society of Hematology, Italian Society of Experimental Hematology, and Italian Group for Bone Marrow Transplantation. Hematologica, 96(7): 937-942 Brekke, K.R., Grasdal, A.L., and Holmås, T.H. (2007). Regulation and pricing of pharmaceuticals: reference pricing or price cap regulation? CESifo working paper, No. 2059 Dalgaard, K., Evers, M., and Santos da Silva, J. (2013). Biosimilars seven years on: Where are we and what’s next? Insights into Pharmaceuticals and Medical products. McKinsey & Company Declerck, P., and Simoens, S. (2012). A European perspective on the market accessibility of biosimilars. Dove Medical Press Ltd, 2: 33-40 Dranitsaris, G., Amir, E., and Dorward, K. (2011). Biosimilars of biological drug therapies. Regulatory, clinical and commercial considerations. Drugs: (Impact factor: 4.13), vol.71, issue 12: 1527-1536. Augmentum Pharma Consulting, Toronto, ON, Canada European Commission. (2013). What you need to know about biosimilar medicinal products. Consensus Information Paper. Process on corporate responsibility in the field of pharmaceuticals. Access to medicines in Europe. European Medicines Agency (EMA), 2014 & 2015. Available on: www.ema.europa.eu GaBI Online – Generics and Biosimilars Initiative. US$54 billion worth of biosimilar patents expiring before 2020. (2011). Mol, Belgium: Pro Pharma Communications international. Retrieved from: www.gabionline.net GaBI Online – Generics and Biosimilars Initiative. Factors affecting market access of biosimilars. (2012). Mol, Belgium: Pro Pharma Communications international. Retrieved from: www.gabionline.net GaBI Online – Generics and Biosimilars Initiative. Huge discount on biosimilar infliximab in Norway. (2015). Mol, Belgium: Pro Pharma Communications international. Retrieved from: www.gabionline.net Grabowski, H., Cockburn, I., and Long, G. (2006). The market for follow-on biologics: How will it evolve? Health Affairs, 25, no. 5: 1291-1301 Grabowski, H.G., Ridley, D.B., and Schulman, K.A. (2007). Entry and competition in generic biologics. Managerial and Decision Economics, 28: 439-451. Published online in Wiley InterScience. Available on: www.interscience.wiley.com Grabowski, H., Guha, R., and Salgado, M. (2014). Biosimilar competition: lessons from Europe. Nature reviews. Drug discovery, vol. 13: 99-100. Macmillan Publishers Limited Leopold1, C., Mantel-Teeuwisse, A.K., Vogler, S., Valkova, S., de Joncheere, K., Leufkens, H.G.M., Wagner, A.K., Ross-Degnan, D., and Laing, R. (2014). Effect of the economic recession on pharmaceutical policy and medicine sales in eight European countries. Bull World Health Organ, 92: 630 – 640D Leopold2, C., Zhang, F., Mantel-Teeuwisse, A.K., Vogler, S., Valkova, S., Ross-Degnan, D., and Wagner, A.K. (2014). Impact of pharmaceutical policy interventions on utilisation of antipsychotic medicines in Finland and Portugal in times of economic recession: interrupted time series analysis. International Journal for Equity in Health. 13:53
39

Roediger, A. (2015). European Biopharmaceutical Enterprises. What pricing and reimbursement policies to use for off-patent biological? – Results from the EBE 2014 biological medicines policy survey. GaBI Journal – Generics and Biosimilars Initiative Journal, vol. 4, issue 1: 17-24 Rovira, J., Lindner, L., Gimenez, E., Espin, J., Oldry de Labry, A., and Garcia, L. (2013). Biosimilars in the European Market. GaBI Online – Generics and Biosimilars Initiative. Mol, Belgium: Pro Pharma Communications international. Retrieved from: www.gabionline.net Swilling, N. (2014). Barbec(EU)d oncology market access. Healthcare Insights. Simon-Kucher & Partners. Vol. 7, Issue 1: 11-14 Tele, P., and Groot, W. (2009). Cost containment measures for pharmaceuticals expenditure in the EU countries: a comparative analysis. The Open Health Services and Policy Journal, 9: 71-83
40