biosolids and carbon footrpint - c.ymcdn.com · us targeted at 7% reduction ... fertilizer offset,...
TRANSCRIPT

Biosolids and CarbonBiosolids and CarbonFootprintFootprint
Patricia Scanlan
Andrew Shaw, Steve Tarallo
November 3, 2009
November 3, 2009Page - 2
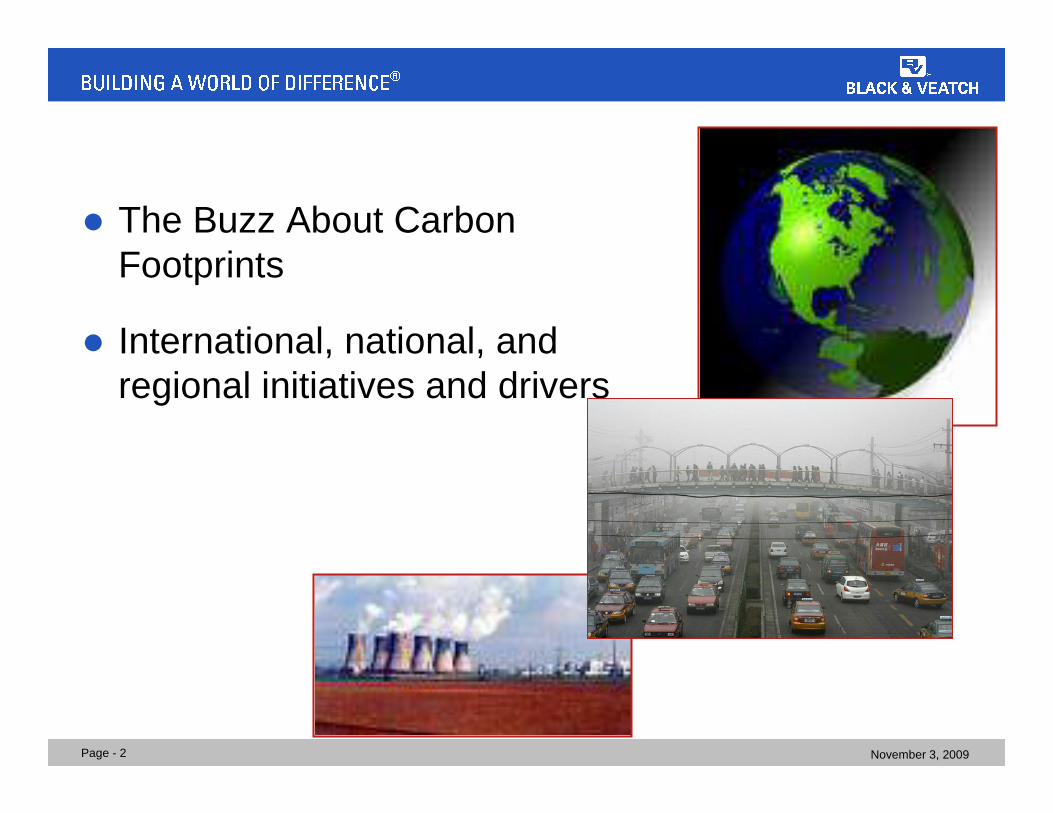
� The Buzz About CarbonFootprints
� International, national, andregional initiatives and drivers

November 3, 2009Page - 3
The Buzz…Why are we inventorying GHG emissions anddeveloping carbon footprints?
� GHG emissions vs. carbon footprint
� Means for auditing, measuring GHG emissions
� Global warming potential (GWP)
� Useful if carbon trading programs are implemented orcarbon caps are imposed in the future
� Important component of a sustainability assessment
� Strategic planning and process selection

November 3, 2009Page - 4
International Initiatives and Drivers
� Kyoto Protocol (1997)
� By 2012, reduce GHG emissions to 5% below 1990levels
� Reduction requirements vary by country
� Only 37 countries required to reduce emissions
� US targeted at 7% reduction
� US did NOT ratify Kyoto
� Expires in 2012. UN Climate Change Conference (Dec2009)

November 3, 2009Page - 5
National Initiatives� Conference of Mayors Climate
Protection Agreement
� Includes 1,012 cities
� Meet or beat Kyoto Protocoltargets (7% reduction by 2012)
� Local implementation
� Arizona cities include:
� Apache Junction
� Bisbee
� Buckeye
� Bullhead City
� Flagstaff
� Gilbert
� Goodyear
� Mesa
� Oro Valley
� Phoenix
� Tucson
� Winslow

November 3, 2009Page - 6
National Initiatives - Legislation

November 3, 2009Page - 7
National Initiatives - Legislation
� American Clean Energy and Security Act of 2009 (ACES) (H.R. 2454)
� Reduce GHG emissions by 17% by 2020
� Applies to emitters of 10,000 tonne/yr CO2e (for specific categoriesof emitters)
� Establishes federal GHG registry
� Includes Cap-and-Trade provisions
� Addresses barriers to carbon sequestration and capture
� Provides for trading, banking, borrowing credits and offsets
� Senate hearings this week

November 3, 2009Page - 8
National Initiatives - Rules� USEPA 40 CFR Part 98
� Mandatory reporting of GHG emissions forspecific industries
� Triggered at 25,000 tonne/year CO2 equiv
�Based on actual, direct emissions
�Does not include electricity purchase
�Biogenic emissions reported separately
�30 mmBtu/hr comparison

November 3, 2009Page - 9
Regional Initiatives� Northeast, midwest, and western
initiatives
� Western Climate Initiative (WCI)
� Reduce GHG emissions to 15%below 2005 levels by 2020(beginning in 2012). POTWsincluded starting 2015. Measured atpoint of emission
� Reporting begins at 10,000 tonne/yrCO2e
� Compliance at 25,000 tonne/yrCO2e
� Triggers based on stationarycombustion emissions
� Includes reporting of emissionsfrom biomass combustion
� Offsets limited to 49% of reductions WCI Partners

November 3, 2009Page - 10
� Carbon footprint of biosolidsmanagement
� Options to reduce emissions

November 3, 2009Page - 11
What are the WW Treatment Carbon Footprint Boundaries?
Treatment System
DecommissioningOperationConstruction

November 3, 2009Page - 12
Inventory Operational Boundaries
Source:WRI/WBCSD

November 3, 2009Page - 13
Scope Definitions
Contracted services
Supply chainsources
Waste disposal
Employee travel
Purchasedelectricity
Direct processemissions
Direct fugitiveemissions
Stationarycombustion
Vehicle fleet fuelcombustion
Scope 3(Optional)
Scope 2Scope 1

November 3, 2009Page - 14
Scope 1 Sources – Wastewater treatment� CO2
� Stationary combustion,vehicle use
� CH4
� stationary combustion,fugitive emissions, vehicleuse, lagoons
� N2O
� stationary combustion,N/DN, vehicle use,incineration, plant effluent

November 3, 2009Page - 15
Scope 2 Purchased Electricity - eGRID
AZNM: 1,316 lb/MWh
National Average: 1,329 lb/MWh
The Emissions & Generation Resource IntegratedDatabase for 2007
(eGRID2007) Technical Support Document
November 3, 2009Page - 16
Scope 3 Sources – Wastewater treatment
� “Embodied” carbon from supply chain
� Equipment
� Chemicals
� Consumables for maintenance
� Solids disposal/final use
� Contractor hauling (mobile combustion)
� Landfill gas production (w/ or w/o LFG collection system)
� Land application
� Fertilizer offset, carbon sequestration, N2O emissions

November 3, 2009Page - 17
Developing the Carbon Footprint for BiosolidsProcesses
� Build GHG emissions from “ground up”
� Identify evaluated processes
� Identify emissions associated with each process
�Use measurement or emission factors
�May be difficult to identify actual energy useassociated with specific processes
� Remember impacts of sidestream treatment

November 3, 2009Page - 18
Carbon Footprint of Thickening and Dewatering
�Polymer use
�Equipmentmanufacture andconstruction
�Transportation forstaff
�Purchasedelectricity
�None
Scope 3(Optional)
Scope 2Scope 1

November 3, 2009Page - 19
Carbon Footprint of Aerobic Digestion
�Polymer use
�Equipmentmanufacture andconstruction
�Transportation forstaff
�Purchasedelectricity
�N2O emissions
Scope 3(Optional)
Scope 2Scope 1

November 3, 2009Page - 20
Carbon Footprint of Anaerobic Digestion
�Chemicals for biogascleaning
�Offsets for biogas use“outside the fence”
�Equipmentmanufacture andconstruction
�Transportation for staff
�Purchased electricity
�Electricity offset(shown as reduction inpurchased electricity)
�Natural gas use
�Fugitive CH4
emissions
�Flare combustion orcogeneration emissions(N2O and CH4)
Scope 3(Optional)
Scope 2Scope 1

November 3, 2009Page - 21
Carbon Footprint of Thermal Processes
�Equipmentmanufacture andconstruction
�Transportation for staff
�Purchased electricity
�Electricity offset frompower generation(shown as reduction inpurchased electricity)
�Combustionemissions (incinerators– N2O)
�Natural gas use(incineration/heatdrying)
Scope 3(Optional)
Scope 2Scope 1

November 3, 2009Page - 22
Carbon Footprint for Final Use Options
�Contracted hauling
�Landfill emissions
�Land application N2Oemissions
�Chemical use (alkalinestabilization)
�Offsets for energy use“outside the fence”
�Offsets for fertilizerreplacement
�Offsets for carbonsequestration
�Purchased electricity�Utility-owned hauling
Scope 3(Optional)
Scope 2Scope 1

November 3, 2009Page - 23
Reducing Carbon Footprint
� First, determine your objectives
� Scope 1 and 2 only?
� For reporting reasons or totalsystem sustainability decisions? Drying Beds
� Choose technologies with lower energy requirements
� Minimize options that require aeration
� Consider impact of thickening and dewatering
� Heat drying and incineration have high energyrequirements
� Solar drying has low energy requirements

November 3, 2009Page - 24
What Portion of Total is Purchased Energy?
Purchased Elec.92%
Mobile2%
Stationary0%
FugitiveEmissions
2%Polymer
4%
Mobile
Purchased Elec.
Stationary
Polymer
Fugitive Emissions
Centrifuge Dewatering
21,000 tonne/yr CO2e
Scope 1 and Scope 2
Converting to BFP dewatering reduces GHG by 11%

November 3, 2009Page - 25
What is the Impact of Technology Choice onGHG?
GHG EmissionsBy Emissions Source
0
5,000
10,000
15,000
20,000
25,000
30,000
35,000
40,000
Cent. BFP Cent w / ER BFP w /ER Drying Incineration
To
nn
e/ye
ar
Fugitive Emissions
Incineration
Polymer
Stationary
Purchased Elec.
Mobile

November 3, 2009Page - 26
Environmental Product Declarations (EPD)
� EPD describes the environmentalimpact of producing and using aproduct based on verified Life CycleAssessments (LCA) in accordance withISO 14025
� Good Example: Flygt Pumpshttp://int.flygt.com/1000251.asp
� Climate Declaration is a simplifiedEPD just for green-house gases,expressed as CO2-equivalents for aproduct's life cycle.
� Tools where customers can comparedifferent products' environmentalperformance.
CO2e kg per kW ofPumping Power
Used over 5yr Life
Production Use Total
Consider Impacts of Equipment Choice

November 3, 2009Page - 27
Reducing Carbon Footprint (continued)
� Maximize use of energy recovery
� Use biogas for power generation, process orbuilding heating/cooling
� Consider biogas augmentation processes
�Co-digestion with FOG
�WAS pretreatment (OpenCEL, Crown Biogest,thermal hydrolysis)

November 3, 2009Page - 28
Reducing Carbon Footprint – Scope 3
� In general, final use options using land applicationhave the lowest GHG emissions
� Landfill disposal has high GHG emission
� Landfill gas systems may not capture methanegenerated by biosolids (3-5 year delay)

November 3, 2009Page - 29
Putting Biosolids in Perspective
� Western Australia (42 mgd / 62 dtpd)
� SBR treatment
� Rotary screw thickeners
� Anaerobic digestion
� Centrifuge dewatering
� Co-generation
1.3 tonne/tonne total
� Co-generation decreased totalby 1.1 tonne/tonne (46%)
29%
71%
Plant Total Solids Treatment