biosolids and organic farming - efrc.com and organic farming - brian...biosolids and organic farming...
TRANSCRIPT
Biosolids and
Organic Farming
Brian J Chambers
Head of Soils & Nutrients
Insert image here
5th Organic Producers Conference
17-18 January 2011
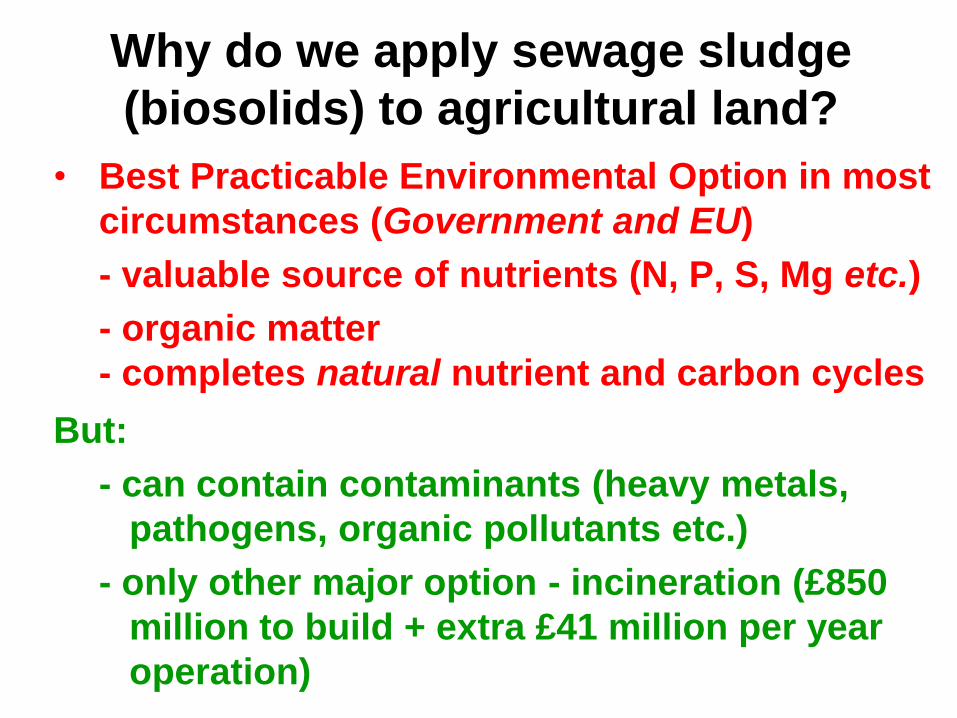
Why do we apply sewage sludge
(biosolids) to agricultural land?
• Best Practicable Environmental Option in most
circumstances (Government and EU)
- valuable source of nutrients (N, P, S, Mg etc.)
- organic matter
- completes natural nutrient and carbon cycles
But:
- can contain contaminants (heavy metals,
pathogens, organic pollutants etc.)
- only other major option - incineration (£850
million to build + extra £41 million per year
operation)
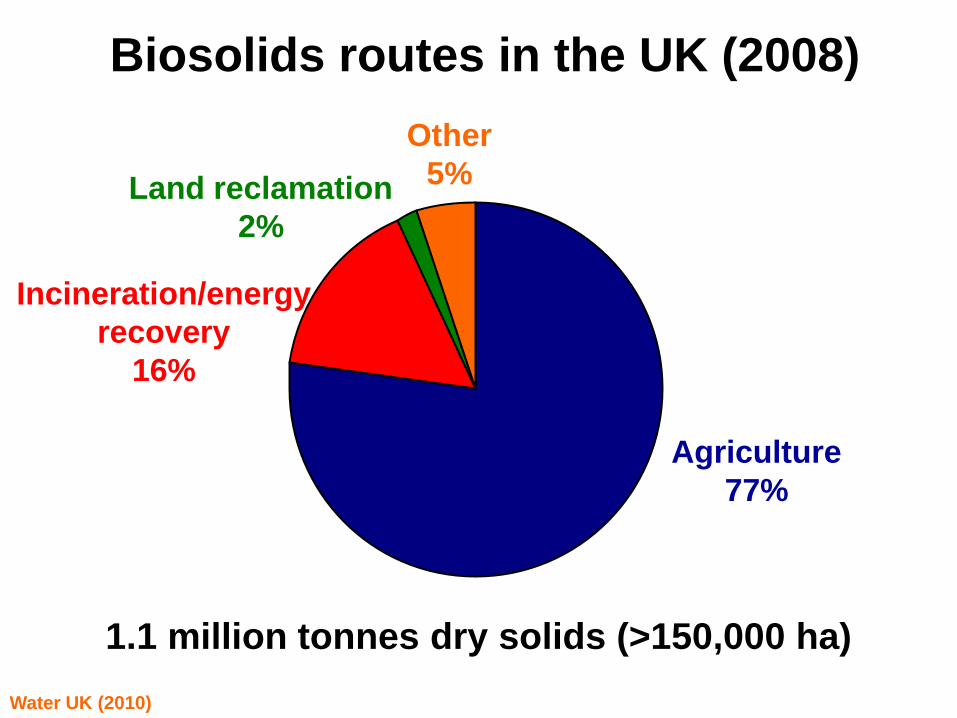
Biosolids routes in the UK (2008)
1.1 million tonnes dry solids (>150,000 ha)
Agriculture
77%
Incineration/energy
recovery
16%
Land reclamation
2%
Other
5%
Water UK (2010)
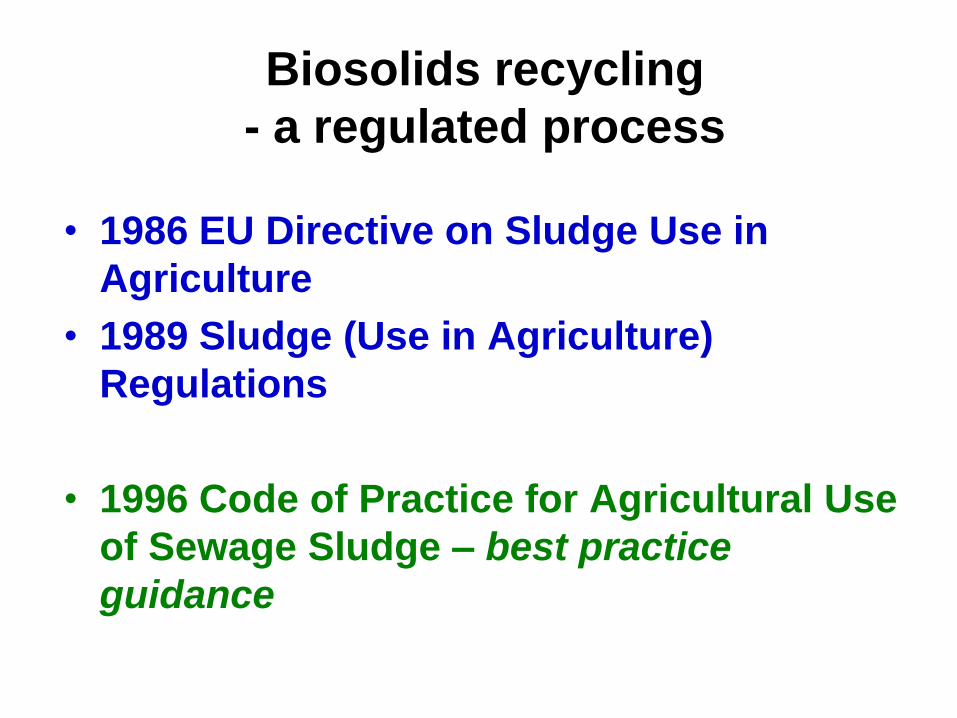
Biosolids recycling
- a regulated process
• 1986 EU Directive on Sludge Use in
Agriculture
• 1989 Sludge (Use in Agriculture)
Regulations
• 1996 Code of Practice for Agricultural Use
of Sewage Sludge – best practice
guidance
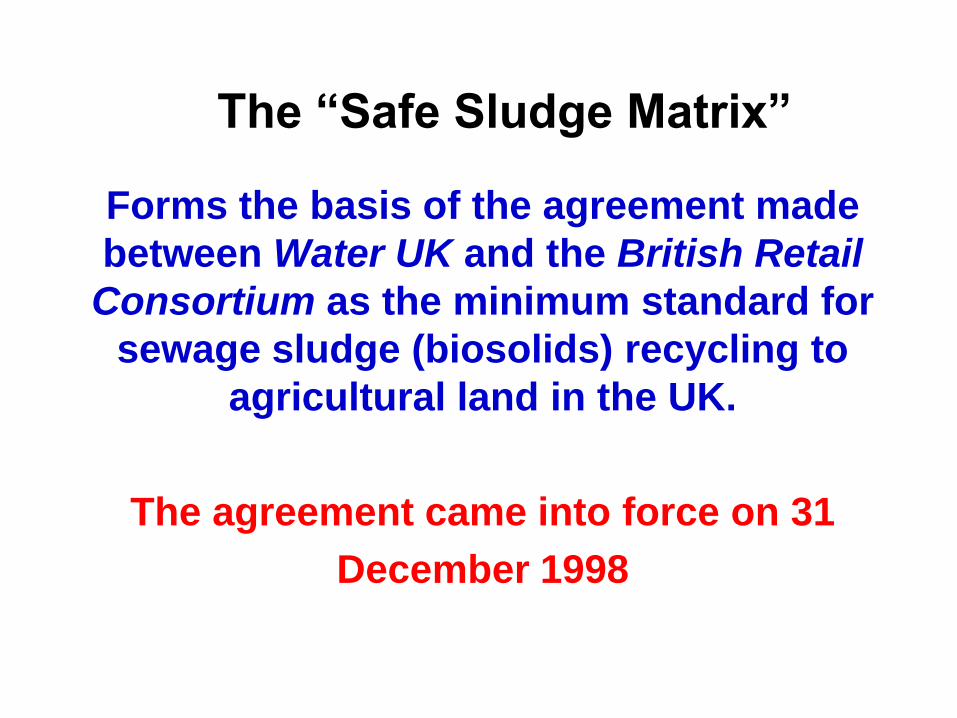
Forms the basis of the agreement made
between Water UK and the British Retail
Consortium as the minimum standard for
sewage sludge (biosolids) recycling to
agricultural land in the UK.
The agreement came into force on 31
December 1998
The “Safe Sludge Matrix”
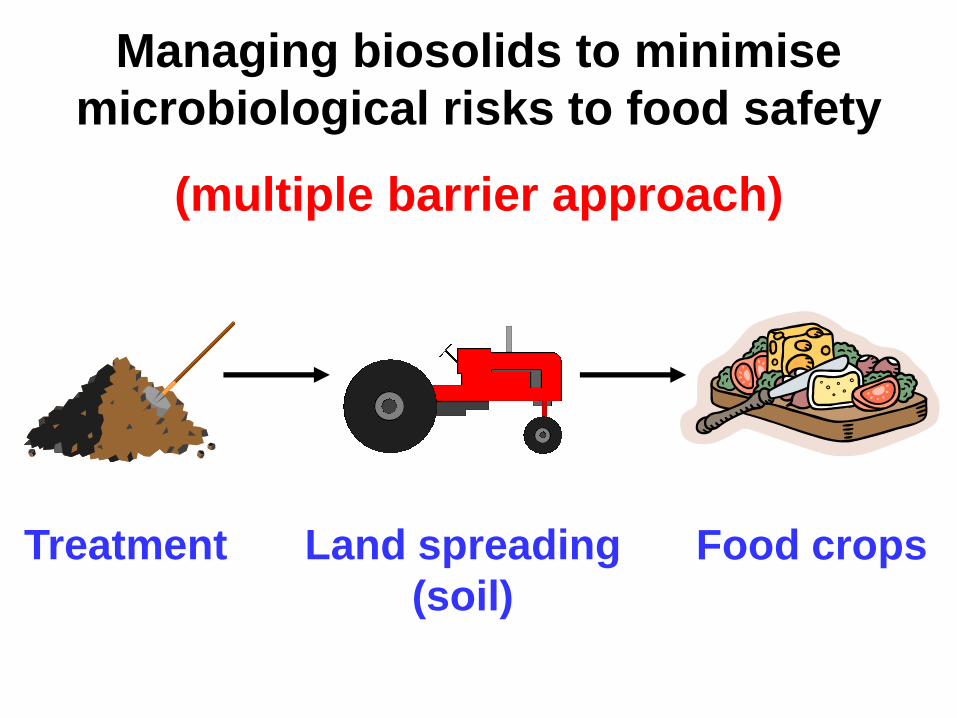
Managing biosolids to minimise
microbiological risks to food safety
(multiple barrier approach)
Treatment Land spreading
(soil)
Food crops
AND ANIMAL
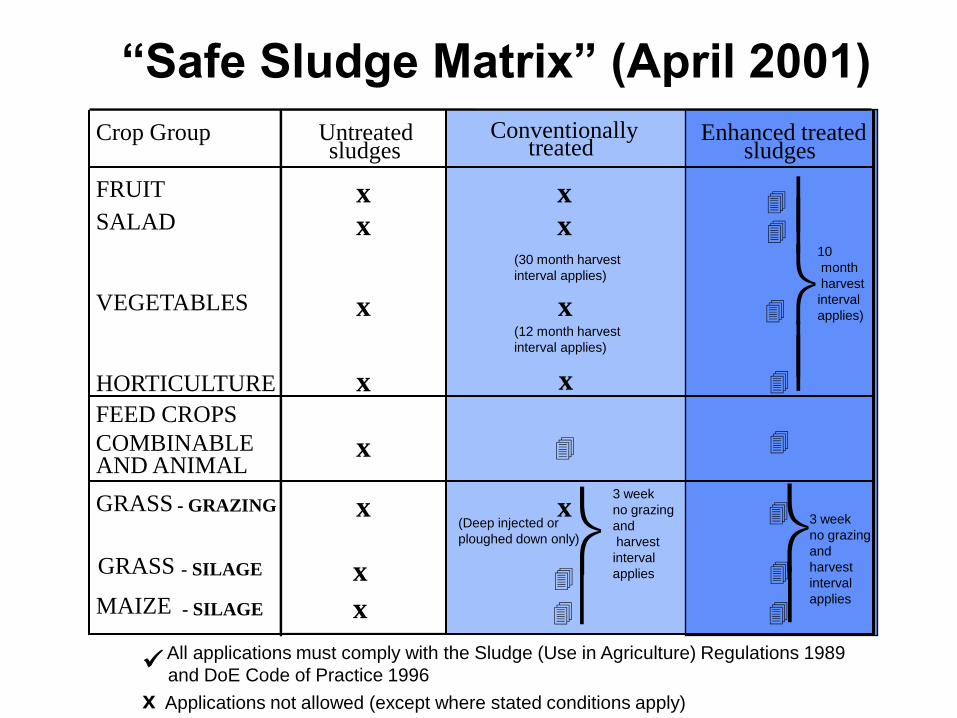
Crop Group Untreatedsludges
Conventionally Enhanced treatedsludges
FRUIT x x 4
SALAD x x 4
VEGETABLES x x 4
HORTICULTURE x x 4
FEED CROPS
COMBINABLE x 4 4
GRASS - GRAZING
- SILAGE
x
x
x
4
4
4
MAIZE - SILAGE x 4 4
All applications must comply with the Sludge (Use in Agriculture) Regulations 1989
and DoE Code of Practice 1996
x Applications not allowed (except where stated conditions apply)
3 week
no grazing
and
harvest
interval
applies
3 week
no grazing
and
harvest
interval
applies
(Deep injected or
ploughed down only)
(30 month harvest
interval applies)
(12 month harvest
interval applies)
10
month
harvest
interval
applies)
“Safe Sludge Matrix” (April 2001)
GRASS
treated
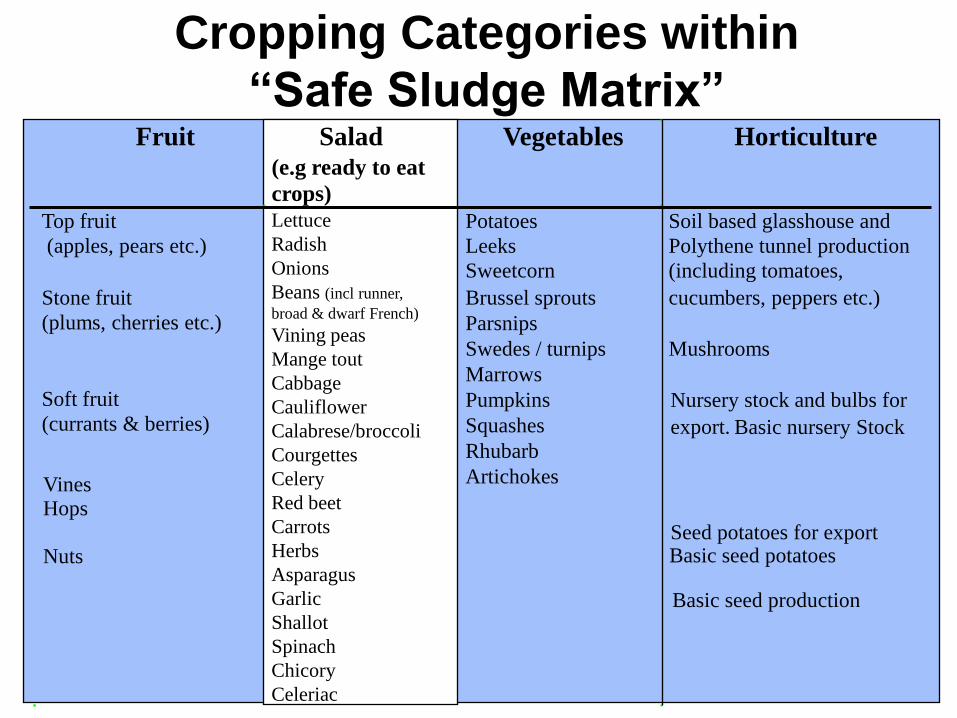
Cropping Categories within
“Safe Sludge Matrix”Fruit Salad
(e.g ready to eat
crops)
Vegetables Horticulture
Top fruit Lettuce
Radish
Onions
Beans (incl runner,
broad & dwarf French)
Vining peas
Mange tout
Cabbage
Cauliflower
Calabrese/broccoli
Courgettes
Celery
Red beet
Carrots
Herbs
Asparagus
Garlic
Shallot
Spinach
Chicory
Celeriac
(apples, pears etc.)
Potatoes
Leeks
Soil based glasshouse and
Polythene tunnel production
Sweetcorn (including tomatoes,
Stone fruit
(plums, cherries etc.)
Brussel sprouts
Parsnips
Swedes / turnips
Marrows
Pumpkins
Squashes
Rhubarb
Artichokes
cucumbers, peppers etc.)
Mushrooms
Nursery stock and bulbs forSoft fruit
(currants & berries) export.
Hops
Basic nursery Stock
Basic seed production
Vines
Seed potatoes for exportNuts Basic seed potatoes
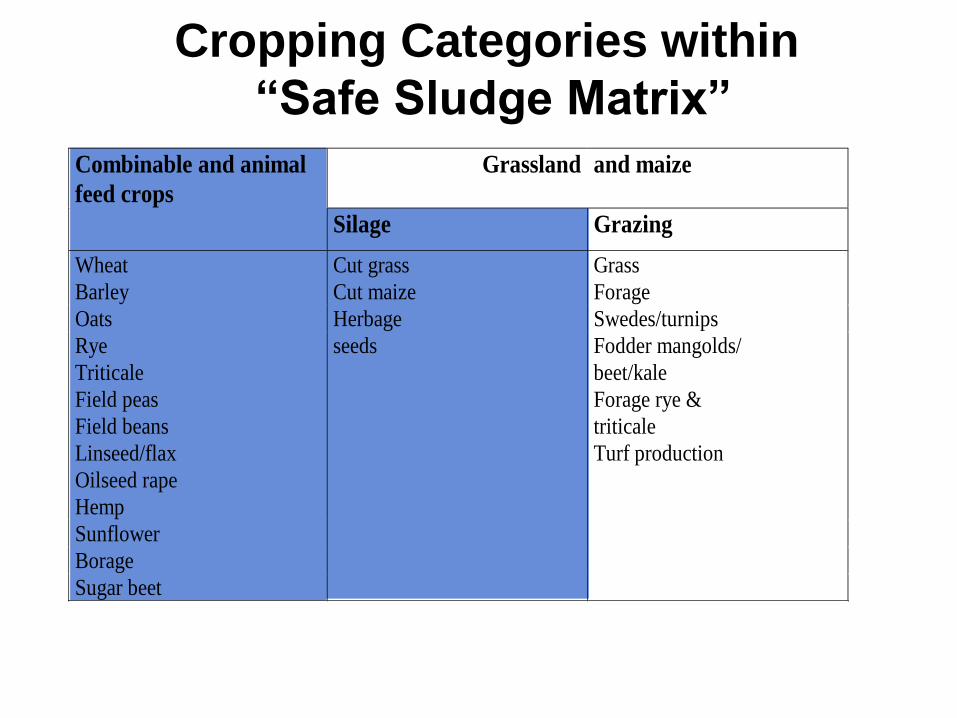
Combinable and animal
feed crops
Grassland and maize
Silage Grazing
Wheat Cut grass Grass
Barley Cut maize Forage
Oats Herbage Swedes/turnips
Rye seeds Fodder mangolds/
Triticale beet/kale
Field peas Forage rye &
Field beans triticale
Linseed/flax Turf production
Oilseed rape
Hemp
Sunflower
Borage
Sugar beet
Cropping Categories within
“Safe Sludge Matrix”
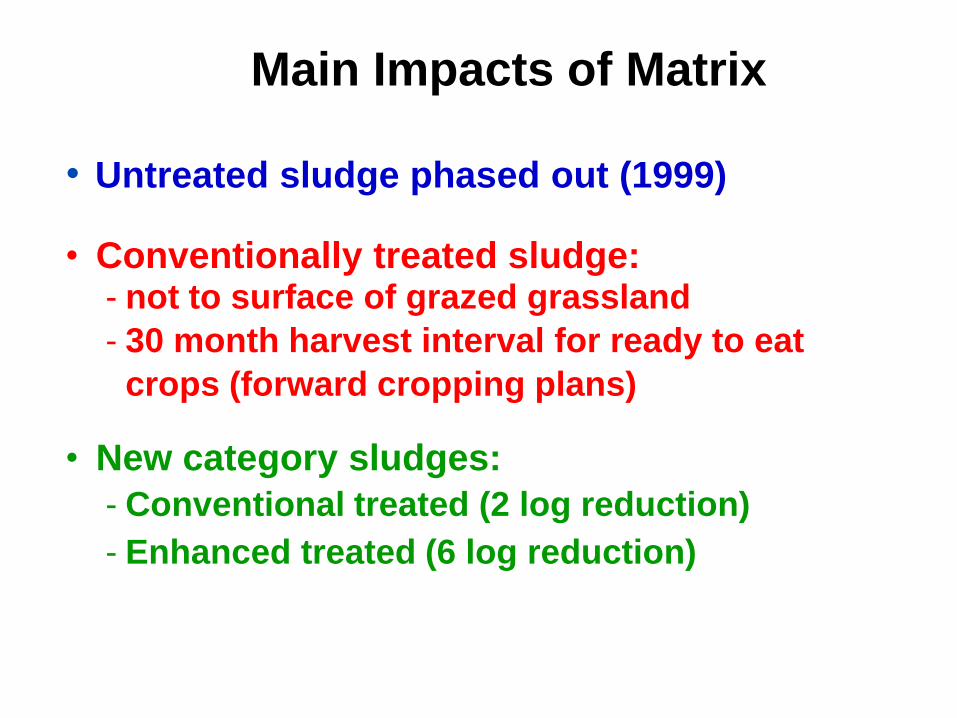
Main Impacts of Matrix
• Untreated sludge phased out (1999)
• Conventionally treated sludge: - not to surface of grazed grassland
- 30 month harvest interval for ready to eat
crops (forward cropping plans)
• New category sludges:
- Conventional treated (2 log reduction)
- Enhanced treated (6 log reduction)
0
200
400
600
800
1000
1200
1995 1998 2001 2002 2003 2004 2005 2006 2008
Dry
so
lid
s (
000 t
on
nes)
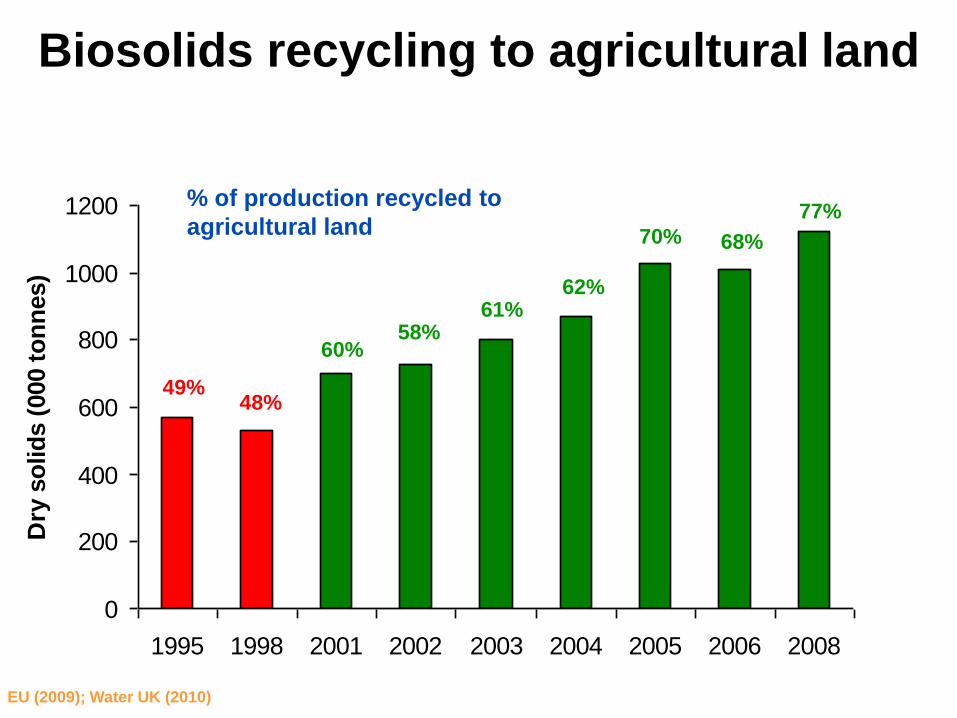
Biosolids recycling to agricultural land
EU (2009); Water UK (2010)
49%48%
60%58%
61%62%
70% 68%
% of production recycled to
agricultural land77%
Operational land recycling
- nitrogen (NVZs)
- heavy metals
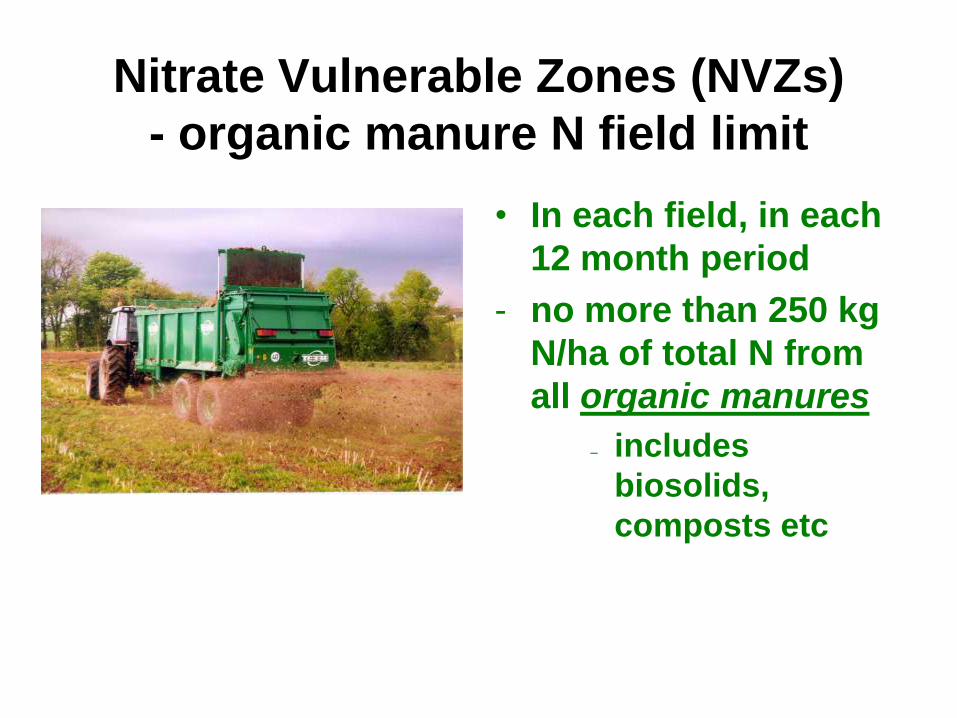
Nitrate Vulnerable Zones (NVZs)
- organic manure N field limit
• In each field, in each
12 month period
- no more than 250 kg
N/ha of total N from
all organic manures
– includes
biosolids,
composts etc
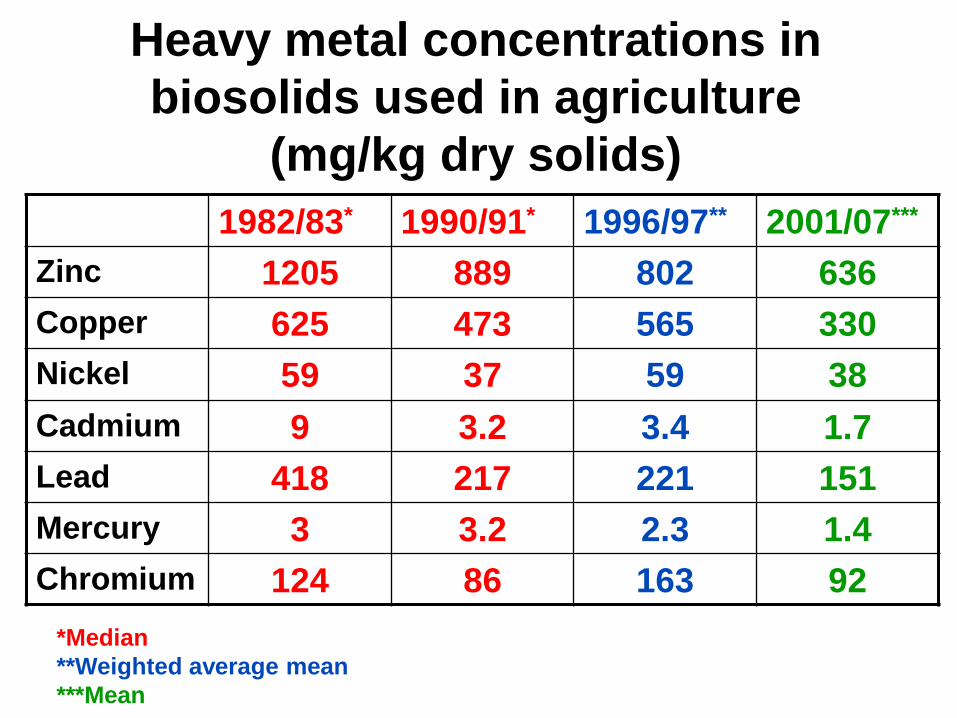
Heavy metal concentrations in
biosolids used in agriculture
(mg/kg dry solids)
Median concentrations
1982/83* 1990/91* 1996/97** 2001/07***
Zinc 1205 889 802 636
Copper 625 473 565 330
Nickel 59 37 59 38
Cadmium 9 3.2 3.4 1.7
Lead 418 217 221 151
Mercury 3 3.2 2.3 1.4
Chromium 124 86 163 92
*Median
**Weighted average mean
***Mean
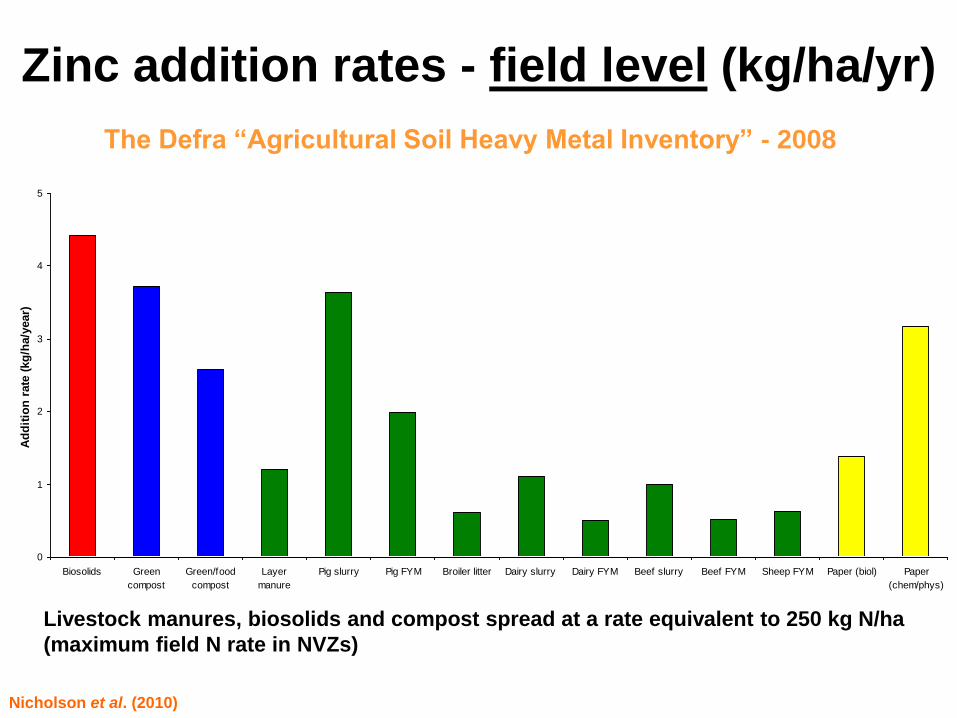
Zinc addition rates - field level (kg/ha/yr)
Livestock manures, biosolids and compost spread at a rate equivalent to 250 kg N/ha
(maximum field N rate in NVZs)
The Defra “Agricultural Soil Heavy Metal Inventory” - 2008
0
1
2
3
4
5
Biosolids Green
compost
Green/food
compost
Layer
manure
Pig slurry Pig FYM Broiler litter Dairy slurry Dairy FYM Beef slurry Beef FYM Sheep FYM Paper (biol) Paper
(chem/phys)
Ad
dit
ion
rate
(kg
/ha/y
ear)
Nicholson et al. (2010)
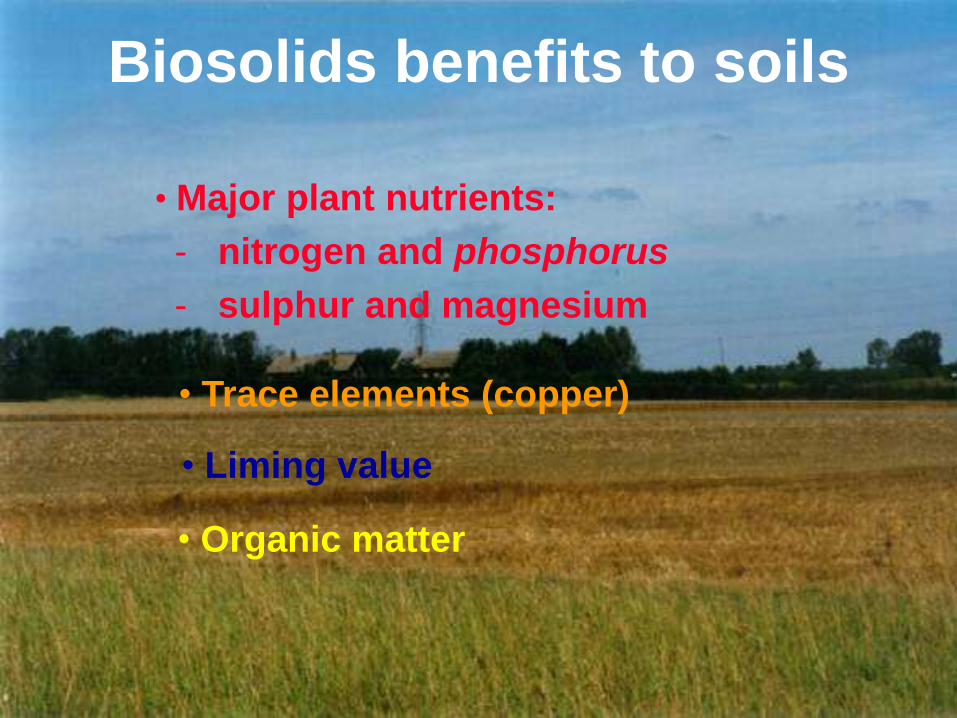
Biosolids benefits to soils
• Major plant nutrients:
- nitrogen and phosphorus
- sulphur and magnesium
• Organic matter
• Trace elements (copper)
• Liming value
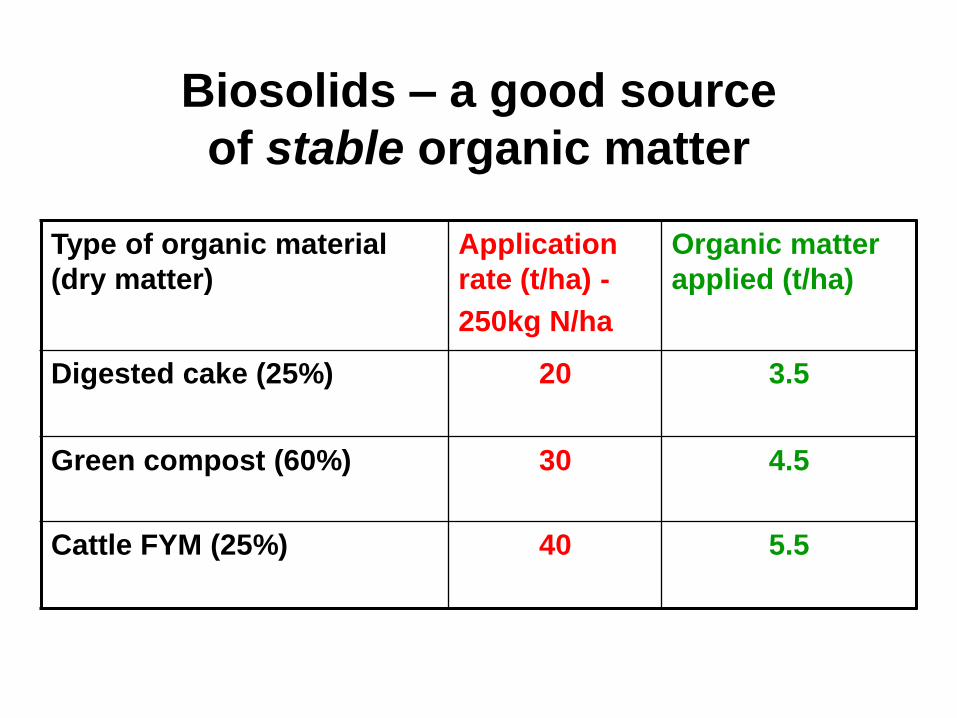
Biosolids – a good source
of stable organic matter
Type of organic material
(dry matter)
Application
rate (t/ha) -
250kg N/ha
Organic matter
applied (t/ha)
Digested cake (25%) 20 3.5
Green compost (60%) 30 4.5
Cattle FYM (25%) 40 5.5
“The Fertiliser Manual (RB209)”
8th Edition, June 2010
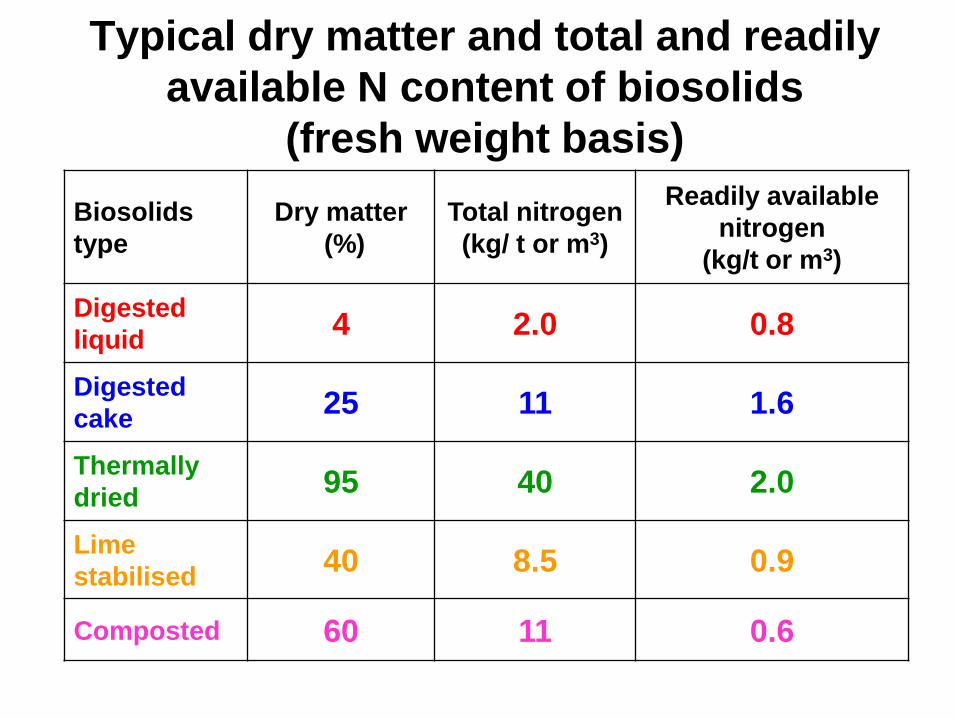
Typical dry matter and total and readily
available N content of biosolids
(fresh weight basis)
Biosolids
type
Dry matter
(%)
Total nitrogen
(kg/ t or m3)
Readily available
nitrogen
(kg/t or m3)
Digested
liquid 4 2.0 0.8
Digested
cake25 11 1.6
Thermally
dried95 40 2.0
Lime
stabilised40 8.5 0.9
Composted 60 11 0.6
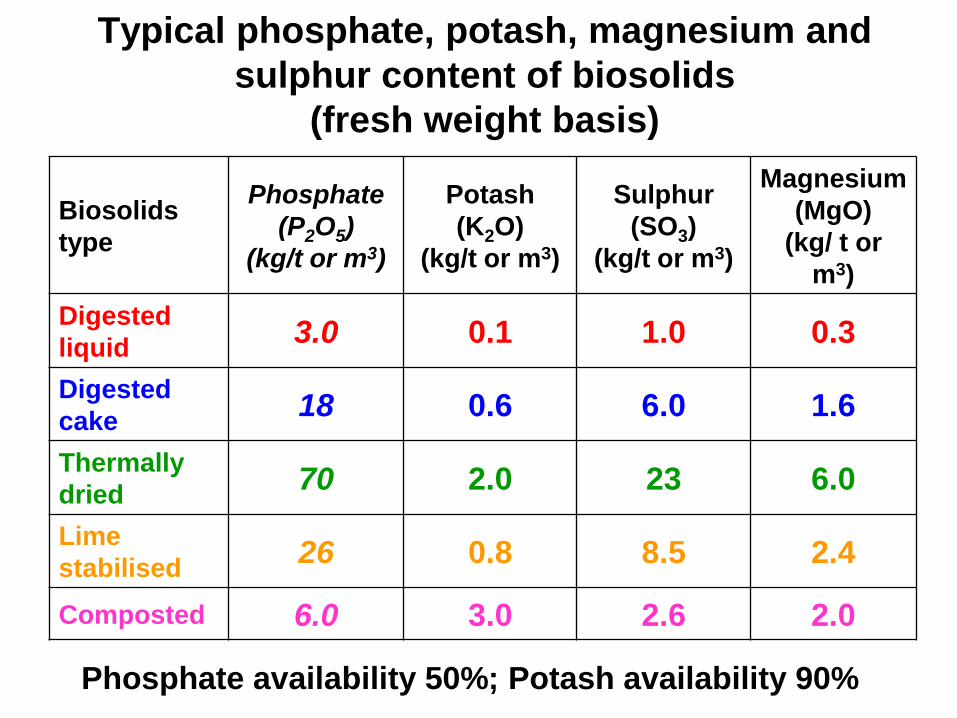
Typical phosphate, potash, magnesium and
sulphur content of biosolids
(fresh weight basis)
Biosolids
type
Phosphate
(P2O5)
(kg/t or m3)
Potash
(K2O)
(kg/t or m3)
Sulphur
(SO3)
(kg/t or m3)
Magnesium
(MgO)
(kg/ t or
m3)
Digested
liquid 3.0 0.1 1.0 0.3
Digested
cake18 0.6 6.0 1.6
Thermally
dried70 2.0 23 6.0
Lime
stabilised26 0.8 8.5 2.4
Composted 6.0 3.0 2.6 2.0
Phosphate availability 50%; Potash availability 90%
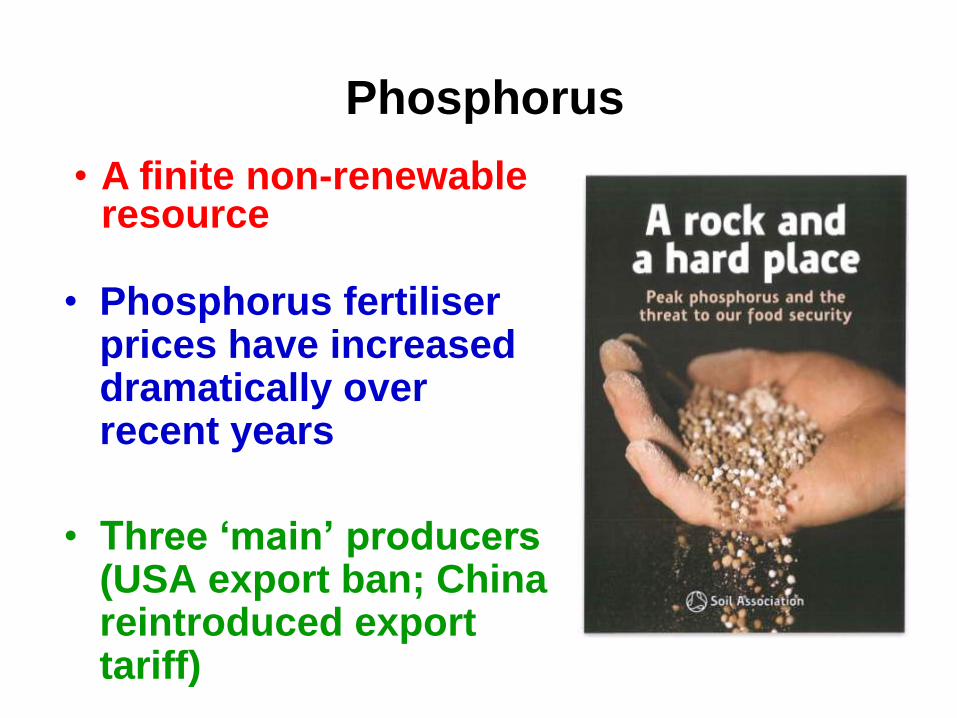
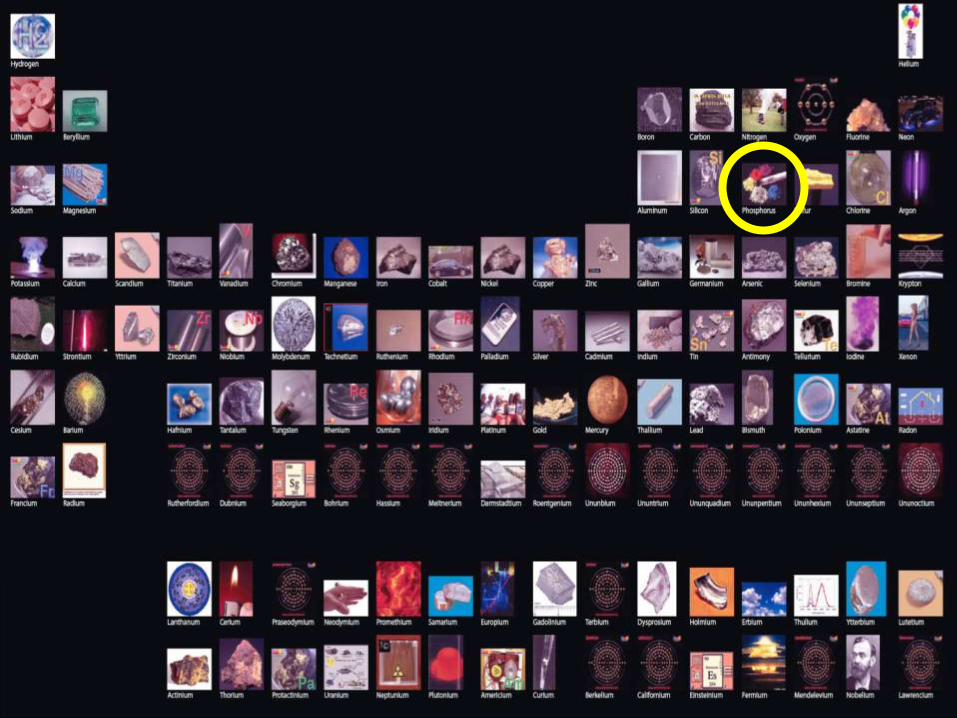
Phosphorus
• Phosphorus fertiliser prices have increased dramatically over recent years
• Three „main‟ producers (USA export ban; China reintroduced export tariff)
• A finite non-renewable resource
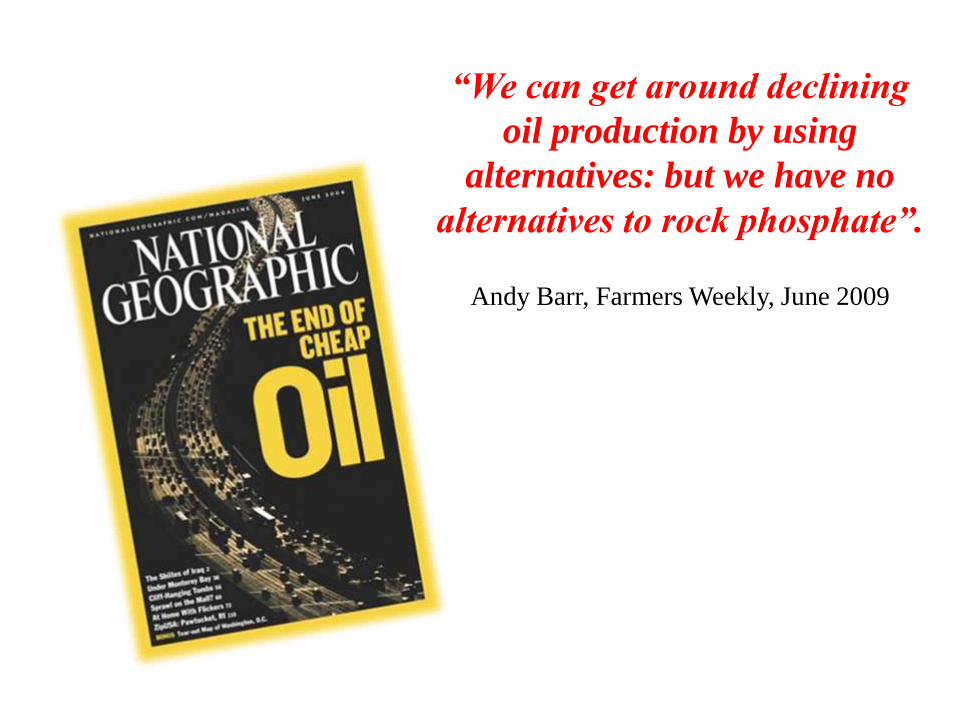
“We can get around declining
oil production by using
alternatives: but we have no
alternatives to rock phosphate”.
Andy Barr, Farmers Weekly, June 2009
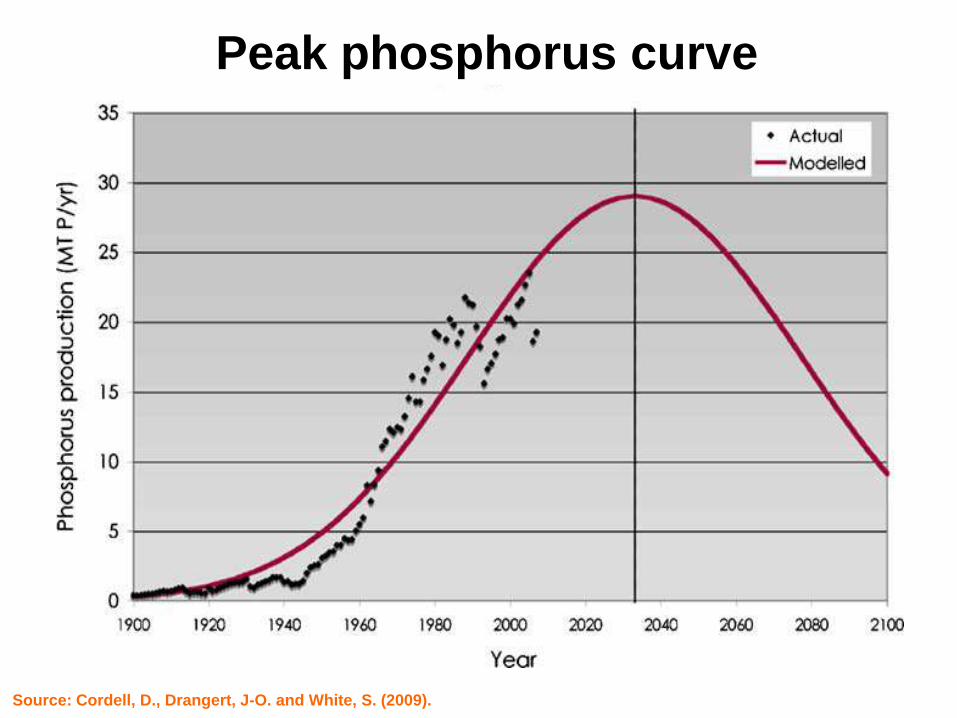
Source: Cordell, D., Drangert, J-O. and White, S. (2009).
Peak phosphorus curve
Biosolids - Phosphorus supply
• A „rich‟ source of phosphate:
- 74 kg phosphate-P2O5/tonne dry solids
- Based on an application rate of 7 tonnes dry
solids/hectare, enough phosphate to supply a
number of years of crops (rotational
management)
• Value >£250/ha (typical field application
rates)
BLACK GOLD……
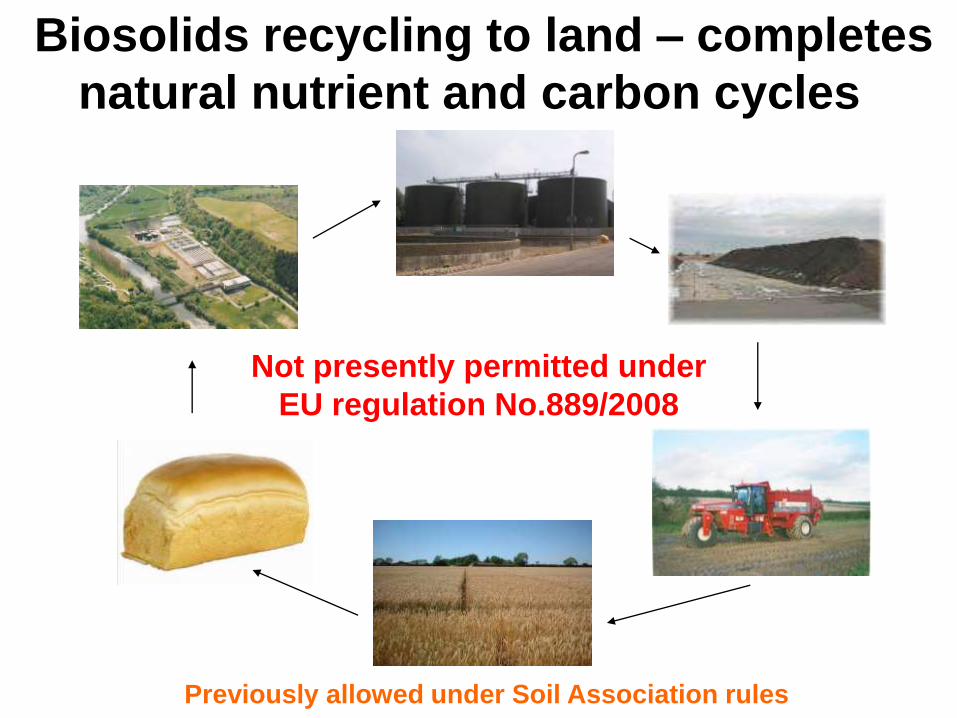
Biosolids recycling to land – completes
natural nutrient and carbon cycles
Not presently permitted under
EU regulation No.889/2008
Previously allowed under Soil Association rules
Thank you
- Questions?