biosolids in conservation tillage: trials for washington… · biosolids in conservation tillage:...
TRANSCRIPT
BIOSOLIDS IN CONSERVATION
TILLAGE: TRIALS FOR
WASHINGTON'S WINTER WHEAT-
SUMMER FALLOW REGION
William Schillinger1, Craig Cogger1, Andy
Bary1, and Brenton Sharratt2 1Department of Crop and Soil Sciences, Washington
State University and 2USDA-ARS

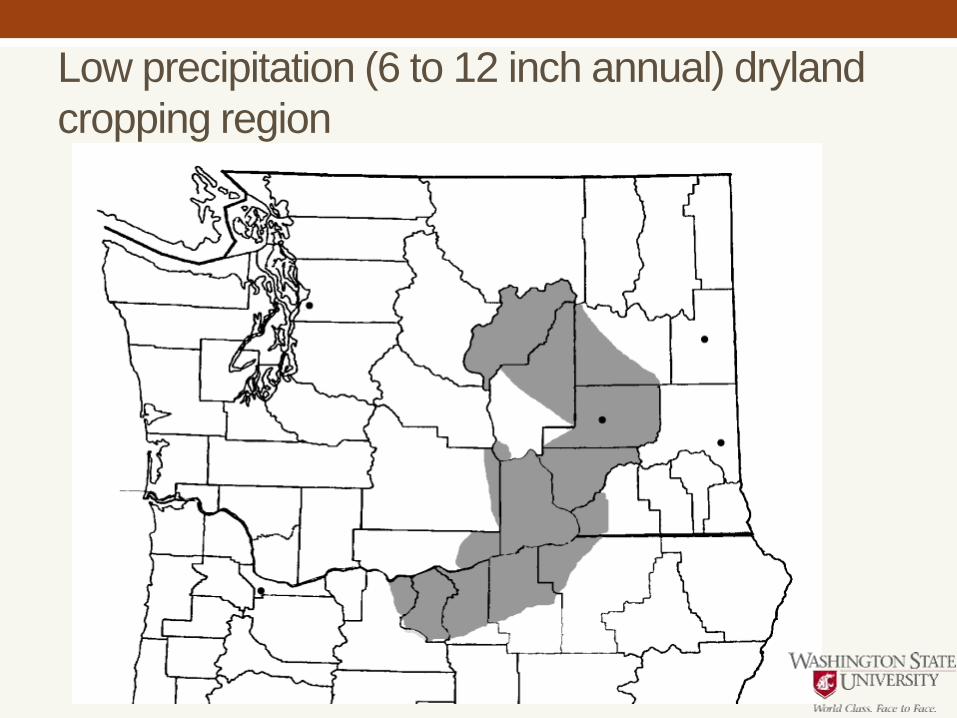
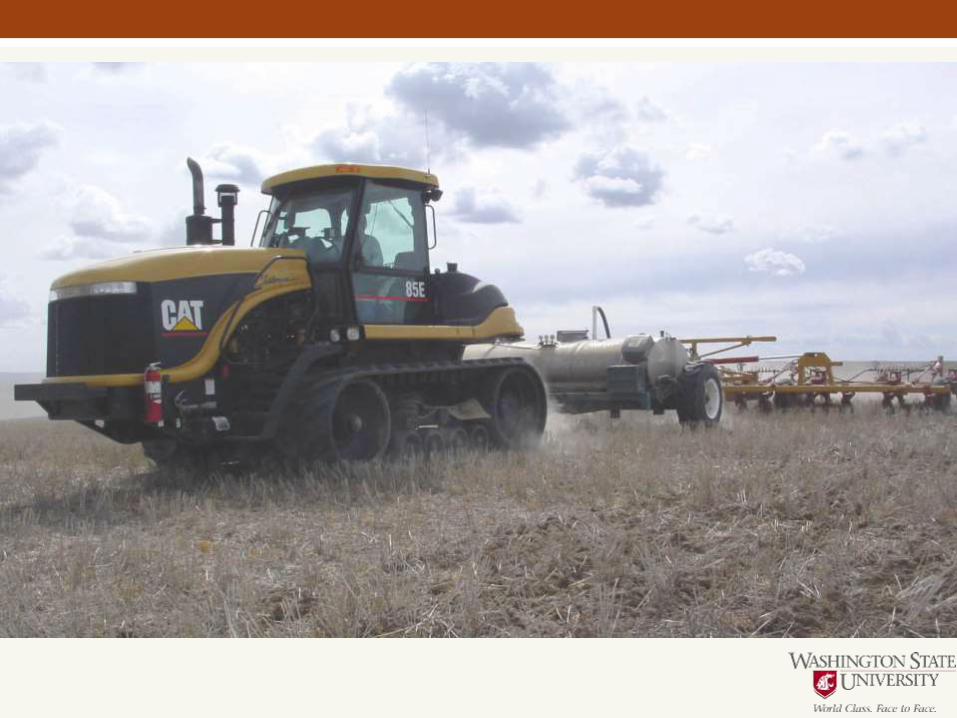
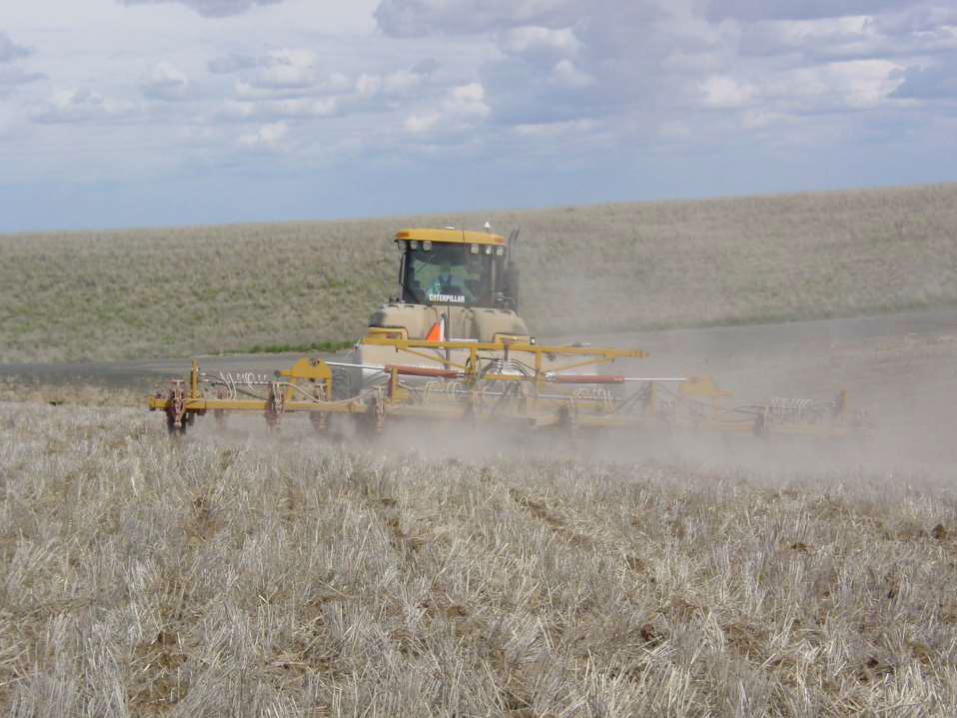
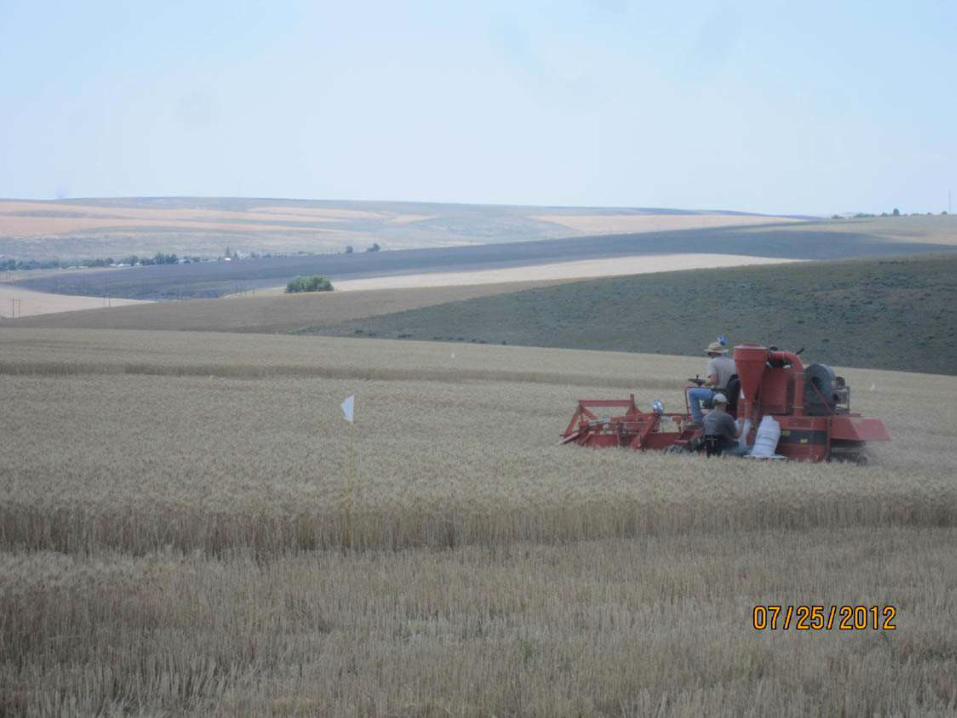
Low precipitation (6 to 12 inch annual) dryland
cropping region

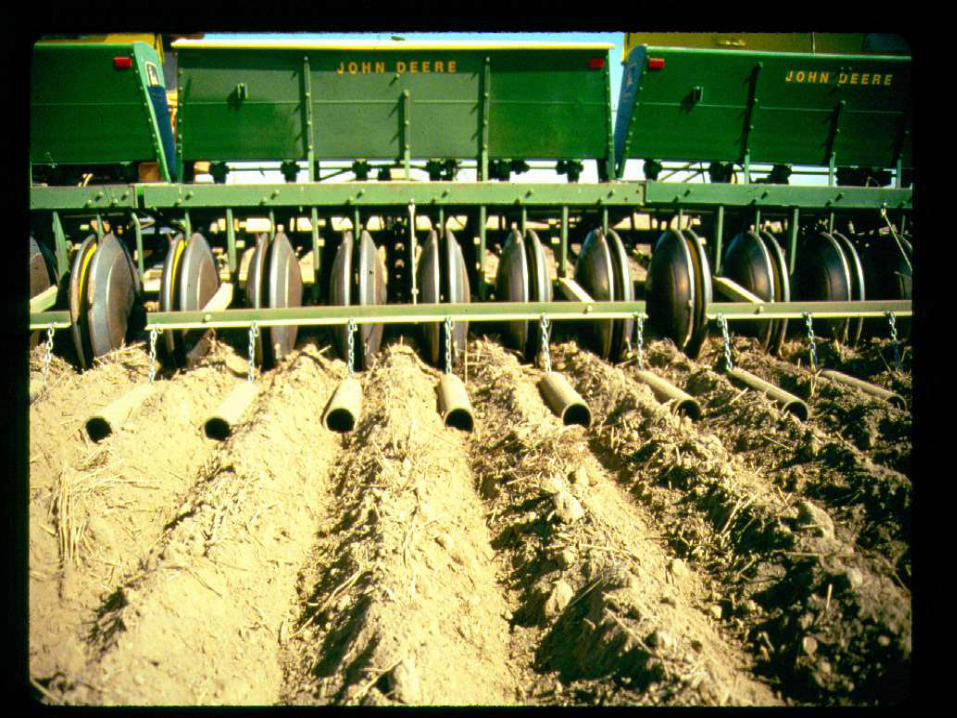
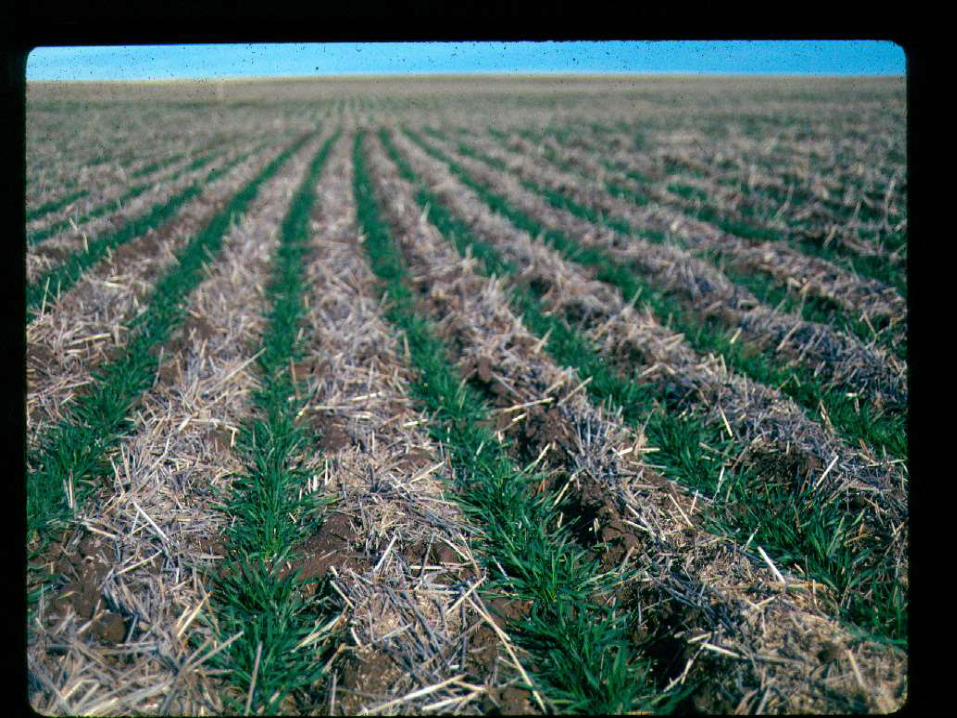
No-till summer fallow
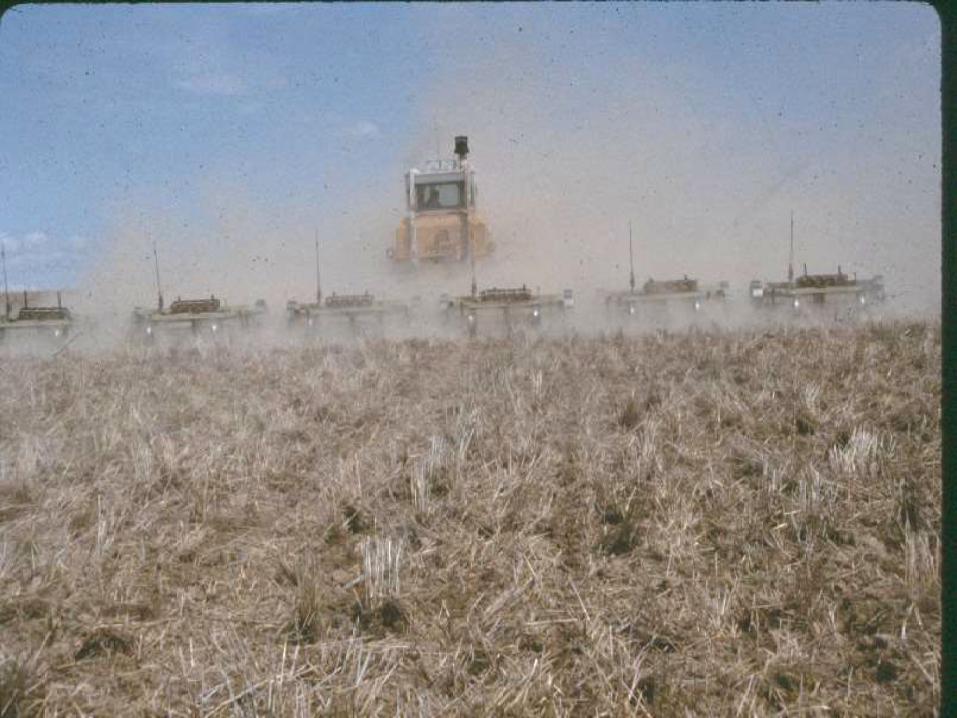
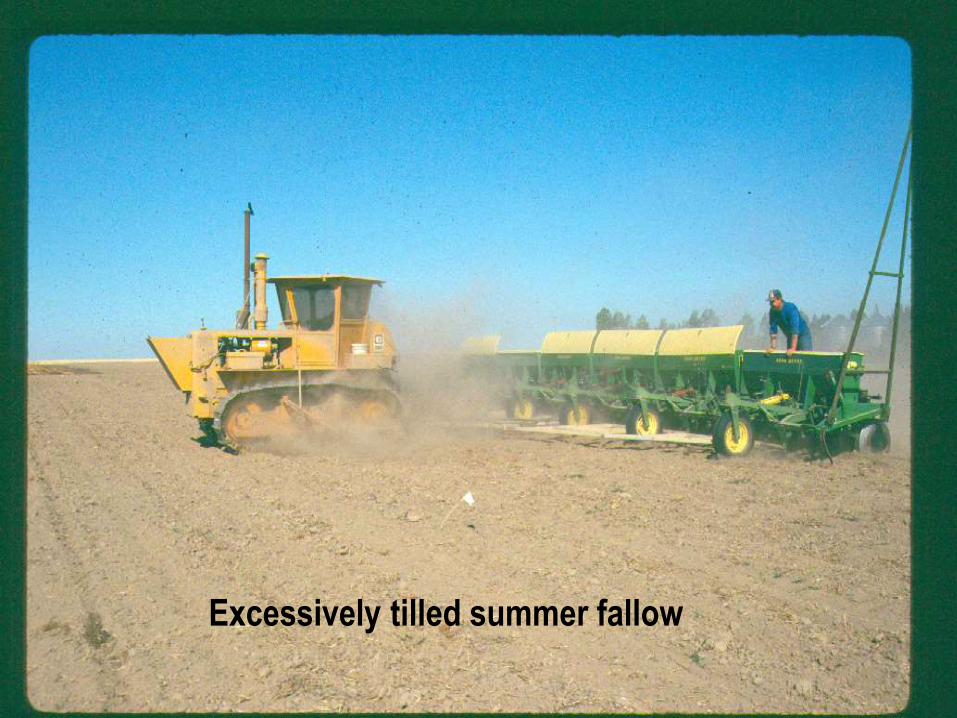
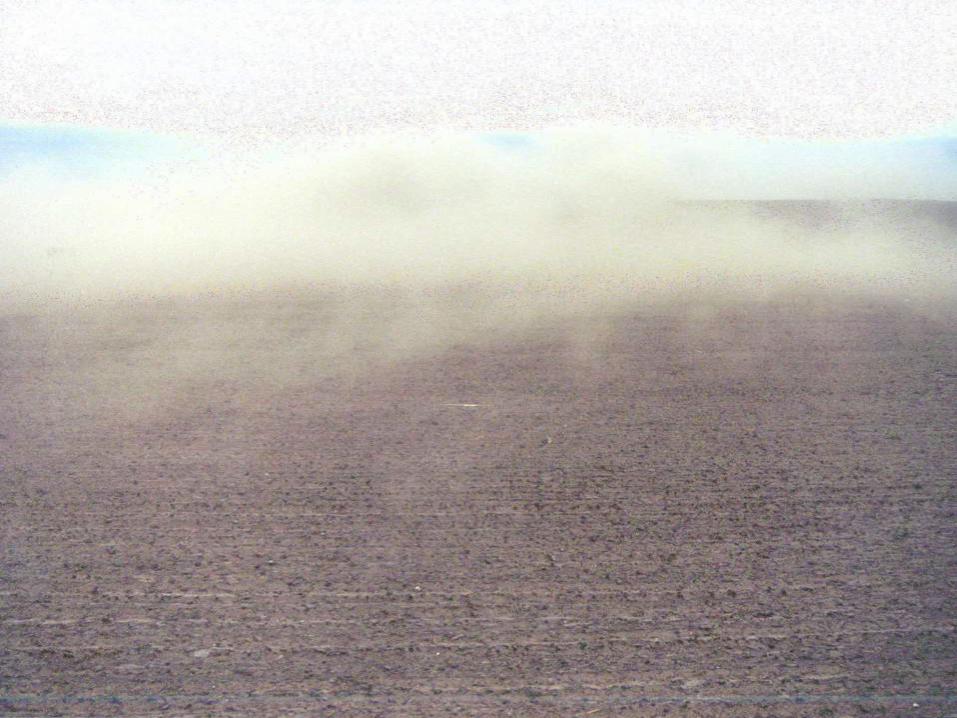
Excessively tilled summer fallow
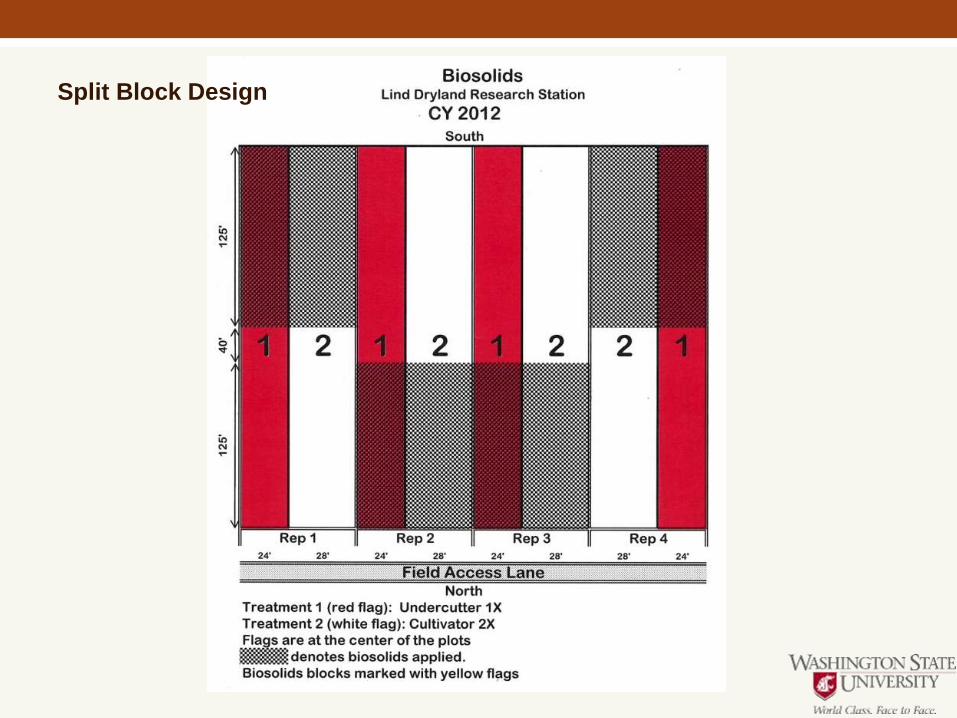
Split Block Design

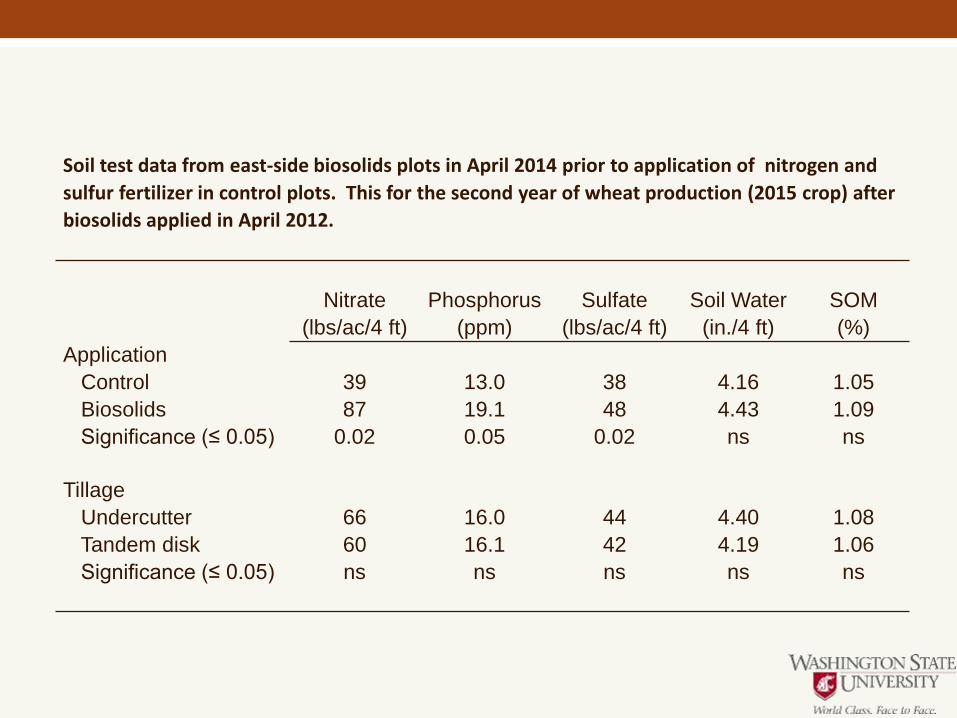
Soil test data from east-side biosolids plots in April 2014 prior to application of nitrogen and
sulfur fertilizer in control plots. This for the second year of wheat production (2015 crop) after
biosolids applied in April 2012.
Nitrate Phosphorus Sulfate Soil Water SOM
(lbs/ac/4 ft) (ppm) (lbs/ac/4 ft) (in./4 ft) (%)
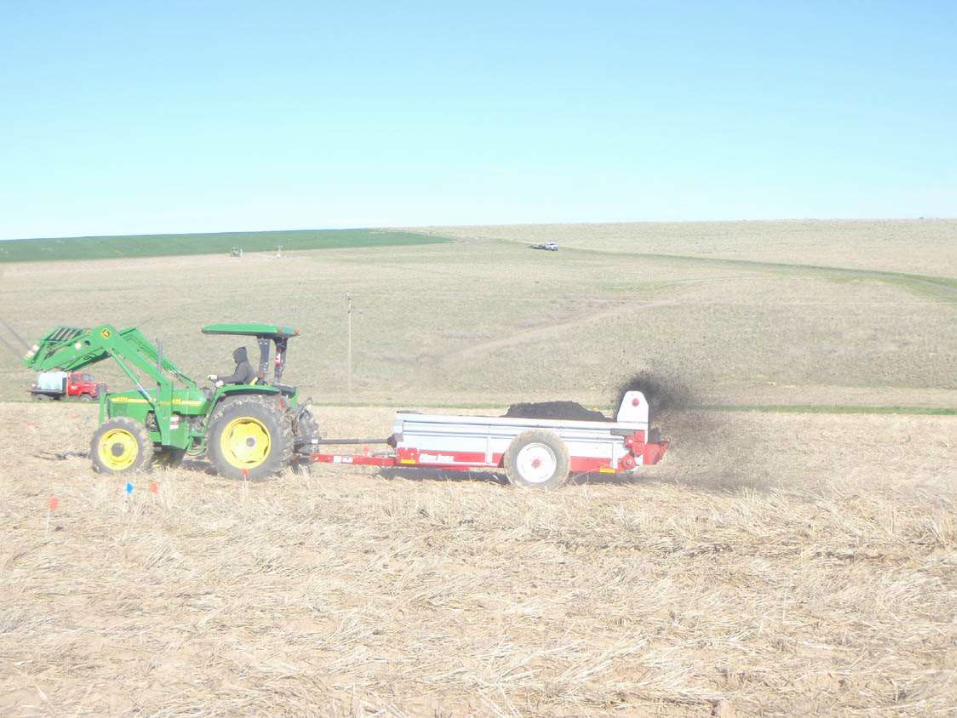
Application
Control 39 13.0 38 4.16 1.05
Biosolids 87 19.1 48 4.43 1.09
Significance (≤ 0.05) 0.02 0.05 0.02 ns ns
Tillage
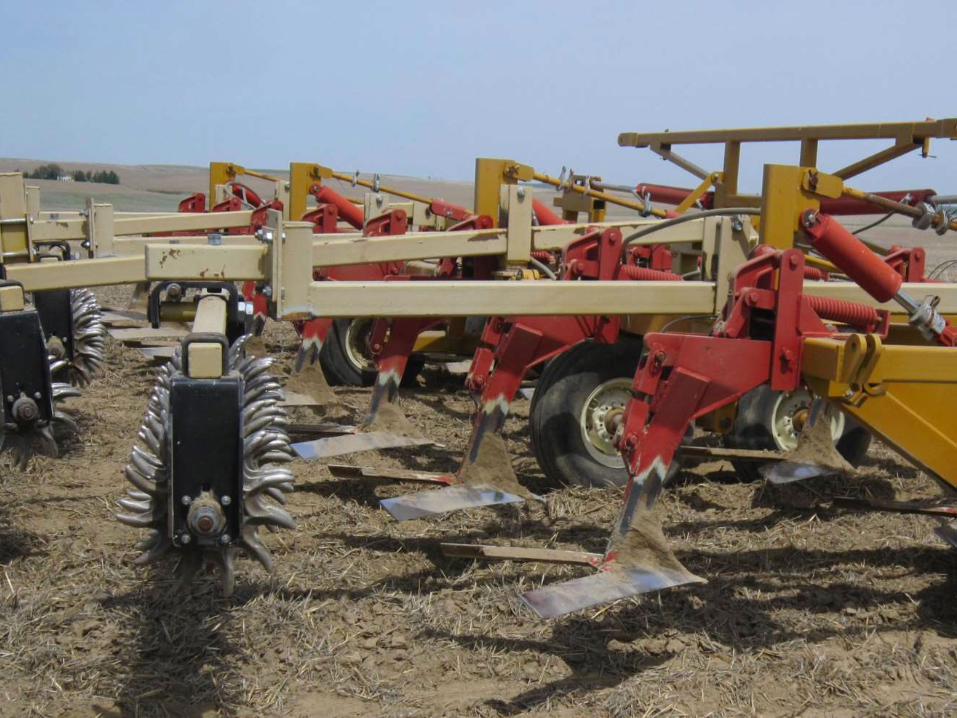
Undercutter 66 16.0 44 4.40 1.08
Tandem disk 60 16.1 42 4.19 1.06
Significance (≤ 0.05) ns ns ns ns ns
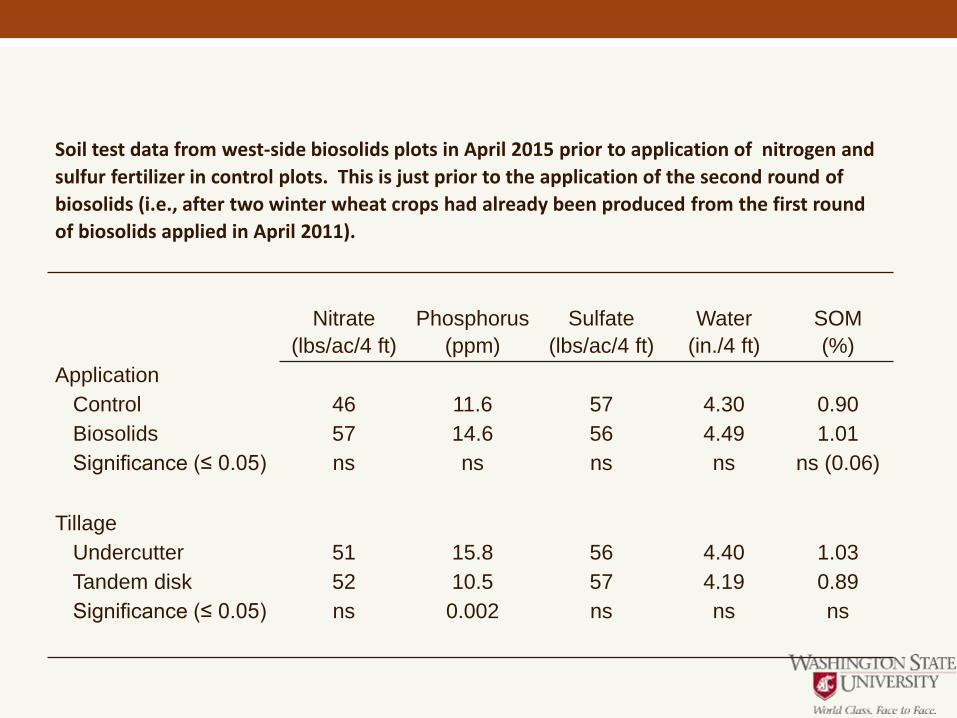
Soil test data from west-side biosolids plots in April 2015 prior to application of nitrogen and
sulfur fertilizer in control plots. This is just prior to the application of the second round of
biosolids (i.e., after two winter wheat crops had already been produced from the first round
of biosolids applied in April 2011).
Nitrate Phosphorus Sulfate Water SOM
(lbs/ac/4 ft) (ppm) (lbs/ac/4 ft) (in./4 ft) (%)
Application
Control 46 11.6 57 4.30 0.90
Biosolids 57 14.6 56 4.49 1.01
Significance (≤ 0.05) ns ns ns ns ns (0.06)
Tillage
Undercutter 51 15.8 56 4.40 1.03
Tandem disk 52 10.5 57 4.19 0.89
Significance (≤ 0.05) ns 0.002 ns ns ns
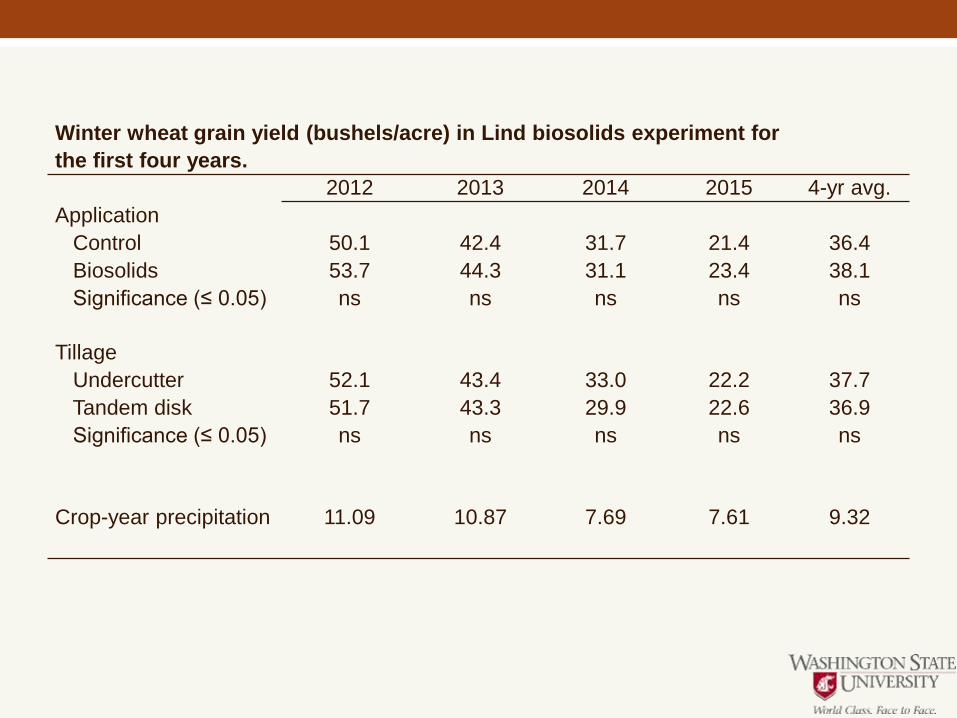
Winter wheat grain yield (bushels/acre) in Lind biosolids experiment for
the first four years.
2012 2013 2014 2015 4-yr avg.
Application
Control 50.1 42.4 31.7 21.4 36.4
Biosolids 53.7 44.3 31.1 23.4 38.1
Significance (≤ 0.05) ns ns ns ns ns
Tillage
Undercutter 52.1 43.4 33.0 22.2 37.7
Tandem disk 51.7 43.3 29.9 22.6 36.9
Significance (≤ 0.05) ns ns ns ns ns
Crop-year precipitation 11.09 10.87 7.69 7.61 9.32
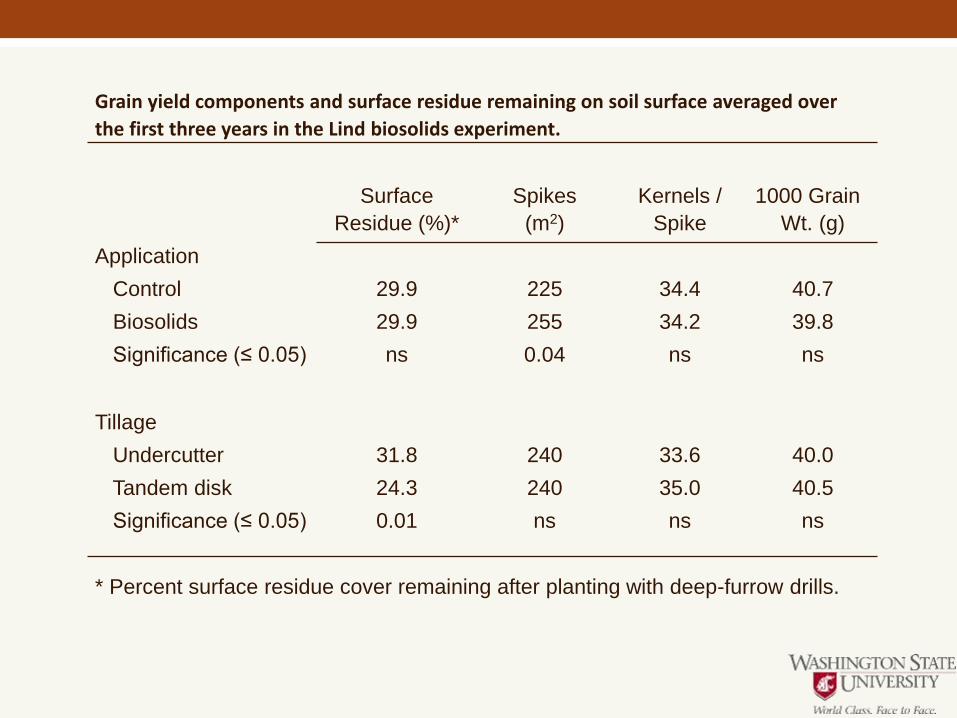
Grain yield components and surface residue remaining on soil surface averaged over
the first three years in the Lind biosolids experiment.
Surface Spikes Kernels / 1000 Grain
Residue (%)* (m2) Spike Wt. (g)
Application
Control 29.9 225 34.4 40.7
Biosolids 29.9 255 34.2 39.8
Significance (≤ 0.05) ns 0.04 ns ns
Tillage
Undercutter 31.8 240 33.6 40.0
Tandem disk 24.3 240 35.0 40.5
Significance (≤ 0.05) 0.01 ns ns ns
* Percent surface residue cover remaining after planting with deep-furrow drills.
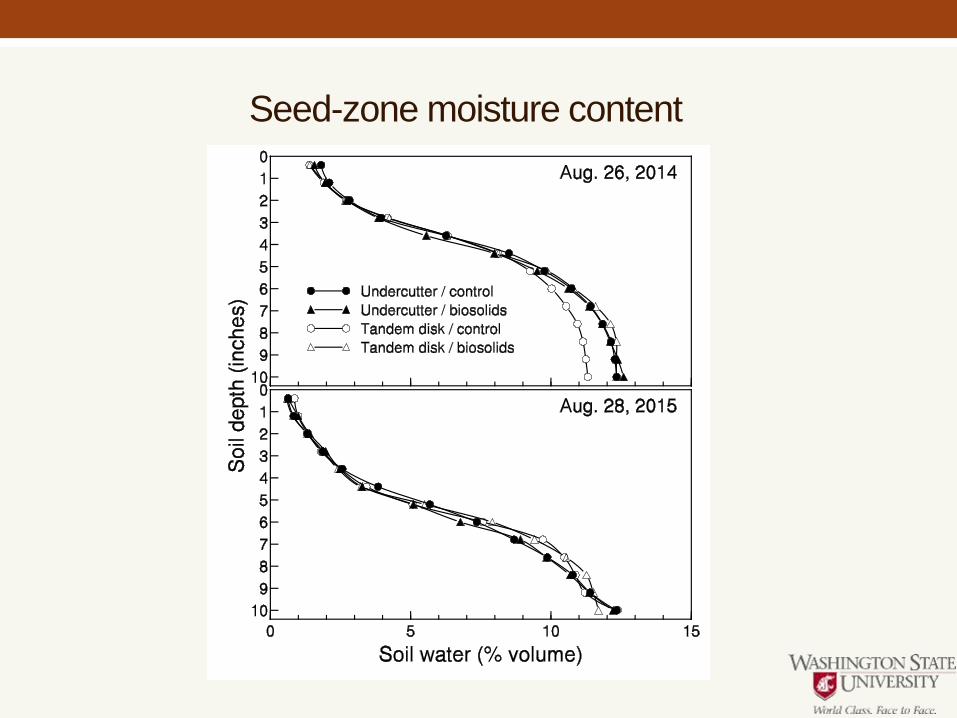
Seed-zone moisture content
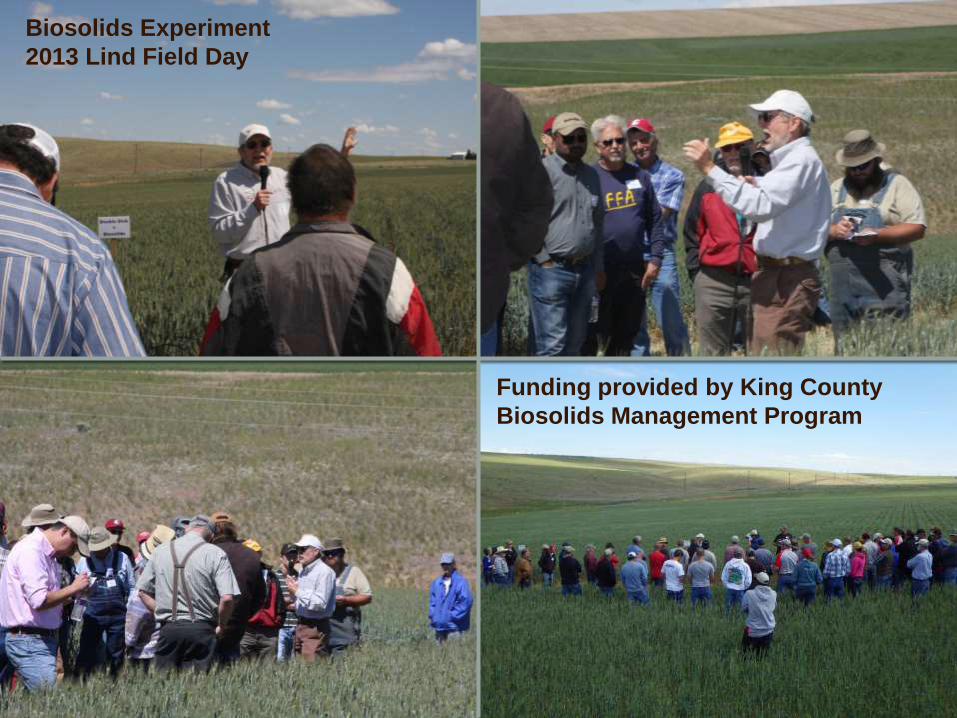
Biosolids Experiment
2013 Lind Field Day
Funding provided by King County
Biosolids Management Program