biostatistics (basic definitions & concepts) | surgicomed.com
TRANSCRIPT

An Introduction To Biostatistics (Basic Definitions & Concepts)
Statistics “Statistics is a science of systemic collection, classification, tabulation, presentation, analysis
and interpretation of data.”
It is the science of facts and figures.
Biostatistics “Biostatistics is the basic science of collection, classification, analysis, quantification and
interpretation of data in relation to vital events.”
Or
“Biostatistics is the branch of statistics that deals with vital events in a human population.”
These vital events are births, deaths, sickness, marriage, divorce etc.
Bio-Statistics is related to health and disease related states and events.
Uses Of Biostatistics To define and quantify the nature and extent of illness and death in the community
To establish causation for existence of health problems
To plan health measures
To evaluate outcome of health measures
For comparison
For research
Vital Statistics “Ongoing collection of data by government agencies relating to events such as births, deaths,
marriages, divorces and adoptions etc. is called Vital Statistics.”
Mathematical Statistics
Statistics Applied Statistics
Socioeconomic Statistics
Demography
Agricultural Statistics
Biostatistics
Population “Population is the number of people living in a specific area.”
In statistics, population means the number of group, number of things etc.
Sample “The part of a population is called Sample.”
“The process of taking sample is called Sampling.”
Statistics “Any numerical value computed from a sample is known as Statistics.”
Parameters “Any numerical value computed from the population is known as Parameters.”
Data “Facts and figures you collect are called Data.”
Data is/are the basic building blocks of statistics and refers to the individual values presented,
measured or observed.
Types Of Data Data can be classified as follow;
A. Quantifiable data
a) Qualitative data
b) Quantitative data
B. Non-quantifiable data
a) Policies
b) Laws
a) Qualitative Or Categorical Data Qualitative data is further divided as;
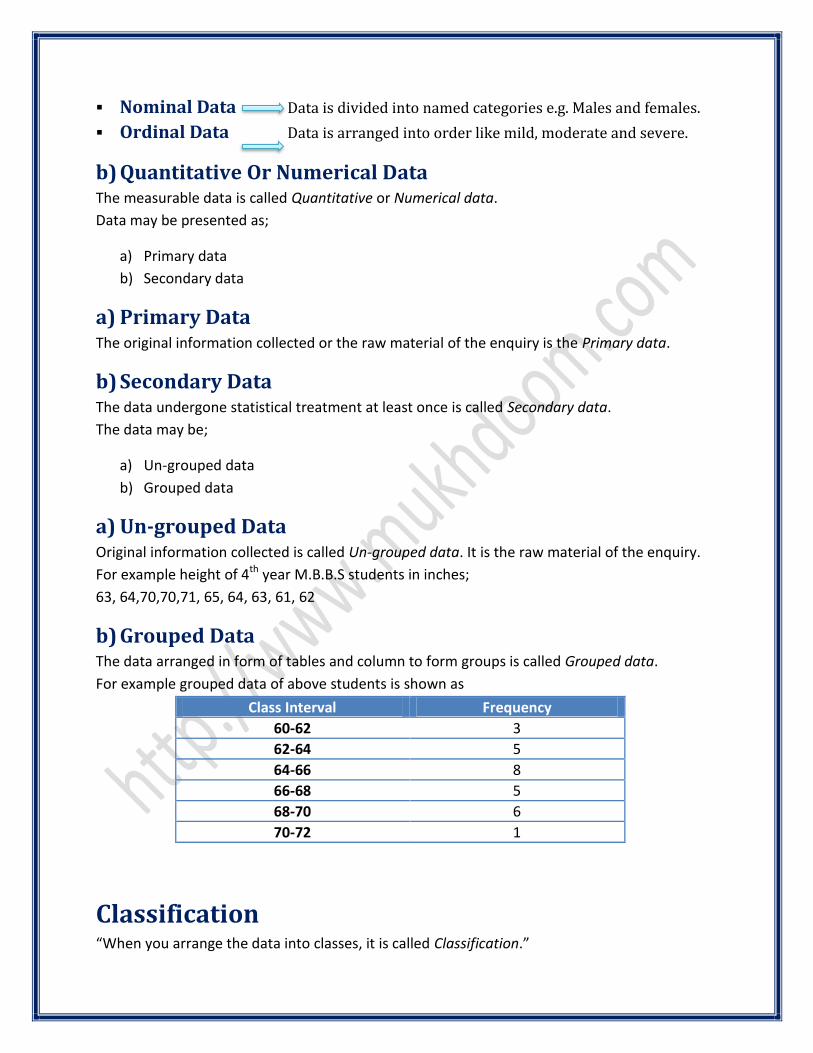
Nominal Data Data is divided into named categories e.g. Males and females.
Ordinal Data Data is arranged into order like mild, moderate and severe.
b) Quantitative Or Numerical Data The measurable data is called Quantitative or Numerical data.
Data may be presented as;
a) Primary data
b) Secondary data
a) Primary Data The original information collected or the raw material of the enquiry is the Primary data.
b) Secondary Data The data undergone statistical treatment at least once is called Secondary data.
The data may be;
a) Un-grouped data
b) Grouped data
a) Un-grouped Data Original information collected is called Un-grouped data. It is the raw material of the enquiry.
For example height of 4th year M.B.B.S students in inches;
63, 64,70,70,71, 65, 64, 63, 61, 62
b) Grouped Data The data arranged in form of tables and column to form groups is called Grouped data.
For example grouped data of above students is shown as
Class Interval Frequency
60-62 3
62-64 5
64-66 8
66-68 5
68-70 6
70-72 1
Classification “When you arrange the data into classes, it is called Classification.”
Table “The systematic arrangement of data in form of columns and rows is called Table.”
Tabulation “The presentation of data in the form of table is called Tabulation.”
Variable “Any numerical value which varies from one individual to other is called Variable.” For example
height and weight of the individuals are variables.
The characteristics of the person, object or phenomenon that can take on different values are
variables.
Variables are represented by letters X, Y, Z.
Types Of Variables The variables may be;
a. Independent variables
b. Dependent variables
a. Independent Variables (Input Variables) The variables that are used to describe the factors that are assumed to cause or influence the
problems are called Independent Variables.
For example smoking causes lung cancer. In which smoking is the independent variable while
lung cancer is dependent variable.
b. Dependent Variable (Outcome Variables) The variables that get modified under the influence of independent variables are called
Dependent Variables.
The variables may be classified as;
a. Continuous variables
b. Discontinuous variables
a. Continuous Variables “Any variable which can assume any value in a given range is called Continuous Variable.” For
example weight (recommended range), height (4 – 6.2 Ft. for humans), speed of car (0 – 150
km/hr.) etc. are continuous variables.
b. Discontinuous Variables “Any variable which can assume a specific value is called Discontinuous Variable.” For example
number of rooms in a house or no of family members in certain family. These can’t be in
fraction.
Constant “Any value which is fixed is called Constant.” For example pi is constant value represent as;
Constants are represented by letters a, b, c.
Health Information System (HIS / HMIS) “Health Information System is a mechanism for the collection, processing, analyzing and
transmission of information required for organizing and operating services and research.”
Information Is Needed About: Demography and vital statistics (Science of population)
Environmental health
Health status indicators
Health resources
Health services utilization
Outcome of a service
Financial reports
Uses Of Health Information To measure the health status of a community
For comparison and conclusion
For planning and management
To see performance of a health care programme
To assess satisfaction of consumer
For research

Sources Of Health Data
1. Census “Census is a periodic count of the population held after specific period of time e.g census are
held after every 10 years in Pakistan.”
Census is held every 10th year and information is collected about demographic and socio-
economic characteristics of population.
Method Of Census o Enumerative Pakistan / USA
o Questionnaire England
o Combination ---------
Types Of Census Two types are there;
a) de facto
b) de jure
a) de facto The person is counted at the place he/she is found at the time of counting.
b) de jure The person is counted at the place of his/her usual/routine residence.
Intercensal Population Estimation Some methods are formulated to estimate Intercensal population i-e to calculate the
population in the years after and before censes.
1) Natural increase method
2) Arithmetic progression method
3) Geometric progression method
1) Natural Increase Method We calculate the population while estimating the natural course.
(Previous census + Births + Immigrants) – (Death + Emigrants) = Total population
2) Arithmetic Progression Method Base population * [1 + growth rate/100 * no of years]
Example
The population on 1-7-1998 = 130.6 million and growth rate = 2.2 %
Estimated population on 1-7-2004 would be;
Population on 1-7-2004 = 130.6 million * [1 + 2.2/100 * 6]
Population on 1-7-2004 = 147.8 million
3) Geometric Progression Method Base population * [1 + growth/100] no of years
Example
The population on 1-7-1998 = 130.6 million and growth rate = 2.2 %
Estimated population on 1-7-2004 would be;
Population on 1-7-2004 = 130.6 million * [1 + 2.2/100]6
Population on 1-7-2004 = 148 million
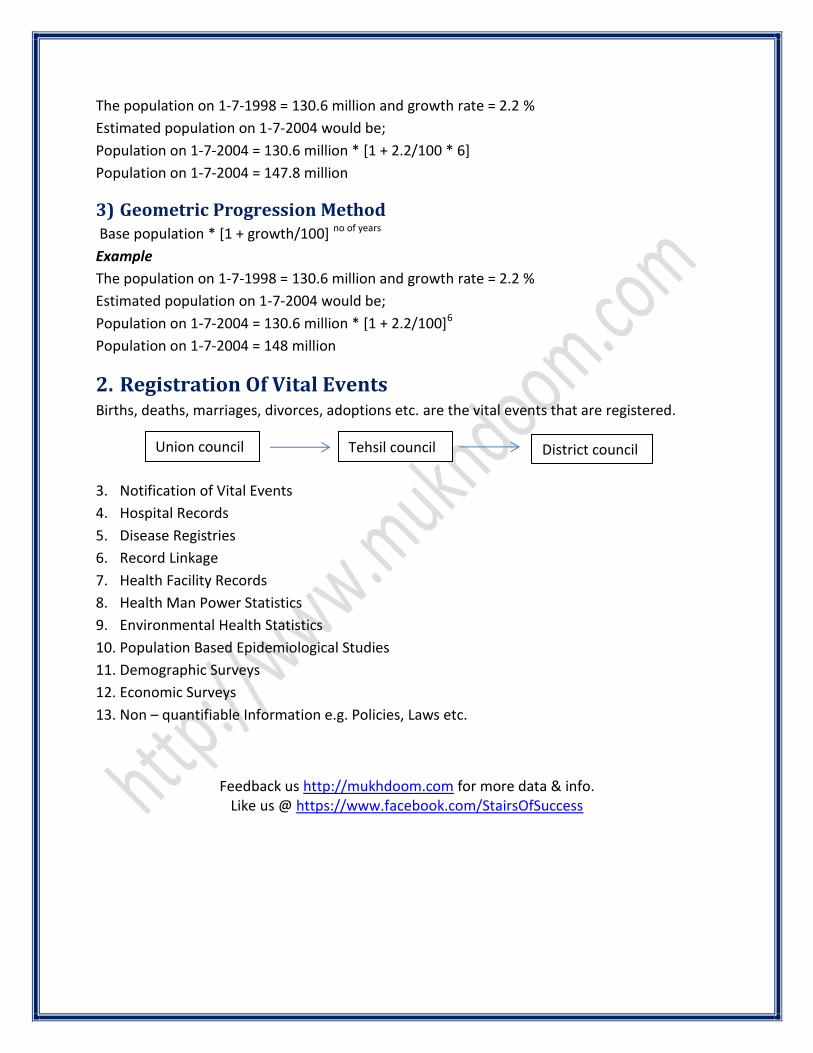
2. Registration Of Vital Events Births, deaths, marriages, divorces, adoptions etc. are the vital events that are registered.
3. Notification of Vital Events
4. Hospital Records
5. Disease Registries
6. Record Linkage
7. Health Facility Records
8. Health Man Power Statistics
9. Environmental Health Statistics
10. Population Based Epidemiological Studies
11. Demographic Surveys
12. Economic Surveys
13. Non – quantifiable Information e.g. Policies, Laws etc.
Feedback us http://mukhdoom.com for more data & info. Like us @ https://www.facebook.com/StairsOfSuccess
Union council Tehsil council District council