bioversity international market surveys including; kabula, kapanda lealui, mapungu, mwandi,...
TRANSCRIPT

MARKET SURVEYS Barotse Floodplain System
Pasqualino, M., Kennedy, G. and Nowak, V. Bioversity International
2015

Table of Contents Introduction ............................................................................................................................................ 2
Methodology ........................................................................................................................................... 2
Discussion ................................................................................................................................................ 3
Market characteristics ......................................................................................................................... 3
Trends in prices and availability .......................................................................................................... 6
Energy ............................................................................................................................................. 6
Protective ........................................................................................................................................ 7
Body-building .................................................................................................................................. 8
Other ............................................................................................................................................... 9
Conclusion ............................................................................................................................................... 9
References ............................................................................................................................................. 10
Annex 1. Seasonal trends in market prices and food availability ........................................................... 11
List of Figures
Figure 1. Number of food items surveyed by market .............................................................................. 3
Figure 2. Food items with seasonal price changes .................................................................................. 5
Figure 3. Food items with constant prices over the seasons ................................................................... 5

Page 2 of 16
Introduction The aim of the CGIAR Research Program on Aquatic Agricultural Systems (AAS) is to improve
livelihoods and food security by enhancing the productivity and diversity of aquatic and agricultural
systems.1 The AAS program in the Barotse floodplain of Zambia, which is being implemented in ten
communities including; Kabula, Kapanda Lealui, Mapungu, Mwandi, Nalitoya, Nembwele, Senanga,
Sifuna and Situlu in December 2014, in Nanikelako in April 2015 and in Mwandi, evaluates changes in
seasonal flooding patterns and the availability of natural resources to strengthen the productivity of
aquatic agricultural management practices and improve the livelihoods of the poor and vulnerable.2
It is essential to understand the current food and nutrition security situation in the Barotse floodplain
in order to support the AAS program objective. Food availability in the Barotse is highly seasonal; it
becomes limited from August or September to January, during which time food and nutrition
insecurity worsens.3 It is therefore necessary to identify opportunities to promote sustainable and
diverse dietary options. This narrative provides an explanation of how the market research was
conducted and some preliminary results. Overall, our research indicates that poor market access is a
significant constraint in the Barotse floodplain, inhibiting AAS community members from securing
proper nutrition and food.
Methodology Market sampling was conducted in 2014 to assess AAS community members’ access to food items in
markets as well as record seasonal price trends. In total, ten markets frequented by community
members in AAS research sites were surveyed. Markets sampled in the city of Mongu, located in
Mongu District in Western Province, included the Black and Green Markets, Main Market, Harbor
Market, Mandanga Market, Kapulanga Market and Mbuywana Market. Additional market sampling in
Mongu District was conducted in the community of Lealui, located 20 to 30 minutes from the city of
Mongu by vehicle, at the Lealui Market. The remaining markets sampled in Western Province included
the Senanga Main Market, Mapungu Shops and Old Lukulu Market. Coordinates for each market were
recorded using a GPS device.
Vendors were interviewed on the food items sold, daily profit, and prices and availability of food items.
They were encouraged to share information on changes in prices and availability, as well as on the
origin of the food items. High and low seasons of availability were identified as well as fluctuations in
prices based on seasonal changes. Approximately 20-30 food items were surveyed in each market. A
nutritionist, nutrition officer or extension officer from the Ministry of Agriculture and Livestock
participated in the sampling of markets.
The ten completed market surveys were then organized into one comprehensive document in order
to observe trends and differences in food prices and availability across markets. Food items were
organized into the categories of “energy,” “protective” and “body-building.” Annex 1 illustrates
seasonal trends in food prices and availability across all markets.
1 CGIAR Research Program on Aquatic Agricultural Systems, 2014 2 Longley & Thilsted, 2012 3 Baidu-Forson, Phiri, Ngu’ni, Mulele, Simainga, Situmo, Ndiyoi, Wahl, Gambone, Mulanda, & Syatwinda, 2014

Page 3 of 16
Discussion
Market characteristics A total of 89 food items were surveyed across 10 markets. The greatest number of food items were
surveyed in Old Lukulu Market (39), followed by the Black and Green Markets in Mongu (31), Mongu
Main Market (30), Kapulanga Market (27), Mandanga Market (25), Lealui Market (24), Mbuywana
Market and Senanga Main Market (23), Harbor Market (19) and Mapungu Shops (11). Figure 1
indicates the number of food items surveyed in each market, organized into five categories.
MONGU MARKETS
FOOD CATEGORY
Bla
ck &
Gre
en
Mar
kets
Mai
n M
arke
t
Har
bo
r M
arke
t
Man
dan
ga
Mar
ket
Kap
ula
ng
a
Mar
ket
Mb
uyw
ana
Mar
ket
Lea
lui M
arke
t
Map
un
gu
Sh
op
s
Sen
ang
a M
ain
Mar
ket
Old
Lu
kulu
Mar
ket
ENERGY
CEREALS AND OTHER STARCHY
STAPLES 5 5 4 7 4 7 9 2 0 9
PROTECTIVE
FRUITS AND VEGETABLES 18 15 11 14 17 13 11 5 13 19
BODY-BUILDING
Animal-source: Types of fish 10 8 4 6 1 3 2 1 7 11
BODY-BUILDING Animal-source: Other 1 1 1 3 2 2 3 1 0 3
BODY-BUILDING Legumes, seeds, beans & nuts 2 2 3 1 6 3 3 1 2 3
OTHER 1 4 1 1 1 2 6 3 1 3
TOTAL 31 30 19 25 27 23 24 11 23 39
Figure 1. Number of food items surveyed by market
As the figure indicates, the greatest number of items per category were often surveyed in Old Lukulu
Market while the least number of food items were surveyed in Mapungu shops. Variations in the
number of food items observed may be attributed to differences in the research methods undertaken
in each market. However, in Mapungu the lowest number of food items was found although all open
shops had been surveyed. It was also observed that the majority of vendors in Mapungu sold the same
items. There is therefore a clear lack of diversity in terms of food items that provide energy, protection
and protein in the Mapungu shops, also compared to other markets. Community members in
Mapungu stated that other products, like vegetables and fish, are cultivated by community members
and households and then traded within the community without a formal market. The shops therefore
do not appear to be a diverse source of food for community members. Community members in
LEGEND Greatest number of items surveyed per food category
Least number of items surveyed per food category

Page 4 of 16
Mapungu, as well as those living in Mwandi, also frequent the market in Kalabo. There is no market in
Mwandi.
The AAS communities located in Mongu district frequent the markets of the provincial capital, Mongu.
Crops are often sold within the communities or taken to the markets in Mongu.4 There is no market
in Situlu or Nanikelako. However, households in Lealui have access to a market located in their
community. The Lealui market includes a number of vendors who display their products outdoors in
stalls or on mats on the ground. There are also a number of stores that sell processed food like maheu
(a processed drink made from maize mealie meal, milk, and sugar), soft drinks and biscuits, as well as
other food products like eggs and groundnuts. Due to recent road construction and the presence of
construction workers in the area, the demand for food items in the Lealui market has increased.
Community members explained that this has led vendors to increase their prices, which has caused
concerns among local people since not all are able to afford the new prices. Vendors also explained
that sales grow annually in July. Since water levels decrease during the dry season, there is an increase
in travel between Mongu and Kalabo by road and therefore an increase in consumers that pass by the
Lealui market.
Community members in Lealui also explained that Mongu is the main market for selling and buying
fish.5 Markets in Mongu include the Black and Green markets, Main market, Harbor market, Kapulanga
market, Mandanga market and Mbuywana market. While the AAS team was conducting the market
survey in the Kapulanga market, they found that some vendors were not willing to give information
because previous surveys on food safety had already been undertaken in the area and vendors did not
find it necessary to answer additional questions. In contrast, vendors in the Mandanga market were
willing to give information. However, it was difficult for some to calculate their daily profits for each
food item since they combine the money earned from all food items. Vendors in the Mandanga
market also stated that fish is the most frequently purchased food item that is a rich source of animal-
based protein. Consumers begin purchasing other sources of protein, such as beans, kapenta and eggs,
when fish is less available during the fishing ban that lasts from December to March. As the demand
for these products increases, so do the prices. Since local consumers are easily affected by price
changes, vendors often keep prices constant but reduce the quantity sold at that price. In the
Mbuywana market, which is small with few vendors, vendors stated that they ordered most of the
food items from the Main market in Mongu, which is fairly large and accessible by bus.
Since there are no markets in Kabula or Kapanda, community members frequent the Old and New
Lukulu markets. While many sell vegetables door to door in their communities, the lack of market
access inhibits individuals from selling crops outside of the community.6 Similarly, there are no
markets in Nalitoya, Nembwele or Sifuna. The closest markets are in the town of Senanga. During
focus group discussions, community members stated that the primary market for fish products is in
Senanga, where they can set higher prices.7
Throughout the ten markets surveyed, prices normally increase during the low season or when a food
item is in high demand. Figure 2 illustrates the seasonal changes in price for a variety of food items.
4 Dierksmeier, Cole, & Teoh, 2015 5 Dierksmeier et al., 2015 6 Dierksmeier et al., 2015 7 Dierksmeier et al., 2015

Page 5 of 16
Figure 2. Food items with seasonal price changes
Some items, which do not vary in seasonal availability, maintain constant prices throughout the year,
as illustrated in Figure 3.
Figure 3. Food items with constant prices over the seasons
0 10 20 30 40 50 60 70 80
Maize grain (1 bowl)
Rice (200g)
Cassava flour (250g)
Carrot (1 bag)
Paw Paw (1 medium)
Sweet potato leaves (1 bundle)
Cabbage (1 medium)
Tomato (4 small)
Green pepper (4-5 peppers)
Fresh bream (7 medium)
Fresh red breasted (7 medium)
Dried red breasted (6 medium)
Kapenta (5kg)
Egg (1 tray)
Bean (5kg)
Groundnut (250g)
Price (Kwacha)
Foo
d it
ems
High Season Low Season
0
10
20
30
40
50
60
70
80
Breakfastmealie meal
(25kg)
Roller meal(25kg)
Flour, wheat(10kg)
Cassava,dried (1bucket)
Sugar (500g) Fresh milk(250mL)
Cooking oil(350mL)
Salt (1kg)
Pri
ce (
Kw
ach
a, K
)
Food items

Page 6 of 16
Trends in prices and availability
Energy Maize “mealie meal” is commonly purchased to make nshima, a thick porridge eaten with vegetables,
fish or meat. The price for a 25 kg bag of breakfast mealie meal ranges across markets from K58 in the
Mandanga market to the highest price of K76 in the Lealui market. However, it is more common for
consumers to purchase smaller quantities of breakfast mealie meal than a 25 kg bag. Quantities are
measured in local containers and prices span from K1 to K15, depending on the amount purchased.
Overall, vendors stated that breakfast mealie meal is available year round and that the price remains
constant. However, a vendor in the Old Lukulu market differed from the rest, stating that the price of
breakfast mealie meal increases when maize is low in season.
There is generally a higher demand for breakfast mealie meal than roller meal, which is also produced
from maize but is less processed and less expensive. Roller meal is available year round with prices
that range from K60 to K65 for a 25 kg bag. It is interesting to note that breakfast mealie meal is usually
preferred over roller meal, even though it is more expensive. Grinded maize mealie meal is also
available year round. However, grinded maize mealie meal was only recorded in one market in Mongu
and therefore no comparisons can be made on this food item across markets. The price of maize grain
is fairly similar across the markets in which it was surveyed. Consumers purchase maize grain to take
to a hammer mill and later produce mealie meal, samp, beer or local beverages like maheu. Cassava
mealie meal is generally available year round and prices are fairly constant. According to a vendor in
Mongu, if cassava mealie meal becomes less available, the price will remain constant but the quantity
sold at that price will decrease.
Rice is available year round in markets, with the low season coinciding with the rainy season (from
November to April). During the low season, prices either increase (for larger quantities of 5-10 kg) or
vendors decrease the amount packaged and keep the price constant. Wheat flour is also available all
year. A vendor in the Old Lukulu market stated that wheat flour is ordered from Lusaka; during the
cold season (from June to July), the order price for flour increases.
In terms of tubers, roasted cassava was surveyed in only one market in Mongu, the vendor of which
explained that cassava is not in season during the rainy season since it cannot be harvested during this
time. Likewise, locally processed cassava flour is less available during the rainy season. When it is less
available, a vendor in the Mandanga market in Mongu explained that the price remains the same but
the quantity packaged decreases. In contrast, a vendor in the Lealui market stated that the price and
quantity do not change when it is less available. This may reflect differences in consumer demand and
producer needs between those living in rural Lealui versus those in urban Mongu. The vendor in Lealui
also stated that cassava becomes more available from June to August because vendors from Kaoma
arrive to exchange cassava for fish. Dried cassava, which was surveyed only in the Old Lukulu Market,
and there it is available year round since the cassava has been processed. Vendors in numerous
markets stated they bought Irish potatoes from Shoprite, a large supermarket chain located in Mongu,
or ordered them from Lusaka and resold them in the markets. When Irish potatoes are less available,
the price increases or less potatoes are sold for the same price than during the high season. The low
season for sweet potatoes, which can depending on the variety rich in vitamin A and also energy-
dense, coincides with the rainy season. The price for sweet potatoes remains constant throughout the
year but fewer potatoes are sold at that price during the low season. Sweet potatoes are also often
dried to increase availability during the low season. They are obtained from the floodplain and Kaoma.
Other energy-dense foods sold in the markets include buns, butter scones and fritters. These are all
locally produced, have constant prices and are available all year. Sugar, which is also available year

Page 7 of 16
round, holds constant prices across markets; a 1 kg bag is normally sold for K7 or K8. A vendor in the
Mapungu shops stated that sugar sales increase during June and July because the wild fruit used to
brew beer is less available and people substitute it with sugar.
Protective
Vitamin A rich food
Only two other vitamin-rich food items were observed in the market besides sweet potatoes. Carrots
were only surveyed in the Mongu Main Market and Senanga Main Market. There is generally a low
availability of carrots. A vendor in Senanga stated that she bought carrots from Shoprite and then
resold them at the market. Although the price remains constant throughout the year, the quantity
sold at that price decreases during the low season. Paw paw was only surveyed in two markets in
Mongu. While vendors gave slightly different descriptions of when paw paw is available, their
responses overlapped to show that it is not available from October to December and that availability
is lower from January to May. Even during the low season, one vendor stated that the price for paw
paw does not change.
Dark leafy greens
There is a variety of dark green leafy vegetables available in markets. The high season for pumpkin
leaves, sweet potato leaves, cassava leaves, amaranthus and hibiscus coincides with the rainy season.
Pumpkin leaves are generally available year round. The price for a bundle of pumpkin leaves is the
same across markets at K0.50. When it is less available, a vendor in Old Lukulu Market stated, the
price remains constant but the bundle contains less leaves. In Senanga, the price for a bundle of sweet
potato leaves increases from K0.50 in the high season to K1 in the low season. Cassava leaves were
only surveyed in one market in Mongu, where a vendor stated the low season is from June to August
and the price for a bundle was K1. The price of a bundle of amaranthus ranges from K0.50 to K1,
depending on the market. Hibiscus is available year round and the price for a bundle ranges from
K0.50 to K1 across markets. During the low season, the price of hibiscus usually remains the same but
the size of the bundle is cut in half by a handful. Unlike other the dark green leaves, rape is available
year round with the high season lasting from about May to August or September. Rape was surveyed
in all markets except for the Lealui Market. In most markets, vendors stated that they keep the price
constant but reduce the number of leaves sold in a bundle. Prices range from K0.50 to K1 for a bundle.
Other vegetables
Other vegetables observed in the markets include cabbage, Chinese cabbage, tomatoes, onions, okra,
African eggplant, eggplant, green pepper and green beans. Cabbage, which was surveyed in most
markets, is available all year. A vendor in Harbor Market stated that availability does not vary much
because the cabbage comes from many places, including the floodplain, upland and Lusaka. If cabbage
becomes less available, it is normally sold at a higher price. Chinese cabbage is also available year
round, with the high season lasting during the dry season, from about April to August. The price
remains constant at K1 for a bundle of leaves throughout the year but the number of leaves sold at
that price decreases during the low season.
Tomatoes, which were surveyed in all markets, are available year round with the low season lasting
from January to March. There were, however, some inconsistencies in vendors’ descriptions of the
low and high season for tomatoes. Tomatoes are sold in bundles of 2 or 4, depending on their size.
The price of tomatoes is relatively similar across the markets. For example, 4 medium tomatoes are
sold for K2. During the low season, 4 medium tomatoes are sold for between K3 and K5. When
tomatoes are very scarce, a vendor in Mongu’s Main Market stated that the price of one tomato can
increase to K5. In contrast, when tomatoes are highly available, they go to waste. Onions are also

Page 8 of 16
available year round, but the low season occurs near the end of the year. A vendor in the Harbor
Market explained that there is less availability of onions during the rainy season because the onions
rot during this time. The price and number of onions sold in a bundle depends on their size. One bulb
is usually sold for K1. In most markets, vendors stated that the price remains the same, even when
onions are less available.
In contrast to onions, the high season for okra coincides with the rainy season with lower availability
during the dry season. A bag of okra that has 10 to 12 fingers is sold for K1 or K2, depending on the
market. During the low season, the price will increase or it will remain the same and the number of
fingers packaged in the bag will decrease. African eggplant is available year round and appears more
available during the dry season. A bag of African eggplant, which may contain 15 to 25 eggplants, is
priced at K1 or K2, depending on the market. During the low season, either the price increases or the
price remains the same and the number of African eggplant packaged decreases. Eggplant was only
surveyed in one market, where a vendor stated that it is only available from December to January.
Four eggplants, ranging in size, are priced at K5.
A vendor in Mongu stated that since green pepper is not high in demand, its price and revenue is
relatively low. For example, 4 to 5 green peppers are sold for K1 or K2, depending on the market. The
price remains constant even when it is less available. In contrast, green peppers are priced higher in
Senanga at K1 per pepper during the high season and K3 during the low season. Green beans were
surveyed in only one market in Mongu; a bag of green beans is sold at K2 and the price is constant
throughout the year. Garlic was also only surveyed in one Mongu market; 5 bulbs are sold for K5 during
the high season. During the low season, the number of bulbs sold for K5 decreases to 4.
Other fruits
Few types of fruit were observed across the markets. Oranges were only surveyed in one market in
Mongu and the price ranges from K0.50 to 1.50 per orange, depending on its size. The high season for
oranges lasts from April to August and the low season from September to March, which coincides with
the rainy season. Pineapples were also only surveyed in one market, in the Old Lukulu Market. One
pineapple is sold for K4 or K5. The vendor in Lukulu explained that pineapple is only available from
January to February and that it comes from North Western Province.
Body-building
Animal-source food
Fish was the most commonly surveyed animal-source food across the markets, including fresh and
dried types. Fish is more available from June to August, during which prices are lower. Some vendors
stated that fish is not available during the fishing ban from December to March. However, others
stated that fish is still available during this time, but at a lower level. This perhaps serves as evidence
that fishing still occurs during the ban. During the low season, prices for fish increase or prices remain
the same but the number of fish sold at that price decreases. When the fishing ban begins, the demand
for kapenta increases as consumers seek a substitute for fresh fish. As the demand for kapenta
increases, vendors keep prices constant but decrease the amount of kapenta that is sold at that price.
Sales decrease once there is plenty of local fish on the market again. Vendors also mentioned that
kapenta is obtained from Siavonga, Mpulungu and Lusaka.
Beef was only surveyed in the Kapulanga Market in Mongu. One kilogram of mixed cuts was priced at
K27. The vendor stated that beef is available all year, but that sales increase during the fishing ban.
Pork was surveyed in the Mandanga Market in Mongu. It was sold by the vendor as fried pork chops
and priced at K20 for 1kg. During lower availability from October to May, the price remains the same
but the pork chops are reduced in size.

Page 9 of 16
Eggs are available year round, with some vendors stating that the low season lasts from June to
August. Like kapenta and beef, vendors mentioned that sales increase during the fishing ban. During
the low season, the price of a tray of eggs increases slightly, but individual eggs are consistently sold
at K1. Multiple vendors mentioned that eggs are ordered from Lusaka.
In terms of dairy products, fresh Parmalat brand milk is available year round and prices do not
fluctuate; a container of 250 mL is sold for K4 and of 500 mL for K6. Sour milk was only surveyed in
the Lealui Market and Old Lukulu Market. The vendor in Lealui stated that the price does not change
as the availability changes, which becomes lower in March, but the quantity sold at that price is
reduced.
Legumes, beans, seeds & nuts
Beans, cowpeas, groundnuts, bambara nuts and soy pieces were observed during the market
sampling. Beans were surveyed in all markets except the shops in Mapungu. The demand for beans is
higher during the fishing ban when less fish is available for consumption. Prices vary depending on the
quantity sold, which is often measured in local containers, and increase during the low season or when
the demand for beans is higher. Cowpeas were only surveyed in two markets, in the Kapulanga Market
in Mongu and the Old Lukulu Market. While cowpeas are available throughout the year, a vendor in
the Kapulanga Market stated that the low season lasts from December to April, which coincides with
the rainy season. The price of cowpeas increases during the low season. Groundnuts were surveyed
in most markets. Similar to beans and cowpeas, the low season for groundnuts is during the rainy
season, generally from November to March, with the high season occurring during the dry months.
However, even when groundnuts are less available from the floodplain, vendors can obtain them from
Sesheke and Kaoma. The price of groundnuts increases during the low season or the quantity
packaged is reduced and sold at the same price as during the high season. For example, a 250 g bag of
groundnuts is sold for K2 during the high season but for K3 during the low season. Powdered
groundnut is available all year and is often purchased by consumers to add to samp, vegetables and
dried fish. Bambara nuts were only surveyed in the Kapulanga Market. The vendor stated that they
are available all year and that prices range from K2 to K3 for quantities measured in local containers.
Soy pieces, purchased from Lusaka, are also available year round. A 100g bag is priced at K3; prices of
soy pieces remain constant.
Other Other food items sold throughout the markets include cooking oil, salt, anthill soil, baking soda, baking
powder, paprika, curry, soft drinks, maheu, D’lite (mix used to make porridge for children) and Instant
Thobwa (maize and soybean mix to make drinks or porridge). These items are available year round
and the prices remain constant. Cooking oil is often sold in small bags or reused bottles at varying
prices ranging from K0.50 to K10. A new 750mL bottle of cooking oil is sold for K10 to K13. Anthill soil
is purchased by pregnant women who believe it satisfies cravings. It was observed that at Mongu’s
Main Market, more soil is sold than powdered groundnuts, even though powdered groundnuts are
available all year at constant prices and are an excellent source of protein and energy as well as certain
micronutrients.
Conclusion The research on the location of markets and fluctuation of food prices and availability indicates that
AAS communities have poor access to markets. This lack of market access inhibits community
members from consistently obtaining food items and from exploring opportunities to diversify their
diets. It is therefore a major constraint to improving the nutrition situation of households in the
Barotse floodplain, especially during the hunger season.

Page 10 of 16
During focus group discussions led by the AAS team in the ten communities, individuals discussed the
need to improve access to markets as a priority area to enhance the well-being and livelihoods of
households. Proposed actions included training households in the production of quality products,
strengthening linkages to markets, improving transportation, lobbying the government for better road
and market infrastructure, and facilitating the establishment of market information centers.8 These
actions may be further explored to identify opportunities to improve market access and therefore
open up entry points to increase dietary diversity and improve nutrition.
References
Baidu-Forson, J.J., Phiri, N., Ngu’ni, D., Mulele, S., Simainga, S., Situmo, J., Ndiyoi, M., Wahl, C.,Gambone, F., Mulanda, A., & Syatwinda, G. (2014). Assessment of agrobiodiversity resources in the Borotse flood plain, Zambia. CGIAR Research Program on Aquatic Agricultural Systems. Penang, Malaysia. Working Paper: AAS-2014-12. Retrieved from http://www.aas.cgiar.org/publications/assessment-agrobiodiversity-resources-borotse-flood-plain-zambia CGIAR Research Program on Aquatic Agricultural Systems. (2014). AAS 2013 Annual Report. Penang, Malaysia: CGIAR Research Program on Aquatic Agricultural Systems. Annual Report: AAS 2014-32. Retrieved from http://aas.cgiar.org/publications/aas-2013-annual-report Dierksmeier, B., Cole, S.M., & Teoh, S.J. (2015). Focal community profiles for Barotse Hub, Zambia. Penang, Malaysia: CGIAR Research Program on Aquatic Agricultural Systems. Program Report: AAS-2015-06. Retrieved from http://www.aas.cgiar.org/publications/focal-community-profiles-barotse-hub-zambia
Longley, C. & Thilsted, S.H. (2012). Food and nutrition security in the Barotse Floodplain System. Penang, Malaysia: CGIAR Research Program on Aquatic Agricultural Systems. Draft Report.
8 Dierksmeier et al., 2015
Page 11 of 16
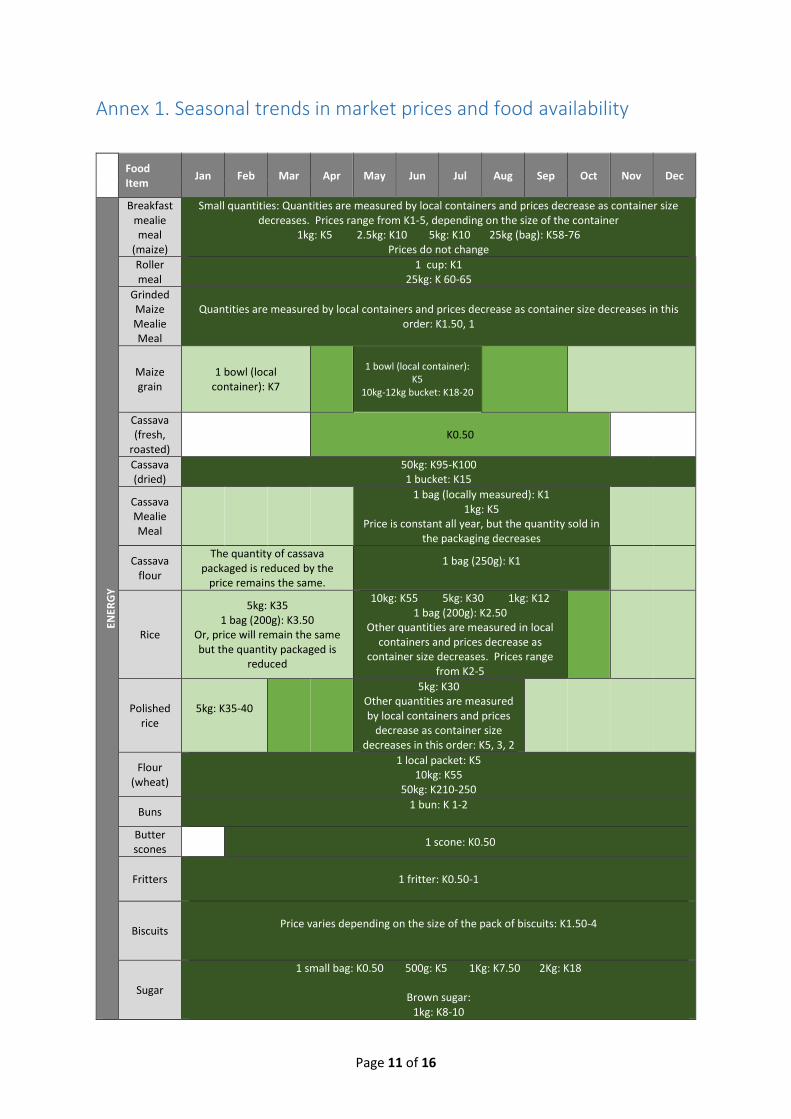
Annex 1. Seasonal trends in market prices and food availability
Food Item
Jan Feb Mar Apr May Jun Jul Aug Sep Oct Nov Dec
ENER
GY
Breakfast mealie meal
(maize)
Small quantities: Quantities are measured by local containers and prices decrease as container size decreases. Prices range from K1-5, depending on the size of the container
1kg: K5 2.5kg: K10 5kg: K10 25kg (bag): K58-76 Prices do not change
Roller meal
1 cup: K1 25kg: K 60-65
Grinded Maize Mealie Meal
Quantities are measured by local containers and prices decrease as container size decreases in this order: K1.50, 1
Maize grain
1 bowl (local container): K7
1 bowl (local container):
K5 10kg-12kg bucket: K18-20
Cassava (fresh,
roasted)
K0.50
Cassava (dried)
50kg: K95-K100 1 bucket: K15
Cassava Mealie Meal
1 bag (locally measured): K1 1kg: K5
Price is constant all year, but the quantity sold in the packaging decreases
Cassava flour
The quantity of cassava packaged is reduced by the
price remains the same.
1 bag (250g): K1
Rice
5kg: K35 1 bag (200g): K3.50
Or, price will remain the same but the quantity packaged is
reduced
10kg: K55 5kg: K30 1kg: K12 1 bag (200g): K2.50
Other quantities are measured in local containers and prices decrease as
container size decreases. Prices range from K2-5
Polished rice
5kg: K35-40
5kg: K30 Other quantities are measured by local containers and prices
decrease as container size decreases in this order: K5, 3, 2
Flour (wheat)
1 local packet: K5 10kg: K55
50kg: K210-250
Buns 1 bun: K 1-2
Butter scones
1 scone: K0.50
Fritters
1 fritter: K0.50-1
Biscuits
Price varies depending on the size of the pack of biscuits: K1.50-4
Sugar
1 small bag: K0.50 500g: K5 1Kg: K7.50 2Kg: K18
Brown sugar: 1kg: K8-10

Page 12 of 16
Food Item
Jan Feb Mar Apr May Jun Jul Aug Sep Oct Nov Dec Irish
potatoes 1 package: K55 4 potatoes: K5
1 package: K60 3 potatoes: K5; price
remains constant, but quantity of potatoes
decreases
PR
OTE
CTI
VE
Sweet potatoes
When it is less available, the quantity decreases but the price
remains the same
10 big: K5 20 medium: K5
Unspecified quantity, small: K2-3
Carrot
1 bag (8 carrots): K5
1 bag (8 carrots): K3
Paw
Large: K5 Medium: K3
Small: K2 Price does not change
Pumpkin leaves
1 bundle (10 leaves): K0.50 Old Lukulu Market: When more available, a bundle of 20 leaves is sold for K0.50; when less available
(May-November), a bundle of 5 leaves is sold for K0.50
Sweet Potato Leaves
1 bundle: K0.50 1 bundle: K1
Cassava leaves
1 bundle: K1
Amaranthus
1 bundle: K0.50-1 1 bundle: K0.50-1*
Hibiscus 1 bundle: K0.50-1
The bundle is divided and
price is same, or the price
increases
Rape
1 bundle (4 leaves): K1 1 bundle (3 leaves): K0.50
Or price constant and number of leaves in bundle decreases
1 bundle (7-10 leaves): K1 1 bundle (5 leaves): K0.50
Cabbage
1 small head: K3.50 1 medium head: K3-5
1 large head: K4-8
small: K1.50-
3 med: K2-5 large: K4-6
Chinese cabbage
1 bundle (4-10 leaves): K1
1 bundle (7-15 leaves): K1
In Kapulanga Market (Mongu): 20-30 leaves for K0.50
Tea leaves
1 bundle: K1
Tomato
4 tomatoes (large): K4-10 4 tomatoes (medium): K3-
5 4 tomatoes (small): K2 2 tomatoes (small): K1
4 tomatoes (large): K3-4
4 tomatoes (medium): K2 4 tomatoes (small): K1
Tomato paste
1 can of 70g: K2.50
Onion 4 bulbs (medium-large): K5
1 bulb (large): K2 1 bulb (small): K 0.50-1
Price remains the same throughout the year but the quantity packaged
decreases during the low season
Onion (unripe)
1 bulb: K1
1 bulb:

Page 13 of 16
Food Item
Jan Feb Mar Apr May Jun Jul Aug Sep Oct Nov Dec
K0.50-1
Spring Onion
(Scallion)
1 bundle: K2
1 bundle: K2
Okra 10 fingers: K1-2
7-10 fingers: K2
African eggplant
1 bag (7-20 eggplants):
K2-5
1 bag (15-25 eggplants): K1-2.50
Eggplant
1 big + 3
small: K5
Green pepper
1 bag (4-5 peppers): K1-2
Price usually does not change
Green beans
1 bag: K2
Price does not change
Garlic 1 bag (4 bulbs): K5 1 bag (5 bulbs): K5
Oranges Large: K1.50 Medium: K 1 Small: K0.50
Pineapple 1 pineapple:
K4-5
BO
DY
-BU
ILD
ING
Fresh Bream
7 medium fish: K50
7 medium fish: K30
Fresh Small Red Breasted
15 fish
(depending on size): K2.50-5
Fresh Red Breasted
6-7 fish
(small/medium): K20 7-8 fish
(large): K50
7 fish (small): K10
7 fish (medium):
K15-20 8 fish (large):
K35-45
Fresh Mudpuffer
1 basin: K70 or K120,
depending on availability and size of
fish
Fresh Tiger Fish
10 small fish:
K2 15 small fish: K5
Fresh "Limbala"
Fish (Barbus)
1 medium
sized cup: K5 1kg: K10
1 small cup
(70 meco): K5
Fresh Catfish
1 fish: K3
1kg: K7.50
1 fish: K5

Page 14 of 16
Food Item
Jan Feb Mar Apr May Jun Jul Aug Sep Oct Nov Dec
"Mabango" Fish
1kg: K35
Dried Small
Bream
14 fish (small): K5 14 fish (medium): K10
Dried Red Breasted
Bream
5 big fish: K40 6 medium fish: K20
8-9 medium fish: K20
5 big fish: K30 6 medium fish: K10
10-12 medium fish: K20
7 small fish: K10
12 fish: K50
Dried Red Breasted Spotted Bream
6 fish: K20 5 fish: K10
7 fish: K20
5 fish: K20
Dried "Maleleka"
Fish K3-5 (depending on size of container)
Dried Bulldog
15 fish: K10 1 cup (140 meco): K5
11-14 fish: K5-10 1 cup (140 meco): K4
Dried Catfish
5
fish: K10
5 fish: K20
Dried Small
Tigerfish
2 fish: K5
Dried Zambezi
Pike 12 fish: K10 15 fish: K20
Dried "Ndikusi"
Fish (Bottlefish)
15 fish: K10 15 fish: K20
Dried "Lingongi" (squeaker)
The quanti
ty is reduc
ed
30 pieces: K2 30 pieces: K2
Dried "Lituu"
Fish
1 heap (10-12 fish, medium
size): K5 1kg: K50
Dried "Shibe"
Fish
140 meco cup: K5
70 meco cup: K5
"Pepe" Fish
(Northern Churchill)
Small plate: K3
Dried "Liminga"
Fish (Parrot
fish)
1 kg: K50
Dried "Nakatenge" Fish
1kg: K25 1kg: K25

Page 15 of 16
Food Item
Jan Feb Mar Apr May Jun Jul Aug Sep Oct Nov Dec
Dried fish (mixed
species) 7 fish: K20 5 fish: K10
Kapenta
5kg: K75 Other quantities:
Prices range from K5-70
5kg: K70 Other quantities are measured by local
containers and prices decrease as container size decreases. Prices range from K5-55
Beef (mixed
cut)
Sales increase during fishing
ban 1kg: K27
Pork chops (fried)
During low season, the price per kg remains the same but the pork chops are
reduced in size 1 Kg: K20
Eggs 1 egg: K1
I tray: K22-23 Sales are higher during fishing ban
1 egg: K1 1 tray: K25-30
Fresh milk
(Parmalat)
250mL: K4 500mL: K6
Powdered milk
1 local packet: K1
Sour milk 1 bag:
K2 1L: K8
The price does not change as
the availability changes; instead, the quantity changes
Beans
5kg: K60-65 Other quantities are
measured in local containers; prices
decrease as container size decreases and range from K4-35
5kg: K45-55 Other quantities are measured in local
containers; prices decrease as container size decreases and range from K3-30
Cowpeas K5-7 K2-3
1kg: K8
Groundnut
250g bag: K3 Quantities measured in
local containers: K0.50, 3, 5, 10, 20
250g bag: K2 Quantities measured in local containers: K0.50,
2, 3, 5, 15
Powdered groundnut
Quantities are measured by local containers and prices decrease as container size decreases. Price range: K1-10
Prices do not change
Bambara nuts
Quantities measured in local containers: K2, 3
Soya pieces
80g: 2.50 90-100g: K3
Prices do not change
OTH
ER
Cooking oil
1L bottle: K15 750mL bottle: K10-13 350mL bottle: K5-5.50
Vendors sell oil in small bags and reused bottles of various sizes. Price range from K0.50-10. Generally, one small bag is priced at K1.
Prices do not change
Salt
1kg: K4 500g: K2-3
Repackaged salt, I bag: K0.50 Coarse salt, 500g: K3 Prices do not change
Soil (anthill
soil)
1kg: K1-3 1 bag with large pieces: K1
1 bag with small pieces: K0.50

Page 16 of 16
Food Item
Jan Feb Mar Apr May Jun Jul Aug Sep Oct Nov Dec
Baking soda
Quantities are measured by local containers and prices decrease as container size decreases. Prices range from K1-2
Baking powder
100g: K2.50
Paprika Quantities are measured by local containers and prices decrease as container size decreases. Prices
range: K10, 5, 2, 1
Curry 1 small bag: K5
Soft drinks
K3-5 per bottle
Maheu 250mL: K2.50
500mL:K4
D'lite 1 box (250g): K12
Instant Thobwa
1 bag (8.1g): K1
LEGEND
High season
Medium
Low season
Not in season
No data