biplane angiography ultrasound images by fusion with...
TRANSCRIPT
Automated calculation of theaxial orientation of intravascularultrasound images by fusion with
biplane angiography
Andreas Wahle, Guido P. M. Prause,Clemens von Birgelen,�
Raimund Erbel,� Milan Sonka
The University of Iowa, Iowa City, IA 52242-1527, USA
�University Hospital Essen, D-45122 Essen, Germany

Poster Layout:
(for information only, not a part of the poster)
MethodOutline
RelativeTwist
CatheterFig. Angio +
FigureBasics
FigureCath Bend.
Curves
Title
Abstract
Problem
SolutionFurtherReading
Flowchart
Out-of-Center Vecs
Orientation
ErrorMinimization
PreviousWork
Absolute
OutlineMethod
vs. IVUSAngio
Results
Conclusions
Curves
28
Example Discussion
FigureVRML
LocalFunctions
ReliabilityWeight
1.
2.
3.
3.1
3.2
4.
4.1 4.2
4.3
5.
6.
7.
2
3
4
5
6
7
8
9
10
11
12
13-16
17
18
19
20
21
22
23
24
25
26
27
ABSTRACT
This poster presents an approach for fusion of the two majorcardiovascular imaging modalities, angiography and intravascularultrasound (IVUS). While the path of the IVUS catheter, whichfollows the vessel curvature during pullback, is reconstructed frombiplane angiograms, cross-sectional information about the vesselis derived from IVUS. However, after mapping of the IVUSframes into their correct 3-D locations along the catheter path, theirorientations remain ambiguous. We determine the relative cathetertwisting analytically, followed by a statistical method for findingthe absolute orientation from the out-of-center position of theIVUS catheter. Our results as obtained from studies with cadavericpig hearts and from three patients undergoing routine coronaryintervention showed a good match of the absolute orientation bythe algorithm. In all tested cases, the method determined thevisually correct orientations of the IVUS frames. Local distortionswere reliably identified and discarded.
2
1. PROBLEM� From biplane angiography, the 3-D geometry of a vessel can
be assessed; however, no information about vessel wall andplaque is provided.
� .Intravascular ultrasound (IVUS) provides accurate infor-mation about vessel wall and the composition of plaque,but current 3-D reconstruction systems do not consider thefollowing effects:
– Due to vessel curvature, the IVUS slices are not par-allel, and thus 3-D quantifications based upon conven-tional straight stacking distorted.
– Due to vessel torsion as defined by differential geom-etry, the axial orientation of an ideal IVUS catheterwithin the vessel is no longer constant.
3

2. SOLUTION� Combination (fusion) of the data obtained from biplane coro-
nary angiography and intravascular ultrasound provides anexact assignment of the cross-sectional data to the vesselsegment in both location and orientation:
1. Both angiograms and all IVUS images are segmentedto obtain (a) the longitudinal geometry of the vessel,and (b) the cross-sectional information.[1, 2, 4]
2. Each IVUS frame can be assigned to a specific locationfrom its time-stamp.[5, 6]
3. The orientation of an IVUS frame consists of a rel-ative portion, defining the relations between adjacentframes,[3] as well as an absolute orientation for the en-tire frame set.
� This poster focuses on the last item for calculation of theaxial orientation in 3-D.
4

Figure 1: Principle of the fusion approach — the IVUS framesare mapped on their respective location along the 3-D trajectoryof the imaging catheter, and their correct spatial orientation isdetermined.
5
3. PREVIOUS WORK
3.1 3-D Catheter Trajectory
� Basis for the assignment of the IVUS frames is the 3-D pathof the imaging catheter (trajectory); after extraction of the2-D angiographic information, it can be reconstructed usingthe epipolar constraint.[1]
� The 3-D pullback trajectory is used to assign a specific3-D location for each IVUS frame based upon the time-distance function.[5, 6]
� A constant pullback speed is required for this matching (e.g.automated devices), as well as ECG-gating in-vivo.
6

Figure 2: Extraction of the catheter path — transducer markedat the most distal position in both projections (green), along withpresumed proximal end of the pullback (yellow), and some guidepoints outlining the catheter path inbetween.
7
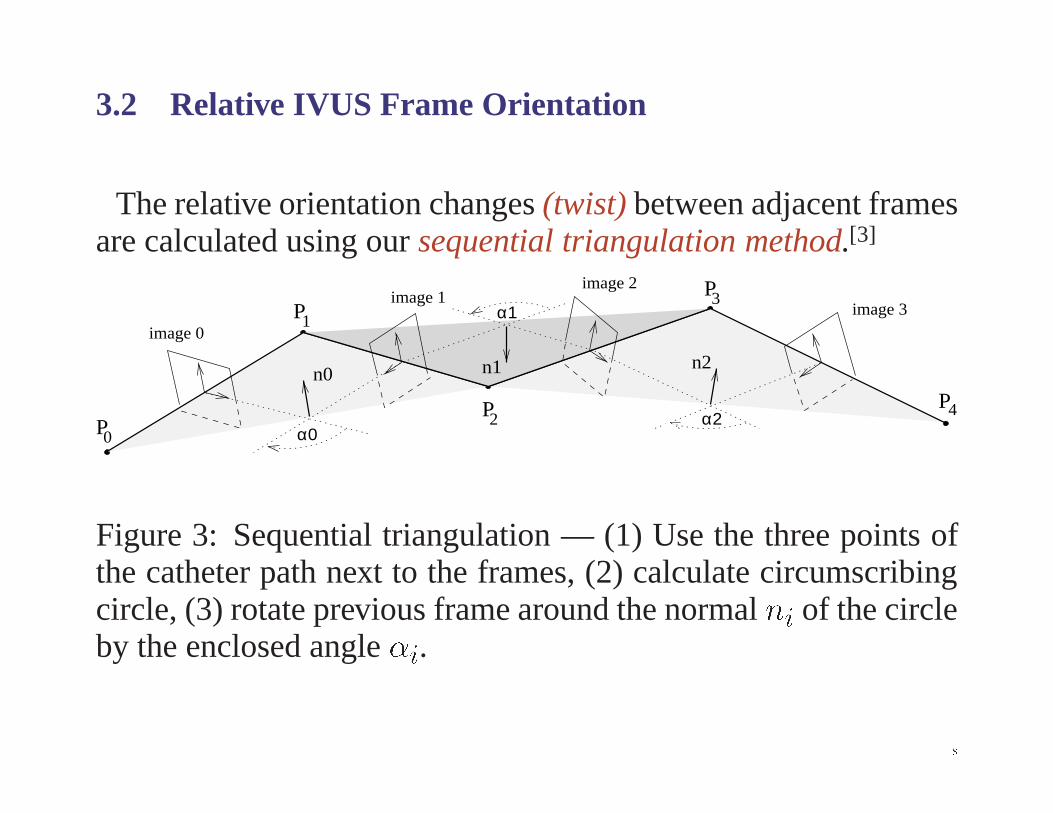
3.2 Relative IVUS Frame Orientation
The relative orientation changes (twist) between adjacent framesare calculated using our sequential triangulation method.[3]
n1
α0α2
α1image 0
image 2
image 3image 1
0
31
24P
P
P
P
P
n0n2
Figure 3: Sequential triangulation — (1) Use the three points ofthe catheter path next to the frames, (2) calculate circumscribingcircle, (3) rotate previous frame around the normal ni of the circleby the enclosed angle �i.
8

vessel lumen
sheathtransducer
Figure 4: Bending of the imaging catheter within the vessel due tovessel curvature — the catheter is seeking a position of minimumenergy and thus provides an artificial landmark for the absoluteorientation; the position of the sheath within the vessel remainsstable during pullback of the core with the transducer.
9
4. ABSOLUTE FRAME ORIENTATION� The sequential triangulation method delivers the relative
orientation only;
� .leg-sock problem: the frame set (“sock”) may be rotatedarbitrarily around the catheter path (“leg”);
� natural landmarks like branches are often unreliable, artifi-cial landmarks like clips not applicable in-vivo.
� The catheter always seeks a position of minimum bendingenergy within the vessel;
� the out-of-center position of the catheter can be identifiedafter segmentation in both angiograms and IVUS images;
� an error minimization algorithm based upon statistics in amoving window along the catheter path is used for optimiz-ing the axial orientation in a single correction step.
10
Outline of our new method:
1. The 3-D catheter path is reconstructed from the angiograms;2. the vessel outline, i.e. the inner lumen contour, is extracted
from both angiographic and IVUS data;3. the relative catheter twist is determined analytically;4. the IVUS lumen contours are mapped into 3-D space using
an initial orientation;5. for each frame location, out-of-center strength � and differ-
ence angles ' are determined;6. within a moving window, strength and angle values are sta-
tistically analyzed;7. a reliability weight is calculated for each window location;8. finally, a single correction angle is derived from all window
locations and applied to the frame set.
11

Angiographic
IVUS
Projectionwith Catheter
Figure 5: Appearance of out-of-center position of the imagingcatheter in angiographic and IVUS images.
12

Angio vs. IVUS
Out-of-Center Strength Sum over Moving Window
Standard Deviation
Weighted Mean Angle
Reliability Weight
Difference Angle
0 5 10 15 20 25 30 35 40 45 50 55 60 650
15
30
45
60
σ(ϕ)
[mm] Pullback at Window Center
[deg
] S
tand
ard
Dev
.
0 5 10 15 20 25 30 35 40 45 50 55 60 650.0
5.0
10.0
15.0
20.0
Σµ
[mm] Pullback at Window Center
[mm
] O
ut-o
f-C
ente
r S
um
0 5 10 15 20 25 30 35 40 45 50 55 60 650.0
0.5
1.0
1.5
2.0
µ
[mm] of Pullback
[mm
] O
ut-o
f-C
ente
r P
osit
ion
0 5 10 15 20 25 30 35 40 45 50 55 60 650
90
180
270
360
ϕ
[mm] of Pullback
[deg
] D
iffe
renc
e A
ngle
0 5 10 15 20 25 30 35 40 45 50 55 60 650
90
180
270
360
ϕ_
[deg
] M
ean
Ang
le
[mm] Pullback at Window Center
0 5 10 15 20 25 30 35 40 45 50 55 60 650.0
1.0
2.0
3.0
Rel
iabi
lity
Wei
ght
[mm] Pullback at Window Center
Angiograms
IVUS DataReconstruction before and after Adjustment
LAO
within Moving WindowStatistical Analysis
-
RAO
FRONTAL
+
+
Catheter PathReconstruction
RelativeTwist (3-D)
InitialOrientation
Lumen (2-D)Calculation ofSegmentation
Vectors (3-D)
Vessel OutlineDetection (2-D)
Elliptical (3-D)Reconstruction
Correction Angle
Out-of-Center
13{16
Figure 6: Flow-chart for the absolute orientation assessment.
4.1 Out-of-Center Vectors
� Out-of-center vectors are obtained for each IVUS frame:
– From angiography1. The elliptical cross-sections are reconstructed from
the vessel outline;2. the intersection of the catheter path with the gener-
ated ellipse is determined at the level of the corre-sponding IVUS frame;
3. out-of-center vector results from the 3-D vectorbeginning at this intersection point and ending atthe center of the ellipse.
17
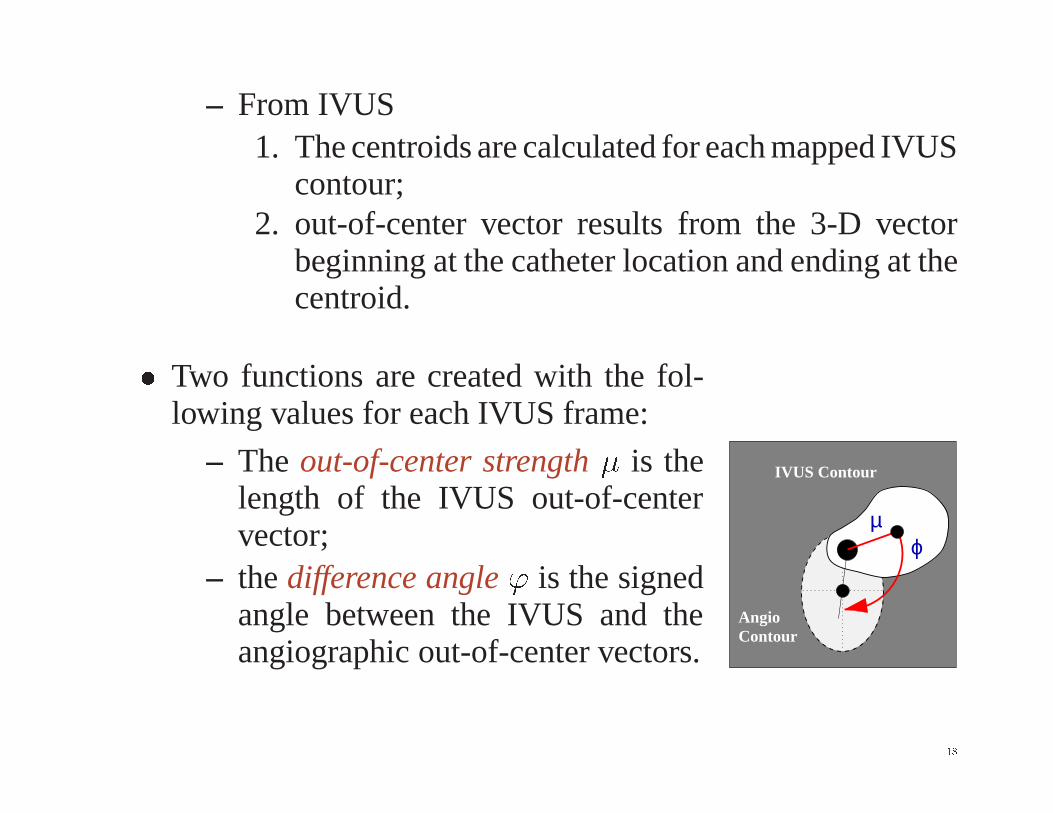
– From IVUS1. The centroids are calculated for each mapped IVUS
contour;2. out-of-center vector results from the 3-D vector
beginning at the catheter location and ending at thecentroid.
� Two functions are created with the fol-lowing values for each IVUS frame:
– The out-of-center strength � is thelength of the IVUS out-of-centervector;
– the difference angle ' is the signedangle between the IVUS and theangiographic out-of-center vectors.
IVUS Contour
ϕµ
ContourAngio
18

4.2 Reliability Weight� Philosophy:
– Give higher weight to values with a high out-of-centerstrength �;
– limit the weight of those with a high tolerance in theangle function '.
� Realization:
– Moving window; for each window location k
1. all difference angles 'i within k are weighted bytheir corresponding vector lengths �i;
2. the weighted mean 'k,3. the weighted standard deviation �('k), and4. the sum of weights ��k are derived.
19

4.3 Error Minimization
After calculation of the reliability function over all windows, thevalues are combined to a single correction angle:
� The positive weight (i.e. locations with increased signifi-cance for the estimation of the correction angle) is the sumof weights ��k,
� the negative weight (i.e. locations with distorted out-of-center data) results from the local tolerances �('k);
� the correction angle results from the weighted mean
'corr
=
Xk
�'k
��k
�('k)�,X
k
���k
�('k)�
and is applied to all IVUS frames.
20
5. RESULTS� The fusion approach was validated in a series of in-vitro
studies using computer models, phantoms, and cadavericpig hearts;[3, 5]
� manual pullback introduces unacceptable localization errorsdue to inhomogeneous speed, thus automated pullback wasapplied in-vivo;
� biplane angiographic images were acquired digitally;
� our approach was successfully applied to three patients withstable coronary artery disease, undergoing coronary revas-cularization and stent placement in native coronary arteries,and which were imaged as part of their clinical procedure;
� visualization was performed by both generation of a 3-Dvoxel cube mapped from IVUS pixel data, and as VRMLmodel.[6]
21

Example:
The following figures show the analysis of a stenosed segmentin a left coronary artery, 40 mm in length.
c)b)a)
Figure 7: Detail in a) 30� RAO and b) 60� LAO projections ofa left anterior descending artery; c) transmission image throughIVUS cube in lateral view.
22

0 5 10 15 20 25 30 35 400.0
0.5
1.0
1.5
µ
[mm] of Pullback
[mm
] O
ut-o
f-C
ente
r Po
sitio
n
0 5 10 15 20 25 30 35 400
90
180
270
360
ϕ
[mm] of Pullback
[deg
] D
iffe
renc
e A
ngle
Figure 8: Functions for length � of the out-of-center vector andlocal correction angle ' of the human artery shown in Figure 7;note the high variances in the angle function when the out-of-centerposition falls below angiographic resolution (<0.5 mm).
23

0 5 10 15 20 25 30 35 400.0
1.0
2.0
3.0
4.0
5.0mm 7.5mm12.5mm
Rel
iabi
lity
Wei
ght
[mm] Pullback at Window Center
0 5 10 15 20 25 30 35 400
90
180
270
360
ϕ_
[deg
] M
ean
Ang
le
[mm] Pullback at Window Center
Figure 9: Final functions for reliability weight ��k=�('k), withnon-linear scale to allow a better visual comparison of the curves,and weighted mean difference angle 'k, for each location of themoving window in three different sizes.
24
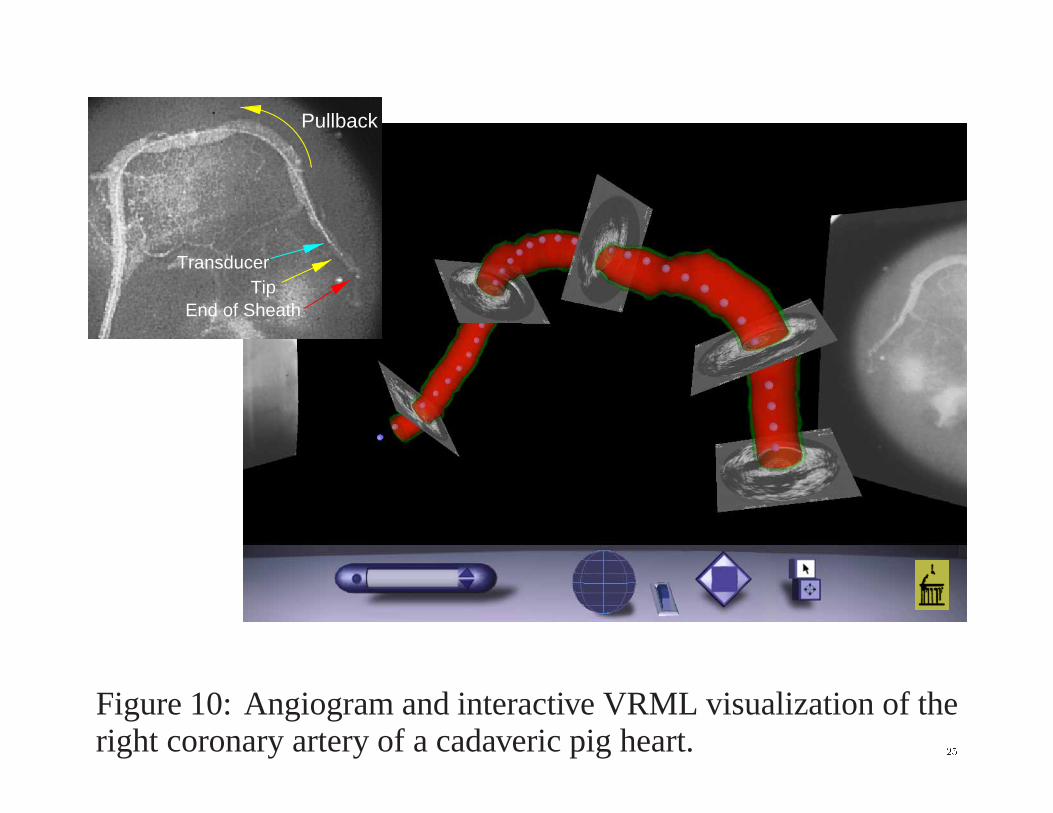
Pullback
TipTransducer
End of Sheath
Figure 10: Angiogram and interactive VRML visualization of theright coronary artery of a cadaveric pig heart. 25

6. DISCUSSION� The presented method has a high potential to overcome a ma-
jor problem in the determination of the absolute orientationsof the IVUS frames;
� using the catheter itself as an artificial landmark does avoidthe need for detecting frequently unreliable natural land-marks or the application of markers directly on the vessel;
� IVUS imaging catheters in sheathed design along with auto-mated pullback are mandatory;
� strong angiographic foreshortening should be avoided toallow optimal performance of our algorithm for the determi-nation of the absolute orientation;
� the developed system has shown to be robust against distort-ing influences, and misinterpretations occur only in severecases.
26
7. CONCLUSIONS� A comprehensive approach to fusion of intravascular ultra-
sound and biplane angiography has been developed, vali-dated, and applied in-vitro as well as in-vivo.
� Using IVUS catheters in sheathed design, the absolute ori-entation of the IVUS frame set is directly determined fromthe out-of-center position of the imaging catheter.
� By the introduction of a reliability weight along with ourmoving window technique, possible errors are successfullydetected and discarded.
� The presented fusion approach delivers high-quality 3-DIVUS reconstructions, operates on a highly automated level,and thus substantially improves the clinical applicability ofcath-lab imaging.
27
Further Reading[1] A. Wahle, E. Wellnhofer, I. Mugaragu, H. U. Sauer, H. Oswald, and E. Fleck, “Assess-
ment of diffuse coronary artery disease by quantitative analysis of coronary morphologybased upon 3-D reconstruction from biplane angiograms,” IEEE Transactions on MedicalImaging 14, pp. 230–241, June 1995.
[2] M. Sonka, X. Zhang, M. Siebes, M. S. Bissing, S. C. DeJong, S. M. Collins, and C. R.McKay, “Segmentation of intravascular ultrasound images: A knowledge-based approach,”IEEE Transactions on Medical Imaging 14, pp. 719–732, Dec. 1995.
[3] G. P. M. Prause, S. C. DeJong, C. R. McKay, and M. Sonka, “Towards a geometricallycorrect 3-D reconstruction of tortuous coronary arteries based on biplane angiography andintravascular ultrasound,” International Journal of Cardiac Imaging 13, pp. 451–462, Dec.1997.
[4] C. von Birgelen, E. A. de Vrey, G. S. Mintz, A. Nicosia, N. Bruining, W. Li, C. J. Slager, J. R.T. C. Roelandt, P. W. Serruys, and P. J. de Feyter, “ECG-gated three-dimensional intravas-cular ultrasound: Feasibility and reproducibility of the automated analysis of coronarylumen and atherosclerotic plaque dimensions in humans,” Circulation 96, pp. 2944–2952,Nov. 1997.
[5] A. Wahle, G. P. M. Prause, S. C. DeJong, and M. Sonka, “3-D fusion of biplane angiographyand intravascular ultrasound for accurate visualization and volumetry,” in Medical ImageComputing and Computer-Assisted Intervention (MICCAI ’98), W. M. Wells et al., eds.,pp. 146–155, Springer, (Berlin/New York), 1998.
[6] S. C. Mitchell, A. Wahle, C. von Birgelen, R. Erbel, and M. Sonka, “Real-time visualizationof coronary interventions using VRML,” in Proc. Medical Imaging 1999: Physiology andFunction from Multidimensional Images, San Diego CA, No. 3660-31, SPIE, (BellinghamWA), Feb. 1999.
28