biraj patnaik
TRANSCRIPT
1
The Right to Food in India
Presentation for CSEApril 2007
Office of the Commissioners to the Supreme Court (Writ 196/ 2001)
2
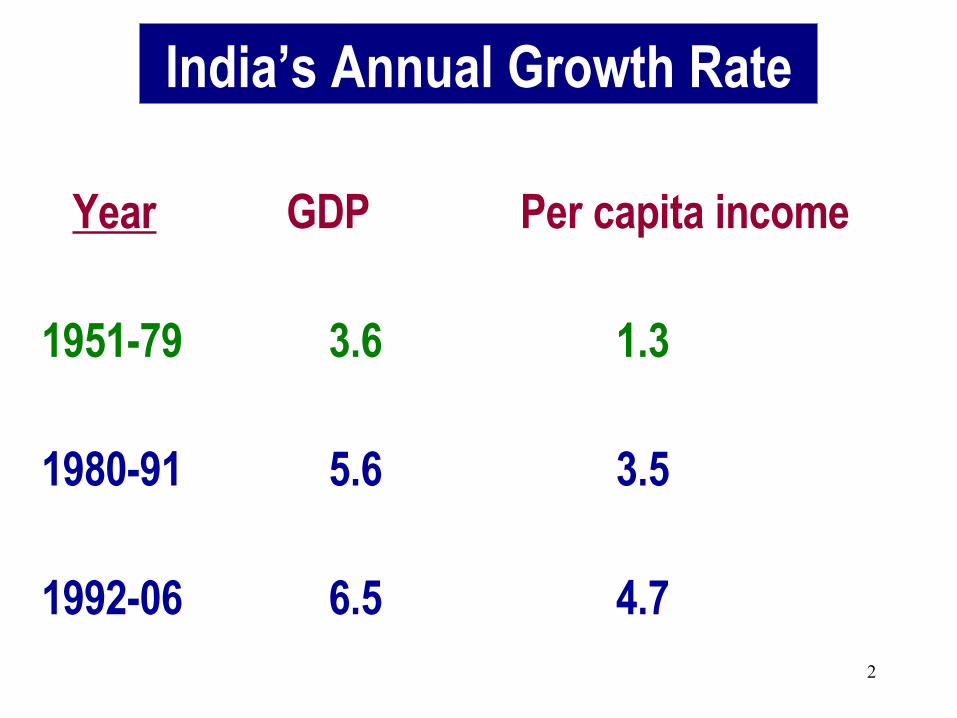
India’s Annual Growth Rate
Year GDP Per capita income
1951-79 3.6 1.3
1980-91 5.6 3.5
1992-06 6.5 4.7
3
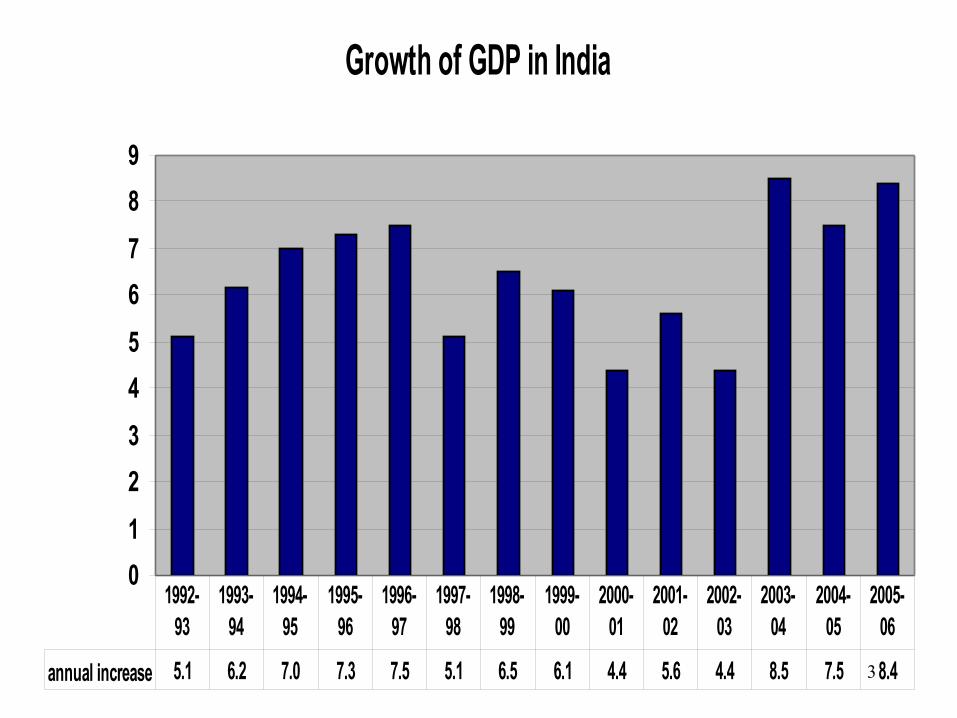
Growth of GDP in India
0
1
2
3
4
5
6
7
8
9
annual increase 5.1 6.2 7.0 7.3 7.5 5.1 6.5 6.1 4.4 5.6 4.4 8.5 7.5 8.4
1992-93
1993-94
1994-95
1995-96
1996-97
1997-98
1998-99
1999-00
2000-01
2001-02
2002-03
2003-04
2004-05
2005-06

4
Worrying issues• News of starvation deaths & farmers’ suicides from many
states• Stagnant agricultural production, and falling food
availability• Unemployment has increased from 4 to 8% in ten years• Regional disparities are increasing • IMR stagnating around 60 per 1000, it is 46 in Bangladesh• Immunisation coverage fell from 60 to 40% in 5 yrs• 50% women are anemic• 47% children are malnourished • Declining child sex ratio during 1991-2001
There is no will to improve administration in poor states

5
80
90
100
110
120
130
140
150
160
170
180
Index number of Agr Production
Series1 100 148.4 175.7 165.3 177.9 176.9 165.7 178.3 150.5 179
1981-82
1990-91
1996-97
1997-98
1998-99
1999-00
2000-01
2001-02
2002-03
2003-04

6
Index number of Agricultural Production
Index annual rate of growth
1981-82 100
4.4%
1990-91 148
2.8%
1996-97 176
0.2%
2004-05 179

7
69.7
64.8
59.8
66.5
69.5
59
62
65
68
71
1961 1971 1981 1991 2001
% of Work Force dependent on Agriculture
8
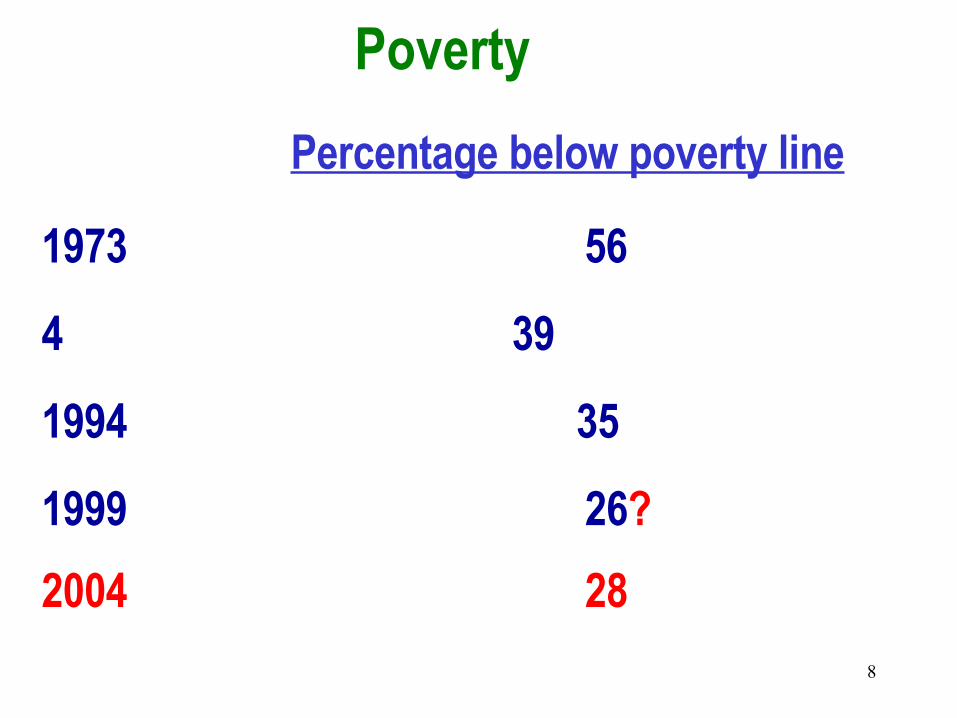
Percentage below poverty line
1973 56
4 39
1994 35
1999 26?
2004 28
Poverty

9
number of poor people in millions
247 239 234201
236
53 65 70
67
78
0
350
1971 1981 1991 2001 2006
Urban
Rural
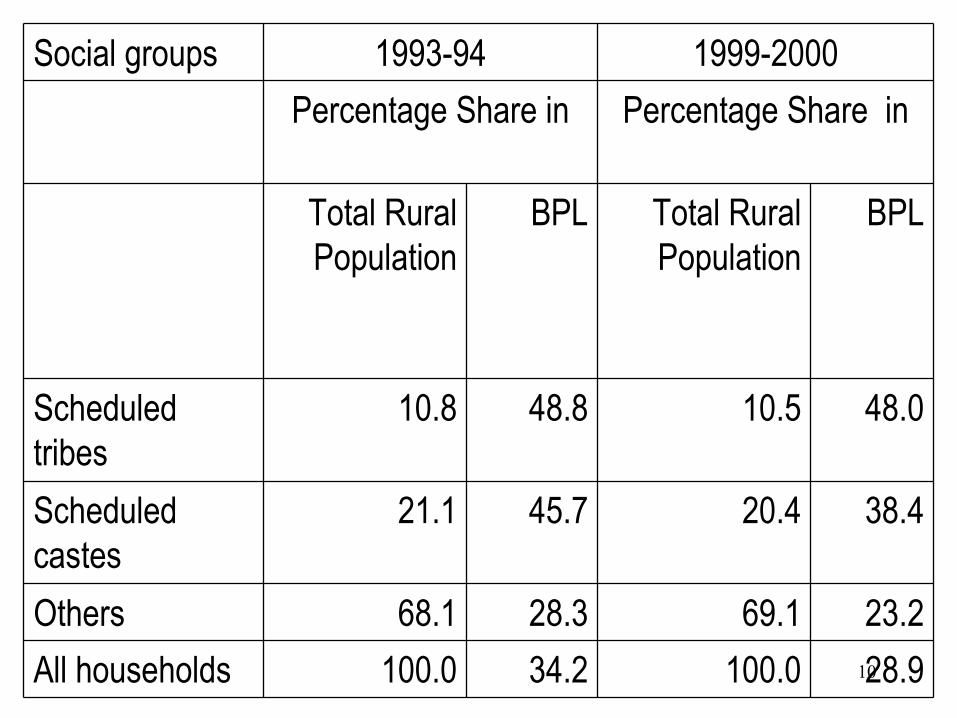
1028.9100.034.2100.0All households
23.269.128.368.1Others
38.420.445.721.1Scheduled castes
48.010.548.810.8Scheduled tribes
BPLTotal Rural Population
BPLTotal Rural Population
Percentage Share inPercentage Share in
1999-20001993-94Social groups
11
12
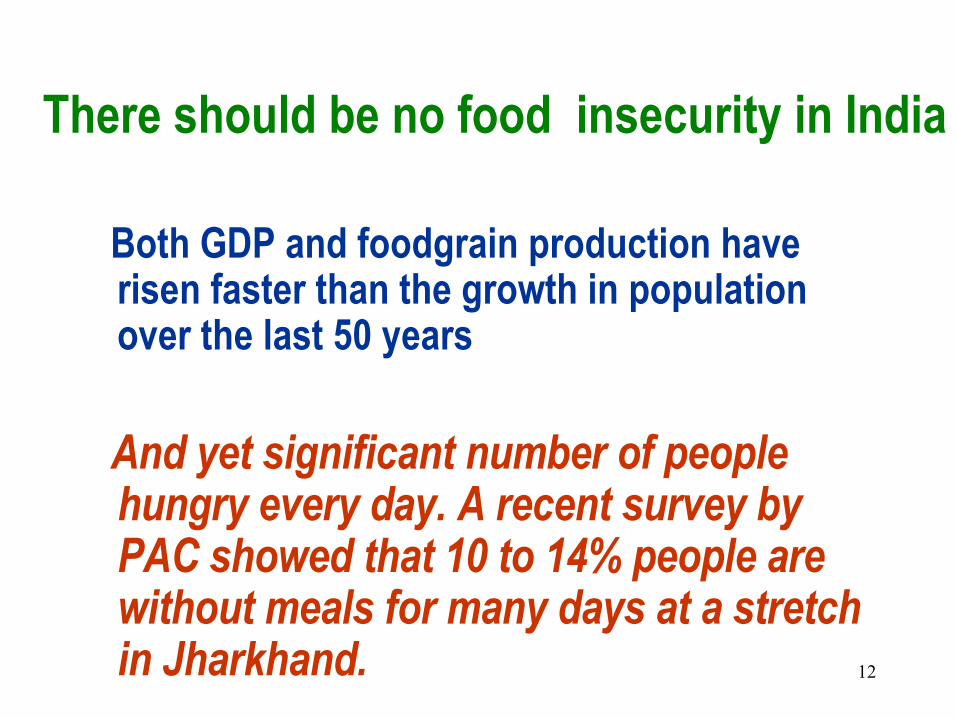
There should be no food insecurity in India
Both GDP and foodgrain production have risen faster than the growth in population over the last 50 years
And yet significant number of people hungry every day. A recent survey by PAC showed that 10 to 14% people are without meals for many days at a stretch in Jharkhand.

13
Decennial Growth of Population, GDP and Foodgrain Production
0
100
200
300
400
500
600
700
800
900
1000
1951 1961 1971 1981 1991 2001
Population
GDP
Foodgrain Production

14

15
0
5
10
15
20
25
30
Foodgrain exports in million tonnes
Total exports 4.685 12.385 10.308 0.753 28.131
2001-02 2002-03 2003-04 2004-05 Total

16
Offtake of foodgrains (in mT)
110.3112.464.70Subsidised
exports
0.259.665.665.60.06Open market
sale
7.410.613.511.388.862.08Other welfare schemes
31.429.424.220.0913.8416.98TPDS & AAY
23,50029,0002700024000176127900Food Subsidy
in crore Rs
2005-06
2004-05
2003-04
2002-03
2001-02
1997-98

17
Planning Commission’s evaluation of TPDS
• 58 per cent of subsidized food grains does not reach the BPL families, 22% reaches APL and 36% sold in black
• High cost of handling, for one rupee transfer to the poor, the Gol spends Rs.3.65
• Targeting errors, ghost cards and non-BPL households• Only 57% of the BPL households have ration cards• FPSs are not viable, they remain in business through
leakages • Homeless often do not have ration cards

18
Lifting of foodgrains as % of BPL allocation 2004-05
30 40 50 60 70 80 90 100 110
Bihar Jharkhand
Punjab West
Orissa Gujrat
Uttranchal U.P.
Haryana Maharash
HP Rajasthan
M.P. Chhatisga
Delhi Assam
J&K Kamataka
Kerala AP
Tamilnadu TOTAL

19
Regular Availability of foodgrains
0112
69101011
2338
4145
4751
73
0 10 20 30 40 50 60 70 80
PunjabBihar
Uttar PradeshHaryana
RajasthanWest Bengal
AssamOrissa
Himachal PradeshMadhya Pradesh
MaharashtraGujaratKerala
KarnatakaAndhra Pradesh
TamilNadu
% of households

20Source: Report of Committee on Long Term Grain Policy, 2002
21
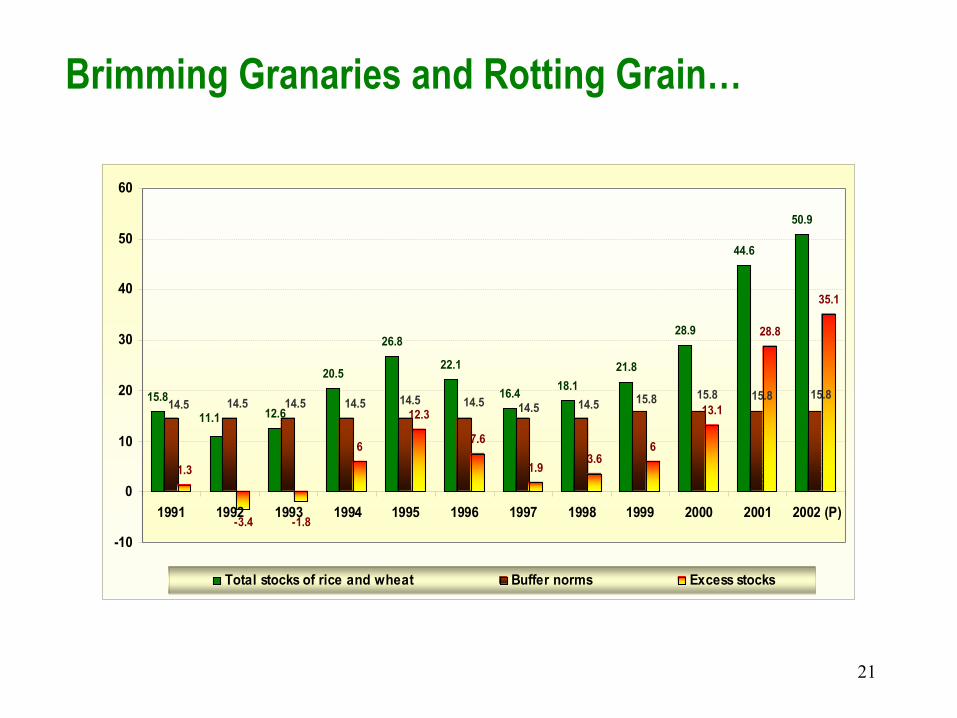
Brimming Granaries and Rotting Grain…
15.812.6
20.5
26.8
22.1
16.418.1
21.8
28.9
44.6
50.9
1.3
-3.4
6
12.3
7.6
1.93.6
6
13.1
28.8
35.1
11.114.5 14.514.514.514.5 14.5 14.5 14.5 15.8 15.8 15.8 15.8
-1.8
-10
0
10
20
30
40
50
60
1991 1992 1993 1994 1995 1996 1997 1998 1999 2000 2001 2002 (P)
Total stocks of rice and wheat Buffer norms Excess stocks

22
ICDS – Supreme Court Orders
• Have a disbursement centre in every settlement.• We direct the State Govts./ UTs to implement the
ICDS in full and to ensure that every ICDS disbursing centre in the country shall provide as under - Each child up to 6 years of age to get 300 calories and 8-10 grams of protein; Each adolescent girl to get 500 calories and 20-25 grams of protein; Each pregnant woman and each nursing mother to get 500 calories & 20-25 grams of protein; Each malnourished child to get 600 calories and 16-20 grams of protein.
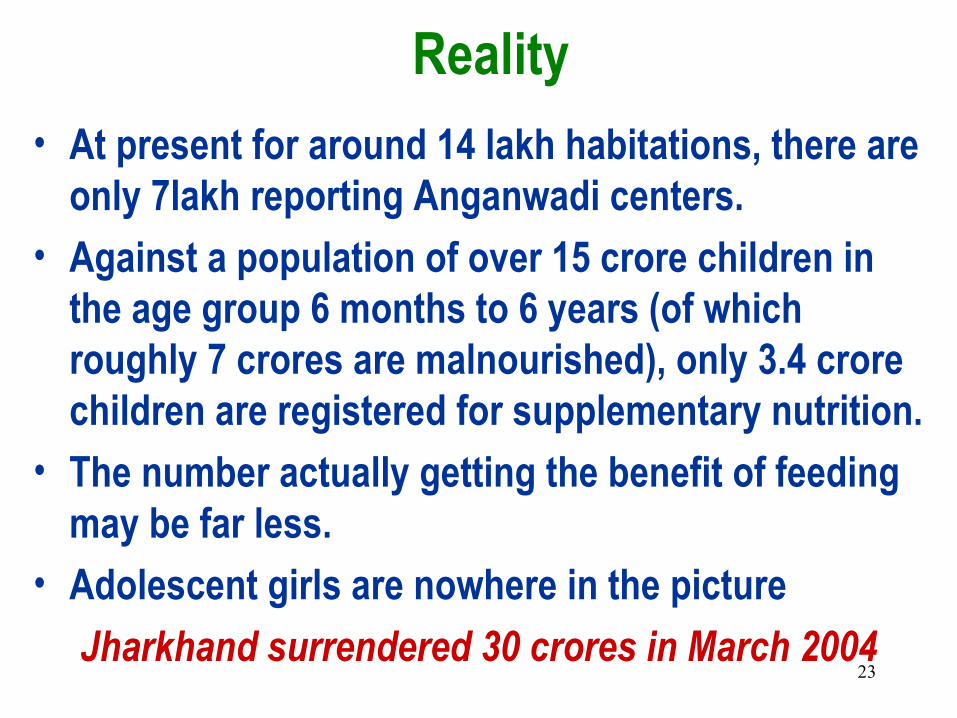
23
Reality• At present for around 14 lakh habitations, there are
only 7lakh reporting Anganwadi centers. • Against a population of over 15 crore children in
the age group 6 months to 6 years (of which roughly 7 crores are malnourished), only 3.4 crore children are registered for supplementary nutrition.
• The number actually getting the benefit of feeding may be far less.
• Adolescent girls are nowhere in the picture
Jharkhand surrendered 30 crores in March 2004

24
ICDS Enrolment & SNP distribution in WB 2004-05
0
500000
1000000
1500000
2000000
2500000
3000000
3500000 A
PR '0
4
MA
Y'04
JUNE
'04
JUL'0
4
AUG
'04
SEP
'04
OCT
'04
NOV
'04
DEC
'04
JAN'
05
FEB'
05
MAR
'05
3-6 population
enrolment
received SNP for 15 days ormore

25
Number of SNP beneficiaries for each month 2004-05 in lakhs
20
30
40
50
60
70
80
90
April
May
June
July
Augu
st
Sept
embe
r
Oct
ober
Nove
mbe
r
Dece
mbe
r
Janu
ary
Febr
uary
Mar
ch
EIigibleEnrolledReceived > 15 days

26
Other issues
• Two-thirds of all centres are running in rented buildings, which are invariably in upper caste locality, thus favouring their children, to the neglect of lower caste children
• 40% vacancies at the supervisor level, though budget is from GOI
• Little attention to 6 months to 3 years, which is the most crucial period
27
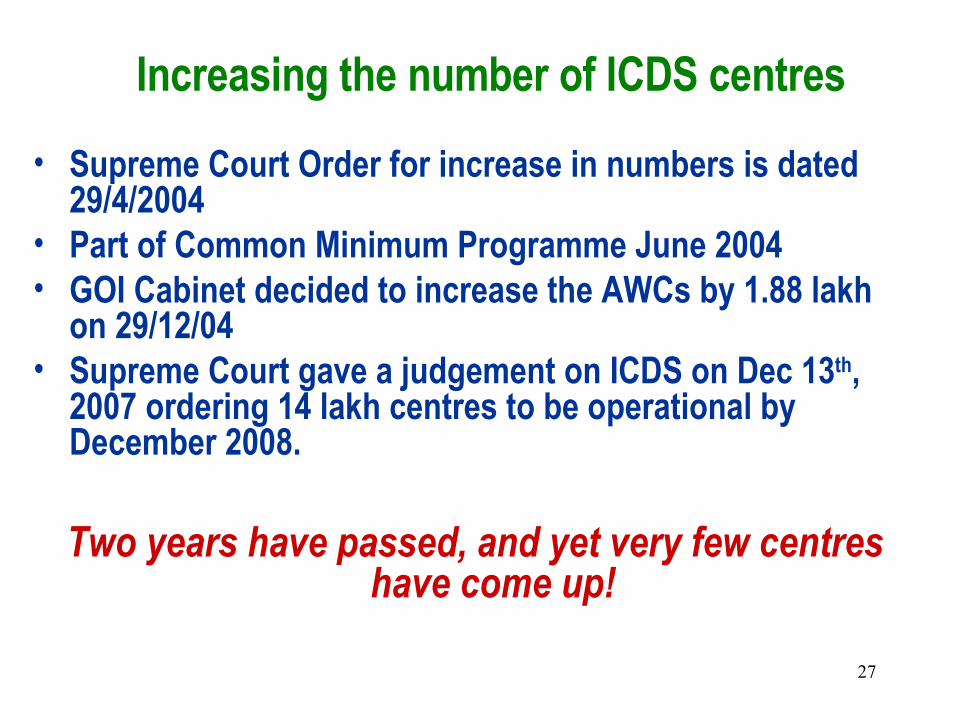
Increasing the number of ICDS centres
• Supreme Court Order for increase in numbers is dated 29/4/2004
• Part of Common Minimum Programme June 2004• GOI Cabinet decided to increase the AWCs by 1.88 lakh
on 29/12/04• Supreme Court gave a judgement on ICDS on Dec 13th,
2007 ordering 14 lakh centres to be operational by December 2008.
Two years have passed, and yet very few centres have come up!
28
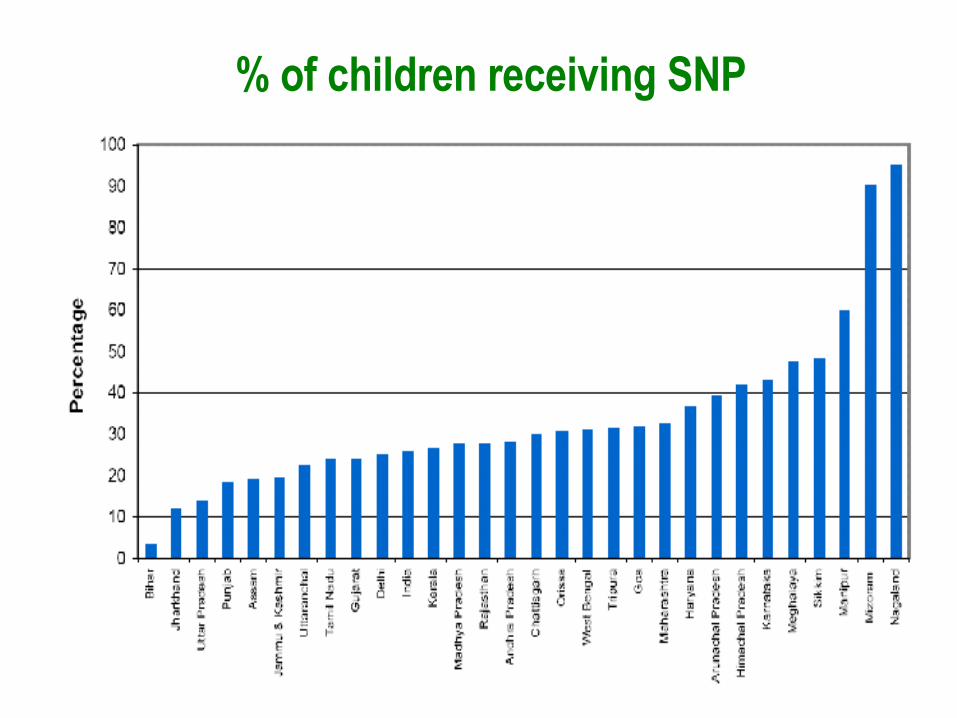
% of children receiving SNP

29
National Social Assistance Programmes• NOAPS and NFBS transferred to the states• Funds cut down to less than 50% of requirement• State finance deptts do not release funds to districts• Little monitoring by the states or GOI• Payment is adhoc, uncertain, and subject to bribes• NMBS fund utilisation is not even 1/3rd of requirement• Scale of pension (Rs 75 pm) revised to Rs 200, but no
releases so far• Numerical ceiling not revised sine 1996• Annapurna has been wound up in some states
Schemes have suffered as there are no contractors!
30
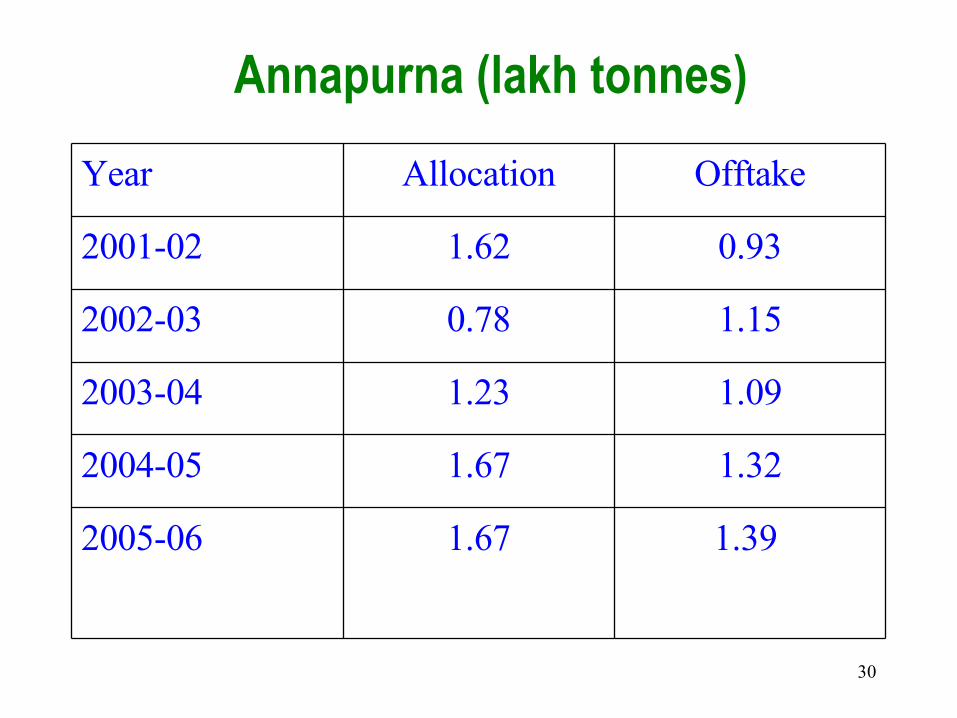
Annapurna (lakh tonnes)
1.39 1.672005-06
1.321.672004-05
1.091.232003-04
1.150.782002-03
0.931.622001-02
OfftakeAllocationYear

31
Mid day meal scheme
• Fully Implemented – Gujarat, AP, Kerala, Pondicherry, Tamil Nadu, Karnataka, Lakhshdeep, Rajasthan, Chattisgarh
• Partially Implemented –, Delhi, Maharashtra, Orissa, Punjab, Goa, MP, Bihar, Jharkhand, West Bengal, UP, Haryana
• Not Implemented – Assam, ManipurOnly 3 out of 51 schools surveyed in Bihar were
running the scheme

32

33
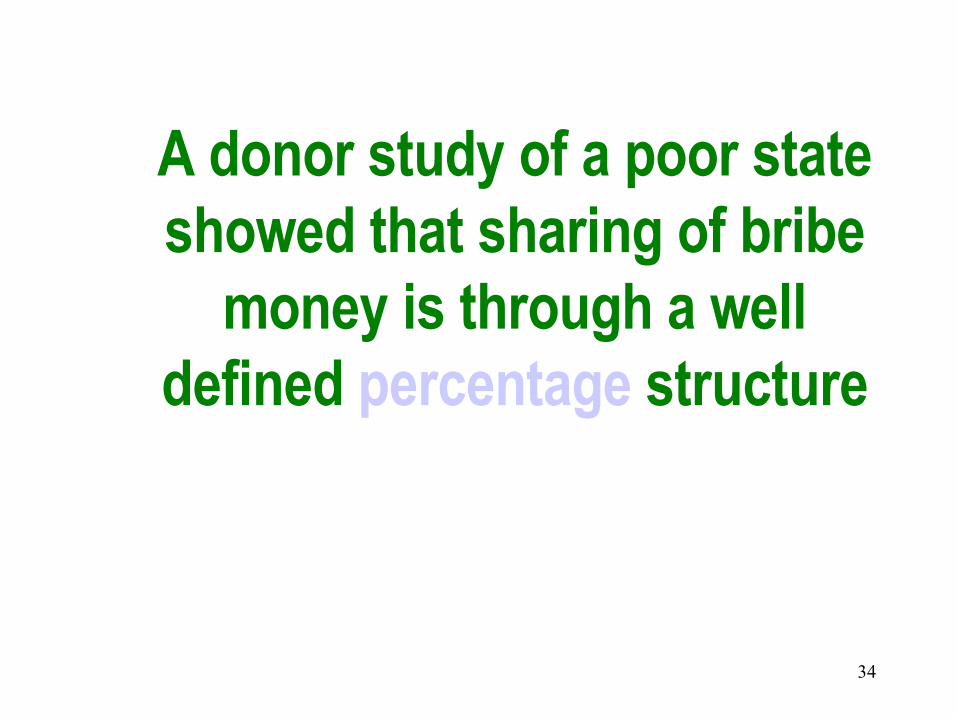
34
A donor study of a poor state showed that sharing of bribe
money is through a well defined percentage structure

35
Leakages – SGRY Orissa
22.05%14.90%
9.83%
53.22% Leakage in Wage Component
Wage Component reaching Beneficiaries
Material Costs Estimated to be Used in Construction
Material Costs Estimated to Not Have Been Used in Construction
Approximate Aggregate Leakage = 32 % of Aggregate Expenditure in Sub-project Register

36
The Right to Food Case
• PUCL petition on hunger in Rajasthan in the Supreme Court in 2001
• Emergence of the Right to Food Campaign• Key Issues:
– Making the Right to Food a Fundamental Right– Converting all existing schemes into entitlements– Tackling large scale malnutrition and chronic hunger– Securing employment as a fundamental right linked to the Right to
Food
• Longest mandamus on the Right to Food in the World– 47 Interim Orders so far; more than 300 affidavits; nearly 50
Interim Applications

37
Office of the Commissioners to the Supreme Court (Writ 196/ 2001)
• Appointed by the Supreme Court to monitor all food schemes in the Country
• Mandate extends to:– Feeding Entitlement Programmes
• MDMS, ICDS
– Employment Programmes• NREGS, SGRY I & II, NFFWP, RSVY
– Food Subsidy Programme• TPDS, Antodaya Anna Yojana (AAY), Annapurna Yojana
– Social Security Programmes• Pensions (NOAPS, NMBS, NFBS)
38
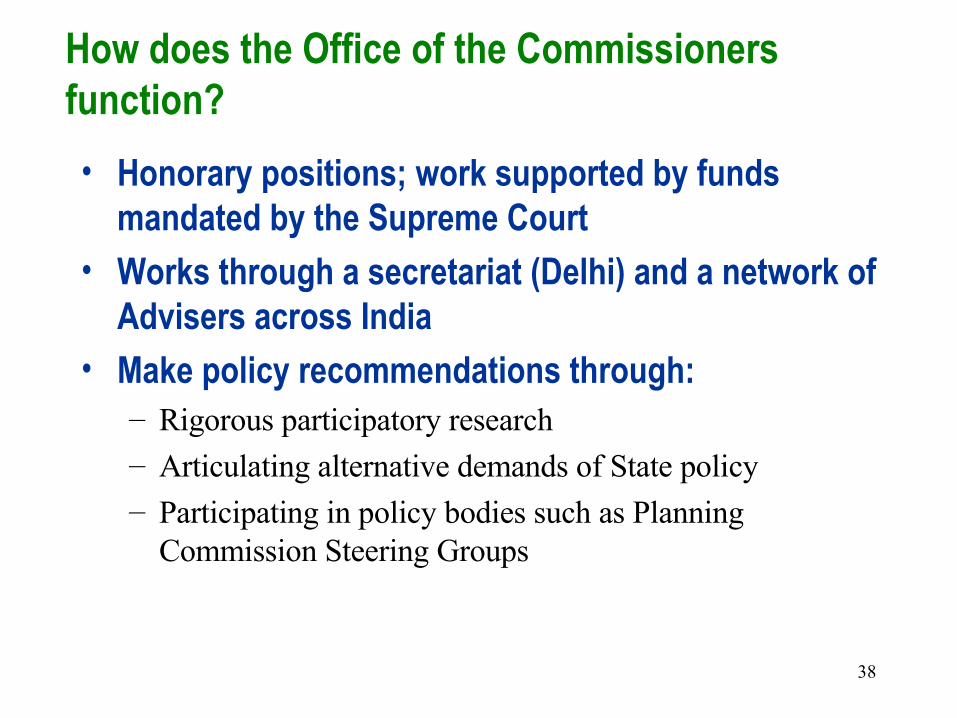
How does the Office of the Commissioners function?
• Honorary positions; work supported by funds mandated by the Supreme Court
• Works through a secretariat (Delhi) and a network of Advisers across India
• Make policy recommendations through:– Rigorous participatory research– Articulating alternative demands of State policy– Participating in policy bodies such as Planning
Commission Steering Groups
39
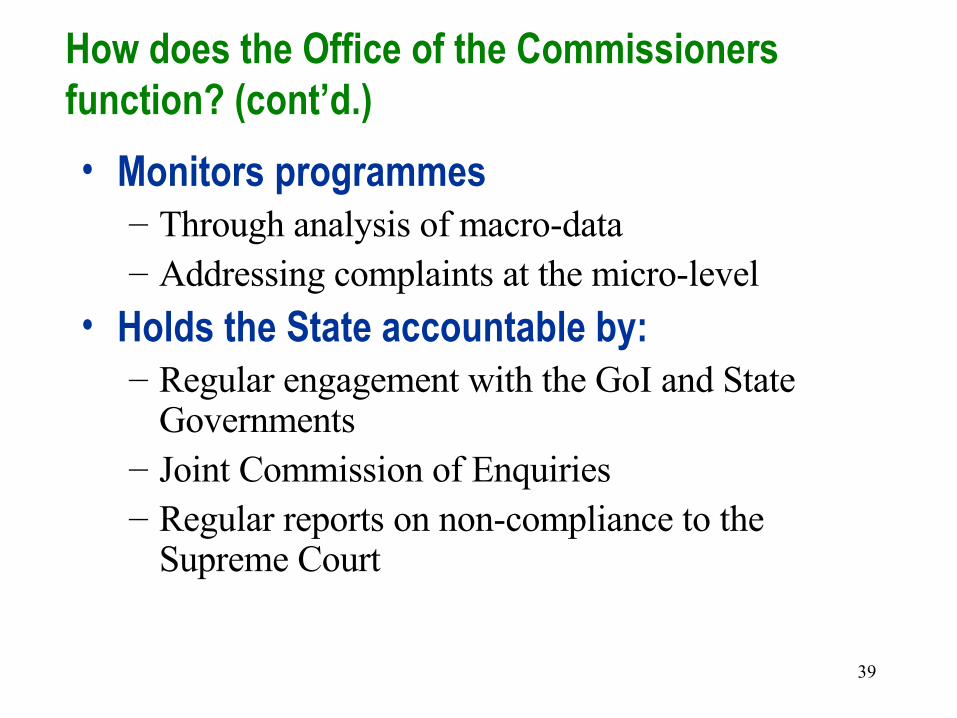
How does the Office of the Commissioners function? (cont’d.)
• Monitors programmes– Through analysis of macro-data– Addressing complaints at the micro-level
• Holds the State accountable by:– Regular engagement with the GoI and State
Governments– Joint Commission of Enquiries– Regular reports on non-compliance to the
Supreme Court

40
Impact so far
• Universalisation of MDMS (12 crore children get school meals) and ICDS (GoI to increase at least 7 lakh ICDS Centres)
• Managed to restrict the lowering of BPL quotas by GoI from 36% to 26%
• Increase in off-take of food-grains through TPDS for BPL and Antodaya families
• Increased budgetary allocation for ICDS, NOAPS• Sector Reforms in some States (PDS –
Chhattisgarh, Maharashtra)

41
Impact so far (cont’d.)
• Provided Civil Society an anchor to engage/ confront the State and created spaces for civil society to engage in food/ employment programmes
• Brought the discourse on food rights to the centre-stage of governance in the States and GoI
• Has been largely effective in provision of gratuitous relief (WB tea gardens, Assam SGRY misappropriation of funds, Chhattisgarh - MDMS)
• Created the environment for the passage of the National Rural Employment Guarantee Act