bird deterrent markings on transparent noise barrier panels
TRANSCRIPT

Bird Deterrent Markings on Transparent Noise Barrier Panels
Nathan Binette
July 21, 2008

Date | Title of Presentation Page | 2
1. Why is it necessary?
2. History – 2004 & 2005 Tests of Visual Markings1
3. 2006 Test Improvements & Results2
4. Conclusions

Date | Title of Presentation Page | 3
Why is it necessary?
Increased use of transparent elements in buildings, fencing, and noise barriers are developments that create opportunities for bird mortality because:
Birds cannot percieve reflected images as reflections and will fly into transparent barriers they think are trees or sky.
Birds (like humans) cannot percieve clear objects as a solid objects. As a result, birds will strike transparent barriers while attempting to reach areas seen through or objects reflected in the barrier.

Date | Title of Presentation Page | 4
History – 2004 & 2005 Tests of Visual Markings
In 2004, the Hohenau-Ringelsdorf Biological Station was commissioned to design a test series to compare tests on the effectiveness of markings on glass for the purpose of preventing bird collisions.
For the purpose of the tests, a tunnel was constructed to offer birds a choice of flight to an unmarked transparent panel or a marked transparent panel.
In all tests a fine net (Japan Net) was employed to catch the birds prior to collision to prevent injury.
In 2004, 536 test flights were conducted to test six markings against unmarked panels.
An additional 198 tests were then conducted to test the 10V marking against other marked panels.
In 2005, 975 test flights were conducted to test eight new marking types. One type (10v) was repeated as a reference marking to allow comparison of the two test years.

Date | Title of Presentation Page | 5
2004 Markings
Coral 1.3V (1.3cm strips, 1.3cm apart) 10V (2cm strips, 10cm apart)
(13% coverage) (50% coverage) (16.7% coverage)
15V (2cm strips, 15cm apart) 10H (2cm strips, 10cm apart) Raster (1mm strips, 12mm apart)
(16.7% coverage) (16.7% coverage) (16% coverage)

Date | Title of Presentation Page | 6
2005 Markings
Small Circles Small Squares Large Circles Large Squares Pattern 10/20 GSCC Filaments
18mm dia 16mm edges 56mm dia 50mm edges 2cm wide strips 2mm wide strips
(25% coverage) (25% coverage) (24.2% coverage) (6.7% coverage)
Sky Walk 1 Sky Walk 2
(~27% coverage) (~27% coverage)
Date | Title of Presentation Page | 7
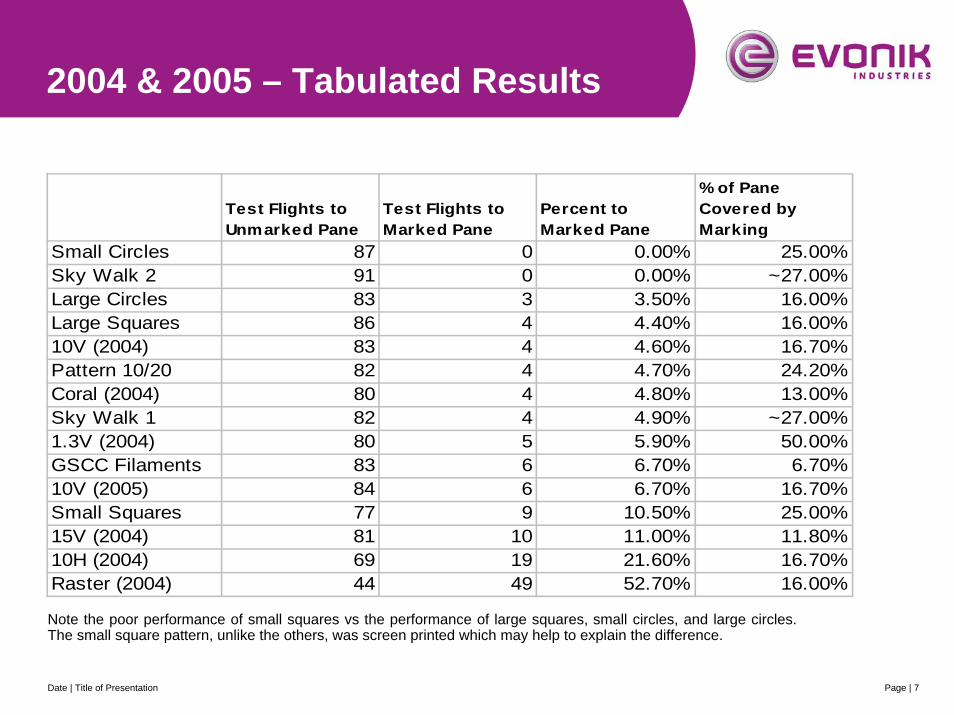
2004 & 2005 – Tabulated Results
Note the poor performance of small squares vs the performance of large squares, small circles, and large circles. The small square pattern, unlike the others, was screen printed which may help to explain the difference.
Test Flights to Unmarked Pane
Test Flights to Marked Pane
Percent to Marked Pane
% of Pane Covered by Marking
Small Circles 87 0 0.00% 25.00%Sky Walk 2 91 0 0.00% ~27.00%Large Circles 83 3 3.50% 16.00%Large Squares 86 4 4.40% 16.00%10V (2004) 83 4 4.60% 16.70%Pattern 10/20 82 4 4.70% 24.20%Coral (2004) 80 4 4.80% 13.00%Sky Walk 1 82 4 4.90% ~27.00%1.3V (2004) 80 5 5.90% 50.00%GSCC Filaments 83 6 6.70% 6.70%10V (2005) 84 6 6.70% 16.70%Small Squares 77 9 10.50% 25.00%15V (2004) 81 10 11.00% 11.80%10H (2004) 69 19 21.60% 16.70%Raster (2004) 44 49 52.70% 16.00%

Date | Title of Presentation Page | 8
2004/2005 Tests Summary
Summary of Tests:•Most tested patterns performed well. The notable exception is the raster pattern.
•Pattern “10V” produced comparable results in years 2004 and 2005.
•Pattern “GSCC filaments” proved effective despite having the lowest degree of marking at just 6.7%.
What is next?2004 / 2005 tests focused on effectiveness of marking shapes and spacings. It is time to check these results using conditions resembling real world conditions.

Date | Title of Presentation Page | 9
2006 Test Improvements
Focus – Attain more natural test conditionsThe first flight tunnel neglected the unnaturally high contrast between the dark test tunnel and the bright daylight background behind the panels.
This contrast is believed to be an important factor. It is expected that high contrast between a glass surface and the natural habitat leads to a lower collision risk.
Improvements to test:The next flight tunnel thus moves the panels, which were inside the tunnel in the 2004 & 2005 tests, out of the end of the tunnel to reduce the contrast. The new tunnel also can be rotated to follow the path of the sun. Further, a sun shield above the tunnel chamber guarantees that direct sunlight reaches the panels exclusively via mirrors and prevents shadows from being cast on the markings.
Panes were placed to adequately dominate the birds’ field of vision.
Mirrors utilized reflect a broad spectrum of light including light in the UV range.
Light conditions were monitored using pyranometers for later analysis of results.

Date | Title of Presentation Page | 10
2006 Test Improvements
Focus – Test FlexibilityWith the first test flight tunnel it was not possible to test flight to an unmarked pane versus flight to an empty pane area because the test panes sealed the tunnel at the front end. Removing one pane resulted in discontinuities to the acoustics and the airflow and had an adverse effect on the test.
Improvements to test:The next flight tunnel made testing panes against an open space possible since there is 30 cm of free airspace between the panes and the tunnel. Tests were performed in the same manner as tests against unmarked panes except the holder remained empty in random order to the left or right.
Flights were randomly distributed with a proportion of 52.8% to 47.2% (38 flights to the pane; 34 flights to the “air”).
Date | Title of Presentation Page | 11
2006 Test Improvements
Focus – Investigate reduction in marking coverageDetermine if reduced coverage area, versus previously tested patterns, will yield effective bird deterring results.
Improvements to test:2006 tests introduce 4 new markings and retest four previous markings.

Date | Title of Presentation Page | 12
2006 Tests Summary
Summary of Tests:•A total of 1025 tests were conducted.
•159 test flights were deemed invalid
•71 tests flights were made to ensure there was no left or right bias
•140 test flights were utilized to ensure the tests were not influenced by the material, unmarked panel vs empty space.
•655 test flights using the eight patterns (seen on next slide) were valid.

Date | Title of Presentation Page | 13
2006 Markings
10H (repeat, 2004) 10V (repeat, 2004 & 2005) 10V black / white 10V/5 black
16.7% coverage 16.7% coverage 16.7% coverage 4.8% coverage
10V/5 white 15V (repeat, 2004) GSCC filaments (repeat, 2005) Dots
4.8% coverage 11.8% coverage 6.7% coverage 4.8% coverage

Date | Title of Presentation Page | 14
2006 Results, Bar Graph
(A) is significantly better than the average; (C) are significantly worse than the average.

Date | Title of Presentation Page | 15
2006 Test Results, Summary
Summary of Tests:• Where the subject could choose a marked pane or an
unmarked pane, 14.5% of flights were to marked panes.
• All marked panes tested in 2006 are effective.
• The “GSCC filaments” proved significantly better than the average of all effective markings
• residual analysis resadst = 2.1, p<0.05
• The “GSCC filaments” is the only marking that had a result of less than 10% mistakes.
• Markings “10h” and “15v” (group C) turned out to be significantly poorer than the average
• residual analysis resadst = -2.3, p<0.05.

Date | Title of Presentation Page | 16
2006 Results, Lighting Impact
Lighting conditions were broken down into 3 categories:
Low light < 60 Wm-2
Medium light 60 – 120 Wm-2
High light > 120 Wm-2
The residual analysis indicated significantly poorer results with weak light (adjusted, standardised residues resadst = -2.5, p < 0.01) and significantly better results with medium light (resadst = 3.3, p < 0.001).
Marking Wm-2
<60 <120 >120n %
Mistakesn %
Mistakesn %
Mistakes10 h 30 20 31 22.6 16 2510 v 34 14.7 24 4.2 22 18.210 v s/w 14 35.7 35 8.6 37 13.510 v // 5 s 42 14.3 22 4.5 21 1910 v // 5 w 32 15.6 24 4.2 23 21.7
15 v 27 22.2 33 12.1 22 22.7GSCC filaments
21 14.3 30 6.7 34 2.9
Dots 14 35.7 46 4.3 21 23.8
Background Light Intensity
The higher values of “mistakes” at both low and high lighting conditions show that, on the average, the effectiveness of the tested markings is more strongly dependent on the light conditions in the background of the pane than on the nature of the markings being tested.
It is noted that the GSCC filaments marking had consistently low mistakes, particularly in high light conditions.

Date | Title of Presentation Page | 17
Conclusions
With random sampling sizes of 80 – 90 tests, it is possible to differentiate between “effective markings”.
Light conditions have a significant impact on mistakes. The GSCC filaments marking is a leader in each light category and shows particular benefit in high light conditions
The GSCC filaments marking achieved significantly higher effectiveness than the average of the effective markings. The study authors note:
“everything speaks in favour of very good compatibility of this pane (GSCC filaments) with the goal of preventing bird collisions.”
and
“GSCC filaments can be recommended unconditionally for the reduction of bird collisions.”

Date | Title of Presentation Page | 18
Literature Cited
1 2004 and 2005 editions of study entitled “PREVENTION OF BIRD COLLISION WITH GLASS SURFACES” authored by Martin Rössler and Thomas Zuna-Kratky of the Hohenau-Ringelsdorf Biological Station
2 2006 edition of study entitled “PREVENTION OF BIRD COLLISION WITH GLASS SURFACES” authored by:
a) Martin Rössler of the Hohenau-Ringelsdorf Biological Station;
b) Wolfgang Laube; and Philipp Weihs of the University of Natural Resources, Institute of Meteorology
