bird river recreation capacity studybirdrivercoa.com/notes/birdriverstudy-draftonly_2.pdfbird river...
TRANSCRIPT
Bird River Recreation Capacity Study
Lombard North Group
1

Bird River Recreation Capacity Study
Lombard North Group
2
BIRD RIVER RECREATION CAPACITY STUDY
Prepared for the RM of Alexander
by Lombard North Group (1984) Ltd.
October 12, 2007

Bird River Recreation Capacity Study
Lombard North Group
3
Table of Contents
Page No 1.0 EXECUTIVE SUMMARY……...……………………………………………. 5
2.0 INTRODUCTION………………………………………………………………. 7
2.1 STUDY AREA…………………………………………………………………………………………….. 7 2.2 BACKGROUND TO THE STUDY……..…………………………………………………………….. 9 2.3 METHODOLOGY……………………………..…………………………………………………………. 10 2.3.1 Methodological Approach……………………………………………………………………….. 10 2.4 STUDY LIMITATIONS………..………………………………………………………………............... 12
3.0 BACKGROUND INFORMATION……………………………………….. 13 3.1 BIO-PHYSICAL FEATURES………………………………………………………………………….. 13 3.1.1 Soil Types………………………………………………………………………………………. 13 3.1.2 Land Use………………………………………………………………………………………... 16 3.1.3 Percentage of Slope……………………………………………………………………........ 21
3.1.4 Drainage Levels………………………………………………………………………………. 23 3.1.5 Erosion Levels………………………………………………………………………………… 25 3.2 DIGITIZED DATA: Field Study Observations…………………………………………………... 27
4.0 CARRYING CAPACITY ANALYSIS…………………………………… 33 4.1 PHYSICAL FEATURES ……………………………………………………………………………….. 33 4.1.1 Topography……………………………………………………………………………………. 33 4.1.2 Vegetation ………………………………………………………………………..................... 34 4.1.3 Surface Water…………………………………………………………………………………. 37
4.1.4 Water Quality Test Results………………………………………………………………... 37 4.1.5 Groundwater ………………………………………………………………………………….. 41 4.1.6 Physical Limitations to Development………………………………………………….. 43 4.1.7 Options for Development………………………………………………………………….. 45 4.2 MAN-MADE FEATURES………………………………………………………………………………. 48 4.2.1 Seasonal Resort Use………………………………………………………………………... 48 4.2.2 Boating………………………………………………………………………………………….. 53 4.2.3 Other Recreation Activities……………………………………………………………….. 57 4.2.4 Public Services: Landfill…………………………………………………………………… 57 4.3 LOCAL RESIDENT CONCERNS……………………………………………………………………. 59
5.0 FINDINGS……………….……………………………………………………….. 56
5.1 BACKSHORE CAPABILITY FOR RECREATIONAL DEVELOPMENT………….………… 61 5.2 SURFACE WATER RECREATIONAL CAPACITY………………………….………………….. 61
5.3 EXISTING DEVELOPMENT ISSUES………………………………………….……………………. 62
6.0 APPENDICES……………………………………….…………………………. 64
7.0 REFERENCES…………………………………….…………………………… 70

Bird River Recreation Capacity Study
Lombard North Group
4
LIST OF MAPS
Page No Map 1: Bird River Study Area……………………………………………………………………………….. 8 Map 2: Soil Types…………………………………………………………………………...………………….. 15 Map 3: Landuse………………………...……………………………………………………………………….. 20 Map 4: Percentage of Slope…………………………………………………………………………………. 22 Map 5: Drainage Levels……………………………………………………………………………………….. 24 Map 6: Areas Susceptible to Water Erosion……………………………..…………………………….. 26 Map 7A: 30m, 50m & 90m Active Boating Separation Distances………………………………... 30 Map 7B: 5 Acre Active Boating Buffers………………………………………………………………….. 31 Map 7C: Float Plane Alighting Areas…………….……………………………………………………….. 32 Map 8: Water Sample Locations………………………………………………………………………….. 42 Map 9: Physical Limitations to Development………………………………………………………….. 44 Map 10: Suitable Areas for Future Development……………………………………………………... 47 Map 11: Estimated Age of Construction………………………………………………………………… 51 Map 12: Seasonal Residential Unit Density…………………………………………………………….. 52 Map 13: Boats Counted from Water………………………………………………………………………. 56
LIST OF APPENDICIES
Page No
Appendix 1: Bird River Boater Survey………..………………………………………………………….. 64 Appendix 2: Water Quality Test Results……..………………………………………………………….. 66 Appendix 3: Total Number of Approved Lots Since 1991………………………………………….. 67 Appendix 4: Counted Boats (2007)…………….………………………………………………………….. 68 Appendix 5: Estimated Speed of Traveling Boats (2007)………………………………………….. 69

Bird River Recreation Capacity Study
Lombard North Group
5
1.0 EXECUTIVE SUMMARY The Bird River lies on the fringe of the Canadian Shield very close to the border between Manitoba and Ontario and flows west into Lac du Bonnet. The river’s boating surface area is however limited between its mouth at Lac du Bonnet and rapids up-stream to only 288.59 acres. Including all bays and inlets the navigable length of the Bird River is restricted to 7.8 km. The river ranges in width from approximately 54 meters (179 feet) its narrowest at the PR 315 bridge crossing to approximately, 231 meters (761 feet) its widest at the mouth of the river. The average width of the Bird River is approximately 135 meters (441 feet). The river with its mix of amenities including access to boating water body and natural setting has been sought after by many recreational enthusiasts and represents an attractive location for seasonal cottages and camps. The Bird River’s recreational potential was first assessed in 1977 by Westland Planning Consultants. The 1977 study indicated the density of seasonal resort use along the navigable shoreline of the Bird River placed substantive boater demand upon the waterway, observing the navigable portion of the Bird River water area was approaching its recreation carrying capacity. Interviews with seasonal residents at that time identified concern over the levels of development and boating traffic. The 1977 study observed use of the river was at its limits and interviewees did not favor additional shoreline development along the Bird River that would add to boater traffic. The 1977 study identified 118 seasonal homes and cottages, 150 permanent trailer sites and 50 occasional (campground) trailer sites located along the riverbank’s 7.8 km length. In excess of 250 power boats were counted within the study area on an August weekend in 1977. The 1977 study suggested two related planning strategies to reduce seasonal resort land use impacts upon the river: Option #1: develop alternatives to river oriented recreation in the form of back shore recreation facilities such as trails and land based recreation facilities; and Option #2: encourage the reduction of river oriented recreation sites by attrition where higher density seasonal or temporary campsite and trailer sites are replaced with lower density seasonal resort use through re-zoning and subdivision approval processes. At the time of the 1977 Study the Alexander was a Local Government District administer by the Province of Manitoba and did not have the zoning or planning authority of a municipality. Amendments to the Municipal Act later converted the
Bird River Recreation Capacity Study
Lombard North Group
6
LGD of Alexander into a Municipality and provided more control over the development approval process. In 1995 Council of the Municipality of Alexander initiated a river water sampling study to establish base line information on water quality which corresponded to current levels of recreation use. The water quality data compiled compared river water quality to Manitoba Stewardship Water Quality Objectives. The observations made in the 1977 Recreation Study together with the 1995 Water Quality Study provide valuable baseline data which allows us to compare changes in the river’s water quality and use in the past with use today and assess how the changes under the current development controls have impacted the river and shoreline for recreational use. In August 2007 Lombard North Group (1984) Ltd. initiated a two day field survey of the current recreational use of the river and duplicated the water quality tests. Over 250 boats were identified within the Bird River seasonal resort study area in August, 2007. Since 1977 continued recreation emphasis on water oriented seasonal resort use has maintained the Bird River boating use at a level beyond its peak capacity for recreational water use. Applying waterway boating capacity standards used in Canada as well as by Manitoba Parks Branch suggests the maximum power boat carrying capacity of the Bird River is 50 motor boats. Shoreline development has not abated and the existing over-capacity conditions identified in 1977 continue to be present today. There has also been in dramatic change in boating types. Thirty years ago jet skis did not exist, pontoon boats were not common recreational craft and the average family boat’s horsepower ratings where substantially lower than present day. Not withstanding the continued high use of the River, water quality tests conducted in August 2007, suggest water quality has been maintained and not deteriorated since the 1995 tests were recorded12 years ago.

Bird River Recreation Capacity Study
Lombard North Group
7
2.0 INTRODUCTION 2.1 STUDY AREA The Bird River Recreation Assessment study area boundaries are identified on Map 1: Bird River Study Area and are generally described as that area of the Bird River from Lac du Bonnet (Winnipeg River) in the west then east 7.8 km to the Bird River’s first falls/ rapids located 2 km east of the PR 325 Bridge. For the purpose of this study we define the “navigable” water area of the Bird River as the Bird River’s total surface area minus a shoreline safety and shallow water buffer of 7.62 meters (25 feet) from shoreline edges including reeds, docks and roped off swimming areas. For greater certainty the Study Area is defined legally as:
-To the north: bounded by the northern extent of the following quarter sections: NW 8-17-14E, NE 7-17-14E, NW 7-17-14E, NE 12-17-13E, NW 12-17-13E, NE 11-17-13E, NW 11-17-13E, SE 1-17- 13E, SW 1-17-13E, SE 9-17-13E, SW 9-17-13E, SE 8-17-13E and SW 8-17-13E
- To the east: bounded by the eastern extent of the following quarter sections: NW 5-17-14E, SW 8-17-14E and NW 8-17-14E.
- To the south: bounded by the southern extent of NE 32-16-13E and NW 33-16-13E (up to where it intersects with PR 315). The boundary then follows the path along the edge of PR 315 up to the intersection of NW 2-17-12E and NE 2-17-12E. From here the southern extent of the study area is bounded by the southern extent of the following quarter sections: NW 1-17-12E, NE 1-17-12E, NW 6-17-14E, NE 6-17-14E and NW 5-17-14E.
- To the west: The boundary is the mouth of the Bird River entering Lac Du Bonnet. The boundary extends through the following quarter sections: SW 8-17-13E. NW 5-17-13E; SW 5-17-13E; and NE 32-16-13E.

Bird River Recreation Capacity Study
Lombard North Group
8
Map 1: Bird River Study Area

Bird River Recreation Capacity Study
Lombard North Group
9
2.2 BACKGROUND TO THE STUDY The Bird River offers a number of recreational attributes sought by people such as Canadian Shield terrain, ample tree cover, accessibility to excellent fishing waters; proximity to metropolitan areas and sheltered boating waters, together these amenities make the Bird River a desired recreation destination. The growing demand for seasonal home sites in Manitoba, combined with Lac du Bonnet and the Bird River close proximity to Winnipeg (less than two hours away on paved highway) has resulted in increased pressures for the subdivision of remaining undeveloped waterfront lands in the area. In response to the 1977 Bird River Study the Local Government of Alexander encouraged through the development process reduction in development densities to assist relieve the pressures for development and the limitations of the physical resource base. The 1977 study indicated that the Bird River study area contained 118 seasonal homes/ cottages, 150 permanent trailer sites and 50 occasional (campground) trailer sites for a total of 318 seasonal resort units within the entire Bird River study area. In 2007, the study team recorded a total of 259 shoreline residences, including seasonal homes/ cottages and permanent trailer sites. Since 1977, several of the permanent trailer sites and the entire campground trailer site have been converted to permanent seasonal resort residential units at a lower density. 2001 data from the Manitoba Land Initiative (MLI) suggests that a total of 397 homes and cottages are located within the entire study area. Therefore, the net development difference between the observed total number of units within the study area in 1977 and 2007 has increased by 79 units. This would suggest that since 1977, 79 seasonal residential units have been added to the Bird River study area along with the conversion of higher density trailer sites to lower density development. Section 4.2.7(4) of the Winnipeg River Development Plan (1992) limits new recreational subdivisions along the Bird River to a maximum of 50 units. Once the 50 units limit has been achieved no further subdivision will be permitted until a Recreational Capacity Study for the Bird River indicates that further development is warranted. Since adoption of the Plan 36 lots have been approved with 1 lot pending approval. It should be noted that if the Government of Manitoba Community Planning Services is of the opinion that Pioneer was a trailer park it would not be included in the figures and would decrease the number of lots approved since 1991 to 24. For more information, please refer to Appendix 3: Total Number of Approved Lots Since 1991. The 1971 Alexander District Development Planning Scheme identified the Bird River as requiring a comprehensive sector plan prior to further development. This study fulfills the Sector Plan initiative of the District Development Plan.
Bird River Recreation Capacity Study
Lombard North Group
10
2.3 METHODOLOGY A) Scope of Study: In a broad sense, the focus of this study was to describe the current conditions within the Bird River by answering the question “where we are now?” To answer this question the Study Team examined how people today use the river and its shoreline area, how has current use changed since 1977, assessed the River’s present water quality and noted the changes which occurred in recorded water quality indicators since 1995? This report assesses the resource characteristics and the changes in the use of Bird River study area since 1977. It is intended to be a point of departure for the Study Team to engage Council, the District Board and the area’s stakeholders in the validate recreation quality and shoreline development wants, objectives as well as their relative importance to one another and answer the question “what do we want?”. Phase #2 of the Study is intended to provide specific policy and implementation suggestions to guide future development of the Bird River. Phase #2 of the Study with Council, District Board and local stakeholder input will articulate the future vision for the Bird River as a recreation area and identify “how we can get there!” by balancing use with the protection of the recreational values which attracted people in the first place. B) General Approach Summary: The approach used by Lombard North Group to complete Phase#1 The Bird River Recreation Capacity Assessment is summarized below. This study assesses the area’s surface water recreation capability and the study area’s bio-physical characteristics to determine future suitability for development. This study provides updated findings that are compared with the 1977 Bird River Sector Plan Study as well as the 1995 Water Quality Sampling Study for the Bird River, which where undertaken employing similar approaches and methodologies. Data sources describing the bio-physical environment where derived from the Manitoba Land Initiative (MLI). This data was used as part of a mapping overlay and site specific Geographic Information System (GIS) analysis for the study area.
2.3.1 Methodological Approach Understanding the dynamics of the recreation use of the Bird River requires we view the river from both a regional and local geographic context. Understanding the study area’s current use requires us to consider both local as well as regional forces which influence demands for recreation use and may impact the character of the study area. Modern GIS mapping data has enabled us to update four variables:
Bird River Recreation Capacity Study
Lombard North Group
11
1. Spatial Capacity Through on -site field verification and GIS analysis, the spatial capacity of the area was qualified. Land use features, total number of seasonal residential units and total number (and type) of watercraft were recorded and used to assess the spatial capacity and watercraft demands placed upon the river. The speed of moving boats and location was estimated and recorded using GPS which was transferred into a GIS mapping layer. Field study observations and valuable information obtained from respondents were used to assess the nature and extent of current usage of the Bird River shoreline.
2. Social Capacity
A Bird River “boater survey” was conducted during the field study. Boaters and residents were asked what their primary recreation uses on the Bird River were; how many boats they observe on a typical weekend day; and to comment on the changes they had seen in the area over the years. A complete list of the survey questions, are contained in Appendix 1: Bird River Boater Survey. The respondents’ perceptions of the Bird River’s recreation experience and future planning needs were recorded and as well as suggestions received for consideration in Phase #2 of the study where we address the vision and policy recommendations for the Bird River.
3. Municipal Infrastructure Capacity
The infrastructure capacity to serve the Bird River study area and implications for development have been assessed including implications for waste disposal facilities and road infrastructure.
4. Ecological Capacity
Ecological capacity was assessed based upon field verification, GIS land resource analysis and observations derived from survey interviews. Soil erosion, land use/vegetation types, drainage levels and percentage of slope were all used in assessing the ecological capacity of the Bird River study area.
Water samples were taken during the field study from four sample sites to record the water quality of the Bird River. The number of test sites and water quality variables tested in the August 2007 water quality study were similar to the number of test sites and water quality variables tested in the 1995 Study. Unfortunately the sample site locations were not available from the information the Study Team received when provide the 1995 test results. The August 2007 Study included sterile sample bottles sealed the lab to ensure no cross contamination was possible that might impact recorded data. Water was manually pumped in to the sample bottles at a depth of three feet from the surface while wearing sterile gloves. The samples were kept on ice and transported to ALS Laboratories within hours of each sample. A GPS waypoint recorded the location of each sample site. These waypoints were
Bird River Recreation Capacity Study
Lombard North Group
12
transferred in to a GIS layer, where attribute data was attached to the geographic reference point.
2.4 STUDY LIMITATIONS
It is important to recognize the study’s constraints which should be taken into account when reviewing the findings. a) No other water quality information and studies were found for the study
area which could provide further reference data to compare current and 1995 water quality findings.
b) Public input by local residents was limited to less than ten recorded interviews with local residents met on the River during the field work.
c) The boater origin survey and total boat count was conducted August 1st and 2nd (the Wednesday and Thursday of the long weekend). By all reports, the total boat count derived would be dramatically higher on weekends.
d) The 1995 water study did not specify the methodology for sampling or sample sites. Therefore, the field study team could not duplicate the exact locations of the 1995 water study.

Bird River Recreation Capacity Study
Lombard North Group
13
3.0 BACKGROUND INFORMATION 3.1 BIO-PHYSICAL FEATURES
The following GIS maps describing the Study Area’s bio-physical features have been complied using existing GIS data from the MLI combined with field observations. The analysis of GIS mapping characteristics is presented in Chapter #4: Carrying Capacity Analysis.
3.1.1 Soil Types Map 2: Soil Types shows soil types for the Bird River study area, which have been assessed based upon surface texture standard USDA soil texture abbreviations (normally the first 15cm). The categories of soil characteristic of the Bird River Study Area include “clayey”, “coarse loamy”, “organic”, “unclassified” and “rock”.
Bird River Study Area Area
(acres) Percentage of the Bird River Study AreaClayey 4804.70 86.5 Coarse Loamy 567.13 10.2 Organic 31.26 0.6 Rock 146.75 2.6 Unclassified 8.17 0.1
One of the most significant soil properties is surface texture. Surface texture is directly associated with a number of other soil attributes, including soil permeability, soil structure, moisture holding capacity, susceptibility to erosion and ease of tillage. Specific crops and crop management techniques are directly affected by these attributes; therefore it is imperative that farmers be informed of the current and changing conditions related to surface texture.
Bird River Study Area Surface Texture
Surface Texture Area (acres) Percentage of Study Area
Loamy 52,640 90.7%
Sand 2,587 4.5%
A large majority of the Bird River study area is comprised of clay based soils (87%). Clay based soils also make up the entire shoreline, with the exception of one 72 acre area site immediately north of the bridge which is comprised of “coarse loamy” soil. Section 9-17-13E that falls within the study area is

Bird River Recreation Capacity Study
Lombard North Group
14
comprised of roughly an equal ratio of “clayey”, “rock” and “organic” soil types. Section 10-14-13E is comprised of mostly “coarse loamy” soils with a smaller percentage of “clayey” soils. South of the Bird River, within the study area is comprised of entirely “clayey” soils. North of the Bird River that falls within the study area, is comprised of a mixture of soil types. A large majority of these soils are “clayey”, however, there are small areas that are comprised of “organic”, “coarse loamy”, “organic” and/or “rock” soil types.

Bird River Recreation Capacity Study
Lombard North Group
15
Map 2: Soil Types

Bird River Recreation Capacity Study
Lombard North Group
16
3.1.2 Land Use Map 3: Landuse describes the principle natural surface characteristics of the land base. The characteristics defined are classified in eight categories as defined by the MLI (2003) land use classifications.
Bird River Study Area Area
(acres) Percentage of the Bird River Study
Area Bogs 47.57 0.9 Cultural 73.17 1.4 Grassland 226.59 4.3 Marsh 462.23 8.6 Mixed Forest 4231.46 77.2 Roads/Trails 128.72 2.5 Treed Rock 275.16 5.1
The definitions for each of the land uses are provided below:
1. Bogs (Treed and Open): Peat covered or peat filled depressions with a high water table. The bogs are covered with a carpet of Spagnum spp. and ericaceous shrubs and may be treeless or treed with black spruce (Picea mariana) and/or tamarack (Larix laricina).
2. Cultural Features: Built-up areas such as urban areas and towns, peat
farms, golf courses, cemeteries, shopping centres, large recreation sites, auto wreck yards, airports, cottage areas, race tracks.
Character of development located along the south shore of the Bird River

Bird River Recreation Capacity Study
Lombard North Group
17
3. Grassland/Rangeland: Mixed native and/or tame prairie grasses and herbs. May also include scattered stands of willow (Salix L.), choke cherry (Prunus virginiana), pin cherry (Prunus pensylvanica) and saskatoon (Amelanchier alnifolia). Many of these areas are used for cutting of hay and grazing. Both upland and lowland meadows fall into this class. There is normally less than 10% shrub or tree cover.
Grassland area along the south shore of the Bird River
4. Marsh: Wet areas with standing or slowly moving water. Vegetation
consists of grasses and/or sedge. Marshes will include common hydrophytic vegetation such as cattail and rushes. Fens will be formed on minerotrophic sites. Areas are frequently interspersed with channels or pools of open water.
Marsh area located in an inlet on the north side of the Bird River

Bird River Recreation Capacity Study
Lombard North Group
18
5. For the purpose of this study Mixed Forest includes the following land uses:
a. Deciduous Forest: 75% - 100% of the forest canopy is deciduous.
Dominant species include trembling aspen (Populus tremuloides), balsam poplar (Populus balsamifera), and white birch (Betula papyrifera). May include small patches of grassland, marsh or fens less than two hectares in size.
b. Open Deciduous: Lands characterized by rough topography, shallow soil, or poor drainage. Supports a growth of shrubs such as willow (Salix spp.), alder (Alnus spp.) saskatoon (Amalanchier spp.) and/or stunted deciduous (Populus spp.) tree cover. An area could have up to 50% scattered tree or shrub cover.
Mixed forest area along north shore of the Bird River
6. Roads and Trails: All highways, secondary roads, trails, cut survey lines,
right-of-ways, railway lines and transmission lines.
PR 315
Bird River Recreation Capacity Study
Lombard North Group
19
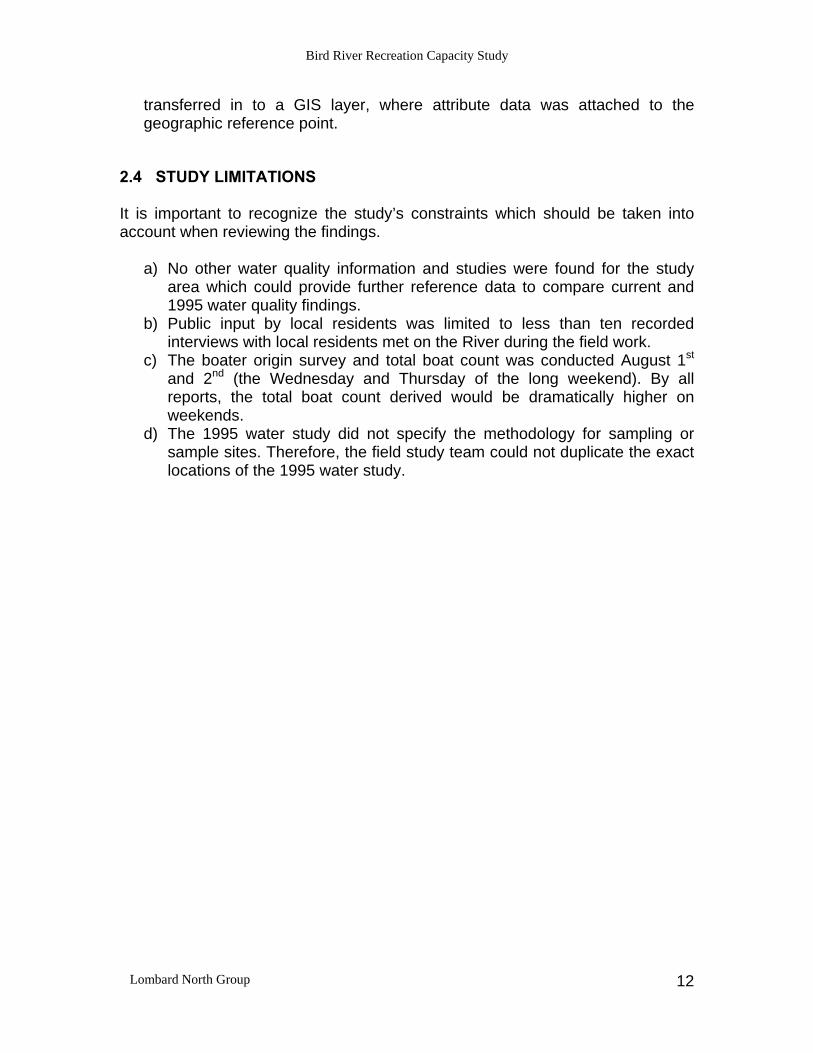
7. Treed Rock: Consists of exposed bedrock with less than 50% tree cover. The Bird River study area is primarily mixed forest land (77%) with some marsh lands grassland (9%) as shown in table above. The majority of the 9% marsh lands within the Bird River study area are located north of the Bird River. Refer to Map 7 for the land use for RM of Archie. The same is true for most grasslands, treed rock lands and bogs. A larger percentage of lands south of the Bird River have been developed and as a result the natural land uses have been altered. There are still large portions of land north of the Bird River where their natural state have been preserved and as a result have slightly different land use characteristics than areas south of the Bird River.
Treed rock along north shore of the Bird River

Bird River Recreation Capacity Study
Lombard North Group
20
Map 3: Landuse

Bird River Recreation Capacity Study
Lombard North Group
21
3.1.3 Percentage of Slope Map 4: Percentage of Slope characterizes the slope or lay of the land and is classified using the MLI (2003) classifications defining slope steepness based on the dominant slope gradient in the map polygon. The percentages of slope were broken down in to the following categories: “0-2%”, “2.0-5.0%”, “5.0-9.0%” and “9.0-15.0%”.
Bird River Study Area Area
(acres) Percentage of the Bird River Study
Area 0-2.0% 26.61 0.5 2.0-5.0% 3987.39 71.9 5.0-9.0% 1384.44 25.0 9.0-15.0% 146.75 2.6
Slope speaks to the variations of steepness of a given landscape. Where steepness exceeds 15 degrees, plant vegetation health may be inhibited. With regard to the Bird River study area, there is minimal negative impact on plant vegetation as a result of steepness of land. The highest degree of steepness for study area is the areas in sections 9-17-13E and 8-17-13E, which are located just north of the mouth of the Bird River.
Area of 2.0-5.0% slope along north shore of the Bird River

Bird River Recreation Capacity Study
Lombard North Group
22
Map 4: Percentage of Slope

Bird River Recreation Capacity Study
Lombard North Group
23
3.1.4 Drainage Levels Map 5: Drainage Levels shows drainage characteristics as defined based on the dominant soil, land cover and slope characteristics of the land. These classifications are allocated by the MLI (2003) into the following categories: “well drained”, “existing water”, “very poorly drained”, “rock”, “urban”, “modified drainage” or “unclassified”.
Bird River Study Area Area
(acres) Percentage of the Bird River Study Area Rock 26.61 0.5 Urban, Modified or Unclassified 8.17 0.1 Very Poor 31.26 0.6 Well 5371.83 98.8
The drainage classification is understood as the capability of soil to remove water, either through run-off or having the water pass through the soil. This information informs individuals about the location and permeability of varying soil types. Soil incapable of sufficient drainage greatly inhibits development on said lands. The following drainage classification is defined by Agriculture and Agri-Food Canada’s Research Branch:
Very Poor: Water is removed from the soil so slowly that the water table remains at or on the soil surface for the greater part of the time the soil is not frozen. Excess water is present in the soil throughout most of the year.
Well: Water is removed from the soil readily but not rapidly. Excess water flows downward readily into underlying materials or laterally as subsurface flow.
Most soils within the Bird River study area are well drained and are not considered to represent limitations for development or plant growth.

Bird River Recreation Capacity Study
Lombard North Group
24
Map 5: Drainage Levels

Bird River Recreation Capacity Study
Lombard North Group
25
3.1.5 Erosion Levels Map 6: Areas Susceptible to Water Erosion display erosion potential based on the estimated soil loss on bare or unprotected soil implementing the Universal Soil Loss Equation (USLE) in the map polygon measure in tones/hectare/year as described by the MLI (2003). The categories include: “High” (22-33t/h/y), “Moderate” (11-22t/h/y), “Low” (6-11t/h/y), “Negligible” (>6t/h/y). Water bodies were also highlighted for this layer.
Bird River Study Area Area
(acres) Percentage of the Bird River
Study Area High - (22-33 tonnes/hectare/year) 201.01 3.6 Moderate - (11-22 tonnes/hectare/year) 1972.95 35.5 Low - (6-11 tonnes/hectare/year) 2703.63 48.7 Negligible - (<6 tonnes/hectare/year) 672.26 12.2
The Province of Manitoba estimates the level of water erosion by the amount of lost or eroded soil (in tonnes) over time. Specifically, this analysis recognizes soil loss in tonnes per hectare per year that can be lost without permanently decreasing the potential productivity of the soil. Establishing a tolerance level for specific soils and topography has been based primarily on qualitative judgment. Manitoba assesses water erosion risk under a five-class system: negligible (< 6 tonnes/ha/year), low (6-11 tonnes/ha/year), moderate (11-22 tonnes/ha/year), high (22-33 tonnes/ha/year), and severe (> 30 tonnes/ha/year). The above table and following maps suggest risk of erosion in the Bird River study area contains a large percentage of lands that are either moderately or highly susceptible to water erosion. Both north and south shore banks of the Bird River up to the PR 315 bridge as well as lands north of mouth of the river in sections 9-17-13E and 8-17-13E are labeled as moderately susceptible to water erosion. A large portion of land that falls within the southern extent of the Bird River study area boundary that is located south of section 4-17-13E is labeled as highly susceptible to water erosion.
Area identified as moderately susceptible to water erosion: north shore of the Bird River
Bird River Recreation Capacity Study
Lombard North Group
26
Map 6: Areas Susceptible to Water Erosion

Bird River Recreation Capacity Study
Lombard North Group
27
3.2 DIGITIZED DATA: Field Study Observations An assessment of the age of construction for each cluster of seasonal residential dwelling units was made during the field study. This information was recorded and then transferred in to a GIS mapping layer where the age of construction is displayed spatially. The number of boats visible from the water during the field study were noted and recorded by location and type. This includes all boats that are docked or on a trailer. One boat was assumed for each boat house observed. The type of boat was recorded and broken down in to the following subcategories: “3.66 to 4.88 meter (12 foot to 16 foot) fishing boat”, “power/speed boats”, “houseboat”, “jetskis/personal watercraft”, “pontoon boats” and “floatplanes”. The density of the seasonal residential units was observed from the water. The categories of density were broken down in to “high, medium or low”. No fixed number of units/acre was used. “High” density was recorded where units were observed to be closely spaced one to the other and there is no room for any add floor area square footage without encroaching into the side yards. “Medium” density described units less tightly spaced with some room for expansion or side yard development. “Low” density describes units very loosely spaced with available room to potentially develop to a medium or high density character. The determination of the River’s navigable water area excluded from consideration a 7.62 meter (25 foot) buffer adjacent the shoreline on both sides of the river as well as around shallow reeds areas, docks, roped off swimming areas and the bridge abutments. The buffer areas where deducted to highlight areas that pose conflicts or hazards to boating which would normally require safe boating adjustments involving reducing speed or expanding separation distances. This total area of “buffer” water was subtracted from the total surface area of the Bird River to derive the total available “boatable” water. Based on common boating experience, separation distances between boats were categorized based upon “active boating use” categories. Not assessed in regards to separation distance is the impacts float plane use (take –off and landing) may have upon the boatable area. Certainly float planes when in use on the river temporarily close use of certain reaches of the river. The following minimum separation distances are recommended for “active boating use”:
• 30m (100 foot) separation distance suggested for passing boats exceeding 25km/h/
• 50m (165 foot) suggested for high speed boats (exceeding 60km/h); and • 90m (300 foot) separation distance suggested for boats that are taking part
in water-skiing/tubing activities.

Bird River Recreation Capacity Study
Lombard North Group
28
To appreciate the implications of these active boating buffers upon the use of the river as series of concentric circles was placed in selected locations on the river to help the reader visualize how active boating use relates to the boatable water characteristics of the river. These buffers can be seen in Map 7A: 30m, 50m and 90m Active Boating Separation Distances. A 5 acre concentric buffer was also created around boats placed in the middle of the Bird River that are spaced every 5 acres. Standards for boating use in the context of the size of the water body are commonly applied for many government agencies. Although the Province of Manitoba does not have a standard general guide for forecasting the capacity of water bodies to sustain boats and hence development, they do try to follow the Ontario Ministry of Natural Resources Lake Alert-Phase II standards of one 1 boat per 10 surface acres of water. This definition does not include weedy areas, shallows, etc.) A 5 acre buffer is illustrated in order to show implications for determining boating capacity of the Bird River. This buffer can be seen in Map 7B: 5 Acre Active Boating Buffer. It should be noted that 3 single engine float planes were observed by the 2007 study team. The locations of these planes on the Bird River can be seen in Map 13: Boats Counted from Water. The following excerpt addressing Civil Aviation Safety Authority Advisory Circular (2005) under “Appendix A Recommended minimum physical characteristics of landing areas and water alighting areas” :
“2.7 Float plane alighting areas. For water operations, a minimum water channel width of 60 meters for day and 90 meters for night operations is recommended. The depth of water over the whole water channel should not be less than 0.3 meters below the hull or floats of the stationary aeroplane when loaded to maximum take-off weight. An additional area, as shown in the following diagrams, provides a protective buffer for the water channel but need not consist of water. Where the additional area consists of water then it should be clear of moving objects, or vessels under way. The centre line of a water channel may be curved, provided that the approach and take-off areas are calculated from the anticipated point of touchdown or lift-off.”
Unlike land-based aircraft, float planes have some unique types of landings and take offs. For example, glassy (calm) water inhibits depth perception during landing, and adds significant drag during takeoff. Rough water pummels the airframe and passengers, prompting expedited liftoffs and prompt deceleration on landing (Flight School List, 2007). Although landing and takeoff distances vary based on type of plane, the weight the plane is carrying, the wave currents and wind conditions to name a few; using Napa County Airport Data (2001) and (Lee, 2007), it has been estimated that minimum takeoff distance requirements for a single engine float plane is between 600m (2000 ft.) and 760m (2500 ft.) at full weight capacity with no obstructions on the departure path. Generally, it takes 20% less distance to land a single engine float plane (Lee, 2007). For the purpose of this study a 60m wide (assuming all flights take place during the day)

Bird River Recreation Capacity Study
Lombard North Group
29
and 675m long buffer has been placed over the Bird River that shows suitable stretches of water for the landing and taking-off of single engine float planes along the Bird River. These buffers can be seen in Map 7C: Float Plane Alighting Areas. This map shows two takeoff/landing strips that meet the minimum distance requirements and are in close proximity to the three float planes that were observed on the Bird River. A 7.62 meter (25 foot) buffer digitized GIS layer was placed around the shoreline of the entire Bird River and was used as a barrier for the digitized takeoff/landing strips. The takeoff/landing strips were drawn as perfect rectangles in shape, which ensured that the takeoff/landing strip was straight and did not meander. It was very difficult to find a suitable location along the Bird River that is fairly straight for 675m and is wider than 60m. One of the two takeoff/landing strips is located just west of the PR 315 bridge in between sections 2-17-13E and 11-17-13E. The other strip is located east of the PR 315 bridge in sections 1-17-13E and 6-17-13E. It is quite apparent that with the 7.62m buffer on the entire shoreline, the Bird River becomes quite narrow in some spots and difficult to find an area that is 675m straight while being 60m wide. It is quite evident that when these float planes are taking off/landing from the identified areas; it would be very difficult for any recreational form of boating to take place within these areas.
Float planes located east of PR 315 bridge
Map 7A: 30, 50m & 90m Active Boating Separation Distances

Bird River Recreation Capacity Study
Lombard North Group
30
Map 7B: 5 Acre Active Boating Buffer

Bird River Recreation Capacity Study
Lombard North Group
31
Bird River Recreation Capacity Study
Lombard North Group
32
Map 7C: Float Plane Alighting Areas
Bird River Recreation Capacity Study
Lombard North Group
33
4.0 CARRYING CAPACITY ANALYSIS This section analyzes various factors that affect the capability of the study area to accommodate further development. The factors discussed include the physical resource base, current use patterns, local resident concerns, regional considerations, water quality test results and the RM of Alexander’s Development Plan objectives and policies. 4.1 PHYSICAL FEATURES
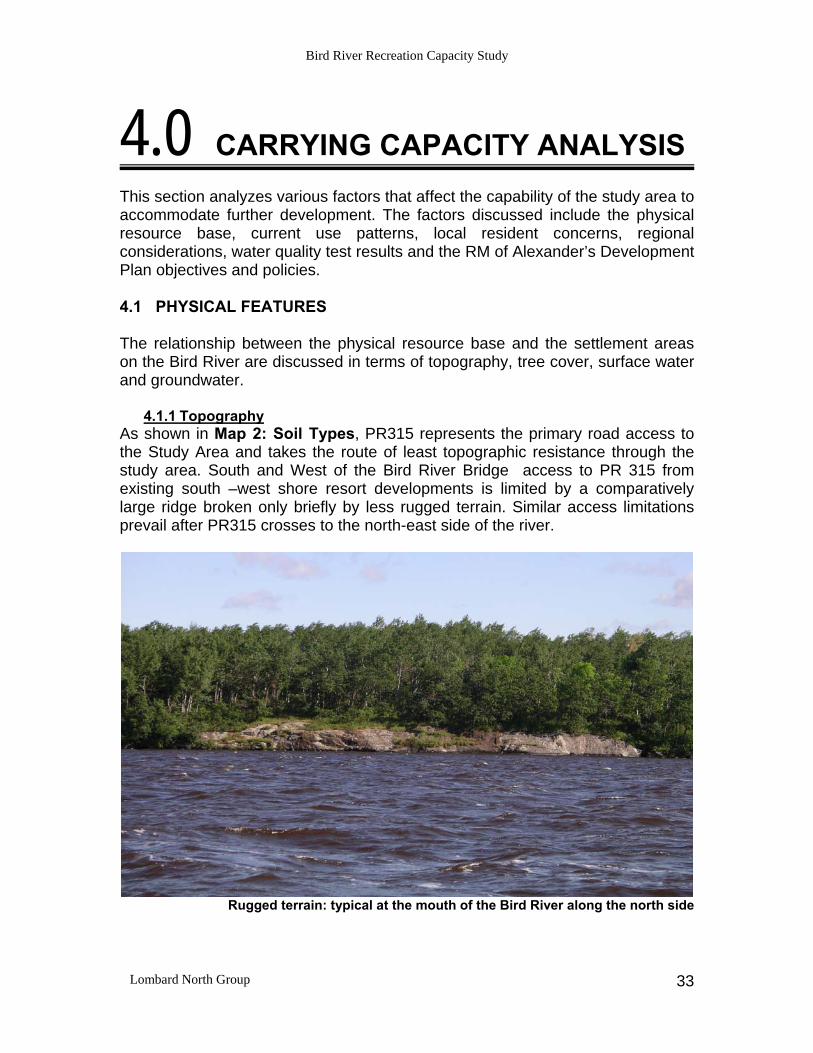
The relationship between the physical resource base and the settlement areas on the Bird River are discussed in terms of topography, tree cover, surface water and groundwater. 4.1.1 Topography As shown in Map 2: Soil Types, PR315 represents the primary road access to the Study Area and takes the route of least topographic resistance through the study area. South and West of the Bird River Bridge access to PR 315 from existing south –west shore resort developments is limited by a comparatively large ridge broken only briefly by less rugged terrain. Similar access limitations prevail after PR315 crosses to the north-east side of the river.
Rugged terrain: typical at the mouth of the Bird River along the north side
Bird River Recreation Capacity Study
Lombard North Group
34
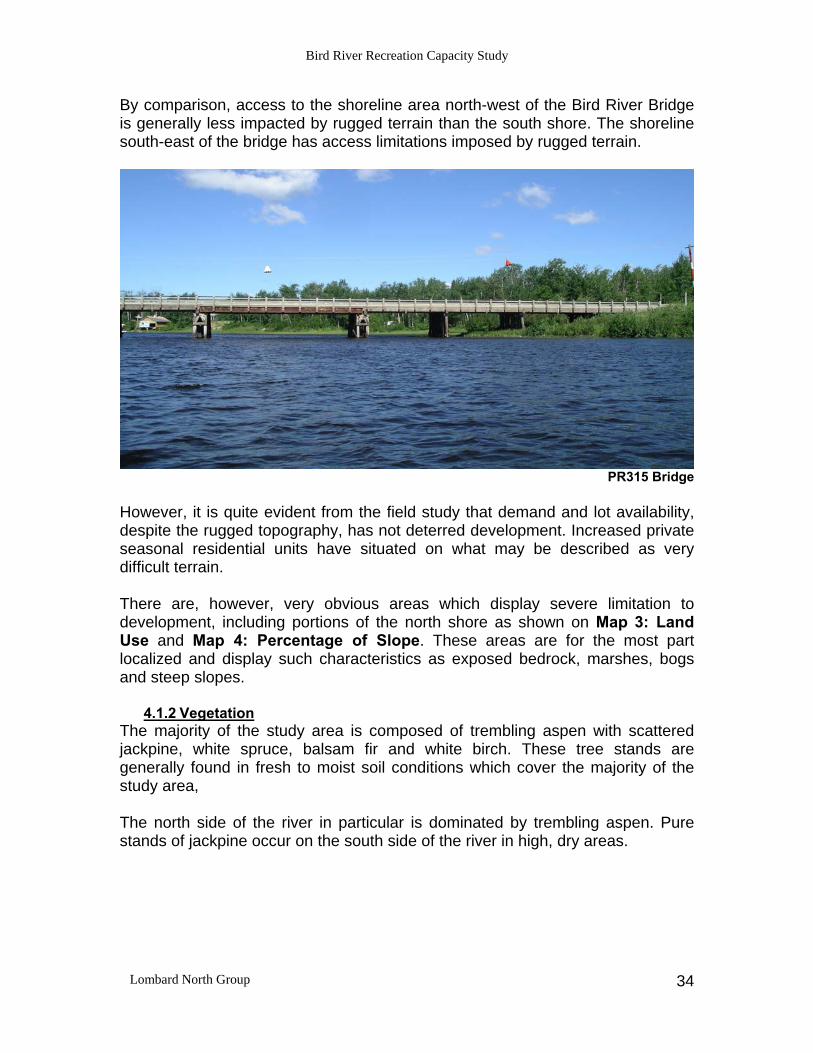
By comparison, access to the shoreline area north-west of the Bird River Bridge is generally less impacted by rugged terrain than the south shore. The shoreline south-east of the bridge has access limitations imposed by rugged terrain.
PR315 Bridge
However, it is quite evident from the field study that demand and lot availability, despite the rugged topography, has not deterred development. Increased private seasonal residential units have situated on what may be described as very difficult terrain. There are, however, very obvious areas which display severe limitation to development, including portions of the north shore as shown on Map 3: Land Use and Map 4: Percentage of Slope. These areas are for the most part localized and display such characteristics as exposed bedrock, marshes, bogs and steep slopes. 4.1.2 Vegetation The majority of the study area is composed of trembling aspen with scattered jackpine, white spruce, balsam fir and white birch. These tree stands are generally found in fresh to moist soil conditions which cover the majority of the study area, The north side of the river in particular is dominated by trembling aspen. Pure stands of jackpine occur on the south side of the river in high, dry areas.

Bird River Recreation Capacity Study
Lombard North Group
35
South side of the Bird River
North side of the Bird River
What was once described as fields and meadows in the 1977 study appears to have since been subdivided and developed for seasonal cottages. The areas of willow-alder, marsh/muskeg, fields and meadows, treed rock and stands of jackpine in dry surface moisture conditions all have limitations for seasonal home developments. The north shore has more areas of exposed bedrock and steep slopes than the south shore, which has a lower relief with some marshy areas. It was noted in the 1977 study that pure stands of any tree species are not as suitable for development as mixed stands. Besides displaying better screening characteristics, mixed stands of vegetation provide insurance that any tree

Bird River Recreation Capacity Study
Lombard North Group
36
disease affecting a particular species will not destroy all the tree cover in that area. It was observed by the field study team that most or all of shoreline vegetation was cleared from the shoreline of a number of residences, particularly ones that have been built within the past five years. Significant stripping of shoreline vegetation can lead to shoreline erosion. Reeds also can be used as an effective way to treat or naturally process various types of noxious effluents, including sewage.
Reeds stripped by resident owner
Riverbank erosion and slumping

Bird River Recreation Capacity Study
Lombard North Group
37
4.1.3 Surface Water The Bird River is not a typical “meandering’ river generally found within the prairie region of the province. It covers a total` area of 288.52 acres with 252.46 acres of “boatable” water. There is approximately 15 km of shoreline, including all bays and inlets. The rocky topographic relief of the Canadian Shield has done more to shape the river’s characteristics than the natural erosion forces of water. At the eastern extremity of the study area, the River enters via a scenic stretch of rapids and then gently flows a brief 7.8 kilometers with little deviation into Lac Du Bonnet. Within the study area the Bird River ranges in width from approximately 54 meters (179 feet) to a maximum of approximately 231 (761 feet). Its average width is estimated to be approximately 231 meters (761 feet). This relatively narrow channel displays no natural beach areas and is characterized by some very steep rock banks up to an estimated 25 meters in height. The navigable portion of the river channel appears to be relatively deep based upon the steep shoreline inclines into the river’s edge and limited width of observed shall water weed beds. No depth tests were taken by the field study team. In a number of locations seasonal resort residents appeared to have removed weed beds and reeds in order to improve docking access and/ or swimming from their property. Field observations confirmed the water appeared to be fairly clear with minimal algae presence noted by the study team. Some localized erosion of the shoreline has occurred and seems to be accelerated due likely to increased wave action resulting from boat use. In conversation with local residents, some expressed concern over the amount of erosion that has taken place in recent years. Respondents who expressed concern over shoreline erosion generally attributed it to the increased boating traffic on the river and fluctuating water levels that are regulated by Manitoba Hydro. Some respondents were forced to take action and try and mitigate shoreline erosion by stabilizing their bank with riprap or other various materials. 4.1.4 Water Quality Test Results The results for the water quality tests have been tabulated. Appendix 2: Water Quality Test Results compares 2007 results with the findings of the 1995 water quality study providing the basis to identify any significant changes. The 1995 study samples 4 sites over the course of 3 months. The 2007 study is on a much smaller scale sampling 4 sites over the course of 2 days. Although the scale of the study is smaller, analytical comparisons are still made between the two studies. Map 8: Water Sample Locations included in this report indicates where each 2007 sample was taken. 1.Fecal Coliform Bacteria:
These organisms originate in the intestines of warm blooded animals and their presence in water is an indication of contamination by fecal matter,

Bird River Recreation Capacity Study
Lombard North Group
38
including sewage, manure or the feces of wildlife. The potential risk of developing illness may be inferred from the density of fecal coliform bacteria. Manitoba Surface Water Quality Objectives and Guidelines (MSWQOG) recommend that drinking water have 0 fecal coliform bacteria / 100ml whereas up to 200 ml may be present in water used for primary recreational activities such as swimming (Beck, 1995). Similar to the 1995 study, all sites tested in 2007 met Manitoba Surface Water Quality Guidelines for recreational waters and the Bird River would therefore suitable be considered suitable for primary recreational purposes such as swimming. In 2007 Site A, which is located just outside the mouth of the river; did contain higher levels (>10 CFU/100ml) than other sample sites. This portion of the river may at times not be suitable for primary recreational purposes. A possible source could be leaking/faulty sewage systems. It may be advisable for the Municipality or Manitoba Environment to conduct further enquiries to locate the source of effluent.
2.Total Kjeldahl Nitrogen:
Total Kjeldahl nitrogen (TKN) is a measure of organic nitrogen (the nitrogen which occurs in biological substances that are present in the water) plus ammonia. This provides an indication of both the amount of life present in the water and the presence of other organic substances such as decaying algae and plants, manure and sewage. Although elevated values of TKN may be indicative of contamination by sewage, manure, or other matter, TKN in and of itself does not affect the suitability of water for such uses as recreation, drinking or for use by fish and wildlife. Therefore, Manitoba Surface Water Quality Objectives (MSWQO) have not been established for this variable (MSWQOG, 2002).
THE 2007 TKN results are very similar to the 1995 study test results. In 1995 the data generally was within the normal range that one typically encounters in eastern areas of Manitoba, excepting sample site B, which showed levels of 0687 mg/L compared to that of the other sample sites which showed an average of 0.594 mg/L (sample locations where not recorded in the 1995 study findings). No one sample site in the 2007 water quality study was significantly different than the others with average TKN levels for all four sample sites showing 0.775 mg/L.
3.Ammonia (NH3) Dissolved: Ammonia nitrogen is an inorganic form of nitrogen that can readily be used by algae and aquatic plants. Elevated levels of ammonia nitrogen in lakes and streams unaffected by human activity may be indicative of algae blooms, excessive plant growth and deficiencies of dissolved oxygen. (Dissolved oxygen deficiencies may induce fish kills and obnoxious odors). Elevated levels of ammonia nitrogen in lakes and streams affected by human activity may be indicative of contamination by sewage, certain industrial processes,

Bird River Recreation Capacity Study
Lombard North Group
39
manure or fertilized runoff. Ammonia may occur in both ionized and un-ionized forms; the relative proportion of each is controlled by temperature and PH. Elevated levels of un-ionized can be directly toxic to fish and other aquatic life (Beck, 1995).
Similar to the 1995 study, the ammonia values encountered recorded in August 2007 on the Bird River were well below levels that might have been toxic to aquatic life. All sites showed very comparable levels, whereas the 1995 study showed higher levels of NH3 for sample sites A and B (sites not located in 1995 study findings).
4.Nitrate-Nitrite Nitrogen:
Dissolved or nitrate-nitrite nitrogen is an inorganic form of nitrogen that can also readily be used by algae and aquatic plants. Elevated levels of nitrate-nitrite nitrogen in lakes unaffected by human activity are uncommon except in well oxygenated, very productive waters. Elevated levels of nitrate-nitrite nitrogen in lakes unaffected by human activity may be indicative of contamination by sewage, certain industrial processes, or by fertilizer runoff. A low ratio of nitrate-nitrite nitrogen may be indicative of dissolved oxygen deficiency (MSWQOG, 2002). Dissolved nitrogen results were very low in both the 2007 study and the 1995 study and are consistent with data from other streams in the province. The Manitoba Surface Water Quality Objectives contains an objective for dissolved nitrogen levels in surface water used as sources of drinking water. Dissolved nitrogen concentrations rarely approach the objective of 10 mg/L in surface water systems but often approach or exceed this concentration in ground water. Albeit the levels for both studies are significantly lower than 10mg/L, it should be noted that 2007 sample sites C and D showed twice the levels of dissolved nitrogen than sample sites A and B (MSWQOG, 2002).
5.Total and Dissolved Phosphorus:
Phosphorus is of interest because of its role in eutrophication. Excessive concentrations of phosphorus may stimulate nuisance growths of algae and other aquatic plants, which in turn may induce foul odors and fish kills. MSWQO recommend that total phosphorus not exceed 0.025 mg/L in any reservoir, lake, or pond, or in a tributary at the point where it enters such bodies of water. In other streams, total phosphorus should not exceed 0.05 mg/L. Two forms of phosphorus, total phosphorus and dissolved phosphorus is a measurement of all phosphorus in the sample including both that which is dissolved and that which is present in suspended particles (ie silt and organic substances such as leaves, twigs, algae, etc.). Only dissolved phosphorus is readily available for uptake and growth by algae and aquatic plants (MSWQOG, 2002)

Bird River Recreation Capacity Study
Lombard North Group
40
The 2007 study like the 1995 study, findings indicated generally that phosphorus concentrations at present were not sufficiently elevated to induce serious eutrophication (ie excessive algae and weed growth) problems. The average levels for the 2007 study remain unchanged from the 1995 study at 0.029 mg/L. However, it should be noted that all 2007 sample sites either meet or exceeded levels of 0.025 mg/L, with sample site A showing the highest levels of both total and dissolved phosphorus at 0.015 mg/L and 0.034 mg/L respectively. According to the MSWQOG, maintenance of such concentrations may not guarantee that eutrophication problems will not develop. Potential future problems associated with this loading (if it continued unchecked) include promoting the nuisance growth of algae and other aquatic vegetation to the point where water quality in the area is eventually rendered unsuitable for recreational purposes.
5. Conclusion: Fecal coliform levels at sample site A for the 2007 study are higher than all other sample sites by >10 CFU/100ml and must be addressed before further development occurs. The 1995 study observed higher fecal coliform levels were recorded for two of the sample sites (although the sites’ locations were not identified). The 1995 study suggested that it is necessary to avoid exacerbating an existing deteriorating water quality situation. If the source(s) of loading of fecal matter and/or organic matter cannot be identified and rectified, the inference that may be drawn is that development along the Bird River has exceeded the ecological carrying capacity of the river. It was stated in the 1995 study that if future development is to occur along the river, water quality may deteriorate significantly over time even at current levels of development. In the 1995 study, the average fecal coliform levels were 58 CFU/100ml. Although the sample locations for the 1995 study are unknown, it should be noted that the fecal coliform testing contained a limited number of high anomalies for sample site B. IF sample site is excluded for the calculation, the average fecal coliform levels for the 1995 would be 12.4 CFU/100ml. These numbers are still higher than the average levels for the 2007 study which showed an average fecal coliform level of <10 CFU/100ml. A total of 28 samples were conducted over a period of 4 month for the 1995 study (7 for each sample site). Perhaps average fecal coliform levels would have been more similar had the 2007 study been conducted in the same manner as the 1995 study. It should be noted that the water quality test results for most of the tested nutrients did not show any significant differences between the two studies. Average fecal coliform levels for the 1995 study were much higher than for the 2007 results. It should also be noted that Total Kjeldahl Nitrogen (TKN) was the only category to show significant difference between the two studies. An average level comparison of TKN shows that the 2007 study have 0.150 mg/L higher than the 1995 study. Careful attention should be paid to the monitoring of total phosphorus levels for the Bird River. All sample sties

Bird River Recreation Capacity Study
Lombard North Group
41
exceeded MSWQO’s recommendation that total phosphorus not exceed 0.025 mg/L in any reservoir, lake, or pond, or in a tributary at the point where it enters such bodies of water.
4.1.5 Groundwater Groundwater appears to be one of two sources of potable water within the Study Area’s. Survey respondents stated they either obtain their potable water from groundwater sources or have it trucked in from Lac du Bonnet and stored in a holding tank. Most respondents stated that they use 5 gallons of purified bottled water for drinking purposes. Groundwater within the study area is very near the surface, thus creating valid reasons for concern in areas where the overlying soils have a high permeability. This can place significant limitations to the use of septic fields. Detailed potable water quality information is lacking in this study. However, the field study team noted that accessibility to adequate supplies of potable groundwater varies considerably. Any future development in the study area should provide proof of an adequate supply of potable water commensurate with the level of development existing or contemplated.

Bird River Recreation Capacity Study
Lombard North Group
42
Map 8: Water Sample Locations

Bird River Recreation Capacity Study
Lombard North Group
43
4.1.6 Physical Limitations to Development: Map 9: Physical Limitations to Development outlines areas that have limitations for seasonal home development. The map is based on site overlay analysis using MLI characteristics including soil type, drainage, susceptibility to shoreline erosion and land use information. A GIS analysis was used to produce a spatial layer that through overlay analysis can visually show the comparative capability of the study area’s land resources to accommodate potential seasonal residential development. The mapping attributes describing site development potential and constraints when overlaid provide a composite view of how the variables in site characteristics combine to create an understanding of carrying capacity and suitability to sustain development. For example, wet areas usually mean the total prohibition of any development in that locale. Other limitations such as dry sites or bedrock outcrops can be somewhat overcome by using very low densities. Map 9: Physical Limitations to Development provides a summary of lands that have one or more characteristics that would hinder the capability of the site to sustain seasonal home development. These characteristics range from extremely wet areas, such as bogs or marshes, areas with a moderate to high susceptibility to shoreline water erosion, areas with poor drainage and areas characterized by organic soil types and exposed bedrock. It should be noted that the designation of site limitations for a given area does not automatically preclude all development. It acknowledges the existence of one or more constraints which in some circumstances subject to precautionary actions may be resolved. It is quite evident on the map that several seasonal residential areas have been built within areas displaying significant constraints. This is particularly evident for most of the seasonal residential areas along the north and south shores of the Bird River that are located between the mouth of the river and the PR 315 bridge. However, in order to ensure long term sustainability for the study area, these areas should not be considered for future seasonal residential development.

Bird River Recreation Capacity Study
Lombard North Group
44
Map 9: Physical Limitations to Development

Bird River Recreation Capacity Study
Lombard North Group
45
4.1.7 Options for Development Two alternative planning strategies were formulated based upon the study information and displayed on orthophoto overlays of the study as shown in Map 10: Suitable Areas for Future Development. Through the use of a GIS interface, all bogs, marshes, treed rocks, roads/trails were selected from the land use layer and made in to a separate layer which highlights the restricted areas for development based on type of land use. Through the use of a GIS interface, all organic soils and rocks were selected from the soil types layer and made in to a separate layer which highlights the restricted areas for development based on soil type. Areas of high (22-33 tonnes/hectare/year) and moderate (11-22 tonnes/hectare/year) erosion were selected from the water erosion risk classification field. These selected areas were made in to a separate layer which highlights the restricted areas for development based on moderate to high soil classes that are susceptible to water erosion risk. Through the use of a GIS interface, areas of “very poor” drainage were selected from the categorized types of drainage within the Bird River Study Area and made into a new layer. The categorized types of drainage, as defined by the MLI include: well, water, very poor, rock and urban/modified or unclassified.
All of the newly created layers were merged in to one layer using a merge function in the GIS interface. This layer highlights all of the areas for restricted development within the Bird River study area. This layer displays areas which may be unsuitable for future development. If this layer is used with the existing infrastructure “roads” layer, it becomes quite evident where (if any) future development should take place within the Bird River study area. Areas seen as most suitable for any future development are highlighted in Map 10: Suitable Areas for Future Development. Both sites are located in close proximity to existing roads and are not located along the shoreline. Site option A is 46 acres, located in NW 1 -17-13E and part of NE 2-17-13E. Site option A is also located on the south side of the river and runs parallel along the south side of PR315. Site option B is 42 acres in area, located in both SE 7-17-14E and SW 7-17-14E. Site option B is located on the north side on the river and runs parallel along the south side of PR 315. Both site options are either connected to or are in very close proximity to PR 315; an all weather road network. These sites are also located adjacent to existing developments that either along shore or off shore which in turn makes any additional infrastructure costs more feasible. The fact that these sites are not located along the shore is indicative of the fact that any further development in the Bird River study area should not add any additional boating traffic. If these sites are to be developed, additional alternative forms of recreation to that of boating should be provided by the developer for these sites in order to alleviate

Bird River Recreation Capacity Study
Lombard North Group
46
the pressure from the already stretched water recreation carrying capacity of the Bird River. It is understood that if these sites were to be developed, a large percentage of the owners would occupy them seasonally and use a boat(s) for a variety of recreational activities. If these sites were to be developed, boat launches would be discouraged from locating in or around these sites. These potential sites do not currently back on to water which limits the entry points to the Bird River for these potential residents. If development is considered as a possibility for these sites in Phase 2 of the Study no consideration should be given to adding additional boat docking or launching facilities on the Bird River.

Bird River Recreation Capacity Study
Lombard North Group
47
Map 10: Suitable Areas for Future Development.

Bird River Recreation Capacity Study
Lombard North Group
48
4.2 MAN-MADE FEATURES The relationship between the man-made environment and the settlement areas on the Bird River are discussed in terms of seasonal residential use, boating and other recreational activates. 4.2.1 Seasonal Residential Units According to MLI, data from 2001 there are 793 building structures that fall within the study area. This includes all seasonal residential units, boat houses and shed. The field study team counted an estimated 227 seasonal residential dwellings that were located along the shoreline of the Bird River. Assuming an average occupancy figure of 3.5 people per seasonal shoreline residential unit, it can be estimated the study area accommodates a maximum of around 800 user/residents along the 7.8km waterway. In 1977, more than 50% of the development on the river was considered semi-permanent. This semi-permanent development is best characterized by the trailer camp developments at the mouth of the Bird River. There are still some trailers located along this densely populated part of the river, but some of these trailer sites have been converted to permanent locations at a similar level of high density. It was noted previously in the 1977 study, that the L.G.D. of Alexander has not in the past closely regulated trailer or lease development on the Bird River. As a result, development densities have been unchecked and the concentration of users and accompanying water use conflicts are greatest at these locations. It was observed by the field study team, that the highest density of seasonal residential units was located along this portion of the river, see below.

Bird River Recreation Capacity Study
Lombard North Group
49
High density development along the south side of the Bird River A GIS layer was created to record the estimated age of construction for each cluster of seasonal residential units. This layer can be seen in Map 11: Estimated Age of Construction. It should be noted an overwhelming majority of the new cabins that were recently or are currently being built along the north shore are significantly larger than cabin’s that were built several years ago along the river. These cabins mostly all have large boat houses with anywhere from 3-5 water craft at each location, illustrated in the following photographs.
Large newly constructed style of cabin
Another GIS layer was created to show the density of the seasonal residential units was observed from the water. The categories of density were broken down in to “high, medium or low”. No fixed number of units/acre was used. Rather each cluster of units were observed as to how closely they where spaced relative to one another and if there was any space remaining that might allow additional development at the same observed density. This layer can be seen in Map 12: Seasonal Residential Unit Density. Areas described as “available for development” should not be confused with areas suitable for suture development, which are shown on Map 10: Suitable Future Areas for Development. Appendix 3: Total Number of Lots Approved Since 1991 shows the total number of lots developed since 1991. Section 4.2.7(4) of the Winnipeg River Development Plan (1992) states that:

Bird River Recreation Capacity Study
Lombard North Group
50
“new recreational subdivisions along the Bird River shall be limited to a maximum of 50 units and serviced by an all-weather public road constructed to Municipal and/or highway standards. Owners of existing trailer developments shall be permitted to subdivide provided that the density is reduced to one unit per acre. Where this redevelopment occurs, the number of units will not be included in the 50 units. Once the 50 units limit has been achieved no further subdivision will be permitted until a Recreational Capacity Study for the Bird River indicates that further development is warranted.”
4.2.7(4) has a profound effect on the number of lots that are available, if Council is of the opinion that Pioneer was a trailer park it would not be included in the figures. This would decrease the number of lots approved since 1991 to 24. Plus if council is of the opinion that Ledin’s was a trailer park then those numbers would likewise not be included in the figures therefore resulting in no lots being conditionally approved.
Bird River Recreation Capacity Study
Lombard North Group
51
Map 11: Estimated Age of Construction

Bird River Recreation Capacity Study
Lombard North Group
52
Map 12: Seasonal Residential Unit Density

Bird River Recreation Capacity Study
Lombard North Group
53
4.2.2 Boating On Wednesday August 1st and Thursday August 2nd, 2007 the study team counted over 250 boats of varying types of along the Bird River. For a breakdown of each type of boat counted, see Appendix 4: Counted Boats (2007). The estimated speed of boats that were traveling on the water was also recorded which is shown in Appendix 5: Estimated Speed of Traveling Boats (2007). Boats were observed and counted around Tall Timber and along the south inlet of the Winnipeg River bank up to the western point of the small inlet before it immediately runs south; the location of the boats can be seen in Map 13: Boats Counted from Water. The field study noted in the survey that the primary recreational use for seasonal residents was for leisure boating activities. A large percentage enjoyed various forms of boating activities. The greatest observed activities in the study area consisted of some form of boating. Fishing and leisure boating activities were observed by the field study team. Similar to the 1977 study, of these activities, fishing, leisure boating and water skiing predominated. Current use patterns appear to favor use of the Bird River over the adjoining Winnipeg River. It was stated in 1977 and again stated by respondents in this study that a possible explanation for this may be the exposure of the adjoining portion of Lac du Bonnet to greater than average wave action. The lake’s uninterrupted exposure to prevailing winds would account for these rough water conditions which in turn discourage most pleasure boating activities. Some respondents stated that the Bird River waterway is calmer and is ideal for certain pleasure boating activities, such as tubing and waterskiing. Some respondents stated that pontoon boats come in from the Winnipeg River and park in the various bays and inlets of the Bird River for hours at a time. Boating conflicts appear most prevalent at the points of greatest user density. According to some respondents this is located just east of the PR315 bridge. It was noted that several boats use the southern inlet as a turn around. On a given Saturday, some respondents stated that a100+ boats pass by their residence during the day. Many of these boaters originate from the Winnipeg River/ Lac du Bonnet. The typical boating conflicts experienced are between:
• fast moving boats and slower vessels, • between water-skiers other boaters and swimmers; and • east of the PR 315 bridge; between boaters and seaplanes landing on the
river.
The long, narrow configuration of the Bird River and features such as the bridge further constrict boat use. Most respondents expressed concern over jet skis,

Bird River Recreation Capacity Study
Lombard North Group
54
some suggesting the need to restricting jet skis use or enforcing a “no wake zone” for the river. Some respondents interviewed expressed concern over the level of noise generated from the amount of boat traffic along the Bird River. The narrowest portions of the river and in particular the PR 315 bridge pose severe handicaps for boating. There are portions of the river that make it very difficult to accommodate more than one lane of traffic for boats traveling in eastbound and westbound directions. The safe boating area at the bridge is very constricted and dangerous given the speed of the boats and use by water-skiers, tubers and jet skiers. The fact that high a density of seasonal residential development adjoin the bridge area provides a further hazard.
Narrow passage through PR315 bridge
It is worthwhile to examine boating use in the context of the size of the water body. Standards are commonly applied as a general guide for forecasting the capacity of water bodies to sustain boats and hence development. For example, the states of Louisiana1 and Wisconsin2 use the standard of one boat per twenty surface acres of water. Ontario3 uses one boat per ten surface acres of water although their definition of surface water excludes areas not suitable for boating (weedy areas, shallows, etc.) and a two hundred foot protection zone around all shoreland and islands. Standards for waterskiing used in Wisconsin, Louisiana and Ontario assume a desirable ratio of one boat per 40 acres of surface water. Manitoba has no comparable standards although in conversation with Manitoba Conservation, the Province of Manitoba tries to follow the standards of the Lake Alert – Phase II model from Ontario Ministry of Natural Resources. Given the
1 Louisiana Parks and Recreation Commission 2 Comprehensive Plan for Wisconsin Outdoor Recreation 3 Lake Alert – Phase II, Ontario Ministry of Natural Resources

Bird River Recreation Capacity Study
Lombard North Group
55
total boatable water acreage in the study area is limited to 288.52 acres, it is easy to see that current potential local boating use (over 250 boats) not including potential boating use from Lac du Bonnet exceeds recommended water body boating standards adopted by other jurisdictions and informally followed by Manitoba Conservation. The total surface water area (approximately 289 acres) of the Bird River within the study area (as calculated using a GIS interface) includes many areas considered unsuitable for boating including shallow bays and weedy areas. Using the GIS 7.62 meter (25 foot) buffer layer around the shoreline, the total amount of “boatable” water is reduced to 252.46 acres. Even using the standard of one boat per 5 acres which represents twice the acceptable density used in other jurisdictions, the study area would have a capacity for only 51 boats. Presently the study area is over capacity by 5 times the boating capacity of the water body. The fact the river is short, 7.8 kilometers and narrow and that boating is by far the dominant recreational attraction, only serves to emphasize its over-use. Normally, the pressure on the river would be somewhat alleviated by the access to a large water body such as Lac du Bonnet. Even if greater use of the lake occurred, the river would still be a busy place acting as a highway carrying study area to the lake based on the number of boats counted either on or near the shore of the river. It was noted in the 1977 that boating use had exceeded the capacity of the water body. Based on the evidence shown, it is clear that the same is true for this study and that boating use is at or has far exceeded the capacity of the water body.

Bird River Recreation Capacity Study
Lombard North Group
56
Map 13: Boats Counted from Water.

Bird River Recreation Capacity Study
Lombard North Group
57
4.2.3 Other Recreational Activities Swimming appears to be restricted to a number of isolated areas including the Church Camp and private roped off areas adjacent to resident owners’ docks. Some of the respondents mentioned various walking and quad/snowmobile trails as the primary form of alternative recreation activities to water based recreation. Other respondents felt that there were not enough trails and/or alternative recreation activities to boating.
Quad trail located in the study area
4.2.4 Public Services: Landfill The 1977 Bird River Sector Plan Study indicated that information by the Manitoba Environmental Protection Branch suggested that existing seasonal resort development has surpassed capacity of the waste disposal grounds serving the study area. The field study team visited the waste disposal grounds for the RM of Alexander, located near the Bird River Study Areas along the east side PR 315 and recorded existing conditions. The site appears to have been built on a marsh. Former refuse has been sealed with a clay and gravel cap creating a large mound in the marsh. Current refuse is being spread on the banks of this mound, which is closely encroaching upon nearby forested areas. It is quite evident after the study team visited the waste disposal site that an alternative site should be created. The site has far exceeded its capacity and is now posing a threat to local wildlife and plant species. No GIS analysis was conducted on the suitability for this site as it is located outside the confines of the study area. As a general rule, increased development on the Bird River will require general improvements and expansion in the number of services provided by the RM of Alexander including waste management.

Bird River Recreation Capacity Study
Lombard North Group
58
Landfill site
Landfill site

Bird River Recreation Capacity Study
Lombard North Group
59
4.3 LOCAL RESIDENT CONCERNS It was interesting to note the concerns of survey respondents with respect to the desirability of further development in an area already view the area as already crowded and not capable of sustaining additional development. In general the 2007 responses from the local area residents are very similar to the responses given in the 1977 study. According to a majority of respondents, the overall recreational use in the study area appears to be approaching its recreation carrying capacity. Some respondents felt that the recreational use levels are unbearable on weekends that current use is such that it adversely affects the quality of the recreation experience and has taken away the very basis for there decisions coming to the Bird River in the first place. Many respondents felt that the recreational carrying capacity had peaked and that any further development would exceed the river’s capacity. Even if no further development is allowed in the future, current boating use on the Bird River may require tighter regulations for safety purposes. Survey data gathered in 1977 and 2007 are from relatively low samples. It is desirable to share the observations from the situation analysis contained in this report with local residents and involve these stakeholders in the discussions to help formulate an generally endorsed land use policy for the Bird River. The 2007 RM of Alexander Development Draft Plan recognizes this and establishes as one of the general policies in Section 2.2 the following:
“To ensure that development does not occur on unsuitable lands, unless a appropriate mitigation measures are taken to reduce any potential negative impacts or enhance the capability of the land to support the proposed development” “To ensure that new developments are compatible with existing and anticipated land uses by minimizing the risks to quality of life, public health and safety”
The field study team did not conduct a formal attitude survey within the study area. During the course of the field study comments were received from some area residents which may or may not be shared by others in the study area. However, the commonly accepted values of the community, to a large extent, determine the opinions of the community on matters related to the quality of the living environment and acceptable levels land development. The following is a summary of respondent attitudes or comments volunteered to the study team during our field investigations August 1 and 2nd 2007:

Bird River Recreation Capacity Study
Lombard North Group
60
• Generally, the respondents expressed concern over further seasonal residential development on the river. Some felt that there has been too much development in recent years.
• Most respondents felt that the river is at its peak carrying capacity and any more development would exceed the rivers recreation carrying capacity.
• Some respondents expressed concern over the levels of noise and safety generated from jet skis use of the river.
• Some respondents expressed concern over the amount of shoreline erosion that has taken place along their property line. Many stated that this was directly attributed to higher levels of boating traffic in river, which cause eroding wave action.
• Although most respondents indicated there were alternative forms of recreational use to boating, some respondents indicated they would like to see more land based activities developed and readily accessible. For instance, it was suggested that more hiking trials could alleviate some boating traffic pressure on the river.
Balancing recreational demand and the aesthetic and environmental quality of a lake is a delicate issue. The foregoing, although not a conclusive indication of all respondents’ concerns does provide a sampling of local values and a point of departure for policy formulation. The future vision for the Bird River will need to take note of these issues, validate how broadly they may be held within the study area and in response define directions to resolve or reduce where possible, concerns.

Bird River Recreation Capacity Study
Lombard North Group
61
5.0 SUMMARY OF FINDINGS This section is intended to provide a summary of the major findings resulting from an analysis of all inputs into the study. The related issues represent the major areas that are suggested be addressed in the formulation of policies and planning strategies for the Bird River in Phase #2 of the study. 5.1 BACKSHORE CAPABILITY FOR FURTHER RECREATIONAL
DEVELOPMENT When examining the land resource base in isolation, it is difficult to assess suitable shoreline areas for further recreational development. The study team took an in depth shoreline assessment to determine where (if any) future recreational development should take place. A GIS assessment was used to assess areas where future recreational development along the shoreline should take place using the physical limitations to development layer. In addition to the GIS overlay analysis, the study team took a visual assessment of backshore areas. Backshore development if it is considered should be directed away from the highlighted areas in Map 9: Physical Limitation to Development. Investment alternative forms of backshore recreation facilities should be readily available as part of any further increase in season resort use in the Bird River Study Area and need to be qualified as viable alternatives to replace water oriented recreation so expansion of recreational seasonal resort use does not increase the already stretched water recreation carrying capacity of the Bird River. 5.2 SURFACE WATER RECREATIONAL CAPACITY The major limitation in the study area centres on the boating capacity of the water body. Our analysis in 2007 of the Bird River surface water recreational capacity re-affirmed the findings of the 1977 Study. There is no doubt that the recreational development of the area is geared almost exclusively to boating activities. This can be attributed to the high number of boats and use patterns as observed by the study team. Use patterns indicate that the majority of local and significant regional boating activity, including wakeboarding, waterskiing, jetskiing and pleasure boating take place on the Bird River. In any event, even if the river were not used, the two hundred-fifty plus motor boats that were observed along the shore of the river would still use the waterway as a “water highway” to reach Lake du Bonnet.

Bird River Recreation Capacity Study
Lombard North Group
62
Continued unregulated use by current users and residents activities have the potential to lead to more serious consequences including personal injury from boating conflicts, property damage and general deterioration in the quality of the river’s recreation experience. It was noted in the 1977 study that specific reference is made to the principle of not permitting further development in areas where overcrowding would lead to a deterioration in the quality of recreational experience. It is the opinion of the consultant team that further boat oriented development within the study area will lead to a significant deterioration in the quality of the recreation experience. 5.3 EXISTING DEVELOPMENT ISSUES Many of the existing residences were originally developed as lease type developments. This type of development provides relatively inexpensive vacation sites, however their high density and uncontrolled sprawl leave much to be desired. The former trailer park, located along the north shore of the river, east of the PR 315 bridge; was noted in the 1977 Study has since been replaced by owned residences on lower density subdivided lots. It was recommended in the 1977 study that the Local Government District consider encouraging the redevelopment of the existing trailer sites at a lower density. It was noted that this will not only ease the pressure on the river, but also improve the visual aesthetics of the area. It should be noted that the newest developments have a much greater separation distance than the It is quite evident that a majority of the development along the shoreline of the Bird River continues to be of higher density, for example residential units are closely spaced to one another as are the docks on the water. Even the newer seasonal resort residences built within the past five years continue to be closely spaced to one another. With development since 1977 much of the shoreline reeds have been cleared to allow easier access for swimming and boating activities. Paths have also been cleared from many of the residences to the water. It was recommended in the 1977 study that if any residential development is to take place along the shoreline of the Bird River, it should take place at a density of lower than 1 unit/5 acres. It is estimated that the average unit lot density along the shoreline of the Bird River is 1 unit/0.5 acres providing 259 seasonal residential units, located along the 7.8km stretch of shoreline as counted by the 2007 study team. Also counted were 267 boats, located along the 7.8km stretch of the Bird River that falls within the study area which is roughly 1 boat/residential unit. It was stated in the 1977 study and previously in this study that the estimated carrying capacity for the Bird River 51 boats, using the standard of one boat per 5 acres which represents twice the acceptable density used in the other areas.

Bird River Recreation Capacity Study
Lombard North Group
63
6.0 APPENDICIES Appendix 1: Bird River Boater Survey
RE BIRD RIVER?
1. What are your primary recreation uses on the Bird River and shore area? 2. Where are you coming from? – please indicate on map with pin 3. On average, what is your typical duration of time spent on the Bird River? 4. How many boats would you estimate come in to the Bird River on a weekly basis?
How would you rate the present level of recreational boating traffic on the Bird River?
i) Not much boating use, - what number/week? ii) Boating use is acceptable – what number/week? ; or iii) Boating use has risen to unacceptable levels – what number/week?
5. If answered number iii) probe about why it is unacceptable in their opinion (ie limits enjoyment of river by other users, safety etc.?)
a) Second probe – In your opinion what would be a tolerable level of boating? b) Third Probe – How can this be achieved (ie speed limits, restrict access,
enforcement?)
THE FUTURE OF

Bird River Recreation Capacity Study
Lombard North Group
64
6. How has use of the Bird River changed over the years you have been familiar with the River?
7. Are there alternative recreation activities available that can meet recreation needs
of vacationers as an alternative to power boating on the river? 8. Any additional comments you would like to add?

Bird River Recreation Capacity Study
Lombard North Group
65
Appendix 2: Water Quality Test Results
Bird River Water Sampling Averaged Results for 1995 and 2007 Year of Study
Fecal Coliform Nitrate+Nitrate Dissolved Ammonia Chlorophyll
Dissolved Phosphorus
Total Phosphorus
TK Nitrogen
1995 58
CFU/100ml* <0.01mg/L <0.02mg/L 4.93ug/L 0.014mg/L 0.029mg/L 0.616mg/L
2007 <10
CFU/100ml 0.02mg/L 0.015mg/L not tested 0.015mg/L 0.029mg/L 0.775mg/L *note: The Fecal Coliform testing for the 1995 study contained a few extremely high anomalies for sample site B. If sample site B is excluded from the average, then the average would be 12.4 CFU/100ml
Bird River Water Sampling Results: 2007
Sample Site Fecal
Coliform Nitrate+Nitrate Dissolved Ammonia Chlorophyll Dissolved
Phosphorus Total
Phosphorus TK
Nitrogen A 10 CFU/100ml 0.018mg/L 0.015mg/L not tested 0.015mg/L 0.034mg/L 0.7mg/L B <10 CFU/100ml 0.013mg/L 0.012mg/L not tested 0.012mg/L 0.029mg/L 0.6mg/L C <10 CFU/100ml 0.025mg/L 0.016mg/L not tested 0.012mg/L 0.028mg/L 0.5mg/L D <10 CFU/100ml 0.025mg/L 0.018mg/L not tested 0.012mg/L 0.025mg/L 0.6mg/L

Bird River Recreation Capacity Study
Lombard North Group
66
Appendix 3: Total Number of Approved Lots Since 1991
• *Trailer park created 12 lots, each lot has a site area of 0.5 acres. The public reserve is
68 acres in size. ** has plans for 20 new lots in total – 3 are only the initial first phase.
Total Number of lots approved since 1991:36 lots Conditional approval given: 24 lots At CPS waiting to give Council Referral: 1 lot
Applicant name
CPS file number
Section-Township-Range
Number of lots
status
Shield Development
4600-1994-4028
03-17-13EPM 41 new lots Rejected
Pioneer Beach*
4600-1996-4194
12-17-13EPM 12 new lots and a public reserve
Final approval given
Hupalo/ Ledin 4600-1998-4373
04-17-13EPM 1 new lot Never completed
Tagesen 4600-1998-4414
01-17-13EPM 12-17-13EPM
2 new lots Final approval given
Shield Development
4600-1999-4458
03-17-13EPM 20 new lots Final approval given
Tagesen 4600-2000-4552
02-17-13EPM 1 new lot Final approval given
Kuehn 4600-2003-4902
12-17-13EPM 1 lot Final approval given
Kozakowski** 4600-2004-4961
11-17-13EPM 3 new lots Needs to acquire crown before circulating
Hupalo/ Leddin 4600-2005-5034
04-17-13EPM 24 new lots Conditional approval issued April 18, 2006
Koke 4600-2005-5030
04-17-13EPM 1 new lot Referred to Council November 2005 nothing further in file
Rakar 4600-2006-5134
07-17-13EPM 1 new lot At CPS office – waiting for CPS to draft referral to Council dependant on the number of lots

Bird River Recreation Capacity Study
Lombard North Group
67
Appendix 4: Counted Boats (2007) Boats – Type Bird River Inlet + Tall Timber
South Shore: 32
South Shore: 5
12’ or longer fishing boats (including tied to docks or trailers)
North Shore: 16
North Shore: 0
Total 48 5 South Shore: 36
South Shore: 10
Power/ Speed Boats
North Shore: 39
North Shore: 8
Total 75 18 South Shore: 17
South Shore: 4
Boathouses (assuming each contains at least one watercraft)
North Shore: 41
North Shore: 0
Total 58 4 South Shore: 13
South Shore: 2
Jet Ski’s/Personal Watercraft
North Shore: 13
North Shore: 0
Total 26 2 South Shore: 15
South Shore: 1
Pontoon Boats
North Shore: 10
North Shore: 2
Total 25 3 South Shore: 0
South Shore: 0
Planes
North Shore: 3
North Shore: 0
Total 3 0 Grand Total 235 32 Overall Total 267

Bird River Recreation Capacity Study
Lombard North Group
68
Appendix 5: Estimated Speed of Traveling Boats (2007) Coasting
(Coasting: ≤20km/h)Cruising
(21km/h-60km/h) Full Speed
(≥61km/h)
Total Boats – Type Aluminum Boat (fishing)
3
1
Speed Boat
1
2
Jet Ski
Wakeboard Boat
Pontoon Boat
House Boat
Sail Boat
Other _____________ _____________
Total
4
3
Grand Total 7
Bird River Recreation Capacity Study
Lombard North Group
69
7.0 REFERENCES Aviation Safety Authority Advisory Circular (2005). Available at: http://www.auf.as
n.au/groundschool/umodule14.html#landing_area2. Last viewed: October, 2007.
Beck, Al (1995). Winnipeg River Planning District (1995). Resolution# 75/95: Water Quality Sampling, Bird River, June to August 1, 1995. Flight School List (2007) Available at: http://www.flightschoollist.com. Last viewed October, 2007. Lee, Don (2007). Alaska Floats (2007) Available at www.AlaskaFloats.com. E- mail response given October 10, 2007. Manitoba Land Initiative (MLI) (2003). Agricultural Interpretations Database Description. Available at https://web2.gov.mb.ca/mli/soils/soilaid/metafiles/ soilaid_description.doc. Last viewed: September, 2007. Manitoba Surface Water Quality Objectives and Guidelines (MSWQOG) (2002). Manitoba Conservation Report. 2002-11. Napa County Airport Data (2001). Available at http://www.napacountyairport.org/ Uploads/Files/MasterPlan2007/Appendix%20E.INM%20noise%20data.pdf and http://www.napacountyairport.org/uploads/pageimages/areamap.jpg. Last viewed October, 2007. Westland Planning Consultants (1977) Bird River Sector Plan Study. Prepared for L.G.D of Alexander. 1978. Municipal Planning Branch.