birds generally carry a small repertoire of bitter taste...
TRANSCRIPT
1
Research Article to GBE
Birds generally carry a small repertoire of bitter taste receptor genes
Kai Wang, and Huabin Zhao
*
Department of Ecology, College of Life Sciences, Wuhan University, Wuhan 430072,
China
*Correspondence to
Huabin Zhao
Department of Ecology
College of Life Sciences
Wuhan University
Wuhan, Hubei 430072, China
Tel: +86-27-68753526
Email: [email protected]
Running head: Bitter taste evolution in birds
Key words: bitter taste, Tas2r, diet, birds, feeding ecology
© The Author(s) 2015. Published by Oxford University Press on behalf of the Society for Molecular Biology and Evolution.This is an Open Access article distributed under the terms of the Creative Commons Attribution License (http://creativecommons.org/licenses/by/4.0/), which permits unrestricted reuse, distribution, and reproduction in any medium, provided the original work is properly cited.
Genome Biology and Evolution Advance Access published September 4, 2015 doi:10.1093/gbe/evv180 at W
uhan University L
ibrary on September 5, 2015
http://gbe.oxfordjournals.org/D
ownloaded from

2
ABSTRACT
As they belong to the most species-rich class of tetrapod vertebrates, birds
have long been believed to possess an inferior taste system. However, the bitter taste
is fundamental in birds to recognize dietary toxins (which are typically bitter) in
potential food sources. To characterize the evolution of avian bitter taste receptor
genes (Tas2rs) and to test whether dietary toxins have shaped the repertoire size of
avian Tas2rs, we examined 48 genomes representing all but three avian orders. The
total number of Tas2r genes was found to range from 1 in the domestic pigeon to 12
in the bar-tailed trogon, with an average of 4, which suggested that a much smaller
Tas2r gene repertoire exists in birds than in other vertebrates. Furthermore, we
uncovered a positive correlation between the number of putatively functional Tas2rs
and the abundance of potential toxins in avian diets. Because plant products contain
more toxins than animal tissues and insects release poisonous defensive secretions, we
hypothesized that herbivorous and insectivorous birds may demand more functional
Tas2rs than carnivorous birds feeding on non-insect animals. Our analyses appear to
support this hypothesis and highlight the critical role of taste perception in birds.
at Wuhan U
niversity Library on Septem
ber 5, 2015http://gbe.oxfordjournals.org/
Dow
nloaded from
3
INTRODUCTION
Sensing the external environment is of critical importance for the survival of
animals. The five traditional senses in vertebrates of taste, sight, smell, sound and
touch recognize environmental cues that trigger or adjust animal behaviors
accordingly. The sense of taste is specialized to evaluate the chemical components in
potential food resources, which evoke appetitive or aversive reactions to ensure the
ingestion of nutrients rather than poisonous substances (Yarmolinsky et al. 2009). The
five basic taste modalities in vertebrates are bitter, sweet, umami, sour, and salty
(Lindemann 1996; Bachmanov and Beauchamp 2007). Of them, bitter taste is
dedicated to identifying bitter-tasting chemicals, such as plant alkaloids and insect
defensive secretions (Garica and Hankins 1975; de Jong et al. 1991; Glendinning
1994), which are potentially poisonous to animals. Thus, bitter taste is a critical
natural defense preventing the ingestion of toxic or harmful substances, which are
typically bitter in nature (Garica and Hankins 1975; Glendinning 1994).
Bitter taste is conferred by the physical interaction of bitter chemicals with a
group of G protein-coupled receptors (Tas2rs) that are encoded by members of the
type 2 taste receptor genes (Tas2rs) (Adler et al. 2000; Chandrashekar et al. 2000;
Matsunami et al. 2000). It is generally believed that the repertoire size of taste
receptors is intimately associated with the external environment that animals inhabit.
Indeed, the total number of Tas2rs, varying substantially from three in the chicken to
69 in the guinea pig, and the number of putatively functional Tas2rs, ranging from 0
at Wuhan U
niversity Library on Septem
ber 5, 2015http://gbe.oxfordjournals.org/
Dow
nloaded from

4
in the dolphin to 51 in the frog, are positively correlated with the amount of plant
materials in diets across vertebrates (Li and Zhang 2014). In addition, frequent
expansions of Tas2rs in some primate lineages were also assumed to link with the
development of plant feeding (Hayakawa et al. 2014). These findings agreed with the
assumption that plant materials contain more bitter compounds than animal tissues
(Glendinning 1994; Wang et al. 2004) and supported the hypothesis that bitter tastants
have driven the evolution of the Tas2r gene repertoire in vertebrate animals (Li and
Zhang 2014). Thus, bitter taste is a good model to evaluate how the chemosensory
receptor gene repertoire was shaped by dietary or environmental factors. However,
within vertebrates, birds were reported to possess a smaller Tas2r gene repertoire
compared with mammals (Go 2006; Li and Zhang 2014; Zhao et al. 2015).
Specifically, the members of Tas2rs have been examined thus far in 16 birds with
fully sequenced genomes, ranging from 1 in the dove (i.e., domestic pigeon) to 12 in
the hummingbird (Zhao et al. 2015), with an average of five, whereas the Tas2rs of
mammals vary in number from 10 in the dolphin (or platypus) to as many as 69 in the
guinea pig, with an average of 31 (Li and Zhang 2014). Similarly, the number of
putatively functional Tas2rs in birds (a mean of 3.9 and a range of 0-10) is generally
lower than that in mammals (a mean of 19.5 and a range of 0-36) (Li and Zhang 2014;
Zhao et al. 2015). The taste receptor genes in birds have not been well characterized
thus far because the avian taste system has long been believed to be largely reduced,
as inferred from a low number of taste buds and the absence of teeth (Roura et al.
at Wuhan U
niversity Library on Septem
ber 5, 2015http://gbe.oxfordjournals.org/
Dow
nloaded from
5
2013). Indeed, chickens show an indifference to sweet stimuli in behavioral tests
(Ganchrow et al. 1990), and the gene encoding the sweet taste receptor is missing
from its genome (Shi and Zhang 2006). Intriguingly, some birds, such as the
white-throated sparrow (Zonotrichia albicollis), were found to have 18 putatively
functional Tas2rs, a number that is comparable to many mammals (Davis et al. 2010).
Such a dramatic change in the Tas2r repertoire size may not be uncommon in birds
with the increasing number of additional avian genomes being deciphered. To
characterize the origin and evolution of avian Tas2rs and to test whether dietary toxins
have shaped the repertoire size of avian Tas2rs, we examined 48 avian genomes,
representing nearly all avian orders (Jarvis et al. 2014; Zhang et al. 2014), to
understand the evolution of Tas2rs in birds. We found that the putatively functional
Tas2rs repertoire size in birds is positively correlated with the abundance of potential
toxins in their diets, although birds generally carry a small number of Tas2rs.
MATERIALS AND METHODS
Diet classification
Very few bird species feed on a single type of food; the composition of avian
diets is significantly influenced by food availability, seasonal changes, age, and other
factors (DeGolier et al. 1999). To be consistent with earlier studies, we followed the
method of Wilson (Wilson 1974), which is based on the stomach contents: when a
food type predominated in the stomachs of 51% or more of samples, the bird species
at Wuhan U
niversity Library on Septem
ber 5, 2015http://gbe.oxfordjournals.org/
Dow
nloaded from

6
was assigned to that food category (DeGolier et al. 1999). We did our best to search
the quantitative data regarding diet composition in the literature (supplementary
table S1) and the Animal Diversity Web (http://animaldiversity.org); when such data
were not available but a food type was the most abundant component in the
description of food habits, we assigned the species to that food category. Because
plant products may contain more toxins than animal tissues and insects release
poisonous defensive secretions, we did not differentiate qualitatively among birds that
feed on different plant products, whereas birds that eat animals were divided into
insectivores (insect eaters) and carnivores (non-insect animal eaters). As a result, we
classified birds into seven categories according to their food habits (supplementary
table S1): (1) Folivores (referring to bird species that mostly eat leaves); (2)
Frugivores (referring to those birds that mostly feed on fruits); (3) Granivores
(referring to birds that predominantly eat the seeds of plants); (4) Nectarivores
(referring to those that mainly feed on the sugar-rich nectar); (5) Insectivores
(referring to any bird species that predominantly feeds on insects); (6) Carnivores
(referring to any bird species that predominantly eats non-insect animals, such as
piscivores); and (7) Omnivores (referring to any bird species that eats insects,
non-insect animals and plant products without quantitative records).
Genome data
A total of 48 avian genome sequences, including 45 that were recently
at Wuhan U
niversity Library on Septem
ber 5, 2015http://gbe.oxfordjournals.org/
Dow
nloaded from
7
released (Jarvis et al. 2014; Zhang et al. 2014) and three that were published earlier
(Hillier et al. 2004; Dalloul et al. 2010; Warren et al. 2010), were retrieved from the
Avian Phylogenomics Project (http://avian.genomics.cn/en/). The three genome
sequences of crocodilians, representing the closest outgroup of all extant birds (Green
et al. 2014), were obtained from the National Center for Biotechnology Information
database with the following accession numbers: AKHW00000000 (Alligator
mississippiensis), JRXG00000000 (Crocodylus porosus), and JRWT00000000
(Gavialis gangeticus).
Gene identification
Vertebrate Tas2rs are single-exon genes that encode bitter taste receptors
characterized by seven transmembrane domains (Adler et al. 2000; Chandrashekar et
al. 2000; Matsunami et al. 2000). To identify the Tas2r repertoire in each of the 48
birds and in three outgroup species of crocodilians, we followed an earlier study (Shi
and Zhang 2006), with minor modifications. First, we used full-length Tas2r protein
sequences from human, mouse, zebra finch, chicken, lizard, frog, and zebra fish as
queries to conduct TBLASTN searches against each of the 51 genomes, with a cutoff
E-value of 1e-10. Second, we filtered the redundant sequences that hit on the same
genomic regions and discarded the blast-hits that were shorter than 200 nucleotides.
Third, the remaining blast-hits were extracted from the genomes and extended in both
5’ and 3’ directions. Those with more than 270 codons and a putative start and stop
at Wuhan U
niversity Library on Septem
ber 5, 2015http://gbe.oxfordjournals.org/
Dow
nloaded from
8
codon are intact genes; those with more than 200 nucleotides and a putative start
codon (or a putative stop codon) were considered to be partial genes, which were
characterized by a truncated open reading frame resulting from either incomplete
genome sequencing or poor genomic assembly; those with more than 200 nucleotides
and an interrupted reading frame were regarded to be pseudogenes. Fourth, we used
newly obtained intact genes as queries to conduct TBLASTN searches against the
genomes and attempted to identify additional Tas2rs. Fifth, all full-length genes were
checked to predict whether the seven transmembrane domains were intact using the
TMHMM method (Sonnhammer et al. 1998), and those without any of domains were
considered to be partial genes. We additionally assessed whether the partial genes are
from independent loci or not, which is particularly necessary for low-coverage
genomes. If multiple partial genes from a given species share a same orthology but do
not overlap, these partial genes could be a single gene due to poor genomic assembly
(supplementary table S2), as suggested in a previous study (Hayakawa et al. 2014).
Synteny analysis is also helpful to assess whether partial genes are unique, as shown
in supplementary table S3. All candidate genes were ultimately verified by BlastN
searches against the GenBank database, with the best hits being the known Tas2r
genes. The deduced protein sequences of all newly identified intact genes are
provided in the supplementary data set S1.
at Wuhan U
niversity Library on Septem
ber 5, 2015http://gbe.oxfordjournals.org/
Dow
nloaded from
9
Phylogenetic analysis
A total of 116 avian and 20 crocodilian intact Tas2rs were analyzed with an
alligator V1r1 gene (GenBank: XM_006031313) as the outgroup because vertebrate
V1r genes are closely related to Tas2rs among the G protein-coupled receptor genes
(Matsunami et al. 2000; Shi and Zhang 2006). The 136 Tas2rs and one V1r1 were
translated into protein sequences and were subsequently aligned with the MUSCLE
program (Edgar 2004), and the resulting alignment was subjected to manual
inspection in MEGA6 (Tamura et al. 2013). Phylogenetic analyses were conducted by
both Neighbor-Joining (NJ) (Saitou and Nei 1987) and Bayesian Inference (BI) (Yang
and Rannala 1997) approaches. The NJ phylogenetic tree was reconstructed using the
protein Poisson distances (Nei and Kumar 2000) and the pairwise-deletion of gap sites
implemented in MEGA6 and was evaluated with 1,000 bootstrap replicates
(Felsenstein 1985a). The BI tree was constructed by MrBayes version 3.1.2 (Ronquist
and Huelsenbeck 2003) with six million generations after the best-fitting substitution
model was determined by the jModelTest2 program (Darriba et al. 2012), following
Bayesian information criterion (Posada and Buckley 2004).
Evolutionary analysis
To infer the processes of gains and losses of Tas2rs across the bird phylogeny,
we carried out a reconciliation analysis in NOTUNG 2.6 program (Chen et al. 2007)
by comparing the species tree with the gene tree. This method works with a
at Wuhan U
niversity Library on Septem
ber 5, 2015http://gbe.oxfordjournals.org/
Dow
nloaded from
10
non-binary gene tree where some nodes are collapsed due to weak support. The gene
gains and losses were predicted by the incongruence between the species and gene
trees on the basis of the parsimony principle. The species tree topology was taken
from a recent study (Zhang et al. 2014), while the gene tree topology was from our BI
tree (Supplementary fig. S1) where nodes with Bayesian posterior probability below
50% were collapsed, as shown in the supplementary fig. S2.
To determine the potential impact of the feeding ecology on the evolution of
the Tas2r gene repertoire size in birds, we coded each bird as 0 (carnivore) and 1
(insectivore/folivore/frugivore/granivore/nectarivore) according to the abundance of
plant products or insect tissues in their diets because plant and insect tissues may have
the most abundant potential toxins, whereas non-insect animals have the least. With
one exception, all of the studied omnivorous birds were described in the relevant
literature (supplementary table S1). The diet of each omnivorous species appeared to
contain 51% or more plant and insect tissues; we therefore coded each omnivorous
bird as 1. The only exception is the carnivorous red-legged seriema (del Hoyo et al.
1992), for which we were unable to determine the amount of non-insect, insect and
plant tissues in its diet; we therefore coded the red-legged seriema as 0 and 1
separately to verify the analysis. A regression analysis of Tas2r gene repertoire size
against diet codes was conducted. Because our data do not fit the standard normal
distribution (P <0.05, Kolmogorov–Smirnov test), the nonparametric Spearman’s rank
correlation coefficient (ρ) was used to assess the correlation. As described earlier, we
at Wuhan U
niversity Library on Septem
ber 5, 2015http://gbe.oxfordjournals.org/
Dow
nloaded from

11
used two sets of Tas2r genes to test the consistency: the first consisted of all
putatively functional Tas2rs (intact and partial genes), and the second comprised all
Tas2rs (intact, partial and pseudogenes). Functional genes can reflect the
physiological needs, and identifiable pseudogenes that were recently lost may also
reflect the physiological needs. Indeed, both the total number and the proportion of
functional olfactory receptor genes were found to be positively correlated with
olfactory acuity in mammals (Rouquier et al. 2000; Gilad et al. 2004). Because the
phylogenetic inertia can potentially confound comparative analyses across a group of
species (Fisher and Owens 2004), we performed a phylogenetically independent
contrast (PIC) analysis implemented in the package Analyses of Phylogenetics and
Evolution (Paradis et al. 2004). The input tree is the species tree (Zhang et al. 2014),
and the branch lengths were estimated from the divergence times among species
according to a recent study (Jarvis et al. 2014) and the TimeTree database
(http://www.timetree.org/). We did not inlcude the white throated sparrow because its
divergence time from other birds is unknown.
RESULTS
Identification of Tas2rs
The avian Tas2r gene repertoire was characterized in few species due to the
scarcity of available genome sequences (Li and Zhang 2014; Zhao et al. 2015).
Recently, a total of 48 avian genome sequences were reported (Jarvis et al. 2014;
at Wuhan U
niversity Library on Septem
ber 5, 2015http://gbe.oxfordjournals.org/
Dow
nloaded from

12
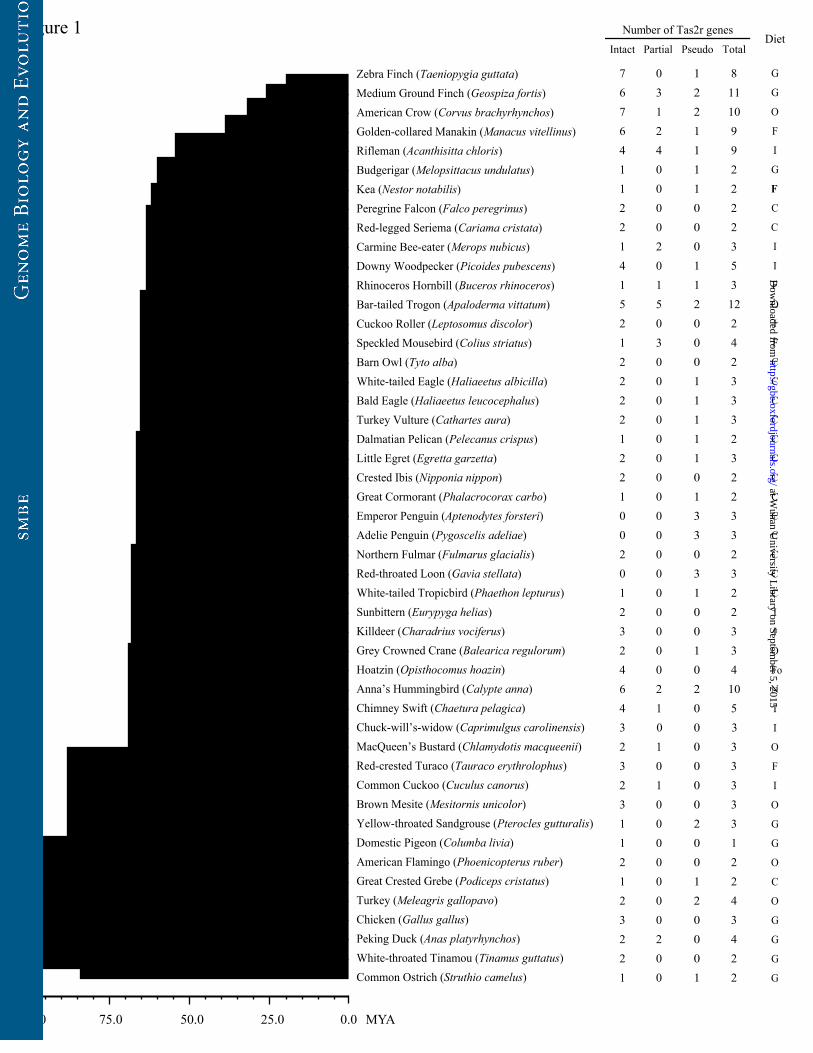
Zhang et al. 2014). By using the published vertebrate Tas2rs as queries, we performed
TBLASTN searches and identified Tas2rs from the genome sequences of 48 birds (fig.
1 and supplementary table S4), representing all but three orders in the class Aves
(Jarvis et al. 2014; Zhang et al. 2014). For convenience, we classified the identified
Tas2rs into three categories: intact genes (with an intact open reading frame [ORF]
and complete coding region), partial genes (with an intact ORF but partial coding
region due to incomplete genome sequencing), and pseudogenes (with a disruptive
ORF resulting from nonsense or frame-shifting mutations). The intact and partial
genes are putatively functional, whereas the pseudogenes are possibly nonfunctional.
We detected 0-7 intact genes (mean=2.4; median=2), 0-5 partial genes (mean=0.6;
median=0), and 0-3 pseudogenes (mean=0.8; median=1) (fig. 1). The number of
putatively functional Tas2rs in each species varied from 0 in the red-throated loon and
the two penguins to 10 in the bar-tailed trogon, with a mean of 3 (fig. 1). While all
three categories of Tas2rs were counted, the gene number ranged from 1 in the
domestic pigeon to 12 in the bar-tailed trogon, with an average of 4 (fig. 1). Overall,
the Tas2r gene repertoire size in bird species is much smaller than that in mammals
(Li and Zhang 2014). To detect whether avian Tas2rs were resulted from tandem
duplication as did mammalian Tas2rs, we checked the genomic location for each
Tas2r gene. Indeed, some Tas2rs were found to be aligned in arrays (supplementary
table S5). Furthermore, we found that longer scaffolds tend to have more tandem
duplicates of Tas2r genes (supplmentary table S6; R=0.617, P=0.025, Pearson
at Wuhan U
niversity Library on Septem
ber 5, 2015http://gbe.oxfordjournals.org/
Dow
nloaded from
13
correlation test), which is also a signature of tandem duplication. In addition, we
similarly searched the genome sequences of three crocodilians, which are the closest
outgroup of all extant birds, and identified 10, 6, and 11 Tas2rs (supplementary table
S4), suggesting that these reptiles have lower Tas2r gene numbers than other reptiles,
such as the lizard (50 in total) (Li and Zhang 2014).
Phylogenetic reconstruction
We aligned the deduced protein sequences of 136 intact Tas2rs from 45 birds
(the red-throated loon and the two penguins have no intact Tas2r) and three
crocodilians. The resulting alignment was used to construct phylogenetic trees with
the Neighbor-Joining (NJ) and Bayesian Inference (BI) approaches, and a crocodilian
V1r gene was used as an outgroup. The partial genes and pseudogenes were not
included in our phylogenetic analyses because most were too short to be aligned. The
BI phylogenetic tree showed that all avian Tas2r genes formed three clades (fig. 2 and
supplementary fig. S1). Each of the three avian clades was allied with a group of
crocodilian genes (fig. 2), suggesting that these genes appeared to have originated
prior to the divergence of archosaurs (including crocodilians, dinosaurs, and birds).
The first clade of avian genes was found to be enriched with putatively
species-specific duplications, which are indicated by various colors (fig. 2). For
example, the bar-tailed trogon has a cluster of four genes and Anna’s hummingbird is
characterized by a cluster of five genes. Tests of gene conversion among paralogous
at Wuhan U
niversity Library on Septem
ber 5, 2015http://gbe.oxfordjournals.org/
Dow
nloaded from
14
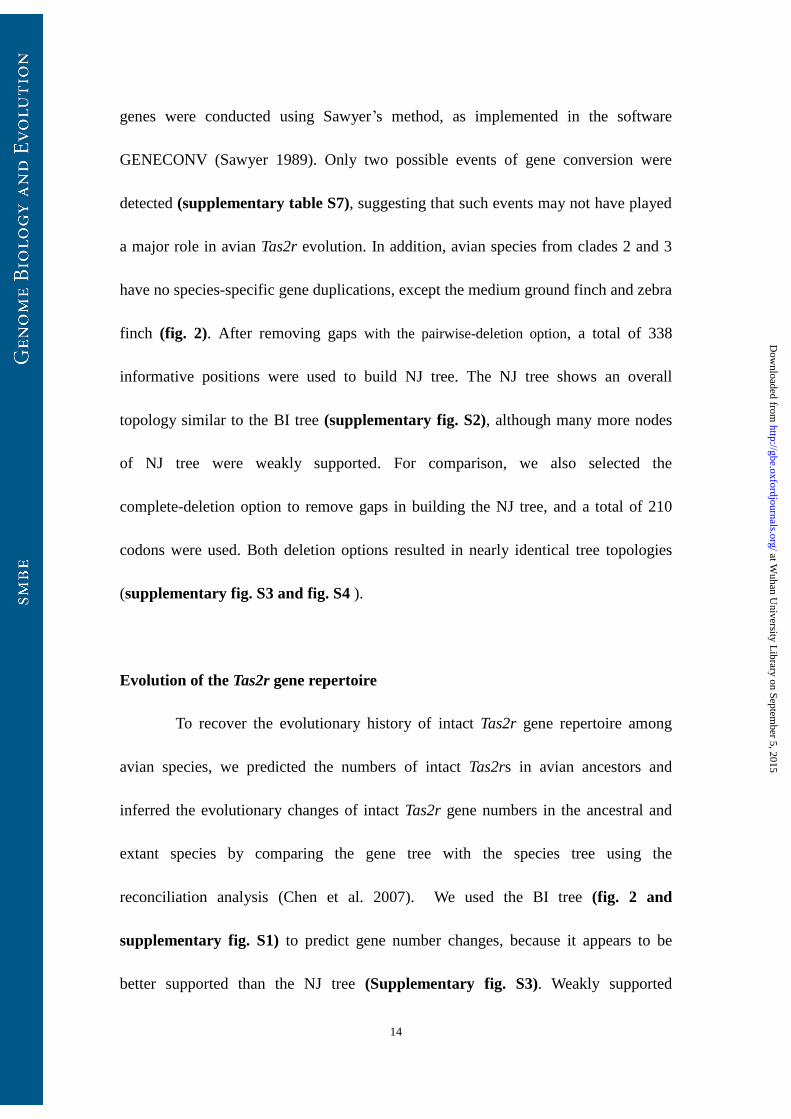
genes were conducted using Sawyer’s method, as implemented in the software
GENECONV (Sawyer 1989). Only two possible events of gene conversion were
detected (supplementary table S7), suggesting that such events may not have played
a major role in avian Tas2r evolution. In addition, avian species from clades 2 and 3
have no species-specific gene duplications, except the medium ground finch and zebra
finch (fig. 2). After removing gaps with the pairwise-deletion option, a total of 338
informative positions were used to build NJ tree. The NJ tree shows an overall
topology similar to the BI tree (supplementary fig. S2), although many more nodes
of NJ tree were weakly supported. For comparison, we also selected the
complete-deletion option to remove gaps in building the NJ tree, and a total of 210
codons were used. Both deletion options resulted in nearly identical tree topologies
(supplementary fig. S3 and fig. S4 ).
Evolution of the Tas2r gene repertoire
To recover the evolutionary history of intact Tas2r gene repertoire among
avian species, we predicted the numbers of intact Tas2rs in avian ancestors and
inferred the evolutionary changes of intact Tas2r gene numbers in the ancestral and
extant species by comparing the gene tree with the species tree using the
reconciliation analysis (Chen et al. 2007). We used the BI tree (fig. 2 and
supplementary fig. S1) to predict gene number changes, because it appears to be
better supported than the NJ tree (Supplementary fig. S3). Weakly supported
at Wuhan U
niversity Library on Septem
ber 5, 2015http://gbe.oxfordjournals.org/
Dow
nloaded from
15
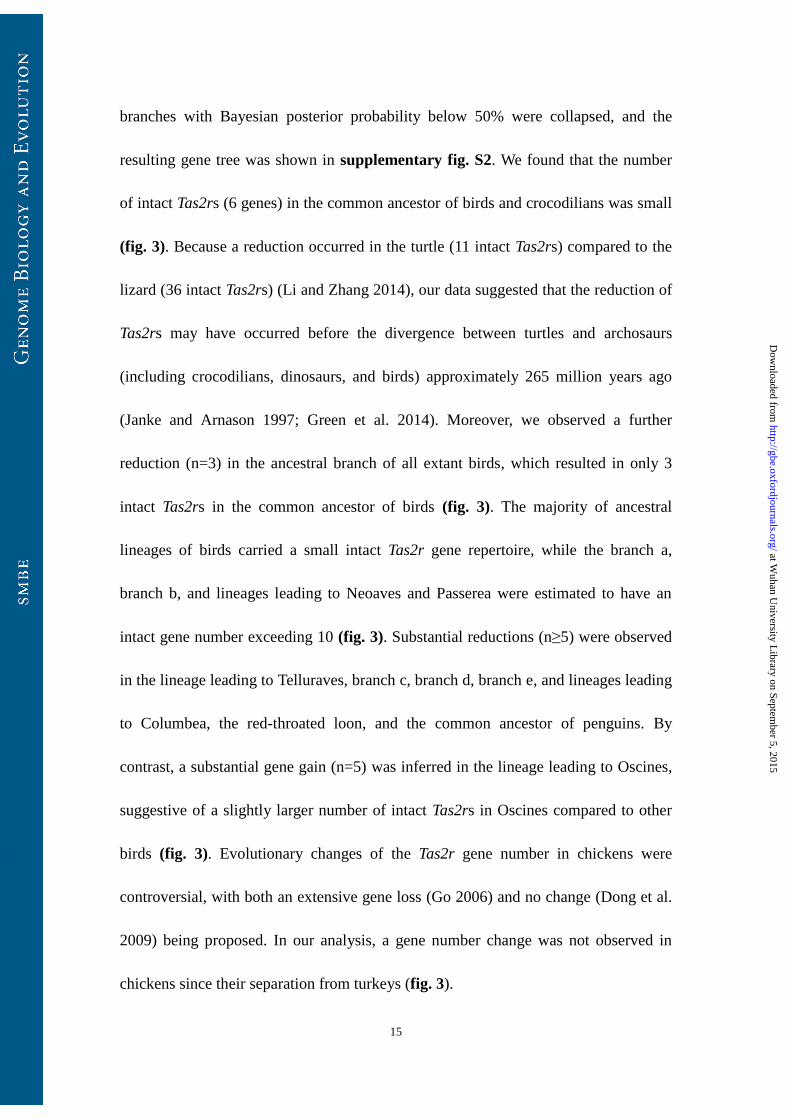
branches with Bayesian posterior probability below 50% were collapsed, and the
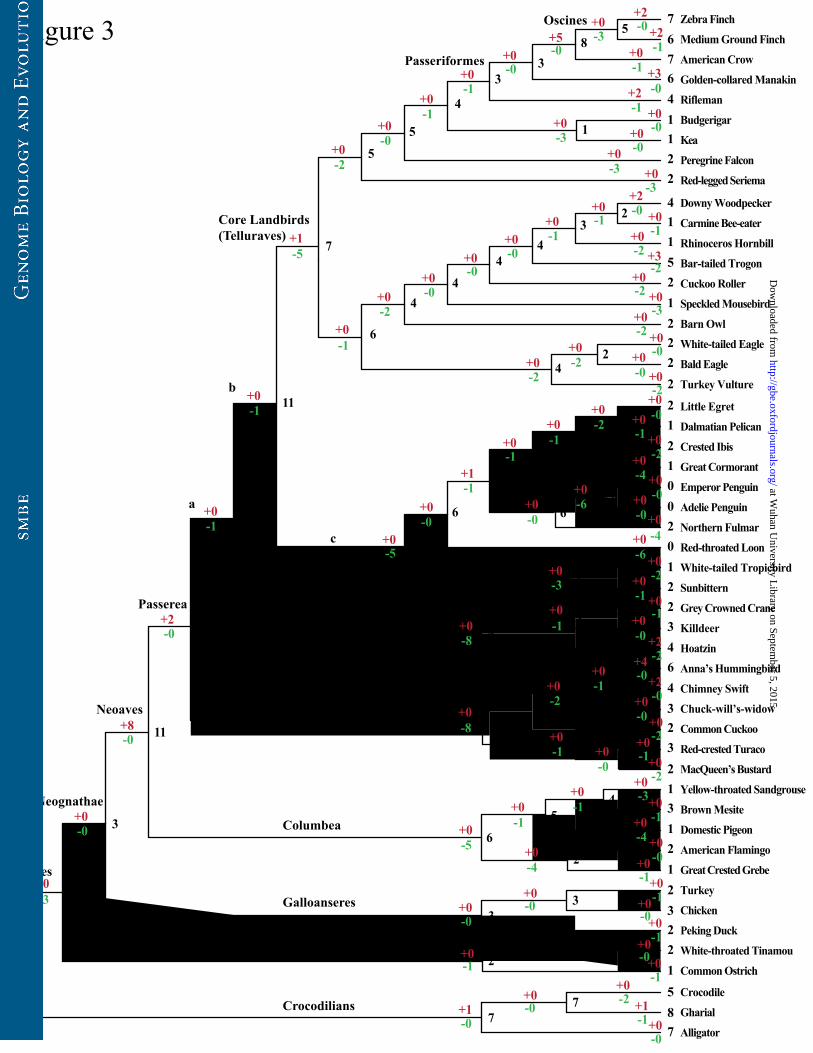
resulting gene tree was shown in supplementary fig. S2. We found that the number
of intact Tas2rs (6 genes) in the common ancestor of birds and crocodilians was small
(fig. 3). Because a reduction occurred in the turtle (11 intact Tas2rs) compared to the
lizard (36 intact Tas2rs) (Li and Zhang 2014), our data suggested that the reduction of
Tas2rs may have occurred before the divergence between turtles and archosaurs
(including crocodilians, dinosaurs, and birds) approximately 265 million years ago
(Janke and Arnason 1997; Green et al. 2014). Moreover, we observed a further
reduction (n=3) in the ancestral branch of all extant birds, which resulted in only 3
intact Tas2rs in the common ancestor of birds (fig. 3). The majority of ancestral
lineages of birds carried a small intact Tas2r gene repertoire, while the branch a,
branch b, and lineages leading to Neoaves and Passerea were estimated to have an
intact gene number exceeding 10 (fig. 3). Substantial reductions (n≥5) were observed
in the lineage leading to Telluraves, branch c, branch d, branch e, and lineages leading
to Columbea, the red-throated loon, and the common ancestor of penguins. By
contrast, a substantial gene gain (n=5) was inferred in the lineage leading to Oscines,
suggestive of a slightly larger number of intact Tas2rs in Oscines compared to other
birds (fig. 3). Evolutionary changes of the Tas2r gene number in chickens were
controversial, with both an extensive gene loss (Go 2006) and no change (Dong et al.
2009) being proposed. In our analysis, a gene number change was not observed in
chickens since their separation from turkeys (fig. 3).
at Wuhan U
niversity Library on Septem
ber 5, 2015http://gbe.oxfordjournals.org/
Dow
nloaded from
16
To examine whether dietary preferences influenced the evolution of avian
Tas2r gene repertoires, which are generally small in size, we divided birds into
carnivores, insectivores, folivores, frugivores, granivores, nectarivores, and
omnivores (fig. 1) according to the Animal Diversity Web (http://animaldiversity.org/)
and other references (supplementary table S1). Because insectivorous birds feed on
insects, of which many species release defensive secretions that are toxic to their
predators (Weatherston 1970; Blum 1981; de Jong et al. 1991), we assumed that
insectivorous birds may confront a similar amount of toxins as their herbivorous
relatives, although it is well known that plant tissues tend to contain more toxins than
animal tissues (Glendinning 1994; Wang et al. 2004; Li and Zhang 2014). Indeed, this
assumption was supported by multiple Tas2r gene expansions in insect-eating bats
rather than fruit-eating bats (Zhou et al. 2009). We predicted that carnivorous birds
carry smaller Tas2r gene repertoires than other birds. We coded the dietary preference
in a bird as 0 (carnivore) or 1 (insectivore/folivore/frugivore/granivore/nectarivore)
under the assumption that other birds consuming more plant and insect tissues
encounter more toxins than do carnivorous birds. After converting the diet codes and
the Tas2r gene numbers into phylogenetically independent contrasts (PICs)
(Felsenstein 1985b), we conducted a regression analysis. We observed a significant
positive correlation between the PICs of the functional Tas2r gene numbers and those
of diet codes (Spearman’s ρ=0.409, P=0.004; fig. 4). The same trend was revealed
when the PICs of the total Tas2r numbers were correlated with the PICs of the diet
at Wuhan U
niversity Library on Septem
ber 5, 2015http://gbe.oxfordjournals.org/
Dow
nloaded from

17
codes (ρ=0.314, P=0.032; fig. 4). We repeated the PIC analysis while coding the
red-legged seriema as 1 because this bird may be omnivorous (del Hoyo et al. 1992).
The repeated analysis confirmed the correlation between diet codes and functional
Tas2r gene numbers (ρ=0.335, P=0.021; supplementary fig. S5) and revealed a same
trend between the PICs of diet codes and those of total Tas2r gene numbers, although
it was not significant (ρ=0.235, P=0.111; supplementary fig. S5). To compare with
an earlier vertebrate-wide study (Li and Zhang 2014), we also coded insectivores as 0,
the positive correlation between the PICs of diet codes and those of functional gene
numbers remains significant (ρ=0.319, P=0.029). Our findings clearly showed a
significant positive correlation between number of functional Tas2rs in birds and
amount of potential toxins in their diet.
DISCUSSION
With the advent of 45 recently released avian genome sequences, we
identified 215 Tas2rs from 48 avian and 3 crocodilian genomes and characterized the
evolutionary history of avian Tas2rs spanning approximately 100 million years (Jarvis
et al. 2014). The avian Tas2r gene repertoire contains approximately 4 members, on
average, ranging from 1 to 12 (fig. 1 and supplementary table S4). Relative to most
other vertebrates (Li and Zhang 2014), bird species exhibit a dramatic reduction of the
Tas2r repertoire size. Furthermore, we found that carnivorous birds carry a smaller
Tas2r repertoire than do other birds and observed a positive correlation between
at Wuhan U
niversity Library on Septem
ber 5, 2015http://gbe.oxfordjournals.org/
Dow
nloaded from
18
number of putatively functional Tas2rs and amount of potential toxins in the diet,
supporting the hypothesis that dietary toxins have driven the evolution of bitter taste
receptor genes, even in bird species carrying diminutive Tas2r repertoires.
The 48 avian species with whole genome sequences represent all but three
orders of birds (Zhang et al. 2014), providing an excellent opportunity to recover an
overall evolutionary history of Tas2rs across bird species. Our study unambiguously
revealed a general pattern that birds species carry a small Tas2r gene repertoire
relative to other vertebrates (Li and Zhang 2014). This finding is consistent with
anatomical evidence, which showed fewer taste buds and a lower number of taste
receptors in bird species compared with other vertebrates (Berkhoudt 1985; Mason
and Clark 2000). Notably, the red-throated loon, Adelie penguin, and emperor
penguin possess no functional Tas2r, which suggested a loss of bitter taste perception.
Other than the three bird species mentioned, the remaining bird species carry at least
one functional Tas2r, indicating that the bitter taste function is retained in 45 birds.
We also observed a few gene clusters consisting of two to five genes, but we did not
detect a large expansion in any bird comparable to the white-throated sparrow
(Zonotrichia albicollis), which was found to possess a gene cluster encoding 18
functional Tas2r receptors (Davis et al. 2010). The lineage-specific expansion in the
white-throated sparrow may not be an isolated case because we identified a gene gain
(n=5) in the ancestral lineage of Oscines (fig. 3). Indeed, we observed that the five
passerine birds studied carry a larger Tas2r repertoire compared with most other bird
at Wuhan U
niversity Library on Septem
ber 5, 2015http://gbe.oxfordjournals.org/
Dow
nloaded from

19
species (fig. 1). The varying coverage of genome sequences (Zhang et al. 2014) may
affect gene identification, but it is not the case for these avian genomes because we
identified a low number of Tas2rs from each avian genome, irrespective of the
genome coverage. Our additional analysis did not detect a correlation between the
fraction of partial genes and contig N50 length (ρ=0.141, P=0.374; supplementary
fig. S6), possibly because birds typically have fewer partial Tas2r genes (mean=0.6;
median=0) and most birds (35 out of 48) have no partial Tas2rs (fig. 1). However, the
small Tas2r repertoires in birds do not necessarily mean a reduced importance of
bitter taste, which could be compensated for by either the recognition of more bitter
compounds or the development of novel taste receptors. For example, all chicken and
turkey Tas2r receptors were able to recognize a wide range of bitter chemicals
(Behrens et al. 2014); the hummingbird repurposed the ancestral umami receptor to
compensate for the loss of Tas1r2, which encodes a canonical sweet receptor (Zhao et
al. 2003; Baldwin et al. 2014). Despite this, birds appear to have a less developed
sense of bitter taste than mammals, as a higher number of Tas2rs allows the evolution
of more specialized bitter taste receptors (Behrens et al. 2014).
Evolution of the narrow Tas2r gene repertoires in birds still reflects the
changes in dietary preferences, with a positive correlation between the functional
Tas2r gene number and abundance of potential toxins in the diet. Because herbivorous
birds consume plant products that typically contain more toxins than animal tissues
and insectivorous birds feed on insects that may release defensive secretions toxic to
at Wuhan U
niversity Library on Septem
ber 5, 2015http://gbe.oxfordjournals.org/
Dow
nloaded from
20
birds, both herbivorous and insectivorous birds are expected to require more Tas2rs
than carnivorous birds eating non-insect animals. Our present findings appear to
support the expectation that dietary toxins shaped the Tas2r gene repertoires in birds.
In addition, we also observed some cases of discrepancies between the gene number
and food habit. For example, three birds clearly have a diet consisting of potential
toxins, yet have only 1 intact Tas2r and 3 in total (carmine bee-eater), and 2 intact
Tas2rs and 3 in total (common cuckoo). These discrepancies may result from the
narrowness of their diets, as proposed in vampire bats (Zhao et al. 2010; Hong and
Zhao 2014). Future studies are needed to evaluate other ecological factors that are
potentially involved.
Consistent with the observation across all of the vertebrates examined (Li
and Zhang 2014), we observed a similar pattern in birds, a subgroup of vertebrates,
suggesting that diet impacts Tas2r evolution at both large and small scales. It would
be interesting to measure, at a smaller scale, the tuning properties of Tas2r receptors
in populations or closely related species with variations in bitter taste ability. By
contrast, a larger genome size cannot predict more Tas2rs in birds because all birds
examined have similar genome sizes, ranging from 1.05Gb to 1.26Gb (Zhang et al.
2014). However, other than diet, additional driving forces must be involved in shaping
Tas2r diversity. For instance, all but one Tas2rs were pseudogenes in both toothed and
baleen whales (Feng et al. 2014; Kishida et al. 2015), possibly driven by the high
concentration of sodium in the ocean, the feeding behavior of swallowing food whole,
at Wuhan U
niversity Library on Septem
ber 5, 2015http://gbe.oxfordjournals.org/
Dow
nloaded from

21
and the dietary switch from plants to meat in ancient whales (Feng et al. 2014); while
the two Tas2rs are intact in their outgroup species, both genes were pseudogenized in
the common ancestor of all extant penguins, which may result from the extremely
cold Antarctic (Zhao et al. 2015). All modern bird species lack teeth and swallow food
without mastication (Meredith et al. 2014), and hence, this feeding behavior should
not account for the Tas2r evolution in the case of bird species. In addition to diet
selection, however, extraoral functions of bitter taste receptors (e.g., in gastrointestinal
tract or respiratory epithelium) (Wu et al. 2002; Finger et al. 2003) may also drive the
evolution of bitter taste receptor genes in birds, a hypothesis that awaits future
investigation.
ACKNOWLEDGEMENTS
We thank two anonymous referees and Wei Hong for helpful comments. This work
was supported by National Natural Science Foundation of China (31300313).
at Wuhan U
niversity Library on Septem
ber 5, 2015http://gbe.oxfordjournals.org/
Dow
nloaded from
22
REFERENCES
Adler E, Hoon MA, Mueller KL, Chandrashekar J, Ryba NJ, Zuker CS. 2000. A novel family of
mammalian taste receptors. Cell 100:693-702.
Bachmanov AA, Beauchamp GK. 2007. Taste receptor genes. Annu Rev Nutr 27:389-414.
Baldwin MW, Toda Y, Nakagita T, O'Connell MJ, Klasing KC, Misaka T, Edwards SV, Liberles SD.
2014. Evolution of sweet taste perception in hummingbirds by transformation of the ancestral
umami receptor. Science 345:929-933.
Behrens M, Korsching SI, Meyerhof W. 2014. Tuning properties of avian and frog bitter taste receptors
dynamically fit gene repertoire sizes. Mol Biol Evol 31:3216-3227.
Berkhoudt H. 1985. Structure and function of avian taste recetors. In: AS Levy, J McLelland, editors.
Form and function in birds III. New York: Academic press. p. 463-496.
Blum M. 1981. Chemical defense of arthropods. New York: Academic Press.
Chandrashekar J, Mueller KL, Hoon MA, Adler E, Feng L, Guo W, Zuker CS, Ryba NJ. 2000. T2Rs
function as bitter taste receptors. Cell 100:703-711.
Chen K, Durand M, Farach-Colton M. 2007. Notung: A program for dating gene duplications and
optimizing gene family trees. J Comp Biol 7:429-447.
Dalloul RA, Long JA, Zimin AV, et al. 2010. Multi-platform next-generation sequencing of the
domestic turkey (Meleagris gallopavo): genome assembly and analysis. PLoS Biol 8.
Darriba D, Taboada GL, Doallo R, Posada D. 2012. jModelTest 2: more models, new heuristics and
parallel computing. Nat Methods 9:772.
Davis JK, Lowman JJ, Thomas PJ, ten Hallers BF, Koriabine M, Huynh LY, Maney DL, de Jong PJ,
Martin CL, Thomas JW. 2010. Evolution of a bitter taste receptor gene cluster in a New World
sparrow. Genome Biol Evol 2:358-370.
de Jong P, Holloway G, Brakefield PM, de Vos H. 1991. Chemical defence in ladybird beetles
(Coccinellidae) II. Amount of reflex fluid, the alka-lois adaline and individual variation in
defence in 2 spot ladybirds (Adalia bipunctata). . Chemoecology 2:15-19.
DeGolier TF, Mahoney SA, Duke GE. 1999. Relationships of avian cecal lengths to food habits,
taxonomic position, and intestinal lengths. Condor 101:622-634.
del Hoyo J, Elliott A, Sargatal J, Cabot J. 1992. Handbook of the birds of the world. Barcelona: Lynx
Edicions.
Dong D, Jones G, Zhang S. 2009. Dynamic evolution of bitter taste receptor genes in vertebrates. BMC
Evol Biol 9:12.
Edgar RC. 2004. MUSCLE: a multiple sequence alignment method with reduced time and space
complexity. BMC Bioinformatics 5:113.
Felsenstein J. 1985a. Confidence limits on phylogenies: an approach using the bootstrap. Evolution
39:783-791.
Felsenstein J. 1985b. Phylogenies and the comparative method. Am Nat 125:1-15.
Feng P, Zheng JS, Rossiter SJ, Wang D, Zhao H. 2014. Massive losses of taste receptor genes in
toothed and baleen whales. Genome Biol Evol 6:1254-1265.
Finger TE, Bottger B, Hansen A, Anderson KT, Alimohammadi H, Silver WL. 2003. Solitary
chemoreceptor cells in the nasal cavity serve as sentinels of respiration. Proc Natl Acad Sci
at Wuhan U
niversity Library on Septem
ber 5, 2015http://gbe.oxfordjournals.org/
Dow
nloaded from

23
USA 100:8981-8986.
Fisher DO, Owens IP. 2004. The comparative method in conservation biology. Trends Ecol Evol
19:391-398.
Ganchrow JR, Steiner JE, Bartana A. 1990. Behavioral reactions to gustatory stimuli in young chicks
(Gallus gallus domesticus). Dev Psychobiol 23:103-117.
Garica J, Hankins WG. 1975. The evolution of bitter and the acquisition of toxiphobia. In: DA Denton,
JP Coghlan, editors. Olfaction and Taste V, Proceedings of the 5th International Symposium in
Melbourne, Australia. New York: Academic Press. p. 39-45.
Gilad Y, Wiebel V, Przeworski M, Lancet D, Paabo S. 2004. Loss of olfactory receptor genes coincides
with the acquisition of full trichromatic vision in primates. PLoS Biol 2:120-125.
Glendinning JI. 1994. Is the bitter rejection response always adaptive? Physiol Behav 56:1217-1227.
Go Y. 2006. Lineage-specific expansions and contractions of the bitter taste receptor gene repertoire in
vertebrates. Mol Biol Evol 23:964-972.
Green RE, Braun EL, Armstrong J, et al. 2014. Three crocodilian genomes reveal ancestral patterns of
evolution among archosaurs. Science 346:1254449.
Hayakawa T, Suzuki-Hashido N, Matsui A, Go Y. 2014. Frequent expansions of the bitter taste receptor
gene repertoire during evolution of mammals in the Euarchontoglires clade. Mol Biol Evol
31:2018-2031.
Hillier LW, Miller W, Birney E, et al. 2004. Sequence and comparative analysis of the chicken genome
provide unique perspectives on vertebrate evolution. Nature 432:695-716.
Hong W, Zhao H. 2014. Vampire bats exhibit evolutionary reduction of bitter taste receptor genes
common to other bats. Proc Biol Sci 281:20141079.
Janke A, Arnason U. 1997. The complete mitochondrial genome of Alligator mississippiensis and the
separation between recent archosauria (birds and crocodiles). Mol Biol Evol 14:1266-1272.
Jarvis ED,Mirarab S,Aberer AJ, et al. 2014. Whole-genome analyses resolve early branches in the tree
of life of modern birds. Science 346:1320-1331.
Kishida T, Thewissen J, Hayakawa T, Imai H, Agata K. 2015. Aquatic adaptation and the evolution of
smell and taste in whales. Zoological Letters 1:9.
Li D, Zhang J. 2014. Diet shapes the evolution of the vertebrate bitter taste receptor gene repertoire.
Mol Biol Evol 31:303-309.
Lindemann B. 1996. Taste reception. Physiol Rev 76:719-766.
Mason JR, Clark L. 2000. The chemical senses in birds. In: GC Whittow, editor. Sturkie's avian
physiology, fifth edition. San Diego: Academic press. p. 39-56.
Matsunami H, Montmayeur JP, Buck LB. 2000. A family of candidate taste receptors in human and
mouse. Nature 404:601-604.
Meredith RW, Zhang G, Gilbert MT, Jarvis ED, Springer MS. 2014. Evidence for a single loss of
mineralized teeth in the common avian ancestor. Science 346:1254390.
Nei M, Kumar S. 2000. Molecular Evolution and Phylogenetics. New York: Oxford University Press.
Paradis E, Claude J, Strimmer K. 2004. APE: Analyses of phylogenetics and evolution in R language.
Bioinformatics 20:289-290.
Posada D, Buckley TR. 2004. Model selection and model averaging in phylogenetics: advantages of
akaike information criterion and bayesian approaches over likelihood ratio tests. Syst Biol
at Wuhan U
niversity Library on Septem
ber 5, 2015http://gbe.oxfordjournals.org/
Dow
nloaded from
24
53:793-808.
Ronquist F, Huelsenbeck JP. 2003. MrBayes 3: Bayesian phylogenetic inference under mixed models.
Bioinformatics 19:1572-1574.
Rouquier S, Blancher A, Giorgi D. 2000. The olfactory receptor gene repertoire in primates and mouse:
evidence for reduction of the functional fraction in primates. Proc Natl Acad Sci USA
97:2870-2874.
Roura E, Baldwin MW, Klasing KC. 2013. The avian taste system: Potential implications in poultry
nutrition. Anim Feed Sci Technol 180:1-9.
Saitou N, Nei M. 1987. The neighbor-joining method: a new method for reconstructing phylogenetic
trees. Mol Biol Evol 4:406-425.
Sawyer S. 1989. Statistical tests for detecting gene conversion. Mol Biol Evol 6:526-538.
Shi P, Zhang J. 2006. Contrasting modes of evolution between vertebrate sweet/umami receptor genes
and bitter receptor genes. Mol Biol Evol 23:292-300.
Sonnhammer EL, von Heijne G, Krogh A. 1998. A hidden Markov model for predicting
transmembrane helices in protein sequences. Proc Int Conf Intell Syst Mol Biol 6:175-182.
Tamura K, Stecher G, Peterson D, Filipski A, Kumar S. 2013. MEGA6: Molecular Evolutionary
Genetics Analysis version 6.0. Mol Biol Evol 30:2725-2729.
Wang X, Thomas SD, Zhang J. 2004. Relaxation of selective constraint and loss of function in the
evolution of human bitter taste receptor genes. Hum Mol Genet 13:2671-2678.
Warren WC, Clayton DF, Ellegren H, et al. 2010. The genome of a songbird. Nature 464:757-762.
Weatherston J, Percy, JE. 1970. Arthropod defensive secretions. New York: Academic Press.
Wilson MF. 1974. Avian community organization and habitat structure. Ecology 55:1017-1029.
Wu SV, Rozengurt N, Yang M, Young SH, Sinnett-Smith J, Rozengurt E. 2002. Expression of bitter
taste receptors of the T2R family in the gastrointestinal tract and enteroendocrine STC-1 cells.
Proc Natl Acad Sci USA 99:2392-2397.
Yang Z, Rannala B. 1997. Bayesian phylogenetic inference using DNA sequences: a Markov Chain
Monte Carlo Method. Mol Biol Evol 14:717-724.
Yarmolinsky DA, Zuker CS, Ryba NJP. 2009. Common sense about taste: from mammals to insects.
Cell 139:234-244.
Zhang G,Li C,Li Q, et al. 2014. Comparative genomics reveals insights into avian genome evolution
and adaptation. Science 346:1311-1320.
Zhao GQ, Zhang Y, Hoon MA, Chandrashekar J, Erlenbach I, Ryba NJ, Zuker CS. 2003. The receptors
for mammalian sweet and umami taste. Cell 115:255-266.
Zhao H, Li J, Zhang J. 2015. Molecular evidence for the loss of three basic tastes in penguins. Curr
Biol 25:R141-R142.
Zhao H, Zhou Y, Pinto CM, Charles-Dominique P, Galindo-González J, Zhang S, Zhang J. 2010.
Evolution of the sweet taste receptor gene Tas1r2 in bats. Mol Biol Evol 27:2642-2650.
Zhou Y, Dong D, Zhang S, Zhao H. 2009. Positive selection drives the evolution of bat bitter taste
receptor genes. Biochem Genet 47:207-215.
at Wuhan U
niversity Library on Septem
ber 5, 2015http://gbe.oxfordjournals.org/
Dow
nloaded from
25
FIGURE LEGENDS
Figure 1. The bitter taste receptor gene repertoires of 48 birds and their dietary
preferences. Species tree and divergence times were taken from a recent study (Jarvis
et al. 2014). Dietary information was from the literature and the Animal Diversity
Web (supplementary table S1). C, carnivore; I, insectivore; F, frugivore; Fo, folivore;
G, granivore; N, nectarivore; O, omnivore.
Figure 2. Evolutionary relationships of all 136 intact Tas2r genes from 48 birds and
three crocodilians. The tree was reconstructed using the Bayesian approach with the
best fitting model of GTR+I+G. Branch lengths were drawn to the scale. Putative
species-specific gene duplications were marked in the branches with various colors,
and members from Passeriformes were bracketed. The detailed information about
species and gene names and Bayesian posterior probabilities was shown in
supplementary fig. S1, and the Neighbour-Joining tree showing a similar topology to
this tree was provided in supplementary fig. S3.
Figure 3. Evolutionary changes of intact Tas2r gene numbers in 48 birds and three
crocodilians. The estimated Tas2r gene numbers for ancestral lineages were shown
with black, whereas the numbers of gene gains and gene losses were indicated with
purple and green, respectively.
Figure 4. Dietary preferences impact the avian Tas2r gene repertoires. (A)
Phylogenetically independent contrast (PIC) in putatively functional Tas2r gene
number is positively correlated with that in diet preference; (B) PIC in total Tas2r
gene number remains an increasing trend as PIC in diet codes increases, although it
was only marginally significant. According to the amount of potential toxins in its diet,
each bird was coded as 0 (carnivore), 1 (folivore), 1 (insectivore), 1 (frugivore), 1
(granivore), 1 (nectarivore), and 1 (omnivore). The Spearman’s rank correlation
coefficient (ρ) with a two-tailed P value was used to evaluate the association.
at Wuhan U
niversity Library on Septem
ber 5, 2015http://gbe.oxfordjournals.org/
Dow
nloaded from
Zebra Finch (Taeniopygia guttata)Medium Ground Finch (Geospiza fortis)
Crested Ibis (Nipponia nippon)
White-tailed Eagle (Haliaeetus albicilla)
Hoatzin (Opisthocomus hoazin)
Chicken (Gallus gallus)
Adelie Penguin (Pygoscelis adeliae)
Great Cormorant (Phalacrocorax carbo)
Chimney Swift (Chaetura pelagica)
Kea (Nestor notabilis)
Barn Owl (Tyto alba)
Downy Woodpecker (Picoides pubescens)
Peregrine Falcon (Falco peregrinus)
Dalmatian Pelican (Pelecanus crispus)
Golden-collared Manakin (Manacus vitellinus)
Common Cuckoo (Cuculus canorus)
Red-legged Seriema (Cariama cristata)
Rhinoceros Hornbill (Buceros rhinoceros)
Common Ostrich (Struthio camelus)
American Crow (Corvus brachyrhynchos)
Anna’s Hummingbird (Calypte anna)
Carmine Bee-eater (Merops nubicus)
Turkey Vulture (Cathartes aura)
Sunbittern (Eurypyga helias)
Red-crested Turaco (Tauraco erythrolophus)
Bald Eagle (Haliaeetus leucocephalus)
White-throated Tinamou (Tinamus guttatus)
Domestic Pigeon (Columba livia)
Cuckoo Roller (Leptosomus discolor)
Great Crested Grebe (Podiceps cristatus)American Flamingo (Phoenicopterus ruber)
Bar-tailed Trogon (Apaloderma vittatum)
Northern Fulmar (Fulmarus glacialis)Red-throated Loon (Gavia stellata)
Chuck-will’s-widow (Caprimulgus carolinensis)MacQueen’s Bustard (Chlamydotis macqueenii)
Turkey (Meleagris gallopavo)
Brown Mesite (Mesitornis unicolor)
Speckled Mousebird (Colius striatus)
White-tailed Tropicbird (Phaethon lepturus)
Killdeer (Charadrius vociferus)
Rifleman (Acanthisitta chloris)
Yellow-throated Sandgrouse (Pterocles gutturalis)
Budgerigar (Melopsittacus undulatus)
Grey Crowned Crane (Balearica regulorum)
Peking Duck (Anas platyrhynchos)
Little Egret (Egretta garzetta)
Emperor Penguin (Aptenodytes forsteri)
100.0 75.0 50.0 25.0 0.0 MYA
Intact Partial Pseudo Total
Number of Tas2r genes
7 0 1 86 3 2 117 1 2 106 2 1 94 4 1 91 0 1 21 0 1 22 0 0 22 0 0 21 2 0 34 0 1 51 1 1 35 5 2 122 0 0 21 3 0 42 0 0 22 0 1 32 0 1 32 0 1 31 0 1 22 0 1 32 0 0 21 0 1 20 0 3 30 0 3 32 0 0 20 0 3 31 0 1 22 0 0 23 0 0 32 0 1 34 0 0 46 2 2 104 1 0 53 0 0 32 1 0 33 0 0 32 1 0 33 0 0 31 0 2 31 0 0 12 0 0 21 0 1 22 0 2 43 0 0 32 2 0 42 0 0 21 0 1 2
Diet
G
G
O
F
I
G
F
C
C
I
I
F
O
I
F
C
C
C
C
C
C
C
C
C
C
C
C
C
I
I
O
Fo
N
I
I
O
F
I
O
G
G
O
C
O
G
G
G
G
Figure 1 at W
uhan University L
ibrary on September 5, 2015
http://gbe.oxfordjournals.org/D
ownloaded from

Downy WoodpeckerBar-tailed TrogonHoatzinChimney SwiftAnna’s HummingbirdRiflemanGolden-collared ManakinMedium Ground FinchZebra FinchCrocodilians
Clade 1
Clade 2
Clade 3
Passeriformes
Passeriformes
Passeriformes
Passeriformes
0.3
Figure 2 at W
uhan University L
ibrary on September 5, 2015
http://gbe.oxfordjournals.org/D
ownloaded from
American Crow
Golden-collared Manakin
Northern Fulmar
Barn Owl
Little Egret
Peking Duck
Adelie Penguin
Chuck-will’s-widow
Peregrine Falcon
Bald Eagle
White-tailed Eagle
Downy Woodpecker
Rifleman
Common Ostrich
Speckled Mousebird
Grey Crowned Crane
Turkey Vulture
Rhinoceros Hornbill
Chimney Swift
Anna’s Hummingbird
Carmine Bee-eater
Brown Mesite
Bar-tailed Trogon
Budgerigar
Great Crested Grebe
Red-legged Seriema
Great Cormorant
Sunbittern
Red-throated Loon
Cuckoo Roller
Crested Ibis
Kea
Red-crested Turaco
Chicken
Common Cuckoo
Medium Ground Finch
Turkey
American Flamingo
Emperor Penguin
White-tailed Tropicbird
MacQueen’s Bustard
Killdeer
Domestic Pigeon
Zebra Finch
Hoatzin
Dalmatian Pelican
Yellow-throated Sandgrouse
White-throated Tinamou
4115212222
767641122
21210020122346432321312123221
23
44
44
62
4
58
33
4
55
7
112
45
60
66
6
12
3
3413
23
4
5
4
45
62
33
2
3
3
11
1
+0-1
+0+2
+2
+0+0
+0
+0+0
+0+0+0
+0 +0+3+0
+0 +0+0
+0+2
-0 -1-3
-0
-2-0
-2-2
-0-2
-3-2-0 -2
-2-2
-1-0
-0-0
-1
+0
+0
+1
-1
-5
-2
+0
+0
+0
+0
-1
-0
-1
-1
+0+0
+0+0
+2+3
+0
+0
+5+0
-3-3
-0-0
-1-0
-1
-3
-0
+0+0
+0+0
+0+0
+0+0
+0+0
+0
+0
+0
+1
+0
-6-4
-0-0
-4-2
-1-0
-6
-2-1
-0
-1
-5
-0
-1
+0
+2+4
+2+0
+0+0
+0+0
+0+0
-0-0
-1
-2-0
-1-1
-2-3
-8
+0+0
+0
+0
+0
+0
+0+0
+0+0
+0
+0+0
+0
+0
-4-1
-1-1
-5
-3-2
-1-2
-0
-0
-1-2
-1
-8
+0+0
+0+0
+0+0
+0+0
+0
+0
+0
-1-0
-1-0
-1-1
-0-4
-1
-0-0
+0
+8-0
-0
+0
+2
-1
-0
Aves
Neognathae
Palaeognathae
Galloanseres
Columbea
Neoaves
Passerea
Passeriformes
Alligator
Gharial
Crocodile587
77
+1+0
+0+1
-1-2
-0-0
Crocodilians
+0-3
6
+0-0
Oscines
Core Landbirds(Telluraves)
c
d
e
a
b
Figure 3 at W
uhan University L
ibrary on September 5, 2015
http://gbe.oxfordjournals.org/D
ownloaded from

Diet code contrast
-0.15 -0.10 -0.05 0.00 0.05 0.10 0.15
Func
tiona
l Tas
2rge
ne n
umbe
r co
ntra
st
-1.0
-0.8
-0.6
-0.4
-0.2
0.0
0.2
0.4
0.6
0.8
ρ = 0.409P = 0.004
A
Diet code contrast
-0.15 -0.10 -0.05 0.00 0.05 0.10 0.15
Tas2
rge
ne r
eper
toir
e si
ze c
ontr
ast
-1.2
-1.0
-0.8
-0.6
-0.4
-0.2
0.0
0.2
0.4
0.6
0.8
ρ = 0.314P = 0.032
B Figure 4
at Wuhan U
niversity Library on Septem
ber 5, 2015http://gbe.oxfordjournals.org/
Dow
nloaded from