biregional ch-1 to 5 (pages 1-1 - who western pacific · pdf filealthough the asia pacific...
TRANSCRIPT
IntroductionAlthough the Asia Pacific Region accounts for only one fifth of the earth’s landmass it is home to over
3.45 billion people, more than half the global population. The population density of 127 people per
square kilometre is more than twice the world average.1,2
The extreme diversities in demographic, economic and health parameters in the Region affect the
prioritization of health issues, allocation of public resources for health, formulation of effective strategies
and implementation of health programmes. This chapter provides an overview at the national level of
demographic conditions, recent trends and future prospects. Statistics quoted are mostly based on
United Nations estimates and may differ from national data based on alternate methods.
While an illiterate and sick population is a health and social burden, it becomes a positive national
resource when educated and healthy. An adult engaged in productive work supports several others
and enhances economic and social development.
3.1 Population structureThe population structure of any area can be studied in terms of socioeconomic parameters and
occupational distribution, but the main demographic parameters for health (apart from total population)
are age and sex. Health needs and the provision of health services depend substantially on the size of
the population and its age and sex structure.
Population size
There is an extremely wide variation in the population sizes of the 48 countries and areas in the Asia
Pacific Region, with very small island countries such as Niue, the Pitcairn Islands and Tokelau, each
3Demographic trends

Health in Asia and the Pacific36
Ch
apte
r 3
having less than 2000 inhabitants in 2005, to giants such as China and India with populations of 1.31
billion and 1.13 billion respectively. These two countries alone are home to 38% of the world’s
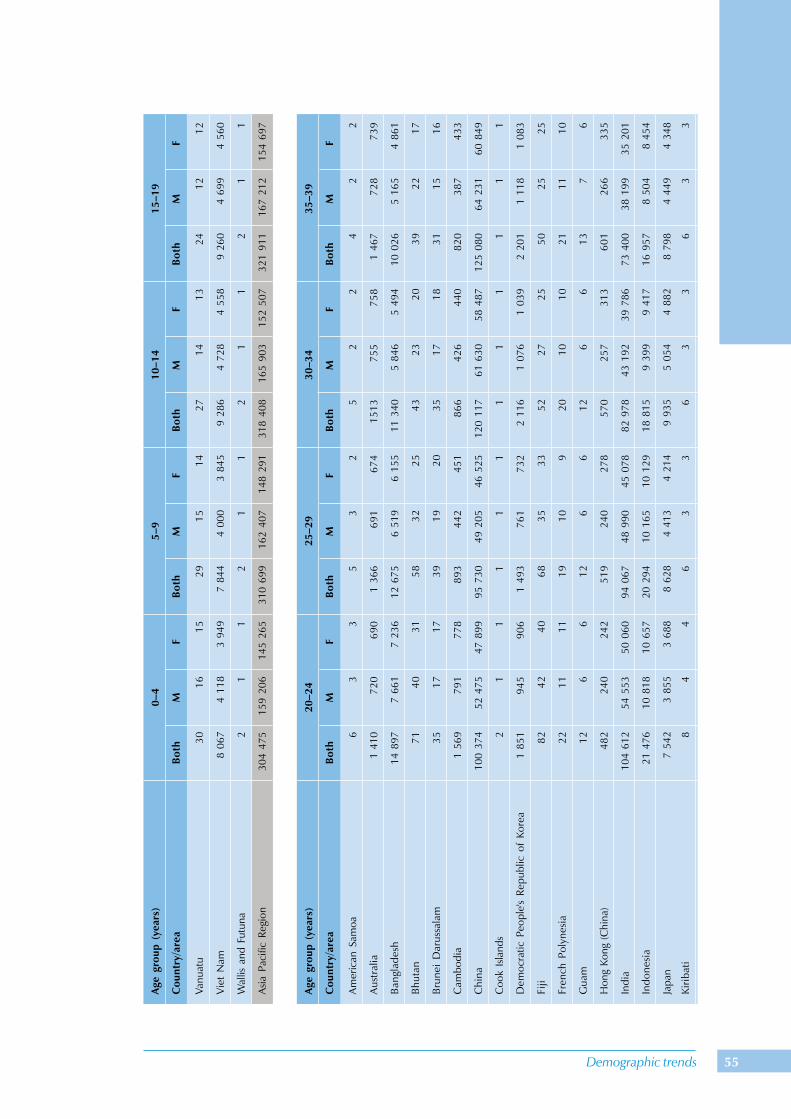
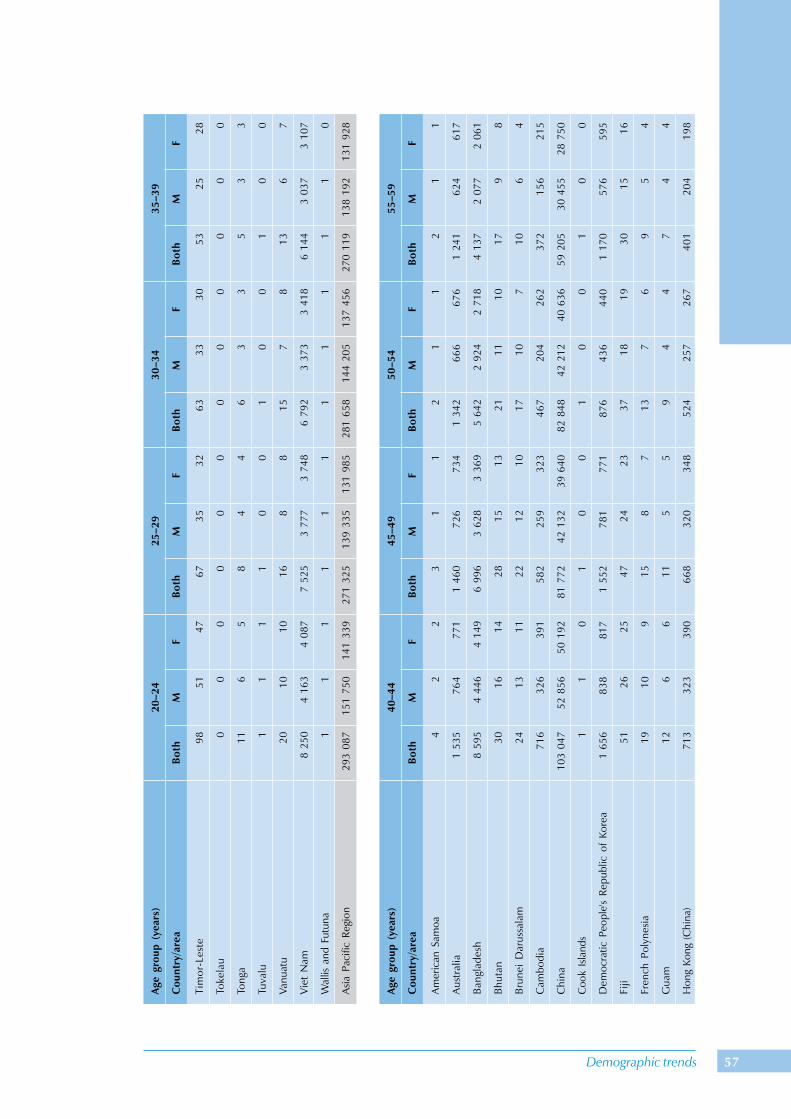
population. The United Nations 2005 population estimates for various countries in the Region by age
and sex are given in Annex Table 3.1.
Population density
After Hong Kong (China), Macao (China) and Singapore, the countries with highest population densities,
expressed in terms of number of people per square km, are Bangladesh (1064), Maldives (991),
Nauru (481), the Republic of Korea (481), Tuvalu (402), India (345), Japan (338), American Samoa
(322) and the Marshall Islands (313) (Annex Table 3.2). There are often large variations in population
densities within countries. In Japan, for example, the prefecture of Aichi has a density of 1427 people
per square km (city population, Aichi) whereas Akita has only 106 (city population, Akita).
Population growth and projections
Between 2000 and 2005, the Region’s population grew at a rate of 1.15% per year, less than the
world average of 1.24%. The annual population growth rate of the Region declined by nearly 50%
between 1950 and 1975. Since the 1970s, family planning programmes in China and India contributed
to this sharp drop. The rapid decline of 50% in fertility levels in China between 1973 and 19833 has
no historic precedence and was brought about by vigorous adherence to the one-child family policy.
The growth rate in China declined from 1.10% per year during the period 1990–1995 to 0.67% per
year between 2000 and 2005. In India, with its two-child norm, the growth rate fell from 2.08% to
1.62% during the same period. Similar reductions in population growth can be expected in the future
as fertility levels continue to decline. Population growth rates for countries and areas in the Asia
Pacific Region from 1990 to 2005, and projections until 2015, are shown in Annex Table 3.3.
Within the Asia Pacific Region, enormous differences exist between countries in population growth
rates. Between 2000 and 2005, rates ranged from 0.14% per year in Japan to 5.31% in Timor-Leste.
High population growth rates of over 2% per year are still prevalent in large population pockets. For
the period 2005–2010, 13 countries in the Region have projected growth rates below 1% per year,
with Japan’s growth rate starting to become negative (-0.02%) at this time. While the trend in all
countries is to have decreasing growth rates, there are still five countries (Brunei Darussalam,
Papua New Guinea, Solomon Islands, Timor-Leste and Vanuatu) with projected population growth
rates of at least 2% per year during this period.
There are also significant intra country variations in the Region’s population growth rates. For
example, population growth rates between 1991 and 2001 among 15 large states in India ranged from
0.9% and 1.1% in Kerala and Tamil Nadu respectively, to 2.5% each in both Bihar and Rajasthan.4 Such
large differentials indicate that periodic revision of estimates of population distributions is required for
planning and monitoring population-sensitive health programmes.
Based on the component projection method and taking the “medium variant” as the likely scenario,
projections place the population of the Region at 3.8 billion by 2015—an increase of 353 million from
2005. Of this number, 168 million will come from India’s growth alone, 76 million from China, 27
million from Bangladesh and 25 million from Indonesia. The population of Japan is expected to decrease
by 1.3 million from the 2005 figure of 127.9 million.

Demographic trends 37
During the next decade, India is expected to account for 47.6% of the increase in the population
of the Region. India’s annual population growth rate of 1.14%, estimated for the period 2015–2020
will be two-and-a-half times the growth rate of China during the same period, estimated at 0.47%.
With a projected population of 1.51 billion by 2030, India will be the most populous country in the
world, surpassing China’s projected population of 1.46 billion the same year.1
Sex ratio
The population sex ratio, defined as the number of males per 100 females, is estimated at 103 for 2005
for the Asia Pacific, higher than the world average of 101.6. In 2005, the sex ratios across countries and
areas in this Region ranged from 92 in Macao (China) to 111 in Bhutan (Annex Table 3.4). Variations in
sex ratios across countries can be attributed to a host of social, cultural and economic factors, such as
cultural preferences which favour the birth or survival of one sex over the other (usually the male),
practices of sex-selective abortion and infanticide, and the large-scale emigration of male labourers.
A high degree of gender imbalance in the population is undesirable because of social implications
that lead to adverse health consequences. The very high sex ratio in Bangladesh, China and India,
constituting 75% of the Region’s population, indicates strong male-child preference and consequent
gender inequities in nutrition and health care. In Bangladesh, India and Nepal for example, mortality
for females under age 5 is higher than for male children. This may be attributable to the discrimination
against girls in providing food and health-care services.5
The sex ratio among children under age 5, usually referred to as the “child sex ratio” reflects the
possible prevalence of sex-selective abortions and discriminatory health care and medical services
against girls. In developed countries, where sex-selective abortions are rare, the sex ratio at birth is
nearly 105 males to 100 females. With equal care and nurturing, the natural sex ratio of children in the
age group 0 to 4 should also be around 105. This is true for Australia and Japan, where the child sex
ratios were 105 and 106 respectively in 2005 (Annex Table 3.4). China, however, had a very high
child sex ratio of 116 for the same year. This has become a matter of great concern from social and
health perspectives. This high sex ratio has been partly attributed to the one-child policy that China has
been pursuing over the years which could have triggered a high number of selective abortions. In the
case of Singapore, which also has a high sex ratio of 108, it is partly reflective of the strong gender
preferences for male children among Chinese and Indian migrants.
Age structure
The age structure of a population is a blueprint of past trends in fertility and mortality levels and at the
same time contains the potential for future demographic and economic growth. With the rapid
demographic transition in some countries of the Region during the past three decades, the age structure
of the population is rapidly changing, with the median age steadily increasing. The age pyramids for
1975, 2000 and projected for 2025 and 2050 for the five largest countries of the Region are presented
in Figure 3.1. Bangladesh, India and Indonesia are likely to have similar structures by 2050, but Japan
will have a large elderly population.
Differences in the shapes of the population pyramids presented in Figure 3.1 also reflect differences
in the age distributions of the selected countries, across time. In 1975, the population pyramids of
Bangladesh, China, India and Indonesia are characterized by a very wide base with gradually decreasing
sides and a pointed tip, approximating the shape of a triangle. This shape is indicative of young

Health in Asia and the Pacific38
Ch
apte
r 3
Fig. 3.1 Changing age pyramids of five large countries in the Asia Pacific Region,
1975–2050
Sources: World population prospects: the 2006 revision. New York, United Nations Department of Economicand Social Affairs, Population Division, 2007. Available from: http://www.un.org/esa/population/publications/wpp2006/wpp2006.htm
World urbanization prospects: the 2005 revision. New York, United Nations Department of Economicand Social Affairs, Population Division, 2005 (medium variant estimates). Available from: http://www.un.org/esa/population/publications/WUP2005/2005wup.htm
20 10 0 10 20 20 10 0 10 20 20 10 0 10 20 20 10 0 10 20
20 10 0 10 20 20 10 0 10 20 20 10 0 10 20 20 10 0 10 20
20 10 0 10 20 20 10 0 10 20 20 10 0 10 20 20 10 0 10 20
20 10 0 10 20 20 10 0 10 20 20 10 0 10 20
20 10 0 10 20
0-45-9
10-1415-1920-2425-2930-3435-3940-4445-4950-5455-5960-6465-6970-7475-79
80+
0-45-9
10-1415-1920-2425-2930-3435-3940-4445-4950-5455-5960-6465-6970-7475-79
80+
0-45-9
10-1415-1920-2425-2930-3435-3940-4445-4950-5455-5960-6465-6970-7475-79
80+
0-45-9
10-1415-1920-2425-2930-3435-3940-4445-4950-5455-5960-6465-6970-7475-79
80+
0-45-9
10-1415-1920-2425-2930-3435-3940-4445-4950-5455-5960-6465-6970-7475-79
80+
20 10 0 10 20 20 10 0 10 20 20 10 0 10 20
20 10 0 10 20
Bangladesh
China
India
Indonesia
Japan
Male
Percentage of population by sex and age group
Female
Age
grou
p
1975 2000 2025 2050

Demographic trends 39
populations, with the highest proportion of the population being children 0–4 years, and with the
proportion of the population decreasing with advancing age. In the succeeding time periods, however,
the pyramids have changed, with the shapes indicative of a decreasing proportion of children, and an
increasing proportion of adults and older persons. In the case of Japan, its age distribution is so
different from the other countries in the Region, since as early as 1975, the highest proportion of the
population were adults 25–29. By 2025 and 2050, Japan is projected to have an odd-shaped population
pyramid with the narrowest point at its base and the widest point at its tip, indicative of a population
with very few children and a very high proportion of older persons.
A more detailed picture of differences and changes in age composition of countries, specifically in
the proportion of children and older persons are shown in Figures 3.2 and 3.3. In 1975, the percentage
of children below age 15 was about 44.3% in Bangladesh, 39.5% in China, and 41.8% in Indonesia. By
2005, these percentages had fallen to 35.2% in Bangladesh, 21.6% in China, and 28.4% in Indonesia,
largely due to declining fertility rates. Projections indicate that these percentages will decline further.
While the age distributions of some countries were almost the same in 1975, wide disparities
developed by 2000. This occurred largely due to the differential decline in their fertility levels, and to
a lesser extent, to increased longevity. China has led the recent demographic transition in the Region.
This has increased the proportion of older people concomitantly with declining proportions in younger
ages. In 1975 the percentages above age 60 years were 4.8% in Bangladesh and 5.6% in India. By
2005, these changed to 5.7% in Bangladesh and 7.5% in India. These are projected to increase by
2025 to 9.2% and 11.5% respectively, and further to 17% and 20.2% by 2050 (Figure 3.3). On the
other hand, the 11.7% above age 60 in Japan in 1975 increased sharply to 26.4% by 2005, and is
expected to increase further to 35.8% and 44% by 2025 and 2050, respectively. By 2050, 44% of the
population in Japan will be age 60 and over. If the trend continues in the Region, with a time lag, the
ageing of the population will become the norm in all other Asia Pacific countries.
Fig. 3.2 Percentage of population age 0–14 years in selected countries, 1975–2050
Sources: World population prospects: the 2006 revision. New York, United Nations Department of Economicand Social Affairs, Population Division, 2007. Available from: http://www.un.org/esa/population/publications/wpp2006/wpp2006.htm
World urbanization prospects: the 2005 revision. New York, United Nations Department of Economicand Social Affairs, Population Division, 2005 (medium variant estimates). Available from: http://www.un.org/esa/population/publications/WUP2005/2005wup.htm
0
10
20
30
40
50
1975 2000 2025 2050
Bangladesh China Indonesia Japan Philippines
Per
cen
tage

Health in Asia and the Pacific40
Ch
apte
r 3
Addressing the health and economic needs of older persons is not an insurmountable problem as
long as the working population is growing and the dependency ratio (next section) is actually falling.
However, a situation may emerge in the next 50 years in which ageing could become an unbearable
burden for some countries. According to the 2002 National Health Survey Report of the Republic of
Korea, 87.6% of the older persons suffered from at least one chronic disease6 suggesting that chronic
diseases in older persons may soon overwhelm health systems in some nations.
In response, Singapore has started community health screening of elderly residents. This includes
checking blood pressure, blood sugar and cholesterol. The proposal for the Republic of Korea is to
provide basic health services at local health centres for the older persons and national lifelong health
promotion programmes that aim to correct unhealthy patterns of behaviour. Many other countries are
devising plans to meet their own needs.
To help promote a global response to this major societal concern, WHO restructured its programme
on health of older persons in 1995 and gave it a new name – Ageing and Health.7 This area of health
care is becoming a dominant concern in the new millennium. The main perspectives which guide
programme activities are:
• approaching ageing as part of the cycle rather than compartmentalizing health care for older
persons;
• promoting long-term health by increasing awareness of the process of healthy ageing;
• increasing the focus on prevention of noncommunicable diseases;
Fig. 3.3 Percentage of population age 60 and over in selected countries, 1975–2050
Sources: World population prospects: the 2006 revision. New York, United Nations Department of Economicand Social Affairs, Population Division, 2007. Available from: http://www.un.org/esa/population/publications/wpp2006/wpp2006.htm
World urbanization prospects: the 2005 revision. New York, United Nations Department of Economicand Social Affairs, Population Division, 2005 (medium variant estimates). Available from: http://www.un.org/esa/population/publications/WUP2005/2005wup.htm
0
10
20
30
40
50
Bangladesh China India Indonesia Japan
1975 2000 2025 2050

Demographic trends 41
• observing cultural influences;
• adopting community-oriented approaches;
• recognizing gender differences; and
• strengthening intergenerational links.
Ageing causes not only physical but also psychological problems. Quality of life in old age needs
greater attention and future programmes may have to take this into account. Health systems must
prepare to take on a different kind of burden associated with older people.
Dependency ratios
Another indicator of the age composition of a population is the age-dependency ratio. It is computed
as the ratio of the number of children (<15 years old) and older pesons (≥ 65 years old) in the
population, to the number of people in the working-age groups (15–64 year old). In some countries,
the cut-off point for older persons is set at a lower age of 60, depending on the retirement age. The
resulting value is interpreted as the number of children and older persons who need to be supported
by every 100 adults in the working-age groups and it is a measure of the age-induced economic
burden on the population. However, the indicator has some limitations since it does not take into
consideration the fact that in several developing countries, a number of children, especially those who
are out of school, are already economically active. Similarly, there can be a considerable proportion of
persons past retirement age who are still earning a living.
From its computational formula, it can be seen that the age-dependency ratio has two components:
child-dependency ratio and old-age dependency ratio. Each of these components can be computed
separately, or can also be combined to come up with a total dependency ratio for the population.
Since children and older persons have very different needs, it is important to analyse the dependency
ratio according to its components, otherwise, differences in types of programmes needed to address
problems might be masked if focus is placed merely on the total dependency ratio.
The total dependency ratio and its components for the years 1975, 2000, 2025 and 2050 are
shown in Annex Table 3.4. In 2000, Timor-Leste had the highest child-dependency ratio while Japan
had the highest old-age dependency ratio. In China the child-dependency ratio declined sharply by
almost one half from 70 in 1975 to 37 in 2000, and is expected to decline further to 25 by 2050. In
India in 1975, this was 71, almost the same as in China, implying their demographic similarities prior
to 1975.
The total dependency ratio tends to decrease in the earlier stages of a country’s development,
when rapid declines in fertility reduce the child population more than the increase in older persons,
but subsequently the increase in older persons far outweighs the decline in the child population.
Because of the earlier decline in fertility in Japan, a low total dependency ratio of 47 in 1975 was
maintained until 2000. It is expected to increase steadily to 68 by 2025 and to 96 by 2050. Thus,
Japan will have almost one dependent person, young or old, for every person in the age group 15–64
by 2050. In Mongolia, this ratio declined from 88 in 1975 to 62 in 2000; it is projected to decline to
40 in 2025 and then increase to 53 by 2050. All countries in the Region will see a shift from child
dependency to old-age dependency as the fertility rate declines and life expectancy increases.

Health in Asia and the Pacific42
Ch
apte
r 3
Demographic bonus and demographic burden
In the late 1990s social scientists began searching for the factors underlying the so-called East Asian
miracle when the growth rates of economies in China, Malaysia, the Republic of Korea, and Thailand
far surpassed expected levels. A careful analysis revealed that a key factor underlying their rapid
economic development was a rapid decline in their dependency ratios, especially the child-dependency
ratio. This allowed earning adults to spend a larger portion of their income on consumption or investment,
rather than on their children. The change was brought about by a rapid switch from large to small
families. As long as there were few retired people in the population, the burden of pensions remained
light resulting in a great demographic push toward economic growth. The term “demographic bonus”
describes the period when the dependency ratio in a population falls because of declining fertility until
it begins to rise again due to increasing longevity.
The duration of the demographic bonus depends on the pace of decline in a population’s fertility
levels. If the switch to small families is swift, the demographic bonus can give a considerable boost to
development. This happened in China beginning in the early 1980s due to its One-child Family
Policy. If investments in health care and education for skills development are made during a period of
demographic bonus, as happened in East Asian countries, maximum advantage is taken of the
demographic transition.
The Republic of Korea, for example, increased net secondary school enrolment from 38% to
84% between 1970 and 1990, while more than tripling expenditure per secondary pupil. Countries
that failed to make such investments during periods of demographic bonus did not record such high
economic growth rates. It is estimated that 15%–40% of the growth of per capita income of these East
Asian countries over the last several decades can be attributed to reduction in their dependency
ratios.8 Changing demographic structures now present similar opportunities and challenges in the
South Asian countries which appear poised for similar growth in coming decades.
The term “demographic burden” describes the increase in the total dependency ratio during any
period of time, mostly caused by an increased old-age dependency ratio. This is an inevitable
consequence of demographic transition, and every country has to face this problem sooner or later.
Japan may face this demographic burden by 2050, with other countries in the Region experiencing it
soon after. The health consequences of the demographic burden are the same as for the ageing of the
population, as discussed earlier.
3.2 FertilityIn addition to describing the age and sex composition of a population, the other areas of concern in
demography are measuring and analysing changes in population size and structure. These are brought
about by three main factors: fertility, mortality and migration.
Several indicators are used to measure fertility both at the individual and country levels. These
include the number of children ever-born, the crude and age-specific fertility rates, gross and net
reproduction rates, and the total fertility rate. There is a large variation in fertility levels across countries
and cultures and social and economic conditions, as well as by individual characteristics like age and
health status of the woman.

Demographic trends 43
In general, controlling fertility is far more difficult than controlling mortality. In terms of demographic
phases, decline in mortality precedes the decline in fertility. Whereas mortality can be controlled by
providing nutrition and medical care, lowering fertility requires intensive, coordinated intersectoral
efforts to change human values. This is an extremely difficult proposition unless the desire for change
comes from within. External interventions, educational or otherwise, take time to show impact. China,
however, is an exception where fertility quickly declined due to government policy and its very
effective implementation.
Crude birth rate
The crude birth rate (CBR) is measured as the number of live births per 1000 population per year. It is
not an adequate measure of fertility since it is very much influenced by the age and sex structure of
the population. However, it is an important determinant of the growth rate of a population. During
the period 2000–2005 the CBR for the Region was 19.2, ranging from a low of 7.4 in Macao (China)
to 41.7 in Timor-Leste (Annex Table 3.5). Projections of crude birth rates for the countries in the
Region for the period 2010–2015 range from 7.1 in Hong Kong (China) to 39.9 in Timor-Leste. Data
for a few selected countries is shown in Figure 3.4. The number of births estimated to have taken
place in the Region during 2000–2005 is approximately 321.4 million or 64.3 million per year. India
accounted for 41.6% of these births and this proportion is expected to be maintained over the next 15
years.
Fig. 3.4 Crude birth rates in selected countries, 1990–2015
Sources: World population prospects: the 2006 revision. New York, United Nations Department of Economicand Social Affairs, Population Division, 2007. Available from: http://www.un.org/esa/population/publications/wpp2006/wpp2006.htm
World urbanization prospects: the 2005 revision. New York, United Nations Department of Economicand Social Affairs, Population Division, 2005 (medium variant estimates). Available from: http://www.un.org/esa/population/publications/WUP2005/2005wup.htm
0 5 10 15 20 25 30 35 40
Asia Pacific
Bangladesh
China
India
Indonesia
Japan
Crude birth rate per 1000 population
2010 to 2015
2000 to 2005
1990 to 1995

Health in Asia and the Pacific44
Ch
apte
r 3
Box 3.1: Case study of demography in Viet Nam
Viet Nam is a mid-sized country of 355 000 square km and nearly 84 million people. It is
divided into eight geographical regions and 61 provinces. The demography of the country and
projection were recently studied in detail. Projections were based on net migration for men
and women, and fertility and mortality in five-year age groups for each five-year projection
period. The baseline data on fertility and mortality were obtained from a 3% sample of all
enumeration areas in the entire country for the year 1998–1999.
The main results are listed below. These estimates vary from United Nations estimates stated
elsewhere in this chapter. International migration is practically zero but there is some internal
migration.
Projection periodRegion 1999
1999–2004 2004–2009 2009–2014 2014–2019 2019–2024
Whole Country
Birth rate 18.62 17.91 17.75 16.59 14.98 ...
Crude death rate ... 6.98 6.74 6.57 6.48 6.50
Total fertility rate 2.33 2.15 2.00 1.95 1.90 1.90
Red River Delta
Birth rate ... 15.87 16.17 16.09 15.32 13.56
Crude death rate ... 6.76 6.80 6.80 6.81 6.92
Total fertility rate 1.95 1.90 1.85 1.80 1.80 1.80
North-East
Birth rate ... 17.93 17.74 18.19 17.36 15.51
Crude death rate ... 6.95 6.71 6.61 6.56 6.59
Total fertility rate 2.32 2.15 2.00 1.95 1.90 1.90
North-West
Birth rate ... 25.98 24.96 23.99 21.15 17.64
Crude death rate ... 8.57 7.63 6.92 6.36 6.09
Total fertility rate 3.57 3.20 2.90 2.65 2.36 2.10
North Central
Birth rate ... 19.23 18.8 18.95 18.58 16.38
Crude death rate ... 7.80 7.44 7.16 6.96 6.86
Total fertility rate 2.84 2.50 2.30 2.15 2.10 2.05
South Central Coast
Birth rate ... 20.13 18.67 17.98 17.39 15.83
Crude death rate ... 8.02 7.49 7.16 6.92 6.79
Total fertility rate 2.50 2.35 2.20 2.10 2.05 2.00
Central Highlands
Birth rate ... 27.46 25.33 25.52 21.13 18.30
Crude death rate ... 8.58 7.51 6.69 6.11 5.79
Total fertility rate 3.93 3.45 3.10 2.75 2.40 2.10
Projected birth rate, crude death rate and total fertility rate for geographical
regions of Viet Nam, 1999–2004 (declining fertility variant)

Demographic trends 45
The overall population growth rate is declining, with Central Highlands, North Central, North-
west and Mekong River Delta showing the fastest declines. The Mekong River Delta is expected
to experience a rapid fall in population growth because of high out-migration in addition to
fertility decline. The total fertility rate in Viet Nam in 1999 was 2.33, projected to decline to
1.90 by 2024. The replacement level may have already been reached in 2006. Further declines
will be slow. In the Central Highlands region, it may decline rapidly, from 3.93 in 1999 to 2.10
in 2024. The South-East region already had a low total fertility rate of 1.93 in 1999 and the
decline is likely to slow down to 1.75 by 2024.
Source: Results of population projections for the whole country, geographic regions and 61 provinces/cities,Viet Nam 1999-2024. Ha Noi, General Statistical Office, 2001.
Total fertility rate
The total fertility rate (TFR) is a useful way to express the rate at which women bear children. This
represents the average number of children that would be born per woman if all women lived to the
end of their childbearing years and bore children according to a given set of age-specific fertility rates.
With nearly equal chance of male and female births, a TFR of 2.0 is considered replacement level.
Countries with very high fertility (TFR ≥4.0) in 2005 were Timor-Leste (7.0), Samoa and the Solomon
Islands (each at 4.4), Papua New Guinea (4.3), the Federated States of Micronesia and Vanuatu at 4.2
(Figure 3.5).
During the past decade, fertility continued to decline in most countries. In the more developed
regions of the world, TFR declined from 1.8 children per woman during the period 1985–1990 to
1.6 children per woman from 1995 to 2005, both far below the replacement level (Table 3.1). The
average TFR for less developed regions declined from 3.8 children per woman between 1985 and
1990 to 2.9 children per woman from 2000 to 2005.
The average TFR in the Region declined from 5.0 to 2.5 per woman in the past three decades, but
there were large differentials between subregions, as seen in Table 3.1. Bangladesh and India are two
Projection periodRegion 1999
1999–2004 2004–2009 2009–2014 2014–2019 2019–2024
South-East
Birth rate ... 17.89 17.42 16.63 15.75 14.45
Crude death rate ... 4.83 4.77 4.77 4.85 5.02
Total fertility rate 1.93 1.85 1.80 1.75 1.75 1.75
Mekong River Delta
Birth rate ... 18.89 19.02 18.21 16.08 13.84
Crude death rate ... 6.51 6.33 6.18 6.12 6.24
Total fertility rate 2.10 2.05 2.00 1.95 1.90 1.90
... Data not available

Health in Asia and the Pacific46
Ch
apte
r 3
populous countries where the pace of
decline has slowed. In India, fertility
stalled at about 5.5 to 5.7 children per
woman between the 1960s and early
1970s, but declined subsequently to
about four children per woman by the
end of the 1980s. During the 1990s,
however, fertility decline slowed again,
with TFR reaching 2.9 children per
woman at the end of the 1990s.1 The
total fertility rates of countries and areas
in the Asia Pacific Region from 1990 to
2015 are presented in Annex Table 3.6.
The situation is different in Eastern
Asia. Fertility decline in China was
achieved through economic development
and a population policy directed at
reducing fertility. This led to a steep
decline in the total fertility rate from 6.3
births per woman in 1955 to 1.9 in 1990,
and 1.7 in 2005.
Missing0.00 to 1.99
2.00 to 2.99
3.00 to 3.99
4.00 and Above
Fig. 3.5 Distribution of countries by total
fertility rate, 2000–2005
Sources: World population prospects: the 2006 revision. NewYork, United Nations Department of Economic and SocialAffairs, Population Division, 2007. Available from: http://www.un.org/esa/population/publications/wpp2006/wpp2006.htm
Core health indicators. Geneva, World HealthOrganization. Available from: http://www.who.int/whosis/database/core/core_select.cfm
Major Areas 1970–1975 1985–1990 1990–1995 1995–2000 2000–2005
World 4.5 3.4 3.1 2.8 2.7
More developed regions 2.1 1.8 1.7 1.6 1.6
Less developed regions 5.4 3.8 3.4 3.1 2.9
Africa 6.7 6.1 5.7 5.3 5.0
Asia 5.0 3.4 3.0 2.7 2.5
Eastern Asia 4.5 2.4 1.9 1.7 1.7
South-Central Asia 5.5 4.5 4.1 3.6 3.2
South-Eastern Asia 5.6 3.6 3.1 2.7 2.5
Western Asia 5.8 4.5 4.1 3.6 3.2
Europe 2.2 1.8 1.6 1.4 1.4
North America 2.0 1.9 2.0 2.0 2.0
Oceania 3.2 2.5 2.5 2.4 2.4
Table 3.1 Trends in total fertility rate by major areas and regions of the world,
1970–2005
Sources: World population prospects: the 2006 revision. New York, United Nations Department of Economicand Social Affairs, Population Division, 2007. Available from: http://www.un.org/esa/population/publications/wpp2006/wpp2006.htm
World urbanization prospects: the 2005 revision. New York, United Nations Department of Economicand Social Affairs, Population Division, 2005 (medium variant estimates). Available from: http://www.un.org/esa/population/publications/WUP2005/2005wup.htm

Demographic trends 47
Although there are big disparities in TFR among developing and developed countries, it fell belowfive children per woman in all countries except Timor-Leste by 2005. However, the trends werediverse (Figure 3.6). There appear to be four groups of countries: (1) countries with stable low TFR,such as Japan and the Republic of Korea; (2) countries where the TFR continues to decline, such asChina, Indonesia, Sri Lanka and Viet Nam; (3) countries where the decline in TFR appears to haveslowed, approaching three children per woman (Bangladesh and India); and (4) countries where TFRremains high (over 4) and the decline rate is slow, such as the Lao People’s Democratic Republic andmany Pacific island countries.
As with other parameters, aggregate national fertility levels mask enormous differentials withincountries, between ethnic groups or rural and urban populations, especially in larger countries. Forexample, TFR in 1999 was 2.00 in the province of Bali in Indonesia, 2.37 in Jawa Tengah, 2.80 inJambi and 3.06 in Nusa Tenggara Timur.9
Determinants of fertility declineThe industrialization, urbanization and modernization of societies bring wider access to education,improved child survival and increased adoption of contraception which are the major driving forcesof fertility decline. Education also plays a decisive role in fostering fertility decline. Studies in 51developing countries show that among women with secondary or higher education, TFR is far lowerthan those with only primary or no education.10 Besides providing knowledge, education increasesexposure to information and the media, builds skills for gainful employment, increases femaleparticipation in family decision-making and raises their income. Table 3.2 presents the TFR levels forwomen in various education categories in selected countries of the Region. A study in India11 foundthat there is no time lag between improvement in education and decline in birth rates as both appearto be part of the same developmental process.
Fig. 3.6 Trend in total fertility rate in selected Asia Pacific Region countries, 1960–2005
Sources: UC atlas of global inequality. Available from: http://ucatlas.ucsc.edu11 health questions about the 11 SEAR countries. New Delhi, WHO Regional Office for South-East Asia,2007.Reproductive health: family planning and fertility rate. Manila, WHO Regional Office for the WesternPacific. Available from: http://www.wpro.who.int/sites/rph/data/family_planning.htmCountry health information profiles (1974-2005). Manila, WHO Regional Office for the WesternPacific.
0
1
2
3
4
5
6
7
8
1960 1970 1980 1990 2000 2005
IndonesiaLao PDR MyanmarPhilippines Republic of KoreaViet Nam

Health in Asia and the Pacific48
Cha
pter
3 Total Fertility RateCountry Year All No Primary Secondary
levels education or higher
Bangladesh 1999 3.3 4.1 3.3 2.4
India 1998 2.9 3.5 2.6 2.0
Indonesia 1997 2.8 2.7 3.0 2.6
Philippines 1998 3.7 5.0 5.0 3.3
Table 3.2 Total fertility rate according to women's level of education in selected countriesand years
Source: World population monitoring: reproductive rights and reproductive health. New York, United NationsDepartment of Economic and Social Affairs, Population Division, 2004: 67. Available from: http://www.un.org/esa/population/publications/2003monitoring/WorldPopMonitoring_2002.pdf
Changes in marriage patterns, postponing marriage, and increasing divorce rates may lead to smallerfamilies because couples have fewer years of childbearing. Women who delay the onset of child-bearingalso have smaller families. A shortened childbearing period for women is now an important determinantof persistent below-replacement fertility in many developed countries and in an increasing number ofdeveloping countries. Although earlier menarche extends the duration of fecundity, postponement offirst birth until age 30 or beyond shortens the effective child-bearing period.
3.3 MortalityThe age at death and the cause of death are important factors in assessing the health of populations.Both these aspects are discussed in detail in Chapter 5. The following discussion is restricted to thelarger aspects of mortality that affect demography.
Crude death rateDuring the five-year period 2000–2005, an estimated 125.3 million deaths, or 25.2 million per year,occurred in the Region. Among these, India, with 37% of the Region’s population, accounted for 9.3million deaths per year or 37% of total deaths (Figure 3.7). The crude death rate (CDR) is the numberof deaths in one year per 1000 population. It is not a very sensitive measure of mortality as it issignificantly influenced by the age and sex structure of the population, while the age structure is nottaken into account in the measurement. Yet CDR is an important measure that, in combination withthe birth rate, determines population growth rate. During the period 2000–2005 the CDR for thecountries of the Region ranged from 2.8 in Brunei Darussalam to 10.2 in Timor-Leste and Myanmar(Annex Table 3.7). There is a greater homogeneity in the death rates than in the birth rates of differentcountries. CDRs projected for the future for the period 2010–2015 range from a high of 10.3 in theDemocratic People’s Republic of Korea to a low of 3.0 in Brunei Darussalam.
While CDRs in India and Bangladesh are expected to continue their declining trend over the next15 years, in China, Indonesia and Japan they are expected to increase because of rapid populationageing. Japan will have negative growth commencing in 2010. Unless policy measures are taken nowto increase fertility and promote immigration from other countries, Japan’s population decline cannotbe halted.

Demographic trends 49
Fig. 3.7 Percentage distribution of total deathsin the Asia Pacific Region, 2000–2005
Sources: World population prospects: the 2006 revision.New York, United Nations Department ofEconomic and Social Affairs, Population Division,2007. Available from: http://www.un.org/esa/population/publications/wpp2006/wpp2006.htmWorld urbanization prospects: the 2005 revision.New York, United Nations Department ofEconomic and Social Affairs, Population Division,2005 (medium variant estimates). Available from:http://www.un.org/esa/population/publications/WUP2005/2005wup.htm
Standardized death rateWhile the CDR in Japan is nearly thesame as in Bangladesh and India, the age-specific mortality rates in every age groupare significantly lower in Japan. The veryhigh proportion of older persons in Japandue to higher longevity masked thesubstantial decline in mortality over theyears. For this reason, age-standardizeddeath rates need to be considered.
Age standardization is a statisticaltechnique that recomputes death rate onthe basis of a common (or standard)population age distribution. Thisremoves the discrepancies arising fromage-differentials, and makes ratescomparable across countries.
Age-standardized death rates for thecountries of the Asia Pacific Region forthe year 2002 are shown in the lastcolumn of Annex Table 3.7. The lowestis 3.6 per 1000 population in Japan, and
the highest is 16.6 in Cambodia, indicating a real measure of great inequalities in death rates. Thecountries with rates of 14 or more are Cambodia, the Lao People’s Democratic Republic, Myanmar,Nauru, Nepal, Papua New Guinea, Timor-Leste and Tuvalu. These countries do not have especiallyhigh CDRs because only a small percentage of their populations are in older age groups. High age-standardized death rates truly identify countries with high mortality.
Urbanization and migrationUrbanization and migration are related phenomena that accompany development because peopletend to move from rural to urban areas in search of jobs and better amenities. This brings populationpressure on cities, often creating slums with a lower quality of life than rural villages. In addition,migration also occurs when another part of the country offers better opportunities. Migration fromone country to another is also common.
The population of the Asia Pacific Region continues to be predominantly rural with agriculture asthe main occupation for the majority of the people. In 2005 only 38.2% of the population lived in theurban areas compared to the 48.7% world average (Annex Table 3.8). Urban population ranged froma high of 100% in Hong Kong (China) and Singapore, to a low of 11.1% in Bhutan, excluding theRegion’s small islands. It is 88.2% in Australia, 94% in Guam, but only 17% in Solomon Islands. Inabsolute magnitude, the 786 million living in rural areas in India is higher than in any other country,including China (784 million).
The urban population projected for the year 2015 for the Asia Pacific Region is nearly 44%. Muchis known about the causes and effects of urbanization, and knowledge about its implications forhealth is increasing.12,13 Adverse changes in the types of food consumed and lower physical activity

Health in Asia and the Pacific50
Cha
pter
3
in urban areas gives rise to obesity. In China and Indonesia, adult obesity is twice as prevalent in urbanareas as it is in rural areas.14 These changes can also precipitate diabetes, stroke and hypertension. Thepressure of living and housing expenses can reduce household expenditure on food and can causeundernutrition in children, with the paradox of undernutrition and obesity occurring simultaneously inthe same household.
Urbanization is associated with health issues related to lifestyle, smoking, drug abuse, polluted air,occupational hazards, accidents and injuries. Scarcity of land and slums create problems of watersupply, sanitation, and overcrowding. Under these conditions, infectious diseases are more widespreadthan in rural areas.
Box 3.2: Living conditions in Mumbai, a megacity
The dream of a better life in cities can easily become a nightmare. The water supply, sanitationand housing conditions of megacities in developing countries, especially in slums, leave muchto be desired. This is illustrated by the conditions in Mumbai. The mean number of people perroom in houses was 4.2 in the slum and 2.6 in non-slum areas. About half of slum householdsand a fourth of those in non-slum areas live in houses built fully or partially with mud. Only 59%of families living in slums had access to piped water in their residences. Only 8% of thehouseholds had their own flush toilets. Kerosene was used as the cooking fuel by 61% of slumhouseholds. All these parameters confirm that the population in megacities can be acutelyvulnerable to adverse health conditions.
Selected indicatorsSlums Non- Total
Slums
Mean number of persons per room 4.2 2.6 3.5
<3 persons per room (%) 26.6 64.5 43.9
Houses built with mud* (%) 48.5 23.1 36.9
Households having electricity (%) 99.2 99.8 99.5
Tap as a source of drinking water within the 58.9 93.5 74.7house/yard/plot (%)
Using drinking water without any purification (%) 38.1 14.2 27.1
Households owning flush toilet (%) 7.6 55.3 29.4
Households without any sanitation facility (%) 4.4 0.2 2.5
Households using kerosene as a cooking fuel (%) 61.2 13.7 39.5
*kaccha and pucca house: kaccha houses are made predominantly with mud and low-qualitybuilding materials. Semi-pucca houses are made partly with low-quality and partly with high-quality building materials.
Source: National Family Health Survey (NFHS-2) India, 1998-99. Mumbai, International Institutefor Population Sciences and ORC Macro, 2000.
Selected household amenity indicators of a megacity: Mumbai, India,1998–1999

Demographic trends 51
Demographic change and developmentDemographic transition describes the transition of a society from high fertility and mortality to lowfertility and mortality. This transition takes place over a long time period, usually classified in fourphases. The first phase is a situation of high fertility and high mortality. In the second phase, mortalitylevels decline while the fertility level remains stagnant or even rises moderately. In the third phase,fertility and mortality levels decline. In the final phase, both fertility and mortality settle down to a lowlevel. In some countries a fifth phase also occurs, in which the death rate exceeds the birth rate dueto population ageing and decline.
The demographic transition theory relates this process to social and economic development and isbased on empirical observations of developed countries in the 19th and 20th centuries. In developedsocieties no organized national programmes of family planning to reduce fertility levels existed and nopublic health and medical care were readily available. Such societies had to create these services as apart of their development. In developing countries, public health and medical care for preventive,curative and promotive health was quickly transferred from these developed countries. Hence mortalitylevels declined rapidly, but not fertility levels. Thus, population growth rates during the 1950s weremuch higher in many developing countries. This was particularly true for countries in the Asia PacificRegion. In order to reduce spiralling population growth rates, many developing countries in the Regionlaunched national programmes for family planning, which were run and supported by their governments.The demographic transition in many developing countries in the Region occurred at a faster pace thanever experienced in developed western countries. Such situations created an imbalance betweensocioeconomic development and demographic transition in some countries, which in turn were reflectedin their health conditions. In many countries, infectious diseases continued to be prevalent at thesame time newer lifestyle diseases emerged due to urbanization and ageing. Large inequities ineconomic and health conditions between different segments of populations also materialized.
There can be a debate on whether high fertility is the outcome of poor development, its antecedent,or that both go hand in hand. As mentioned earlier, in India, the fertility decline accompanied anincrease in the literacy level. China’s experience suggests that fertility decline can lead to rapid economicdevelopment.
A popular belief that “development is the best contraceptive” implies that economic growth causesfertility to decline. However, fertility declines in Indonesia, the Republic of Korea and Thailand in the1970s and 1980s were more than that anticipated from economic development alone.15 It was arguedearlier that the fertility decline in developing countries reduces dependency ratios, resulting in ademographic bonus. To make the most of this, the opportunity must be seized to increase investmentsin education, levels of saving and investment, and provide impetus for economic growth during thisperiod of demographic bonus and transform it into a positive resource for the population. Countrieswhere this has been done have reaped the benefit through rapid development.

Health in Asia and the Pacific52
Cha
pter
3
References1 World population prospects: the 2006 revision. New York, United Nations Department of Economic and
Social Affairs, Population Division, 2007. Available from: http://www.un.org/esa/population/publications/wpp2006/wpp2006.htm
2 World urbanization prospects: the 2005 revision. New York, United Nations Department of Economic andSocial Affairs, Population Division, 2005 (medium variant estimates). Available from: http://www.un.org/esa/population/publications/WUP2005/2005wup.htm
3 Li B. Levels, trends and determinants of fertility in China: 1973-1987. Asia-Pacific population journal, 1990,5 (2):3-16.
4 Census of India 2001. Chapter 3: States at a glance. New Delhi, Office of the Registrar General and CensusCommissioner. Available from: http://www.censusindia.gov.in/
5 Li S, Zhu C, Feldman MW. Gender differences in child survival in contemporary rural China: a countrystudy. Journal of biosocial science, 2004, 36:83-109.
6 Kwang-ho M. The health consequences of Korea’s rapidly aging population. Paper presented at an East-West Center conference, Tokyo, Japan, 2004. Abstract available from: http://www2.eastwestcenter.org/alumni/Japan/2004/Abstracts/Kwang-Ho%meng.htm
7 Fifty years of WHO in South-East Asia. 1988-1997: the fifth decade. New Delhi, WHO Regional Office forSouth-East Asia. Available from: http://www.searo.who.int/EN/Section898/Section1444_5917.htm
8 Shift to smaller families can bring economic benefits. In: State of the world population 1998: the newgenerations. New York, United Nations Population Fund, 1998. Available from: http://www.unfpa.org/swp/1998/newsfeature1.htm
9 BPS Statistics Indonesia 2006: total fertility rate by province. Jakarta, Badan Pusat Statistik (BPS). Availablefrom: www.bps.go.id/sector/population/table7.html
10 World population monitoring: reproductive rights and reproductive health. New York, United NationsDepartment of Economic and Social Affairs, Population Division, 2004. Available from: http://www.un.org/esa/population/publications/2003monitoring/WorldPopMonitoring_2002.pdf
11 Bansal AK, Bajpai R, Indrayan A. The time lag between literacy making an impact on mortality and fertilityindicators: preliminary results. Indian journal of community medicine, 1993,18(1):14-19.
12 Talib R, Agus MR. Social problems and health in urbanization. Southeast Asian journal of tropical medicineand public health, 1992, 23 (Suppl 3):84-93.
13 Bekedam H. A vision for healthy urbanization in the 21st century: challenges and opportunities for China.Available from: http://www.wpro.who.int/china/media_centre/speeches/speech_200602.htm
14 Popkin BM. Urbanization and the nutrition transition 2020. Washington DC, International Food PolicyResearch Institute (IFRP), 2000 (2020 Focus No. 3 – Brief 07). Available from: http://www.ifpri.org/2020/focus/focus03/focus03_07.asp)
15 Robey B, ed. How rapid decline in fertility speeds economic development: evidence from Asia. Hawaii,East-West Center, 1987.

Demographic trends 53
Anne
x Ta
bles
Age
grou
p (y
ears
)0–
45–
910
–14
15–1
9
Cou
ntry
/are
aB
oth
MF
Bot
hM
FB
oth
MF
Bot
hM
F
Tabl
e 3.
1Po
pula
tion
(tho
usan
ds) b
y fiv
e-ye
ar a
ge g
roup
s an
d se
x in
the
Asia
Pac
ific
Regi
on, 2
005
Am
eric
an S
amoa
84
47
44
74
37
43
Aus
tral
ia1
263
648
615
1 30
867
163
71
394
715
678
1 39
971
768
2
Bang
lade
sh18
916
9 66
99
247
17 5
558
992
8 56
317
456
8 93
48
522
16 2
708
358
7 91
2
Bhut
an63
3231
7035
3478
3938
7538
37
Brun
ei D
arus
sala
m40
2119
3619
1734
1816
3217
15
Cam
bodi
a1
681
858
823
1 70
186
783
41
864
947
917
1 70
986
684
4
Chi
na85
287
45 8
5939
428
95 5
0650
900
44 6
0610
2 97
954
328
48 6
5111
7 00
961
330
55 6
79
Coo
k Is
land
s2
11
21
12
11
21
1
Dem
ocra
tic P
eopl
e’s
Repu
blic
of
Kore
a1
661
851
809
1 97
91
011
967
2 06
91
057
1 01
21
855
948
907
Fiji
9147
4493
4845
8946
4382
4240
Fren
ch P
olyn
esia
2312
1124
1212
2312
1128
1413
Gua
m17
98
179
816
88
147
7
Hon
g Ko
ng (C
hina
)29
515
114
436
018
317
741
220
920
342
521
920
6
Indi
a12
6 89
466
136
60 7
5812
4 49
465
118
59 3
7612
2 75
564
267
58 4
8811
4 12
659
554
54 5
72
Indo
nesi
a21
754
11 0
9210
662
21 1
7610
779
10 3
9721
217
10 7
8610
430
21 3
7010
839
10 5
32
Japa
n5
700
2 92
62
773
6 05
73
110
2 94
86
001
3 07
32
928
6 56
83
363
3 20
6
Kirib
ati
116
511
55
105
59
54
Lao
Peop
le’s
Dem
ocra
tic R
epub
lic71
636
535
176
038
737
377
839
538
368
334
533
7
Mac
ao (
Chi
na)
179
824
1212
3518
1742
2121
Mal
aysi
a2
752
1 41
41
338
2 65
51
363
1 29
22
646
1 35
41
292
2 51
81
281
1 23
7
Mal
dive
s30
1515
3216
1638
2019
3920
19
Mar
shal
l Is
land
s7
33
63
36
33
63
3

Health in Asia and the Pacific54
Cha
pter
3Ag
e gr
oup
(yea
rs)
0–4
5–9
10–1
415
–19
Cou
ntry
/are
aB
oth
MF
Bot
hM
FB
oth
MF
Bot
hM
F
Mic
rone
sia,
Fede
rate
d St
ates
of
158
714
77
147
713
76
Mon
golia
234
119
114
231
118
113
281
144
138
317
160
157
Mya
nmar
4 17
32
118
2 05
44
342
2 20
02
142
4 55
92
308
2 25
14
763
2 40
92
354
Nau
ru2
11
21
12
11
11
1
Nep
al36
111
853
1 75
93
571
1 83
61
735
3 37
31
737
1 63
62
919
1 50
41
415
New
Cal
edon
ia20
1010
2211
1122
1111
2111
10
New
Zea
land
283
145
138
286
147
139
310
160
150
306
156
150
Niu
e0
00
00
00
00
00
0
Nor
ther
n M
aria
na I
sland
s11
55
105
510
55
95
4
Pala
u3
11
21
12
11
21
1
Papu
a N
ew G
uine
a89
946
443
584
143
340
872
537
235
362
832
130
6
Phili
ppin
es10
924
5 59
35
331
10 0
125
118
4 89
49
642
4 92
24
721
8 90
64
537
4 36
9
Pitc
airn
Isla
nds*
00
00
00
00
00
00
Repu
blic
of
Kore
a2
444
1 28
01
164
3 06
61
602
1 46
43
414
1 73
61
677
3 22
21
697
1 52
5
Sam
oa26
1312
2714
1323
1211
2010
9
Sing
apor
e21
611
210
428
814
913
934
117
616
528
714
913
8
Solo
mon
Isla
nds
6936
3364
3331
5830
2851
2624
Sri L
anka
1 50
376
773
61
510
769
741
1 60
882
178
81
760
896
864
Thai
land
4 52
02
317
2 20
34
484
2 31
02
174
4 65
22
402
2 25
15
007
2 55
42
453
Tim
or-L
este
182
9389
164
8480
134
6966
113
5855
Toke
lau
00
00
00
00
00
00
Tong
a12
66
137
613
76
116
5
Tuva
lu1
11
11
11
11
11
1
Demographic trends 55
Age
grou
p (y
ears
)0–
45–
910
–14
15–1
9
Cou
ntry
/are
aB
oth
MF
Bot
hM
FB
oth
MF
Bot
hM
F
Vanu
atu
3016
1529
1514
2714
1324
1212
Vie
t N
am8
067
4 11
83
949
7 84
44
000
3 84
59
286
4 72
84
558
9 26
04
699
4 56
0
Wal
lis a
nd F
utun
a2
11
21
12
11
21
1
Asia
Pac
ific
Regi
on30
4 47
515
9 20
614
5 26
531
0 69
916
2 40
714
8 29
131
8 40
816
5 90
315
2 50
732
1 91
116
7 21
215
4 69
7
Age
grou
p (y
ears
)20
–24
25–2
930
–34
35–3
9
Cou
ntry
/are
aB
oth
MF
Bot
hM
FB
oth
MF
Bot
hM
F
Am
eric
an S
amoa
63
35
32
52
24
22
Aus
tral
ia1
410
720
690
1 36
669
167
415
1375
575
81
467
728
739
Bang
lade
sh14
897
7 66
17
236
12 6
756
519
6 15
511
340
5 84
65
494
10 0
265
165
4 86
1
Bhut
an71
4031
5832
2543
2320
3922
17
Brun
ei D
arus
sala
m35
1717
3919
2035
1718
3115
16
Cam
bodi
a1
569
791
778
893
442
451
866
426
440
820
387
433
Chi
na10
0 37
452
475
47 8
9995
730
49 2
0546
525
120
117
61 6
3058
487
125
080
64 2
3160
849
Coo
k Is
land
s2
11
11
11
11
11
1
Dem
ocra
tic P
eopl
e's
Repu
blic
of
Kore
a1
851
945
906
1 49
376
173
22
116
1 07
61
039
2 20
11
118
1 08
3
Fiji
8242
4068
3533
5227
2550
2525
Fren
ch P
olyn
esia
2211
1119
109
2010
1021
1110
Gua
m12
66
126
612
66
137
6
Hon
g Ko
ng (C
hina
)48
224
024
251
924
027
857
025
731
360
126
633
5
Indi
a10
4 61
254
553
50 0
6094
067
48 9
9045
078
82 9
7843
192
39 7
8673
400
38 1
9935
201
Indo
nesi
a21
476
10 8
1810
657
20 2
9410
165
10 1
2918
815
9 39
99
417
16 9
578
504
8 45
4
Japa
n7
542
3 85
53
688
8 62
84
413
4 21
49
935
5 05
44
882
8 79
84
449
4 34
8
Kirib
ati
84
46
33
63
36
33

Health in Asia and the Pacific56
Cha
pter
3Ag
e gr
oup
(yea
rs)
20–2
425
–29
30–3
435
–39
Cou
ntry
/are
aB
oth
MF
Bot
hM
FB
oth
MF
Bot
hM
F
Lao
Peop
le's
Dem
ocra
tic R
epub
lic53
726
926
844
822
222
637
918
519
430
915
015
9
Mac
ao (
Chi
na)
3718
2030
1316
3716
2143
1726
Mal
aysi
a2
399
1 20
81
191
2 08
41
056
1 02
81
926
976
950
1 77
990
587
5
Mal
dive
s33
1716
2613
1221
1110
179
8
Mar
shal
l Is
land
s5
22
42
24
22
42
2
Mic
rone
sia,
Fede
rate
d St
ates
of
126
68
44
63
36
33
Mon
golia
271
137
134
245
123
122
219
110
109
190
9496
Mya
nmar
4 59
52
319
2 27
64
354
2 18
02
174
4 21
22
089
2 12
43
574
1 75
81
815
Nau
ru1
11
11
01
00
11
0
Nep
al2
519
1 28
41
235
2 13
21
060
1 07
21
804
866
938
1 53
871
582
3
New
Cal
edon
ia19
99
189
919
910
189
9
New
Zea
land
281
143
138
264
131
133
286
138
149
298
143
155
Niu
e0
00
00
00
00
00
0
Nor
ther
n M
aria
na I
sland
s7
44
63
36
33
63
3
Pala
u2
11
21
11
11
11
1
Papu
a N
ew G
uine
a54
828
026
847
824
123
744
721
922
938
018
719
2
Phili
ppin
es7
962
4 04
33
920
7 07
93
583
3 49
66
062
3 05
73
005
5 24
72
632
2 61
5
Pitc
airn
Isla
nds*
00
00
00
00
00
00
Repu
blic
of
Kore
a3
731
1 91
91
812
3 78
81
939
1 84
94
231
2 15
82
073
4 09
02
083
2 00
7
Sam
oa14
86
116
512
66
126
6
Sing
apor
e26
513
712
726
113
512
631
516
015
538
318
919
4
Solo
mon
Isla
nds
4624
2240
2119
3518
1726
1313
Sri L
anka
1 86
393
393
01
471
713
758
1 24
359
365
01
447
705
742
Thai
land
5 10
82
574
2 53
45
083
2 52
02
564
5 09
02
443
2 64
75
018
2 36
22
656
Demographic trends 57
Age
grou
p (y
ears
)20
–24
25–2
930
–34
35–3
9
Cou
ntry
/are
aB
oth
MF
Bot
hM
FB
oth
MF
Bot
hM
F
Tim
or-L
este
9851
4767
3532
6333
3053
2528
Toke
lau
00
00
00
00
00
00
Tong
a11
65
84
46
33
53
3
Tuva
lu1
11
10
01
00
10
0
Vanu
atu
2010
1016
88
157
813
67
Vie
t N
am8
250
4 16
34
087
7 52
53
777
3 74
86
792
3 37
33
418
6 14
43
037
3 10
7
Wal
lis a
nd F
utun
a1
11
11
11
11
11
0
Asia
Pac
ific
Regi
on29
3 08
715
1 75
014
1 33
927
1 32
513
9 33
513
1 98
528
1 65
814
4 20
513
7 45
627
0 11
913
8 19
213
1 92
8
Age
grou
p (y
ears
)40
–44
45–4
950
–54
55–5
9
Cou
ntry
/are
aB
oth
MF
Bot
hM
FB
oth
MF
Bot
hM
F
Am
eric
an S
amoa
42
23
11
21
12
11
Aus
tral
ia1
535
764
771
1 46
072
673
41
342
666
676
1 24
162
461
7
Bang
lade
sh8
595
4 44
64
149
6 99
63
628
3 36
95
642
2 92
42
718
4 13
72
077
2 06
1
Bhut
an30
1614
2815
1321
1110
179
8
Brun
ei D
arus
sala
m24
1311
2212
1017
107
106
4
Cam
bodi
a71
632
639
158
225
932
346
720
426
237
215
621
5
Chi
na10
3 04
752
856
50 1
9281
772
42 1
3239
640
82 8
4842
212
40 6
3659
205
30 4
5528
750
Coo
k Is
land
s1
10
10
01
00
10
0
Dem
ocra
tic P
eopl
e's
Repu
blic
of
Kore
a1
656
838
817
1 55
278
177
187
643
644
01
170
576
595
Fiji
5126
2547
2423
3718
1930
1516
Fren
ch P
olyn
esia
1910
915
87
137
69
54
Gua
m12
66
115
59
44
74
4
Hon
g Ko
ng (C
hina
)71
332
339
066
832
034
852
425
726
740
120
419
8

Health in Asia and the Pacific58
Cha
pter
3Ag
e gr
oup
(yea
rs)
40–4
445
–49
50–5
455
–59
Cou
ntry
/are
aB
oth
MF
Bot
hM
FB
oth
MF
Bot
hM
F
Indi
a65
196
33 9
1931
277
57 0
4029
639
27 4
0048
777
25 2
2623
550
35 4
0317
913
17 4
90
Indo
nesi
a14
694
7 39
67
298
12 4
146
255
6 15
99
657
4 85
54
803
7 36
93
527
3 84
2
Japa
n8
098
4 09
04
008
7 74
63
893
3 85
38
831
4 40
94
421
10 2
685
091
5 17
7
Kirib
ati
53
25
22
42
23
21
Lao
Peop
le's
Dem
ocra
tic R
epub
lic26
412
913
521
810
711
117
787
9010
247
55
Mac
ao (
Chi
na)
4721
2649
2425
3720
1725
1411
Mal
aysi
a1
696
863
833
1 46
174
871
21
156
595
561
870
449
421
Mal
dive
s15
87
126
610
55
63
3
Mar
shal
l Is
land
s3
21
31
12
11
21
1
Mic
rone
sia,
Fede
rate
d St
ates
of
53
35
22
42
23
11
Mon
golia
173
8588
129
6366
8240
4256
2729
Mya
nmar
3 07
81
504
1 57
42
686
1 30
41
382
2 29
61
102
1 19
41
514
723
791
Nau
ru1
00
10
01
00
00
0
Nep
al1
316
607
709
1 10
551
659
092
243
748
572
133
139
0
New
Cal
edon
ia17
88
147
712
66
105
5
New
Zea
land
321
156
165
293
144
149
256
126
129
234
116
118
Niu
e0
00
00
00
00
00
0
Nor
ther
n M
aria
na I
sland
s5
32
52
24
22
32
1
Pala
u1
11
11
11
00
10
0
Papu
a N
ew G
uine
a32
216
016
224
312
212
218
796
9113
769
67
Phili
ppin
es4
478
2 23
42
244
3 76
81
867
1 90
13
131
1 53
81
593
2 30
11
144
1 15
7
Pitc
airn
Isla
nds*
00
00
00
00
00
00
Repu
blic
of
Kore
a4
132
2 08
52
047
3 94
41
980
1 96
42
875
1 44
51
430
2 36
31
169
1 19
4
Sam
oa10
65
84
46
33
42
2

Demographic trends 59
Age
grou
p (y
ears
)40
–44
45–4
950
–54
55–5
9
Cou
ntry
/are
aB
oth
MF
Bot
hM
FB
oth
MF
Bot
hM
F
Sing
apor
e42
321
121
241
120
620
534
317
217
026
513
313
2
Solo
mon
Isla
nds
2110
1117
88
137
610
55
Sri L
anka
1 39
869
170
61
291
639
652
1 19
958
961
096
546
949
6
Thai
land
5 08
12
407
2 67
44
789
2 28
72
502
4 05
31
952
2 10
02
996
1 45
51
541
Tim
or-L
este
4723
2442
2121
3116
1525
1113
Toke
lau
00
00
00
00
00
00
Tong
a4
22
32
23
12
31
2
Tuva
lu1
00
00
00
00
00
0
Vanu
atu
105
59
54
63
36
33
Vie
t N
am5
465
2 69
52
770
4 43
02
182
2 24
83
396
1 67
01
726
2 11
81
032
1 08
6
Wal
lis a
nd F
utun
a1
00
10
01
00
00
0
Asia
Pac
ific
Regi
on23
2 73
111
8 95
411
3 77
819
5 30
099
951
95 3
4717
9 27
291
159
88 1
0713
4 38
567
878
66 5
08
Age
grou
p (y
ears
)60
–69
70–7
980
+A
ll ag
es
Cou
ntry
/are
aB
oth
MF
Bot
hM
FB
oth
MF
Bot
hM
F
Am
eric
an S
amoa
31
12
11
00
065
3432
Aus
tral
ia1
714
858
857
1 18
655
463
271
326
444
920
311
10 1
0110
209
Bang
lade
sh5
708
2 81
92
889
2 47
11
167
1 30
360
026
733
315
3 28
478
472
74 8
12
Bhut
an26
1413
147
83
11
636
334
300
Brun
ei D
arus
sala
m11
74
63
31
01
373
194
178
Cam
bodi
a46
317
928
520
667
139
4716
3113
956
6 79
17
166
Chi
na80
604
41 3
3239
273
48 0
1723
069
24 9
4815
404
6 16
49
240
1 31
2 97
967
8 17
863
4 80
3
Coo
k Is
land
s0
00
00
00
00
1910
9
Dem
ocra
tic P
eopl
e's
Repu
blic
of
Kore
a2
042
917
1 12
588
128
160
021
542
174
23 6
1711
638
11 9
77

Health in Asia and the Pacific60
Cha
pter
3Ag
e gr
oup
(yea
rs)
60–6
970
–79
80+
All
ages
Cou
ntry
/are
aB
oth
MF
Bot
hM
FB
oth
MF
Bot
hM
F
Fiji
3818
2115
68
31
282
842
040
9
Fren
ch P
olyn
esia
137
76
33
11
125
613
312
4
Gua
m9
44
52
31
11
167
8482
Hon
g Ko
ng (C
hina
)48
425
023
540
419
321
120
075
123
7 05
83
387
3 67
0
Indi
a50
895
24 9
4125
954
25 9
4512
263
13 6
8278
2037
0841
121
134
402
587
618
546
784
Indo
nesi
a11
637
5 37
56
262
5 85
62
594
3 26
21
375
569
808
226
061
112
953
113
112
Japa
n15
802
7 59
18
211
11 7
445
215
6 53
06
178
1 95
54
223
127
896
62 4
8765
410
Kirib
ati
42
22
11
00
090
4744
Lao
Peop
le's
Dem
ocra
tic R
epub
lic17
480
9395
4253
249
155
664
2 81
92
843
Mac
ao (
Chi
na)
2312
1117
710
93
647
222
524
7
Mal
aysi
a1
068
534
535
493
225
267
152
6486
25 6
5513
035
12 6
18
Mal
dive
s9
54
53
31
01
294
151
144
Mar
shal
l Is
land
s2
11
20
00
00
5428
26
Mic
rone
sia,
Fede
rate
d St
ates
of
32
22
11
10
011
156
54
Mon
golia
8842
4546
1926
196
122
581
1 28
71
291
Mya
nmar
2 06
896
41
105
1 29
658
770
945
819
426
347
968
23 7
5924
208
Nau
ru1
00
00
00
00
147
7
Nep
al99
344
355
045
619
426
211
144
6627
091
13 4
2713
665
New
Cal
edon
ia14
77
73
43
12
236
116
118
New
Zea
land
326
159
166
222
104
119
131
4784
4 09
72
015
2 08
2
Niu
e0
00
00
00
00
21
1
Nor
ther
n M
aria
na I
sland
s4
22
21
10
00
8645
42
Pala
u1
00
10
00
00
2111
10

Demographic trends 61
Age
grou
p (y
ears
)60
–69
70–7
980
+A
ll ag
es
Cou
ntry
/are
aB
oth
MF
Bot
hM
FB
oth
MF
Bot
hM
F
Papu
a N
ew G
uine
a16
383
8060
2931
137
76
071
3 08
32
988
Phili
ppin
es3
178
1 51
51
663
1 47
165
381
940
415
225
384
565
42 5
8841
981
Pitc
airn
Isla
nds*
00
00
00
00
00
00
Repu
blic
of
Kore
a3
855
1 82
92
026
2 04
881
41
234
669
204
465
47 8
7223
940
23 9
31
Sam
oa7
44
42
21
01
185
9689
Sing
apor
e29
614
615
117
178
9363
2538
4 32
82
178
2 14
9
Solo
mon
Isla
nds
147
77
33
11
147
224
222
8
Sri L
anka
1 06
750
955
858
126
032
221
595
118
19 1
219
449
9 67
1
Thai
land
4 05
81
899
2 15
82
245
970
1 27
482
128
453
663
005
30 7
3632
267
Tim
or-L
este
3417
1713
67
31
11
069
543
525
Toke
lau
00
00
00
00
02
11
Tong
a5
22
32
20
00
100
5250
Tuva
lu0
00
00
00
00
116
5
Vanu
atu
74
33
22
10
021
611
010
7
Viet
Nam
3 25
91
570
1 68
92
335
1 08
71
248
857
376
481
85 0
2842
507
42 5
20
Wal
lis a
nd F
utun
a1
00
00
00
00
158
7
Asia
Pac
ific
Regi
on19
0 17
094
153
96 0
2410
8 34
650
519
57 8
2736
520
14 5
7821
936
3 44
8 40
41
765
400
1 68
2 99
5
Not
e:Th
e su
m o
f po
pula
tion
prov
ided
in
age
grou
ps m
ay d
iffer
slig
htly
fro
m t
otal
pop
ulat
ion
of t
he c
ount
ry/a
rea
prov
ided
in
othe
r ta
bles
due
to
rou
nd-o
ff er
rors
.*
Tota
l Pop
ulat
ion
of P
itcai
rn I
sland
is 9
2.So
urce
s:W
orld
pop
ulat
ion
pros
pect
s: t
he 2
006
revi
sion.
N
ew Y
ork,
Uni
ted
Nat
ions
Dep
artm
ent
of E
cono
mic
and
Soc
ial A
ffairs
, Po
pula
tion
Div
ision
, 20
07.
Avai
labl
e fro
m:
http
://w
ww
.un.
org/
esa/
popu
latio
n/pu
blic
atio
ns/w
pp20
06/w
pp20
06.h
tmW
orld
urb
aniz
atio
n pr
ospe
cts:
the
200
5 re
visio
n. N
ew Y
ork,
Uni
ted
Nat
ions
Dep
artm
ent
of E
cono
mic
and
Soc
ial
Affa
irs,
Popu
latio
n D
ivisi
on,
2005
(m
ediu
m v
aria
ntes
timat
es).
Avai
labl
e fr
om:
http
://w
ww
.un.
org/
esa/
popu
latio
n/pu
blic
atio
ns/W
UP2
005/
2005
wup
.htm
Dem
ogra
phic
tab
les
for
the
Wes
tern
Pac
ific
Regi
on 2
005-
2010
. M
anila
, W
HO
Reg
iona
l O
ffice
for
the
Wes
tern
Pac
ific,
200
5. A
vaila
ble
from
: ht
tp://
ww
w.w
pro.
who
.int/
publ
icat
ions
/Dem
ogra
phic
+ta
bles
.htm

Health in Asia and the Pacific62
Cha
pter
3
American Samoa 237 264 287 322 356 388
Australia 2 2 2 3 3 3
Bangladesh 785 877 968 1 064 1 157 1 251
Bhutan 12 11 12 14 15 16
Brunei Darussalam 45 51 58 65 72 79
Cambodia 54 63 71 77 84 92
China 120 126 132 137 141 145
Cook Islands 75 77 68 59 53 49
Democratic People’s Republic of Korea 167 180 190 196 199 203
Fiji 40 42 44 45 47 48
French Polynesia 49 54 59 64 68 72
Guam 244 265 283 307 328 348
Hong Kong (China) 5 191 5 647 6 062 6 422 6 751 7 047
India 262 290 318 345 371 396
Indonesia 96 104 111 119 126 132
Japan 327 332 336 338 338 335
Kiribati 99 106 116 127 137 148
Lao People’s Democratic Republic 17 20 22 24 26 28
Macao (China) 14 313 15 832 16 964 18 196 18 845 19 493
Malaysia 55 62 71 78 85 91
Maldives 724 832 916 991 1 082 1 184
Marshall Islands 261 282 288 313 350 384
Micronesia, Federated States of 137 153 153 157 160 165
Mongolia 1 2 2 2 2 2
Myanmar 59 64 68 71 74 77
Nauru 436 475 478 481 488 504
Nepal 130 147 166 184 203 223
New Caledonia 9 10 12 13 14 15
New Zealand 13 14 14 15 16 16
Niue 9 9 7 6 6 5
Northern Mariana Islands 94 124 149 173 191 207
Palau 33 37 42 44 45 46
Papua New Guinea 9 10 12 13 14 16
Philippines 204 229 254 282 310 337
Pitcairn Islands 13 12 12 10 10 10
Republic of Korea 431 452 470 481 489 493
Samoa 57 59 63 65 68 70
Singapore 4 416 5 092 5 882 6 336 6 723 7 040
Country/area 1990 1995 2000 2005 2010 2015
Table 3.2 Total population density (number of people per square km) in the Asia PacificRegion, 1990–2015

Demographic trends 63
Solomon Islands 11 13 14 16 18 20
Sri Lanka 261 276 285 291 298 304
Thailand 106 112 118 123 127 130
Timor-Leste 50 57 55 72 85 101
Tokelau 134 123 126 117 117 117
Tonga 145 150 151 153 157 160
Tuvalu 363 377 392 402 410 419
Vanuatu 12 14 16 18 20 22
Viet Nam 200 221 238 256 274 291
Wallis and Futuna 69 72 74 75 78 81
Asia Pacific Region 94 103 108 127 131 135
World 39 42 45 48 51 54
Sources: World population prospects: the 2006 revision. New York, United Nations Department of Economicand Social Affairs, Population Division, 2007. Available from: http://www.un.org/esa/population/publications/wpp2006/wpp2006.htmWorld urbanization prospects: the 2005 revision. New York, United Nations Department ofEconomic and Social Affairs, Population Division, 2005 (medium variant estimates). Available from:http://www.un.org/esa/population/publications/WUP2005/2005wup.htm
Country/area 1990 1995 2000 2005 2010 2015

Health in Asia and the Pacific64
Cha
pter
3 Australia 1.37 1.15 1.19 1.01 0.95
Bangladesh 2.22 1.98 1.89 1.67 1.56
Bhutan -1.53 1.94 2.63 1.43 1.48
Brunei Darussalam 2.76 2.45 2.29 2.05 1.81
Cambodia 3.23 2.29 1.76 1.74 1.78
China 1.10 0.91 0.67 0.58 0.54
Democratic People’s Republic of Korea 1.50 1.10 0.58 0.34 0.33
Fiji 1.19 0.86 0.65 0.62 0.46
French Polynesia 1.99 1.80 1.59 1.31 1.21
Guam 1.67 1.28 1.66 1.30 1.18
Hong Kong (China) 1.69 1.42 1.15 1.00 0.86
India 2.08 1.84 1.62 1.46 1.31
Indonesia 1.53 1.40 1.31 1.16 0.98
Japan 0.31 0.25 0.14 -0.02 -0.18
Lao People’s Democratic Republic 2.82 2.15 1.62 1.72 1.64
Macao (China) 2.02 1.38 1.40 0.70 0.68
Malaysia 2.58 2.45 1.95 1.69 1.47
Maldives 2.78 1.93 1.57 1.76 1.80
Micronesia, Federated States of 2.15 -0.02 0.55 0.46 0.58
Mongolia 1.51 0.66 0.88 0.96 1.09
Myanmar 1.44 1.24 0.89 0.85 0.76
Nepal 2.51 2.39 2.08 1.97 1.88
New Caledonia 2.42 2.15 1.71 1.54 1.35
New Zealand 1.48 0.96 1.22 0.90 0.79
Papua New Guinea 2.62 2.67 2.41 2.00 1.75
Philippines 2.27 2.11 2.08 1.90 1.67
Republic of Korea 0.97 0.77 0.46 0.33 0.18
Samoa 0.84 1.07 0.71 0.87 0.65
Singapore 2.85 2.88 1.49 1.19 0.92
Solomon Islands 2.86 2.76 2.57 2.33 2.08
Sri Lanka 1.10 0.69 0.43 0.47 0.39
Thailand 1.16 1.06 0.76 0.66 0.50
Timor-Leste 2.77 -0.76 5.31 3.50 3.36
Tonga 0.60 0.14 0.26 0.50 0.35
Vanuatu 2.84 1.94 2.54 2.38 2.18
Viet Nam 2.05 1.51 1.45 1.32 1.20
Asia Pacific Region 1.54 1.34 1.15 1.02 0.93
World 1.54 1.37 1.24 1.17 1.10
Sources: World population prospects: the 2006 revision. New York, United Nations Department of Economicand Social Affairs, Population Division, 2007. Available from: http://www.un.org/esa/population/publications/wpp2006/wpp2006.htmWorld urbanization prospects: the 2005 revision. New York, United Nations Department ofEconomic and Social Affairs, Population Division, 2005 (medium variant estimates). Available from:http://www.un.org/esa/population/publications/WUP2005/2005wup.htm
Country/area 1990–1995 1995–2000 2000–2005 2005–2010 2010–2015
Table 3.3 Average annual population growth rate (%) in the Asia Pacific Region, 1990–2015

Demographic trends 65
American Samoa 56 8 64 108 106
Australia 29 19 48 105 99
Bangladesh 57 6 63 105 105
Bhutan 53 7 60 103 111
Brunei Darussalam 44 5 49 111 108
Cambodia 63 5 69 104 95
China 31 11 41 116 107
Cooks Islands 56 8 64 108 106
Democratic People’s Republic of Korea 36 13 49 105 97
Fiji 52 7 59 107 103
French Polynesia 41 8 48 109 105
Guam 46 10 56 113 104
Hong Kong (China) 21 16 37 105 92
India 53 8 61 109 108
Indonesia 43 8 51 104 100
Japan 21 30 51 106 96
Kiribati 58 8 67 106 107
Lao People’s Democratic Republic 70 6 76 104 99
Macao (China) 21 10 31 113 92
Malaysia 49 7 56 106 103
Maldives 55 6 61 100 105
Marshall Islands 58 8 67 106 107
Micronesia, Federated States of 67 7 74 114 103
Mongolia 43 6 49 104 100
Myanmar 41 8 49 103 98
Nauru 58 8 67 106 107
Nepal 68 6 74 105 98
New Caledonia 41 10 51 100 102
New Zealand 32 18 51 105 97
Niue 56 8 64 108 106
Northern Mariana Islands 58 8 67 100 107
Palau 58 8 67 106 107
Papua New Guinea 71 4 75 107 103
Philippines 60 6 67 105 101
Pitcairn Islands* 50 106 156 100 100
Republic of Korea 26 13 39 110 100
Samoa 75 8 83 108 109
Singapore 27 12 39 108 101
Solomon Islands 72 5 77 109 107
Sri Lanka 35 9 44 104 98
Dependency ratios Sex ratioCountry/area
Child Old age Total 0–4 years Overall
Table 3.4 Dependency ratios and sex ratios by type in the Asia Pacific Region, 2005
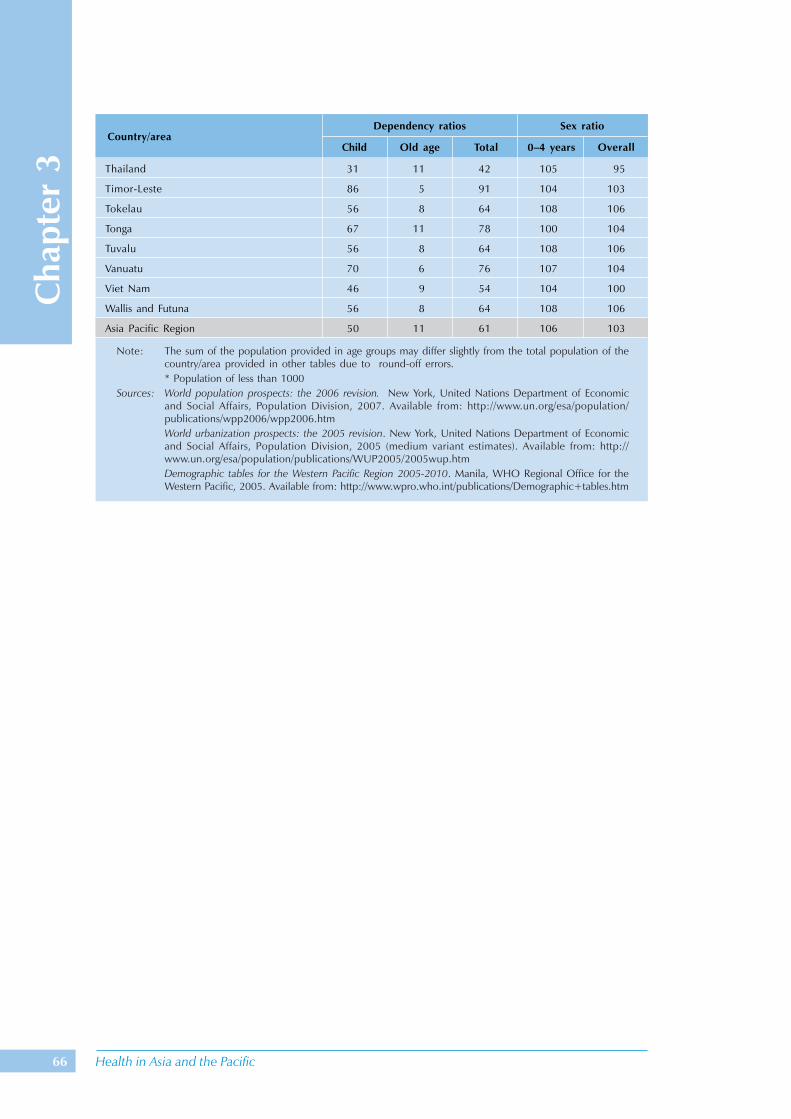
Health in Asia and the Pacific66
Cha
pter
3 Thailand 31 11 42 105 95
Timor-Leste 86 5 91 104 103
Tokelau 56 8 64 108 106
Tonga 67 11 78 100 104
Tuvalu 56 8 64 108 106
Vanuatu 70 6 76 107 104
Viet Nam 46 9 54 104 100
Wallis and Futuna 56 8 64 108 106
Asia Pacific Region 50 11 61 106 103
Dependency ratios Sex ratioCountry/area
Child Old age Total 0–4 years Overall
Note: The sum of the population provided in age groups may differ slightly from the total population of thecountry/area provided in other tables due to round-off errors.* Population of less than 1000
Sources: World population prospects: the 2006 revision. New York, United Nations Department of Economicand Social Affairs, Population Division, 2007. Available from: http://www.un.org/esa/population/publications/wpp2006/wpp2006.htmWorld urbanization prospects: the 2005 revision. New York, United Nations Department of Economicand Social Affairs, Population Division, 2005 (medium variant estimates). Available from: http://www.un.org/esa/population/publications/WUP2005/2005wup.htmDemographic tables for the Western Pacific Region 2005-2010. Manila, WHO Regional Office for theWestern Pacific, 2005. Available from: http://www.wpro.who.int/publications/Demographic+tables.htm

Demographic trends 67
American Samoa ... . . . ... ... ...
Australia 14.7 13.5 12.7 12.4 12.2
Bangladesh 33.6 29.4 27.8 24.8 23.1
Bhutan 35.7 29.3 22.4 18.5 18.9
Brunei Darussalam 28.2 25.1 23.6 21.5 19.5
Cambodia 41.0 32.0 27.5 26.4 25.9
China 18.2 16.0 13.6 13.1 13.1
Cook Islands ... . . . ... ... ...
Democratic People’s Republic of Korea 21.1 19.0 15.1 13.2 13.6
Fiji 27.5 25.5 23.1 21.1 19.7
French Polynesia 25.4 21.4 19.3 18.3 17.5
Guam 26.0 23.9 20.7 18.5 17.4
Hong Kong (China) 12.4 10.0 8.1 7.6 7.1
India 30.7 27.7 25.1 23.0 21.0
Indonesia 24.3 22.0 20.7 18.7 16.8
Japan 9.7 9.6 9.0 8.3 7.5
Kiribati ... . . . ... ... ...
Lao People’s Democratic Republic 41.4 34.5 28.4 26.8 25.1
Macao (China) 16.9 10.9 7.4 7.5 7.9
Malaysia 27.8 24.5 22.7 20.6 19.0
Maldives 36.6 26.6 22.2 23.4 23.3
Marshall Islands ... . . . ... ... ...
Micronesia, Federated States of 32.2 31.5 29.7 25.9 23.8
Mongolia 29.1 21.2 19.7 18.4 18.0
Myanmar 25.3 22.1 19.5 18.2 16.6
Nauru ... . . . ... ... ...
Nepal 38.1 34.5 30.2 28.1 26.4
New Caledonia 23.8 21.6 18.0 16.4 15.5
New Zealand 17.1 14.9 14.2 13.7 12.9
Niue ... . . . ... ... ...
Northern Mariana Islands ... . . . ... ... ...
Palau ... . . . ... ... ...
Papua New Guinea 36.7 36.9 34.0 29.6 26.7
Philippines 31.7 29.1 28.1 25.8 23.2
Pitcairn Islands ... . . . ... ... ...
Republic of Korea 15.9 13.5 10.4 9.3 8.5
Samoa 31.1 33.1 29.4 24.7 21.9
Singapore 17.9 14.0 10.1 8.2 7.9
Solomon Islands 38.7 36.3 33.6 30.5 27.6
Sri Lanka 20.4 18.2 16.3 15.0 14.6
Thailand 18.4 17.0 15.4 14.6 13.6
Country/area 1990–1995 1995–2000 2000–2005 2005–2010 2010–2015
Table 3.5 Crude birth rate per 1000 population in the Asia Pacific Region, 1990–2015

Health in Asia and the Pacific68
Cha
pter
3
Timor-Leste 43.0 45.7 41.7 42.1 39.9
Tokelau ... . . . ... ... ...
Tonga 29.9 26.6 24.3 25.6 23.8
Tuvalu ... . . . ... ... ...
Vanuatu 36.5 33.9 31.0 28.8 26.4
Viet Nam 28.2 21.4 20.2 18.8 17.5
Wallis and Futuna ... . . . ... ... ...
Asia Pacific Region 23.7 21.3 19.2 17.9 16.9
World 24.7 22.6 21.1 20.3 19.5
Note: ... Data not available.Sources: World population prospects: the 2006 revision. New York, United Nations Department of Economic
and Social Affairs, Population Division, 2007. Available from: http://www.un.org/esa/population/publications/wpp2006/wpp2006.htmWorld urbanization prospects: the 2005 revision. New York, United Nations Department of Economicand Social Affairs, Population Division, 2005 (medium variant estimates). Available from: http://www.un.org/esa/population/publications/WUP2005/2005wup.htm
Country/area 1990–1995 1995–2000 2000–2005 2005–2010 2010–2015

Demographic trends 69
Australia 1.9 1.8 1.8 1.8 1.8
Bangladesh 4.1 3.5 3.2 2.8 2.6
Bhutan 5.4 4.2 2.9 2.2 2.1
Brunei Darussalam 3.1 2.7 2.5 2.3 2.1
Cambodia 5.6 4.5 3.6 3.2 2.9
China 1.9 1.8 1.7 1.7 1.8
Democratic People’s Republic of Korea 2.4 2.1 1.9 1.9 1.9
Fiji 3.4 3.2 3.0 2.8 2.6
French Polynesia 3.1 2.6 2.4 2.3 2.2
Guam 3.1 3.0 2.7 2.5 2.4
Hong Kong (China) 1.3 1.1 0.9 1.0 1.0
India 3.9 3.5 3.1 2.8 2.5
Indonesia 2.9 2.6 2.4 2.2 2.0
Japan 1.5 1.4 1.3 1.3 1.3
Lao People’s Democratic Republic 5.9 4.7 3.6 3.2 2.9
Macao (China) 1.6 1.1 0.8 0.9 1.0
Malaysia 3.5 3.1 2.9 2.6 2.4
Maldives 5.6 3.9 2.8 2.6 2.5
Micronesia, Federated States of 4.8 4.5 4.2 3.7 3.3
Mongolia 3.4 2.4 2.1 1.9 1.9
Myanmar 3.1 2.7 2.3 2.1 1.9
Nepal 5.0 4.4 3.7 3.3 3.0
New Caledonia 2.9 2.6 2.2 2.1 2.0
New Zealand 2.1 2.0 2.0 2.0 1.9
Papua New Guinea 4.7 4.6 4.3 3.8 3.4
Philippines 4.1 3.7 3.5 3.2 2.9
Republic of Korea 1.7 1.5 1.2 1.2 1.2
Samoa 4.7 4.7 4.4 3.9 3.5
Singapore 1.8 1.6 1.4 1.3 1.3
Solomon Islands 5.5 4.9 4.4 3.9 3.5
Sri Lanka 2.5 2.2 2.0 1.9 1.9
Thailand 2.0 1.9 1.8 1.9 1.9
Timor-Leste 5.7 7.0 7.0 6.5 6.0
Tonga 4.5 4.0 3.7 3.8 3.4
Vanuatu 4.8 4.6 4.2 3.7 3.3
Viet Nam 3.3 2.5 2.3 2.1 2.0
Asia Pacific Region 3.51 3.12 2.78 2.56 2.38
Sources: World population prospects: the 2006 revision. New York, United Nations Department of Economicand Social Affairs, Population Division, 2007. Available from: http://www.un.org/esa/population/publications/wpp2006/wpp2006.htmWorld urbanization prospects: the 2005 revision. New York, United Nations Department of Economicand Social Affairs, Population Division, 2005 (medium variant estimates). Available from: http://www.un.org/esa/population/publications/WUP2005/2005wup.htm
Country/area 1990–1995 1995–2000 2000–2005 2005–2010 2010–2015
Table 3.6 Total fertility rate per woman in the Asia Pacific Region, 1990–2015

Health in Asia and the Pacific70
Cha
pter
3
Australia 7.0 7.0 6.8 7.1 7.4 4.2
Bangladesh 11.1 9.2 8.2 7.5 7.0 12.7
Bhutan 12.6 10.0 7.8 7.2 7.0 13.1
Brunei Darussalam 3.2 2.9 2.8 2.8 3.0 5.9
Cambodia 11.6 10.4 10.0 9.0 8.0 16.6
China 7.1 6.7 6.6 7.1 7.5 8.4
Cook Islands ... . . . ... ... ... 8.2
Democratic People’s Republic of Korea 6.0 7.9 9.3 9.9 10.3 11.1
Fiji 6.3 6.2 6.4 6.6 6.9 10.6
French Polynesia 5.0 4.8 4.9 5.2 5.5 . . .
Guam 4.7 4.7 5.1 5.5 5.7 . . .
Hong Kong (China) 5.6 5.1 5.3 5.9 6.5 . . .
India 9.8 9.1 8.7 8.2 7.8 12.9
Indonesia 8.2 7.2 6.6 6.3 6.3 11.0
Japan 7.0 7.6 8.0 9.0 9.8 3.6
Kiribati ... . . . ... ... ... 11.0
Lao People’s Democratic Republic 11.9 9.5 8.0 7.1 6.4 16.3
Macao (China) 4.5 4.2 4.3 4.7 5.2 . . .
Malaysia 5.0 4.7 4.5 4.5 4.6 8.3
Maldives 8.9 7.3 6.5 5.7 5.3 12.7
Marshall Islands ... . . . ... ... ... 13.3
Micronesia, Federated States of 6.4 6.3 6.3 6.1 5.8 10.6
Mongolia 8.9 7.2 6.9 6.6 6.4 12.4
Myanmar 10.3 9.8 10.2 9.7 9.0 14.3
Nauru ... . . . ... ... ... 14.5
Nepal 12.0 9.8 8.7 7.7 7.0 14.1
New Caledonia 5.5 5.5 5.2 5.5 5.9 ...
New Zealand 7.6 7.4 7.1 7.1 7.3 4.8
Niue ... . . . ... ... ... 8.6
Palau ... . . . ... ... ... 9.7
Papua New Guinea 10.6 10.2 9.9 9.6 9.2 14.1
Philippines 6.3 5.5 5.1 4.8 4.7 9.9
Republic of Korea 5.6 5.5 5.4 5.9 6.6 6.5
Samoa 6.9 6.2 5.7 5.4 5.2 10.3
Singapore 4.9 4.8 4.9 5.3 6.1 4.6
Solomon Islands 10.2 8.7 7.9 7.2 6.8 10.9
Sri Lanka 6.5 7.0 7.3 7.2 7.7 9.1
Thailand 7.4 8.1 8.6 8.5 8.9 8.6
Timor-Leste 15.4 12.6 10.2 8.9 7.8 14.9
Country/area1990– 1995– 2000– 2005– 2010–1995 2000 2005 2010 2015
Table 3.7 Crude death rate per 1000 population 1990–2015, and age-standardized deathrate 2002 in the Asia Pacific Region
Age-standardized
death rate2002

Demographic trends 71
Tonga 5.9 5.7 5.7 5.7 5.7 8.9
Tuvalu ... . . . ... ... ... 14.3
Vanuatu 7.1 6.7 5.7 5.0 4.6 10.3
Viet Nam 6.9 5.7 5.2 5.1 5.0 9.3
Asia Pacific Region 8.2 7.7 7.4 7.4 7.5 ...
World 9.3 8.9 8.8 8.6 8.5 ...
Note: ... Data not available.Sources: World population prospects: the 2006 revision. New York, United Nations Department of Economic
and Social Affairs, Population Division, 2007. Available from: http://www.un.org/esa/population/publications/wpp2006/wpp2006.htmWorld urbanization prospects: the 2005 revision. New York, United Nations Department of Economicand Social Affairs, Population Division, 2005 (medium variant estimates). Available from: http://www.un.org/esa/population/publications/WUP2005/2005wup.htm
Country/area 1990– 1995– 2000– 2005– 2010–1995 2000 2005 2010 2015
Age-standardized
death rate2002
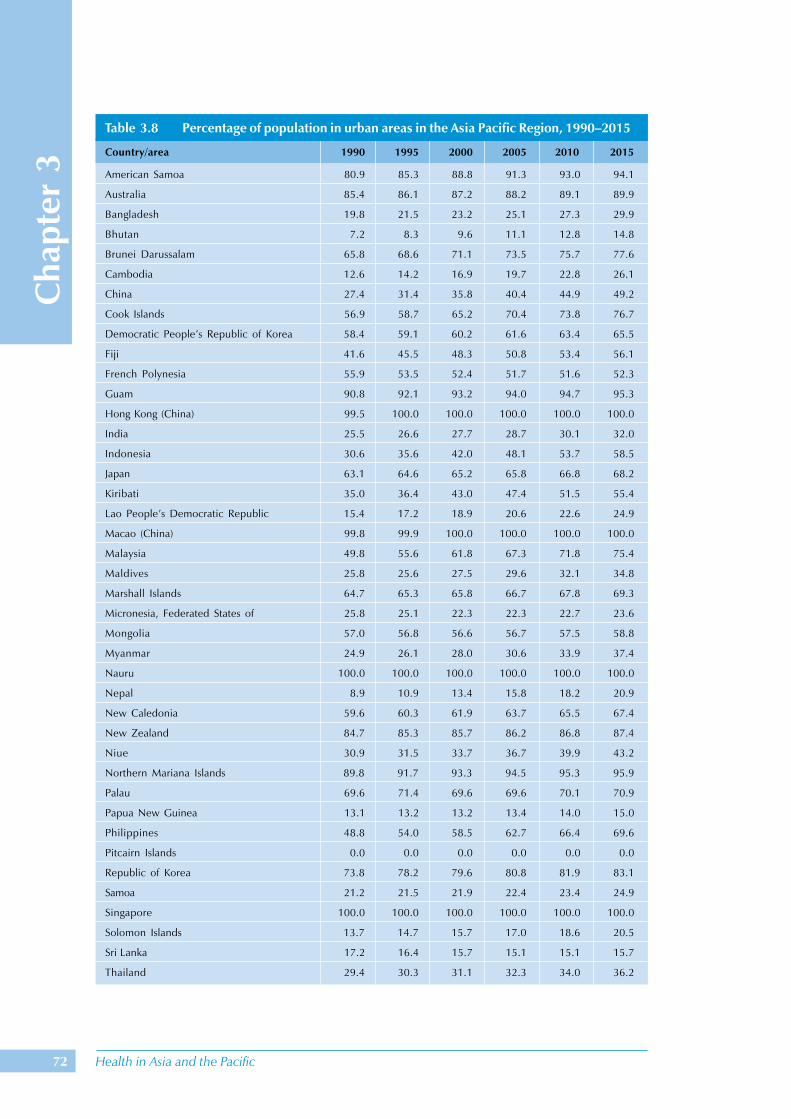
Health in Asia and the Pacific72
Cha
pter
3 American Samoa 80.9 85.3 88.8 91.3 93.0 94.1
Australia 85.4 86.1 87.2 88.2 89.1 89.9
Bangladesh 19.8 21.5 23.2 25.1 27.3 29.9
Bhutan 7.2 8.3 9.6 11.1 12.8 14.8
Brunei Darussalam 65.8 68.6 71.1 73.5 75.7 77.6
Cambodia 12.6 14.2 16.9 19.7 22.8 26.1
China 27.4 31.4 35.8 40.4 44.9 49.2
Cook Islands 56.9 58.7 65.2 70.4 73.8 76.7
Democratic People’s Republic of Korea 58.4 59.1 60.2 61.6 63.4 65.5
Fiji 41.6 45.5 48.3 50.8 53.4 56.1
French Polynesia 55.9 53.5 52.4 51.7 51.6 52.3
Guam 90.8 92.1 93.2 94.0 94.7 95.3
Hong Kong (China) 99.5 100.0 100.0 100.0 100.0 100.0
India 25.5 26.6 27.7 28.7 30.1 32.0
Indonesia 30.6 35.6 42.0 48.1 53.7 58.5
Japan 63.1 64.6 65.2 65.8 66.8 68.2
Kiribati 35.0 36.4 43.0 47.4 51.5 55.4
Lao People’s Democratic Republic 15.4 17.2 18.9 20.6 22.6 24.9
Macao (China) 99.8 99.9 100.0 100.0 100.0 100.0
Malaysia 49.8 55.6 61.8 67.3 71.8 75.4
Maldives 25.8 25.6 27.5 29.6 32.1 34.8
Marshall Islands 64.7 65.3 65.8 66.7 67.8 69.3
Micronesia, Federated States of 25.8 25.1 22.3 22.3 22.7 23.6
Mongolia 57.0 56.8 56.6 56.7 57.5 58.8
Myanmar 24.9 26.1 28.0 30.6 33.9 37.4
Nauru 100.0 100.0 100.0 100.0 100.0 100.0
Nepal 8.9 10.9 13.4 15.8 18.2 20.9
New Caledonia 59.6 60.3 61.9 63.7 65.5 67.4
New Zealand 84.7 85.3 85.7 86.2 86.8 87.4
Niue 30.9 31.5 33.7 36.7 39.9 43.2
Northern Mariana Islands 89.8 91.7 93.3 94.5 95.3 95.9
Palau 69.6 71.4 69.6 69.6 70.1 70.9
Papua New Guinea 13.1 13.2 13.2 13.4 14.0 15.0
Philippines 48.8 54.0 58.5 62.7 66.4 69.6
Pitcairn Islands 0.0 0.0 0.0 0.0 0.0 0.0
Republic of Korea 73.8 78.2 79.6 80.8 81.9 83.1
Samoa 21.2 21.5 21.9 22.4 23.4 24.9
Singapore 100.0 100.0 100.0 100.0 100.0 100.0
Solomon Islands 13.7 14.7 15.7 17.0 18.6 20.5
Sri Lanka 17.2 16.4 15.7 15.1 15.1 15.7
Thailand 29.4 30.3 31.1 32.3 34.0 36.2
Country/area 1990 1995 2000 2005 2010 2015
Table 3.8 Percentage of population in urban areas in the Asia Pacific Region, 1990–2015

Demographic trends 73
Timor-Leste 20.8 22.7 24.5 26.5 28.7 31.2
Tokelau 0.0 0.0 0.0 0.0 0.0 0.0
Tonga 22.7 22.9 23.2 24.0 25.3 27.4
Tuvalu 40.7 44.0 46.0 48.1 50.4 52.9
Vanuatu 18.7 20.2 21.7 23.5 25.6 28.1
Viet Nam 20.3 22.2 24.3 26.4 28.8 31.6
Wallis and Futuna 0.0 0.0 0.0 0.0 0.0 0.0
Asia Pacific Region 30.1 32.7 35.4 38.2 41.0 43.9
World 43.0 44.8 46.7 48.7 50.8 52.9
Country/area 1990 1995 2000 2005 2010 2015
Sources: World population prospects: the 2006 revision. New York, United Nations Department of Economicand Social Affairs, Population Division, 2007. Available from: http://www.un.org/esa/population/publications/wpp2006/wpp2006.htmWorld urbanization prospects: the 2005 revision. New York, United Nations Department of Economicand Social Affairs, Population Division, 2005 (medium variant estimates). Available from: http://www.un.org/esa/population/publications/WUP2005/2005wup.htm