birla sun life frontline equity fund … · birla sun life frontline equity fund an open ended...
TRANSCRIPT

Birla Sun Life Frontline Equity FundAn open ended Growth Scheme
Mutual Fund investments are subject to market risks. Please read the Statement of
Additional Information / Scheme Information Document carefully before investing.
Call 1-800-270-7000/1-800-22-7000 (toll-free) | Visit www.birlasunlife.com sms AIM to 56161
J u n e 2 0 1 0
Birla Sun Life
Frontline Equity FundAn Open ended Growth Scheme
Birla Sun Life
Frontline Equity FundAn Open ended Growth Scheme
How do you always keep your investments at the top?
For more details please refer page No 25
Index
2
CEO LETTER . . . . . . . . . . . . . . . . . . . . . . . . . . . . . . . . . . . . . . . . . . . . . . 3
OUTLOOK. . . . . . . . . . . . . . . . . . . . . . . . . . . . . . . . . . . . . . . . . . . . . . . . 4
SAVINGS SOLUTIONS
Birla Sun Life Cash Plus. . . . . . . . . . . . . . . . . . . . . . . . . . . . . . . . . . . . . . . . . . . . . . . . . . . . . . . . . . . . . . . . . . . . . . 5
Birla Sun Life Cash Manager . . . . . . . . . . . . . . . . . . . . . . . . . . . . . . . . . . . . . . . . . . . . . . . . . . . . . . . . . . . . . . . . . . 6
Birla Sun Life Savings Fund . . . . . . . . . . . . . . . . . . . . . . . . . . . . . . . . . . . . . . . . . . . . . . . . . . . . . . . . . . . . . . . . . . . 7
Birla Sun Life Short Term Fund . . . . . . . . . . . . . . . . . . . . . . . . . . . . . . . . . . . . . . . . . . . . . . . . . . . . . . . . . . . . . . . . 8
Birla Sun Life Dynamic Bond Fund . . . . . . . . . . . . . . . . . . . . . . . . . . . . . . . . . . . . . . . . . . . . . . . . . . . . . . . . . . . . . 9
Birla Sun Life Medium Term Plan . . . . . . . . . . . . . . . . . . . . . . . . . . . . . . . . . . . . . . . . . . . . . . . . . . . . . . . . . . . . . . 10
Birla Sun Life Income Plus . . . . . . . . . . . . . . . . . . . . . . . . . . . . . . . . . . . . . . . . . . . . . . . . . . . . . . . . . . . . . . . . . . . 11
Birla Sun Life Income Fund . . . . . . . . . . . . . . . . . . . . . . . . . . . . . . . . . . . . . . . . . . . . . . . . . . . . . . . . . . . . . . . . . . 12
Birla Sun Life Floating Rate - Short Term Plan. . . . . . . . . . . . . . . . . . . . . . . . . . . . . . . . . . . . . . . . . . . . . . . . . . . . 13
Birla Sun Life Gilt Plus . . . . . . . . . . . . . . . . . . . . . . . . . . . . . . . . . . . . . . . . . . . . . . . . . . . . . . . . . . . . . . . . . . . . . . 14
Birla Sun Life Government Securities Fund . . . . . . . . . . . . . . . . . . . . . . . . . . . . . . . . . . . . . . . . . . . . . . . . . . . . . . 15
REGULAR INCOME SOLUTIONS
Birla Sun Life Monthly Income . . . . . . . . . . . . . . . . . . . . . . . . . . . . . . . . . . . . . . . . . . . . . . . . . . . . . . . . . . . . . . . . 16
Birla Sun Life MIP. . . . . . . . . . . . . . . . . . . . . . . . . . . . . . . . . . . . . . . . . . . . . . . . . . . . . . . . . . . . . . . . . . . . . . . . . . 17
Birla Sun Life MIP II - Wealth 25 Plan . . . . . . . . . . . . . . . . . . . . . . . . . . . . . . . . . . . . . . . . . . . . . . . . . . . . . . . . . . 18
Birla Sun Life MIP II - Savings 5 Plan . . . . . . . . . . . . . . . . . . . . . . . . . . . . . . . . . . . . . . . . . . . . . . . . . . . . . . . . . . 19
TAX SAVINGS SOLUTIONS
Birla Sun Life Tax Relief '96 . . . . . . . . . . . . . . . . . . . . . . . . . . . . . . . . . . . . . . . . . . . . . . . . . . . . . . . . . . . . . . . . . . 20
Birla Sun Life Tax Plan . . . . . . . . . . . . . . . . . . . . . . . . . . . . . . . . . . . . . . . . . . . . . . . . . . . . . . . . . . . . . . . . . . . . . . 21
WEALTH CREATION SOLUTIONS
Birla Sun Life Equity Fund . . . . . . . . . . . . . . . . . . . . . . . . . . . . . . . . . . . . . . . . . . . . . . . . . . . . . . . . . . . . . . . . . . . 22
Birla Sun Life Advantage Fund. . . . . . . . . . . . . . . . . . . . . . . . . . . . . . . . . . . . . . . . . . . . . . . . . . . . . . . . . . . . . . . . 23
Birla Sun Life Midcap Fund . . . . . . . . . . . . . . . . . . . . . . . . . . . . . . . . . . . . . . . . . . . . . . . . . . . . . . . . . . . . . . . . . . 24
Birla Sun Life Frontline Equity Fund. . . . . . . . . . . . . . . . . . . . . . . . . . . . . . . . . . . . . . . . . . . . . . . . . . . . . . . . . . . . 25
Birla Sun Life Infrastructure Fund. . . . . . . . . . . . . . . . . . . . . . . . . . . . . . . . . . . . . . . . . . . . . . . . . . . . . . . . . . . . . . 26
Birla Sun Life Basic Industries Fund . . . . . . . . . . . . . . . . . . . . . . . . . . . . . . . . . . . . . . . . . . . . . . . . . . . . . . . . . . . 27
Birla Sun Life India Gennext Fund . . . . . . . . . . . . . . . . . . . . . . . . . . . . . . . . . . . . . . . . . . . . . . . . . . . . . . . . . . . . . 28
Birla Sun Life New Millennium Fund . . . . . . . . . . . . . . . . . . . . . . . . . . . . . . . . . . . . . . . . . . . . . . . . . . . . . . . . . . . 29
Birla Sun Life Top 100 Fund . . . . . . . . . . . . . . . . . . . . . . . . . . . . . . . . . . . . . . . . . . . . . . . . . . . . . . . . . . . . . . . . . . 30
Birla Sun Life Buy India Fund. . . . . . . . . . . . . . . . . . . . . . . . . . . . . . . . . . . . . . . . . . . . . . . . . . . . . . . . . . . . . . . . . 31
Birla Sun Life MNC Fund . . . . . . . . . . . . . . . . . . . . . . . . . . . . . . . . . . . . . . . . . . . . . . . . . . . . . . . . . . . . . . . . . . . . 32
Birla Sun Life Index Fund . . . . . . . . . . . . . . . . . . . . . . . . . . . . . . . . . . . . . . . . . . . . . . . . . . . . . . . . . . . . . . . . . . . . 33
Birla Sun Life India Opportunities Fund . . . . . . . . . . . . . . . . . . . . . . . . . . . . . . . . . . . . . . . . . . . . . . . . . . . . . . . . . 34
Birla Sun Life Dividend Yield Plus . . . . . . . . . . . . . . . . . . . . . . . . . . . . . . . . . . . . . . . . . . . . . . . . . . . . . . . . . . . . . 35
Birla Sun Life 95 Fund . . . . . . . . . . . . . . . . . . . . . . . . . . . . . . . . . . . . . . . . . . . . . . . . . . . . . . . . . . . . . . . . . . . . . . 36
Birla Sun Life Freedom Fund . . . . . . . . . . . . . . . . . . . . . . . . . . . . . . . . . . . . . . . . . . . . . . . . . . . . . . . . . . . . . . . . . 37
Birla Sun Life Asset Allocation Fund. . . . . . . . . . . . . . . . . . . . . . . . . . . . . . . . . . . . . . . . . . . . . . . . . . . . . . . . . . . . 38
Birla Sun Life Special Situations Fund . . . . . . . . . . . . . . . . . . . . . . . . . . . . . . . . . . . . . . . . . . . . . . . . . . . . . . . . . . 39
Birla Sun Life Commodity Equities Fund . . . . . . . . . . . . . . . . . . . . . . . . . . . . . . . . . . . . . . . . . . . . . . . . . . . . . . . . 40
Birla Sun Life International Equity Fund - Plan A . . . . . . . . . . . . . . . . . . . . . . . . . . . . . . . . . . . . . . . . . . . . . . . . . . 41
Birla Sun Life International Equity Fund - Plan B . . . . . . . . . . . . . . . . . . . . . . . . . . . . . . . . . . . . . . . . . . . . . . . . . . 42
Birla Sun Life Pure Value Fund . . . . . . . . . . . . . . . . . . . . . . . . . . . . . . . . . . . . . . . . . . . . . . . . . . . . . . . . . . . . . . . 43
Birla Sun Life Long Term Advantage Fund. . . . . . . . . . . . . . . . . . . . . . . . . . . . . . . . . . . . . . . . . . . . . . . . . . . . . . . 44
METHODOLOGY OF RANKING. . . . . . . . . . . . . . . . . . . . . . . . . . . . . . . . . . . . . . . . . . . . . . . . . . . . . . 50
DIVIDEND HISTORY . . . . . . . . . . . . . . . . . . . . . . . . . . . . . . . . . . . . . . . . . . . . . . . . . . . . . . . . . . . . 45-47
ASSET ALLOCATION GUIDE . . . . . . . . . . . . . . . . . . . . . . . . . . . . . . . . . . . . . . . . . . . . . . . . . . . . . . . 48
OUR COVERAGE . . . . . . . . . . . . . . . . . . . . . . . . . . . . . . . . . . . . . . . . . . . . . . . . . . . . . . . . . . . . . . . . . 49
J u n e 2 0 1 0

Warm Regards,
A. BalasubramanianChief Executive Officer
J u n e 2 0 1 0
Dear Friend,
The month of May 2010 triggered a much-awaited correction in stock markets across the globe. The focus of thesovereign crisis in Greece started spreading across other nations in the Euro zone. The unfolding events reducedrisk appetite and FIIs net sold Indian equities worth Rs. 9,426 crore.
However, May 2010 also produced positives for us – a lot of them through unexpected events.
The 3G spectrum auctions turned out to be bonanza for the government. Together with the Broadband WirelessAccess (BWA) auction bids, the total revenue could be close to 1 trillion rupees and reduce fiscal deficit to 4.5% ofGDP from the estimated 5.5%. This has eased pressure on 10-Year bond yield, setting the road for a bullishflattening of the yield curve.
Though the European crisis created uncertainty, it also seems to have created opportunity for countries like India.Being driven by domestic demand, India can continue to attract more capital flows. India's GDP grew by 8.6% inQ4 2010, lifting the annual FY2009-10 GDP to 7.4%, higher than 7.2% as projected in the Union Budget.
Meanwhile, earnings have continued to be strong and the government showed further intent towards reforms byhiking natural gas prices under the APM regime. Global risk aversion pushed crude oil prices lower, raising hopeof auto fuel price decontrol as well.
India is likely to witness a short-term impact of the crisis, but considering Indian economy's resilience to the globalrecession last year, its long-term impact might not be severe this time as well.
We continue to hold our conviction for channelising savings into capital markets through mutual funds. A rightcombination of Fixed Income & Equity schemes would provide the opportunity to create wealth for a regularsavings through debt products.
We are also happy to share with you that Birla Sun Life Mutual Fund has crossed the Rs.73000 crore mark ofaverage AUM. We assure our investors that our endeavor is to deliver consistent investment performance &service at all times.
AAUM Rs.73,855 Crores as on 31 May 2010Source : www.amfiindia.com

OutlookJ u n e 2 0 1 0
Our Investment Team (In alphabetical order)
Achala Kanitkar Research Analyst : Equity
Ajay Argal Co-Head : Equity
Ajay Garg Fund Manager : Equity
Ankit Sancheti Fund Manager/ Research Analyst : Equity
Atul Penkar Fund Manager/ Research Analyst : Equity
Chanchal Khandelwal Research Analyst : Equity
Hemang Dagli Sr. Equity Dealer / Fund Manager
Kaustubh Gupta Fund Manager / Dealer : Fixed Income
Lokesh Mallya Fund Manager /Research Analyst :Fixed Income
Mahesh Patil Co-Head : Equity
Maneesh Dangi Head : Fixed Income
Mayank Hyanki
Merlyn Joseph Research Analyst : Equity
Naysar Shah Sr Research Analyst : Equity
Nishit Dholakia Fund Manager / Research Analyst : Equity
Paresh Khandelwal Research Analyst : Equity
Research Analyst : Equity
Prasad Dhonde Fund Manager / Dealer : Fixed Income
Sanjay Chawla Fund Manager : Equity
Satyabrata Mohanty Head : Mixed Assets
Shaktie Prakash Fund Manager / Dealer : Fixed Income
Sujit Patki Dealer : Equity
Sunaina Da cunha Fund Manager / Research Analyst : Fixed Income
Varda Pandey
Vineet Maloo Fund Manager/ Research Analyst : Equity
Rohit Murarka Research Analyst : Fixed Income
Research Analyst : Fixed Income
04
Surprising reliefThe debt market received unexpected relief as a few unforeseen factors becamemajor influences to turn around the weakening trend of bonds. However,tightening liquidity has since played spoilsport and the yield curve ended off thelows reached during the month of May 2010. Call rate rose to 5.30-5.40%. Ten-year benchmark yield ended at 7.55% from 7.76%. It slumped to 7.38%, a 6-month low, during the height of the rally.
Unexpected boostThe government has received Rs.67,719 crore from the 3G spectrum sale. Thisis almost double the projected Rs.35,000 crore with the excess revenueamounting to around 7% of the full borrowing calendar. Further, the BroadbandWireless Access (BWA) auction bids have also exceeded expectations with Rs.35,000 crore as per the latest reports with the auction still on. The total amountwill be more than Rs. 100,000 crore, which means that non-tax revenue is higherand this could bring down the fiscal deficit to 4.5% of GDP from the estimated5.5%. The pressure on government borrowing can ease to that extent.
Can Europe slow down RBIHowever, currently major concerns are coming from Europe, where the EU and
Debt Outlook
the IMF has raised its bailout support to nearly $1 trillion for Greece. However, the spotlight on Greece has since expanded to include other nations asdeteriorating fiscal deficit news has fallen out of the closet. Countries likePortugal, Italy and Spain have established austerity measures but credit ratingagencies have not reacted positively. Fitch has cut Spain's sovereign creditrating. Hungary came to the scene after a leading political official reportedly saidthat Hungary faces a Greek-like sovereign-debt problem. Amid thesedevelopments, India will not be immune to the effects of European crises.
What is next?The domestic inflation rate appears to have peaked but by no means does thismean that inflation is in a comfort zone and other macro economic data remainsrobust. The proposal of raising prices of motor fuels will put further pressure oninflation. Monsoon has struck the Kerala coast but its spread has to be watched.Meanwhile, liquidity faces another test from advance tax payments in mid-June.We expect money market rates to tighten further in view of large outflows onaccount of 3G, BWA and tax payments. Ten-year yield is expected to be in thebroad range of 7.40%-7.80%.
Source : Reuters
Equity Outlook
Global investor sentiment has suffered setbacks in the month of May 2010 whichis reflected in the risk assets prices declining. Indian equity markets have,however, been surprisingly resilient on the surface. Stepping a level deeper intosector level movements we find similar sentiments are manifest here as well.
Source : ReutersComputation : Internal
FIIs net sold equities worth Rs. 9,426 crore during the month. It was the sharpestreversal in the flows since October 2008.
Euro zone – the epicentreThe global stock markets remained hostage to the uncertainty over the exactsize and expanse of the sovereign crisis among Euro zone nations. While EUand IMF promised to extend a helping hand with a financial package, sovereigncredit rating downgrades and news of a bank needing bailout (Spain) andbanning of short selling in some financial instruments (Germany) maintained afear psychosis across the globe. Euro zone members came up with austeritymeasures but there was no lasting positive impact on sentiment, as suchmeasures would, on the other hand, weaken economic growth drivers.
Policymakers would act to contain the current logjam and prevent situation fromfurther worsening. It is unlikely that they will let the global financial system come
dangerously close to instability since they have seen the impact of late 2008events in US banking industry with the collapse of Lehman Brothers. Theprobability of policymakers not any taking decisive steps is very low given theconsequences of inaction.
Fundamentals intact...India's domestic fundamentals remain still strong. This fact was furtherreinforced by the release of fourth quarter GDP data. The Central StatisticalOrganization (CSO) announced that GDP growth in the quarter ended March2010 (QE Mar 2010) was at 8.6%. This compares with 6.5% (revised upwards from 6% earlier) registered in QE December 2009 and 8.6% (revised upwardsfrom 7.9% earlier) registered in QE September 2009.The agriculture output accelerated 0.7% in QE Mar 2010 after declining1.8%YoY in the previous quarter due to better winter crop (rabi) production. Thegrowth in the mining and quarrying also accelerated to 14% in QE Mar 2010 (vs.9.6% in the earlier quarter).
The industry segment growth accelerated to 13.2% in QE Mar 2010 compared to11.3% in the previous quarter. Within industry, the manufacturing segmentgrowth picked up further to 16.3% (vs. 13.8% earlier). Growth in the electricity, gas & water supply and construction segments accelerated to 7.1% and 8.7%,respectively, (vs. 4.7% and 8.1% in QE Dec 2009).Growth in the services sector accelerated to 8.4% in QE Mar 2010, comparedwith 7.2% in the previous quarter. Within services, the growth in the trade, hotels,transport & communication segment accelerated to 12.4% (vs. 10.2% earlier).The financing, insurance, real estate & business services growth remainedstable at 7.9% in QE Mar 2010 compared to the previous quarter. The growth inthe community, social & personal services segment remained lackluster at 1.6%(vs. 0.8% earlier) due to lower government spending in this quarter.
Additionally, the 3G spectrum receipts and forthcoming broadband wirelessaccess revenue, PSU stake sales will reduce pressure on the fiscal deficit. Fromthe policy point of view, there is a portion of the market, which believes that it isunlikely that the RBI will move forward with an aggressive tightening, until theEuropean issue calms down. A key variable is the monsoon and its progressover the coming days and weeks will be watched.
Equity Markets Sector IndicesMSCI Emerging Markets Index -9.20% BSE METAL INDEX -14.30%S&P 500 INDEX (US) -8.20% B SE Realty Index -11.30%S&P EUROPE 350 INDEX -5.70% BSE POWER INDEX -4.40%
BSE IT INDEX -3.40%Domestic Market Indices BSE CAPITAL GOODS INDEX -2.60%BSE SENSEX 30 INDEX -3.50% BSE AUTO INDEX -1.30%NSE S&P CNX NIFTY INDEX -3.60% BSE OIL & GAS INDEX 2.60%BSE 200 INDEX -3.50% BSE HEALTHCARE INDEX 2.70%BSE SMALL-CAP INDEX -7.20% BSE FMCG INDEX 3.60%BSE MID-CAP INDEX -4.90%
CurrenciesCommodities AUSTRALIAN DOLLAR SPOT -8.50%REUTERS/JEFFERIES CRB Index-8.20% Asia Dollar Index -2.10%
Fund Details
Investment Objective
As on May 31, 2010
Birla Sun Life Cash Plus
Investment Style Box
Low Interest RateSensitivity
High
Mid
Low
Credit Quality
High Med
Fund Manager :Ms. Sunaina Da Cunha
Managing Fund Since : June 18, 2009Total Experience : 11 years & 6 yearsDate of inception : June 16, 1997Nature of the scheme : An Open-ended Liquid Scheme
Default option : Appln of less than Rs. 1 cr - Retail Plan - Dividend ReinvestmentAppln of equal to or greater than Rs. 1 cr but less than Rs. 5 cr - Institutional Plan - Daily Dividend ReinvestmentAppln of equal to or greater than Rs. 5 cr - Institutional Premium Plan - Daily Dividend Reinvestment
Retail PlanFresh Purchase : Rs. 10000/-Additional Purchase : Rs. 1000/-Institutional PlanFresh Purchase : Rs. 1 CroreAdditional Purchase : Rs. 1 LacInstitutional Premium PlanFresh Purchase : Rs. 5 CroreAdditional Purchase : Rs. 1 LacRedemption Cheques : Within 10 working daysissuedSystematic Investment : Not Available Plan (SIP)Systematic Withdrawal : AvailablePlan (SWP)Systematic Transfer : AvailablePlan (STP)
Retail PlanGrowth : 24.6402Daily Dividend : 16.3694(Reinvestment)Institutional PlanGrowth : 25.0400Daily Dividend : 10.8023(Reinvestment)Fortnightly Dividend : 10.8240(Payout & Reinvestment)Weekly Dividend : 10.8098(Payout & Reinvestment)Institutional Premium PlanGrowth : 14.8402Daily Dividend : 10.0195(Payout & Reinvestment)Fortnightly Dividend : 10.0000(Payout & Reinvestment)Weekly Dividend : 10.0260(Payout & Reinvestment)Monthly Dividend : 10.0000(Payout & Reinvestment)
Benchmark : CRISIL Liquid Fund IndexAverage AUM : Rs. 4,941.93 Crores
Entry Load : NilExit Load : Nil
Average Maturity : 0.07 YearsYield to Maturity : 5.00%Mark to Market : -Standard DeviationRetail Plan : 0.15%Institutional Plan : 0.15%Institutional Premium Plan : 0.14%
Mr. Prasad Dhonde &
Key Features
Plans / Options & NAV
Load Structure
OtherParameter
(As on May 31, 2010)
Note:Standard Deviation is calculated on annualised basis using 1 year history of monthlyreturns, source: MFI Explorer
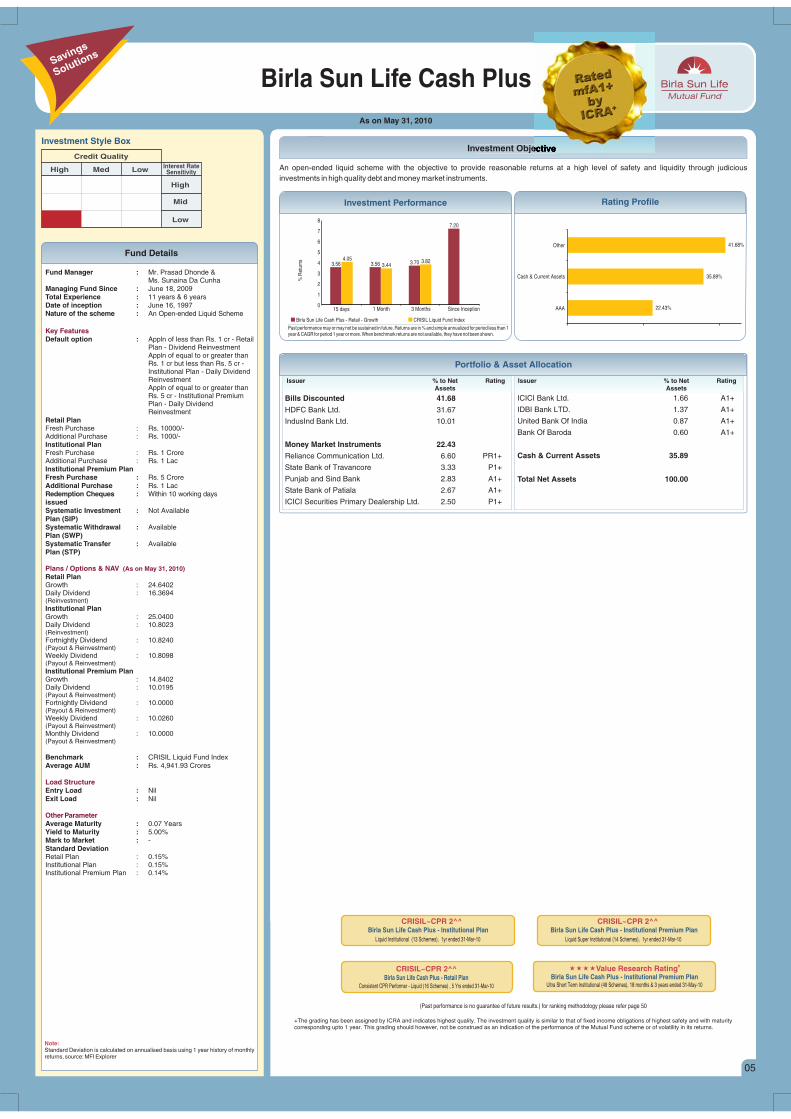
An open-ended liquid scheme with the objective to provide reasonable returns at a high level of safety and liquidity through judiciousinvestments in high quality debt and money market instruments.
Portfolio & Asset Allocation
Issuer % to Net RatingAssets
Issuer % to Net RatingAssets
Bills Discounted 41.68
HDFC Bank Ltd. 31.67
IndusInd Bank Ltd. 10.01
Money Market Instruments 22.43
Reliance Communication Ltd. 6.60 PR1+
State Bank of Travancore 3.33 P1+
Punjab and Sind Bank 2.83 A1+
State Bank of Patiala 2.67 A1+
ICICI Securities Primary Dealership Ltd. 2.50 P1+
ICICI Bank Ltd. 1.66 A1+
IDBI Bank LTD. 1.37 A1+
United Bank Of India 0.87 A1+
Bank Of Baroda 0.60 A1+
Cash & Current Assets 35.89
Total Net Assets 100.00
(Past performance is no guarantee of future results.) for ranking methodology please refer page 50
CRISIL~CPR 2^^Birla Sun Life Cash Plus - Retail Plan
Consistent CPR Performer - Liquid (16 Schemes) , 5 Yrs ended 31-Mar-10
+The grading has been assigned by ICRA and indicates highest quality. The investment quality is similar to that of fixed income obligations of highest safety and with maturity corresponding upto 1 year. This grading should however, not be construed as an indication of the performance of the Mutual Fund scheme or of volatility in its returns.
Rating ProfileInvestment Performance
Past performance may or may not be sustained in future. Returns are in % and simple annualized for period less than 1year & CAGR for period 1 year or more. When benchmark returns are not available, they have not been shown.
% R
etur
ns
Birla Sun Life Cash Plus - Retail - Growth CRISIL Liquid Fund Index
���#
�Value Research RatingBirla Sun Life Cash Plus - Institutional Premium Plan
Ultra Short Term Institutional (49 Schemes), 18 months & 3 years ended 31-May-10
Savings
Solutions
Birla Sun Life Cash Plus - Institutional Premium PlanLiquid Super Institutional ended 31-Mar-10 (14 Schemes), 1yr
CRISIL~CPR 2^^Birla Sun Life Cash Plus - Institutional Plan
Liquid Institutional ended 31-Mar-10 (13 Schemes), 1yr
CRISIL~CPR 2^^
22.43%
35.89%
41.68%
AAA
Cash & Current Assets
Other
05
3.56 3.56 3.70
7.20
4.053.44
3.82
0
1
2
3
4
5
6
7
8
15 days 1 Month 3 Months Since Inception
Fund Details
Investment Objective
As on May 31, 2010
Birla Sun Life Cash Manager
Investment Style Box
Low Interest RateSensitivity
High
Mid
Low
Credit Quality
High Med
Fund Manager :Ms. Sunaina Da Cunha
Managing Fund Since : June 18, 2009Total Experience : 11 years & 6 yearsDate of inception : May 14, 1998Nature of the scheme : An Open-ended Liquid Scheme
Default option : Appln of less than Rs. 1 cr - Weekly Dividend Reinvestment.Appln of equal to or greater than Rs. 1 cr - Institutional Plan - Daily Dividend Reinvestment
Retail PlanFresh Purchase : Rs. 10000/-Additional Purchase : Rs. 1000/-Institutional PlanFresh Purchase : Rs. 1 CroreAdditional Purchase : Rs. 1 LacRedemption Cheques : Within 10 working days issuedSystematic Investment : Not Available Plan (SIP)Systematic Withdrawal : AvailablePlan (SWP)Systematic Transfer : AvailablePlan (STP)
Retail PlanGrowth : 22.6143Weekly Dividend : 10.0088(Reinvestment)
Institutional PlanGrowth : 15.5171Daily Dividend : 10.0030(Reinvestment)
Weekly Dividend : 10.0095(Reinvestment)
Benchmark : CRISIL Liquid Fund IndexAverage AUM : Rs. 280.30 Crores
Entry Load : NilExit Load : Nil
Average Maturity : 0.03 YearsYield to Maturity : 5.00%Mark to Market : -Standard DeviationRetail Plan : 0.15%Institutional Plan : 0.15%
Mr. Prasad Dhonde &
Key Features
Plans / Options & NAV
Load Structure
Other Parameter
(As on May 31, 2010)
Note:Standard Deviation is calculated on annualised basis using 1 year history of monthly returns, source: MFI Explorer
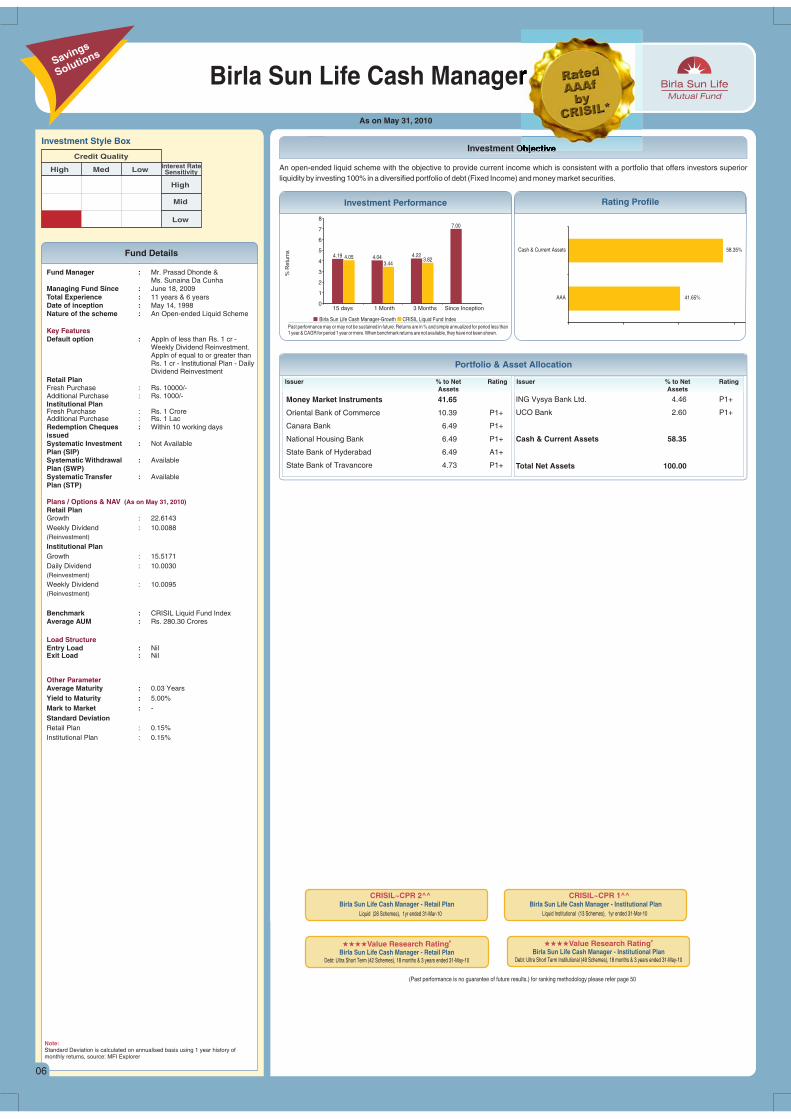
An open-ended liquid scheme with the objective to provide current income which is consistent with a portfolio that offers investors superiorliquidity by investing 100% in a diversified portfolio of debt (Fixed Income) and money market securities.
Rating Profile
Past performance may or may not be sustained in future. Returns are in % and simple annualized for period less than1 year & CAGR for period 1 year or more. When benchmark returns are not available, they have not been shown.
Birla Sun Life Cash Manager-Growth CRISIL Liquid Fund Index
Investment Performance
% R
etu
rns
Portfolio & Asset Allocation
Issuer % to Net RatingAssets
Issuer % to Net RatingAssets
Money Market Instruments 41.65
Oriental Bank of Commerce 10.39 P1+
Canara Bank 6.49 P1+
National Housing Bank 6.49 P1+
State Bank of Hyderabad 6.49 A1+
State Bank of Travancore 4.73 P1+
ING Vysya Bank Ltd. 4.46 P1+
UCO Bank 2.60 P1+
Cash & Current Assets 58.35
Total Net Assets 100.00
#���Value Research Rating�
Birla Sun Life Cash Manager - Retail PlanDebt: Ultra Short Term (42 Schemes), 18 months & 3 years ended 31-May-10
(Past performance is no guarantee of future results.) for ranking methodology please refer page 50
#���Value Research Rating�
Birla Sun Life Cash Manager - Institutional PlanDebt: Ultra Short Term Institutional (49 Schemes), 18 months & 3 years ended 31-May-10
Savings
Solutions
Birla Sun Life Cash Manager - Retail PlanLiquid ended 31-Mar-10 (26 Schemes), 1yr
CRISIL~CPR 2^^Birla Sun Life Cash Manager - Institutional Plan
Liquid Institutional ended 31-Mar-10 (13 Schemes), 1yr
CRISIL~CPR 1^^
06
41.65%
58.35%
AAA
Cash & Current Assets4.19 4.04 4.22
7.00
4.053.44
3.82
0
1
2
3
4
5
6
7
8
15 days 1 Month 3 Months Since Inception

Fund Details
Investment Obje
Birla Sun Life Savings Fund
As on May 31, 2010
Investment Style Box
Low Interest RateSensitivity
High
Mid
Low
Credit Quality
High Med
Fund Manager :Managing Fund Since : June 18, 2009Total Experience : 10 yearsDate of inceptionRetail Plan : November 27, 2001Institutional Plan : April 16, 2003Nature of the scheme : An Open-ended Short Term
Income Scheme
Default option : Appln of less than Rs. 1 cr - Retail Plan - Weekly Dividend
ReinvestmentAppln of equal to or greater than Rs. 1 cr - Institutional Plan - Daily Dividend Reinvestment
Retail PlanFresh Purchase : Rs. 10000/-Additional Purchase : Rs. 1000/-Institutional PlanFresh Purchase : Rs. 1 CroreAdditional Purchase : Rs. 1 LacRedemption Cheques : Within 10 working days issuedSystematic Investment : AvailablePlan (SIP)Systematic Withdrawal : AvailablePlan (SWP)Systematic Transfer : AvailablePlan (STP)
Retail PlanGrowth : 17.2421Daily Dividend : 10.0068(Reinvestment)Weekly Dividend : 10.0047(Payout & Reinvestment)Fortnightly Dividend : 11.2638(Payout & Reinvestment)Monthly Dividend : 10.2236(Payout, Reinvestment & Sweep Option)Institutional PlanGrowth : 17.6278Daily Dividend : 10.0068(Reinvestment)Weekly Dividend : 10.0052(Payout & Reinvestment)Fortnightly Dividend : 10.8341(Payout & Reinvestment)Monthly Dividend : 10.2457(Payout, Reinvestment & Sweep Option)
Benchmark : CRISIL Short-Term Bond Fund Index
Average AUM : Rs. 26,377.68 Crores
Entry Load : NilExit Load : Nil
Average Maturity : 0.31 YearsYield to Maturity : 5.40%Mark to Market : 2%Standard DeviationRetail Plan : 0.13%Institutional Plan : 0.12%
Mr. Maneesh Dangi
Key Features
Plans / Options & NAV
Load Structure (Incl. for SIP)
Other Parameter
(As on May 31, 2010)
Note:
Standard Deviation is calculated on annualised basis using 1 year history of monthlyreturns, source: MFI Explorer
Birla Sun Life Savings Fund - Institutional Plan Ultra Short Term Debt Scheme - Institutional (28 Schemes), 1yr ended 31-Mar-10
CRISIL~CPR 2^^
(Past performance is no guarantee of future results.) for ranking methodology please refer page 50
Past performance may or may not be sustained in future. Returns are in % and absolute returns for period less than1year&CAGRforperiod1yearormore.Whenbenchmark returns arenotavailable, they havenotbeenshown.
% R
etur
ns
Birla Sun Life Savings Fund - Retail Growth CRISIL Short-Term Bond Fund Index
Investment Performance Rating Profile
The primary objective of the schemes is to generate regular income through investments in debt and money market instruments. Income maybegenerated through the receipt of coupon payments or the purchase and sale of securities in the underlying portfolio. The schemes willundernormal market conditions, invest its net assets in fixed income securities, money market instruments, cash and cash equivalents.
Portfolio & Asset Allocation
Issuer % to Net RatingAssets
Issuer % to Net RatingAssets
Money Market Instruments 68.31
Central Bank of India 8.01 PR1+
IDBI Bank Ltd. 7.85 A1+
Punjab National Bank 6.00 PR1+
ICICI Bank Ltd. 5.83 A1+
Andhra Bank 5.49 PR1+
Reliance Communication Ltd. 5.16 PR1+
Canara Bank 3.61 P1+
Reliance Capital Ltd. 2.92 A1+
UCO Bank 2.34 P1+
Bank of Baroda 2.11 A1+
United Bank of India 2.01 PR1+
Oriental Bank of Commerce 1.90 P1+
Corporation Bank 1.44 P1+
Andhra Bank 1.42 F1+
Kotak Mahindra Bank Ltd. 1.37 P1+
State Bank of Hyderabad 0.94 A1+
Federal Bank Ltd. 0.91 P1+
State Bank of Patiala 0.89 P1+
State Bank of Patiala 0.86 A1+
Steel Authority of India Ltd. 0.85 PR1+
South Indian Bank 0.72 PR1+
State Bank of Mysore 0.64 A1+
IDBI Bank Ltd. 0.60 P1+
National Housing Bank 0.54 P1+
Small Industries Development Bank of India 0.54 A1+
State Bank of Bikaner and Jaipur 0.53 P1+
Rural Electrification Corporation Ltd. 0.47 PR1+
The Jammu And Kashmir Bank Ltd 0.42 P1+
HDFC Ltd. 0.34 A1+
L&T Finance Limited. 0.32 PR1+
State Bank of Travancore 0.32 P1+
Punjab and Sind Bank 0.23 A1+
Vijaya Bank 0.21 PR1+
L&T Infrastructure Finance Company Ltd. 0.21 A1+
Indian Oil Corporation Ltd. 0.15 P1+
Sundaram BNP Paribas Home Finance Ltd 0.10 A1+
Bajaj Auto Finance Ltd. 0.04 P1+
Floating Rate Instruments 5.31
HDFC Ltd. ** 1.70 AAA
HDFC Ltd. ** 0.72 LAAA
UltraTech Cement Ltd. ** 0.65 AAA
Tata Steel Ltd. ** 0.65 AA
CitiFinancial Consumer Finance India Ltd. ** 0.43 AA
Tata Sons Ltd. ** 0.39 AAA
IDFC Ltd. ** 0.32 LAA+
Indian Railway Finance Corporation Ltd. ** 0.21 AAA
Power Finance Corporation Ltd. ** 0.13 AAA
ICICI Bank Ltd. ** 0.10 AAA
Bills Discounted 4.51
HDFC Bank Ltd. 4.51
Corporate Debt 2.04
HDFC Ltd. ** 0.44 AAA
ICICI Home Finance Company Ltd. ** 0.39 LAAA
CitiFinancial Consumer Finance India Ltd. ** 0.35 AA
LIC Housing Finance Ltd. ** 0.26 AAA
Sundaram Finance Ltd. ** 0.14 LAA+
Kotak Mahindra Prime Ltd. ** 0.12 LAA
Tata Sons Ltd. ** 0.11 AAA
Mahindra & Mahindra Financial Services Ltd ** 0.11 AA-
IDFC Ltd. ** 0.11 AA+
Aditya Birla Nuvo Ltd. ** # AA+
Treasury Bills 0.85
91 Days T-bill 30 Jun 2010 0.68 Sovereign
91 Days T-bill 13 Aug 2010 0.17 Sovereign
Securitised Debt 0.51
Tata Capital Ltd. ** 0.44 CARE AA+(SO)
Power Finance Corporation Ltd. ** 0.07 AAA(SO)
NTPC Ltd. ** 0.01 AAA(SO)
PSU/PFI Bonds/Banks 0.22
National Housing Bank ** 0.22 AAA
Rural Electrification Corporation Ltd. ** # AAA
Cash & Current Assets 18.24
Total Net Assets 100.00
** Represents thinly traded/ non traded securities and illiquid securities.Total Percentage of thinly/non traded securities is 8.09 %. # Indicates less than 0.01
Birla Sun Life Savings Fund - Retail Plan Ultra Short Term Debt Scheme (36 Schemes), 1yr ended 31-Mar-10
CRISIL~CPR 2^^
Savings
Solutions
07
0.85%
2.68%
4.51%
18.24%
73.72%
Sovereign
AA
Other
Cash & Current Assets
AAA
4.45
6.98 6.74 6.61
4.88
7.84
6.81
0
1
2
3
4
5
6
7
8
9
1 Year 3 Years 5 Years Since Inception

Fund Details
Investment Obje
As on May 31, 2010
Birla Sun Life Ultra Short Term Fund*
Investment Style Box
Low Interest RateSensitivity
High
Mid
Low
Credit Quality
High Med
Fund Manager :Mr. Lokesh Mallya
Managing Fund Since : September 29, 2009Total Experience : 5 years & 4 yearsDate of inception : April 19, 2002Nature of the scheme : An Open-ended Short Term
Income Scheme
Default option : Appln of less than Rs. 2 cr - Retail Plan - Fortnightly Dividend ReinvestmentAppln of equal to or greater than Rs. 2 cr - Institutional Plan - Fortnightly Dividend Reinvestment
Retail PlanFresh Purchase : Rs. 10000/-Additional Purchase : Rs. 1000/-Institutional PlanFresh Purchase : Rs. 2 CroreAdditional Purchase : Rs. 10000/-Redemption Cheques : Within 10 working days issuedSystematic Investment : AvailablePlan (SIP)Systematic Withdrawal : AvailablePlan (SWP)Systematic Transfer : AvailablePlan (STP)
Retail PlanGrowth : 16.7583Daily Dividend : 10.0055(Reinvestment)Fortnightly Dividend : 10.3027(Payout & Reinvestment)Monthly Dividend : 10.7709(Payout, Reinvestment & Sweep Option)Institutional PlanGrowth : 11.0376Daily Dividend : 10.0055(Reinvestment)
Fortnightly Dividend : 10.2139(Payout & Reinvestment)
Benchmark : CRISIL Short-Term Bond Fund Index
Average AUM : Rs. 10,487.72 Crores
Entry Load : NilExit Load** :
Average Maturity : 0.39 YearsYield to Maturity : 5.75%Mark to Market : 10%Standard Deviation : 0.16%
Mr. Kaustubh Gupta &
Key Features
Plans / Options & NAV
Load Structure (Incl. for SIP)
OtherParameter
(As on May 31, 2010)
Weekly Dividend : 10.1797(Payout, Reinvestment)
For redemption/switch-out of units within 15 days from the date of allotment: 0.25% of applicable NAV.**Exit / Entry Load is NIL for units issued inBonus & Dividend Reinvestment.
Past performance may or may not be sustained in future. Returns are in % and absolute returns forperiod less than 1 year & CAGR for period 1 year or more.
% R
etur
ns
Birla Sun Life Ulta Short Term Fund - Retail Plan - Growth CRISIL Short-Term Bond Fund Index
Investment Performance Rating Profile
An open-ended short term income scheme with the objective to generate income and capital appreciation by investing 100% of the corpus in adiversified portfolio of debt and money market securities with relatively low levels of interest rate risk.
Note:
Standard Deviation is calculated on annualised basis using 1 year history of monthlyreturns, source: MFI Explorer.
(Past performance is no guarantee of future results.) for ranking methodology please refer page 50
Birla Sun Life Ultra Short Term Fund - Retail PlanUltra Short Term Debt Schemes (36 Schemes), 1 Yr ended 31-Mar-10
CRISIL~CPR 2^^
Portfolio & Asset Allocation
Issuer % to Net RatingAssets
Issuer % to Net RatingAssets
Money Market Instruments 81.34United Bank of India 9.38 PR1+HDFC Bank Ltd. 9.05 A1+Vijaya Bank 7.25 PR1+ICICI Bank Ltd. 5.73 A1+IDBI Bank Ltd. 4.56 A1+Central Bank of India 4.14 PR1+Punjab National Bank 3.86 PR1+Canara Bank 3.76 P1+Andhra Bank 3.54 PR1+Indian Bank 3.31 P1+Bank of Maharashtra 2.56 P1+ING Vysya Bank Ltd. 2.55 P1+Bank of India 2.48 P1+Oriental Bank of Commerce 2.31 P1+State Bank of Bikaner and Jaipur 2.11 P1+Dena Bank 2.09 P1+Punjab and Sind Bank 1.95 A1+Syndicate Bank 1.45 PR1+Yes Bank Limited 1.40 P1+Allahabad Bank 1.08 A1+National Housing Bank 0.86 P1+IndusInd Bank Ltd. 0.85 PR1+State Bank of Hyderabad 0.85 A1+Union Bank of India 0.83 P1+
Federal Bank Ltd. 0.73 P1+Karnataka Bank Ltd. 0.64 A1+HDFC Ltd. 0.63 A1+Punjab and Sind Bank 0.63 PR1+Hindustan Petroleum Corporation Ltd. 0.30 P1+Corporation Bank 0.22 P1+State Bank of Patiala 0.17 P1+Kotak Mahindra Bank Ltd. 0.08 P1+
PSU/PFI Bonds/Banks 1.56National Housing Bank 1.30 AAARural Electrification Corporation Ltd. 0.26 AAA
Treasury Bills 0.0791 Days T-bill 04 June 2010 0.04 Sovereign28 Days T-bill 16 June 2010 0.04 Sovereign
Corporate Debt 0.04Housing Development Finance Corporation Ltd. 0.04 AAA
Cash & Current Assets 16.98
Total Net Assets 100.00
Savings
Solutions
08
*Name of scheme changed w.e.f. April 20, 2010 erstwhile Birla Sun Life Short Term Fund.
0.07%
16.98%
82.95%
Sovereign
Cash & Current Assets
AAA
4.40
7.16 7.016.56
4.88
7.84
6.816.27
0
1
2
3
4
5
6
7
8
9
1 Year 3 Years 5 Years Since Inception
Fund Details
Investment Obje
Birla Sun Life Dynamic Bond Fund
As on May 31, 2010
Investment Style Box
Low Interest RateSensitivity
High
Mid
Low
Credit Quality
High Med
Fund Manager :Managing Fund Since : June 18, 2009Total Experience : 10 yearsDate of inception : September 27, 2004Nature of the scheme : An Open-ended Income Scheme
Default option : Quarterly Dividend ReinvestmentRetail Monthly Dividend Sweep OptionFresh Purchase : Rs. 5 lacsAdditional Purchase : Rs. 1000/-For Other OptionFresh Purchase : Rs. 5000/- Additional Purchase : Rs. 1000/-Redemption Cheques : Within 10 working days issuedSystematic Investment : AvailablePlan (SIP)Systematic Withdrawal : AvailablePlan (SWP)Systematic Transfer : AvailablePlan (STP)
Retail Growth : 15.6650Retail Quarterly Dividend : 11.2440(Payout, Reinvestment & Sweep Option)Retail Monthly Dividend : 10.4106(Payout, Reinvestment & Sweep Option)Retail Monthly Dividendsweep option also available (w.e.f Jan 12, 2009)
Benchmark : CRISIL Composite Bond Fund Index
Average AUM : Rs. 8,612.86 Crores
Entry Load : Nil
Exit Load** : For redemption/switch-out of units within 180 days from the date ofallotment: 0.50% of applicableNAV.**Exit / Entry Load is NIL for units issued inBonus & Dividend Reinvestment.
Average Maturity : 1.95 YearsModified Duration : 1.75 YearsYield to Maturity : 7.10%Mark to Market : 34%Standard Deviation : 0.89%
Mr. Maneesh Dangi
Key Features
Plans / Options & NAV
Load Structure (Incl. for SIP)
OtherParameter
(As on May 31, 2010)
Note:Standard Deviation is calculated on annualised basis using 1 year history of monthlyreturns, source: MFI Explorer.
(Past performance is no guarantee of future results.) for ranking methodology please refer page 50
#���Value Research Rating��
Birla Sun Life Dynamic Bond FundDebt: Medium Term (40 Schemes), 18 months & 3 years ended 31-May-10
Portfolio & Asset Allocation
Issuer % to Net RatingAssets
Issuer % to Net RatingAssets
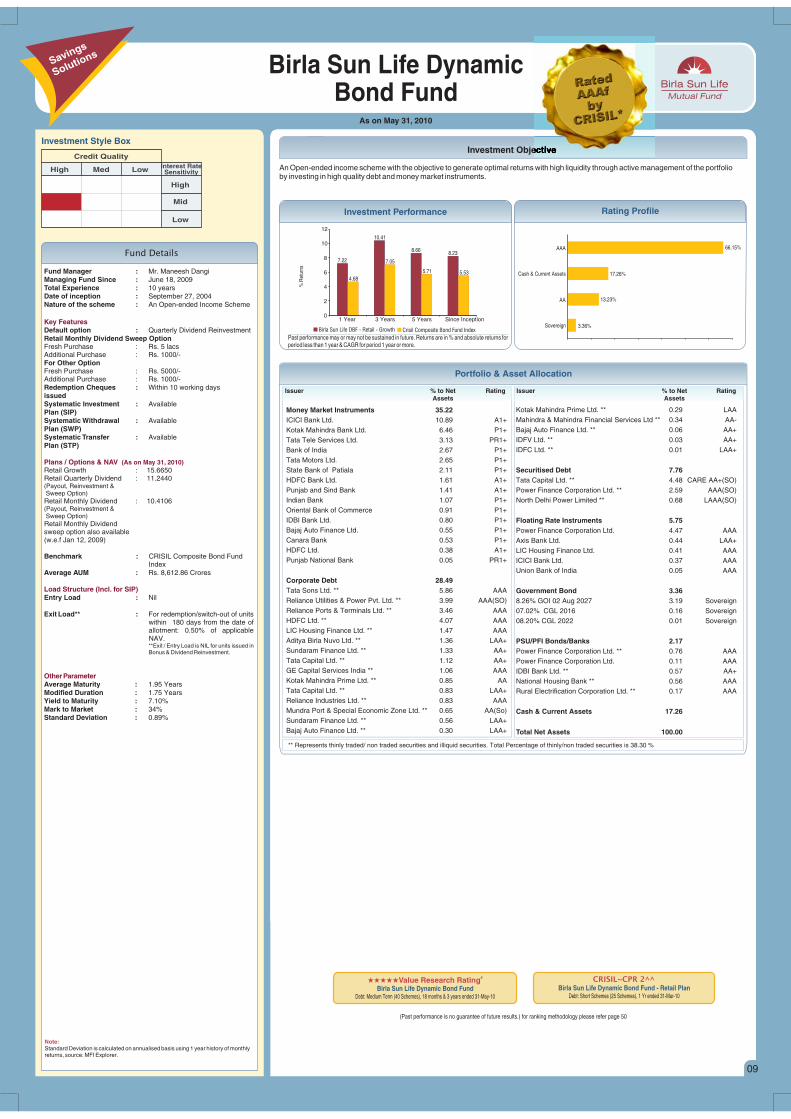
Money Market Instruments 35.22ICICI Bank Ltd. 10.89 A1+Kotak Mahindra Bank Ltd. 6.46 P1+Tata Tele Services Ltd. 3.13 PR1+Bank of India 2.67 P1+Tata Motors Ltd. 2.65 P1+State Bank of Patiala 2.11 P1+HDFC Bank Ltd. 1.61 A1+Punjab and Sind Bank 1.41 A1+Indian Bank 1.07 P1+Oriental Bank of Commerce 0.91 P1+IDBI Bank Ltd. 0.80 P1+Bajaj Auto Finance Ltd. 0.55 P1+Canara Bank 0.53 P1+HDFC Ltd. 0.38 A1+Punjab National Bank 0.05 PR1+
Corporate Debt 28.49Tata Sons Ltd. ** 5.86 AAAReliance Utilities & Power Pvt. Ltd. ** 3.99 AAA(SO)Reliance Ports & Terminals Ltd. ** 3.46 AAAHDFC Ltd. ** 4.07 AAALIC Housing Finance Ltd. ** 1.47 AAAAditya Birla Nuvo Ltd. ** 1.36 LAA+Sundaram Finance Ltd. ** 1.33 AA+Tata Capital Ltd. ** 1.12 AA+GE Capital Services India ** 1.06 AAAKotak Mahindra Prime Ltd. ** 0.85 AATata Capital Ltd. ** 0.83 LAA+Reliance Industries Ltd. ** 0.83 AAAMundra Port & Special Economic Zone Ltd. ** 0.65 AA(So)Sundaram Finance Ltd. ** 0.56 LAA+Bajaj Auto Finance Ltd. ** 0.30 LAA+
Kotak Mahindra Prime Ltd. ** 0.29 LAAMahindra & Mahindra Financial Services Ltd ** 0.34 AA-Bajaj Auto Finance Ltd. ** 0.06 AA+IDFV Ltd. ** 0.03 AA+IDFC Ltd. ** 0.01 LAA+
Securitised Debt 7.76Tata Capital Ltd. ** 4.48 CARE AA+(SO)Power Finance Corporation Ltd. ** 2.59 AAA(SO)North Delhi Power Limited ** 0.68 LAAA(SO)
Floating Rate Instruments 5.75Power Finance Corporation Ltd. 4.47 AAAAxis Bank Ltd. 0.44 LAA+LIC Housing Finance Ltd. 0.41 AAAICICI Bank Ltd. 0.37 AAAUnion Bank of India 0.05 AAA
Government Bond 3.368.26% GOI 02 Aug 2027 3.19 Sovereign07.02% CGL 2016 0.16 Sovereign08.20% CGL 2022 0.01 Sovereign
PSU/PFI Bonds/Banks 2.17Power Finance Corporation Ltd. ** 0.76 AAAPower Finance Corporation Ltd. 0.11 AAAIDBI Bank Ltd. ** 0.57 AA+National Housing Bank ** 0.56 AAARural Electrification Corporation Ltd. ** 0.17 AAA
Cash & Current Assets 17.26
Total Net Assets 100.00
** Represents thinly traded/ non traded securities and illiquid securities. Total Percentage of thinly/non traded securities is 38.30 %
Past performance may or may not be sustained in future. Returns are in % and absolute returns forperiod less than 1 year & CAGR for period 1 year or more.
% R
etur
ns
Birla Sun Life DBF - Retail - Growth Crisil Composite Bond Fund Index
Investment Performance Rating Profile
An Open-ended income scheme with the objective to generate optimal returns with high liquidity through active management of the portfolioby investing in high quality debt and money market instruments.
Savings
Solutions
09
Birla Sun Life Dynamic Bond Fund - Retail PlanDebt: Short Schemes (25 Schemes), 1 Yr ended 31-Mar-10
CRISIL~CPR 2^^
3.36%
13.23%
17.26%
66.15%
Sovereign
AA
Cash & Current Assets
AAA
7.22
10.41
8.668.23
4.68
7.05
5.71 5.53
0
2
4
6
8
10
12
1 Year 3 Years 5 Years Since Inception

Fund Details
Investment Objective
Birla Sun Life Medium Term Plan
As on May 31, 2010
Investment Style Box
Low Interest RateSensitivity
High
Mid
Low
Credit Quality
High Med
Fund Manager :Mr. Kaustubh Gupta
Managing Fund Since : June 25, 2009Total Experience : 10 years & 5 yearsDate of inception : March 25, 2009Nature of the scheme : An Open-ended Income Scheme
Default option : Default Plan RetailDefault Option GrowthDefault Facility FortnightlyDividend Reinvestment
Retail PlanFresh Purchase : Rs. 5000/-Additional Purchase : Rs. 1000/-For Institutional PlanFresh Purchase : Rs. 1 Crore Additional Purchase : Rs. 10,000/-Redemption Cheques : Within 10 working days issuedSystematic Investment : AvailablePlan (SIP)Systematic Withdrawal : Not Available Plan (SWP)Systematic Transfer : AvailablePlan (STP)
Retail PlanWeekly Dividend : 10.0175Fortnightly Dividend : 10.1430Monthly Dividend : 10.1528(Payout, Reinvestment & Sweep Option)Quarterly Dividend : 10.1778(Payout, Reinvestment & Sweep Option)Growth : 10.6949Institutional PlanWeekly Dividend : 10.0290Fortnightly Dividend : 10.1431Monthly Dividend : 10.1099(Payout, Reinvestment & Sweep Option)Quarterly Dividend : 10.1819(Payout, Reinvestment & Sweep Option)Growth : 10.3652
Benchmark : CRISIL Short Term Bond Fund Index
Average AUM : Rs. 958.40 Crores
Entry Load : NilExit Load** :
Mr. Maneesh Dangi &
Key Features
Plans / Options & NAV
Load Structure (Incl. for SIP)
Other Parameter
(As on May 31, 2010)
0.25% if redeemed / switched out within 90 days from the date of allotment**Exit / Entry Load is NIL for units issued in Bonus & Dividend Reinvestment.
Average Maturity : 1.05 YearsYield to Maturity : 6.75%Mark to Market : 36%Standard DeviationInstitutional Plan : 2.46%
Portfolio & Asset Allocation
Issuer % to Net RatingAssets
Issuer % to Net RatingAssets
Money Market Instruments 34.43Punjab and Sind Bank 13.52 A1+Reliance Capital Ltd. 12.06 A1+Kotak Mahindra Prime Ltd. 4.88 P1+IDBI Bank Ltd. 3.97 A1+
Corporate Debt 30.02Reliance Ports & Terminals Ltd.** 5.31 AAAKotak Mahindra Prime Ltd.** 4.50 LAAAditya Birla Nuvo Ltd.** 4.17 LAA+HDFC Ltd.** 4.12 AAALIC Housing Finance Ltd.** 2.96 AAAReliance Industries Ltd. 2.59 AAABajaj Auto Finance Ltd.** 2.58 AA+
Kotak Mahindra Prime Ltd.** 2.57 P1+Tata Capital Ltd.** 1.22 AA+
PSU/PFI Bonds/Banks 4.54ICICI Bank Ltd.** 2.57 AAAPower Finance Corporation Ltd.** 1.97 AAA
Government Bond 0.976.90% CGL 2019 0.97 Sovereign
Cash & Current Assets 30.04
Total Net Assets 100.00
Past performance may or may not be sustained in future. Returns are in % and absolute returns forperiod less than 1 year & CAGR for period 1 year or more.
% R
etur
ns
Birla Sun Life Medium Term Plan - Retail - Growth Crisil Short Term Bond Fund Index
Investment Performance Rating Profile
The primary investment objective of the Scheme is to generate regular income through investments in debt & money market instruments inorder to make regular dividend payments to unitholders & secondary objective is growth of capital.
** Represents thinly traded/ non traded securities and illiquid securities. Total Percentage of thinly/non traded securities is 31.97 %
Savings
Solutions
10
Note:Standard Deviation is calculated on annualised basis using 1 year history of monthly returns, source: MFI Explorer.
Birla Sun Life Medium Term Plan - Retail PlanDebt: Short Schemes (25 Schemes), 1 Yr ended 31-Mar-10
CRISIL~CPR 2^^
(Past performance is no guarantee of future results.) for ranking methodology please refer page 50
0.97%
12.47%
30.04%
56.52%
Sovereign
AA
Cash & Current Assets
AAA
5.565.84
4.92
5.84
1
2
3
4
5
6
7
1 Year Since Inception
Fund Details
Investment Obje
Birla Sun Life Income PlusAs on May 31, 2010
Investment Style Box
Low Interest RateSensitivity
High
Mid
Low
Credit Quality
High Med
Fund Manager : Mr.Managing Fund Since : Jan 11, 2010Total Experience : 11 yearsDate of inception : October 21, 1995Nature of the scheme : An Open-ended Income Scheme
Default option : Dividend ReinvestmentFresh Purchase : Rs. 5000/-Additional Purchase : Rs. 1000/-Redemption Cheques : Within 10 working days issuedSystematic Investment : AvailablePlan (SIP)Systematic Withdrawal : AvailablePlan (SWP)Systematic Transfer : AvailablePlan (STP)
Growth : 42.4237Dividend : 11.3688(Payout & Reinvestment)
Benchmark : CRISIL Composite Bond Fund Index
Average AUM : Rs. 682.09 Crores
Entry Load : Nil
Exit Load** : 0.25% if redeemed / switched outwithin 7 days from the date ofallotment**Exit / Entry Load is NIL for unitsissued in Bonus & DividendReinvestment.
Average Maturity : 8.57 YearsModified Duration : 7.50 YearsYield to Maturity : 7.50%Mark to Market : 90%Standard Deviation : 2.49%
Prasad Dhonde
Key Features
Plans / Options & NAV
Load Structure (Incl. for SIP)
Other Parameter
(As on May 31, 2010)
Note:Standard Deviation is calculated on annualised basis using 1 year history of monthly returns, source: MFI Explorer
CRISIL~CPR 1^^
Birla Sun Life Income PlusConsistent CPR Performer-Debt (13 Schemes), 5 Yrs ended 31-Mar-10
(Past performance is no guarantee of future results.) for ranking methodology please refer page 50
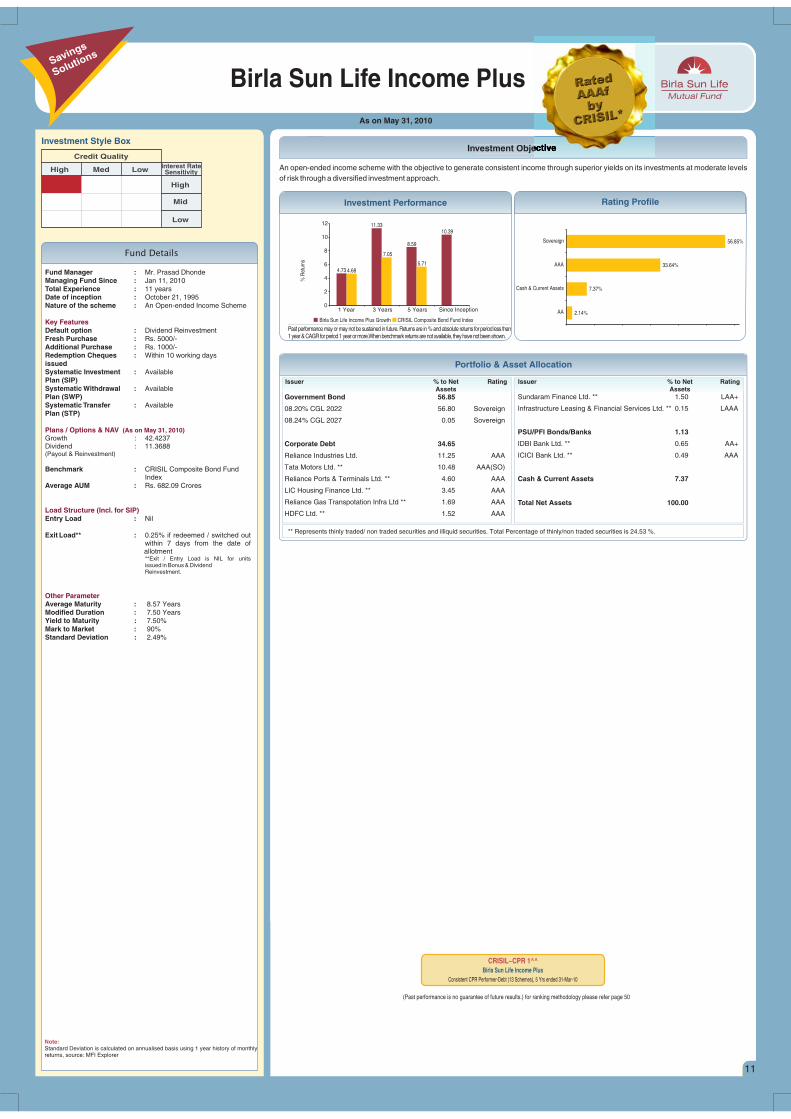
An open-ended income scheme with the objective to generate consistent income through superior yields on its investments at moderate levelsof risk through a diversified investment approach.
Past performance may or may not be sustained in future. Returns are in % and absolute returns for period less than1year&CAGRforperiod1yearormore.Whenbenchmark returns arenotavailable, theyhavenotbeenshown.
% R
etur
ns
Birla Sun Life Income Plus Growth CRISIL Composite Bond Fund Index
Investment Performance Rating Profile
Portfolio & Asset Allocation
Issuer % to Net RatingAssets
Issuer % to Net RatingAssets
Government Bond 56.85
08.20% CGL 2022 56.80 Sovereign
08.24% CGL 2027 0.05 Sovereign
Corporate Debt 34.65
Reliance Industries Ltd. 11.25 AAA
Tata Motors Ltd. ** 10.48 AAA(SO)
Reliance Ports & Terminals Ltd. ** 4.60 AAA
LIC Housing Finance Ltd. ** 3.45 AAA
Reliance Gas Transpotation Infra Ltd ** 1.69 AAA
HDFC Ltd. ** 1.52 AAA
Sundaram Finance Ltd. ** 1.50 LAA+
Infrastructure Leasing & Financial Services Ltd. ** 0.15 LAAA
PSU/PFI Bonds/Banks 1.13
IDBI Bank Ltd. ** 0.65 AA+
ICICI Bank Ltd. ** 0.49 AAA
Cash & Current Assets 7.37
Total Net Assets 100.00
** Represents thinly traded/ non traded securities and illiquid securities. Total Percentage of thinly/non traded securities is 24.53 %.
Savings
Solutions
11
2.14%
7.37%
33.64%
56.85%
AA
Cash & Current Assets
AAA
Sovereign
4.73
11.33
8.59
10.39
4.68
7.05
5.71
0
2
4
6
8
10
12
1 Year 3 Years 5 Years Since Inception

Fund Details
Investment Obje
As on May 31, 2010
Birla Sun Life Income Fund
Investment Style Box
Low Interest RateSensitivity
High
Mid
Low
Credit Quality
High Med
Fund Manager :Managing Fund Since : Jan 11, 2010Total Experience : 6 years Date of inception : March 3, 1997Nature of the scheme : An Open-ended Income Scheme
Default option : Dividend ReinvestmentFresh Purchase : Rs. 5000/-Additional Purchase : Rs. 1000/-Redemption Cheques : Within 10 working days issuedSystematic Investment : AvailablePlan (SIP)Systematic Withdrawal : AvailablePlan (SWP)Systematic Transfer : AvailablePlan (STP)
Growth : 34.4228Quarterly Dividend : 10.9846(Payout, Reinvestment & Sweep Option)Half Yearly Dividend : 11.4540(Payout, Reinvestment & Sweep Option)54 EA Growth : 34.399054 EA Dividend : 10.374454 EB Growth : 34.182354 EB Dividend : 15.1740
Benchmark : CRISIL Composite Bond Fund Index
Average AUM : Rs. 366.39 Crores
Entry Load : NilExit Load** : 0.50% if redeemed / switched out
within180 days from the date of allotment**Exit / Entry Load is NIL for units issuedin Bonus & Dividend Reinvestment.
Average Maturity : 4.19 YearsModified Duration : 3.75 YearsYield to Maturity : 7.00%Mark to Market : 53%Standard DeviationRetail Plan : 2.70%54 EA Growth : 2.70%54 EB Growth : 2.70%
Mr. Shaktie Prakash
Key Features
Plans / Options & NAV
Load Structure (Incl. for SIP)
Other Parameter
(As on May 31, 2010)
Note:
Standard Deviation is calculated on annualised basis using 1 year history of monthly returns, source: MFI Explorer
Portfolio & Asset Allocation
Issuer % to Net RatingAssets
Issuer % to Net RatingAssets
Corporate Debt 30.24Reliance Industries Ltd. 8.39 AAATata Sons Ltd.** 6.02 AAAHDFC Ltd.** 5.95 AAAKotak Mahindra Prime Ltd.** 5.95 P1+Tata Motors Ltd.** 2.58 AAA(SO)Reliance Gas Transpotation Infrastructure Ltd.** 1.35 AAA
Money Market Instruments 23.05State Bank of Patiala 5.86 P1+Bank of Baroda 5.77 A1+State Bank of Hyderabad 5.77 A1+Canara Bank 5.66 P1+
Government Bond 22.9308.20% CGL 2022 21.95 Sovereign7.35% CGL 2024 0.89 Sovereign06.05% CGL 2019 FEB 0.09 Sovereign
PSU/PFI Bonds/Banks 1.23Indian Railway Finance Corporation Ltd.** 1.23 AAA
Cash & Current Assets 22.55
Total Net Assets 100.00
Past performance may or may not be sustained in future. Returns are in % and absolute returns for period less than1 year & CAGR for period 1 year or more.When benchmark returns are not available, they have not been shown.
% R
etur
ns
Birla Sun Life Income Fund Growth CRISIL Composite Bond Fund Index
Investment Performance Rating Profile
An open-ended income scheme with the objective to generate income and capital appreciation by investing 100% of the corpus in a diversifiedportfolio of debt and money market securities.
Savings
Solutions
12
** Represents thinly traded/ non traded securities and illiquid securities. Total Percentage of thinly/non traded securities is 23.08%.
22.55%
22.93%
54.51%
Cash & Current Assets
Sovereign
AAA
5.81
9.178.19
9.78
4.68
7.05
5.71
0
2
4
6
8
10
12
1 Year 3 Years 5 Years Since Inception
Fund Details
Investment Objective
As on May 31, 2010
Birla Sun Life Floating Rate Fund Short Term Plan
Investment Style Box
Low Interest RateSensitivity
High
Mid
Low
Credit Quality
High Med
Fund Manager :Ms. Sunaina Da Cunha
Managing Fund Since : June 18, 2009Total Experience : 11 years & 6 years Date of inception : June 05, 2003Nature of the scheme : An Open-ended Income Scheme
Default option : Appln of less than Rs. 5 cr - Daily Dividend ReinvestmentAppln of equal to or greater than Rs. 5 cr - Institutional Plan - Daily Dividend Reinvestment
Retail PlanFresh Purchase : Rs. 5000/-Additional Purchase : Rs. 1000/-Institutional PlanFresh Purchase : Rs. 5 CroreAdditional Purchase : Rs. 1 Lac
Redemption Cheques : Within 10 working days issuedSystematic Investment : NAPlan (SIP)Systematic Withdrawal : AvailablePlan (SWP)Systematic Transfer : AvailablePlan (STP)
Retail PlanGrowth : 15.2675Daily Dividend (Reinvestment) : 10.0015Dividend (Reinvestment) : 10.3777Institutional PlanGrowth : 12.3032Daily Dividend (Reinvestment) : 10.0000Weekly Dividend (Reinvestment) : 10.0107Fortnightly Dividend : 10.0000(Reinvestment)
Benchmark : CRISIL Liquid Fund Index
Average AUM : Rs. 958.63 Crores
Entry Load : NilExit Load : Nil
Average Maturity : 0.08 YearsYield to Maturity : 5.00%Standard DeviationRetail Plan : 0.21%
Mr. Prasad Dhonde &
Key Features
Plans / Options & NAV
Load Structure
Other Parameter
(As on May 31, 2010)
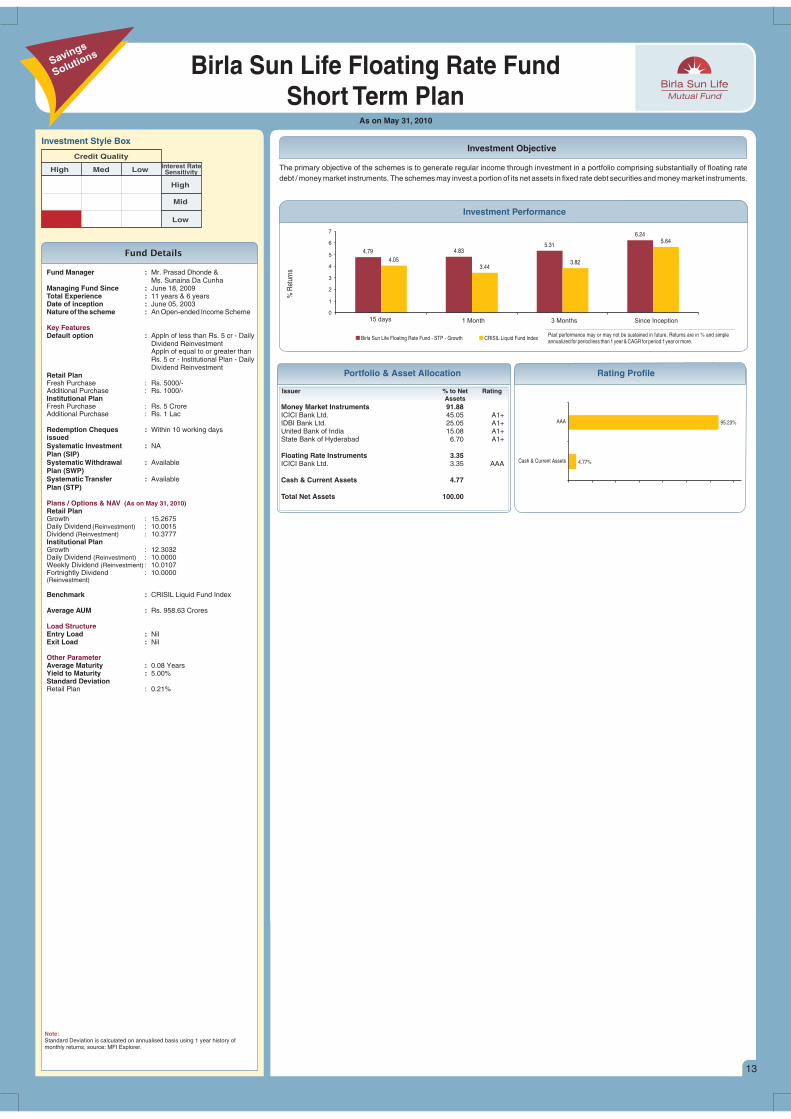
The primary objective of the schemes is to generate regular income through investment in a portfolio comprising substantially of floating ratedebt / money market instruments. The schemes may invest a portion of its net assets in fixed rate debt securities and money market instruments.
Issuer % to Net RatingAssets
Portfolio & Asset Allocation
Note:Standard Deviation is calculated on annualised basis using 1 year history of monthly returns, source: MFI Explorer.
Money Market Instruments 91.88ICICI Bank Ltd. 45.05 A1+IDBI Bank Ltd. 25.05 A1+United Bank of India 15.08 A1+State Bank of Hyderabad 6.70 A1+
Floating Rate Instruments 3.35ICICI Bank Ltd. 3.35 AAA
Cash & Current Assets 4.77
Total Net Assets 100.00
3 Years
% R
etur
ns
Past performance may or may not be sustained in future. Returns are in % and simpleannualized for period less than 1 year & CAGR for period 1 year or more.
Birla Sun Life Floating Rate Fund - STP - Growth CRISIL Liquid Fund Index
Savings
Solutions
Rating Profile
Investment Performance
13
4.77%
95.23%
Cash & Current Assets
AAA
4.79 4.835.31
6.24
4.053.44
3.82
5.64
0
1
2
3
4
5
6
7
15 days 1 Month 3 Months Since Inception

Investment Objective
As on May 31, 2010
An open - ended government securities scheme with the objective to generate income and capital appreciation through investments exclusivelyin Government Securities.
Birla Sun Life Gilt Plus
Investment Style Box
Low Interest RateSensitivity
High
Mid
Low
Credit Quality
High Med
Fund Manager :Managing Fund Since : June 18, 2009Total Experience : 6 yearsDate of inception : October 12, 1999Nature of the scheme : An Open-ended Government
Securities Scheme
Default option : GrowthFresh Purchase : Rs. 5000/-Additional Purchase : Rs. 1000/-Redemption Cheques : Within 10 working days issuedSystematic Investment : AvailablePlan (SIP)Systematic Withdrawal : AvailablePlan (SWP)Systematic Transfer : AvailablePlan (STP)
Liquid PlanGrowth : 21.3864(Quarterly Gain & Annual Gain)Dividend : 10.4240(Payout, Reinvestment & Sweep Option)Annual Dividend Option : 10.3580(Payout, Reinvestment & Sweep Option)PF PlanGrowth : 24.1819(Quarterly Gain & Annual Gain)Dividend : 10.1692(Payout, Reinvestment & Sweep Option)Annual Dividend Option : 18.1186(Payout, Reinvestment & Sweep Option)Regular PlanGrowth : 30.9568(Quarterly Gain & Annual Gain)Dividend : 11.8906(Payout, Reinvestment & Sweep Option)Annual Dividend Option : 23.1791(Payout, Reinvestment & Sweep Option)
Benchmark :Liquid Plan : I-Sec SI-BEXPF Plan : I-Sec LI-BEXRegular Plan : I-Sec LI-BEXAverage AUMLiquid Plan : Rs. 6.32 CroresPF Plan : Rs. 54.26 CroresRegular Plan : Rs. 78.67 Crores
Liquid Plan, Regular Plan & PF Plan - Quarterly / AnnualDividendEntry Load : NilExit Load : NilPF Plan - GrowthEntry Load : NilExit Load** : 1% if redeemed / switched out
within 365 days from the date of allotment**Exit / Entry Load is NIL for units issued inBonus & Dividend Reinvestment.
Average Maturity Liquid Plan : -PF Plan : 10.50 YearsRegular Plan : 9.25 YearsModified DurationLiquid Plan : -PF Plan : 8.50 YearsRegular Plan : 8.00 YearsYield to MaturityLiquid Plan : 5.00 %PF Plan : 7.50 %Regular Plan : 5.00 %Mark to MarketLiquid Plan : -PF Plan : 91 % Regular Plan : 94 %Standard DeviationLiquid Plan : 1.78 %PF Plan : 2.83 % Regular Plan : 2.49 %
Mr. Shaktie Prakash
Key Features
Plans / Options & NAV
Load Structure (Incl. for SIP)
Other Parameter
(As on May 31, 2010)
Note:
Standard Deviation is calculated on annualised basis using 1 year history of monthlyreturns, source: MFI Explorer.
Past performance may or may not be sustained in future. Returns are in % and absolute returns for period less than1 year &CAGRfor period 1 year or more.When benchmark returns are not available, they have not been shown.
Investment Performance - Liquid Plan Rating Profile - Liquid Plan
Past performance may or may not be sustained in future. Returns are in % and absolute returns for period less than1year&CAGRforperiod1 yearor more.When benchmark returns are not available, they havenot beenshown.
Investment Performance - PF Plan Rating Profile - PF Plan
Past performance may or may not be sustained in future. Returns are in % and absolute returns for period less than1year&CAGRforperiod1yearormore.Whenbenchmark returns arenotavailable, they havenotbeenshown.
Investment Performance - Regular plan Rating Profile - Regular Plan
Birla Sun Life Gilt Plus - LP Growth I-Sec SI-BEX
Birla Sun Life Gilt Plus - PF Growth I-Sec LI-BEX
Birla Sun Life Gilt Plus - RP Growth I-Sec LI-BEX
% R
etur
ns%
Ret
urns
% R
etur
ns
Fund Details
Issuer % to Net RatingAssets
Government Bond 91.2608.20% CGL 2022 89.33 Sovereign07.47% OIL MKT CO GOI BOND 2012 1.93 Sovereign
Cash & Current Assets 8.74
Total Net Assets 100.00
Issuer % to Net RatingAssets
Cash & Current Assets 100.00
Total Net Assets 100.00
Portfolio & Asset Allocation - Liquid Plan Portfolio & Asset Allocation - PF Plan
Issuer % to Net RatingAssets
Government Bond 94.4808.20% CGL 2022 76.19 Sovereign07.47% OIL MKT CO GOI BOND 2012 18.30 Sovereign
Cash & Current Assets 5.52
Total Net Assets 100.00
Portfolio & Asset Allocation - Regular Plan
Savings
Solutions
14
#���Value Research Rating�
Birla Sun Life Gilt Plus - Liquid PlanGilt: Short Term (10 Schemes), 18 months & 3 years ended 31-May-10
(Past performance is no guarantee of future results.) for ranking methodology please refer page 50
100.00%Cash & Current Assets
8.74%
91.26%
Cash & Current Assets
Sovereign
5.52%
94.48%
Cash & Current Assets
Sovereign
5.16 5.14 5.41
7.41
5.54
8.95
7.81
0
1
2
3
4
5
6
7
8
9
10
1 Year 3 Years 5 Years Since Inception
2.67
5.08 4.88
8.65
2.94
9.45
7.86
0123456789
10
1 Year 3 Years 5 Years Since Inception
1.03
9.33
7.99
11.20
2.94
9.45
7.86
0
2
4
6
8
10
12
1 Year 3 Years 5 Years Since Inception
As on May 31, 2010
Fund Details
Investment Style Box
Low Interest RateSensitivity
High
Mid
Low
Credit Quality
High Med
Fund Manager :Managing Fund Since : June 18, 2009Total Experience : 10 years Date of inception : October 28, 1999Nature of the scheme : An Open-ended Gilt Scheme
Default option : GrowthFor Short Term Retail Plan & Long Term PlanFresh Purchase : Rs. 5000/-Additional Purchase : Rs. 1000/-For Short Term Institutional PlanFresh Purchase : Rs. 5 croresAdditional Purchase : Rs. 1 lacsRedemption Cheques : Within 10 working days issued
Systematic Investment : AvailablePlan (SIP)Systematic Withdrawal : AvailablePlan (SWP)Systematic Transfer : AvailablePlan (STP)
Long Term PlanGrowth : 27.3870Dividend : 11.6130(Payout & Reinvestment)
Short Term Plan - Retail Growth : 18.3437Dividend : 10.2311(Payout & Reinvestment)Daily Dividend : 10.0031(Reinvestment)Weekly Dividend : 10.0033(Reinvestment)Institutional Plan Daily Dividend : 10.0000
BenchmarkShort Term Plan : I-Sec SI-BEXLong Term Plan : I-Sec LI-BEX
Average AUMLong Term Plan : Rs. 86.42 CroresShort Term Plan : Rs. 1.77 Crores
Entry Load : NilExit LoadLong Term :
Average Maturity Long Term Plan :Short Term Plan :
Yield to Maturity Long Term Plan : 5.00 %Short Term Plan : 5.00 %
Standard DeviationLong Term Plan : 3.06%Short Term Plan : 0.96%
Mr. Maneesh Dangi
Key Features
Plans / Options & NAV
Load Structure (Incl. for SIP)
Other Parameter
Maximum Subscription amount (incl. switch in)Long Term Plan : 2 Crores
1.00% if redeemed / switched out within 365 days from the date of allotment**Exit / Entry Load is NIL for units issued in Bonus & Dividend Reinvestment.
Short Term : Nil
--
Modified DurationLong Term Plan : -Short Term Plan : -
Mark to MarketLong Term Plan : -Short Term Plan : -
(As on May 31, 2010)
Note:Standard Deviation is calculated on annualised basis using 1 year history of monthlyreturns, source: MFI Explorer.
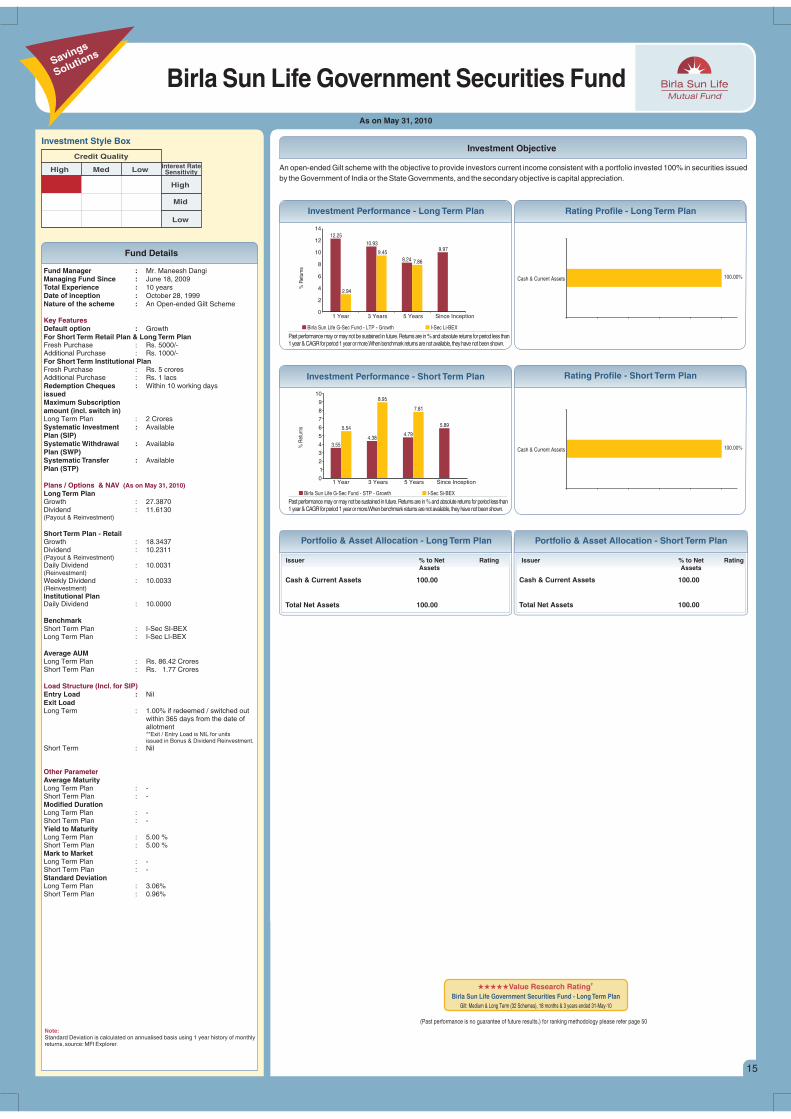
An open-ended Gilt scheme with the objective to provide investors current income consistent with a portfolio invested 100% in securities issuedby the Government of India or the State Governments, and the secondary objective is capital appreciation.
Investment Objective
Birla Sun Life Government Securities Fund
Past performance may or may not be sustained in future. Returns are in % and absolute returns for period less than1year&CAGRforperiod1yearormore.Whenbenchmark returns arenotavailable, they havenotbeenshown.
% R
etur
ns
Birla Sun Life G-Sec Fund - LTP - Growth I-Sec Li-BEX
Investment Performance - Long Term Plan Rating Profile - Long Term Plan
Past performance may or may not be sustained in future. Returns are in % and absolute returns for period less than1year&CAGRforperiod1 year or more.When benchmark returns are not available, they have not been shown.
Investment Performance - Short Term Plan Rating Profile - Short Term Plan
% R
etur
ns
Birla Sun Life G-Sec Fund - STP - Growth I-Sec Si-BEX
Issuer % to Net RatingAssets
Issuer % to Net RatingAssets
Cash & Current Assets 100.00
Total Net Assets 100.00
Cash & Current Assets 100.00
Total Net Assets 100.00
Portfolio & Asset Allocation - Long Term Plan Portfolio & Asset Allocation - Short Term Plan
#���Value Research Rating��
Birla Sun Life Government Securities Fund - Long Term PlanGilt: Medium & Long Term (32 Schemes), 18 months & 3 years ended 31-May-10
(Past performance is no guarantee of future results.) for ranking methodology please refer page 50
Savings
Solutions
15
100.00%Cash & Current Assets
100.00%Cash & Current Assets
12.25
10.93
8.24
9.97
2.94
9.45
7.86
0
2
4
6
8
10
12
14
1 Year 3 Years 5 Years Since Inception
3.55
4.384.79
5.895.54
8.95
7.81
0
1
2
3
4
5
6
7
8
9
10
1 Year 3 Years 5 Years Since Inception

Fund Details
Birla Sun Life Monthly IncomeAn open-ended scheme. Monthly income is not assured and is subject
to availability of distributable surplus
As on May 31, 2010
Investment Style Box
High Mid Low Interest rate sensitivity
High
Mid
Low
Credit Quality
Fund Manager :Mr. Nishit Dholakia
Managing Fund Since : June 18, 2009Total Experience : 12 years & 10 yearsDate of inception : July 14, 1999Nature of the scheme : An Open-ended Income Scheme
Default Plan / Option : Growth / Dividend ReinvestmentFor Monthly & Quarterly Dividend Fresh Purchase : Rs. 25000/-Additional Purchase : Rs. 5000/-For Growth PlanFresh Purchase : Rs. 5000/-Additional Purchase : Rs. 1000/-Redemption Cheques : Within 10 working days issued
Monthly Dividend : 11.2591(Payout, Reinvestment & Sweep Option)Quarterly Dividend : 11.8162(Payout, Reinvestment & Sweep Option)Growth : 34.4871
Benchmark : CRISIL MIP Blended IndexAverage AUM : Rs. 491.18 Crores
Entry Load : Nil
Exit Load** : 1.00% if redeemed / switched out within 365 days from the date of allotment**Exit / Entry Load is NIL for units issued in Bonus & Dividend Reinvestment.
Average Maturity : 1.11 YearsYield to Maturity : 5.25%(for Debt Component)Mark to Market : 34%Standard Deviation : 8.05%
##Sharp Ratio : 0.65
Mr. Satyabrata Mohanty &
Key Features
Plans / Options & NAV
Load Structure
Other Parameter
(As on May 31, 2010)
An open-ended income scheme with the primary investment objective to generate regular income so as to make monthly and quarterlydistributions to Unit holders and the secondary objective as growth of capital. Monthly income is not assured and is subject to availability ofdistributable surplus
Investment Objective
Past performance may or may not be sustained in future. Returns are in % and absolute returns for period less than1 year & CAGR for period 1 year or more. When benchmark returns are not available, they have not been shown.
% R
etur
ns
Investment Performance Rating Profile
Birla Sun Life Monthly Income - Growth Crisil MIP Blended Index
Debt Allocation 64.34
Equity Allocation 12.01
Money Market Instruments 42.34Oriental Bank of Commerce 10.54 P1+ICICI Bank Ltd. 7.82 A1+IDBI Bank Ltd. 7.68 A1+L&T Finance Limited. 4.86 PR1+Bank of Baroda 4.78 A1+Corporation Bank 4.76 P1+Punjab National Bank 1.90 PR1+
Corporate Debt 16.73Sundaram Finance Ltd. ** 10.01 LAA+HDFC Ltd. ** 3.18 AAALIC Housing Finance Ltd. ** 2.10 AAAICICI Home Finance Company Ltd. ** 1.01 LAAAIDFC Ltd. ** 0.42 AA+
PSU/PFI Bonds/Banks 3.24NABARD ** 1.99 AAAPower Finance Corporation Ltd. ** 0.72 AAAIDBI Bank Ltd. ** 0.54 AA+
Government Bond 2.0308.20% CGL 2022 1.03 Sovereign8.26% GOI 02 Aug 2027 1.01 Sovereign
Banks 1.95Canara Bank 0.41Axis Bank Ltd. 0.34Allahabad Bank 0.33United Bank Of India 0.32ICICI Bank Ltd. 0.29The South Indian Bank Ltd. 0.25
Finance 1.39Rural Electrification Corporation Ltd. 0.33Shriram Transport Finance Company Ltd. 0.31Power Finance Corporation Ltd 0.31HDFC Ltd. 0.22LIC Housing Finance Ltd. 0.15McDowell Holdings Ltd. 0.08
Consumer Non Durables 0.93ICI India Ltd. 0.45Asian Paints Ltd. 0.29Glaxosmithkline Consumer Healthcare Ltd. 0.19
Industrial Products 0.80Cummins (India) Ltd. 0.44Greaves Cotton Ltd. 0.36
Fertilisers 0.66Coromandel International Limited 0.52Chambal Fertilisers and Chemicals Ltd. 0.14
Pesticides 0.62Rallis India Ltd. 0.62
Power 0.62Kalpataru Power Transmission Ltd. 0.22Gujarat Industries Power Company Ltd. 0.20KEC International Ltd. 0.19
Software 0.60HCL Technologies Ltd. 0.31Infosys Technologies Ltd. 0.30
Auto 0.60Mahindra & Mahindra Ltd. 0.31Hero Honda Motors Ltd. 0.29
Petroleum Products 0.51Hindustan Petroleum Corporation Ltd. 0.36Castrol India Ltd. 0.15
Industrial Capital Goods 0.48Thermax Ltd. 0.28Emco Ltd. 0.12Elecon Engineering Company Ltd. 0.08
Consumer Durables 0.43Bajaj Electricals Ltd. 0.29Blue Star Ltd. 0.15
Gas 0.39Indraprastha Gas Ltd. 0.39
Transportation 0.36The Great Eastern Shipping Co. Ltd 0.18Gateway Distriparks Ltd. 0.18
Oil 0.33Oil & Natural Gas Corporation Ltd. 0.33
Media & Entertainment 0.29Jagran Prakashan Ltd. 0.29Magnasound India Ltd. ** #
Pharmaceuticals 0.28Wyeth Ltd. 0.28
Auto Ancillaries 0.28Phillips Carbon Black Limited 0.28
Hotels 0.20Taj GVK Hotels & Resorts Ltd. 0.20
Construction Project 0.15Voltas Ltd. 0.15
Ferrous Metals 0.13PSL Ltd. 0.13
Total Net Assets 100.00
Cash & Current Assets 23.65
Issuer % to Net RatingAssets
Issuer % to Net RatingAssets
** Represents thinly traded/ non traded securities and illiquid securities. Total Percentage of thinly/non traded securities is 19.97% # Indicates less than 0.01
Portfolio & Asset Allocation
(Past performance is no guarantee of future results.) for ranking methodology please refer page 50
Note:Standard Deviation & Sharpe Ratio are calculated on Annualised basis using 3 yearhistory of monthly returns, source: MFI Explorer.##Risk-free rate assumed to be 4.40%(91 day T-bill yield As on May 31, 2010)
MIP Conservative Scheme (11 Schemes), 2 years ended 31-Mar-10
Birla Sun Life Monthly IncomeCRISIL~CPR 1^^
Regular
Income
Solutions
16
2.03%
10.97%
12.01%
23.65%
51.33%
Sovereign
AA
Other
Cash & Current Assets
AAA
���#
�Value Research RatingBirla Sun Life Monthly Income
Hybrid: Monthly Income (34 Schemes),for 3 & 5 years periods ended 31-May-10
10.209.66
10.18
12.04
6.34
7.708.33
0
2
4
6
8
10
12
14
1 Year 3 Years 5 Years Since Inception
Fund Details
Birla Sun Life MIPAn open-ended scheme. Monthly income is not assured and is subject
to availability of distributable surplus
As on May 31, 2010
Investment Style Box
Credit Quality
High Mid Low Interest rate sensitivity
High
Mid
Low
Fund Manager :Mr. Nishit Dholakia
Managing Fund Since : June 18, 2009Total Experience : 12 years & 10 yearsDate of inception : November 20, 2000Nature of the scheme : An Open-ended Income Scheme
Default option : Dividend Reinvestment / Instant Payment
For Monthly Dividend / PaymentFresh Purchase : Rs. 25000/-Additional Purchase : Rs. 1000/-For GrowthFresh Purchase : Rs. 5000/-Additional Purchase : Rs. 1000/-Redemption Cheques : Within 10 working days issued
Dividend : 11.2720(Payout, Reinvestment & Sweep Option)Monthly Payment / Growth : 25.0547(Instant / Deferred)
Benchmark : CRISIL MIP Blended IndexAverage AUM : Rs. 272.14 Crores
Entry Load : Nil
Exit Load** : 0.25% if redeemed/switched out within 7 days from the date of allotment
Average Maturity : 1.53 YearsYield to Maturity : 5.90%(for Debt Component)Mark to Market : 34%Standard Deviation : 7.83%
##Sharp Ratio : 0.51
Mr. Satyabrata Mohanty &
Key Features
Plans / Options & NAV
Load Structure
Other Parameter
(As on May 31, 2010)
**Exit / Entry Load is NIL for units issued in Bonus & Dividend Reinvestment.
Note:Standard Deviation & Sharpe Ratio are calculated on Annualised basis using 3 yearhistory of monthly returns, source: MFI Explorer.##Risk-free rate assumed to be 4.40%(91 day T-bill yield As on May 31, 2010)
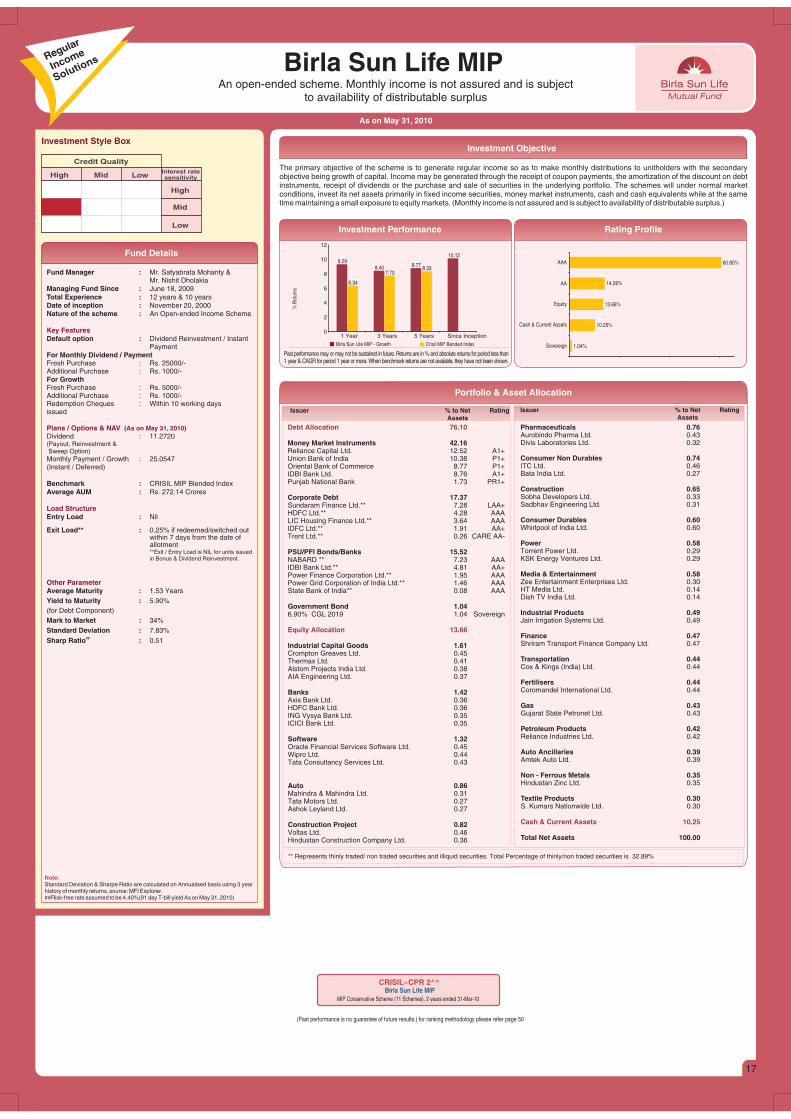
The primary objective of the scheme is to generate regular income so as to make monthly distributions to unitholders with the secondaryobjective being growth of capital. Income may be generated through the receipt of coupon payments, the amortization of the discount on debtinstruments, receipt of dividends or the purchase and sale of securities in the underlying portfolio. The schemes will under normal marketconditions, invest its net assets primarily in fixed income securities, money market instruments, cash and cash equivalents while at the sametime maintaining a small exposure to equity markets. (Monthly income is not assured and is subject to availability of distributable surplus.)
Investment Objective
Past performance may or may not be sustained in future. Returns are in % and absolute returns for period less than1 year & CAGR for period 1 year or more. When benchmark returns are not available, they have not been shown.
% R
etur
ns
Investment Performance Rating Profile
Birla Sun Life MIP - Growth Crisil MIP Bended Index
Debt Allocation 76.10
Equity Allocation 13.66
Money Market Instruments 42.16Reliance Capital Ltd. 12.52 A1+Union Bank of India 10.38 P1+Oriental Bank of Commerce 8.77 P1+IDBI Bank Ltd. 8.76 A1+Punjab National Bank 1.73 PR1+
Corporate Debt 17.37Sundaram Finance Ltd.** 7.28 LAA+HDFC Ltd.** 4.28 AAALIC Housing Finance Ltd.** 3.64 AAAIDFC Ltd.** 1.91 AA+Trent Ltd.** 0.26 CARE AA-
PSU/PFI Bonds/Banks 15.52NABARD ** 7.23 AAAIDBI Bank Ltd.** 4.81 AA+Power Finance Corporation Ltd.** 1.95 AAAPower Grid Corporation of India Ltd.** 1.46 AAAState Bank of India** 0.08 AAA
Government Bond 1.046.90% CGL 2019 1.04 Sovereign
Industrial Capital Goods 1.61Crompton Greaves Ltd. 0.45Thermax Ltd. 0.41Alstom Projects India Ltd. 0.38AIA Engineering Ltd. 0.37
Banks 1.42Axis Bank Ltd. 0.36HDFC Bank Ltd. 0.36ING Vysya Bank Ltd. 0.35ICICI Bank Ltd. 0.35
Software 1.32Oracle Financial Services Software Ltd. 0.45Wipro Ltd. 0.44Tata Consultancy Services Ltd. 0.43
Auto 0.86Mahindra & Mahindra Ltd. 0.31Tata Motors Ltd. 0.27Ashok Leyland Ltd. 0.27
Construction Project 0.82Voltas Ltd. 0.46Hindustan Construction Company Ltd. 0.36
Pharmaceuticals 0.76Aurobindo Pharma Ltd. 0.43Divis Laboratories Ltd. 0.32
Consumer Non Durables 0.74ITC Ltd. 0.46Bata India Ltd. 0.27
Construction 0.65Sobha Developers Ltd. 0.33Sadbhav Engineering Ltd. 0.31
Consumer Durables 0.60Whirlpool of India Ltd. 0.60
Power 0.58Torrent Power Ltd. 0.29KSK Energy Ventures Ltd. 0.29
Media & Entertainment 0.58Zee Entertainment Enterprises Ltd. 0.30HT Media Ltd. 0.14Dish TV India Ltd. 0.14
Industrial Products 0.49Jain Irrigation Systems Ltd. 0.49
Finance 0.47Shriram Transport Finance Company Ltd. 0.47
Transportation 0.44Cox & Kings (India) Ltd. 0.44
Fertilisers 0.44Coromandel International Ltd. 0.44
Gas 0.43Gujarat State Petronet Ltd. 0.43
Petroleum Products 0.42Reliance Industries Ltd. 0.42
Auto Ancillaries 0.39Amtek Auto Ltd. 0.39
Non - Ferrous Metals 0.35Hindustan Zinc Ltd. 0.35
Textile Products 0.30S. Kumars Nationwide Ltd. 0.30
Total Net Assets 100.00
Cash & Current Assets 10.25
Issuer % to Net RatingAssets
Issuer % to Net RatingAssets
Portfolio & Asset Allocation
** Represents thinly traded/ non traded securities and illiquid securities. Total Percentage of thinly/non traded securities is 32.89%
Regular
Income
Solutions
17
MIP Conservative Scheme (11 Schemes), 2 years ended 31-Mar-10
Birla Sun Life MIP CRISIL~CPR 2^^
(Past performance is no guarantee of future results.) for ranking methodology please refer page 50
1.04%
10.25%
13.66%
14.26%
60.80%
Sovereign
Cash & Current Assets
Equity
AA
AAA9.298.40 8.77
10.12
6.34
7.708.33
0
2
4
6
8
10
12
1 Year 3 Years 5 Years Since Inception
Fund Details
Investment Objective
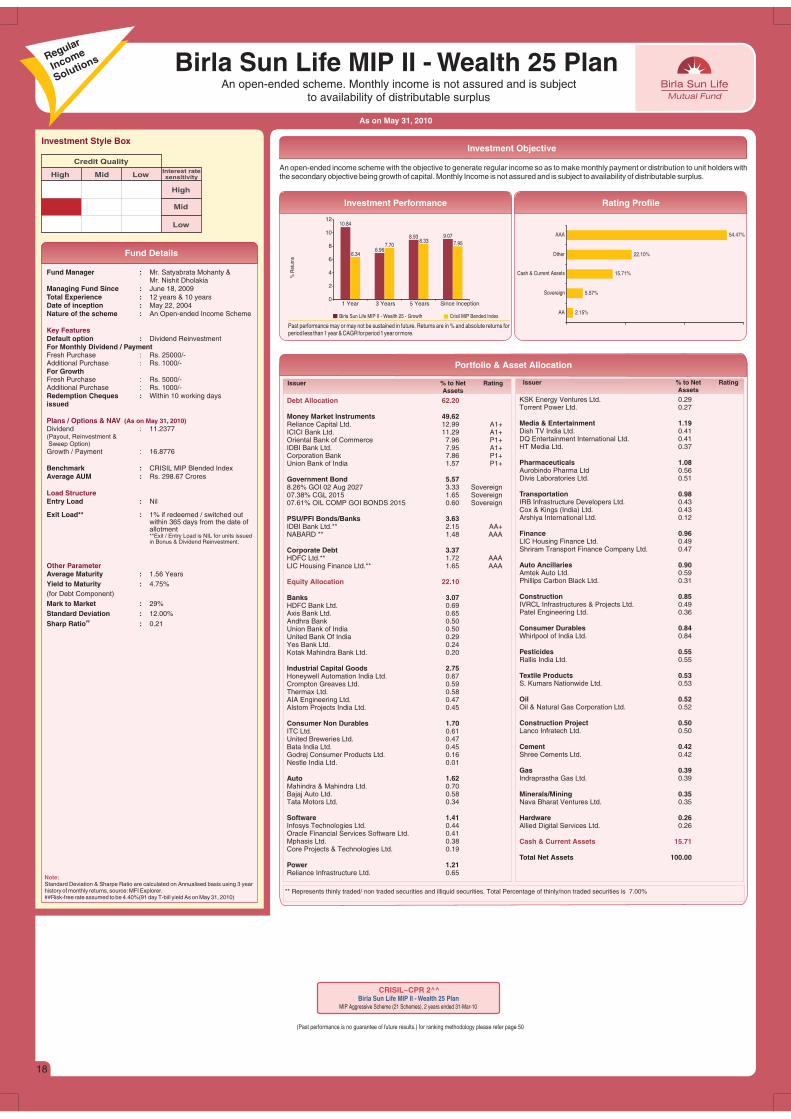
Birla Sun Life MIP II - Wealth 25 PlanAn open-ended scheme. Monthly income is not assured and is subject
to availability of distributable surplus
As on May 31, 2010
Investment Style Box
Credit Quality
High Mid Low Interest rate sensitivity
High
Mid
Low
Fund Manager :Mr. Nishit Dholakia
Managing Fund Since : June 18, 2009Total Experience : 12 years & 10 yearsDate of inception : May 22, 2004Nature of the scheme : An Open-ended Income Scheme
Default option : Dividend ReinvestmentFor Monthly Dividend / PaymentFresh Purchase : Rs. 25000/-Additional Purchase : Rs. 1000/-For GrowthFresh Purchase : Rs. 5000/-Additional Purchase : Rs. 1000/-Redemption Cheques : Within 10 working days issued
Dividend : 11.2377(Payout, Reinvestment & Sweep Option)Growth / Payment : 16.8776
Benchmark : CRISIL MIP Blended IndexAverage AUM : Rs. 298.67 Crores
Entry Load : Nil
Exit Load** : 1% if redeemed / switched out within 365 days from the date of allotment**Exit / Entry Load is NIL for units issued in Bonus & Dividend Reinvestment.
Average Maturity : 1.56 YearsYield to Maturity : 4.75%(for Debt Component)Mark to Market : 29%Standard Deviation : 12.00%
##Sharp Ratio : 0.21
Mr. Satyabrata Mohanty &
Key Features
Plans / Options & NAV
Load Structure
Other Parameter
(As on May 31, 2010)
An open-ended income scheme with the objective to generate regular income so as to make monthly payment or distribution to unit holders withthe secondary objective being growth of capital. Monthly Income is not assured and is subject to availability of distributable surplus.
Past performance may or may not be sustained in future. Returns are in % and absolute returns forperiod less than 1year &CAGRfor period 1year or more.
% R
etur
ns
Investment Performance Rating Profile
Birla Sun Life MIP II - Wealth 25 - Growth Crisil MIP Bended Index
Debt Allocation 62.20
Equity Allocation 22.10
Money Market Instruments 49.62Reliance Capital Ltd. 12.99 A1+ICICI Bank Ltd. 11.29 A1+Oriental Bank of Commerce 7.96 P1+IDBI Bank Ltd. 7.95 A1+Corporation Bank 7.86 P1+Union Bank of India 1.57 P1+
Government Bond 5.578.26% GOI 02 Aug 2027 3.33 Sovereign07.38% CGL 2015 1.65 Sovereign07.61% OIL COMP GOI BONDS 2015 0.60 Sovereign
PSU/PFI Bonds/Banks 3.63IDBI Bank Ltd.** 2.15 AA+NABARD ** 1.48 AAA
Corporate Debt 3.37HDFC Ltd.** 1.72 AAALIC Housing Finance Ltd.** 1.65 AAA
Banks 3.07HDFC Bank Ltd. 0.69Axis Bank Ltd. 0.65Andhra Bank 0.50Union Bank of India 0.50United Bank Of India 0.29Yes Bank Ltd. 0.24Kotak Mahindra Bank Ltd. 0.20
Industrial Capital Goods 2.75Honeywell Automation India Ltd. 0.67Crompton Greaves Ltd. 0.59Thermax Ltd. 0.58AIA Engineering Ltd. 0.47Alstom Projects India Ltd. 0.45
Consumer Non Durables 1.70ITC Ltd. 0.61United Breweries Ltd. 0.47Bata India Ltd. 0.45Godrej Consumer Products Ltd. 0.16Nestle India Ltd. 0.01
Auto 1.62Mahindra & Mahindra Ltd. 0.70Bajaj Auto Ltd. 0.58Tata Motors Ltd. 0.34
Software 1.41Infosys Technologies Ltd. 0.44Oracle Financial Services Software Ltd. 0.41Mphasis Ltd. 0.38Core Projects & Technologies Ltd. 0.19
Power 1.21Reliance Infrastructure Ltd. 0.65
KSK Energy Ventures Ltd. 0.29Torrent Power Ltd. 0.27
Media & Entertainment 1.19Dish TV India Ltd. 0.41DQ Entertainment International Ltd. 0.41HT Media Ltd. 0.37
Pharmaceuticals 1.08Aurobindo Pharma Ltd 0.56Divis Laboratories Ltd. 0.51
Transportation 0.98IRB Infrastructure Developers Ltd. 0.43Cox & Kings (India) Ltd. 0.43Arshiya International Ltd. 0.12
Finance 0.96LIC Housing Finance Ltd. 0.49Shriram Transport Finance Company Ltd. 0.47
Auto Ancillaries 0.90Amtek Auto Ltd. 0.59Phillips Carbon Black Ltd. 0.31
Construction 0.85IVRCL Infrastructures & Projects Ltd. 0.49Patel Engineering Ltd. 0.36
Consumer Durables 0.84Whirlpool of India Ltd. 0.84
Pesticides 0.55Rallis India Ltd. 0.55
Textile Products 0.53S. Kumars Nationwide Ltd. 0.53
Oil 0.52Oil & Natural Gas Corporation Ltd. 0.52
Construction Project 0.50Lanco Infratech Ltd. 0.50
Cement 0.42Shree Cements Ltd. 0.42
Gas 0.39Indraprastha Gas Ltd. 0.39
Minerals/Mining 0.35Nava Bharat Ventures Ltd. 0.35
Hardware 0.26Allied Digital Services Ltd. 0.26
Total Net Assets 100.00
Cash & Current Assets 15.71
Issuer % to Net RatingAssets
Issuer % to Net RatingAssets
Portfolio & Asset Allocation
Note:Standard Deviation & Sharpe Ratio are calculated on Annualised basis using 3 yearhistory of monthly returns, source: MFI Explorer.##Risk-free rate assumed to be 4.40%(91 day T-bill yield As on May 31, 2010)
** Represents thinly traded/ non traded securities and illiquid securities. Total Percentage of thinly/non traded securities is 7.00%
Regular
Income
Solutions
18
MIP Aggressive Scheme (21 Schemes), 2 years ended 31-Mar-10
Birla Sun Life MIP II - Wealth 25 PlanCRISIL~CPR 2^^
(Past performance is no guarantee of future results.) for ranking methodology please refer page 50
2.15%
5.57%
15.71%
22.10%
54.47%
AA
Sovereign
Cash & Current Assets
Other
AAA
10.84
6.96
8.93 9.07
6.34
7.708.33 7.95
0
2
4
6
8
10
12
1 Year 3 Years 5 Years Since Inception

Fund Details
Investment Objective
As on May 31, 2010
Birla Sun Life MIP II - Savings 5 PlanAn open-ended scheme. Monthly income is not assured and is subject
to availability of distributable surplus
Investment Style Box
Credit Quality
High Mid Low Interest rate sensitivity
High
Mid
Low
Fund Manager :Mr. Nishit Dholakia
Managing Fund Since : June 18, 2009Total Experience : 12 years & 10 yearsDate of inception : May 22, 2004Nature of the scheme : An Open-ended Income Scheme
Default option : Growth / Dividend ReinvestmentFor Monthly Dividend / PaymentFresh Purchase : Rs. 25000/-Additional Purchase : Rs. 1000/-For GrowthFresh Purchase : Rs. 5000/-Additional Purchase : Rs. 1000/-Redemption Cheques : Within 10 working days issuedSystematic Investment : AvailablePlan (SIP)Systematic Withdrawal : AvailablePlan (SWP)Systematic Transfer : AvailablePlan (STP)
Monthly Dividend : 11.2012(Payout, Reinvestment & Sweep Option)Monthly Payment / Growth : 16.6506
Benchmark : CRISIL MIP Blended IndexAverage AUM : Rs. 1,793.12 Crores
Entry Load : Nil
Exit Load** : 1% if redeemed / switched out within 365 days from the date of allotment**Exit / Entry Load is NIL for units issued in Bonus & Dividend Reinvestment.
Average Maturity : 1.66 YearsYield to Maturity : 6.00%(for Debt Component)Mark to Market : 30%Standard Deviation : 8.82%
##Sharp Ratio : 0.87
Mr. Satyabrata Mohanty &
Key Features
Plans / Options & NAV
Load Structure (Incl. for SIP)
Other Parameter
(As on May 31, 2010)
Note:
Standard Deviation & Sharpe Ratio are calculated on Annualised basis using 3 yearhistory of monthly returns, source: MFI Explorer.##Risk-free rate assumed to be 4.40%(91 day T-bill yield As on May 31, 2010)
An Open-ended income scheme with the objective to generate regular income so as to make monthly payment or distribution to unit holderswith the secondary objective being growth of capital. Monthly Income is not assured and is subject to availability of distributable surplus.
Past performance may or may not be sustained in future. Returns are in % and absolute returns forperiod less than 1 year & CAGR for period 1 year or more.
% R
etur
ns
Investment Performance Rating Profile
Birla Sun Life MIP II - Savings 5 - Growth Crisil MIP Bended Index
Debt Allocation 72.30
Equity Allocation 6.42
Money Market Instruments 46.35HDFC Bank Ltd. 12.11 A1+Bank of Baroda 10.00 A1+Indian Bank 5.38 P1+IDBI Bank Ltd. 4.62 A1+ICICI Bank Ltd. 4.15 A1+Reliance Capital Ltd. 3.61 A1+Federal Bank Ltd. 2.68 P1+Punjab National Bank 1.61 PR1+Corporation Bank 1.35 P1+Union Bank of India 0.81 P1+Oriental Bank of Commerce 0.03 P1+
Corporate Debt 12.13Reliance Utilities & Power Pvt. Ltd. ** 4.90 AAA(SO)LIC Housing Finance Ltd.** 3.79 AAATata Sons Ltd.** 1.69 AAAHDFC Ltd ** 1.22 AAAICICI Home Finance Company Ltd. ** 0.28 LAAAReliance Industries Ltd. ** 0.24 AAA
PSU/PFI Bonds/Banks 7.53Rural Electrification Corporation Ltd. ** 3.14 AAAPower Finance Corporation Ltd. ** 2.74 AAANABARD ** 0.84 AAAIndian Oil Corporation Ltd. ** 0.56 AAAIDBI Bank Ltd. ** 0.25 AA+
Government Bond 3.4808.20% CGL 2022 3.48 Sovereign
Floating Rate Instruments 2.82Power Finance Corporation Ltd. 2.82 AAA
Consumer Non Durables 1.26Asian Paints Ltd. 0.22Glaxosmithkline Consumer Healthcare Ltd. 0.19ITC Ltd. 0.14Godrej Consumer Products Ltd. 0.12Nestle India Ltd. 0.12Dabur India Ltd. 0.12Colgate-Palmolive (India) Ltd. 0.11Marico Ltd. 0.10ICI India Ltd. 0.10Procter&Gamble Hygiene&Health Care Ltd. 0.05
Finance 0.82LIC Housing Finance Ltd. 0.32Rural Electrification Corporation Ltd. 0.25CRISIL Ltd. 0.14Power Finance Corporation Ltd 0.12
Banks 0.62Allahabad Bank 0.21United Bank Of India 0.20Union Bank of India 0.20
Auto 0.54Bajaj Auto Ltd. 0.23Mahindra & Mahindra Ltd. 0.19Tata Motors Ltd. 0.12
Cement 0.42Orient Paper & Industries Ltd. 0.19Mangalam Cement Ltd. 0.14Birla Corporation Ltd. 0.08
Software 0.37Tata Consultancy Services Ltd. 0.15Polaris Software Lab Ltd. 0.12Infosys Technologies Ltd. 0.11
Pharmaceuticals 0.37Cadila Healthcare Ltd. 0.14Glaxosmithkline Pharmaceuticals Ltd. 0.12Wyeth Ltd. 0.11
Industrial Capital Goods 0.28Bharat Electronics Ltd. 0.12Thermax Ltd. 0.11Elecon Engineering Company Ltd. 0.06
Industrial Products 0.25Cummins (India) Ltd. 0.18Greaves Cotton Ltd. 0.07
Oil 0.21Oil & Natural Gas Corporation Ltd. 0.13Oil India Ltd 0.08
Non - Ferrous Metals 0.17Sterlite Industries (India) Ltd. 0.17
Gas 0.17Indraprastha Gas Ltd. 0.17
Minerals/Mining 0.14Nava Bharat Ventures Ltd. 0.14
Auto Ancillaries 0.13Phillips Carbon Black Ltd. 0.13
Ferrous Metals 0.11Maharashtra Seamless Ltd. 0.11
Transportation 0.11Gateway Distriparks Ltd. 0.11
Power 0.10Kalpataru Power Transmission Ltd. 0.10
Construction Project 0.10Voltas Ltd. 0.10
Media & Entertainment 0.10D.B. Corp Ltd. 0.09Jagran Prakashan Ltd. 0.01
Fertilisers 0.08Coromandel International Ltd. 0.08
Leisure Facilities 0.07Talwalkars Better Value Fitness Limited 0.07
Total Net Assets 100.00
Cash & Current Assets 21.28
Issuer % to Net RatingAssets
Issuer % to Net RatingAssets
Portfolio & Asset Allocation
���#
��Value Research RatingBirla Sun Life MIP II Savings 5 Plan
Hybrid: Monthly Income (34 Schemes),for 3 & 5 years periods ended 31-May-10
(Past performance is no guarantee of future results.) for ranking methodology please refer page 50
MIP Conservative schemes (11 Schemes), 2 years ended 31-Mar-10
Birla Sun Life MIP II Savings 5 PlanCRISIL~CPR 2^^
Regular
Income
Solutions
0.25%
3.48%
6.42%
21.28%
68.58%
AA
Sovereign
Other
Cash & Current Assets
AAA
19
** Represents thinly traded/ non traded securities and illiquid securities. Total Percentage of thinly/non traded securities is 19.65%
6.35
12.07
9.768.83
6.34
7.708.33 7.95
0
2
4
6
8
10
12
14
1 Year 3 Years 5 Years Since Inception

As on May 31, 2010
Birla Sun Life Tax Relief ‘96An open - ended Equity Linked Savings Scheme (ELSS) with a lock-in of 3 years
Fund Manager :Managing Fund Since : October 01,2006Total Experience : 15 yearsDate of inception : March 29, 1996Nature of the scheme : An Open-ended ELSS Scheme
Default option : Dividend PayoutFresh Purchase : Rs. 500/-Additional Purchase : Rs. 500/-Redemption Cheques : Within 10 working days issuedSystematic Investment : AvailablePlan (SIP)Systematic Withdrawal : Not Available Plan (SWP)Systematic Transfer : Not AvailablePlan (STP)
Dividend : 80.17(Payout, Reinvestment & Sweep)Growth (w.e.f. 06/03/08) : 10.82
Benchmark : BSE 200Average AUM : Rs. 1,370.00 Crores
Entry Load : Nil
Exit Load : Nil
Standard Deviation : 41.41%##Sharpe Ratio : 0.04
Beta : 1.05
Mr. Ajay Garg
Key Features
Plans / Options & NAV
Load Structure (Incl for SIP)
Other Parameter
(As on May 31, 2010)
Note:Standard Deviation, Sharpe Ratio & Beta are calculated on Annualised basis using 3 years history of monthly returns, source: MFI Explorer.##Risk-free rate assumed to be 4.40% (91 day T-bill yield As on May 31, 2010).
An open-ended equity linked savings scheme (ELSS) with the objective of long term growth of capital through a portfolio with a targetallocation of 80% equity, 20% debt and money market securities
Birla Sun Life Tax Relief ‘96 - Dividend BSE 200
% R
etur
ns
Past performance may or may not be sustained in future. Returns are in % and absolute returns for period less than 1 year & CAGR for period 1 year or more. Returns assume reinvestment of the tax free dividend declared.
SIP is a powerful tool that can help you create wealth over time. If you had invested in Birla Sun Life Tax Relief ‘96...
Date of First Installment : April 01, 1996The data assumes the investment of Rs.1,000/- on 1st day of every month or the subsequent working day. Load and Taxes are not considered for computation of returns. Past performance may or may not be sustained in future.*CAGR Returns are computed after accounting for the cash flow by using the XIRR method (investment internal rate of return)
Investment Period Total Investment(Rs.) Birla Sun Life
Tax Relief ‘96Birla Sun Life Tax
Relief ‘96BSE 200 BSE 200
Value (Rs.) of SIP in Returns (%)*
Since Inception 170000 650388 1901254 17.30 30.29
Last 5 years 60000 84983 88119 13.91 15.38
Last 3 years 36000 44542 46240 14.36 16.99
Last 1 year 12000 12773 13155 12.24 18.46
Issuer % to NetAssets
Issuer % to NetAssets
Issuer % to NetAssets
Banks 16.16State Bank of India 4.16ING Vysya Bank Ltd. 3.29Axis Bank Ltd. 3.22HDFC Bank Ltd. 2.47ICICI Bank Ltd. 2.27Kotak Mahindra Bank Ltd. 0.74
Power 8.86Reliance Infrastructure Ltd. 3.84Torrent Power Ltd. 2.77GVK Power & Infrastructure Ltd. 0.85KSK Energy Ventures Ltd. 0.81JSW Energy Ltd. 0.58
Industrial Capital Goods 8.63Honeywell Automation India Ltd. 3.57Bharat Heavy Electricals Ltd. 2.62Crompton Greaves Ltd. 1.57Bharat Bijlee Ltd. 0.51Siemens Ltd. 0.37
Software 8.12Infosys Technologies Ltd. 4.87Tata Consultancy Services Ltd. 1.94Wipro Ltd. 1.14Core Projects & Technologies Ltd. 0.17
Petroleum Products 7.18Reliance Industries Ltd. 7.18
Finance 6.91HDFC Ltd. 3.29
ICRA Ltd. 2.42India Infoline Ltd. 1.20
Ferrous Metals 5.82Jindal Steel & Power Ltd. 3.85Tata Steel Limited 1.97
Auto Ancillaries 5.54MRF Ltd. 2.47Bosch Ltd. 2.04Sundaram-Clayton Ltd. 1.03
Hotels 4.73Indian Hotels Company Ltd. 2.77Taj GVK Hotels & Resorts Ltd. 0.95Asian Hotels North Ltd. 0.40Vardhaman Hotels Ltd.** 0.31Chillwinds Hotels Ltd.** 0.31
Construction Project 4.27Larsen & Toubro Ltd. 4.27
Auto 3.51Maruti Suzuki India Ltd. 1.86Mahindra & Mahindra Ltd. 1.65
Non - Ferrous Metals 3.27Hindalco Industries Ltd. 1.97Sterlite Industries (India) Ltd. 1.30
Pesticides 3.15United Phosphorus Ltd. 1.91Rallis India Ltd. 1.24
Consumer Non Durables 3.13United Breweries Holdings Ltd. 1.44
United Spirits Ltd. 1.02Radico Khaitan Ltd. 0.67
Industrial Products 2.57Cummins (India) Ltd. 2.57
Pharmaceuticals 2.12Glaxosmithkline Pharmaceuticals Ltd. 2.12
Transportation 1.90Jet Airways India Ltd. 1.10Spicejet Ltd. 0.80
Construction 1.38Ackruti City Ltd. 0.96GMR Infrastructure Ltd. 0.42
Media & Entertainment 1.30Television Eighteen India Ltd. 1.30Magnasound India Ltd. ** #
United States of America 0.65Sterlite Industries (India) Ltd - Ads 0.65
Trading 0.30Uniphos Enterprises Ltd. 0.30
Cash & Cash Equivalents 0.67
Net receivables / payables -0.16
Total Net Assets 100.00
Total Percentage of thinly/non traded securities is 0.62%. # Indicates less than 0.01** Represents thinly traded/ non traded securities and illiquid securities.
Investment Objective
Systematic Investment Plan (SIP)
Investment Performance
Fund Details
Investment Style Box
Value Blend Growth Size
Large
Small
Investment Style
29.21
6.05
21.00
32.09
21.40
6.81
19.32
13.77
0
10
20
30
40
1 Year 3 Years 5 Years Since Inception
Tax
Saving
Solutions
Portfolio & Asset Allocation
Mid
20
World‘s Best Performing Equity Fund - Ranked by Lipper for 13 year Performance
Equity Funds, (3006 schemes) 13 Yrs Ended (30 Sept 2009)
Birla Sun Life Tax Relief ‘96 9
(Past performance is no guarantee of future results) For Lipper World Ranks for 1yr, 5yrs, 10yrs & 13 yrs Time Periods ended Sept '09 and Lipper Ranking Methodology and Disclaimer refer page no.50
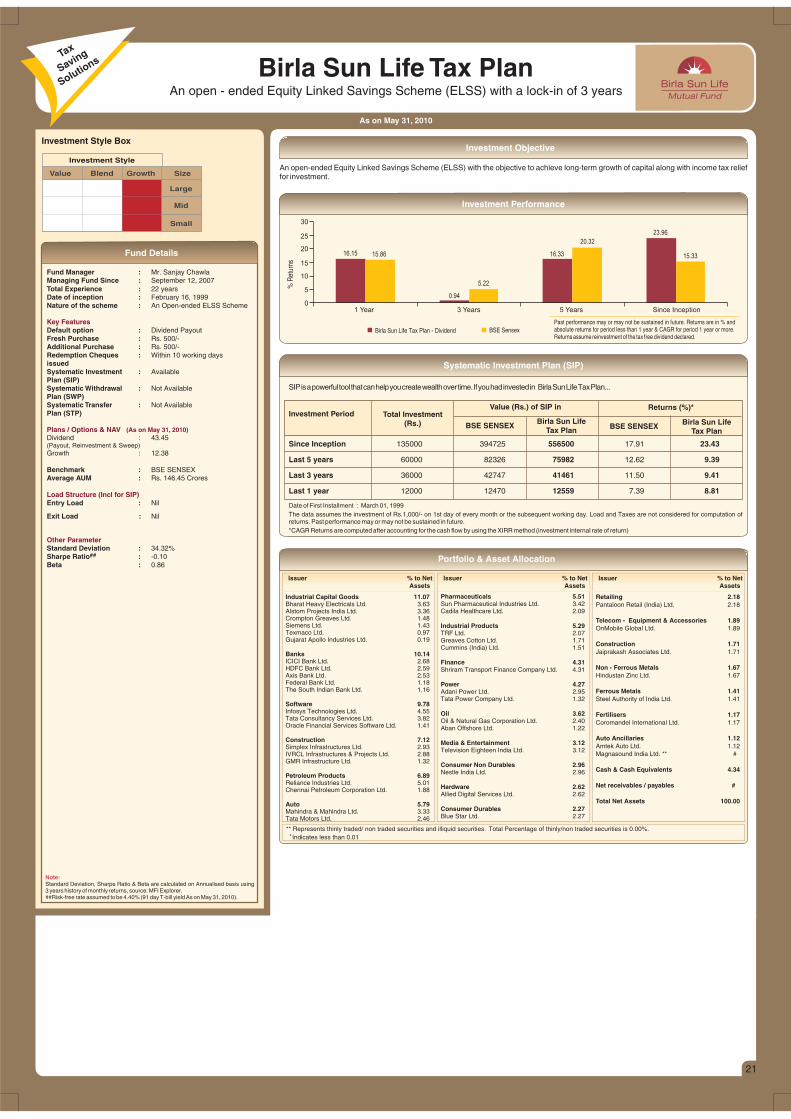
Fund Details
As on May 31, 2010
Birla Sun Life Tax PlanAn open - ended Equity Linked Savings Scheme (ELSS) with a lock-in of 3 years
Investment Style Box
Fund Manager :Managing Fund Since : September 12, 2007Total Experience : 22 yearsDate of inception : February 16, 1999Nature of the scheme : An Open-ended ELSS Scheme
Default option : Dividend PayoutFresh Purchase : Rs. 500/-Additional Purchase : Rs. 500/-Redemption Cheques : Within 10 working days issuedSystematic Investment : AvailablePlan (SIP)Systematic Withdrawal : Not Available Plan (SWP)Systematic Transfer : Not AvailablePlan (STP)
Dividend : 43.45(Payout, Reinvestment & Sweep)Growth : 12.38
Benchmark : BSE SENSEXAverage AUM : Rs. 146.45 Crores
Entry Load : Nil
Exit Load : Nil
Standard Deviation : 34.32%##Sharpe Ratio : -0.10
Beta : 0.86
Mr. Sanjay Chawla
Key Features
Plans / Options & NAV
Load Structure (Incl for SIP)
Other Parameter
(As on May 31, 2010)
Note:Standard Deviation, Sharpe Ratio & Beta are calculated on Annualised basis using 3 years history of monthly returns, source: MFI Explorer.##Risk-free rate assumed to be 4.40% (91 day T-bill yield As on May 31, 2010).
An open-ended Equity Linked Savings Scheme (ELSS) with the objective to achieve long-term growth of capital along with income tax relieffor investment.
Birla Sun Life Tax Plan - Dividend BSE Sensex
% R
etur
ns
Past performance may or may not be sustained in future. Returns are in % and absolute returns for period less than 1 year & CAGR for period 1 year or more. Returns assume reinvestment of the tax free dividend declared.
SIPisapowerfultoolthatcanhelpyoucreatewealthovertime.Ifyouhadinvestedin BirlaSunLifeTaxPlan...
Date of First Installment : March 01, 1999The data assumes the investment of Rs.1,000/- on 1st day of every month or the subsequent working day. Load and Taxes are not considered for computation ofreturns. Past performance may or may not be sustained in future.*CAGR Returns are computed after accounting for the cash flow by using the XIRR method (investment internal rate of return)
Investment Period Total Investment(Rs.) Birla Sun Life
Tax PlanBirla Sun Life
Tax PlanBSE SENSEX BSE SENSEX
Value (Rs.) of SIP in Returns (%)*
Since Inception 135000 394725 556500 17.91 23.43
Last 5 years 60000 82326 75982 12.62 9.39
Last 3 years 36000 42747 41461 11.50 9.41
Last 1 year 12000 12470 12559 7.39 8.81
Issuer % to NetAssets
Issuer % to NetAssets
Issuer % to NetAssets
Industrial Capital Goods 11.07Bharat Heavy Electricals Ltd. 3.63Alstom Projects India Ltd. 3.36Crompton Greaves Ltd. 1.48Siemens Ltd. 1.43Texmaco Ltd. 0.97Gujarat Apollo Industries Ltd. 0.19
Banks 10.14ICICI Bank Ltd. 2.68HDFC Bank Ltd. 2.59Axis Bank Ltd. 2.53Federal Bank Ltd. 1.18The South Indian Bank Ltd. 1.16
Software 9.78Infosys Technologies Ltd. 4.55Tata Consultancy Services Ltd. 3.82Oracle Financial Services Software Ltd. 1.41
Construction 7.12Simplex Infrastructures Ltd. 2.93IVRCL Infrastructures & Projects Ltd. 2.88GMR Infrastructure Ltd. 1.32
Petroleum Products 6.89Reliance Industries Ltd. 5.01Chennai Petroleum Corporation Ltd. 1.88
Auto 5.79Mahindra & Mahindra Ltd. 3.33Tata Motors Ltd. 2.46
Pharmaceuticals 5.51Sun Pharmaceutical Industries Ltd. 3.42Cadila Healthcare Ltd. 2.09
Industrial Products 5.29TRF Ltd. 2.07Greaves Cotton Ltd. 1.71Cummins (India) Ltd. 1.51
Finance 4.31Shriram Transport Finance Company Ltd. 4.31
Power 4.27Adani Power Ltd. 2.95Tata Power Company Ltd. 1.32
Oil 3.62Oil & Natural Gas Corporation Ltd. 2.40Aban Offshore Ltd. 1.22
Media & Entertainment 3.12Television Eighteen India Ltd. 3.12
Consumer Non Durables 2.96Nestle India Ltd. 2.96
Hardware 2.62Allied Digital Services Ltd. 2.62
Consumer Durables 2.27Blue Star Ltd. 2.27
Investment Performance
Portfolio & Asset Allocation
Total Percentage of thinly/non traded securities is 0.00%. # Indicates less than 0.01** Represents thinly traded/ non traded securities and illiquid securities.
Investment Objective
Portfolio & Asset Allocation
Retailing 2.18Pantaloon Retail (India) Ltd. 2.18
Telecom - Equipment & Accessories 1.89OnMobile Global Ltd. 1.89
Construction 1.71Jaiprakash Associates Ltd. 1.71
Non - Ferrous Metals 1.67Hindustan Zinc Ltd. 1.67
Ferrous Metals 1.41Steel Authority of India Ltd. 1.41
Fertilisers 1.17Coromandel International Ltd. 1.17
Auto Ancillaries 1.12Amtek Auto Ltd. 1.12Magnasound India Ltd. ** #
Cash & Cash Equivalents 4.34
Net receivables / payables #
Total Net Assets 100.00
Systematic Investment Plan (SIP)
Tax
Saving
Solutions
Value Blend Growth Size
Large
Mid
Small
Investment Style
21
16.15
0.94
16.33
23.96
15.86
5.22
20.32
15.33
0
5
10
15
20
25
30
1 Year 3 Years 5 Years Since Inception

Fund Details
Fund Manager :Managing Fund Since : November 17, 2005Total Experience : 20 yearsDate of inception : August 27, 1998Nature of the scheme : An Open-ended Growth Scheme
Default option : Dividend ReinvestmentFresh Purchase : Rs. 5000/-Additional Purchase : Rs. 1000/-Redemption Cheques : Within 10 working days issuedSystematic Investment : AvailablePlan (SIP)Systematic Withdrawal : AvailablePlan (SWP)Systematic Transfer : AvailablePlan (STP)
Dividend : 69.49( )Growth : 247.12
Benchmark : BSE 200Average AUM : Rs. 1,142.36 Crores
Entry Load : Nil
Exit Load** : 1% if redeemed / switched out within 365 days from the date of allotment**Exit / Entry Load is NIL for units issued in Bonus & Dividend
Reinvestment.
Standard Deviation : 36.74%##Sharpe Ratio : 0.07
Beta : 0.93
Mr. Mahesh Patil
Payout, Reinvestment & Sweep
Key Features
Plans / Options & NAV
Load Structure (Incl for SIP)
Other Parameter
(As on May 31, 2010)
Note:Standard Deviation, Sharpe Ratio & Beta are calculated on Annualised basis using 3 years history of monthly returns, source: MFI Explorer##Risk-free rate assumed to be 4.40% (91 day T-bill yield As on May 31, 2010)
Value Blend Growth Size
Large
Mid
Small
Investment Style
Investment Style Box
As on May 31, 2010
An open-ended growth scheme with the objective of long term growth of capital, through a portfolio with a target allocation of 90% equity and10% debt and money market securities.
Investment Objective
Banks 14.85State Bank of India 3.27HDFC Bank Ltd. 2.31Axis Bank Ltd. 2.26ICICI Bank Ltd. 2.03Bank of Baroda 1.86Yes Bank Ltd. 1.33The South Indian Bank Ltd. 1.07Union Bank of India 0.72
Power 9.21GVK Power & Infrastructure Ltd. 1.83KEC International Ltd. 1.82Tata Power Company Ltd. 1.74CESC Ltd. 1.65PTC India Ltd 1.10Reliance Infrastructure Ltd. 1.07
Software 8.99Infosys Technologies Ltd. 3.41Tata Consultancy Services Ltd. 2.63Polaris Software Lab Ltd. 1.86MindTree Ltd. 0.71Megasoft Ltd. 0.38
Industrial Capital Goods 8.09Thermax Ltd. 3.36Crompton Greaves Ltd. 2.47Bharat Heavy Electricals Ltd. 1.52Bharat Bijlee Ltd. 0.75
Auto 5.63Tata Motors Ltd. 3.19Maruti Suzuki India Ltd. 1.35Bajaj Auto Ltd. 1.09
Construction Project 5.31Nagarjuna Construction Company Ltd. 1.69Lanco Infratech Ltd. 1.68Gammon India Ltd. 1.05
Larsen & Toubro Ltd. 0.89
Consumer Non Durables 5.11ITC Ltd. 3.31United Breweries Holdings Ltd. 1.80
Finance 4.33Rural Electrification Corporation Ltd. 1.79India Infoline Ltd. 1.04Shriram Transport Finance Company Ltd. 0.95HDFC Ltd. 0.55
Media & Entertainment 4.32Zee Entertainment Enterprises Ltd. 1.51Jagran Prakashan Ltd. 1.44DQ Entertainment International Ltd. 1.04Balaji Telefilms Ltd. 0.32Magnasound India Ltd. ** #
Pharmaceuticals 4.19Dr.Reddy's Laboratories Ltd. 2.60Aurobindo Pharma Ltd 1.57Maestro Mediline Systems Ltd. 0.02
Oil 3.61Oil & Natural Gas Corporation Ltd. 3.61
Retailing 3.10Pantaloon Retail (India) Ltd. 2.83Pantaloon Retail (India) Ltd. -Class B 0.27
Petroleum Products 2.89Reliance Industries Ltd. 2.89
Transportation 2.65Cox & Kings (India) Ltd. 1.35Spicejet Ltd. 1.30
Cement 2.56Century Textiles and Industries Ltd. 1.57
Grasim Industries Ltd. 0.78Samruddhi Cement Ltd.** 0.21
Hardware 1.69Allied Digital Services Ltd. 1.69
Construction 1.63Ackruti City Ltd. 0.99GMR Infrastructure Ltd. 0.64
Ferrous Metals 1.26Usha Martin Ltd. 0.83Tata Steel Limited 0.44
United States of America 1.23Sterlite Industries (India) Ltd - Ads 1.23
Telecom-Services 1.03Bharti Airtel Ltd. 1.03
Non - Ferrous Metals 0.95Hindalco Industries Ltd. 0.66Sterlite Industries (India) Ltd. 0.30
Industrial Products 0.82Max India Ltd. 0.82
Pesticides 0.23United Phosphorus Ltd. 0.23
Future and Options -1.71Tata Steel Ltd. Futures June 10 0.44CNX Nifty Futures June 10 -2.15
Cash & Cash Equivalents 4.59
Net receivables / payables 3.43
Total Net Assets 100.00
Issuer % to NetAssets
Issuer % to NetAssets
Issuer % to NetAssets
Portfolio & Asset Allocation
Total Percentage of thinly/non traded securities is 0.21%. # Indicates less than 0.01** Represents thinly traded/ non traded securities and illiquid securities.
Systematic Investment Plan (SIP)
SIP is a powerful tool that can help you create wealth over time. If you had invested in Birla Sun Life Equity Fund...
Date of First Installment : October 01, 1998The data assumes the investment of Rs.1,000/- on 1st day of every month or the subsequent working day. Load and Taxes are not considered for computation of returns. Past performance may or may not be sustained in future.*CAGR Returns are computed after accounting for the cash flow by using the XIRR method (investment internal rate of return)
Since Inception 140000 467185 809826 19.26 27.70
Last 5 years 60000 84978 89244 13.91 15.90
Last 3 years 36000 44538 45576 14.35 15.96
Last 1 year 12000 12768 12955 12.16 15.18
Investment Period Total Investment(Rs.) Birla Sun Life
Equity FundBirla Sun LifeEquity Fund
BSE 200 BSE 200
Value (Rs.) of SIP in Returns (%)*
Birla Sun Life Equity Fund - Growth BSE 200
% R
etur
ns
Past performance may or may not be sustained in future. Returns are in % and absolute returns for period less than 1 year & CAGR for period 1 year or more.
Investment Performance
Birla Sun Life Equity FundWealth
Creation
Solutions
22
26.45
6.88
22.27
31.33
21.40
6.81
19.32 18.08
0
5
10
15
20
25
30
35
1 Year 3 Years 5 Years Since Inception

Fund Details
Investment Objective
As on May 31, 2010
Birla Sun Life Advantage Fund
Value Blend Growth Size
Large
Mid
Small
Investment Style
Investment Style Box
Fund Manager :Managing Fund Since : Aug 05. 2009Total Experience : 16 yearsDate of inception : February 24, 1995Nature of the scheme : An Open-ended Growth Scheme
Default option : Dividend ReinvestmentFresh Purchase : Rs. 5000/-Additional Purchase : Rs. 1000/-Redemption Cheques : Within 10 working days issuedSystematic Investment : AvailablePlan (SIP)Systematic Withdrawal : AvailablePlan (SWP)Systematic Transfer : AvailablePlan (STP)
Dividend : 86.87(Payout, Reinvestment & Sweep)Growth : 148.43
Benchmark : BSE SENSEXAverage AUM : Rs. 394.47 Crores
Entry Load : Nil
Exit Load** : 0.50% if redeemed / switched out within 7 days from the date of allotment**Exit / Entry Load is NIL for units issued in Bonus & Dividend Reinvestment.
Standard Deviation : 38.29%##Sharpe Ratio : -0.01
Beta : 0.96
Mr. Ajay Argal
Key Features
Plans / Options & NAV
Load Structure (Incl for SIP)
Other Parameter
(As on May 31, 2010)
Note:Standard Deviation, Sharpe Ratio & Beta are calculated on Annualised basis using 3 years history of monthly returns, source: MFI Explorer##Risk-free rate assumed to be 4.40% (91 day T-bill yield As on May 31, 2010)
An open-ended growth scheme with the objective to achieve long-term growth of capital at relatively moderate levels of risk through adiversified research based investment approach.
Investment Performance
Birla Sun Life Advantage Fund - Growth BSE Sensex
% R
etur
ns
Past performance may or may not be sustained in future. Returns are in % and absolute returns for period less than 1 year & CAGR for period 1 year or more.
SIP is a powerful tool that can help you create wealth over time. If you had invested in Birla Sun Life Advantage Fund...
Systematic Investment Plan (SIP)
Date of First Installment : March 01, 1995The data assumes the investment of Rs.1,000/- on 1st day of every month or the subsequent working day. Load and Taxes are not considered for computation of returns. Past performance may or may not be sustained in future.*CAGR Returns are computed after accounting for the cash flow by using the XIRR method (investment internal rate of return)
Investment Period Total Investment(Rs.) Birla Sun Life
Advantage FundBirla Sun Life
Advantage FundBSE SENSEX BSE SENSEX
Value (Rs.) of SIP in Returns (%)*
Since Inception 183000 633353 1208099 14.86 22.05
Last 5 years 60000 82326 80843 12.62 11.89
Last 3 years 36000 42747 44314 11.50 14.00
Last 1 year 12000 12470 12709 7.39 11.21
Issuer % to NetAssets
Issuer % to NetAssets
Issuer % to NetAssets
Banks 13.35HDFC Bank Ltd. 2.96ICICI Bank Ltd. 2.85Yes Bank Ltd. 2.47State Bank of India 2.21ING Vysya Bank Ltd. 1.84The South Indian Bank Ltd. 1.02
Software 11.96Infosys Technologies Ltd. 5.22Polaris Software Lab Ltd. 2.19Tata Consultancy Services Ltd. 2.14Mphasis Ltd. 1.16MindTree Ltd. 1.04Core Projects & Technologies Ltd. 0.21
Industrial Capital Goods 8.10Bharat Heavy Electricals Ltd. 3.51Thermax Ltd. 2.64Bharat Electronics Ltd. 1.95
Pharmaceuticals 7.45Dishman Pharmaceuticals & Chemicals Ltd. 2.41Biocon Ltd. 1.86Cipla Ltd. 1.61Pfizer Ltd. 1.57
Construction Project 6.80Larsen & Toubro Ltd. 2.55Voltas Ltd. 2.14Nagarjuna Construction Company Ltd. 2.11
Construction 6.14IVRCL Infrastructures & Projects Ltd. 1.91Sobha Developers Ltd. 1.75GMR Infrastructure Ltd. 1.33Unitech Ltd. 1.05Dharti Dredging and Infrastructure Ltd** 0.09
Petroleum Products 5.55Reliance Industries Ltd. 5.55
Consumer Non Durables 5.12ITC Ltd. 4.11United Spirits Ltd. 1.01
Auto Ancillaries 4.85Exide Industries Ltd. 2.21Amtek Auto Ltd. 1.94Apollo Tyres Ltd. 0.70
Auto 4.66Tata Motors Ltd. 3.76Mahindra & Mahindra Ltd. 0.90
Transportation 4.05IL&FS Transportation Networks Ltd 2.22Spicejet Ltd. 1.83
Oil 3.16Oil & Natural Gas Corporation Ltd. 3.16
Portfolio & Asset Allocation
** Represents thinly traded/ non traded securities and illiquid securities. Total Percentage of thinly/non traded securities is 0.09% # Indicates less than 0.01
Gas 2.87GAIL India Ltd. 2.87
Finance 2.69HDFC Ltd. 1.81LIC Housing Finance Ltd. 0.88Ferrous Metals 2.51Jindal Steel & Power Ltd. 1.67Welspun Corp Ltd 0.84
Telecom-Services 2.39Bharti Airtel Ltd. 2.39
Power 1.81KEC International Ltd. 1.81
Media & Entertainment 0.90Jagran Prakashan Ltd. 0.90
Non - Ferrous Metals 0.69Sterlite Industries (India) Ltd. 0.69
IT Consulting & Services 0.00Karrox Technologies Ltd ** #
Cash & Cash Equivalents 4.86
Net receivables / payables 0.12
Total Net Assets 100.00
Wealth
Creation
Solutions
23
20.39
4.05
17.28
20.79
15.86
5.22
20.32
11.05
0
5
10
15
20
25
1 Year 3 Years 5 Years Since Inception
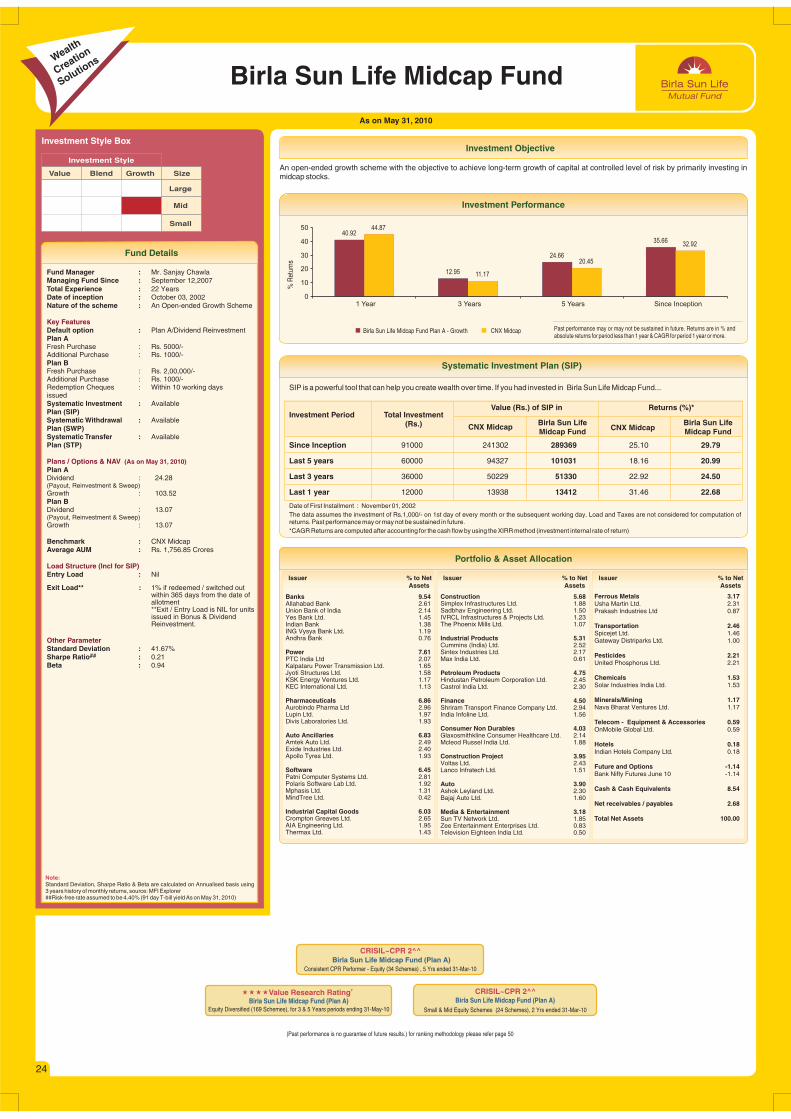
Fund Details
As on May 31, 2010
Investment Objective
Birla Sun Life Midcap Fund
Value Blend Growth Size
Large
Mid
Small
Investment Style
Investment Style Box
Fund Manager :Managing Fund Since : September 12,2007Total Experience : 22 YearsDate of inception : October 03, 2002Nature of the scheme : An Open-ended Growth Scheme
Default option : Plan A/Dividend ReinvestmentPlan AFresh Purchase : Rs. 5000/-Additional Purchase : Rs. 1000/-Plan BFresh Purchase : Rs. 2,00,000/-Additional Purchase : Rs. 1000/-Redemption Cheques : Within 10 working days issuedSystematic Investment : AvailablePlan (SIP)Systematic Withdrawal : AvailablePlan (SWP)Systematic Transfer : AvailablePlan (STP)
Plan ADividend : 24.28( )Growth : 103.52Plan BDividend : 13.07(Payout, Reinvestment & Sweep)Growth : 13.07
Benchmark : CNX MidcapAverage AUM : Rs. 1,756.85 Crores
Entry Load : Nil
Exit Load** : 1% if redeemed / switched out within 365 days from the date of allotment**Exit / Entry Load is NIL for units issued in Bonus & Dividend Reinvestment.
Standard Deviation : 41.67%##Sharpe Ratio : 0.21
Beta : 0.94
Mr. Sanjay Chawla
Payout, Reinvestment & Sweep
Key Features
Plans / Options & NAV
Load Structure (Incl for SIP)
Other Parameter
(As on May 31, 2010)
Note:Standard Deviation, Sharpe Ratio & Beta are calculated on Annualised basis using 3 years history of monthly returns, source: MFI Explorer##Risk-free rate assumed to be % (91 day T-bill yield As on May 31, 2010)4.40
Investment Performance
Birla Sun Life Midcap Fund - GrowthPlan A CNX Midcap
% R
etur
ns
Past performance may or may not be sustained in future. Returns are in % and absolute returns for period less than 1 year & CAGR for period 1 year or more.
SIP is a powerful tool that can help you create wealth over time. If you had invested in Birla Sun Life Midcap Fund...
Systematic Investment Plan (SIP)
Date of First Installment : November 01, 2002The data assumes the investment of Rs.1,000/- on 1st day of every month or the subsequent working day. Load and Taxes are not considered for computation of returns. Past performance may or may not be sustained in future.*CAGR Returns are computed after accounting for the cash flow by using the XIRR method (investment internal rate of return)
Investment Period Total Investment(Rs.) Birla Sun Life
Midcap FundBirla Sun LifeMidcap Fund
CNX Midcap CNX Midcap
Value (Rs.) of SIP in Returns (%)*
Since Inception 91000 241302 289369 25.10 29.79
Last 5 years 60000 94327 101031 18.16 20.99
Last 3 years 36000 50229 51330 22.92 24.50
Last 1 year 12000 13938 13412 31.46 22.68
Issuer % to NetAssets
Issuer % to NetAssets
Issuer % to NetAssets
Banks 9.54Allahabad Bank 2.61Union Bank of India 2.14Yes Bank Ltd. 1.45Indian Bank 1.38ING Vysya Bank Ltd. 1.19Andhra Bank 0.76
Power 7.61PTC India Ltd 2.07Kalpataru Power Transmission Ltd. 1.65Jyoti Structures Ltd. 1.58KSK Energy Ventures Ltd. 1.17KEC International Ltd. 1.13
Pharmaceuticals 6.86Aurobindo Pharma Ltd 2.96Lupin Ltd. 1.97Divis Laboratories Ltd. 1.93
Auto Ancillaries 6.83Amtek Auto Ltd. 2.49Exide Industries Ltd. 2.40Apollo Tyres Ltd. 1.93
Software 6.45Patni Computer Systems Ltd. 2.81Polaris Software Lab Ltd. 1.92Mphasis Ltd. 1.31MindTree Ltd. 0.42
Industrial Capital Goods 6.03Crompton Greaves Ltd. 2.65AIA Engineering Ltd. 1.95Thermax Ltd. 1.43
Construction 5.68Simplex Infrastructures Ltd. 1.88Sadbhav Engineering Ltd. 1.50IVRCL Infrastructures & Projects Ltd. 1.23The Phoenix Mills Ltd. 1.07
Industrial Products 5.31Cummins (India) Ltd. 2.52Sintex Industries Ltd. 2.17Max India Ltd. 0.61
Petroleum Products 4.75Hindustan Petroleum Corporation Ltd. 2.45Castrol India Ltd. 2.30
Finance 4.50Shriram Transport Finance Company Ltd. 2.94India Infoline Ltd. 1.56
Consumer Non Durables 4.03Glaxosmithkline Consumer Healthcare Ltd. 2.14Mcleod Russel India Ltd. 1.88
Construction Project 3.95Voltas Ltd. 2.43Lanco Infratech Ltd. 1.51
Auto 3.90Ashok Leyland Ltd. 2.30Bajaj Auto Ltd. 1.60
Media & Entertainment 3.18Sun TV Network Ltd. 1.85Zee Entertainment Enterprises Ltd. 0.83Television Eighteen India Ltd. 0.50
Ferrous Metals 3.17Usha Martin Ltd. 2.31Prakash Industries Ltd 0.87
Transportation 2.46Spicejet Ltd. 1.46Gateway Distriparks Ltd. 1.00
Pesticides 2.21United Phosphorus Ltd. 2.21
Chemicals 1.53Solar Industries India Ltd. 1.53
Minerals/Mining 1.17Nava Bharat Ventures Ltd. 1.17
Telecom - Equipment & Accessories 0.59OnMobile Global Ltd. 0.59
Hotels 0.18Indian Hotels Company Ltd. 0.18
Future and Options -1.14Bank Nifty Futures June 10 -1.14
Cash & Cash Equivalents 8.54
Net receivables / payables 2.68
Total Net Assets 100.00
Portfolio & Asset Allocation
An open-ended growth scheme with the objective to achieve long-term growth of capital at controlled level of risk by primarily investing in midcap stocks.
Wealth
Creation
Solutions
(Past performance is no guarantee of future results.) for ranking methodology please refer page 50
CRISIL~CPR 2^^Birla Sun Life Midcap Fund (Plan A)
Small & Mid Equity Schemes ( Schemes), 2 24 Yrs ended 31-Mar-10
����#Value Research Rating
Birla Sun Life Midcap Fund (Plan A)Equity Diversified (169 Schemes), for 3 & 5 Years periods ending 31-May-10
24
CRISIL~CPR 2^^Birla Sun Life Midcap Fund (Plan A)
Consistent CPR Performer - Equity (34 Schemes) , 5 Yrs ended 31-Mar-10
40.92
12.95
24.66
35.66
44.87
11.17
20.45
32.92
0
10
20
30
40
50
1 Year 3 Years 5 Years Since Inception
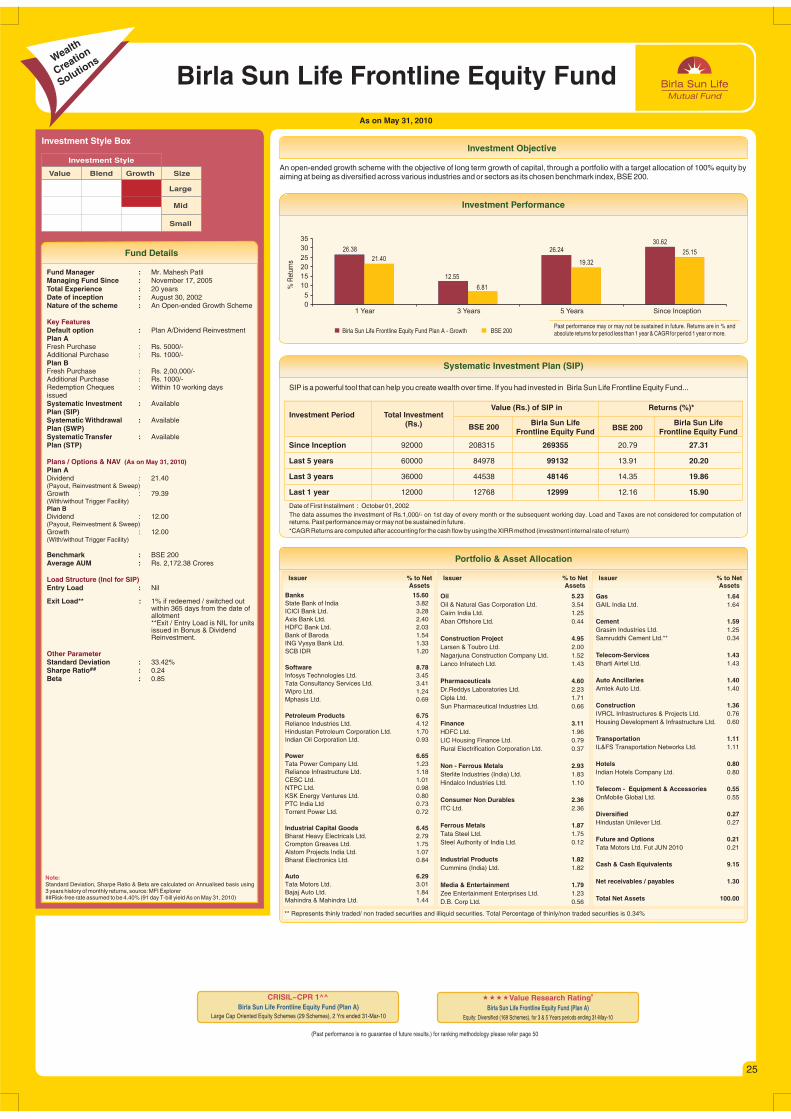
Fund Details
Investment Objective
Birla Sun Life Frontline Equity Fund
As on May 31, 2010
An open-ended growth scheme with the objective of long term growth of capital, through a portfolio with a target allocation of 100% equity byaiming at being as diversified across various industries and or sectors as its chosen benchmark index, BSE 200.
Investment Performance
Birla Sun Life Frontline Equity Fund Plan A - Growth BSE 200
% R
etur
ns
Past performance may or may not be sustained in future. Returns are in % and absolute returns for period less than 1 year & CAGR for period 1 year or more.
SIP is a powerful tool that can help you create wealth over time. If you had invested in Birla Sun Life Frontline Equity Fund...
Systematic Investment Plan (SIP)
Date of First Installment : October 01, 2002The data assumes the investment of Rs.1,000/- on 1st day of every month or the subsequent working day. Load and Taxes are not considered for computation of returns. Past performance may or may not be sustained in future.*CAGR Returns are computed after accounting for the cash flow by using the XIRR method (investment internal rate of return)
Investment Period Total Investment(Rs.) Birla Sun Life
Frontline Equity FundBirla Sun Life
Frontline Equity FundBSE 200 BSE 200
Value (Rs.) of SIP in Returns (%)*
Since Inception 92000 208315 269355 20.79 27.31
Last 5 years 60000
Last 3 years 36000 44538 48146 14.35 19.86
Last 1 year 12000 12768 12999 12.16 15.90
84978 99132 13.91 20.20
Issuer % to NetAssets
Issuer % to NetAssets
Issuer % to NetAssets
Banks 15.60State Bank of India 3.82ICICI Bank Ltd. 3.28Axis Bank Ltd. 2.40HDFC Bank Ltd. 2.03Bank of Baroda 1.54ING Vysya Bank Ltd. 1.33SCB IDR 1.20
Software 8.78Infosys Technologies Ltd. 3.45Tata Consultancy Services Ltd. 3.41Wipro Ltd. 1.24Mphasis Ltd. 0.69
Petroleum Products 6.75Reliance Industries Ltd. 4.12Hindustan Petroleum Corporation Ltd. 1.70Indian Oil Corporation Ltd. 0.93
Power 6.65Tata Power Company Ltd. 1.23Reliance Infrastructure Ltd. 1.18CESC Ltd. 1.01NTPC Ltd. 0.98KSK Energy Ventures Ltd. 0.80PTC India Ltd 0.73Torrent Power Ltd. 0.72
Industrial Capital Goods 6.45Bharat Heavy Electricals Ltd. 2.79Crompton Greaves Ltd. 1.75Alstom Projects India Ltd. 1.07Bharat Electronics Ltd. 0.84
Auto 6.29Tata Motors Ltd. 3.01Bajaj Auto Ltd. 1.84Mahindra & Mahindra Ltd. 1.44
Oil 5.23Oil & Natural Gas Corporation Ltd. 3.54Cairn India Ltd. 1.25Aban Offshore Ltd. 0.44
Construction Project 4.95Larsen & Toubro Ltd. 2.00Nagarjuna Construction Company Ltd. 1.52Lanco Infratech Ltd. 1.43
Pharmaceuticals 4.60Dr.Reddys Laboratories Ltd. 2.23Cipla Ltd. 1.71Sun Pharmaceutical Industries Ltd. 0.66
Finance 3.11HDFC Ltd. 1.96LIC Housing Finance Ltd. 0.79Rural Electrification Corporation Ltd. 0.37
Non - Ferrous Metals 2.93Sterlite Industries (India) Ltd. 1.83Hindalco Industries Ltd. 1.10
Consumer Non Durables 2.36ITC Ltd. 2.36
Ferrous Metals 1.87Tata Steel Ltd. 1.75Steel Authority of India Ltd. 0.12
Industrial Products 1.82Cummins (India) Ltd. 1.82
Media & Entertainment 1.79Zee Entertainment Enterprises Ltd. 1.23D.B. Corp Ltd. 0.56
Gas 1.64GAIL India Ltd. 1.64
Cement 1.59Grasim Industries Ltd. 1.25Samruddhi Cement Ltd.** 0.34
Telecom-Services 1.43Bharti Airtel Ltd. 1.43
Auto Ancillaries 1.40Amtek Auto Ltd. 1.40
Construction 1.36IVRCL Infrastructures & Projects Ltd. 0.76Housing Development & Infrastructure Ltd. 0.60
Transportation 1.11IL&FS Transportation Networks Ltd. 1.11
Hotels 0.80Indian Hotels Company Ltd. 0.80
Telecom - Equipment & Accessories 0.55OnMobile Global Ltd. 0.55
Diversified 0.27Hindustan Unilever Ltd. 0.27
Future and Options 0.21Tata Motors Ltd. Fut JUN 2010 0.21
Cash & Cash Equivalents 9.15
Net receivables / payables 1.30
Total Net Assets 100.00
Portfolio & Asset Allocation
(Past performance is no guarantee of future results.) for ranking methodology please refer page 50
CRISIL~CPR 1^^ ����V #alue Research RatingBirla Sun Life Frontline Equity Fund (Plan A)
Equity: Diversified (169 Schemes), for 3 & 5 Years periods ending 31-May-10
Value Blend Growth Size
Large
Mid
Small
Investment Style
Investment Style Box
Fund Manager :Managing Fund Since :Total Experience : 20 yearsDate of inception : August 30, 2002Nature of the scheme : An Open-ended Growth Scheme
Default option : Plan A/Dividend ReinvestmentPlan AFresh Purchase : Rs. 5000/-Additional Purchase : Rs. 1000/-Plan BFresh Purchase : Rs. 2,00,000/-Additional Purchase : Rs. 1000/-Redemption Cheques : Within 10 working days issuedSystematic Investment : AvailablePlan (SIP)Systematic Withdrawal : AvailablePlan (SWP)Systematic Transfer : AvailablePlan (STP)
Plan ADividend : 21.40( )Growth : 79.39(With/without Trigger Facility)Plan BDividend : 12.00(Payout, Reinvestment & Sweep)Growth : 12.00(With/without Trigger Facility)
Benchmark : BSE 200Average AUM : Rs. 2,172.38 Crores
Entry Load : Nil
Exit Load** : 1% if redeemed / switched out within 365 days from the date of allotment**Exit / Entry Load is NIL for units issued in Bonus & Dividend Reinvestment.
Standard Deviation : 33.42%##Sharpe Ratio : 0.24
Beta : 0.85
Mr. Mahesh PatilNovember 17, 2005
Payout, Reinvestment & Sweep
Key Features
Plans / Options & NAV
Load Structure (Incl for SIP)
Other Parameter
(As on May 31, 2010)
Note:Standard Deviation, Sharpe Ratio & Beta are calculated on Annualised basis using 3 years history of monthly returns, source: MFI Explorer##Risk-free rate assumed to be % (91 day T-bill yield As on May 31, 2010)4.40
Wealth
Creation
Solutions
25
Birla Sun Life Frontline Equity Fund (Plan A)
Large Cap Oriented Equity Schemes (29 Schemes), 2 Yrs ended 31-Mar-10
** Represents thinly traded/ non traded securities and illiquid securities. Total Percentage of thinly/non traded securities is 0.34%
26.38
12.55
26.2430.62
21.40
6.81
19.32
25.15
0
5
10
15
20
25
30
35
1 Year 3 Years 5 Years Since Inception
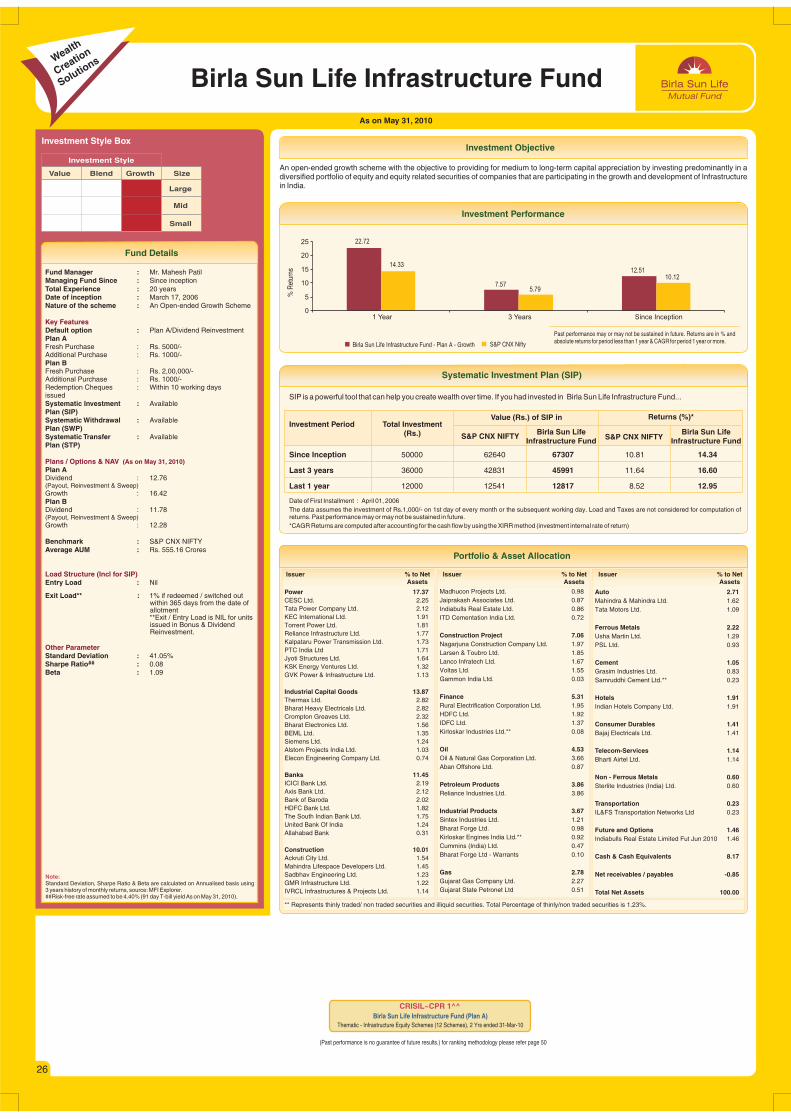
Fund Details
Investment Objective
As on May 31, 2010
Birla Sun Life Infrastructure Fund
Value Blend Growth Size
Large
Mid
Small
Investment Style
Investment Style Box
Fund Manager :Managing Fund Since : Since inceptionTotal Experience : 20 yearsDate of inception : March 17, 2006Nature of the scheme : An Open-ended Growth Scheme
Default option : Plan A/Dividend ReinvestmentPlan AFresh Purchase : Rs. 5000/-Additional Purchase : Rs. 1000/-Plan BFresh Purchase : Rs. 2,00,000/-Additional Purchase : Rs. 1000/-Redemption Cheques : Within 10 working days issuedSystematic Investment : AvailablePlan (SIP)Systematic Withdrawal : AvailablePlan (SWP)Systematic Transfer : AvailablePlan (STP)
Plan ADividend : 12.76( )Growth : 16.42Plan BDividend : 11.78(Payout, Reinvestment & Sweep)Growth : 12.28
Benchmark : S&P CNX NIFTYAverage AUM : Rs. 555.16 Crores
Entry Load : Nil
Exit Load** : 1% if redeemed / switched out within 365 days from the date of allotment**Exit / Entry Load is NIL for units issued in Bonus & Dividend Reinvestment.
Standard Deviation : 41.05%##Sharpe Ratio : 0.08
Beta : 1.09
Mr. Mahesh Patil
Payout, Reinvestment & Sweep
Key Features
Plans / Options & NAV
Load Structure (Incl for SIP)
Other Parameter
(As on May 31, 2010)
Note:Standard Deviation, Sharpe Ratio & Beta are calculated on Annualised basis using 3 years history of monthly returns, source: MFI Explorer.##Risk-free rate assumed to be % (91 day T-bill yield As on May 31, 2010).4.40
An open-ended growth scheme with the objective to providing for medium to long-term capital appreciation by investing predominantly in adiversified portfolio of equity and equity related securities of companies that are participating in the growth and development of Infrastructurein India.
Investment Performance
Birla Sun Life Infrastructure Fund - Plan A - Growth S&P CNX Nifty
% R
etur
ns
Past performance may or may not be sustained in future. Returns are in % and absolute returns for period less than 1 year & CAGR for period 1 year or more.
SIP is a powerful tool that can help you create wealth over time. If you had invested in Birla Sun Life Infrastructure Fund...
Systematic Investment Plan (SIP)
Date of First Installment : April 01, 2006The data assumes the investment of Rs.1,000/- on 1st day of every month or the subsequent working day. Load and Taxes are not considered for computation of returns. Past performance may or may not be sustained in future.*CAGR Returns are computed after accounting for the cash flow by using the XIRR method (investment internal rate of return)
Investment Period Total Investment(Rs.) Birla Sun Life
Infrastructure FundBirla Sun Life
Infrastructure FundS&P CNX NIFTY S&P CNX NIFTY
Value (Rs.) of SIP in Returns (%)*
Since Inception 50000 62640 67307 10.81 14.34
Last 3 years 36000 42831 45991 11.64 16.60
Last 1 year 12000 12541 12817 8.52 12.95
Issuer % to NetAssets
Issuer % to NetAssets
Issuer % to NetAssets
Power 17.37CESC Ltd. 2.25Tata Power Company Ltd. 2.12KEC International Ltd. 1.91Torrent Power Ltd. 1.81Reliance Infrastructure Ltd. 1.77Kalpataru Power Transmission Ltd. 1.73PTC India Ltd 1.71Jyoti Structures Ltd. 1.64KSK Energy Ventures Ltd. 1.32GVK Power & Infrastructure Ltd. 1.13
Industrial Capital Goods 13.87Thermax Ltd. 2.82Bharat Heavy Electricals Ltd. 2.82Crompton Greaves Ltd. 2.32Bharat Electronics Ltd. 1.56BEML Ltd. 1.35Siemens Ltd. 1.24Alstom Projects India Ltd. 1.03Elecon Engineering Company Ltd. 0.74
Banks 11.45ICICI Bank Ltd. 2.19Axis Bank Ltd. 2.12Bank of Baroda 2.02HDFC Bank Ltd. 1.82The South Indian Bank Ltd. 1.75United Bank Of India 1.24Allahabad Bank 0.31
Construction 10.01Ackruti City Ltd. 1.54Mahindra Lifespace Developers Ltd. 1.45Sadbhav Engineering Ltd. 1.23GMR Infrastructure Ltd. 1.22IVRCL Infrastructures & Projects Ltd. 1.14
Madhucon Projects Ltd. 0.98Jaiprakash Associates Ltd. 0.87Indiabulls Real Estate Ltd. 0.86ITD Cementation India Ltd. 0.72
Construction Project 7.06Nagarjuna Construction Company Ltd. 1.97Larsen & Toubro Ltd. 1.85Lanco Infratech Ltd. 1.67Voltas Ltd. 1.55Gammon India Ltd. 0.03
Finance 5.31Rural Electrification Corporation Ltd. 1.95HDFC Ltd. 1.92IDFC Ltd. 1.37Kirloskar Industries Ltd.** 0.08
Oil 4.53Oil & Natural Gas Corporation Ltd. 3.66Aban Offshore Ltd. 0.87
Petroleum Products 3.86Reliance Industries Ltd. 3.86
Industrial Products 3.67Sintex Industries Ltd. 1.21Bharat Forge Ltd. 0.98Kirloskar Engines India Ltd.** 0.92Cummins (India) Ltd. 0.47Bharat Forge Ltd - Warrants 0.10
Gas 2.78Gujarat Gas Company Ltd. 2.27Gujarat State Petronet Ltd 0.51
Auto 2.71Mahindra & Mahindra Ltd. 1.62Tata Motors Ltd. 1.09
Ferrous Metals 2.22Usha Martin Ltd. 1.29PSL Ltd. 0.93
Cement 1.05Grasim Industries Ltd. 0.83Samruddhi Cement Ltd.** 0.23
Hotels 1.91Indian Hotels Company Ltd. 1.91
Consumer Durables 1.41Bajaj Electricals Ltd. 1.41
Telecom-Services 1.14Bharti Airtel Ltd. 1.14
Non - Ferrous Metals 0.60Sterlite Industries (India) Ltd. 0.60
Transportation 0.23IL&FS Transportation Networks Ltd 0.23
Future and Options 1.46Indiabulls Real Estate Limited Fut Jun 2010 1.46
Cash & Cash Equivalents 8.17
Net receivables / payables -0.85
Total Net Assets 100.00
Portfolio & Asset Allocation
Wealth
Creation
Solutions
26
** Represents thinly traded/ non traded securities and illiquid securities. Total Percentage of thinly/non traded securities is 1.23%.
CRISIL~CPR 1^^Birla Sun Life Infrastructure Fund (Plan A)
Thematic - Infrastructure Equity Schemes (12 Schemes), 2 Yrs ended 31-Mar-10
(Past performance is no guarantee of future results.) for ranking methodology please refer page 50
22.72
7.57
12.5114.33
5.79
10.12
0
5
10
15
20
25
1 Year 3 Years Since Inception

Fund Details
Investment Objective
As on May 31, 2010
Birla Sun Life Basic Industries Fund
Value Blend Growth Size
Large
Mid
Small
Investment Style
Investment Style Box
Fund Manager :Managing Fund Since : November 30,2007Total Experience : 11 yearsDate of inception : January 15, 2000Nature of the scheme : An Open-ended Growth Scheme
Default option : Dividend ReinvestmentFresh Purchase : Rs. 5000/-Additional Purchase : Rs. 1000/-Redemption Cheques : Within 10 working days issuedSystematic Investment : AvailablePlan (SIP)Systematic Withdrawal : AvailablePlan (SWP)Systematic Transfer : AvailablePlan (STP)
Dividend : 29.08(Payout, Reinvestment & Sweep)
@Dividend Trigger Plan : 10.46Growth : 96.91
Benchmark : BSE 200Average AUM : Rs. 136.79 Crores
Entry Load : Nil
Exit Load** : 1.00% if redeemed / switched out within 365 days from the date of allotment**Exit / Entry Load is NIL for units issued in Bonus & Dividend Reinvestment.
Standard Deviation : 39.80%##Sharpe Ratio : 0.14
Beta : 0.99
Mr. Ankit Sancheti
Key Features
Plans / Options & NAV
Load Structure (Incl for SIP)
Other Parameter
(As on May 31, 2010)
Note:Standard Deviation, Sharpe Ratio & Beta are calculated on Annualised basis using 3 years history of monthly returns, source: MFI Explorer.##Risk-free rate assumed to be % (91 day T-bill yield As on May 31, 2010).@No fresh purchases/additional purchases/switch-in(s) shall be accepted in DividendTrigger Plan(DTP) with effect from May 28, 2010.Unitholders under DTP are given an option to either redeem their investments orswitch their investments to any open ended scheme of Birla Sun Life Mutual Fund, within the period starting from June 01, 2010 till the close of business hours on June30, 2010 at the applicable NAV, without payment of any exit load and those who donot exercise the any of the option shall be automatically converted under DividendPlan (Payout Facility) at the applicable NAV of June 30, 2010. For further details,please refer addendum dated May 27, 2010 available on website of Mutual Fund orany of the Investor Services Centres
4.40
A multi-sector open-ended growth scheme with the objective of long term growth capital, through a portfolio with a target allocation of 100%equity, focusing on investing in companies sensitive to economic cycles and commodity pricing cycles. The investments will be in companieswhich are often referred to as cyclical companies.
Investment Performance
Birla Sun Life Basic Industries Fund - Growth BSE 200
% R
etur
ns
Past performance may or may not be sustained in future. Returns are in % and absolute returns for period less than 1 year & CAGR for period 1 year or more.
SIP is a powerful tool that can help you create wealth over time. If you had invested in Birla Sun Life Basic Industries Fund...
Systematic Investment Plan (SIP)
Date of First Installment : March 01, 2000The data assumes the investment of Rs.1,000/- on 1st day of every month or the subsequent working day. Load and Taxes are not considered for computation of returns. Past performance may or may not be sustained in future.*CAGR Returns are computed after accounting for the cash flow by using the XIRR method (investment internal rate of return)
Investment Period Total Investment(Rs.) Birla Sun Life Basic
Industries FundBirla Sun Life Basic
Industries FundBSE 200 BSE 200
Value (Rs.) of SIP in Returns (%)*
Since Inception 123000 374107 586942 20.52 28.60
Last 5 years 60000 84978 89277 13.91 15.91
Last 3 years 36000 44538 44680 14.35 17.66
Last 1 year 12000 12768 13121 12.16 17.89
Issuer % to NetAssets
Issuer % to NetAssets
Issuer % to NetAssets
Industrial Capital Goods 16.37Crompton Greaves Ltd. 2.87Apar Industries Ltd. 2.72McNally Bharat Engineering Company Ltd 2.52Bharat Heavy Electricals Ltd. 2.42Bharat Electronics Ltd. 2.23Siemens Ltd. 1.83Titagarh Wagons Ltd 0.73Texmaco Ltd. 0.62Gujarat Apollo Industries Ltd. 0.43
Power 11.38Jyoti Structures Ltd. 2.00Torrent Power Ltd. 1.86Kalpataru Power Transmission Ltd. 1.70Tata Power Company Ltd. 1.66Reliance Infrastructure Ltd. 1.66PTC India Ltd 1.42KEC International Ltd. 1.08
Banks 8.23ICICI Bank Ltd. 2.01Federal Bank Ltd. 1.97Axis Bank Ltd. 1.77The Jammu And Kashmir Bank Ltd 1.35HDFC Bank Ltd. 1.13
Construction Project 7.47Voltas Ltd. 2.17Larsen & Toubro Ltd. 2.11Nagarjuna Construction Company Ltd. 1.62Lanco Infratech Ltd. 1.57
Auto 7.00Tata Motors Ltd. 2.74Bajaj Auto Ltd. 2.62Mahindra & Mahindra Ltd. 1.65
Petroleum Products 5.82Reliance Industries Ltd. 4.28Chennai Petroleum Corporation Ltd. 1.55
Industrial Products 5.58Carborundum Universal Ltd. 1.90TRF Ltd. 1.49Cummins (India) Ltd. 1.26ESAB India Ltd. 0.94
Finance 5.10HDFC Ltd. 2.26Shriram Transport Finance Company Ltd. 2.04India Infoline Ltd. 0.80
Construction 5.96The Phoenix Mills Ltd. 1.42IVRCL Infrastructures & Projects Ltd. 1.38Jaiprakash Associates Ltd. 1.22Simplex Infrastructures Ltd. 1.11GMR Infrastructure Ltd. 0.83
Ferrous Metals 4.05Jindal Steel & Power Ltd. 1.80Maharashtra Seamless Ltd. 1.21PSL Ltd. 1.04
Auto Ancillaries 3.40Exide Industries Ltd. 1.71Amtek Auto Ltd. 1.68
Transportation 2.74The Great Eastern Shipping Company Ltd. 1.43IL&FS Transportation Networks Ltd. 1.31
Oil 2.52Oil & Natural Gas Corporation Ltd. 2.52
Gas 2.42GAIL India Ltd. 1.56Gujarat State Petronet Ltd 0.85
Consumer Durables 1.75Bajaj Electricals Ltd. 1.75
Non - Ferrous Metals 1.52Sterlite Industries (India) Ltd. 1.52
Minerals/Mining 0.63Gujarat NRE Coke Ltd 0.60Gujarat NRE Coke Ltd Class B Shares 0.03
Cash & Cash Equivalents 6.61
Net receivables / payables 1.44
Total Net Assets 100.00
Portfolio & Asset Allocation
Wealth
Creation
Solutions
27
CRISIL~CPR 1^^Birla Sun Life Basic Industries Fund (Plan A)
Thematic - Infrastructure Equity Schemes (12 Schemes), 2 Yrs ended 31-Mar-10
(Past performance is no guarantee of future results.) for ranking methodology please refer page 50
27.70
9.93
20.92
24.4621.40
6.81
19.32
12.42
0
5
10
15
20
25
30
1 Year 3 Years 5 Years Since Inception
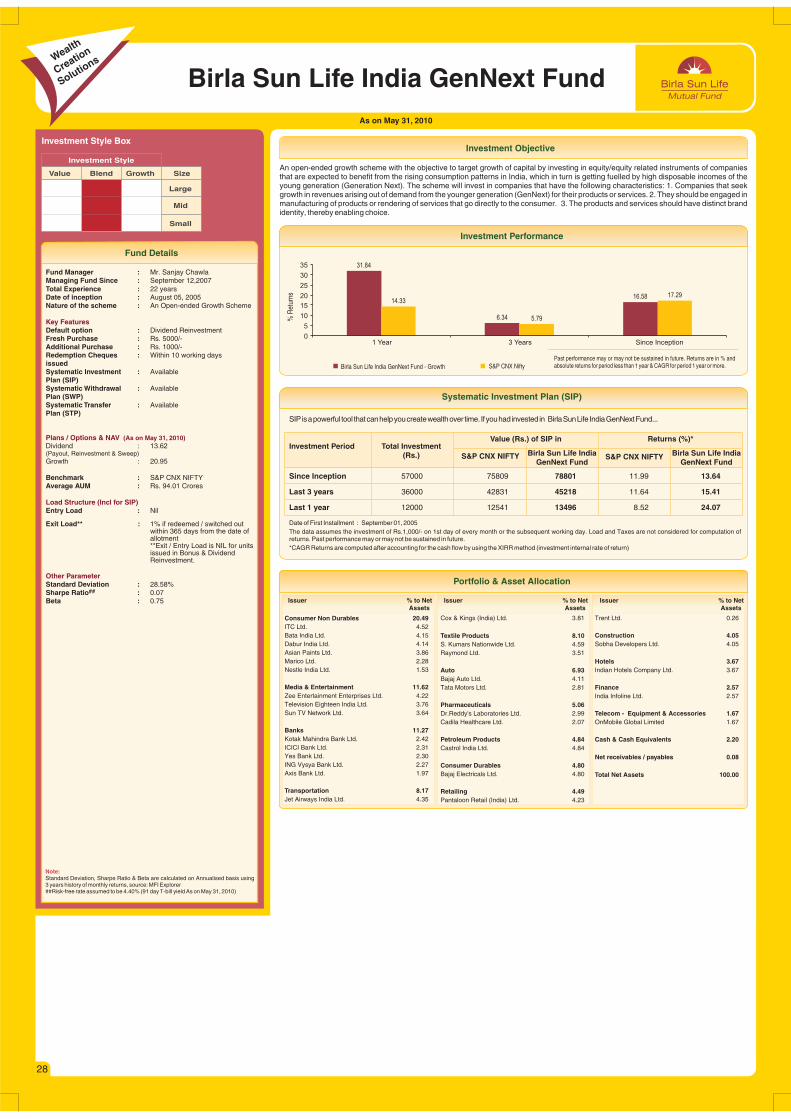
Fund Details
Investment Objective
Birla Sun Life India GenNext FundAs on May 31, 2010
Value Blend Growth Size
Large
Mid
Small
Investment Style
Investment Style Box
Fund Manager :Managing Fund Since : September 12,2007Total Experience : 22 yearsDate of inception : August 05, 2005Nature of the scheme : An Open-ended Growth Scheme
Default option : Dividend ReinvestmentFresh Purchase : Rs. 5000/-Additional Purchase : Rs. 1000/-Redemption Cheques : Within 10 working days issuedSystematic Investment : AvailablePlan (SIP)Systematic Withdrawal : AvailablePlan (SWP)Systematic Transfer : AvailablePlan (STP)
Dividend : 13.62(Payout, Reinvestment & Sweep)Growth : 20.95
Benchmark : S&P CNX NIFTYAverage AUM : Rs. 94.01 Crores
Entry Load : Nil
Exit Load** : 1% if redeemed / switched out within 365 days from the date of allotment**Exit / Entry Load is NIL for units issued in Bonus & Dividend Reinvestment.
Standard Deviation : 28.58%##Sharpe Ratio : 0.07
Beta : 0.75
Mr. Sanjay Chawla
Key Features
Plans / Options & NAV
Load Structure (Incl for SIP)
Other Parameter
(As on May 31, 2010)
Note:Standard Deviation, Sharpe Ratio & Beta are calculated on Annualised basis using 3 years history of monthly returns, source: MFI Explorer##Risk-free rate assumed to be % (91 day T-bill yield As on May 31, 2010)4.40
An open-ended growth scheme with the objective to target growth of capital by investing in equity/equity related instruments of companiesthat are expected to benefit from the rising consumption patterns in India, which in turn is getting fuelled by high disposable incomes of theyoung generation (Generation Next). The scheme will invest in companies that have the following characteristics: 1. Companies that seekgrowth in revenues arising out of demand from the younger generation (GenNext) for their products or services. 2. They should be engaged inmanufacturing of products or rendering of services that go directly to the consumer. 3. The products and services should have distinct brandidentity, thereby enabling choice.
Investment Performance
Birla Sun Life India GenNext Fund - Growth S&P CNX Nifty
% R
etur
ns
Past performance may or may not be sustained in future. Returns are in % and absolute returns for period less than 1 year & CAGR for period 1 year or more.
SIPisapowerful tool thatcanhelpyoucreatewealthover time. Ifyouhadinvested in BirlaSunLife IndiaGenNextFund...
Systematic Investment Plan (SIP)
Date of First Installment : September 01, 2005The data assumes the investment of Rs.1,000/- on 1st day of every month or the subsequent working day. Load and Taxes are not considered for computation of returns. Past performance may or may not be sustained in future.*CAGR Returns are computed after accounting for the cash flow by using the XIRR method (investment internal rate of return)
Investment Period Total Investment(Rs.) Birla Sun Life India
GenNext FundBirla Sun Life India
GenNext FundS&P CNX NIFTY S&P CNX NIFTY
Value (Rs.) of SIP in Returns (%)*
Since Inception 57000 75809 78801 11.99 13.64
Last 3 years 36000 42831 45218 11.64 15.41
Last 1 year 12000 12541 13496 8.52 24.07
Issuer % to NetAssets
Issuer % to NetAssets
Issuer % to NetAssets
Consumer Non Durables 20.49ITC Ltd. 4.52Bata India Ltd. 4.15Dabur India Ltd. 4.14Asian Paints Ltd. 3.86Marico Ltd. 2.28Nestle India Ltd. 1.53
Media & Entertainment 11.62Zee Entertainment Enterprises Ltd. 4.22Television Eighteen India Ltd. 3.76Sun TV Network Ltd. 3.64
Banks 11.27Kotak Mahindra Bank Ltd. 2.42ICICI Bank Ltd. 2.31Yes Bank Ltd. 2.30ING Vysya Bank Ltd. 2.27Axis Bank Ltd. 1.97
Transportation 8.17Jet Airways India Ltd. 4.35
Cox & Kings (India) Ltd. 3.81
Textile Products 8.10S. Kumars Nationwide Ltd. 4.59Raymond Ltd. 3.51
Auto 6.93Bajaj Auto Ltd. 4.11Tata Motors Ltd. 2.81
Pharmaceuticals 5.06Dr.Reddy's Laboratories Ltd. 2.99Cadila Healthcare Ltd. 2.07
Petroleum Products 4.84Castrol India Ltd. 4.84
Consumer Durables 4.80Bajaj Electricals Ltd. 4.80
Retailing 4.49Pantaloon Retail (India) Ltd. 4.23
Trent Ltd. 0.26
Construction 4.05Sobha Developers Ltd. 4.05
Hotels 3.67Indian Hotels Company Ltd. 3.67
Finance 2.57India Infoline Ltd. 2.57
Telecom - Equipment & Accessories 1.67OnMobile Global Limited 1.67
Cash & Cash Equivalents 2.20
Net receivables / payables 0.08
Total Net Assets 100.00
Portfolio & Asset Allocation
Wealth
Creation
Solutions
31.84
6.34
16.5814.33
5.79
17.29
0
5
10
15
20
25
30
35
1 Year 3 Years Since Inception
28
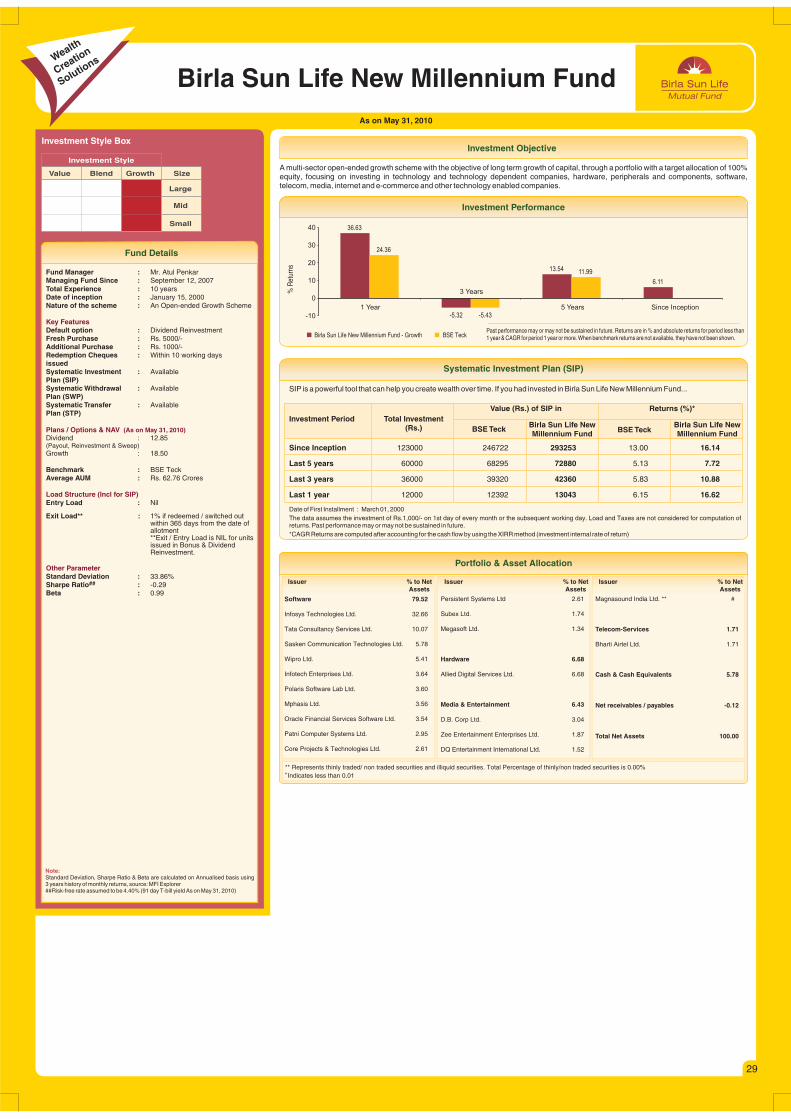
Fund Details
As on May 31, 2010
Investment Objective
Birla Sun Life New Millennium Fund
Value Blend Growth Size
Large
Mid
Small
Investment Style
Investment Style Box
Fund Manager :Managing Fund Since : September 12, 2007Total Experience : 10 yearsDate of inception : January 15, 2000Nature of the scheme : An Open-ended Growth Scheme
Default option : Dividend ReinvestmentFresh Purchase : Rs. 5000/-Additional Purchase : Rs. 1000/-Redemption Cheques : Within 10 working days issuedSystematic Investment : AvailablePlan (SIP)Systematic Withdrawal : AvailablePlan (SWP)Systematic Transfer : AvailablePlan (STP)
Dividend : 12.85(Payout, Reinvestment & Sweep)Growth : 18.50
Benchmark : BSE TeckAverage AUM : Rs. 62.76 Crores
Entry Load : Nil
Exit Load** : 1% if redeemed / switched out within 365 days from the date of allotment**Exit / Entry Load is NIL for units issued in Bonus & Dividend Reinvestment.
Standard Deviation : 33.86%##Sharpe Ratio : -0.29
Beta : 0.99
Mr. Atul Penkar
Key Features
Plans / Options & NAV
Load Structure (Incl for SIP)
Other Parameter
(As on May 31, 2010)
A multi-sector open-ended growth scheme with the objective of long term growth of capital, through a portfolio with a target allocation of 100%equity, focusing on investing in technology and technology dependent companies, hardware, peripherals and components, software,telecom, media, internet and e-commerce and other technology enabled companies.
Investment Performance
% R
etur
ns
Birla Sun Life New Millennium Fund - Growth BSE TeckPast performance may or may not be sustained in future. Returns are in % and absolute returns for period less than1 year & CAGR for period 1 year or more. When benchmark returns are not available, they have not been shown.
SIP is a powerful tool that can help you create wealth over time. If you had invested in Birla Sun Life New Millennium Fund...
Systematic Investment Plan (SIP)
Date of First Installment : March 01, 2000The data assumes the investment of Rs.1,000/- on 1st day of every month or the subsequent working day. Load and Taxes are not considered for computation of returns. Past performance may or may not be sustained in future.*CAGR Returns are computed after accounting for the cash flow by using the XIRR method (investment internal rate of return)
Investment Period Total Investment(Rs.) Birla Sun Life New
Millennium FundBirla Sun Life NewMillennium Fund
BSE Teck BSE Teck
Value (Rs.) of SIP in Returns (%)*
Since Inception 123000 246722 293253 13.00 16.14
Last 5 years 60000 68295 72880 5.13 7.72
Last 3 years 36000 39320 42360 5.83 10.88
Last 1 year 12000 12392 13043 6.15 16.62
Issuer % to NetAssets
Issuer % to NetAssets
Issuer % to NetAssets
Software 79.52
Infosys Technologies Ltd. 32.66
Tata Consultancy Services Ltd. 10.07
Sasken Communication Technologies Ltd. 5.78
Wipro Ltd. 5.41
Infotech Enterprises Ltd. 3.64
Polaris Software Lab Ltd. 3.60
Mphasis Ltd. 3.56
Oracle Financial Services Software Ltd. 3.54
Patni Computer Systems Ltd. 2.95
Core Projects & Technologies Ltd. 2.61
Persistent Systems Ltd 2.61
Subex Ltd. 1.74
Megasoft Ltd. 1.34
Hardware 6.68
Allied Digital Services Ltd. 6.68
Media & Entertainment 6.43
D.B. Corp Ltd. 3.04
Zee Entertainment Enterprises Ltd. 1.87
DQ Entertainment International Ltd. 1.52
Portfolio & Asset Allocation
Magnasound India Ltd. ** #
Telecom-Services 1.71
Bharti Airtel Ltd. 1.71
Cash & Cash Equivalents 5.78
Net receivables / payables -0.12
Total Net Assets 100.00
Note:Standard Deviation, Sharpe Ratio & Beta are calculated on Annualised basis using 3 years history of monthly returns, source: MFI Explorer##Risk-free rate assumed to be % (91 day T-bill yield As on May 31, 2010)4.40
Wealth
Creation
Solutions
** Represents thinly traded/ non traded securities and illiquid securities. Total Percentage of thinly/non traded securities is 0.00%# Indicates less than 0.01
29
36.63
-5.32
13.54
6.11
24.36
-5.43
11.99
-10
0
10
20
30
40
1 Year
3 Years
5 Years Since Inception
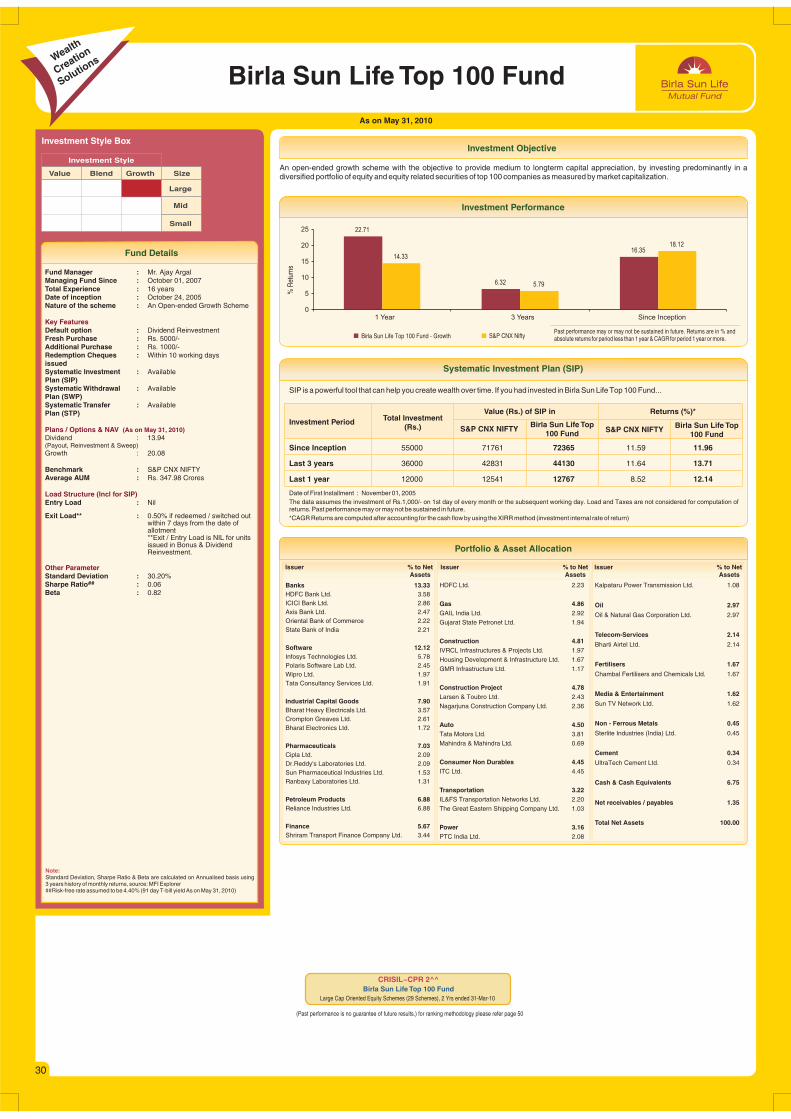
Fund Details
As on May 31, 2010
Investment Objective
Birla Sun Life Top 100 Fund
Value Blend Growth Size
Large
Mid
Small
Investment Style
Investment Style Box
Fund Manager :Managing Fund Since : October 01, 2007Total Experience : 16 yearsDate of inception : October 24, 2005Nature of the scheme : An Open-ended Growth Scheme
Default option : Dividend ReinvestmentFresh Purchase : Rs. 5000/-Additional Purchase : Rs. 1000/-Redemption Cheques : Within 10 working days issuedSystematic Investment : AvailablePlan (SIP)Systematic Withdrawal : AvailablePlan (SWP)Systematic Transfer : AvailablePlan (STP)
Dividend : 13.94(Payout, Reinvestment & Sweep)Growth : 20.08
Benchmark : S&P CNX NIFTYAverage AUM : Rs. 347.98 Crores
Entry Load : Nil
Exit Load** : 0.50% if redeemed / switched out within 7 days from the date of allotment**Exit / Entry Load is NIL for units issued in Bonus & Dividend Reinvestment.
Standard Deviation : 30.20%##Sharpe Ratio : 0.06
Beta : 0.82
Mr. Ajay Argal
Key Features
Plans / Options & NAV
Load Structure (Incl for SIP)
Other Parameter
(As on May 31, 2010)
An open-ended growth scheme with the objective to provide medium to longterm capital appreciation, by investing predominantly in adiversified portfolio of equity and equity related securities of top 100 companies as measured by market capitalization.
Investment Performance
Birla Sun Life Top 100 Fund - Growth S&P CNX Nifty
% R
etur
ns
Past performance may or may not be sustained in future. Returns are in % and absolute returns for period less than 1 year & CAGR for period 1 year or more.
SIP is a powerful tool that can help you create wealth over time. If you had invested in Birla Sun Life Top 100 Fund...
Systematic Investment Plan (SIP)
Date of First Installment : November 01, 2005The data assumes the investment of Rs.1,000/- on 1st day of every month or the subsequent working day. Load and Taxes are not considered for computation ofreturns. Past performance may or may not be sustained in future.*CAGR Returns are computed after accounting for the cash flow by using the XIRR method (investment internal rate of return)
Investment Period Total Investment(Rs.) Birla Sun Life Top
100 FundBirla Sun Life Top
100 FundS&P CNX NIFTY S&P CNX NIFTY
Value (Rs.) of SIP in Returns (%)*
Since Inception 55000 71761 72365 11.59 11.96
Last 3 years 36000 42831 44130 11.64 13.71
Last 1 year 12000 12541 12767 8.52 12.14
Issuer % to NetAssets
Issuer % to NetAssets
Issuer % to NetAssets
Banks 13.33HDFC Bank Ltd. 3.58ICICI Bank Ltd. 2.86Axis Bank Ltd. 2.47Oriental Bank of Commerce 2.22State Bank of India 2.21
Software 12.12Infosys Technologies Ltd. 5.78Polaris Software Lab Ltd. 2.45Wipro Ltd. 1.97Tata Consultancy Services Ltd. 1.91
Industrial Capital Goods 7.90Bharat Heavy Electricals Ltd. 3.57Crompton Greaves Ltd. 2.61Bharat Electronics Ltd. 1.72
Pharmaceuticals 7.03Cipla Ltd. 2.09Dr.Reddy's Laboratories Ltd. 2.09Sun Pharmaceutical Industries Ltd. 1.53Ranbaxy Laboratories Ltd. 1.31
Petroleum Products 6.88Reliance Industries Ltd. 6.88
Finance 5.67Shriram Transport Finance Company Ltd. 3.44
HDFC Ltd. 2.23
Gas 4.86GAIL India Ltd. 2.92
Gujarat State Petronet Ltd. 1.94
Construction 4.81IVRCL Infrastructures & Projects Ltd. 1.97
Housing Development & Infrastructure Ltd. 1.67
GMR Infrastructure Ltd. 1.17
Construction Project 4.78Larsen & Toubro Ltd. 2.43
Nagarjuna Construction Company Ltd. 2.36
Auto 4.50Tata Motors Ltd. 3.81
Mahindra & Mahindra Ltd. 0.69
Consumer Non Durables 4.45ITC Ltd. 4.45
Transportation 3.22IL&FS Transportation Networks Ltd. 2.20
The Great Eastern Shipping Company Ltd. 1.03
Power 3.16PTC India Ltd. 2.08
Kalpataru Power Transmission Ltd. 1.08
Oil 2.97
Oil & Natural Gas Corporation Ltd. 2.97
Telecom-Services 2.14
Bharti Airtel Ltd. 2.14
Fertilisers 1.67
Chambal Fertilisers and Chemicals Ltd. 1.67
Media & Entertainment 1.62
Sun TV Network Ltd. 1.62
Non - Ferrous Metals 0.45
Sterlite Industries (India) Ltd. 0.45
Cement 0.34
UltraTech Cement Ltd. 0.34
Cash & Cash Equivalents 6.75
Net receivables / payables 1.35
Total Net Assets 100.00
Portfolio & Asset Allocation
Note:Standard Deviation, Sharpe Ratio & Beta are calculated on Annualised basis using 3 years history of monthly returns, source: MFI Explorer##Risk-free rate assumed to be % (91 day T-bill yield As on May 31, 2010)4.40
Wealth
Creation
Solutions
CRISIL~CPR 2^^
(Past performance is no guarantee of future results.) for ranking methodology please refer page 50
30
Large Cap Oriented Equity Schemes (29 Schemes), 2 Yrs ended 31-Mar-10
Birla Sun Life Top 100 Fund
22.71
6.32
16.3514.33
5.79
18.12
0
5
10
15
20
25
1 Year 3 Years Since Inception
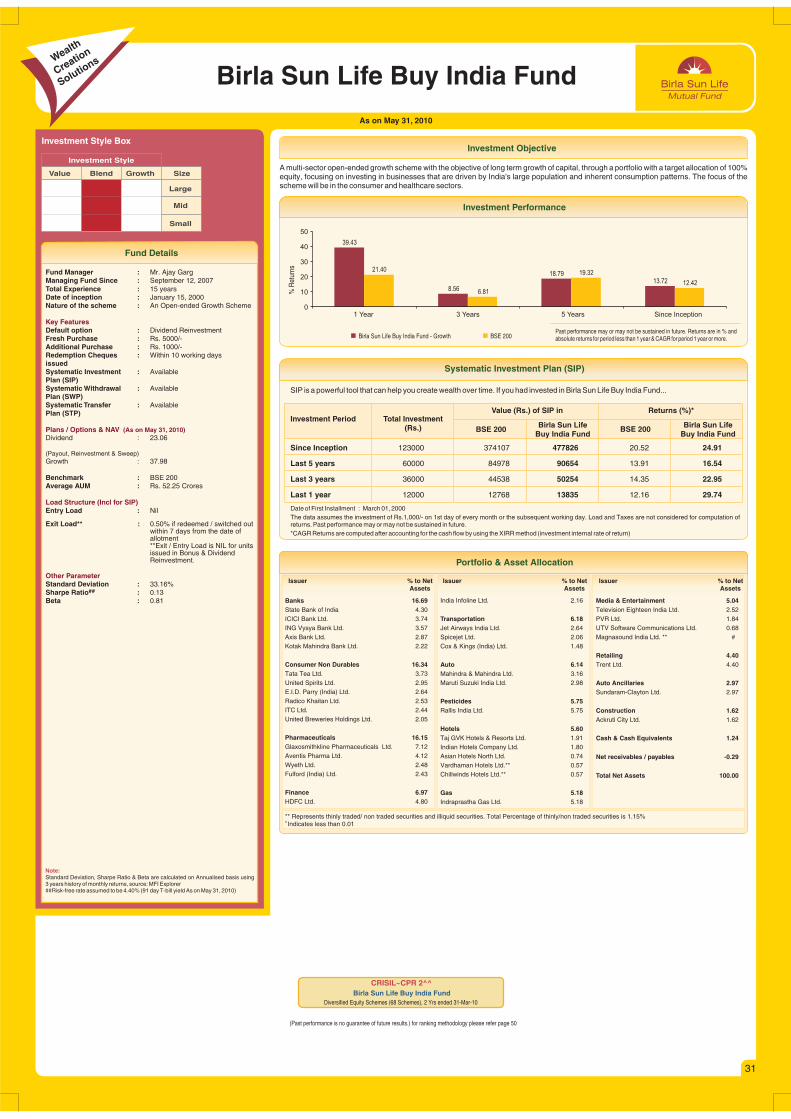
Fund Details
As on May 31, 2010
Birla Sun Life Buy India Fund
Value Blend Growth Size
Large
Mid
Small
Investment Style
Investment Style Box
Fund Manager :Managing Fund Since : September 12, 2007Total Experience : 15 yearsDate of inception : January 15, 2000Nature of the scheme : An Open-ended Growth Scheme
Default option : Dividend ReinvestmentFresh Purchase : Rs. 5000/-Additional Purchase : Rs. 1000/-Redemption Cheques : Within 10 working days issuedSystematic Investment : AvailablePlan (SIP)Systematic Withdrawal : AvailablePlan (SWP)Systematic Transfer : AvailablePlan (STP)
Dividend : 23.06
(Payout, Reinvestment & Sweep)Growth : 37.98
Benchmark : BSE 200Average AUM : Rs. 52.25 Crores
Entry Load : Nil
Exit Load** : 0.50% if redeemed / switched out within 7 days from the date of allotment**Exit / Entry Load is NIL for units issued in Bonus & Dividend Reinvestment.
Standard Deviation : 33.16%##Sharpe Ratio : 0.13
Beta : 0.81
Mr. Ajay Garg
Key Features
Plans / Options & NAV
Load Structure (Incl for SIP)
Other Parameter
(As on May 31, 2010)
Note:Standard Deviation, Sharpe Ratio & Beta are calculated on Annualised basis using 3 years history of monthly returns, source: MFI Explorer##Risk-free rate assumed to be % (91 day T-bill yield As on May 31, 2010)4.40
A multi-sector open-ended growth scheme with the objective of long term growth of capital, through a portfolio with a target allocation of 100%equity, focusing on investing in businesses that are driven by India's large population and inherent consumption patterns. The focus of thescheme will be in the consumer and healthcare sectors.
Investment Objective
Investment Performance
Birla Sun Life Buy India Fund - Growth BSE 200
% R
etur
ns
Past performance may or may not be sustained in future. Returns are in % and absolute returns for period less than 1 year & CAGR for period 1 year or more.
SIP is a powerful tool that can help you create wealth over time. If you had invested in Birla Sun Life Buy India Fund...
Systematic Investment Plan (SIP)
Date of First Installment : March 01, 2000The data assumes the investment of Rs.1,000/- on 1st day of every month or the subsequent working day. Load and Taxes are not considered for computation ofreturns. Past performance may or may not be sustained in future.*CAGR Returns are computed after accounting for the cash flow by using the XIRR method (investment internal rate of return)
Investment Period Total Investment(Rs.) Birla Sun Life
Buy India FundBirla Sun Life
Buy India FundBSE 200 BSE 200
Value (Rs.) of SIP in Returns (%)*
Since Inception 123000 374107 477826 20.52 24.91
Last 5 years 60000 84978 90654 13.91 16.54
Last 3 years 36000 44538 50254 14.35 22.95
Last 1 year 12000 12768 13835 12.16 29.74
Issuer % to NetAssets
Issuer % to NetAssets
Issuer % to NetAssets
Banks 16.69State Bank of India 4.30ICICI Bank Ltd. 3.74ING Vysya Bank Ltd. 3.57Axis Bank Ltd. 2.87Kotak Mahindra Bank Ltd. 2.22
Consumer Non Durables 16.34Tata Tea Ltd. 3.73United Spirits Ltd. 2.95E.I.D. Parry (India) Ltd. 2.64Radico Khaitan Ltd. 2.53ITC Ltd. 2.44United Breweries Holdings Ltd. 2.05
Pharmaceuticals 16.15Glaxosmithkline Pharmaceuticals Ltd. 7.12Aventis Pharma Ltd. 4.12Wyeth Ltd. 2.48Fulford (India) Ltd. 2.43
Finance 6.97HDFC Ltd. 4.80
India Infoline Ltd. 2.16
Transportation 6.18Jet Airways India Ltd. 2.64Spicejet Ltd. 2.06Cox & Kings (India) Ltd. 1.48
Auto 6.14Mahindra & Mahindra Ltd. 3.16Maruti Suzuki India Ltd. 2.98
Pesticides 5.75Rallis India Ltd. 5.75
Hotels 5.60Taj GVK Hotels & Resorts Ltd. 1.91Indian Hotels Company Ltd. 1.80Asian Hotels North Ltd. 0.74Vardhaman Hotels Ltd.** 0.57Chillwinds Hotels Ltd.** 0.57
Gas 5.18Indraprastha Gas Ltd. 5.18
Media & Entertainment 5.04Television Eighteen India Ltd. 2.52PVR Ltd. 1.84UTV Software Communications Ltd. 0.68Magnasound India Ltd. ** #
Retailing 4.40Trent Ltd. 4.40
Auto Ancillaries 2.97Sundaram-Clayton Ltd. 2.97
Construction 1.62Ackruti City Ltd. 1.62
Cash & Cash Equivalents 1.24
Net receivables / payables -0.29
Total Net Assets 100.00
Portfolio & Asset Allocation
** Represents thinly traded/ non traded securities and illiquid securities. Total Percentage of thinly/non traded securities is 1.15%# Indicates less than 0.01
Wealth
Creation
Solutions
39.43
8.56
18.7913.72
21.40
6.81
19.32
12.42
0
10
20
30
40
50
1 Year 3 Years 5 Years Since Inception
31
CRISIL~CPR 2^^
(Past performance is no guarantee of future results.) for ranking methodology please refer page 50
Diversified Equity Schemes (68 Schemes), 2 Yrs ended 31-Mar-10
Birla Sun Life Buy India Fund

Fund Details
As on May 31, 2010
Investment Objective
Birla Sun Life MNC Fund
Value Blend Growth Size
Large
Mid
Small
Investment Style
Investment Style Box
Fund Manager :Managing Fund Since : June 18, 2009Total Experience : 15 yearsDate of inception : December 27, 1999Nature of the scheme : An Open-ended Growth Scheme
Default option : Dividend ReinvestmentFresh Purchase : Rs. 5000/-Additional Purchase : Rs. 1000/-Redemption Cheques : Within 10 working daysissuedSystematic Investment : AvailablePlan (SIP)Systematic Withdrawal : AvailablePlan (SWP)Systematic Transfer : AvailablePlan (STP)
Dividend : 78.66(Payout, Reinvestment & Sweep)Growth : 182.78
Benchmark : S & P CNX MNCAverage AUM : Rs. 204.75 Crores
Entry Load : Nil
Exit Load** : 1% if redeemed / switched out within 365 days from the date of allotment**Exit / Entry Load is NIL for units issued in Bonus & Dividend Reinvestment.
Standard Deviation : 26.63%##Sharpe Ratio : 0.30
Beta : 0.83
Mr. Ajay Garg
Key Features
Plans / Options & NAV
Load Structure (Incl for SIP)
Other Parameter
(As on May 31, 2010)
Note:Standard Deviation, Sharpe Ratio & Beta are calculated on Annualised basis using 3 years history of monthly returns, source: MFI Explorer##Risk-free rate assumed to be % (91 day T-bill yield As on May 31, 2010)4.40
An open-ended growth scheme with the objective to achieve long-term growth of capital at relatively moderate levels of risk
by making investments in securities of multi-national companies through a research based investment approach.
Investment Performance
SIP is a powerful tool that can help you create wealth over time. If you had invested in Birla Sun Life MNC Fund...
Systematic Investment Plan (SIP)
Date of First Installment : January 01, 2000The data assumes the investment of Rs.1,000/- on 1st day of every month or the subsequent working day. Load and Taxes are not considered for computation ofreturns. Past performance may or may not be sustained in future.*CAGR Returns are computed after accounting for the cash flow by using the XIRR method (investment internal rate of return)
Investment Period Total Investment(Rs.) Birla Sun Life
MNC FundBirla Sun Life
MNC FundS & P CNX MNC S & P CNX MNC
Value (Rs.) of SIP in Returns (%)*
Since Inception 125000 296806 448347 15.79 23.07
Last 5 years 60000 85848 98360 14.32 19.88
Last 3 years 36000 46988 55066 18.12 29.70
Last 1 year 12000 12839 14764 13.31 45.64
Issuer % to NetAssets
Issuer % to NetAssets
Issuer % to NetAssets
Pharmaceuticals 17.94
Pfizer Ltd. 6.19
Glaxosmithkline Pharmaceuticals Ltd. 4.63
Fulford (India) Ltd. 3.99
Wyeth Ltd. 2.59
Aventis Pharma Ltd. 0.54
Consumer Non Durables 17.17
Glaxosmithkline Consumer Healthcare Ltd. 4.89
Kansai Nerolac Paints Ltd. 3.99
Colgate-Palmolive (India) Ltd. 3.33
ITC Ltd. 2.49
Procter&Gamble Hygiene&Health Care Ltd. 2.47
Visakha Aqua Farms Ltd** #
Industrial Capital Goods 13.49
Honeywell Automation India Ltd. 4.22
Alstom Projects India Ltd. 2.86
Areva T&D India Ltd. 2.44
Siemens Ltd. 2.08
ABB Ltd. 1.89
Banks 10.41
ING Vysya Bank Ltd. 5.35
Yes Bank Ltd. 5.06
Finance 10.07
CRISIL Ltd. 5.88
ICRA Ltd. 4.18
Auto Ancillaries 7.34
Bosch Ltd. 3.44
Wabco TVS India Ltd 2.85
Federal-Mogul Goetze (India) Ltd. 1.04
Gas 6.25
Gujarat Gas Company Ltd. 6.25
Industrial Products 6.20
Cummins (India) Ltd. 5.18
FAG Bearings India Ltd. 1.02
Software 3.72
Oracle Financial Services Software Ltd. 1.96
Mphasis Ltd. 1.76
Auto 3.26
Maruti Suzuki India Ltd. 3.26
Oil 2.27
Cairn India Ltd. 2.27
Construction 1.12
ITD Cementation India Ltd. 1.12
Textiles - Cotton 0.00
Sri Venkatesha Mills Ltd** #
Textiles - Synthetic 0.00
Maruti Cottex Ltd** #
Sree Jayalakshmi Autospin Ltd.** #
Paper 0.00
Jainpur Straw Board & Papers Ltd. ** #
Cash & Cash Equivalents 1.05
Net receivables / payables -0.27
Total Net Assets 100.00
Portfolio & Asset Allocation
(Past performance is no guarantee of future results.) for ranking methodology please refer page 50
** Represents thinly traded/ non traded securities and illiquid securities. Total Percentage of thinly/non traded securities is 0.00%.# Indicates less than 0.01
Wealth
Creation
Solutions
Birla Sun Life MNC Fund - Growth S&P CNX MNC
% R
etur
ns
Past performance may or may not be sustained in future. Returns are in % and absolute returns for period less than 1 year & CAGR for period 1 year or more.
����V #alue Research RatingBirla Sun Life MNC Fund
Equity: Diversified (169 Schemes), for 3 & 5 Years periods ending 31-May-10
CRISIL~CPR 2^^
Small and Mid Equity Schemes (24 Schemes), 2 Yrs ended 31-Mar-10
Birla Sun Life MNC Fund
32
61.31
12.2820.10 16.26
101.80
7.9019.26
10.09
0
20
40
60
80
100
120
1 Year 3 Years 5 Years Since Inception

Fund Details
As on May 31, 2010
Investment Objective
Birla Sun Life Index Fund
Value Blend Growth Size
Large
Mid
Small
Investment Style
Investment Style Box
Fund Manager :Managing Fund Since : October 01, 2007Total Experience : 15 yearsDate of inception : September 18, 2002Nature of the scheme : An Open-ended Index Linked
Growth Scheme
Default option : Dividend ReinvestmentFresh Purchase : Rs. 5000/-Additional Purchase : Rs. 1000/-Redemption Cheques : Within 10 Working daysissuedSystematic Investment : AvailablePlan (SIP)Systematic Withdrawal : Not Available Plan (SWP)Systematic Transfer : Not AvailablePlan (STP)
Dividend : 19.51(Payout, Reinvestment & Sweep)Growth : 50.48
Benchmark : S&P CNX NIFTYAverage AUM : Rs. 33.35 Crores
Entry Load : Nil
Exit Load** : 0.50% if redeemed / switched out within 7 days from the date of allotment
Standard Deviation : 35.51%##Sharpe Ratio : 0.03
Beta : 0.98
Mr. Ajay Garg
Key Features
Plans / Options & NAV
Load Structure (Incl for SIP)
Other Parameter
(As on May 31, 2010)
**Exit / Entry Load is NIL for units issued in Bonus & Dividend Reinvestment.
Note:Standard Deviation, Sharpe Ratio & Beta are calculated on Annualised basis using 3 years history of monthly returns, source: MFI Explorer##Risk-free rate assumed to be % (91 day T-bill yield As on May 31, 2010)4.40
An open-ended index-linked growth scheme with the objective to generate returns commensurate with the performance of Nifty subject totracking errors.
Investment Performance
% R
etur
ns
Birla Sun Life Index Fund - Growth S&P CNX NiftyPast performance may or may not be sustained in future. Returns are in % and absolute returns for period less than 1 year & CAGR for period 1 year or more.
SIP is a powerful tool that can help you create wealth over time. If you had invested in Birla Sun Life Index Fund...
Systematic Investment Plan (SIP)
Date of First Installment : October 1, 2002The data assumes the investment of Rs.1,000/- on 1st day of every month or the subsequent working day. Load and Taxes are not considered for computation of returns. Past performance may or may not be sustained in future.*CAGR Returns are computed after accounting for the cash flow by using the XIRR method (investment internal rate of return)
Investment Period Total Investment(Rs.) Birla Sun Life
Index FundBirla Sun Life
Index FundS&P CNX NIFTY S&P CNX NIFTY
Value (Rs.) of SIP in Returns (%)*
Since Inception 92000 197855 191759 19.48 18.69
Last 5 years 60000 82739 80995 12.82 11.96
Last 3 years 36000 42831 42366 11.64 10.89
Last 1 year 12000 12541 12481 8.52 7.57
Issuer % to NetAssets
Issuer % to NetAssets
Issuer % to NetAssets
Banks 14.21ICICI Bank Ltd. 4.97HDFC Bank Ltd. 3.37State Bank of India 3.00Axis Bank Ltd. 1.56Punjab National Bank 0.69Kotak Mahindra Bank Ltd. 0.62
Software 9.93Infosys Technologies Ltd. 6.57Tata Consultancy Services Ltd. 1.92Wipro Ltd. 1.03HCL Technologies Ltd. 0.42
Petroleum Products 9.47Reliance Industries Ltd. 9.08Bharat Petroleum Corporation Ltd. 0.39
Construction Project 5.03Larsen & Toubro Ltd. 5.03
Finance 4.76HDFC Ltd. 3.62IDFC Ltd. 0.76Reliance Capital Ltd. 0.38
Auto 4.02Mahindra & Mahindra Ltd. 1.23Tata Motors Ltd. 1.05Hero Honda Motors Ltd. 0.89Maruti Suzuki India Ltd. 0.84
Consumer Non Durables 3.77ITC Ltd. 3.77
Ferrous Metals 3.49Tata Steel Ltd. 1.57Jindal Steel & Power Ltd. 1.30Steel Authority of India Ltd. 0.62
Power 3.35Tata Power Company Ltd. 1.08NTPC Ltd. 0.90Reliance Infrastructure Ltd. 0.77Power Grid Corporation of India Ltd. 0.30Reliance Power Ltd. 0.29
Industrial Capital Goods 3.11Bharat Heavy Electricals Ltd. 1.91Siemens Ltd. 0.54ABB Ltd. 0.45Suzlon Energy Ltd. 0.21
Oil 2.69Oil & Natural Gas Corporation Ltd. 2.02Cairn India Ltd. 0.66
Telecom - Services 2.58Bharti Airtel Ltd. 1.65Reliance Communications Ltd. 0.50Idea Cellular Ltd. 0.44
Non - Ferrous Metals 2.38Sterlite Industries India Ltd. 1.37
Hindalco Industries Ltd. 1.00
Pharmaceuticals 1.81Cipla Ltd. 0.83Sun Pharmaceutical Industries Ltd. 0.64Ranbaxy Laboratories Ltd. 0.33
Cement 1.61Jaiprakash Associates Ltd. 0.73Ambuja Cements Ltd. 0.46ACC Ltd. 0.42
Diversified 1.28Hindustan Unilever Ltd. 1.28
Gas 1.05GAIL (India) Ltd. 1.05
Construction 1.02DLF Ltd. 0.52Unitech Ltd. 0.50
Future and Options 27.68CNX Nifty Future June 10 27.68
Cash & Cash Equivalents 22.62
Net receivables / payables -25.84
Total Net Assets 100.00
Portfolio & Asset Allocation
Wealth
Creation
Solutions
13.66
5.63
18.62
23.39
14.33
5.79
19.48
24.23
0
5
10
15
20
25
30
1 Year 3 Years 5 Years Since Inception
33
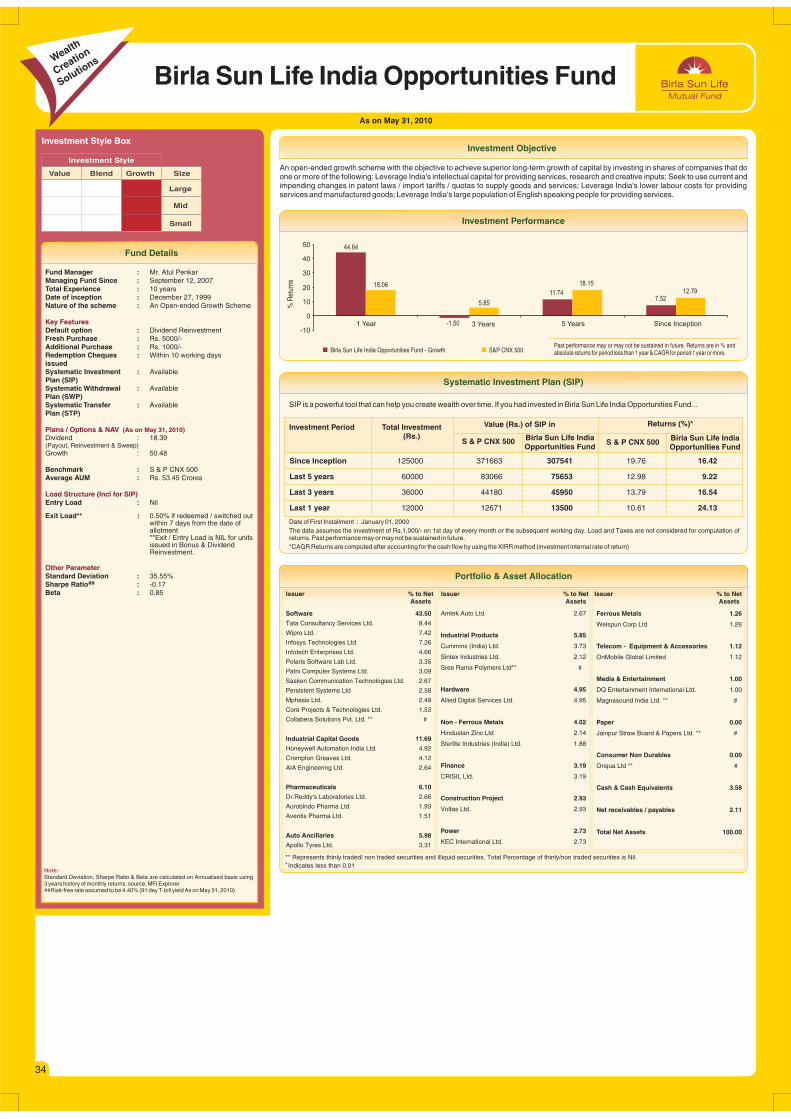
Fund Details
As on May 31, 2010
Investment Objective
Birla Sun Life India Opportunities Fund
Value Blend Growth Size
Large
Mid
Small
Investment Style
Investment Style Box
Fund Manager :Managing Fund Since : September 12, 2007Total Experience : 10 yearsDate of inception : December 27, 1999Nature of the scheme : An Open-ended Growth Scheme
Default option : Dividend ReinvestmentFresh Purchase : Rs. 5000/-Additional Purchase : Rs. 1000/-Redemption Cheques : Within 10 working days issuedSystematic Investment : AvailablePlan (SIP)Systematic Withdrawal : AvailablePlan (SWP)Systematic Transfer : AvailablePlan (STP)
Dividend : 18.39(Payout, Reinvestment & Sweep)Growth : 50.48
Benchmark : S & P CNX 500Average AUM : Rs. 53.45 Crores
Entry Load : Nil
Exit Load** : 0.50% if redeemed / switched out within 7 days from the date of allotment**Exit / Entry Load is NIL for units issued in Bonus & Dividend Reinvestment.
Standard Deviation : 35.55%##Sharpe Ratio : -0.17
Beta : 0.85
Mr. Atul Penkar
Key Features
Plans / Options & NAV
Load Structure (Incl for SIP)
Other Parameter
(As on May 31, 2010)
Note:Standard Deviation, Sharpe Ratio & Beta are calculated on Annualised basis using 3 years history of monthly returns, source: MFI Explorer##Risk-free rate assumed to be % (91 day T-bill yield As on May 31, 2010)4.40
An open-ended growth scheme with the objective to achieve superior long-term growth of capital by investing in shares of companies that doone or more of the following: Leverage India's intellectual capital for providing services, research and creative inputs; Seek to use current andimpending changes in patent laws / import tariffs / quotas to supply goods and services; Leverage India's lower labour costs for providing services and manufactured goods; Leverage India's large population of English speaking people for providing services.
Investment Performance
Birla Sun Life India Opportunities Fund - Growth S&P CNX 500
% R
etur
ns
Past performance may or may not be sustained in future. Returns are in % and absolute returns for period less than 1 year & CAGR for period 1 year or more.
SIP is a powerful tool that can help you create wealth over time. If you had invested in Birla Sun Life India Opportunities Fund...
Systematic Investment Plan (SIP)
Date of First Installment : January 01, 2000The data assumes the investment of Rs.1,000/- on 1st day of every month or the subsequent working day. Load and Taxes are not considered for computation ofreturns. Past performance may or may not be sustained in future.*CAGR Returns are computed after accounting for the cash flow by using the XIRR method (investment internal rate of return)
Investment Period Total Investment(Rs.) Birla Sun Life India
Opportunities FundBirla Sun Life India Opportunities Fund
S & P CNX 500 S & P CNX 500
Value (Rs.) of SIP in Returns (%)*
Since Inception 125000 371663 307541 19.76 16.42
Last 5 years 60000 83066 75653 12.98 9.22
Last 3 years 36000 44180 45950 13.79 16.54
Last 1 year 12000 12671 13500 10.61 24.13
Issuer % to NetAssets
Issuer % to NetAssets
Issuer % to NetAssets
Software 43.50
Tata Consultancy Services Ltd. 8.44
Wipro Ltd. 7.42
Infosys Technologies Ltd. 7.26
Infotech Enterprises Ltd. 4.66
Polaris Software Lab Ltd. 3.35
Patni Computer Systems Ltd. 3.09
Sasken Communication Technologies Ltd. 2.67
Persistent Systems Ltd 2.58
Mphasis Ltd. 2.49
Core Projects & Technologies Ltd. 1.53
Collabera Solutions Pvt. Ltd. ** #
Industrial Capital Goods 11.69
Honeywell Automation India Ltd. 4.92
Crompton Greaves Ltd. 4.12
AIA Engineering Ltd. 2.64
Pharmaceuticals 6.10
Dr.Reddy's Laboratories Ltd. 2.66
Aurobindo Pharma Ltd 1.93
Aventis Pharma Ltd. 1.51
Auto Ancillaries 5.98
Apollo Tyres Ltd. 3.31
Amtek Auto Ltd. 2.67
Industrial Products 5.85
Cummins (India) Ltd. 3.73
Sintex Industries Ltd. 2.12
Sree Rama Polymers Ltd** #
Hardware 4.95
Allied Digital Services Ltd. 4.95
Non - Ferrous Metals 4.02
Hindustan Zinc Ltd 2.14
Sterlite Industries (India) Ltd. 1.88
Finance 3.19
CRISIL Ltd. 3.19
Construction Project 2.93
Voltas Ltd. 2.93
Power 2.73
KEC International Ltd. 2.73
Ferrous Metals 1.26
Welspun Corp Ltd 1.26
Telecom - Equipment & Accessories 1.12
OnMobile Global Limited 1.12
Media & Entertainment 1.00
DQ Entertainment International Ltd. 1.00
Magnasound India Ltd. ** #
Paper 0.00
Jainpur Straw Board & Papers Ltd. ** #
Consumer Non Durables 0.00
Oriqua Ltd ** #
Cash & Cash Equivalents 3.58
Net receivables / payables 2.11
Total Net Assets 100.00
Portfolio & Asset Allocation
** Represents thinly traded/ non traded securities and illiquid securities. Total Percentage of thinly/non traded securities is Nil.# Indicates less than 0.01
Wealth
Creation
Solutions
44.64
-1.50
11.747.52
18.06
5.85
18.1512.79
-10
0
10
20
30
40
50
1 Year 3 Years 5 Years Since Inception
34

Fund Details
As on May 31, 2010
Investment Objective
Birla Sun Life Dividend Yield Plus
Value Blend Growth Size
Large
Mid
Small
Investment Style
Investment Style Box
Fund Manager :Managing Fund Since : November 30, 2007Total Experience : 11 yearsDate of inception : February 26, 2003Nature of the scheme : An Open-ended Growth Scheme
Default option : Dividend ReinvestmentFresh Purchase : Rs. 5000/-Additional Purchase : Rs. 1000/-Redemption Cheques : Within 10 working days issuedSystematic Investment : AvailablePlan (SIP)Systematic Withdrawal : AvailablePlan (SWP)Systematic Transfer : AvailablePlan (STP)
Dividend : 14.19(Payout, Reinvestment & Sweep)Growth : 75.59
Benchmark : S & P CNX 500Average AUM : Rs. 384.83 Crores
Entry Load : Nil
Exit Load** : 1% if redeemed / switched out within 365 days from the date of allotment**Exit / Entry Load is NIL for units issued in Bonus & Dividend Reinvestment.
Standard Deviation : 32.60%##Sharpe Ratio : 0.41
Beta : 0.77
Mr. Ankit Sancheti
Key Features
Plans / Options & NAV
Load Structure (Incl for SIP)
Other Parameter
(As on May 31, 2010)
Note:Standard Deviation, Sharpe Ratio & Beta are calculated on Annualised basis using 3 years history of monthly returns, source: MFI Explorer##Risk-free rate assumed to be % (91 day T-bill yield As on May 31, 2010)4.40
An open-ended growth scheme with the objective to provide capital growth and income by investing primarily in a well-diversified portfolio ofdividend paying companies that have a relatively high dividend yield.
Investment Performance
Birla Sun Life Dividend Yield Plus - Growth S & P CNX 500
% R
etur
ns
Past performance may or may not be sustained in future. Returns are in % and absolute returns for period less than 1 year & CAGR for period 1 year or more.
SIP is a powerful tool that can help you create wealth over time. If you had invested in Birla Sun Life Dividend Yield Plus...
Systematic Investment Plan (SIP)
Date of First Installment : March 01, 2003The data assumes the investment of Rs.1,000/- on 1st day of every month or the subsequent working day. Load and Taxes are not considered for computation of returns. Past performance may or may not be sustained in future.*CAGR Returns are computed after accounting for the cash flow by using the XIRR method (investment internal rate of return)
Investment Period Total Investment(Rs.) Birla Sun Life
Dividend Yield PlusBirla Sun Life
Dividend Yield PlusS & P CNX 500 S & P CNX 500
Value (Rs.) of SIP in Returns (%)*
Since Inception 87000 176260 216733 19.09 24.68
Last 5 years 60000 83066 103779 12.98 22.10
Last 3 years 36000 44180 55605 13.79 30.44
Last 1 year 12000 12671 14231 10.61 36.44
Issuer % to NetAssets
Issuer % to NetAssets
Issuer % to NetAssets
Banks 18.03Andhra Bank 3.40Standard Chartered Bank PLC - IDR** 2.52The South Indian Bank Ltd. 2.51Oriental Bank of Commerce 2.46Corporation Bank 2.34Indian Bank 1.33Allahabad Bank 1.25The Jammu And Kashmir Bank Ltd. 1.07ICICI Bank Ltd. 0.87Canara Bank 0.27
Consumer Non Durables 13.09Glaxosmithkline Consumer Healthcare Ltd. 3.55Kansai Nerolac Paints Ltd. 2.63E.I.D. Parry (India) Ltd. 2.33Procter & Gamble Hygiene & Health Care Ltd. 1.40ICI India Ltd. 1.23Berger Paints India Ltd. 1.03United Spirits Ltd. 0.92
Pharmaceuticals 8.88Wyeth Ltd. 3.82Glaxosmithkline Pharmaceuticals Ltd. 3.67Pfizer Ltd. 1.39
Petroleum Products 5.53Castrol India Ltd. 2.36Hindustan Petroleum Corporation Ltd. 1.82Indian Oil Corporation Ltd. 1.35
Fertilisers 5.34Coromandel International Ltd. 2.47Chambal Fertilisers and Chemicals Ltd. 1.61Tata Chemicals Ltd. 1.26
Power 4.58KEC International Ltd. 2.60Gujarat Industries Power Company Ltd. 1.98
Industrial Products 4.03Cummins (India) Ltd. 3.20Cosmo Films Ltd. 0.83
Finance 3.94Rural Electrification Corporation Ltd. 2.82India Infoline Ltd. 1.09Kirloskar Brothers Investment Ltd.** 0.03
Oil 3.90Oil & Natural Gas Corporation Ltd. 3.90
Industrial Capital Goods 3.72Apar Industries Ltd. 2.14Thermax Ltd. 0.83Elecon Engineering Company Ltd. 0.75
Gas 3.59Indraprastha Gas Ltd. 1.94GAIL India Ltd. 1.66
Auto 3.12Bajaj Auto Ltd. 2.21Ashok Leyland Ltd. 0.91
Auto Ancillaries 2.84Phillips Carbon Black Ltd. 1.86Goodyear India Ltd. 0.97
Ferrous Metals 2.65Tata Sponge Iron Ltd. 1.47
PSL Ltd. 1.18
Paper 2.65Tamil Nadu Newsprint & Papers Ltd. 1.85Ballarpur Industries Ltd. 0.80
Consumer Durables 2.56Bajaj Electricals Ltd. 2.56
Software 2.273i Infotech Ltd. 1.02HCL Technologies Ltd. 0.95Sasken Communication Technologies Ltd. 0.29
Transportation 2.25Shipping Corporation of India Ltd. 1.38Gateway Distriparks Ltd. 0.59The Great Eastern Shipping Co. Ltd. 0.27
Media & Entertainment 1.10Jagran Prakashan Ltd. 1.10
Cement 0.94Orient Paper & Industries Ltd. 0.94
Construction 0.73Indiabulls Real Estate Ltd. 0.73
Cash & Cash Equivalents 4.12
Net receivables / payables 0.14
Total Net Assets 100.00
Portfolio & Asset Allocation
(Past performance is no guarantee of future results.) for ranking methodology please refer page 50
CRISIL~CPR 1^^Birla Sun Life Dividend Yield Plus
Diversified Equity Schemes - Equity ( Schemes), 2 68 Yrs ended 31-Mar-10
�����#Value Research Rating
Birla Sun Life Dividend Yield PlusEquity Diversified (169 Schemes), for 3 & 5 Years periods ending 31-May-10
Wealth
Creation
Solutions
35
** Represents thinly traded/ non traded securities and illiquid securities. Total Percentage of thinly/non traded securities is 2.55%.
45.39
17.8620.60
32.11
18.06
5.85
18.15
26.62
0
10
20
30
40
50
1 Year 3 Years 5 Years Since Inception

As on May 31, 2010
Birla Sun Life '95 Fund
Fund Manager :Mr. Nishit Dholakia
Managing Fund Since : June 18, 2009Total Experience : 12 years & 10 yearsDate of inception : February 10, 1995Natureof thescheme : AnOpen-ended Balanced Scheme
Default option : Dividend ReinvestmentFresh Purchase : Rs. 5000/-Additional Purchase : Rs. 1000/-Redemption Cheques : Within 10 working days issuedSystematic Investment : AvailablePlan (SIP)Systematic Withdrawal : AvailablePlan (SWP)Systematic Transfer : AvailablePlan (STP)
Dividend : 107.30(Payout, Reinvestment & Sweep)Growth : 278.16
Benchmark : CRISIL Balanced Fund IndexAverage AUM : Rs. 289.89 Crores
Entry Load : Nil
Exit Load** : 1% if redeemed / switched out within 365 days from the date of allotment**Exit / Entry Load is NIL for units issued in Bonus & Dividend Reinvestment.
Average Maturity : –Standard Deviation : 27.65%
##Sharpe Ratio : 0.26
Mr. Satyabrata Mohanty &
Key Features
Plans / Options & NAV
Load Structure (Incl for SIP)
Other Parameter
(As on May 31, 2010)
Investment Style Box
An open-ended balanced scheme with the objective of long term growth of capital and current income, through a portfolio of equity and fixedincome securities
Equity alloction 68.48
Banks 9.28ICICI Bank Ltd. 2.33HDFC Bank Ltd. 2.31Axis Bank Ltd. 2.26Allahabad Bank 1.40Canara Bank 0.69United Bank Of India 0.29
Software 6.32Infosys Technologies Ltd. 2.25Wipro Ltd. 1.48HCL Technologies Ltd. 1.43Core Projects & Technologies Ltd. 0.59Everonn Education Ltd. 0.57
Consumer Non Durables 6.25ITC Ltd. 1.20Nestle India Ltd. 1.17Asian Paints Ltd. 1.13Dabur India Ltd. 1.01Marico Ltd. 0.73Kansai Nerolac Paints Ltd. 0.51United Breweries Holdings Ltd. 0.50
Pharmaceuticals 5.01Aurobindo Pharma Ltd. 1.45Lupin Ltd. 1.26Divis Laboratories Ltd. 0.81Aventis Pharma Ltd. 0.75Dr.Reddys Laboratories Ltd. 0.38Sun Pharmaceutical Industries Ltd. 0.37
Industrial Capital Goods 4.52Thermax Ltd. 1.55Crompton Greaves Ltd. 1.47AIA Engineering Ltd. 0.75Honeywell Automation India Ltd. 0.75
Power 4.28Torrent Power Ltd. 1.37KSK Energy Ventures Ltd. 1.08Kalpataru Power Transmission Ltd. 0.87KEC International Ltd. 0.49Jyoti Structures Ltd. 0.47
Pesticides 3.61Rallis India Ltd. 3.61
Petroleum Products 3.47Reliance Industries Ltd. 1.99Hindustan Petroleum Corporation Ltd. 1.48
Construction Project 3.32Voltas Ltd. 1.53Lanco Infratech Ltd. 1.13Larsen & Toubro Ltd. 0.66
Finance 2.75Shriram Transport Finance Company Ltd. 1.61Housing Development Finance Corporation Ltd. 1.14
Retailing 2.74Trent Ltd. 2.74
Gas 2.51Gujarat Gas Company Ltd. 0.99Indraprastha Gas Ltd. 0.77Gujarat State Petronet Ltd. 0.75
Transportation 1.81IL&FS Transportation Networks Ltd. 1.03Cox & Kings (India) Ltd. 0.78
Non - Ferrous Metals 1.72Hindustan Zinc Ltd. 1.16Sterlite Industries (India) Ltd. 0.56
Minerals/Mining 1.44Nava Bharat Ventures Ltd. 1.44
Media & Entertainment 1.18DQ Entertainment (International) Ltd. 0.44ETC Networks Ltd. 0.43Zee Entertainment Enterprises Ltd. 0.30Magnasound India Ltd. ** #
Consumer Durables 1.11Bajaj Electricals Ltd. 1.11
Auto Ancillaries 0.97Amtek Auto Ltd. 0.97
Auto 0.64Tata Motors Ltd. 0.64
Construction 1.16Patel Engineering Ltd. 0.64Jaiprakash Associates Ltd. 0.53
Ferrous Metals 0.53Steel Authority of India Ltd. 0.53
Diversified 0.26Bombay Burmah Trading Corporation Ltd. 0.26
Future and Options 3.60CNX NIFTY FUT JUN 10 3.60
Money Market Instruments 6.49Bank of Baroda 6.49 A1+
PSU/PFI Bonds/Banks 5.95National Bank for Agricultural & Rural Development.** 3.37 AAAIDBI Bank Ltd.** 2.58 AA+
Government Bond 1.7408.20% CGL 2022 1.74 Sovereign
Total Net Assets 100.00
Debt Allocation 14.18
Cash & Current Assets 17.33
** Represents thinly traded/ non traded securities and illiquid securities. Total Percentage of thinly/non traded securities is 5.95%# Indicates less than 0.01
Note:Standard Deviation & Sharpe Ratio are calculated on Annualised basis using 3 year history of monthly returns, source: MFI Explorer.##Risk-free rate assumed to be % (91 day T-bill yield As on May 31, 2010)4.40
Past performance may or may not be sustained in future. Returns are in % and absolute returns for period less than1year&CAGRforperiod1year ormore. When benchmark returnsare not available, they have not been shown.
% R
etur
ns
Birla Sun Life 95 Fund - Growth Crisil Balanced Fund Index
(Past performance is no guarantee of future results.) for ranking methodology please refer page 50
#����Value Research Rating
Hybrid Equity-Oriented (30 Schemes),for 3 & 5 years periods ending 31-May-10Birla Sun Life ‘95 FundBirla Sun Life ‘95 Fund
CRISIL~CPR 2^^
SIP is a powerful tool that can help you create wealth over time. If you had invested in Birla Sun Life '95 Fund...
Date of First Installment : April 1, 1995The data assumes the investment of Rs.1,000/- on 1st day of every month or the subsequent working day. Load and Taxes are not considered for computation of returns. Past performance may or may not be sustained in future.*CAGR Returns are computed after accounting for the cash flow by using the XIRR method (investment internal rate of return)
Since Inception 182000 455857 1617049 11.23 25.49
Last 5 years 60000 80049 94419 11.49 18.20
Last 3 years 36000 42373 48385 10.90 20.22
Last 1 year 12000 12507 13159 7.97 18.51
Consistent CPR Performer- Balanced (14 Schemes), 5 years ended 31-Mar-10
Birla Sun Life ‘95 FundCRISIL~CPR 2^^
Wealth
Creation
Solutions
Value Blend Growth Size
Large
Mid
Small
Investment Style
Fund Details
Systematic Investment Plan (SIP)
Portfolio & Asset Allocation
Investment Performance Rating Profile
Investment Objective
InvestmentPeriod
TotalInvestment
(Rs.) CRISIL Balanced Fund Index
Birla Sun Life '95 Fund
CRISIL Balanced Fund Index
Value (Rs.) of SIP in Returns (%)*
Birla Sun Life '95 Fund
Issuer % to Net RatingAssets
Issuer % to Net RatingAssets
36
Balanced Schemes (19 Schemes), 2 years ended 31-Mar-10
1.74%
2.58%
9.86%
17.33%
68.48%
Cash & Current
Assets
AA
Sovereign
AAA
Other
26.09
11.71
21.01
24.26
11.19
7.78
15.08
0
5
10
15
20
25
30
1 Year 3 Years 5 Years Since Inception
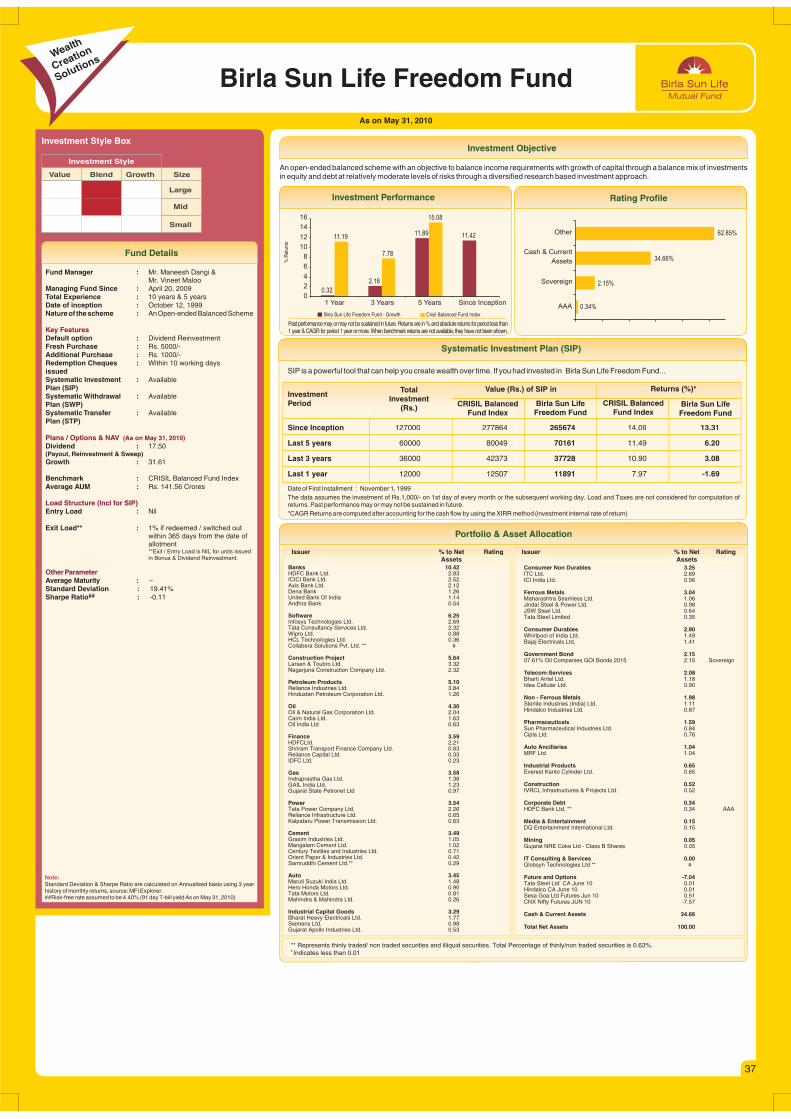
Birla Sun Life Freedom FundAs on May 31, 2010
Investment Style Box
Value Blend Growth Size
Large
Mid
Small
Investment Style
Fund Manager :Mr. Vineet Maloo
Managing Fund Since : April 20, 2009Total Experience : 10 years & 5 yearsDate of inception : October 12, 1999Natureof thescheme : AnOpen-ended Balanced Scheme
Default option : Dividend ReinvestmentFresh Purchase : Rs. 5000/-Additional Purchase : Rs. 1000/-Redemption Cheques : Within 10 working days issuedSystematic Investment : AvailablePlan (SIP)Systematic Withdrawal : AvailablePlan (SWP)Systematic Transfer : AvailablePlan (STP)
Dividend : 17.50(Payout, Reinvestment & Sweep)Growth : 31.61
Benchmark : CRISIL Balanced Fund IndexAverage AUM : Rs. 141.56 Crores
Entry Load : Nil
Exit Load** : 1% if redeemed / switched out within 365 days from the date of allotment
Average Maturity : –Standard Deviation : 19.41%
##Sharpe Ratio :
Mr. Maneesh Dangi &
Key Features
Plans / Options & NAV
Load Structure (Incl for SIP)
OtherParameter
(As on May 31, 2010)
**Exit / Entry Load is NIL for units issued in Bonus & Dividend Reinvestment.
-0.11
Note:Standard Deviation & Sharpe Ratio are calculated on Annualised basis using 3 yearhistory of monthly returns, source: MFI Explorer.##Risk-free rate assumed to be % (91 day T-bill yield As on May 31, 2010)4.40
An open-ended balanced scheme with an objective to balance income requirements with growth of capital through a balance mix of investmentsin equity and debt at relatively moderate levels of risks through a diversified research based investment approach.
Past performance may or may not be sustained in future. Returns are in % and absolute returns for period less than1 year & CAGR for period 1 year or more. When benchmark returns are not available, they have not been shown.
% R
etur
ns
Birla Sun Life Freedom Fund - Growth Crisil Balanced Fund Index
Banks 10.42HDFC Bank Ltd. 2.83ICICI Bank Ltd. 2.52Axis Bank Ltd. 2.12Dena Bank 1.26United Bank Of India 1.14Andhra Bank 0.54
Software 6.25Infosys Technologies Ltd. 2.69Tata Consultancy Services Ltd. 2.32Wipro Ltd. 0.88HCL Technologies Ltd. 0.36Collabera Solutions Pvt. Ltd. ** #
Construction Project 5.64Larsen & Toubro Ltd. 3.32Nagarjuna Construction Company Ltd. 2.32
Petroleum Products 5.10Reliance Industries Ltd. 3.84Hindustan Petroleum Corporation Ltd. 1.26
Oil 4.30Oil & Natural Gas Corporation Ltd. 2.04Cairn India Ltd. 1.63Oil India Ltd 0.63
Finance 3.59HDFCLtd. 2.21Shriram Transport Finance Company Ltd. 0.83Reliance Capital Ltd. 0.33IDFC Ltd. 0.23
Gas 3.58Indraprastha Gas Ltd. 1.38GAIL India Ltd. 1.23Gujarat State Petronet Ltd 0.97
Power 3.54Tata Power Company Ltd. 2.26Reliance Infrastructure Ltd. 0.65Kalpataru Power Transmission Ltd. 0.63
Cement 3.49Grasim Industries Ltd. 1.05Mangalam Cement Ltd. 1.02Century Textiles and Industries Ltd. 0.71Orient Paper & Industries Ltd. 0.42Samruddhi Cement Ltd.** 0.29
Auto 3.45Maruti Suzuki India Ltd. 1.48Hero Honda Motors Ltd. 0.90Tata Motors Ltd. 0.81Mahindra & Mahindra Ltd. 0.26
Industrial Capital Goods 3.29Bharat Heavy Electricals Ltd. 1.77Siemens Ltd. 0.98Gujarat Apollo Industries Ltd. 0.53
Consumer Non Durables 3.25ITC Ltd. 2.69ICI India Ltd. 0.56
Ferrous Metals 3.04Maharashtra Seamless Ltd. 1.06Jindal Steel & Power Ltd. 0.98JSW Steel Ltd. 0.64Tata Steel Limited 0.35
Consumer Durables 2.90Whirlpool of India Ltd. 1.49Bajaj Electricals Ltd. 1.41
Government Bond 2.1507.61% Oil Companies GOI Bonds 2015 2.15 Sovereign
Telecom-Services 2.08Bharti Airtel Ltd. 1.18Idea Cellular Ltd. 0.90
Non - Ferrous Metals 1.98Sterlite Industries (India) Ltd. 1.11Hindalco Industries Ltd. 0.87
Pharmaceuticals 1.59Sun Pharmaceutical Industries Ltd. 0.84Cipla Ltd. 0.76
Auto Ancillaries 1.04MRF Ltd. 1.04
Industrial Products 0.65Everest Kanto Cylinder Ltd. 0.65
Construction 0.52IVRCL Infrastructures & Projects Ltd. 0.52
Corporate Debt 0.34HDFC Bank Ltd. ** 0.34 AAA
Media & Entertainment 0.15DQ Entertainment International Ltd. 0.15
Mining 0.05Gujarat NRE Coke Ltd - Class B Shares 0.05
IT Consulting & Services 0.00Globsyn Technologies Ltd ** #
Future and Options -7.04Tata Steel Ltd CA June 10 0.01Hindalco CA June 10 0.01Sesa Goa Ltd Futures Jun 10 0.51CNX Nifty Futures JUN 10 -7.57
Cash & Current Assets 34.66
Total Net Assets 100.00
SIP is a powerful tool that can help you create wealth over time. If you had invested in Birla Sun Life Freedom Fund...
Date of First Installment : November 1, 1999The data assumes the investment of Rs.1,000/- on 1st day of every month or the subsequent working day. Load and Taxes are not considered for computation of returns. Past performance may or may not be sustained in future.*CAGR Returns are computed after accounting for the cash flow by using the XIRR method (investment internal rate of return)
Since Inception 127000 277864 265674 14.09 13.31
Last 5 years 60000 80049 70161 11.49 6.20
Last 3 years 36000 42373 37728 10.90 3.08
Last 1 year 12000 12507 11891 7.97 -1.69
Wealth
Creation
Solutions
Fund Details
InvestmentPeriod
TotalInvestment
(Rs.) Birla Sun LifeFreedom Fund
Birla Sun LifeFreedom Fund
CRISIL Balanced Fund Index
CRISIL Balanced Fund Index
Value (Rs.) of SIP in Returns (%)*
Issuer % to Net RatingAssets
Issuer % to Net RatingAssets
Investment Objective
Systematic Investment Plan (SIP)
Investment Performance Rating Profile
Portfolio & Asset Allocation
** Represents thinly traded/ non traded securities and illiquid securities. Total Percentage of thinly/non traded securities is 0.63%.# Indicates less than 0.01
37
0.34%
2.15%
34.66%
62.85%
AAA
Sovereign
Cash & Current
Assets
Other
0.32
2.18
11.89 11.4211.19
7.78
15.08
0
2
4
6
8
10
12
14
16
1 Year 3 Years 5 Years Since Inception

As on May 31, 2010
Birla Sun Life Asset Allocation Fund
Investment Style Box
Credit Quality
High Mid Low Interest rate sensitivity
High
Mid
Low
Fund Manager :Managing Fund Since : June 18, 2009Total Experience : 12 yearsDate of inception : February 24, 2004Nature of the scheme : An Open-ended Fund of Funds
Scheme
Default option : Dividend ReinvestmentFresh Purchase : Rs. 5000/-Additional Purchase : Rs. 1000/-Redemption Cheques : Within 10 working days issued
Aggressive PlanDividend : 31.8652(Payout & Reinvestment)Growth : 31.8652Conservative PlanDividend : 19.7665(Payout & Reinvestment)Growth : 19.7665Moderate PlanDividend : 26.5240(Payout & Reinvestment)Growth : 26.5240
BenchmarkAggressive Plan : S&P CNX NIFTYModerate Plan : CRISIL Balanced Fund IndexConservative Plan : CRISIL MIP Blended IndexAverage AUMAggressive Plan : Rs. 10.64 CroresConservative Plan : Rs. 10.46 Crores
Entry Load : NilExit Load : Nil
Standard DeviationAggressive Plan : 12.48%Conservative Plan : 4.33%
Mr. Satyabrata Mohanty
Key Features
Plans / Options & NAV
:
Load Structure
Other Parameter
(As on May 31, 2010)
Moderate Plan Rs. 5.95 Crores
Moderate Plan : 9.92%
Note:Standard Deviation is calculated on annualised basis using 1 year history of monthlyreturns, source: MFI Explorer
An open-ended Fund of Funds scheme with the objective to provide income and capital appreciation along with diversification by investing in abasket of debt and equity Mutual Fund schemes in line with the risk profile of the investors.
Past performance may or may not be sustained in future. Returns are in % and absolute returns forperiod less than 1 year & CAGR for period 1 year or more.
Birla Sun Life AAF Aggressive Plan - Growth S & P CNX Nifty
Past performance may or may not be sustained in future. Returns are in % and absolute returns forperiod less than 1 year & CAGR for period 1 year or more.
Birla Sun Life AAF Conservative Plan - Growth Crisil MIP Blended Index
Past performance may or may not be sustained in future. Returns are in % and absolute returns forperiod less than 1 year & CAGR for period 1 year or more.
Birla Sun Life AAF Moderate Plan - Growth Crisil Balanced Fund Index
% R
etur
ns
% R
etur
ns
% R
etur
ns
Mutual Fund Units 86.45Birla Sun Life Dynamic Bond Fund - Growth 30.32Birla Sun Life Midcap Fund - Growth 14.64Birla Sun Life Index Fund - Growth 12.89Birla Sun Life Buy India Fund - Growth 7.27Birla Sun Life InternationalEquity Fund - Plan A Growth 6.70Birla Sun Life India Opportunities Fund - Growth 5.16Birla Sun Life MNC Fund - Growth 4.81Birla Sun Life Income Fund - Growth 2.46Birla Sun Life Ultra Short Term Fund - Growth 2.19
Cash & Cash Equivalents 13.62
Net receivables / payables #
Total Net Assets 100.00
Mutual Fund Units 95.26Birla Sun Life Midcap Fund - Growth 19.62Birla Sun Life Buy India Fund - Growth 14.86Birla Sun Life MNC Fund - Growth 14.71Birla Sun Life Dynamic Bond Fund - Growth 14.21Birla Sun Life India Opportunities Fund 13.10Birla Sun Life Index Fund - Growth 12.21Birla Sun Life Income Fund - Growth 3.38Birla Sun Life Ultra Short Term Fund - Growth 2.61Birla Sun Life Gilt Plus Inv - Growth 0.57
Cash & Cash Equivalents 4.60
Net receivables / payables 0.14
Total Net Assets 100.00
Mutual Fund Units 92.50Birla Sun Life Dynamic Bond Fund - Growth 34.61Birla Sun Life Ultra Short Term Fund - Growth 13.19Birla Sun Life Income Plus Fund - Growth 12.72Birla Sun Life Midcap Fund - Growth 7.34Birla Sunlife Cash Manager-Retail Growth 6.98Birla Sun Life MNC Fund - Growth 4.15Birla Sun Life Index Fund - Growth 3.97Birla Sun Life India Opportunities Fund - Growth 3.69Birla Sun Life Income Fund - Growth 3.23Birla Sun Life International Equity Fund - Plan A Growth 2.61
Cash & Cash Equivalents 7.15
Net receivables / payables 0.35
Total Net Assets 100.00
(Past performance is no guarantee of future results.) for ranking methodology please refer page 50
����#Value Research Rating
Hybrid: Debt-oriented(17 Schemes),for 3 & 5 years periods ended 31-May-10
Birla Sun Life AAF - Conservative
Wealth
Creation
Solutions
Fund Details
Investment Objective
Investment Performance - Moderate PlanInvestment Performance - Aggressive Plan
Investment Performance - Conservative Plan
Portfolio & Asset Allocation - Moderate PlanPortfolio & Asset Allocation - Aggressive Plan
Portfolio & Asset Allocation - Conservative Plan
Issuer % to Net Assets Issuer % to Net Assets
Issuer % to Net Assets
����#Value Research Rating
Equity Diversified(169 Schemes),for 3 & 5 years periods ended 31-May-10
Birla Sun Life AAF - Aggressive����
#Value Research Rating
Hybrid: Equity-oriented(30 Schemes),for 3 & 5 years periods ended 31-May-10
Birla Sun Life AAF - Moderate
# Indicates less than 0.01
38
Winner of&Best Fund - 3 yrs performance Lipper Awards India 2010
Mixed Asset INR Balanced, (6 schemes) 3 Yrs Performance (2007-2009)
Birla Sun Life Asset Allocation Fund - Moderate Plan - Growth9
Winner of&Best Fund - 5 yrs performance Lipper Awards India 2010
Mixed Asset INR Balanced, (6 schemes) 5 Yrs Performance (2005-2009)
Birla Sun Life Asset Allocation Fund - Moderate Plan - Growth9
29.50
13.11
20.37 20.31
14.33
5.79
19.48 18.05
0
5
10
15
20
25
30
35
1 Year 3 Years 5 Years Since Inception
21.56
12.03
16.97 16.84
11.19
7.78
15.0813.57
0
5
10
15
20
25
1 Year 3 Years 5 Years Since Inception
12.50
10.29
11.97 11.48
6.347.70
8.337.31
0
2
4
6
8
10
12
14
1 Year 3 Years 5 Years Since Inception
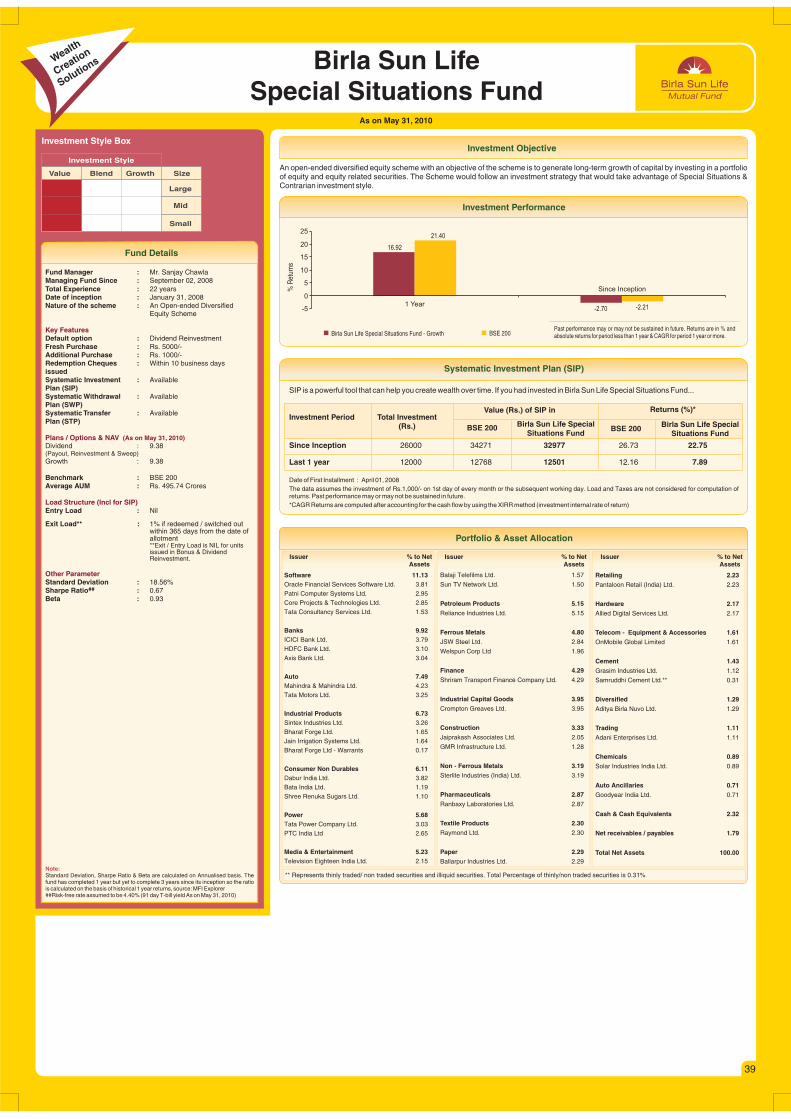
Fund Details
As on May 31, 2010
Investment Objective
Birla Sun LifeSpecial Situations Fund
Value Blend Growth Size
Large
Mid
Small
Investment Style
Investment Style Box
Fund Manager :Managing Fund Since : September 02, 2008Total Experience : 22 yearsDate of inception : January 31, 2008Nature of the scheme : An Open-ended Diversified
Equity Scheme
Default option : Dividend ReinvestmentFresh Purchase : Rs. 5000/-Additional Purchase : Rs. 1000/-Redemption Cheques : Within 10 business days issuedSystematic Investment : AvailablePlan (SIP)Systematic Withdrawal : AvailablePlan (SWP)Systematic Transfer : AvailablePlan (STP)
Dividend : 9.38(Payout, Reinvestment & Sweep)Growth : 9.38
Benchmark : BSE 200Average AUM : Rs. 495.74 Crores
Entry Load : Nil
Exit Load** : 1% if redeemed / switched out within 365 days from the date of allotment**Exit / Entry Load is NIL for units issued in Bonus & Dividend Reinvestment.
Standard Deviation : 18.56%##Sharpe Ratio : 0.67
Beta : 0.93
Mr. Sanjay Chawla
Key Features
Plans / Options & NAV
Load Structure (Incl for SIP)
Other Parameter
(As on May 31, 2010)
Note:Standard Deviation, Sharpe Ratio & Beta are calculated on Annualised basis.fund has completed 1 year but yet to complete 3 years since its inception so the ratiois calculated on the basis of historical 1 year returns, source: MFI Explorer##Risk-free rate assumed to be % (91 day T-bill yield As on May 31, 2010)
The
4.40
An open-ended diversified equity scheme with an objective of the scheme is to generate long-term growth of capital by investing in a portfolioof equity and equity related securities. The Scheme would follow an investment strategy that would take advantage of Special Situations &Contrarian investment style.
Investment Performance
Birla Sun Life Special Situations Fund - Growth BSE 200
% R
etur
ns
Past performance may or may not be sustained in future. Returns are in % and absolute returns for period less than 1 year & CAGR for period 1 year or more.
SIP is a powerful tool that can help you create wealth over time. If you had invested in Birla Sun Life Special Situations Fund...
Systematic Investment Plan (SIP)
Date of First Installment : April 01, 2008The data assumes the investment of Rs.1,000/- on 1st day of every month or the subsequent working day. Load and Taxes are not considered for computation ofreturns. Past performance may or may not be sustained in future.*CAGR Returns are computed after accounting for the cash flow by using the XIRR method (investment internal rate of return)
Investment Period Total Investment(Rs.) Birla Sun Life Special
Situations FundBirla Sun Life Special
Situations FundBSE 200 BSE 200
Value (Rs.) of SIP in Returns (%)*
Since Inception 26000 34271 32977 26.73 22.75
Last 1 year 12000 12768 12501 12.16 7.89
Issuer % to NetAssets
Issuer % to NetAssets
Issuer % to NetAssets
Software 11.13Oracle Financial Services Software Ltd. 3.81
Patni Computer Systems Ltd. 2.95
Core Projects & Technologies Ltd. 2.85
Tata Consultancy Services Ltd. 1.53
Banks 9.92ICICI Bank Ltd. 3.79
HDFC Bank Ltd. 3.10
Axis Bank Ltd. 3.04
Auto 7.49Mahindra & Mahindra Ltd. 4.23
Tata Motors Ltd. 3.25
Industrial Products 6.73Sintex Industries Ltd. 3.26
Bharat Forge Ltd. 1.65
Jain Irrigation Systems Ltd. 1.64
Bharat Forge Ltd - Warrants 0.17
Consumer Non Durables 6.11Dabur India Ltd. 3.82
Bata India Ltd. 1.19
Shree Renuka Sugars Ltd. 1.10
Power 5.68Tata Power Company Ltd. 3.03
PTC India Ltd 2.65
Media & Entertainment 5.23Television Eighteen India Ltd. 2.15
Balaji Telefilms Ltd. 1.57
Sun TV Network Ltd. 1.50
Petroleum Products 5.15
Reliance Industries Ltd. 5.15
Ferrous Metals 4.80
JSW Steel Ltd. 2.84
Welspun Corp Ltd 1.96
Finance 4.29
Shriram Transport Finance Company Ltd. 4.29
Industrial Capital Goods 3.95
Crompton Greaves Ltd. 3.95
Construction 3.33
Jaiprakash Associates Ltd. 2.05
GMR Infrastructure Ltd. 1.28
Non - Ferrous Metals 3.19
Sterlite Industries (India) Ltd. 3.19
Pharmaceuticals 2.87
Ranbaxy Laboratories Ltd. 2.87
Textile Products 2.30
Raymond Ltd. 2.30
Paper 2.29
Ballarpur Industries Ltd. 2.29
Retailing 2.23
Pantaloon Retail (India) Ltd. 2.23
Hardware 2.17
Allied Digital Services Ltd. 2.17
Telecom - Equipment & Accessories 1.61
OnMobile Global Limited 1.61
Cement 1.43
Grasim Industries Ltd. 1.12
Samruddhi Cement Ltd.** 0.31
Diversified 1.29
Aditya Birla Nuvo Ltd. 1.29
Trading 1.11
Adani Enterprises Ltd. 1.11
Chemicals 0.89
Solar Industries India Ltd. 0.89
Auto Ancillaries 0.71
Goodyear India Ltd. 0.71
Cash & Cash Equivalents 2.32
Net receivables / payables 1.79
Total Net Assets 100.00
Portfolio & Asset Allocation
Wealth
Creation
Solutions
39
** Represents thinly traded/ non traded securities and illiquid securities. Total Percentage of thinly/non traded securities is 0.31%
16.92
-2.70
21.40
-2.21-5
0
5
10
15
20
25
1 Year
Since Inception

As on May 31, 2010
Investment ObjectiveFund Details
Birla Sun LifeCommodity Equities Fund
Fund Manager :Mr. Vineet Maloo
Managing Fund Since : Since InceptionTotal Experience : 11 years / 5 YearsDate of inception : November 07, 2008Nature of the scheme : An Open-ended Growth Scheme
Default option : Default Plan: Retail PlanDefault Option: GrowthDefault Facility: Dividend Reinvestment
Retail PlanFresh Purchase : Rs. 5000/-Additional Purchase : Rs. 1000/-Institutional PlanFresh Purchase : Rs. 5,00,00,000/-Additional Purchase : Rs. 10000/-Redemption Cheques : Within 10 working days issuedSystematic Investment : AvailablePlan (SIP)Systematic Withdrawal : AvailablePlan (SWP)Systematic Transfer : AvailablePlan (STP)
Global Agri PlanRetail PlanDividend : 12.96(Payout, Reinvestment & Sweep)Growth : 12.96Global Multi Commodity PlanRetail PlanDividend : 11.59(Payout, Reinvestment & Sweep)Growth : 11.59Global Precious Metals PlanRetail PlanDividend : 12.63(Payout, Reinvestment & Sweep)Growth : 12.63
Benchmark (for all plans) : Global Agri business indexMSCI World indexDow Jones Precious Metals Index
Average AUMGlobal Agri Plan : Rs. 7.10 CroresGlobal Multi Commodity Plan : Rs. 15.07 CroresGlobal Precious Metals Plan : Rs. 2.91 Crores
Entry Load : Nil
Exit Load** : 3% if redeemed / switched out within 30 days from the date of allotment. For redemption/switch-out of units after 30 days but before 365 days from the date of allotment: 1.00% of applicable NAV. For redemption/switch-out of units after 365 days from the date of allotment: Nil.**Exit / Entry Load is NIL for units issued in Bonus & Dividend Reinvestment.
Global Agri PlanStandard Deviation : 16.78%
##Sharpe Ratio : -0.64Beta : 0.68Global Multi Commodity PlanStandard Deviation : 14.70%
##Sharpe Ratio : -0.20Beta : 0.65Global Precious Metals PlanStandard Deviation : 22.88%
##Sharpe Ratio : 0.25Beta : 0.56
Mr. Ankit Sancheti and
Key Features
Plans / Options & NAV
Load Structure (Incl for SIP)
Other Parameter
(As on May 31, 2010)
An Open ended Growth Scheme with the objective to offer long term growth of capital, by investing in (1) stocks of commodity companies, i.e.,companies engaged in or focusing on the specified commodity business and/or (2) overseas mutual fund scheme(s), that have similarinvestment objectives. These securities could be issued in India or overseas.
Note:Standard Deviation, Sharpe Ratio & Beta are calculated on Annualised basis. The fund has completed 1 year but yet to complete 3 years since its inception so the ratiois calculated on the basis of historical 1 year returns, source: MFI Explorer##Risk-free rate assumed to be % (91 day T-bill yield As on May 31, 2010)4.40
Investment Performance(Global Multi Commodity Plan)
Investment Performance(Global Agri Plan)
Investment Performance(Global Precious Metals Plan)
Birla Sun Life Commodity Equities Fund - Global Agri Plan Retail - Growth
Global Agri business index Birla Sun Life Commodity Equities Fund - Global Multi commodity - Retail Growth
MSCI World indexBirla Sun Life Commodity Equities Fund - Global Precious Metal - Retail Growth
Dow Jones Precious Metal Index
Past performance may or may not be sustained in future. Returns are in % and absolute returns for period less than 1 year & CAGR for period 1 year or more.
Portfolio & Asset Allocation (Global Multi Commodity Plan)
Issuer % to NetAssets
Issuer % to NetAssets
Issuer % to NetAssets
Agriculture 21.81Potash Corp of Saskatchewan Inc 3.05Deere & Co 2.47FMC Corp 2.36Monsanto Co 2.19Cosan Ltd 2.13AGCO Corp 2.11Agrium Inc 2.04CF Industries Holdings Inc 1.88Mosaic Co 1.77Yara International ASA 1.82
Energy 28.73Exxon Mobil Corp 5.17Occidental Petroleum Corp 3.42Chesapeake Energy Corp 2.88Schlumberger Ltd 2.86Peabody Energy Corp 2.77Walter Energy Inc 2.54Apache Corp 2.42Massey Energy Co 2.37Halliburton Co 2.11
Petroleo Brasileiro SA 2.18
Industrial metal 18.39Freeport-McMoRan Copper & Gold Inc 2.53United States Steel Corp 2.08Vale SA 2.03Cliffs Natural Resources Inc 1.88Xstrata PLC 1.78Vedanta Resources PLC 1.70OAO SEVERSTAL GDR 1.66Anglo American PLC 1.66Kazakhmys PLC 1.60ArcelorMittal 1.47
Precious metal 17.40Barrick Gold Corp 2.63Newmont Mining Corp 2.16Goldcorp Inc 2.14Silver Wheaton Corp 2.04Agnico-Eagle Mines Ltd 1.84Yamana Gold Inc 1.79Cia de Minas Buenaventura SA 1.71
Portfolio & Asset Allocation (Global Precious Metals Plan)
Issuer % to NetAssets
Issuer % to NetAssets
Foreign Equity 94.17Barrick Gold Corp 4.84
Gold Fields Ltd 4.27
Goldcorp Inc 4.19
Yamana Gold Inc 3.97
Newmont Mining Corp 3.93
Silver Wheaton Corp 3.91
AngloGold Ashanti Ltd 3.80
Cia de Minas Buenaventura SA 3.79
Randgold Resources Ltd 3.68
Hecla Mining Co 3.63
Agnico-Eagle Mines Ltd 3.60
Golden Star Resources Ltd 3.41
Kinross Gold Corp 3.37
Pan American Silver Corp 3.07
IAMGOLD Corp 3.05
Royal Gold Inc 2.92
Harmony Gold Mining Co Ltd 2.91
Eldorado Gold Corp 2.72
Centamin Egypt Ltd 3.30
Petropavlovsk Plc 3.27
Aquarius Platinum Ltd 2.84
Centerra Gold Inc 3.64
Alamos Gold Inc 3.39
Anglo Platinum Ltd. 2.43
Impala Platinum Holdings Ltd 2.15
Newcrest Mining Ltd 2.24
PanAust Ltd 1.56
Zijin Mining Group Co Ltd 2.17
Umicore 2.11
Cash & Cash Equivalents 6.17
Net receivables / payables -0.34
Total Net Assets 100.00
IAMGOLD Corp 1.60Hecla Mining Co 1.49
Water 5.25Danaher Corp 0.67ITT Corp 0.53Nalco Holding Co 0.50Watts Water Technologies Inc 0.49Pentair Inc 0.49Pall Corp 0.47IDEX Corp 0.46Insituform Technologies Inc 0.34United Utilities Group PLC 0.32Veolia Environnement 0.50Geberit AG 0.47
Cash & Cash Equivalents 9.45
Net receivables / payables -1.03
Total Net Assets 100.00
% R
etur
ns
% R
etur
ns
Wealth
Creation
Solutions
Portfolio & Asset Allocation (Global Agri Plan)
Issuer % to NetAssets
Issuer % to NetAssets
Issuer % to NetAssets
Foreign Equity 95.39
Potash Corp of Saskatchewan Inc 6.38
Deere & Co 5.18
Cosan Ltd 4.84
Mosaic Co 4.73
Agrium Inc 4.32
FMC Corp 4.25
CF Industries Holdings Inc 4.20
Monsanto Co 4.17
AGCO Corp 3.38
CNH Global NV 3.50
JBS SA 3.33
Cosan Sa Industria E Comercio 2.98
Marfrig Alimentos SA 2.86
Fertilizantes Fosfatados SA 2.86
BRF - Brasil Foods SA 2.60
Indofood Agri Resources Ltd. 3.48
Noble Group Ltd 2.88
Olam International Ltd 2.30
Sino-Forest Corp 3.42
Viterra Inc 3.06
China Agri-Industries Holdings Ltd 2.51
Sinofert Holdings Ltd 1.72
Yara International ASA 3.63
K+S AG 2.75
Syngenta AG 2.62
Israel Chemicals Ltd 2.46
Kubota Corp 2.15
AWB LTD 1.95
Namhae Chemical Corp 0.89
Cash & Cash Equivalents 4.06
Net receivables / payables 0.55
Total Net Assets 100.00
% R
etur
ns
40
-6.34
18.07
3.49
31.02
-10
-5
0
5
10
15
20
25
30
35
1 Year Since Inception
10.06
16.11
8.79
55.32
0
10
20
30
40
50
60
1 Year Since Inception
1.53
9.9410.57
9.94
0
2
4
6
8
10
12
1 Year Since Inception
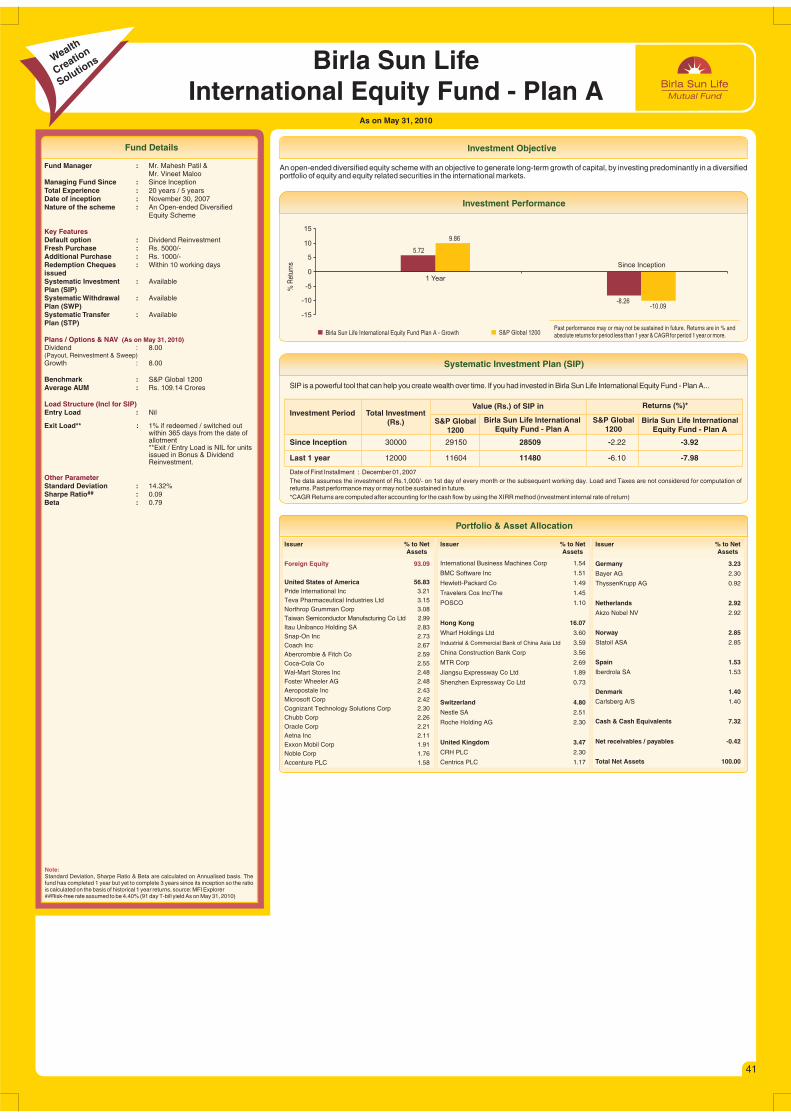
As on May 31, 2010
Investment ObjectiveFund Details
Birla Sun LifeInternational Equity Fund - Plan A
Fund Manager :Mr. Vineet Maloo
Managing Fund Since : Since InceptionTotal Experience : 20 years / 5 yearsDate of inception : November 30, 2007Nature of the scheme : An Open-ended Diversified
Equity Scheme
Default option : Dividend ReinvestmentFresh Purchase : Rs. 5000/-Additional Purchase : Rs. 1000/-Redemption Cheques : Within 10 working days issuedSystematic Investment : AvailablePlan (SIP)Systematic Withdrawal : AvailablePlan (SWP)Systematic Transfer : AvailablePlan (STP)
Dividend : 8.00(Payout, Reinvestment & Sweep)Growth : 8.00
Benchmark : S&P Global 1200Average AUM : Rs. 109.14 Crores
Entry Load : Nil
Exit Load** : 1% if redeemed / switched out within 365 days from the date of allotment**Exit / Entry Load is NIL for units issued in Bonus & Dividend Reinvestment.
Standard Deviation : 14.32%##Sharpe Ratio : 0.09
Beta : 0.79
Mr. Mahesh Patil &
Key Features
Plans / Options & NAV
Load Structure (Incl for SIP)
Other Parameter
(As on May 31, 2010)
Note:Standard Deviation, Sharpe Ratio & Beta are calculated on Annualised basis.fund has completed 1 year but yet to complete 3 years since its inception so the ratiois calculated on the basis of historical 1 year returns, source: MFI Explorer##Risk-free rate assumed to be 4.40% (91 day T-bill yield As on May 31, 2010)
The
An open-ended diversified equity scheme with an objective to generate long-term growth of capital, by investing predominantly in a diversifiedportfolio of equity and equity related securities in the international markets.
Investment Performance
Birla Sun Life International Equity Fund Plan A - Growth S&P Global 1200
% R
etur
ns
Past performance may or may not be sustained in future. Returns are in % and absolute returns for period less than 1 year & CAGR for period 1 year or more.
SIP is a powerful tool that can help you create wealth over time. If you had invested in Birla Sun Life International Equity Fund - Plan A...
Systematic Investment Plan (SIP)
Date of First Installment : December 01, 2007The data assumes the investment of Rs.1,000/- on 1st day of every month or the subsequent working day. Load and Taxes are not considered for computation of returns. Past performance may or may not be sustained in future.*CAGR Returns are computed after accounting for the cash flow by using the XIRR method (investment internal rate of return)
Investment Period Total Investment(Rs.) Birla Sun Life International
Equity Fund - Plan ABirla Sun Life International
Equity Fund - Plan AS&P Global
1200S&P Global
1200
Value (Rs.) of SIP in Returns (%)*
Since Inception 30000 29150 28509 -2.22 -3.92
Last 1 year 12000 11604 11480 -6.10 -7.98
Issuer % to NetAssets
Issuer % to NetAssets
Issuer % to NetAssets
Foreign Equity 93.09
United States of America 56.83Pride International Inc 3.21Teva Pharmaceutical Industries Ltd 3.15Northrop Grumman Corp 3.08Taiwan Semiconductor Manufacturing Co Ltd 2.99Itau Unibanco Holding SA 2.83Snap-On Inc 2.73Coach Inc 2.67Abercrombie & Fitch Co 2.59Coca-Cola Co 2.55Wal-Mart Stores Inc 2.48Foster Wheeler AG 2.48Aeropostale Inc 2.43Microsoft Corp 2.42Cognizant Technology Solutions Corp 2.30Chubb Corp 2.26Oracle Corp 2.21Aetna Inc 2.11Exxon Mobil Corp 1.91Noble Corp 1.76Accenture PLC 1.58
International Business Machines Corp 1.54
BMC Software Inc 1.51
Hewlett-Packard Co 1.49
Travelers Cos Inc/The 1.45
POSCO 1.10
Hong Kong 16.07
Wharf Holdings Ltd 3.60
Industrial & Commercial Bank of China Asia Ltd 3.59
China Construction Bank Corp 3.56
MTR Corp 2.69
Jiangsu Expressway Co Ltd 1.89
Shenzhen Expressway Co Ltd 0.73
Switzerland 4.80
Nestle SA 2.51
Roche Holding AG 2.30
United Kingdom 3.47
CRH PLC 2.30
Centrica PLC 1.17
Germany 3.23
Bayer AG 2.30
ThyssenKrupp AG 0.92
Netherlands 2.92
Akzo Nobel NV 2.92
Norway 2.85
Statoil ASA 2.85
Spain 1.53
Iberdrola SA 1.53
Denmark 1.40
Carlsberg A/S 1.40
Cash & Cash Equivalents 7.32
Net receivables / payables -0.42
Total Net Assets 100.00
Portfolio & Asset Allocation
Wealth
Creation
Solutions
41
5.72
-8.26
9.86
-10.09
-15
-10
-5
0
5
10
15
1 Year
Since Inception
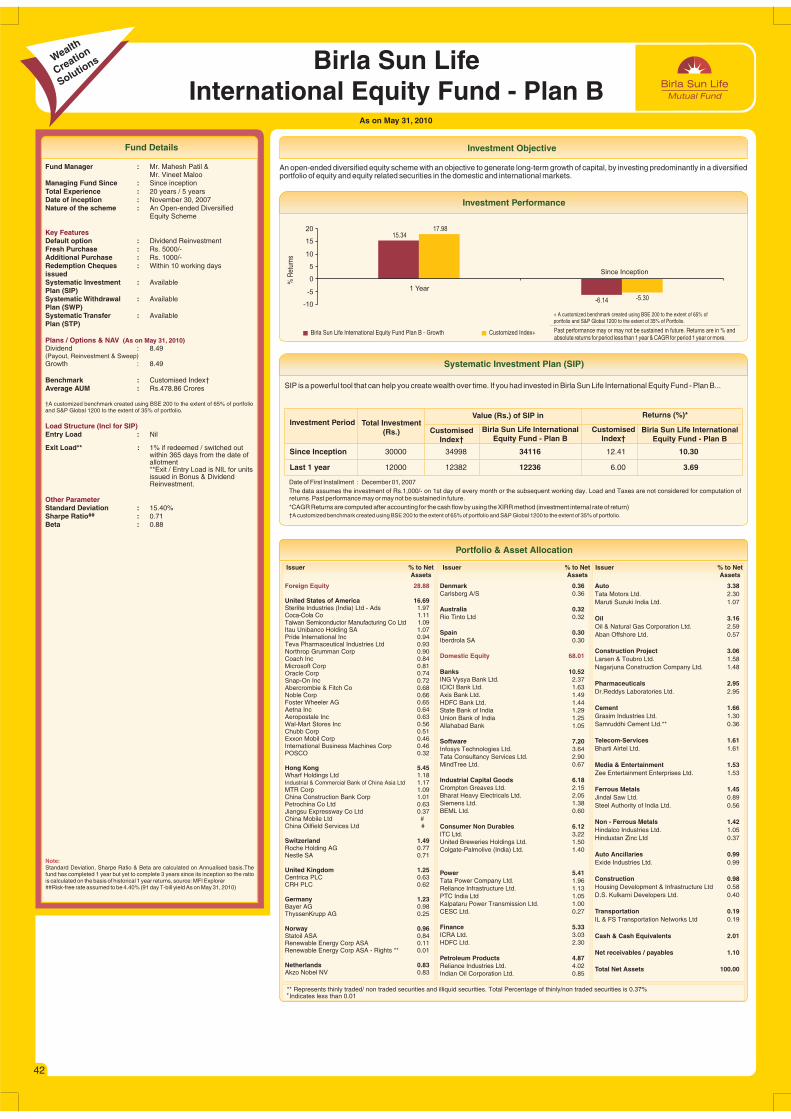
As on May 31, 2010
Investment ObjectiveFund Details
Birla Sun LifeInternational Equity Fund - Plan B
Fund Manager :Mr. Vineet Maloo
Managing Fund Since : Since inceptionTotal Experience : 20 years / 5 yearsDate of inception : November 30, 2007Nature of the scheme : An Open-ended Diversified
Equity Scheme
Default option : Dividend ReinvestmentFresh Purchase : Rs. 5000/-Additional Purchase : Rs. 1000/-Redemption Cheques : Within 10 working days issuedSystematic Investment : AvailablePlan (SIP)Systematic Withdrawal : AvailablePlan (SWP)Systematic Transfer : AvailablePlan (STP)
Dividend : 8.49(Payout, Reinvestment & Sweep)Growth : 8.49
Benchmark : Customised Index†Average AUM : Rs.478.86 Crores
†A customized benchmark created using BSE 200 to the extent of 65% of portfolio and S&P Global 1200 to the extent of 35% of portfolio.
Entry Load : Nil
Exit Load** : 1% if redeemed / switched out within 365 days from the date of allotment**Exit / Entry Load is NIL for units issued in Bonus & Dividend Reinvestment.
Standard Deviation : 15.40%##Sharpe Ratio : 0.71
Beta : 0.88
Mr. Mahesh Patil &
Key Features
Plans / Options & NAV
Load Structure (Incl for SIP)
Other Parameter
(As on May 31, 2010)
Note:Standard Deviation, Sharpe Ratio & Beta are calculated on Annualised basis.fund has completed 1 year but yet to complete 3 years since its inception so the ratiois calculated on the basis of historical 1 year returns, source: MFI Explorer##Risk-free rate assumed to be 4.40% (91 day T-bill yield As on May 31, 2010)
The
An open-ended diversified equity scheme with an objective to generate long-term growth of capital, by investing predominantly in a diversifiedportfolio of equity and equity related securities in the domestic and international markets.
Investment Performance
Birla Sun Life International Equity Fund Plan B - Growth Customized Index+
% R
etur
ns
Past performance may or may not be sustained in future. Returns are in % and absolute returns for period less than 1 year & CAGR for period 1 year or more.
+ A customized benchmark created using BSE 200 to the extent of 65% of portfolio and S&P Global 1200 to the extent of 35% of Portfolio.
SIP is a powerful tool that can help you create wealth over time. If you had invested in Birla Sun Life International Equity Fund - Plan B...
Systematic Investment Plan (SIP)
Date of First Installment : December 01, 2007The data assumes the investment of Rs.1,000/- on 1st day of every month or the subsequent working day. Load and Taxes are not considered for computation of returns. Past performance may or may not be sustained in future.*CAGR Returns are computed after accounting for the cash flow by using the XIRR method (investment internal rate of return)†A customized benchmark created using BSE 200 to the extent of 65% of portfolio and S&P Global 1200 to the extent of 35% of portfolio.
Investment Period Total Investment(Rs.) Birla Sun Life International
Equity Fund - Plan BBirla Sun Life International
Equity Fund - Plan BCustomised
Index†Customised
Index†
Value (Rs.) of SIP in Returns (%)*
Since Inception 30000 34998 34116 12.41 10.30
Last 1 year 12000 12382 12236 6.00 3.69
Issuer % to NetAssets
Issuer % to NetAssets
Issuer % to NetAssets
Foreign Equity 28.88
United States of America 16.69Sterlite Industries (India) Ltd - Ads 1.97Coca-Cola Co 1.11Taiwan Semiconductor Manufacturing Co Ltd 1.09Itau Unibanco Holding SA 1.07Pride International Inc 0.94Teva Pharmaceutical Industries Ltd 0.93Northrop Grumman Corp 0.90Coach Inc 0.84Microsoft Corp 0.81Oracle Corp 0.74Snap-On Inc 0.72Abercrombie & Fitch Co 0.68Noble Corp 0.66Foster Wheeler AG 0.65Aetna Inc 0.64Aeropostale Inc 0.63Wal-Mart Stores Inc 0.56Chubb Corp 0.51Exxon Mobil Corp 0.46International Business Machines Corp 0.46POSCO 0.32
Hong Kong 5.45Wharf Holdings Ltd 1.18Industrial & Commercial Bank of China Asia Ltd 1.17MTR Corp 1.09China Construction Bank Corp 1.01Petrochina Co Ltd 0.63Jiangsu Expressway Co Ltd 0.37China Mobile Ltd #China Oilfield Services Ltd #
Switzerland 1.49Roche Holding AG 0.77Nestle SA 0.71
United Kingdom 1.25Centrica PLC 0.63CRH PLC 0.62
Germany 1.23Bayer AG 0.98ThyssenKrupp AG 0.25
Norway 0.96Statoil ASA 0.84Renewable Energy Corp ASA 0.11Renewable Energy Corp ASA - Rights ** 0.01
Netherlands 0.83Akzo Nobel NV 0.83
Denmark 0.36Carlsberg A/S 0.36
Australia 0.32Rio Tinto Ltd 0.32
Spain 0.30Iberdrola SA 0.30
Banks 10.52ING Vysya Bank Ltd. 2.37ICICI Bank Ltd. 1.63Axis Bank Ltd. 1.49HDFC Bank Ltd. 1.44State Bank of India 1.29Union Bank of India 1.25Allahabad Bank 1.05
Software 7.20Infosys Technologies Ltd. 3.64Tata Consultancy Services Ltd. 2.90MindTree Ltd. 0.67
Industrial Capital Goods 6.18Crompton Greaves Ltd. 2.15Bharat Heavy Electricals Ltd. 2.05Siemens Ltd. 1.38BEML Ltd. 0.60
Consumer Non Durables 6.12ITC Ltd. 3.22United Breweries Holdings Ltd. 1.50Colgate-Palmolive (India) Ltd. 1.40
Power 5.41Tata Power Company Ltd. 1.96Reliance Infrastructure Ltd. 1.13PTC India Ltd 1.05Kalpataru Power Transmission Ltd. 1.00CESC Ltd. 0.27
Finance 5.33ICRA Ltd. 3.03HDFC Ltd. 2.30
Petroleum Products 4.87Reliance Industries Ltd. 4.02Indian Oil Corporation Ltd. 0.85
Domestic Equity 68.01
Auto 3.38Tata Motors Ltd. 2.30Maruti Suzuki India Ltd. 1.07
Oil 3.16Oil & Natural Gas Corporation Ltd. 2.59Aban Offshore Ltd. 0.57
Construction Project 3.06Larsen & Toubro Ltd. 1.58Nagarjuna Construction Company Ltd. 1.48
Pharmaceuticals 2.95Dr.Reddys Laboratories Ltd. 2.95
Cement 1.66Grasim Industries Ltd. 1.30Samruddhi Cement Ltd.** 0.36
Telecom-Services 1.61Bharti Airtel Ltd. 1.61
Media & Entertainment 1.53Zee Entertainment Enterprises Ltd. 1.53
Ferrous Metals 1.45Jindal Saw Ltd. 0.89Steel Authority of India Ltd. 0.56
Non - Ferrous Metals 1.42Hindalco Industries Ltd. 1.05Hindustan Zinc Ltd 0.37
Auto Ancillaries 0.99Exide Industries Ltd. 0.99
Construction 0.98Housing Development & Infrastructure Ltd 0.58D.S. Kulkarni Developers Ltd. 0.40
Transportation 0.19IL & FS Transportation Networks Ltd 0.19
Cash & Cash Equivalents 2.01
Net receivables / payables 1.10
Total Net Assets 100.00
Portfolio & Asset Allocation
Wealth
Creation
Solutions
** Represents thinly traded/ non traded securities and illiquid securities. Total Percentage of thinly/non traded securities is 0.37%# Indicates less than 0.01
42
15.34
-6.14
17.98
-5.30-10
-5
0
5
10
15
20
1 Year
Since Inception
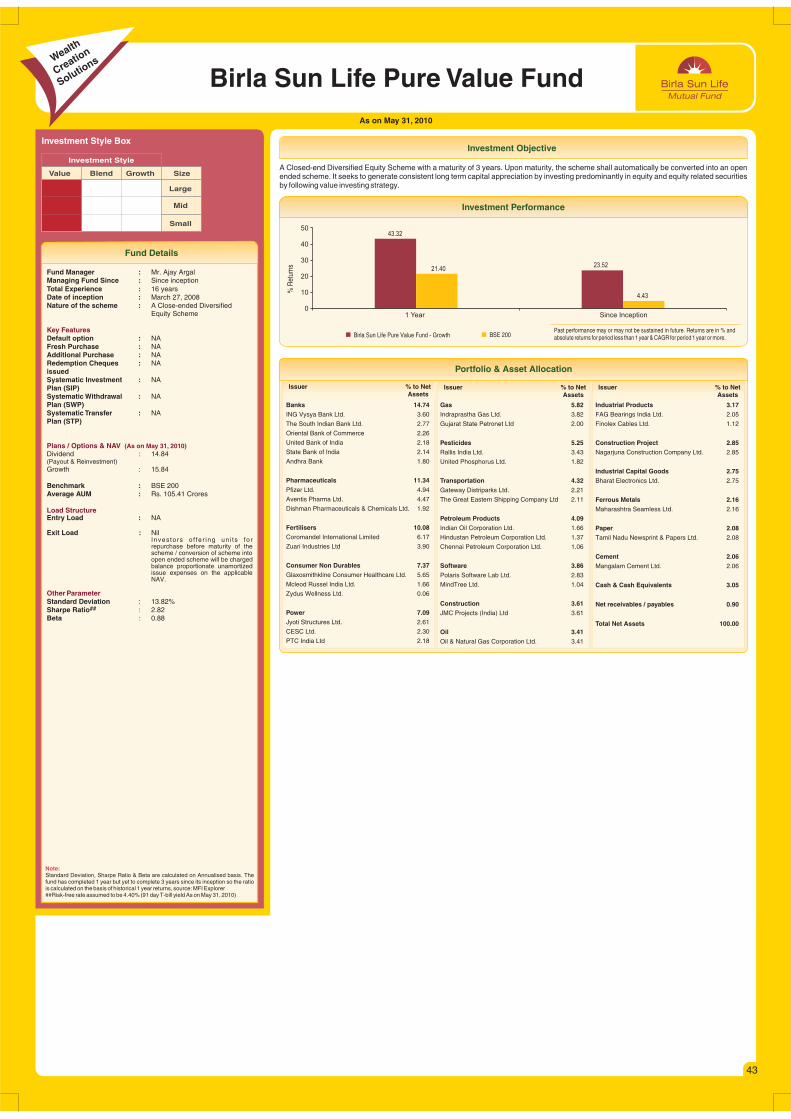
As on May 31, 2010
Birla Sun Life Pure Value Fund
Value Blend Growth Size
Large
Mid
Small
Investment Style
Investment Style Box
Fund Details
Fund Manager :Managing Fund Since : Since inceptionTotal Experience : 16 yearsDate of inception : March 27, 2008Nature of the scheme : A Close-ended Diversified
Equity Scheme
Default option : NAFresh Purchase : NAAdditional Purchase : NARedemption Cheques : NAissuedSystematic Investment : NAPlan (SIP)Systematic Withdrawal : NAPlan (SWP)Systematic Transfer : NAPlan (STP)
Dividend : 14.84(Payout & Reinvestment)Growth : 15.84
Benchmark : BSE 200Average AUM : Rs. 105.41 Crores
Entry Load : NA
Exit Load : NilInvestors o f fe r ing un i ts forrepurchase before maturity of thescheme / conversion of scheme into open ended scheme will be charged balance proportionate unamortizedissue expenses on the applicableNAV.
Standard Deviation : 13.82%##Sharpe Ratio : 2.82
Beta : 0.88
Mr. Ajay Argal
Key Features
Plans / Options & NAV
Load Structure
Other Parameter
(As on May 31, 2010)
Note:Standard Deviation, Sharpe Ratio & Beta are calculated on Annualised basis.fund has completed 1 year but yet to complete 3 years since its inception so the ratiois calculated on the basis of historical 1 year returns, source: MFI Explorer##Risk-free rate assumed to be 4.40% (91 day T-bill yield As on May 31, 2010)
The
A Closed-end Diversified Equity Scheme with a maturity of 3 years. Upon maturity, the scheme shall automatically be converted into an openended scheme. It seeks to generate consistent long term capital appreciation by investing predominantly in equity and equity related securitiesby following value investing strategy.
Investment Objective
Investment Performance
Birla Sun Life Pure Value Fund - Growth BSE 200
% R
etur
ns
Past performance may or may not be sustained in future. Returns are in % and absolute returns for period less than 1 year & CAGR for period 1 year or more.
Issuer % to NetAssets
Issuer % to NetAssets
Issuer % to NetAssets
Banks 14.74ING Vysya Bank Ltd. 3.60
The South Indian Bank Ltd. 2.77
Oriental Bank of Commerce 2.26
United Bank of India 2.18
State Bank of India 2.14
Andhra Bank 1.80
Pharmaceuticals 11.34Pfizer Ltd. 4.94
Aventis Pharma Ltd. 4.47
Dishman Pharmaceuticals & Chemicals Ltd. 1.92
Fertilisers 10.08Coromandel International Limited 6.17
Zuari Industries Ltd 3.90
Consumer Non Durables 7.37Glaxosmithkline Consumer Healthcare Ltd. 5.65
Mcleod Russel India Ltd. 1.66
Zydus Wellness Ltd. 0.06
Power 7.09Jyoti Structures Ltd. 2.61
CESC Ltd. 2.30
PTC India Ltd 2.18
Gas 5.82Indraprastha Gas Ltd. 3.82
Gujarat State Petronet Ltd 2.00
Pesticides 5.25Rallis India Ltd. 3.43
United Phosphorus Ltd. 1.82
Transportation 4.32Gateway Distriparks Ltd. 2.21
The Great Eastern Shipping Company Ltd 2.11
Petroleum Products 4.09Indian Oil Corporation Ltd. 1.66
Hindustan Petroleum Corporation Ltd. 1.37
Chennai Petroleum Corporation Ltd. 1.06
Software 3.86Polaris Software Lab Ltd. 2.83
MindTree Ltd. 1.04
Construction 3.61JMC Projects (India) Ltd 3.61
Oil 3.41Oil & Natural Gas Corporation Ltd. 3.41
Industrial Products 3.17FAG Bearings India Ltd. 2.05
Finolex Cables Ltd. 1.12
Construction Project 2.85Nagarjuna Construction Company Ltd. 2.85
Industrial Capital Goods 2.75Bharat Electronics Ltd. 2.75
Ferrous Metals 2.16Maharashtra Seamless Ltd. 2.16
Paper 2.08Tamil Nadu Newsprint & Papers Ltd. 2.08
Cement 2.06Mangalam Cement Ltd. 2.06
Cash & Cash Equivalents 3.05
Net receivables / payables 0.90
Total Net Assets 100.00
Portfolio & Asset Allocation
Wealth
Creation
Solutions
43
43.32
23.5221.40
4.43
0
10
20
30
40
50
1 Year Since Inception

Fund Details
Investment Objective
Birla Sun Life Long TermAdvantage Fund
As on May 31, 2010
Value Blend Growth Size
Large
Mid
Small
Investment Style
Investment Style Box
Fund Manager :Managing Fund Since : Since inceptionTotal Experience : 16 yearsDate of inception : October 10, 2006Nature of the scheme : A 5 Years Close-ended Scheme
Default option : NAFresh Purchase : NAAdditional Purchase : NARedemption Cheques : NAissuedSystematic Investment : NAPlan (SIP)Systematic Withdrawal : NAPlan (SWP)Systematic Transfer : NAPlan (STP)
Dividend : 12.11(Payout & Reinvestment)Growth : 13.11
Benchmark : BSE SensexAverage AUM : Rs. 307.38 Crores
Entry Load : NA
Exit Load : NilInvestors offering units for repurchasebefore maturity of the scheme /conversion of scheme into openended scheme will be chargedbalance proportionate unamortizedissue expenses on the applicableNAV.
Standard Deviation : 32.21%##Sharpe Ratio : -
Beta : 0.88
Mr. Ajay Argal
Key Features
Plans / Options & NAV
Load Structure
Other Parameter
(As on May 31, 2010)
Note:Standard Deviation, Sharpe Ratio & Beta are calculated on Annualised basis using 3 years history of monthly returns, source: MFI Explorer##Risk-free rate assumed to be 4.40% (91 day T-bill yield As on May 31, 2010)
A 5 years close ended scheme with automatic conversion to an open ended scheme upon maturity with the objective to provide longterm capitalappreciation by investing predominantly in a diversified portfolio of equity and equity related securities.
Investment Performance
Birla Sun Life Long Term Advantage Fund - Growth BSE Sensex
% R
etur
ns
Past performance may or may not be sustained in future. Returns are in % and absolute returns for period less than 1 year & CAGR for period 1 year or more.
Issuer % to NetAssets
Issuer % to NetAssets
Issuer % to NetAssets
Banks 12.45
Axis Bank Ltd. 2.70
ICICI Bank Ltd. 2.64
HDFC Bank Ltd. 2.55
Oriental Bank of Commerce 2.46
State Bank of India 1.76
United Bank Of India 0.35
Software 11.43
Infosys Technologies Ltd. 4.21
Patni Computer Systems Ltd. 2.20
MindTree Ltd. 2.14
Tata Consultancy Services Ltd. 2.00
Subex Ltd. 0.88
Industrial Capital Goods 11.24
McNally Bharat Engineering Company Ltd. 3.81
Bharat Heavy Electricals Ltd. 2.86
Gujarat Apollo Industries Ltd. 2.83
Bharat Electronics Ltd. 1.74
Pesticides 8.58
Rallis India Ltd. 8.58
Auto Ancillaries 6.07
Bosch Ltd. 3.16
Exide Industries Ltd. 2.92
Petroleum Products 5.87
Reliance Industries Ltd. 5.87
Construction Project 5.83
Nagarjuna Construction Company Ltd. 3.13
Larsen & Toubro Ltd. 2.70
Pharmaceuticals 3.84
Dr.Reddy's Laboratories Ltd. 2.22
Cipla Ltd. 1.61
Ferrous Metals 3.38
Maharashtra Seamless Ltd. 3.38
Auto 3.31
Tata Motors Ltd. 3.31
Construction 3.24
GMR Infrastructure Ltd. 1.38
JMC Projects (India) Ltd 1.34
ITD Cementation India Ltd. 0.52
Consumer Non Durables 2.82
ITC Ltd. 2.82
Oil 2.64
Oil & Natural Gas Corporation Ltd. 2.64
Finance 2.63HDFC Ltd. 2.63
Cement 2.60Kesoram Industries Ltd. 2.60
Industrial Products 2.51FAG Bearings India Ltd. 2.51
Telecom-Services 2.45Bharti Airtel Ltd. 2.45
Transportation 2.20IL&FS Transportation Networks Ltd. 2.20
Power 1.84KEC International Ltd. 1.84
Gas 1.80GAIL India Ltd. 1.80
Engineering 1.17Engineers India Ltd. 1.17
Cash & Cash Equivalents 4.00
Net receivables / payables -1.91
Total Net Assets 100.00
Portfolio & Asset Allocation
Wealth
Creation
Solutions
44
33.10
4.557.72
15.86
5.227.76
0
5
10
15
20
25
30
35
1 Year 3 Years Since Inception

J u n e 2 0 1 0
Dividend History(For select Schemes)
Non Corporate Corporate
After payment of dividend, NAV will fall to the extent of the payout and statutory levy, if any. Past performance is no guarantee of future results.
DEBT SCHEMES
# # DEBT SCHEMES Date Face Value Dividend Dividend Cum Dividend NAV(Rs. per unit) (Rs. per unit) (Rs. per unit)
Birla Sun Life Savings Fund - Institutional 26-Mar-10 0.0259 0.0241 10.2580
30-Apr-10 0.0390 0.0363 10.2790
28-May-10 0.0290 0.0270 10.2740
Birla Sun Life Savings Fund - Retail 26-Mar-10 0.0226 0.0210 10.2337
30-Apr-10 0.0350 0.0326 10.2538
28-May-10 0.0261 0.0243 10.2489
Birla Sun Life Ulttra Short Term Fund - 30-Mar-10 0.0287 0.0267 10.7532
30-Apr-10 0.0336 0.0313 10.7652
31-May-10 0.0307 0.0286 10.7709
Birla Sun Life Dynamic Bond Fund - Retail 24-Apr-09 0.0526 0.0489 10.4961
30-Jun-09 0.1664 0.1549 11.2343
29-Sep-09 0.1568 0.1459 11.2341
31-Dec-09 0.1358 0.1264 11.2253
30-Mar-10 0.1301 0.1211 11.2720
Birla Sun Life Income Plus 16-Jun-08 0.1634 0.1520 10.6083
15-Sep-08 0.1594 0.1484 10.8205
15-Dec-08 0.2090 0.1945 11.7199
16-Mar-09 0.2277 0.2120 11.5018
15-Jun-09 0.2190 0.2038 11.4616
15-Sep-09 0.1239 0.1153 11.3907
15-Dec-09 0.1229 0.1144 11.3564
15-Mar-10 0.0526 0.0489 11.2701
Birla Sun Life Income Fund- 17-Mar-08 0.4752 0.4423 11.6359
16-Mar-09 0.4467 0.4158 11.9496
15-Mar-10 0.2453 0.2283 11.5557
Birla Sun Life Income Fund - 15-Sep-08 0.1613 0.1501 10.9178
15-Dec-08 0.2110 0.1964 11.7458
16-Mar-09 0.2277 0.2120 11.1896
15-Jun-09 0.0876 0.0815 10.9322
15-Sep-09 0.1196 0.1113 11.0205
15-Dec-09 0.1428 0.1329 11.0263
15-Mar-10 0.0876 0.0815 10.9137
Birla Sun Life Gilt Plus - Liquid Plan - 22-Oct-08 0.0061 0.0057 10.4045
15-Dec-08 0.1384 0.1288 10.5148
16-Mar-09 0.2102 0.1957 10.4492
15-Jun-09 0.1314 0.1223 10.3190
15-Sep-09 0.0898 0.0836 10.2416
15-Dec-09 0.0554 0.0515 10.2064
15-Mar-10 0.0701 0.0652 10.2300
Birla Sun Life Gilt Plus - PF Plan 15-Sep-08 0.1332 0.1240 10.3951
15-Dec-08 0.2013 0.1873 11.2919
16-Mar-09 0.2190 0.2038 10.4392
15-Jun-09 0.0876 0.0815 10.1703
15-Sep-09 0.0088 0.0082 10.0989
15-Dec-09 0.1211 0.1128 10.2548
15-Mar-10 0.0263 0.0245 10.0900
Birla Sun Life Gilt Plus - Regular Plan 15-Sep-08 0.1454 0.1353 11.6963
15-Dec-08 0.2267 0.2110 12.9233
16-Mar-09 0.2540 0.2364 12.4390
15-Jun-09 0.1664 0.1549 12.2848
15-Sep-09 0.0801 0.0745 12.0337
15-Dec-09 0.1303 0.1213 12.0244
15-Mar-10 0.0876 0.0815 11.8600
Birla Sun Life Govt. Securities - 16-Mar-09 0.7883 0.7337 11.5177
15-Sep-09 0.3267 0.3041 11.4130
15-Mar-10 0.3067 0.2854 11.3546
Birla Sun Life Govt. Securities - 15-Sep-08 0.1095 0.1109 10.2966
15-Dec-08 0.1111 0.1034 10.3417
16-Mar-09 0.2015 0.1875 10.2841
15-Jun-09 0.0876 0.0815 10.1322
15-Sep-09 0.0447 0.0416 10.0789
15-Dec-09 0.0385 0.0359 10.0779
15-Mar-10 0.0438 0.0408 10.1242
Birla Sun Life Short Term 15-Dec-08 0.1098 0.1022 10.2182
16-Mar-09 0.2015 0.1875 10.3932
27-Apr-09 0.0876 0.0815 10.2657
15-Jun-09 0.1314 0.1223 10.2689
15-Sep-09 0.1340 0.1247 10.3079
15-Dec-09 0.1219 0.1135 10.3235
15-Mar-10 0.1077 0.1003 10.3124
10.00
10.00
10.00
10.00
10.00
10.00
10.00
10.00
10.00
10.00
10.00
10.00
10.00
10.00
10.00
10.00
10.00
10.00
10.00
10.00
10.00
10.00
10.00
10.00
10.00
10.00
10.00
10.00
10.00
10.00
10.00
10.00
10.00
10.00
10.00
10.00
10.00
10.00
10.00
10.00
10.00
10.00
10.00
10.00
10.00
10.00
10.00
10.00
10.00
10.00
10.00
10.00
10.00
10.00
10.00
10.00
10.00
10.00
10.00
10.00
10.00
10.00
10.00
Opportunities Fund 10.00
10.00
10.00
10.00
10.00
10.00
10.00
Quarterly Dividend
Quartery Dividend
Monthly Dividend
Monthly Dividend
Monthly Dividend
Half Yearly Dividend
Long Term Dividend
Non Corporate Corporate
Quarterly Dividend
Quarterly Dividend
Quarterly Dividend
Quarterly Dividend
Short Term Dividend
45
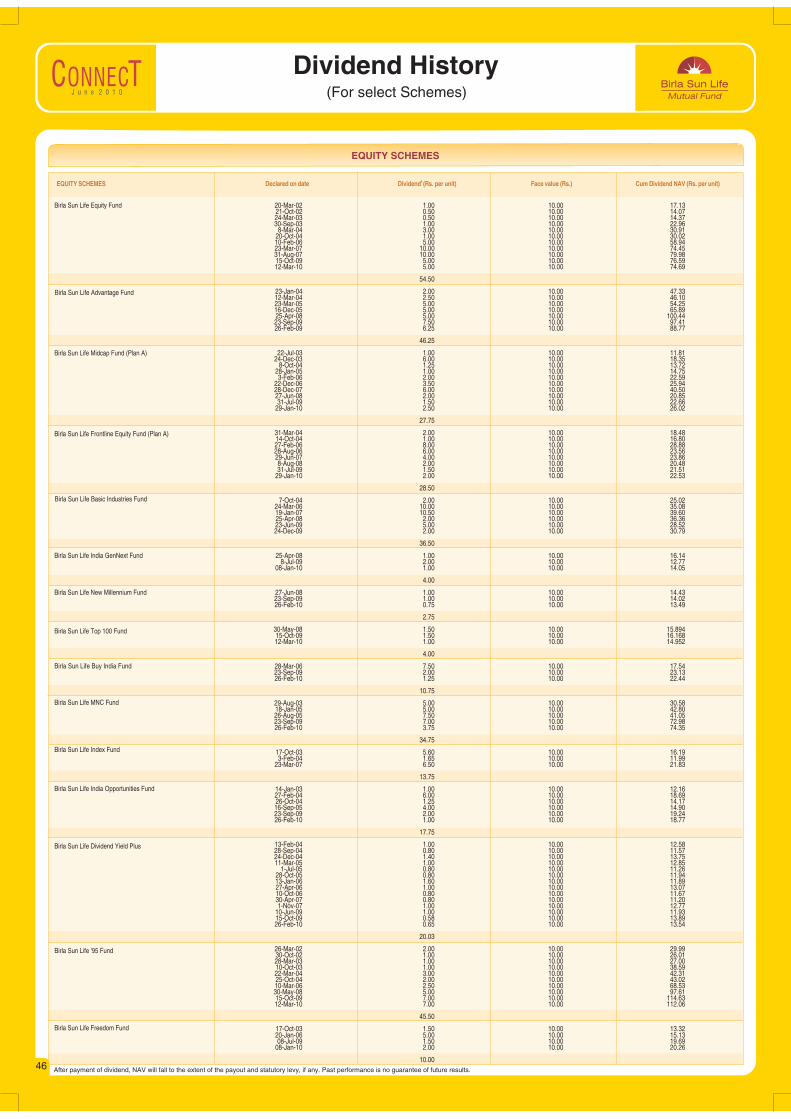
J u n e 2 0 1 0
Dividend History(For select Schemes)
EQUITY SCHEMES
After payment of dividend, NAV will fall to the extent of the payout and statutory levy, if any. Past performance is no guarantee of future results.
#EQUITY SCHEMES Declared Dividend Face value Cum Dividend NAVon date (Rs. per unit) (Rs.) (Rs. per unit)
Birla Sun Life Advantage Fund
Birla Sun Life Dividend Yield Plus
Birla Sun Life Index Fund
Birla Sun Life India GenNext Fund
Birla Sun Life India Opportunities Fund
Birla Sun Life Midcap Fund (Plan A)
Birla Sun Life Basic Industries Fund
Birla Sun Life Equity Fund
Birla Sun Life Frontline Equity Fund (Plan A)
Birla Sun Life New Millennium Fund
Birla Sun Life Top 100 Fund
Birla Sun Life '95 Fund
Birla Sun Life Freedom Fund
20-Mar-02 1.00 10.00 17.1321-Oct-02 0.50 10.00 14.0724-Mar-03 0.50 10.00 14.3730-Sep-03 1.00 10.00 22.96
8-Mar-04 3.00 10.00 30.9120-Oct-04 1.00 10.00 30.0210-Feb-06 5.00 10.00 58.9423-Mar-07 10.00 10.00 74.4531-Aug-07 10.00 10.00 79.9815-Oct-09 5.00 10.00 76.5912-Mar-10 5.00 10.00 74.69
54.50
23-Jan-04 2.00 10.00 47.3312-Mar-04 2.50 10.00 46.1023-Mar-05 5.00 10.00 54.2516-Dec-05 5.00 10.00 65.8925-Apr-08 5.00 10.00 100.4423-Sep-09 7.50 10.00 97.4126-Feb-09 6.25 10.00 88.77
46.25
22-Jul-03 1.00 10.00 11.8124-Dec-03 6.00 10.00 18.35
8-Oct-04 1.25 10.00 13.7228-Jan-05 1.00 10.00 14.753-Feb-06 2.00 10.00 22.59
22-Dec-06 3.50 10.00 25.9428-Dec-07 6.00 10.00 40.5027-Jun-08 2.00 10.00 20.8531-Jul-09 1.50 10.00 22.66
29-Jan-10 2.50 10.00 26.02
27.75
31-Mar-04 2.00 10.00 18.4814-Oct-04 1.00 10.00 16.8027-Feb-06 8.00 10.00 28.8828-Aug-06 6.00 10.00 23.5629-Jun-07 4.00 10.00 23.868-Aug-08 2.00 10.00 20.4831-Jul-09 1.50 10.00 21.51
29-Jan-10 2.00 10.00 22.53
28.50
7-Oct-04 2.00 10.00 25.0224-Mar-06 10.00 10.00 35.0819-Jan-07 10.50 10.00 39.6025-Apr-08 2.00 10.00 36.3623-Jun-09 5.00 10.00 28.5224-Dec-09 2.00 10.00 30.79
36.50
25-Apr-08 1.00 10.00 16.148-Jul-09 2.00 10.00 12.77
08-Jan-10 1.00 10.00 14.05
4.00
27-Jun-08 1.00 10.00 14.4323-Sep-09 1.00 10.00 14.0226-Feb-10 0.75 10.00 13.49
2.75
30-May-08 1.50 10.00 15.89415-Oct-09 1.50 10.00 16.16812-Mar-10 1.00 10.00 14.952
4.00
28-Mar-06 7.50 10.00 17.5423-Sep-09 2.00 10.00 23.1326-Feb-10 1.25 10.00 22.44
10.75
29-Aug-03 5.00 10.00 30.5818-Jan-05 5.00 10.00 42.8026-Aug-05 7.50 10.00 41.0523-Sep-09 7.00 10.00 72.9826-Feb-10 3.75 10.00 74.35
34.75
17-Oct-03 5.60 10.00 16.193-Feb-04 1.65 10.00 11.99
23-Mar-07 6.50 10.00 21.83
13.75
14-Jan-03 1.00 10.00 12.1627-Feb-04 6.00 10.00 18.6926-Oct-04 1.25 10.00 14.1716-Sep-05 4.00 10.00 14.9023-Sep-09 2.00 10.00 19.2426-Feb-10 1.00 10.00 18.77
17.75
13-Feb-04 1.00 10.00 12.5828-Sep-04 0.80 10.00 11.5724-Dec-04 1.40 10.00 13.7511-Mar-05 1.00 10.00 12.85
1-Jul-05 0.80 10.00 11.2628-Oct-05 0.80 10.00 11.9413-Jan-06 1.60 10.00 11.8927-Apr-06 1.00 10.00 13.0710-Oct-06 0.80 10.00 11.6730-Apr-07 0.80 10.00 11.201-Nov-07 1.00 10.00 12.77
10-Jun-09 1.00 10.00 11.9315-Oct-09 0.58 10.00 13.8926-Feb-10 0.65 10.00 13.54
20.03
26-Mar-02 2.00 10.00 29.9930-Oct-02 1.00 10.00 26.0128-Mar-03 1.00 10.00 27.0010-Oct-03 1.00 10.00 38.5922-Mar-04 3.00 10.00 42.3125-Oct-04 2.00 10.00 43.0210-Mar-06 2.50 10.00 68.5330-May-08 5.00 10.00 97.6115-Oct-09 7.00 10.00 114.6312-Mar-10 7.00 10.00 112.06
45.50
17-Oct-03 1.50 10.00 13.3220-Jan-06 5.00 10.00 15.1308-Jul-09 1.50 10.00 19.69
08-Jan-10 2.00 10.00 20.26
10.00
Birla Sun Life MNC Fund
Birla Sun Life Buy India Fund
46
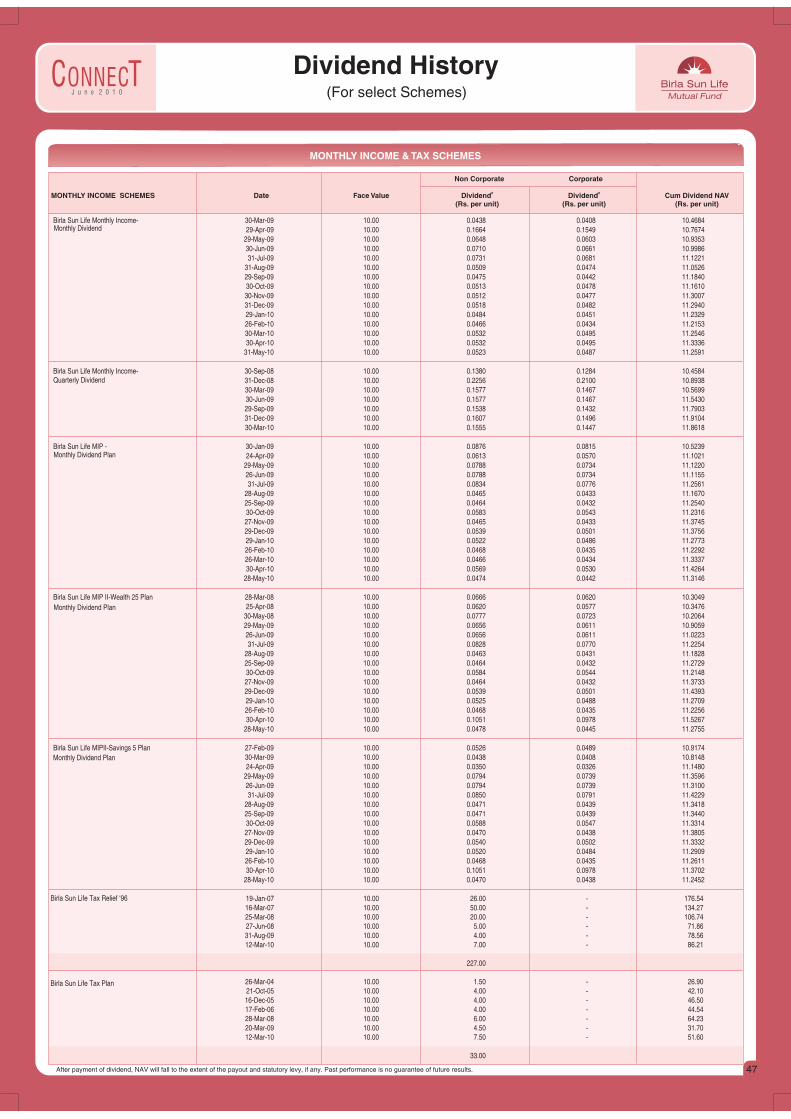
J u n e 2 0 1 0
Dividend History(For select Schemes)
MONTHLY INCOME & TAX SCHEMES
#MONTHLY INCOME SCHEMES Date Face Value Dividend Cum Dividend NAV(Rs. per unit) (Rs. per unit) (Rs. per unit)
#Dividend
Non Corporate Corporate
After payment of dividend, NAV will fall to the extent of the payout and statutory levy, if any. Past performance is no guarantee of future results.
Quarterly Dividend
Monthly DividendBirla Sun Life Monthly Income- 30-Mar-09 10.00 0.0438 0.0408 10.4684
29-Apr-09 10.00 0.1664 0.1549 10.7674
29-May-09 10.00 0.0648 0.0603 10.9353
30-Jun-09 10.00 0.0710 0.0661 10.9986
31-Jul-09 0.0731 0.0681 11.1221
31-Aug-09 0.0509 0.0474 11.0526
29-Sep-09 0.0475 0.0442 11.1840
30-Oct-09 0.0513 0.0478 11.1610
30-Nov-09 0.0512 0.0477 11.3007
31-Dec-09 0.0518 0.0482 11.2940
29-Jan-10 0.0484 0.0451 11.2329
26-Feb-10 0.0466 0.0434 11.2153
30-Mar-10 0.0532 0.0495 11.2546
30-Apr-10 0.0532 0.0495 11.3336
31-May-10 0.0523 0.0487 11.2591
Birla Sun Life Monthly Income- 30-Sep-08 0.1380 0.1284 10.4584
31-Dec-08 0.2256 0.2100 10.8938
30-Mar-09 0.1577 0.1467 10.5699
30-Jun-09 0.1577 0.1467 11.5430
29-Sep-09 0.1538 0.1432 11.7903
31-Dec-09 0.1607 0.1496 11.9104
30-Mar-10 0.1555 0.1447 11.8618
Birla Sun Life MIP - 30-Jan-09 0.0876 0.0815 10.5239
24-Apr-09 0.0613 0.0570 11.1021
29-May-09 0.0788 0.0734 11.1220
26-Jun-09 0.0788 0.0734 11.1155
31-Jul-09 0.0834 0.0776 11.2561
28-Aug-09 0.0465 0.0433 11.1670
25-Sep-09 0.0464 0.0432 11.2540
30-Oct-09 0.0583 0.0543 11.2316
27-Nov-09 0.0465 0.0433 11.3745
29-Dec-09 0.0539 0.0501 11.3756
29-Jan-10 0.0522 0.0486 11.2773
26-Feb-10 0.0468 0.0435 11.2292
26-Mar-10 0.0466 0.0434 11.3337
30-Apr-10 0.0569 0.0530 11.4264
28-May-10 0.0474 0.0442 11.3146
Birla Sun Life MIP II-Wealth 25 Plan 28-Mar-08 0.0666 0.0620 10.3049
25-Apr-08 0.0620 0.0577 10.3476
30-May-08 0.0777 0.0723 10.2064
29-May-09 0.0656 0.0611 10.9059
26-Jun-09 0.0656 0.0611 11.0223
31-Jul-09 0.0828 0.0770 11.2254
28-Aug-09 0.0463 0.0431 11.1828
25-Sep-09 0.0464 0.0432 11.2729
30-Oct-09 0.0584 0.0544 11.2148
27-Nov-09 0.0464 0.0432 11.3733
29-Dec-09 0.0539 0.0501 11.4393
29-Jan-10 0.0525 0.0488 11.2709
26-Feb-10 0.0468 0.0435 11.2256
30-Apr-10 0.1051 0.0978 11.5267
28-May-10 0.0478 0.0445 11.2755
Birla Sun Life MIPII-Savings 5 Plan 27-Feb-09 0.0526 0.0489 10.9174
30-Mar-09 0.0438 0.0408 10.8148
24-Apr-09 0.0350 0.0326 11.1480
29-May-09 0.0794 0.0739 11.3596
26-Jun-09 0.0794 0.0739 11.3100
31-Jul-09 0.0850 0.0791 11.4229
28-Aug-09 0.0471 0.0439 11.3418
25-Sep-09 0.0471 0.0439 11.3440
30-Oct-09 0.0588 0.0547 11.3314
27-Nov-09 0.0470 0.0438 11.3805
29-Dec-09 0.0540 0.0502 11.3332
29-Jan-10 0.0520 0.0484 11.2909
26-Feb-10 0.0468 0.0435 11.2611
30-Apr-10 0.1051 0.0978 11.3702
28-May-10 0.0470 0.0438 11.2452
10.00
10.00
10.00
10.00
10.00
10.00
10.00
10.00
10.00
10.00
10.00
10.00
10.00
10.00
10.00
10.00
10.00
10.00
10.00
10.00
10.00
10.00
10.00
10.00
10.00
10.00
10.00
10.00
10.00
10.00
10.00
10.00
10.00
10.00
10.00
10.00
10.00
10.00
10.00
10.00
10.00
10.00
10.00
10.00
10.00
10.00
10.00
10.00
10.00
10.00
10.00
10.00
10.00
10.00
10.00
10.00
10.00
10.00
10.00
10.00
10.00
10.00
10.00
Monthly Dividend Plan
Monthly Dividend Plan
Birla Sun Life Tax Relief ‘96
Birla Sun Life Tax Plan
19-Jan-07 26.00 - 176.54
16-Mar-07 50.00 - 134.27
25-Mar-08 20.00 - 106.74
27-Jun-08 5.00 - 71.86
31-Aug-09 4.00 - 78.56
12-Mar-10 7.00 - 86.21
227.00
26-Mar-04 1.50 - 26.90
21-Oct-05 4.00 - 42.10
16-Dec-05 4.00 - 46.50
17-Feb-06 4.00 - 44.54
28-Mar-08 6.00 - 64.23
20-Mar-09 4.50 - 31.70
12-Mar-10 7.50 - 51.60
33.00
10.00
10.00
10.00
10.00
10.00
10.00
10.00
10.00
10.00
10.00
10.00
10.00
10.00
Monthly Dividend Plan
47
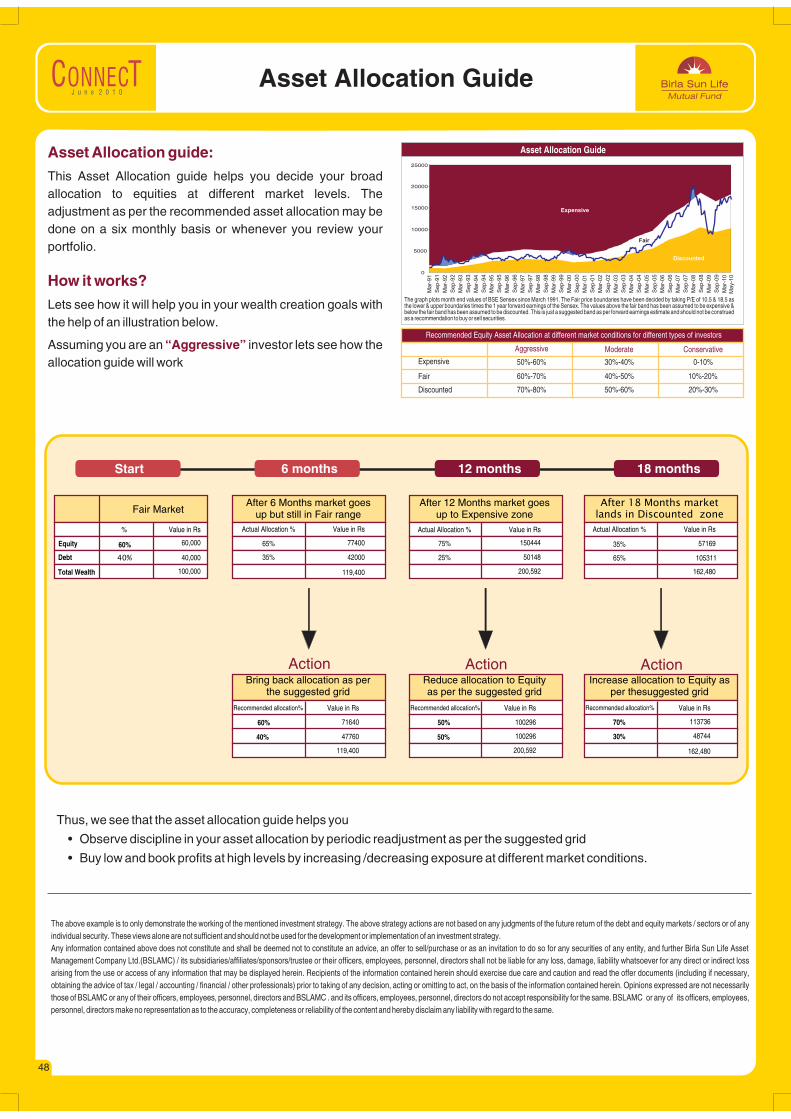
J u n e 2 0 1 0Asset Allocation Guide
Asset Allocation guide:
How it works?
“Aggressive”
This Asset Allocation guide helps you decide your broadallocation to equities at different market levels. Theadjustment as per the recommended asset allocation may bedone on a six monthly basis or whenever you review yourportfolio.
Lets see how it will help you in your wealth creation goals withthe help of an illustration below.
Assuming you are an investor lets see how theallocation guide will work
Recommended Equity Asset Allocation at different market conditions for different types of investors
Aggressive Moderate Conservative
Expensive 50%-60% 30%-40% 0-10%
Fair 60%-70% 40%-50% 10%-20%
Discounted 70%-80% 50%-60% 20%-30%
Asset Allocation Guide
The graph plots month end values of BSE Sensex since March 1991. The Fair price boundaries have been decided by taking P/E of 10.5 & 18.5 asthe lower & upper boundaries times the 1 year forward earnings of the Sensex. The values above the fair band has been assumed to be expensive &below the fair band has been assumed to be discounted. This is just a suggested band as per forward earnings estimate and should not be construedas a recommendation to buy or sell securities.
Start 6 months 12 months 18 months
% Value in Rs Actual Allocation % Actual Allocation %Value in Rs Value in Rs
Equity 60% 60,000 65% 77400 75% 150444
Debt 40% 40,000 35% 42000 25% 50148
Total Wealth 100,000 119,400 200,592
Fair MarketAfter 6 Months market goes
up but still in Fair range
Action
Value in RsRecommended allocation%
60% 71640
40% 47760
119,400
Bring back allocation as perthe suggested grid
After 12 Months market up to Expensive zone
goes
Actual Allocation % Value in Rs
35% 57169
65% 105311
162,480
After 18 Months market
lands in Discounted zone
Action
Value in RsRecommended allocation%
70% 113736
30% 48744
162,480
Increase allocation to per thesuggested grid
Equity as Action
Value in RsRecommended allocation%
50% 100296
50% 100296
200,592
Reduce allocation to Equityas per the suggested grid
Thus, we see that the asset allocation guide helps you
• Observe discipline in your asset allocation by periodic readjustment as per the suggested grid
• Buy low and book profits at high levels by increasing /decreasing exposure at different market conditions.
The above example is to only demonstrate the working of the mentioned investment strategy. The above strategy actions are not based on any judgments of the future return of the debt and equity markets / sectors or of any
individual security. These views alone are not sufficient and should not be used for the development or implementation of an investment strategy.
Any information contained above does not constitute and shall be deemed not to constitute an advice, an offer to sell/purchase or as an invitation to do so for any securities of any entity, and further Birla Sun Life Asset
Management Company Ltd.(BSLAMC) / its subsidiaries/affiliates/sponsors/trustee or their officers, employees, personnel, directors shall not be liable for any loss, damage, liability whatsoever for any direct or indirect loss
arising from the use or access of any information that may be displayed herein. Recipients of the information contained herein should exercise due care and caution and read the offer documents (including if necessary,
obtaining the advice of tax / legal / accounting / financial / other professionals) prior to taking of any decision, acting or omitting to act, on the basis of the information contained herein. Opinions expressed are not necessarily
those of BSLAMC or any of their officers, employees, personnel, directors and BSLAMC . and its officers, employees, personnel, directors do not accept responsibility for the same. BSLAMC or any of its officers, employees,
personnel, directors make no representation as to the accuracy, completeness or reliability of the content and hereby disclaim any liability with regard to the same.
Ma
r-9
1
Se
p-9
1
Ma
r-9
2
Se
p-9
2
Ma
r-9
3
Se
p-9
3
Ma
r-9
4
Se
p-9
4
Ma
r-9
5
Se
p-9
5
Ma
r-9
6
Se
p-9
6
Ma
r-9
7
Se
p-9
7
Ma
r-9
8
Se
p-9
8
Ma
r-9
9
Se
p-9
9
Ma
r-0
0
Se
p-0
0
Ma
r-0
1
Se
p-0
1
Ma
r-0
2
Se
p-0
2
Ma
r-0
3
Se
p-0
3
Ma
r-0
4
Se
p-0
4
Ma
r-0
5
Se
p-0
5
Ma
r-0
6
Se
p-0
6
Ma
r-0
7
Se
p-0
7
Ma
r-0
8
Se
p-0
8
Ma
r-0
9
Se
p-0
9
Ma
r-1
0
0
5000
10000
15000
20000
25000
Ma
y-1
0
Expensive
Expensive
Discounted
Fair
48

J u n e 2 0 1 0
Mumbai_SundayDate - May 16, 2010
The Economic TimesDate - May 17, 2010
Business StandardDate - May 30, 2010
49
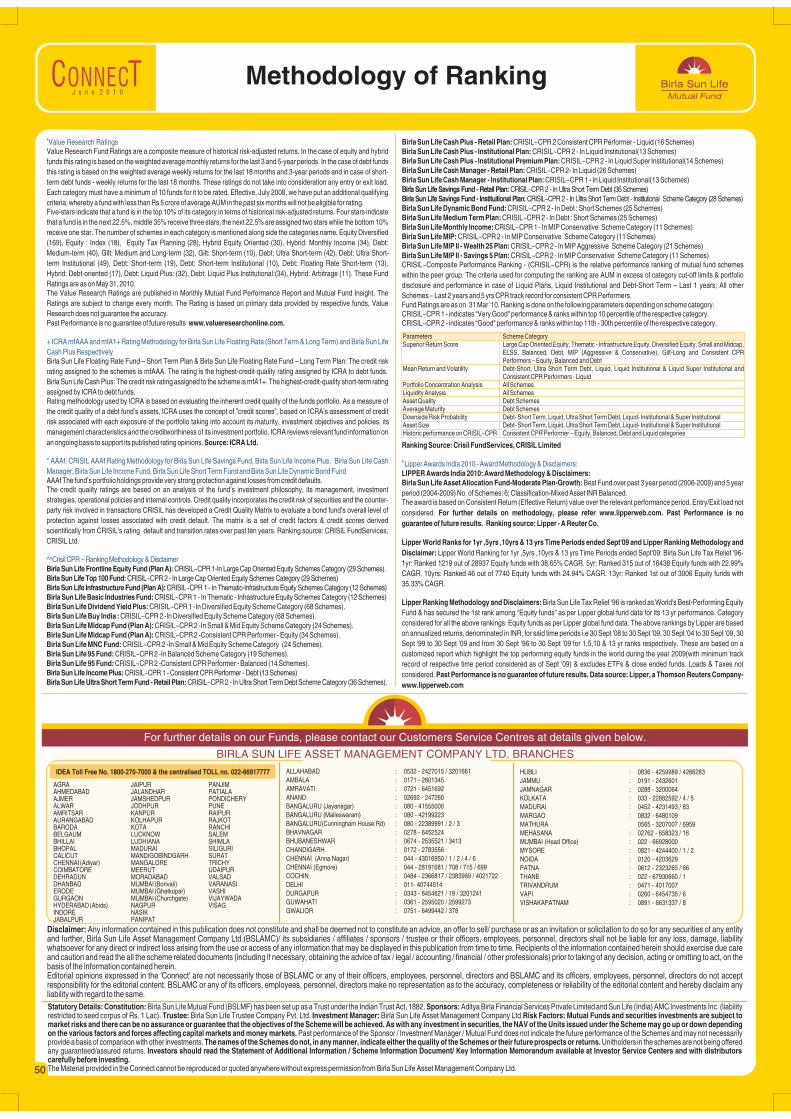
#Value Research Ratings
+ ICRA mfAAA and mfA1+ Rating Methodology for Birla Sun Life Floating Rate (Short Term & Long Term) and Birla Sun Life
Cash Plus Respectively
* AAAf: CRISIL AAAf Rating Methodology for Birla Sun Life Savings Fund, Birla Sun Life Income Plus, Birla Sun Life Cash
Manager, Birla Sun Life Income Fund, Birla Sun Life Short Term Fund and Birla Sun Life Dynamic Bond Fund
^^Crisil CPR – Ranking Methodology & Disclaimer
Value Research Fund Ratings are a composite measure of historical risk-adjusted returns. In the case of equity and hybrid
funds this rating is based on the weighted average monthly returns for the last 3 and 5-year periods. In the case of debt funds
this rating is based on the weighted average weekly returns for the last 18 months and 3-year periods and in case of short-
term debt funds - weekly returns for the last 18 months. These ratings do not take into consideration any entry or exit load.
Each category must have a minimum of 10 funds for it to be rated. Effective, July 2008, we have put an additional qualifying
criteria, whereby a fund with less than Rs 5 crore of average AUM in the past six months will not be eligible for rating.Five-stars indicate that a fund is in the top 10% of its category in terms of historical risk-adjusted returns. Four stars indicate
that a fund is in the next 22.5%, middle 35% receive three stars, the next 22.5% are assigned two stars while the bottom 10%
receive one star. The number of schemes in each category is mentioned along side the categories name. Equity Diversified
(169), Equity : Index (18), Equity Tax Planning (28), Hybrid Equity Oriented (30), Hybrid: Monthly Income (34), Debt:
Medium-term (40), Gilt: Medium and Long-term (32), Gilt: Short-term (10), Debt: Ultra Short-term (42), Debt: Ultra Short-
term Institutional (49), Debt: Short-term (19), Debt: Short-term Institutional (10), Debt: Floating Rate Short-term (13),
Hybrid: Debt-oriented (17), Debt: Liquid Plus: (32), Debt: Liquid Plus Institutional:(34), Hybrid: Arbitrage (11). These Fund
Ratings are as on May 31, 2010.The Value Research Ratings are published in Monthly Mutual Fund Performance Report and Mutual Fund Insight. The
Ratings are subject to change every month. The Rating is based on primary data provided by respective funds, Value
Research does not guarantee the accuracy.
Past Performance is no guarantee of future results www.valueresearchonline.com.
Birla Sun Life Floating Rate Fund – Short Term Plan & Birla Sun Life Floating Rate Fund – Long Term Plan: The credit risk
rating assigned to the schemes is mfAAA. The rating is the highest-credit-quality rating assigned by ICRA to debt funds.
Birla Sun Life Cash Plus: The credit risk rating assigned to the scheme is mfA1+. The highest-credit-quality short-term rating
assigned by ICRA to debt funds.Rating methodology used by ICRA is based on evaluating the inherent credit quality of the funds portfolio. As a measure of
the credit quality of a debt fund’s assets, ICRA uses the concept of ”credit scores”, based on ICRA’s assessment of credit
risk associated with each exposure of the portfolio taking into account its maturity, investment objectives and policies, its
management characteristics and the creditworthiness of its investment portfolio. ICRA reviews relevant fund information on
an ongoing basis to support its published rating opinions. Source: ICRA Ltd.
AAAf The fund’s portfolio holdings provide very strong protection against losses from credit defaults.The credit quality ratings are based on an analysis of the fund’s investment philosophy, its management, investment
strategies, operational policies and internal controls. Credit quality incorporates the credit risk of securities and the counter-
party risk involved in transactions CRISIL has developed a Credit Quality Matrix to evaluate a bond fund’s overall level of
protection against losses associated with credit default. The matrix is a set of credit factors & credit scores derived
scientifically from CRISIL’s rating default and transition rates over past ten years. Ranking source: CRISIL FundServices,
CRISIL Ltd.
Birla Sun Life Frontline Equity Fund (Plan A): CRISIL~CPR 1-In Large Cap Oriented Equity Schemes Category (29 Schemes).
Birla Sun Life Top 100 Fund: CRISIL~CPR 2 - In Large Cap Oriented Equity Schemes Category (29 Schemes)
Birla Sun Life Infrastructure Fund (Plan A): CRISIL~CPR 1 - In Thematic-Infrastructure Equity Schemes Category (12 Schemes)
Birla Sun Life Basic Industries Fund: CRISIL~CPR 1 - In Thematic - Infrastructure Equity Schemes Category (12 Schemes)
Birla Sun Life Dividend Yield Plus: CRISIL~CPR 1 -In Diversified Equity Scheme Category (68 Schemes).
Birla Sun Life Buy India : CRISIL~CPR 2 -In Diversified Equity Scheme Category (68 Schemes).
Birla Sun Life Midcap Fund (Plan A): CRISIL~CPR 2 -In Small & Mid Equity Scheme Category (24 Schemes).
Birla Sun Life Midcap Fund (Plan A): CRISIL~CPR 2 -Consistent CPR Performer - Equity (34 Schemes).
Birla Sun Life MNC Fund: CRISIL~CPR 2 -In Small & Mid Equity Scheme Category (24 Schemes).
Birla Sun Life 95 Fund: CRISIL~CPR 2 -In Balanced Scheme Category (19 Schemes).
Birla Sun Life 95 Fund: CRISIL~CPR 2 -Consistent CPR Performer - Balanced (14 Schemes).
Birla Sun Life Income Plus: CRISIL~CPR 1 - Consistent CPR Performer - Debt (13 Schemes)
Birla Sun Life Ultra Short Term Fund - Retail Plan: CRISIL~CPR 2 - In Ultra Short Term Debt Scheme Category (36 Schemes).
Birla Sun Life Cash Plus - Retail Plan: CRISIL~CPR 2 Consistent CPR Performer - Liquid (16 Schemes)
Birla Sun Life Cash Plus - Institutional Plan: CRISIL~CPR 2 - In Liquid Institutional(13 Schemes)
Birla Sun Life Cash Plus - Institutional Premium Plan: CRISIL~CPR 2 - In Liquid Super Institutional(14 Schemes)
Birla Sun Life Cash Manager - Retail Plan: CRISIL~CPR 2- In Liquid (26 Schemes)
Birla Sun Life Cash Manager - Institutional Plan: CRISIL~CPR 1 - In Liquid Institutional(13 Schemes)
Birla Sun Life Savings Fund - Retail Plan: CRISIL~CPR 2 - In Ultra Short Term Debt (36 Schemes)
Birla Sun Life Savings Fund - Instituitional Plan: CRISIL~CPR 2 - In Ultra Short Term Debt - Institutional Scheme Category (28 Schemes)
Birla Sun Life Dynamic Bond Fund: CRISIL~CPR 2 - In Debt : Short Schemes (25 Schemes)
Birla Sun Life Medium Term Plan: CRISIL~CPR 2 - In Debt : Short Schemes (25 Schemes)
Birla Sun Life Monthly Income: CRISIL~CPR 1 - In MIP Conservative Scheme Category (11 Schemes)
Birla Sun Life MIP: CRISIL~CPR 2 - In MIP Conservative Scheme Category (11 Schemes)
Birla Sun Life MIP II - Wealth 25 Plan: CRISIL~CPR 2 - In MIP Aggressive Scheme Category (21 Schemes)
Birla Sun Life MIP II - Savings 5 Plan: CRISIL~CPR 2 - In MIP Conservative Scheme Category (11 Schemes)CRISIL~Composite Performance Ranking - (CRISIL~CPR) is the relative performance ranking of mutual fund schemes
within the peer group. The criteria used for computing the ranking are AUM in excess of category cut-off limits & portfolio
disclosure and performance in case of Liquid Plans, Liquid Institutional and Debt-Short Term – Last 1 years; All other
Schemes – Last 2 years and 5 yrs CPR track record for consistent CPR Performers.Fund Ratings are as on 31 Mar ‘10. Ranking is done on the following parameters depending on scheme category.CRISIL~CPR 1 - indicates “Very Good" performance & ranks within top 10 percentile of the respective category.CRISIL~CPR 2 - indicates “Good" performance & ranks within top 11th - 30th percentile of the respective category.
Ranking Source: Crisil FundServices, CRISIL Limited
LIPPER Awards India 2010: Award Methodology & Disclaimers:
Birla Sun Life Asset Allocation Fund-Moderate Plan-Growth: Best Fund over past 3 year period (2006-2009) and 5 year
period (2004-2009) No. of Schemes: 6; Classification-Mixed Asset INR Balanced.The award is based on Consistent Return (Effective Return) value over the relevant performance period. Entry/Exit load not
considered. For further details on methodology, please refer www.lipperweb.com. Past Performance is no
guarantee of future results. Ranking source: Lipper - A Reuter Co.
&Lipper Awards India 2010 - Award Methodology & Disclaimers:
Lipper World Ranks for 1yr ,5yrs ,10yrs & 13 yrs Time Periods ended Sept'09 and Lipper Ranking Methodology and
Disclaimer: Lipper World Ranking for 1yr ,5yrs ,10yrs & 13 yrs Time Periods ended Sept'09: Birla Sun Life Tax Relief '96-
1yr: Ranked 1219 out of 28937 Equity funds with 38.65% CAGR. 5yr: Ranked 315 out of 16438 Equity funds with 22.99%
CAGR. 10yrs: Ranked 46 out of 7740 Equity funds with 24.94% CAGR. 13yr: Ranked 1st out of 3006 Equity funds with
35.33% CAGR.
Lipper Ranking Methodology and Disclaimers: Birla Sun Life Tax Relief '96 is ranked as World's Best-Performing Equity
Fund & has secured the 1st rank among “Equity funds” as per Lipper global fund data for its 13 yr performance. Category
considered for all the above rankings: Equity funds as per Lipper global fund data. The above rankings by Lipper are based
on annualized returns, denominated in INR, for said time periods i.e 30 Sept '08 to 30 Sept '09, 30 Sept '04 to 30 Sept '09, 30
Sept '99 to 30 Sept '09 and from 30 Sept '96 to 30 Sept '09 for 1,5,10 & 13 yr ranks respectively. These are based on a
customized report which highlight the top performing equity funds in the world during the year 2009(with minimum track
record of respective time period considered as of Sept '09) & excludes ETFs & close ended funds. Loads & Taxes not
considered. Past Performance is no guarantee of future results. Data source: Lipper, a Thomson Reuters Company-
www.lipperweb.com
For further details on our Funds, please contact our Customers Service Centres at details given below.
BIRLA SUN LIFE ASSET MANAGEMENT COMPANY LTD. BRANCHES
Disclaimer: Any information contained in this publication does not constitute and shall be deemed not to constitute an advice, an offer to sell/ purchase or as an invitation or solicitation to do so for any securities of any entityand further, Birla Sun Life Asset Management Company Ltd.(BSLAMC)/ its subsidiaries / affiliates / sponsors / trustee or their officers, employees, personnel, directors shall not be liable for any loss, damage, liabilitywhatsoever for any direct or indirect loss arising from the use or access of any information that may be displayed in this publication from time to time. Recipients of the information contained herein should exercise due careand caution and read the all the scheme related documents (including if necessary, obtaining the advice of tax / legal / accounting / financial / other professionals) prior to taking of any decision, acting or omitting to act, on thebasis of the information contained herein.Editorial opinions expressed in the 'Connect' are not necessarily those of BSLAMC or any of their officers, employees, personnel, directors and BSLAMC and its officers, employees, personnel, directors do not acceptresponsibility for the editorial content. BSLAMC or any of its officers, employees, personnel, directors make no representation as to the accuracy, completeness or reliability of the editorial content and hereby disclaim anyliability with regard to the same.
Statutory Details: Constitution: Birla Sun Life Mutual Fund (BSLMF) has been set up as a Trust under the Indian Trust Act, 1882. Sponsors: Aditya Birla Financial Services Private Limited and Sun Life (India) AMC Investments Inc. (liabilityrestricted to seed corpus of Rs. 1 Lac). Trustee: Birla Sun Life Trustee Company Pvt. Ltd. Investment Manager: Birla Sun Life Asset Management Company Ltd.Risk Factors: Mutual Funds and securities investments are subject tomarket risks and there can be no assurance or guarantee that the objectives of the Scheme will be achieved. As with any investment in securities, the NAV of the Units issued under the Scheme may go up or down dependingon the various factors and forces affecting capital markets and money markets. Past performance of the Sponsor / Investment Manager / Mutual Fund does not indicate the future performance of the Schemes and may not necessarilyprovide a basis of comparison with other investments. The names of the Schemes do not, in any manner, indicate either the quality of the Schemes or their future prospects or returns. Unitholders in the schemes are not being offeredany guaranteed/assured returns. Investors should read the Statement of Additional Information / Scheme Information Document/ Key Information Memorandum available at Investor Service Centers and with distributors carefully before investing.The Material provided in the Connect cannot be reproduced or quoted anywhere without express permission from Birla Sun Life Asset Management Company Ltd.
ALLAHABAD : 0532 - 2427015 / 3201661
AMBALA : 0171 - 2601345
AMRAVATI : 0721 - 6451692
ANAND : 02692 - 247260
BANGALURU (Jayanagar) : 080 - 41555000
BANGALURU (Malleswaram) : 080 - 42199223
BANGALURU(Cunningham House Rd) : 080 - 22389991 / 2 / 3
BHAVNAGAR : 0278 - 6452524
BHUBANESHWAR : 0674 - 2535521 / 3413
CHANDIGARH : 0172 - 2783556
CHENNAI (Anna Nagar) : 044 - 43016950 / 1 / 2 / 4 / 6
CHENNAI (Egmore) : 044 - 28191681 / 708 / 715 / 699
COCHIN : 0484 - 2366817 / 2383969 / 4021722
DELHI : 011- 40744514
DURGAPUR : 0343 - 6454621 / 19 / 3201241
GUWAHATI : 0361 - 2595020 / 2599273
GWALIOR : 0751 - 6499442 / 378
AGRA JAIPUR PANJIMAHMEDABAD JALANDHAR PATIALAAJMER JAMSHEDPUR PONDICHERYALWAR JODHPUR PUNEAMRITSAR KANPUR RAIPURAURANGABAD KOLHAPUR RAJKOTBARODA KOTA RANCHIBELGAUM LUCKNOW SALEMBHILLAI LUDHIANA SHIMLABHOPAL MADURAI SILIGURICALICUT MANDIGOBINDGARH SURATCHENNAI (Adiyar) MANGALORE TRICHYCOIMBATORE MEERUT UDAIPURDEHRADUN MORADABAD VALSADDHANBAD MUMBAI (Borivali) VARANASIERODE MUMBAI (Ghatkopar) VASHIGURGAON MUMBAI (Churchgate) VIJAYWADAHYDERABAD(Abids) NAGPUR VISAGINDORE NASIKJABALPUR PANIPAT
HUBLI : 0836 - 4259989 / 4266283
JAMMU : 0191 - 2432601
JAMNAGAR : 0288 - 3200064
KOLKATA : 033 - 22882592 / 4 / 5
MADURAI : 0452 - 4231493 / 83
MARGAO : 0832 - 6480109
MATHURA 0565 - 3207007 / 6959
MEHASANA : 02762 - 658323 / 16
MUMBAI (Head Office) : 022 - 66928000
MYSORE : 0821 - 4244400 / 1 / 2
NOIDA : 0120 - 4203629
PATNA : 0612 - 2323265 / 66
THANE : 022 - 67930660 / 1
TRIVANDRUM : 0471 - 4017007
VAPI : 0260 - 6454735 / 6
VISHAKAPATNAM : 0891 - 6631337 / 8
IDEA Toll Free No. 1800-270-7000 & the centralised TOLL no. 022-66917777
Parameters Scheme CategorySuperior Return Score Large Cap Oriented Equity, Thematic - Infrastructure Equity, Diversified Equity, Small and Midcap,
ELSS, Balanced, Debt, MIP (Aggressive & Conservative), Gilt-Long and Consistent CPRPerformers – Equity, Balanced and Debt
Mean Return and Volatility Debt-Short, Ultra Short Term Debt, Liquid, Liquid Institutional & Liquid Super Institutional andConsistent CPR Performers - Liquid
Portfolio Concentration Analysis All SchemesLiquidity Analysis All SchemesAsset Quality Debt SchemesAverage Maturity Debt SchemesDownside Risk Probability Debt- Short Term, Liquid, Ultra Short Term Debt, Liquid- Institutional & Super InstitutionalAsset Size Debt- Short Term, Liquid, Ultra Short Term Debt, Liquid- Institutional & Super InstitutionalHistoric performance on CRISIL~CPR Consistent CPR Performer – Equity, Balanced, Debt and Liquid categories
J u n e 2 0 1 0
50

assistance,round the clock.
www.birlasunlife.com/mobile
Online PortfolioAccess
www.birlasunlife.com
Mobile InvestmentManager
All India Telephone
• View portfolio summary
• View transaction history
• Track your portfolio
• Purchase, Switch & Redeem
• Change TPIN (Telephone Personal Identification Number)
• Get Account Statement instantly
Toll Free : 1-800-22-7000 1-800-270-7000
Non Toll Free : +91 22 6691 7777
(MTNL/BSNL)