birth characteristics and early-life social
TRANSCRIPT
Longitudinal and Life Course Studies 2010 Volume 1 Issue 4 pp 317-338
317
Birth characteristics and early-life social characteristics predict unequal educational outcomes across the life course and across generations
Data from a Swedish cohort born 1915-1929 and their grandchildren born 1973-1980
Anna Goodman London School of Hygiene and Tropical Medicine; Centre for Health Equity Studies, Stockholm University/Karolinska Institute
Marit D Gisselmann Centre for Health Equity Studies, Stockholm University/Karolinska Institute Ilona Koupil Centre for Health Equity Studies, Stockholm University/Karolinska Institute [email protected]
(Received April 2010 Revised September 2010)
Abstract We investigated the effects of adverse birth characteristics and social disadvantage upon educational outcomes over the lifecourse and across generations. Our subjects were 12,674 Swedish infants born 1915-1929 and 9,706 of their grandchildren born 1973-1980. Within both cohorts, better school achievement (schoolmarks in elementary school) was predicted by: heavier birthweight, lower birth order, older mother, married mother and higher family social class. These effects persisted after mutual-adjustment, and birth characteristics and family composition did not play a major role in explaining social class effects. There were no independent effects of pre-term or twin status, but weak evidence of a disadvantage to post-term infants. The predictors of education continuation (secondary school attendance and entrance to tertiary education) were very similar, with family composition and social class effects persisting even after adjusting for school achievement. In cross-generational analyses, better educational outcomes in the grandchildren were predicted by heavier birthweight, lower birth order and higher social class in the grandparents. These associations became non-significant and/or were substantially attenuated after adjusting for grandchild socio-economic position in childhood, suggesting that this was the major mechanism for this effect. We conclude that multiple early-life characteristics predict educational outcomes across the lifecourse and across generations. This includes birth characteristics and family composition effects which typically receive far less attention than socio-economic influences. Most effects were remarkably stable across the half-century separating our cohorts, suggesting their potential relevance for understanding educational inequalities in populations around the world.
Keywords: Birth characteristics; early-life characteristics; education continuation; educational inequalities;
inter-generational effects; school achievement; social characteristics; socio-economic position

Anna Goodman, Marit D Gisselmann, Ilona Koupil Early-life predictors of educational inequalities in Sweden
318
Introduction Social inequalities create inequities within societies in health, employment and living conditions, and may also decrease well-being in society as a whole (World Health Organization, 2008). Educational level is a major route whereby social inequalities are recreated across generations – indeed, in Sweden it appears to be the dominant mechanism (Jonsson 2004). Equalising educational opportunities and outcomes was therefore a major political goal in Sweden during the twentieth century, motivating many of the school reforms which occurred since 1945 (Husén and Boalt 1967, Björklund et al 2003). Inequalities in adult educational outcomes may reflect differences in academic achievement in school and/or differences in the probability that a student continues to higher education (Boudon 1974). There is accumulating evidence that adverse birth characteristics and early-life social disadvantage impact negatively upon cognitive development and educational attainment, and growing interest in the role of these early-life characteristics in explaining educational inequalities. This paper examines this issue across the lifecourse and across generations, using two Swedish birth cohorts. The first cohort comprises infants born 1915-1929 in Uppsala, Sweden, whom we refer to as ‘G1s’ (Generation 1s). The second cohort is drawn from their Swedish-born grandchildren born 1973-1980, whom we call ‘G3s’ (Generation 3s). Historical context Sweden experienced substantial changes in the years separating our cohorts. Living standards rose dramatically, a comprehensive social support system was established and infant mortality fell from 64/1,000 in the G1s to 7/1,000 in the G3s. Average family size remained around two, but both childlessness and very large families became rarer (Eckstein et al 1999; Modin 2002b). Simultaneously, childbearing outside of marriage became more common and substantially more socially acceptable. By contrast, unmarried mothers in the G1 cohort faced considerable stigma, and this may partly explain the poorer birth outcomes and higher mortality of their offspring (Modin 2003).
Existing evidence on early-life characteristics and educational outcomes Birth characteristics. During the past decade, strong evidence has accumulated that pre-term or low birthweight infants are more likely to experience cognitive impairment and difficulties in school (Bhutta et al 2002). More recently, researchers have turned their attention to the effects of birth characteristics within the normal range. The protective effect of higher birthweight appears to extend across the normal range, with heavier infants having progressively better cognitive and educational outcomes (Shenkin et al 2004). By contrast, a smaller number of studies suggest that an intermediate gestational age is optimal, with poorer childhood outcomes in post-term infants (Record et al 1969b; Yang et al 2010). More modest disadvantages from adverse birth characteristics may also persist into later adolescence (Breslau et al 2004; Boardman et al 2002; Eide et al 2007) and be reflected in lower completion of secondary school or university (Jefferis et al 2002; Conley and Bennett 2000). These effects upon education continuation are most plausibly mediated by earlier inequalities in school achievement, but to our knowledge no studies examine this explicitly. Birth order, mother’s age and mother’s marital status. Studies from around the world report poorer educational outcomes in children with many siblings, probably reflecting a ‘dilution’ of parental investments of time and money (Steelman et al 2002). Most large studies also find an independent disadvantage to later-born children (Bjerkedal et al 2007). For example, birth order had a greater effect than family size or social class when predicting school achievement and continuation among 11,000 children born in Stockholm in 1953 (Walldén 1990; Walldén 1992). Fewer studies examine maternal age, but these generally report better cognitive or educational outcomes for children of older mothers (Lawlor et al 2005; Lawlor et al 2006; Record et al 1969a; Eide et al 2007). Findings are less consistent for children of unmarried mothers; some studies find a marked disadvantage (Lawlor et al 2005; Eide et al 2007), others find no difference or a difference only in some groups (Boardman et al 2002; Desai et al 1989). This inconsistency may be because the effects of mother’s marital status are particularly likely to be context-specific.
Anna Goodman, Marit D Gisselmann, Ilona Koupil Early-life predictors of educational inequalities in Sweden
319
Family socio-economic position. In societies around the world, low family socio-economic position predicts poorer school achievement and lower education continuation (Bradley and Corwyn 2002). In Sweden, strong social gradients in schoolmarks and/or education continuation were demonstrated in longitudinal studies of 1,549 children in the 1930s al 1969) and 5,306 children in the 1950s (Husén and Boalt 1967). Socio-economic position likewise affects both school achievement (Björklund et al 2003) and education continuation net of school performance (Berggren 2006) among Swedish students born at the same time as the G3s. These socio-economic inequalities appear to reflect multiple factors, including early cognitive development, parental aspirations and the child’s own perceptions of the benefits of education (Erikson and Jonsson 1996; Guo 1998). It is also plausible that socio-economic inequalities may partly reflect systematic differences in birth characteristics or family composition, although relatively few studies address this question directly (Shenkin et al 2004). Contribution of the present paper Thus many early-life characteristics predict educational outcomes. Few studies examine multiple factors simultaneously, however, making it hard to assess which effects are independent or which are strongest. Similarly, few studies investigate both school achievement and education continuation, preventing ready assessment of how far the former may explain any differences in the latter. Finally, although education plays a major role in recreating social inequalities across generations (Jonsson 2004), no previous study has examined whether individuals’ early-life characteristics predict educational outcomes in their descendants. These limitations also apply to published evidence on the G1s and G3s. Among the G1s, Modin (2002a) has demonstrated that low birthweight, higher birth order, unmarried mother and lower social class predict failing to complete three years of secondary school. Modin also showed similar trends for schoolmarks in a small subset (N=720), though mostly not statistically significant. Among the G3s, male gender, pre-term birth and higher birth order predict schoolmarks in Swedish, with the effect of pre-term birth being
confined to less well-educated parents (Gisselmann et al 2010). No previous analysis, however, has used all these early-life characteristics, has presented adequately-powered analyses of both school achievement and education continuation, or has examined cross-generational effects. This paper redresses these limitations through a comprehensive investigation of which early-life characteristics predict school achievement and education continuation. First, we present analyses of each cohort separately, testing the hypotheses that 1) any association between family social class and school achievement is explained by birth characteristics and family composition, and 2) any association between early-life characteristics and education continuation is explained by earlier school achievement. We then present cross-generational analyses, testing the hypotheses that 3) early-life characteristics of the G1s predict educational outcomes in their G3 grandchildren, and 4) any such associations are explained by G3 childhood socio-economic position. In testing these hypotheses, this paper presents the first analysis of how and why birth characteristics and early-life social characteristics may affect educational outcomes across generations. It also presents the first direct comparison of early-life determinants in the G1 and G3 cohorts, thereby shedding light on how far Sweden has achieved its long-standing political goal of equalising educational opportunities.
Methods Study populations Our study populations come from the Uppsala Multigenerational Birth Cohort Study (Koupil 2007). The G1s are drawn from the 14,192 live births between 1915 and 1929 at the Uppsala University Hospital. Of these, 13,811 (97.3%) were traced through parish archives until death, emigration or until their unique personal registration number was assigned, usually in 1947. For the 12,168 G1s assigned personal numbers and still alive in Sweden in 1960, record linkage provided information across their adult lives. This included identifying all registered descendents in the Swedish Multigenerational registry. Our G3 cohort is drawn from their 10,036 grandchildren born in Sweden between 1973 and 1980. In this paper, we excluded the 1,518 G1s and 239 G3s who died or emigrated before the spring of

Anna Goodman, Marit D Gisselmann, Ilona Koupil Early-life predictors of educational inequalities in Sweden
320
the year when they turned 20, this being the age necessary to attain the educational outcomes of interest. We likewise excluded the 91 adopted G3s – this data was not available for G1s. Our study populations therefore consisted of the remaining 12,674 G1s (6,560 male, 6,114 female) and 9,706 G3s (4,924 male, 4,782 female). The G1s Uppsala Birth Cohort has previously been demonstrated to be broadly representative of Sweden in 1915–1929 (Rajaleid et al 2008). To assess the representativeness of our G3 cohort, we used register data to compare their characteristics to those of all births in Sweden 1973-1980. Early-life characteristics
For the G1s, archived obstetric records provided data on their gender; birthweight; gestational age; birth multiplicity; birth order; mother’s age; mother’s marital status; and family social class (see Table 1). The Swedish medical birth register (established 1973) provided the corresponding G3 information, with the exception of family social class which came from the 1980 Swedish census. These registers also provided the data we used to assess the representativeness of our G3 cohort relative to all Swedish births in 1973-1980. Family social class was coded using the Swedish socio-economic classification scheme (SEI: Statistics Sweden 1989). We assigned G1 social class using father’s occupation if recorded (80.1%) or mother’s occupation if not (19.9%). G1 social class categories included ‘housedaughters’, namely mothers living with their parents. We assigned G3 social class using the occupation of the head of household - i.e. the resident adult with the highest occupational social class (Erikson 1984); in 23.1 % of households this was the mother, in 55.4% the mother’s partner and in 21.6% both parents had the same social class. We were unable to use this ‘head of household’ method for the G1s because the mother’s occupation was usually missing if the father’s occupation was recorded. In practice, however, this will have made very little difference because women at this time faced substantial disadvantages in the labour market, and very rarely had a higher occupational social class than their partners. Finally, for the G3s we additionally calculated total family size, operationalised as the number of children recorded for the mother in the
Multigenerational Registry up to 2002; and mother’s and father’s educational level in the 1990 census. These characteristics were not available for the G1s. School achievement, G1s Our G1 measure of school achievement was their mean schoolmark in the spring term of the third grade. At this age all children were schooled together, whereas from the fifth grade children were streamed to different schools. Furthermore, third grade schoolmarks had meaningful consequences for children, being one determinant of subsequent streaming (Husén and Boalt 1967). In theory children complete the third grade in the year they turn 10, although (as was common at this time) this applied to only 79.9% of G1s. Using archived school records, we obtained schoolmarks for 10,336/12,674 (81.6%) of the G1s eligible for inclusion in this study. We recorded marks for 10 standard school subjects, with a mean of 9.1 subjects per child (range 6-10). We scored the marks from 0 (Grade C) to 18 (Grade A), as suggested by the education department in 1942 (SOU 1942). Factor analyses indicated a single latent factor explaining much of the observed variation in all 10 marks (first Eigenvalue 4.26, second 0.99). We therefore combined all 10 schoolmarks into a single average, first standardising each subject individually because of differences in their means. School achievement, G3s Our G3 measure of school achievement was their grade average in the ninth (and final) grade of elementary school, obtained from the Swedish National Board for Education. In theory, children complete the ninth grade in the calendar year when they turn 16, and this applied to 95.6% of G3s. Ninth grade schoolmark averages are calculated for all students by their schools. These averages are based on 16 to 18 standard subjects, and are important in determining admission chances for different secondary schools. Thus as for the G1s, our G3 measure of school achievement was a composite across many subjects with personally meaningful consequences. Moreover, again as for the G1s, the component subjects of the ninth grade average loaded strongly onto a single factor (first Eigenvalue 11.21, second 0.99).
Anna Goodman, Marit D Gisselmann, Ilona Koupil Early-life predictors of educational inequalities in Sweden
321
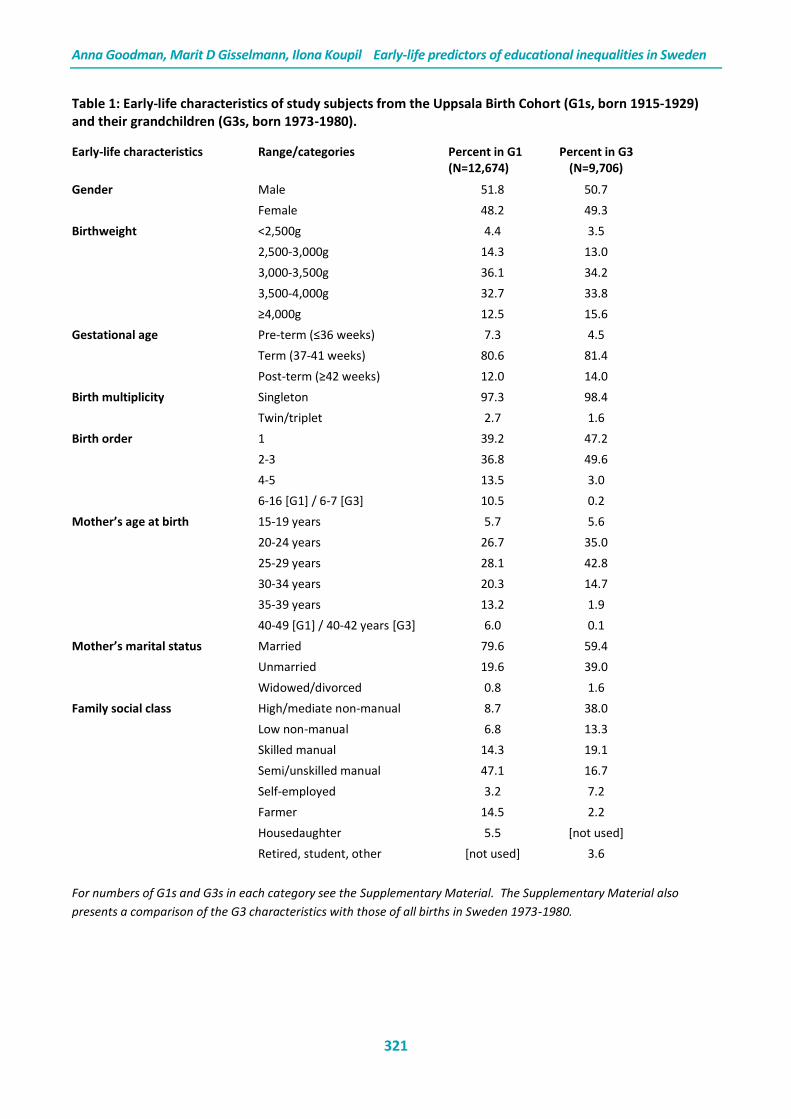
Table 1: Early-life characteristics of study subjects from the Uppsala Birth Cohort (G1s, born 1915-1929) and their grandchildren (G3s, born 1973-1980).
Early-life characteristics Range/categories Percent in G1 (N=12,674)
Percent in G3 (N=9,706)
Gender Male 51.8 50.7
Female 48.2 49.3
Birthweight <2,500g 4.4 3.5
2,500-3,000g 14.3 13.0
3,000-3,500g 36.1 34.2
3,500-4,000g 32.7 33.8
≥4,000g 12.5 15.6
Gestational age Pre-term (≤36 weeks) 7.3 4.5
Term (37-41 weeks) 80.6 81.4
Post-term (≥42 weeks) 12.0 14.0
Birth multiplicity Singleton 97.3 98.4
Twin/triplet 2.7 1.6
Birth order 1 39.2 47.2
2-3 36.8 49.6
4-5 13.5 3.0
6-16 [G1] / 6-7 [G3] 10.5 0.2
Mother’s age at birth 15-19 years 5.7 5.6
20-24 years 26.7 35.0
25-29 years 28.1 42.8
30-34 years 20.3 14.7
35-39 years 13.2 1.9
40-49 [G1] / 40-42 years [G3] 6.0 0.1
Mother’s marital status Married 79.6 59.4
Unmarried 19.6 39.0
Widowed/divorced 0.8 1.6
Family social class High/mediate non-manual 8.7 38.0
Low non-manual 6.8 13.3
Skilled manual 14.3 19.1
Semi/unskilled manual 47.1 16.7
Self-employed 3.2 7.2
Farmer 14.5 2.2
Housedaughter 5.5 [not used]
Retired, student, other [not used] 3.6
For numbers of G1s and G3s in each category see the Supplementary Material. The Supplementary Material also
presents a comparison of the G3 characteristics with those of all births in Sweden 1973-1980.
Anna Goodman, Marit D Gisselmann, Ilona Koupil Early-life predictors of educational inequalities in Sweden
322
Education continuation Our primary measure of educational continuation was entering tertiary education, defined as completing at least one year of a university degree or equivalent. As a secondary measure we examined secondary school attendance, defined as completing at least two years at gymnasium (secondary school) or equivalent. This secondary measure was particularly valuable for analyses of the G1s, amongst whom tertiary education was rare. For the G1s, we obtained this education continuation data from the 1960 Swedish census (i.e. at ages 31-45 years), or from the 1970 and 1990 census if this information was missing (N=112). For secondary school attendance, the 1960 census categorised all people who did not complete three years of secondary school as having only elementary education. The 1970 census included the additional, intermediate response option ‘2 or fewer years of secondary school’. This was assigned to 2,179 G1s with ‘elementary’ education in the 1960 census and we decided to count these individuals as having attended secondary school. For the G3s we obtained our information from the Longitudinal database for Education, Income and Occupation (LOUISE database) held by Statistics Sweden. The last year from which we had data was 2001, providing good coverage for those born in 1980 or earlier. This determined 1980 as the upper birthyear for our G3 cohort. Where LOUISE 2001 data was missing, we used the most recent year in which the individual was aged at least 20 (N=139). Statistical methods Our statistical analyses were guided by our hypotheses that birth characteristics and family composition may explain the effects of family social class upon an individual’s educational outcomes; that schoolmarks may explain effects of early-life characteristics upon an individual’s education continuation; and that G3 childhood socio-economic position may explain the effects of early-life G1 characteristics upon G3 educational outcomes. We examined these hypotheses by fitting a series of multivariable regression models using a hierarchical approach, beginning with models including only the most distal variables and then proceeding to models additionally including hypothesised mediators (Victora et al 1997). We
used linear regression when predicting to schoolmarks, and logistic regression when predicting to secondary school attendance/entrance to tertiary education. All standard errors were calculated with clustering by the subject’s mother, in order to allow for potential correlations due to similarity between siblings (26.4% of G1 cohort and 28.1% of G3 cohort). All models adjust for sex and for birthyear by one-year age band, and were performed in Stata 11.1. We determined a priori to examine whether any early-life characteristics modified the relationship between school achievement and education continuation and/or had differential effects by gender or social class. We therefore tested for interactions between each early-life characteristic and 1) schoolmarks, 2) gender and 3) social class, predicting to each educational outcome in turn and adjusting only for birthyear. The frequency of missing data was 0-6.0% for all early-life characteristics and educational outcomes, except for G1 schoolmarks where the frequency of missing data was 18.4%. We used multiple imputation (five imputations) to impute missing values under an assumption of missing at random. To facilitate comparisons between the G1s and G3s, we categorised our three continuous variables (birthweight, birth order and mother’s age) in main effects models and present p-values for heterogeneity. This did not affect substantive conclusions regarding associations with any educational outcome. By contrast, we kept these variables as continuous when testing for interactions, to avoid underpowered tests involving categorical variables with many levels. When performing cross-generational effects, we used the G3s as our units of analysis and assigned to each G3 the early-life characteristics of their G1 grandparent. For the 1,312 G3s (13.5%) with more than one grandparent from the Uppsala Birth Cohort, we selected one G1 grandparent at random. We examined whether G3 childhood socio-economic position explained any cross-generational effects by additionally adjusting for G3 family social class, mother’s educational levels and father’s educational levels.
Anna Goodman, Marit D Gisselmann, Ilona Koupil Early-life predictors of educational inequalities in Sweden
323
Results Early-life characteristics
There were noticeable differences in the early-life social characteristics of our two cohorts (Table 1). Compared to the G1s, the G3s had fewer large families (3% at birth order ≥4 vs. 24% in G1s); fewer older mothers (17% aged over 30 years vs. 40% in G1s); more unmarried mothers (39% vs. 20% in G1s); and higher social class (e.g. 38% high/mediate non-manual vs. 9% in G1s). Comparisons with all Swedish births 1973-1980 indicated that this largely reflected real changes in Swedish society; in general the early-life characteristics of the G3s were very similar to those of the total population (see Supplementary Material). Nevertheless, the maternal age difference between the two cohorts was exaggerated by an under-representation of older mothers in the G3s (17% aged over 30 years in the G3s vs. 26% in the total population). This is because, for example, 40-year old G3 mothers must have been born between 1933 and 1940, years when most G1s (i.e. their own parents) would not have started childbearing (Goodman and Koupil 2009).
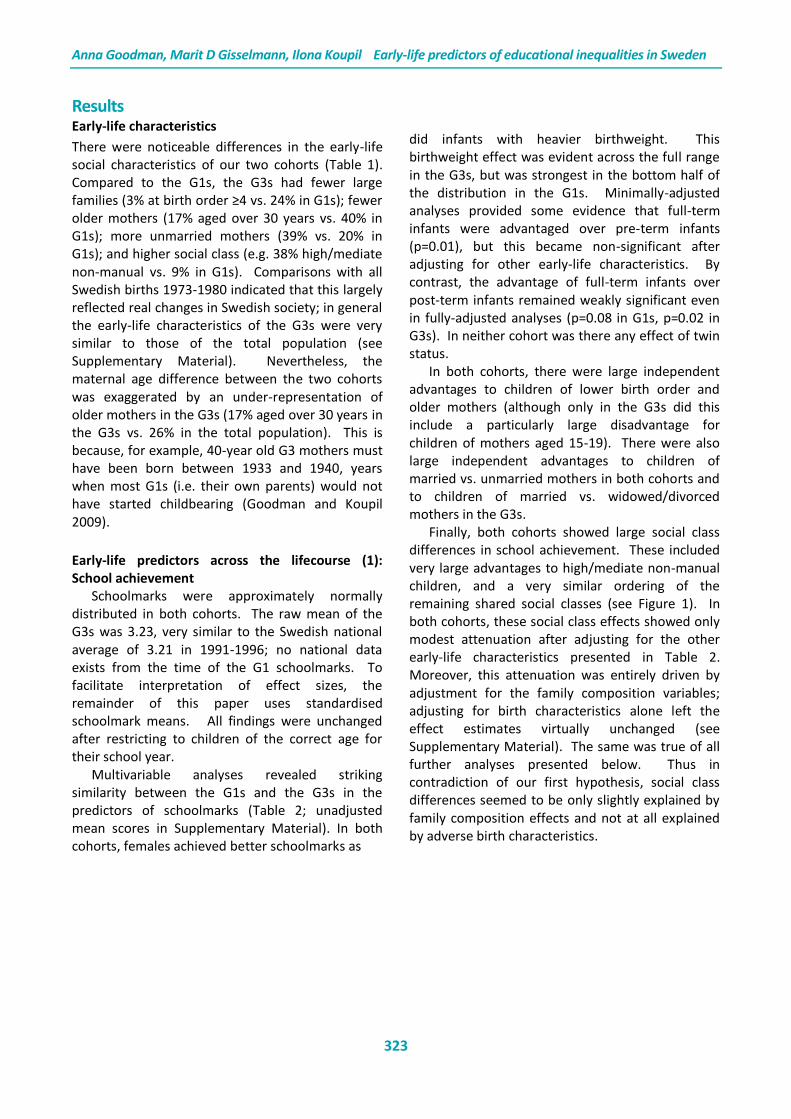
Early-life predictors across the lifecourse (1): School achievement Schoolmarks were approximately normally distributed in both cohorts. The raw mean of the G3s was 3.23, very similar to the Swedish national average of 3.21 in 1991-1996; no national data exists from the time of the G1 schoolmarks. To facilitate interpretation of effect sizes, the remainder of this paper uses standardised schoolmark means. All findings were unchanged after restricting to children of the correct age for their school year. Multivariable analyses revealed striking similarity between the G1s and the G3s in the predictors of schoolmarks (Table 2; unadjusted mean scores in Supplementary Material). In both cohorts, females achieved better schoolmarks as
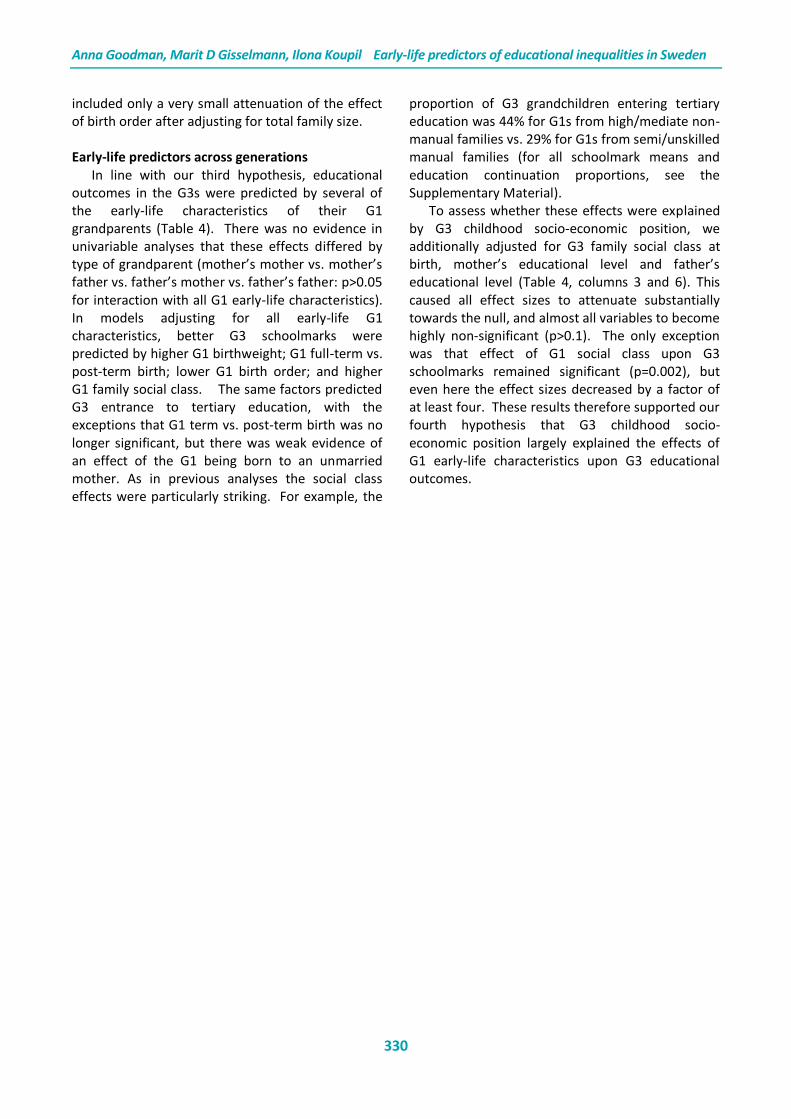
did infants with heavier birthweight. This birthweight effect was evident across the full range in the G3s, but was strongest in the bottom half of the distribution in the G1s. Minimally-adjusted analyses provided some evidence that full-term infants were advantaged over pre-term infants (p=0.01), but this became non-significant after adjusting for other early-life characteristics. By contrast, the advantage of full-term infants over post-term infants remained weakly significant even in fully-adjusted analyses (p=0.08 in G1s, p=0.02 in G3s). In neither cohort was there any effect of twin status. In both cohorts, there were large independent advantages to children of lower birth order and older mothers (although only in the G3s did this include a particularly large disadvantage for children of mothers aged 15-19). There were also large independent advantages to children of married vs. unmarried mothers in both cohorts and to children of married vs. widowed/divorced mothers in the G3s. Finally, both cohorts showed large social class differences in school achievement. These included very large advantages to high/mediate non-manual children, and a very similar ordering of the remaining shared social classes (see Figure 1). In both cohorts, these social class effects showed only modest attenuation after adjusting for the other early-life characteristics presented in Table 2. Moreover, this attenuation was entirely driven by adjustment for the family composition variables; adjusting for birth characteristics alone left the effect estimates virtually unchanged (see Supplementary Material). The same was true of all further analyses presented below. Thus in contradiction of our first hypothesis, social class differences seemed to be only slightly explained by family composition effects and not at all explained by adverse birth characteristics.
Anna Goodman, Marit D Gisselmann, Ilona Koupil Early-life predictors of educational inequalities in Sweden
324
Table 2: Early-life characteristics and school achievement among subjects from the Uppsala Birth Cohort (G1s, born 1915-1929) and their grandchildren (G3s, born 1973-1980)
G1 characteristics predicting G1 schoolmarks: linear regression, regression coefficients and 95% CI
G3 characteristics predicting G3 schoolmarks: linear regression, regression coefficients and 95% CI
Minimally adjusted† Multivariable: all early-life characteristics
Minimally adjusted† Multivariable: all early-life characteristics
N 12,674 12,674 9,706 9,706
Gender Male 0*** 0*** 0*** 0***
Female 0.35 (0.30, 0.41) 0.37 (0.32, 0.43) 0.42 (0.38, 0.46) 0.43 (0.39, 0.47)
Birth- <2,500g -0.13 (-0.22, -0.04) -0.13 (-0.23, -0.04) -0.22 (-0.35, -0.10) -0.22 (-0.34, -0.09)
weight 2,500-3,000g -0.09 (-0.17, -0.01) -0.09 (-0.17, -0.02) -0.10 (-0.17, -0.04) -0.10 (-0.17, -0.04)
3,000-3,500g 0** 0** 0*** 0***
3,500-4,000g 0.01 (-0.04, 0.05) 0.02 (-0.03, 0.07) 0.10 (0.05, 0.15) 0.08 (0.04, 0.12)
≥4,000g 0.01 (-0.06, 0.08) 0.04 (-0.04, 0.11) 0.11 (0.05, 0.17) 0.12 (0.06, 0.18)
Gesta- Pre-term -0.10 (-0.17, -0.02) -0.02 (-0.09, 0.05) -0.09 (-0.20, 0.02) 0.10 (-0.01, 0.22)
-tional Term 0** 0 0 0*
age Post-term -0.06 (-0.11, 0.00) -0.05 (-0.10, 0.01) -0.04 (-0.10, 0.02) -0.06 (-0.12, -0.01)
Birth Singleton 0 0 0 0
multiplicity Twin/triplet -0.10 (-0.24, 0.05) -0.02 (-0.17, 0.13) -0.02 (-0.21, 0.17) 0.12 (-0.04, 0.29)
Birth 1 0*** 0*** 0*** 0***
order 2-3 -0.12 (-0.16, -0.07) -0.20 (-0.25, -0.15) -0.18 (-0.21, -0.14) -0.30 (-0.34, -0.26)
4-5 -0.18 (-0.24, -0.12) -0.31 (-0.38, -0.24) -0.55 (-0.68, -0.41) -0.65 (-0.77, -0.52)
≥6 -0.21 (-0.28, -0.14) -0.39 (-0.48, -0.30) -0.66 (-1.13, -0.20) -0.74 (-1.19, -0.30)
Mother’s 15-19 years 0.04 (-0.04, 0.13) 0.06 (-0.03, 0.15) -0.29 (-0.38, -0.20) -0.20 (-0.29, -0.11)
age 20-24 years 0* 0** 0*** 0***
at birth 25-29 years 0.08 (0.02, 0.13) 0.07 (0.01, 0.13) 0.25 (0.20, 0.30) 0.16 (0.11, 0.21)
30-34 years 0.09 (0.02, 0.15) 0.11 (0.03, 0.19) 0.32 (0.26, 0.39) 0.25 (0.18, 0.31)
35-39 years 0.04 (-0.02, 0.10) 0.11 (0.03, 0.18) 0.32 (0.17, 0.47) 0.33 (0.19, 0.48)
≥40 years 0.07 (-0.02, 0.15) 0.19 (0.09, 0.29) [too few cases] [too few cases]
Mother’s Married 0*** 0*** 0*** 0***
marital Unmarried -0.15 (-0.20, -0.10) -0.14 (-0.21, -0.08) -0.27 (-0.32, -0.23) -0.15 (-0.19, -0.11)
status Widow/divorced -0.21 (-0.41, -0.01) -0.09 (-0.29, 0.11) -0.73 (-0.90, -0.56) -0.54 (-0.70, -0.39)
Family High/med non-
manual
0*** 0*** 0*** 0***
social Low non-manual -0.34 (-0.47, -0.21) -0.30 (-0.42, -0.17) -0.47 (-0.53, -0.40) -0.39 (-0.45, -0.32)
class Skilled manual -0.42 (-0.52, -0.32) -0.36 (-0.46, -0.26) -0.64 (-0.70, -0.58) -0.51 (-0.57, -0.45)
Semi/unskilled
manual
-0.48 (-0.56, -0.39) -0.40 (-0.48, -0.31) -0.86 (-0.92, -0.79) -0.69 (-0.76, -0.62)
Self-employed -0.26 (-0.38, -0.13) -0.22 (-0.35, -0.09) -0.57 (-0.65, -0.48) -0.46 (-0.54, -0.38)
Farmers -0.22 (-0.32, -0.12) -0.15 (-0.25, -0.05) -0.29 (-0.43, -0.16) -0.23 (-0.36, -0.10)
Housedaughter -0.41 (-0.51, -0.31) -0.32 (-0.44, -0.21) [not used] [not used]
Retired, student,
other
[not used] [not used] -0.81 (-0.95, -0.67) -0.63 (-0.77, -0.50)
*p<0.05, **p<0.01, ***p<0.001. †Minimally adjusted: variables entered separately, adjusting only for gender and birthyear. Results not presented for G3 children of mothers aged 40 or mor e because of the very small sample size (N=6). See Supplementary Material for intermediate multivariable models adjusting A) only for birth characteristics and social class, and B) only for family composition and social class.

Anna Goodman, Marit D Gisselmann, Ilona Koupil Early-life predictors of educational inequalities in Sweden
325
Figure 1: School achievement and education continuation stratified by gender and family social class in subjects from the Uppsala Birth Cohort (G1s, born 1915-1929) and their grandchildren (G3s, born 1973-1980)
95% CI = 95% confidence intervals. High NM = high/mediate non-manual, Self-emp=self-employed, Low NM=low non-manual, Skilled M=skilled manual, Unskilled M=semi/unskilled manual, Housedau=housedaughters, Other=retired/student/other. Shared social classes are presented in order of school achievement in G1 females.

Anna Goodman, Marit D Gisselmann, Ilona Koupil Early-life predictors of educational inequalities in Sweden
326
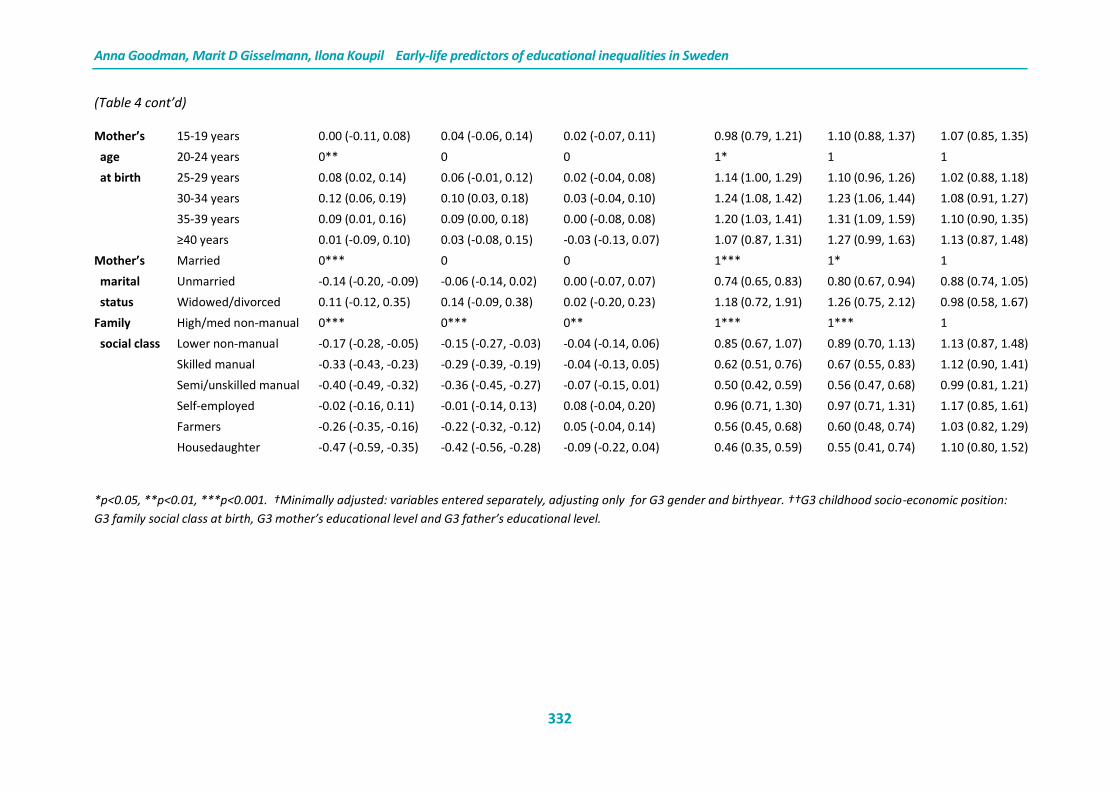
Early-life predictors across the lifecourse (2): Education continuation Secondary school attendance was far more common in the G3s (90% vs. 28% in the G1s), with even G3s in the bottom schoolmark decile attending more often than top-decile G1s (Figure 2). Entering
tertiary education was likewise substantially more common for the G3s (32% vs. 5%), despite the G3s being younger when educational level was ascertained and therefore not including mature students.
Figure 2: Education continuation by school achievement and gender in subjects from the Uppsala Birth Cohort (G1s, born 1915-1929) and their grandchildren (G3s, born 1973-1980)
95% CI = 95% confidence intervals.

Anna Goodman, Marit D Gisselmann, Ilona Koupil Early-life predictors of educational inequalities in Sweden
327
Table 3: Early-life characteristics and entrance to tertiary education among subjects from the Uppsala Birth Cohort (G1s, born 1915-1929) and their grandchildren (G3s, born 1973-1980)
G1 characteristics predicting G1 entrance to tertiary
education: logistic regression, odds ratios and 95% CI
G3 characteristics predicting G3 entrance to tertiary
education: logistic regression, odds ratios and 95% CI
Minimally
adjusted†
Multivariable: all
early-life
characteristics
Multivariable: all
early-life
characteristics
plus schoolmarks
Minimally
adjusted†
Multivariable: all
early-life
characteristics
Multivariable: all
early-life
characteristics
plus schoolmarks
N 12,674 12,674 12,674 9,706 9,706 9,706
Gender Male 1*** 1*** 1*** 1*** 1*** 1
Female 0.38 (0.32, 0.46) 0.35 (0.29, 0.43) 0.28 (0.23, 0.35) 1.62 (1.48, 1.77) 1.74 (1.58, 1.91) 1.00 (0.89, 1.12)
Birth- <2,500g 0.84 (0.52, 1.38) 0.82 (0.47, 1.43) 0.84 (0.46, 1.56) 0.87 (0.67, 1.13) 0.82 (0.61, 1.12) 1.14 (0.79, 1.65)
weight 2,500-3,000g 0.83 (0.62, 1.11) 0.79 (0.57, 1.11) 0.82 (0.59, 1.15) 0.92 (0.80, 1.06) 0.90 (0.77, 1.05) 1.04 (0.87, 1.25)
3,000-3,500g 1 1* 1 1** 1** 1
3,500-4,000g 0.89 (0.72, 1.10) 0.91 (0.72, 1.15) 0.91 (0.71, 1.16) 1.16 (1.05, 1.29) 1.14 (1.02, 1.28) 1.06 (0.93, 1.21)
≥4,000g 1.14 (0.88, 1.47) 1.34 (1.00, 1.80) 1.32 (0.97, 1.81) 1.18 (1.03, 1.36) 1.25 (1.08, 1.44) 1.10 (0.93, 1.32)
Gesta- Pre-term 0.83 (0.58, 1.18) 1.07 (0.70, 1.62) 1.12 (0.72, 1.73) 1.03 (0.82, 1.28) 1.30 (0.99, 1.70) 1.15 (0.85, 1.56)
-tional Term 1* 1* 1* 1 1 1
age Post-term 0.63 (0.46, 0.86) 0.62 (0.44, 0.86) 0.62 (0.44, 0.89) 0.96 (0.85, 1.09) 0.94 (0.81, 1.08) 1.03 (0.87, 1.22)
Birth Singleton 1 1 1 1 1 1
multiplicity Twin/triplet 1.04 (0.56, 1.94) 1.19 (0.67, 2.10) 1.25 (0.69, 2.28) 1.30 (0.85, 1.96) 1.53 (0.99, 2.34) 1.59 (0.98, 2.58)
Birth 1 1*** 1*** 1*** 1*** 1*** 1***
order 2-3 0.86 (0.71, 1.04) 0.65 (0.52, 0.81) 0.73 (0.59, 0.91) 0.71 (0.65, 0.77) 0.53 (0.47, 0.58) 0.71 (0.63, 0.80)
4-5 0.54 (0.40, 0.74) 0.42 (0.30, 0.60) 0.49 (0.34, 0.71) 0.45 (0.33, 0.61) 0.31 (0.22, 0.43) 0.58 (0.38, 0.87)
≥6 0.17 (0.10, 0.31) 0.12 (0.07, 0.23) 0.15 (0.08, 0.29) 0.40 (0.13, 1.20) 0.26 (0.09, 0.75) 0.58 (0.16, 2.12)

Anna Goodman, Marit D Gisselmann, Ilona Koupil Early-life predictors of educational inequalities in Sweden
328
(Table 3 cont’d)
Mother’s 15-19 years 0.38 (0.19, 0.76) 0.65 (0.32, 1.31) 0.63 (0.30, 1.29) 0.52 (0.41, 0.66) 0.62 (0.48, 0.80) 0.70 (0.52, 0.95)
age 20-24 years 1*** 1*** 1** 1*** 1*** 1***
at birth 25-29 years 1.74 (1.35, 2.24) 1.32 (1.00, 1.74) 1.26 (0.94, 1.70) 1.58 (1.43, 1.75) 1.35 (1.20, 1.52) 1.14 (0.99, 1.31)
30-34 years 1.86 (1.41, 2.45) 1.48 (1.08, 2.02) 1.39 (0.98, 1.96) 2.03 (1.77, 2.34) 1.80 (1.53, 2.12) 1.44 (1.19, 1.75)
35-39 years 1.97 (1.45, 2.67) 2.00 (1.38, 2.90) 1.89 (1.28, 2.78) 2.34 (1.66, 3.30) 2.48 (1.70, 3.61) 1.94 (1.30, 2.87)
≥40 years 1.16 (0.74, 1.83) 2.10 (1.24, 3.58) 1.92 (1.11, 3.31) [too few cases] [too few cases] [too few cases]
Mother’s Married 1*** 1 [p=0.05] 1 1*** 1*** 1**
marital Unmarried 0.18 (0.12, 0.28) 0.54 (0.30, 0.98) 0.60 (0.34, 1.07) 0.58 (0.53, 0.65) 0.72 (0.65, 0.81) 0.84 (0.73, 0.96)
status Widow/divorced 0.18 (0.02, 1.33) 0.30 (0.03, 2.85) 0.32 (0.03, 3.25) 0.23 (0.14, 0.37) 0.28 (0.16, 0.46) 0.42 (0.23, 0.78)
Family High/med non-manual 1*** 1*** 1*** 1*** 1*** 1***
social Low non-manual 0.19 (0.14, 0.27) 0.21 (0.16, 0.30) 0.24 (0.17, 0.34) 0.37 (0.32, 0.43) 0.43 (0.37, 0.50) 0.58 (0.49, 0.69)
class Skilled manual 0.06 (0.05, 0.09) 0.08 (0.05, 0.11) 0.09 (0.06, 0.12) 0.25 (0.22, 0.29) 0.32 (0.28, 0.37) 0.50 (0.42, 0.59)
Semi/unskilled manual 0.03 (0.02, 0.04) 0.04 (0.03, 0.06) 0.05 (0.04, 0.07) 0.17 (0.15, 0.20) 0.23 (0.19, 0.27) 0.43 (0.35, 0.52)
Self-employed 0.20 (0.13, 0.31) 0.21 (0.14, 0.33) 0.22 (0.14, 0.35) 0.27 (0.22, 0.33) 0.32 (0.26, 0.39) 0.47 (0.37, 0.60)
Farmers 0.03 (0.02, 0.05) 0.04 (0.02, 0.06) 0.04 (0.02, 0.06) 0.49 (0.35, 0.68) 0.55 (0.39, 0.77) 0.67 (0.44, 1.00)
Housedaughter 0.02 (0.01, 0.05) 0.05 (0.02, 0.13) 0.05 (0.02, 0.15) [not used] [not used] [not used]
Retired, student, other [not used] [not used] [not used] 0.27 (0.20, 0.36) 0.36 (0.26, 0.49) 0.66 (0.45, 0.94)
*p<0.05, **p<0.01, ***p<0.001. †Minimally adjusted: variables entered separately, adjusting only for gender and birthyear. Results not presented for G3 children of
mothers aged 40 or more because of the very small sample size (N=6)
.

Anna Goodman, Marit D Gisselmann, Ilona Koupil Early-life predictors of educational inequalities in Sweden
329
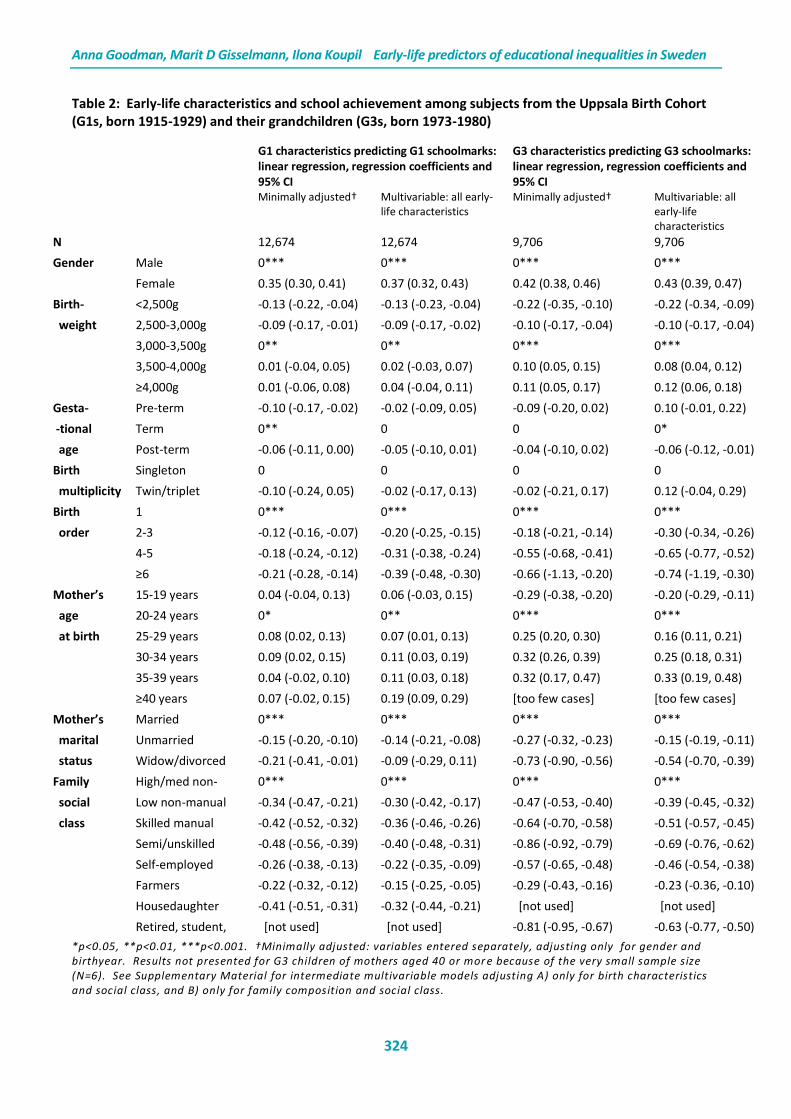
In general, these two measures of education continuation yielded similar or identical substantive findings regarding the importance of early-life characteristics. We therefore describe the results together below, with Table 3 presenting logistic regression models for tertiary education (our primary measure of education continuation). Raw proportions and regression models for secondary school attendance are presented in the Supplementary Material. G3 females were advantaged with respect to education continuation, while among the G1s it was males who were substantially advantaged (see also Figure 2). The G3 female advantage disappeared after adjusting for schoolmarks, suggesting that school achievement explained the gender difference in this cohort. By contrast the G1 gender inequality grew still more pronounced after adjusting for females’ better school achievement. In both cohorts there was some evidence of an advantage to infants of heavier birthweight in analyses adjusting for all early-life characteristics, but these effects became non-significant after adjusting for previous school achievement. As for schoolmarks, there was no independent effect of pre-term or twin status in either cohort. However, full-term G1s (but not G3s) did have an advantage relative to post-term infants, and this persisted even after adjusting for schoolmarks (p=0.008 for secondary school attendance; p=0.009 for entrance to tertiary education). In both cohorts, lower birth order, older mother, married mother and higher family social class carried large independent advantages for education continuation. The social class differences were particularly striking; for example, 30% of high/mediate non-manual G1s entered tertiary education versus 1% of semi/unskilled manuals. The corresponding G3 figures were 50% and 15%. It was also interesting to note that G1 children of farmers and housedaughters were among the social classes least likely to continue their education, despite average or above-average schoolmarks (see Figure 1). For the most part, however, the predictors of education continuation were very similar to the predictors of school achievement. Nevertheless, prior school achievement only partially explained these differences – despite some attenuation after adjusting for schoolmarks, most effect sizes remained large and highly significant (Table 3, columns 3 and 6). The major exception
was that most G3 early-life characteristics ceased to predict secondary school attendance after adjusting for school achievement in the final year of elementary school (i.e. immediately before the transition to secondary school; results in the Supplementary Material). To summarise, these analyses only partially supported our second hypothesis that school achievement would explain the effects of early-life characteristics upon education continuation. This did seem to be the case for the greater education continuation for G3 females and G1 and G3 infants of heavier birthweight. By contrast, schoolmarks only explained some of the effects of family composition and social class, with these variables having a direct effect on education continuation over and above their previous influence on school achievement. Early-life predictors across the lifecourse (3): Interactions and sensitivity analyses We tested for interactions between all early-life characteristics and 1) schoolmarks, 2) gender and 3) social class. In the G1s, three sets of interactions were significant at p<0.01. First, not only were G1 males much more likely to attend secondary school than females, but good schoolmarks played a greater role in determining which males got that opportunity (p<0.001 for interaction; see also Figure 2). Second, there was a gender-social class interaction for schoolmarks (p<0.001), secondary school attendance (p<0.001) and entrance to tertiary education (p=0.04). For school achievement this interaction reflected a particularly large female advantage in farming families, while for education continuation it reflected a particularly large male advantage in non-manual and self-employed families (see Figure 1). Third, there was a birth order-social class interaction for school achievement (p=0.03) and secondary school attendance (p=0.003), reflecting particularly strong birth order effects in non-manual families. No interactions were significant at p<0.01 in the G3s. We also conducted sensitivity analyses in the G3s, repeating the analyses in Table 2 and Table 3 after additionally adjusting for total family size, mother’s education and father’s education. The effect of family social class attenuated somewhat after adjusting for parental education, but otherwise the results were almost unchanged. This
Anna Goodman, Marit D Gisselmann, Ilona Koupil Early-life predictors of educational inequalities in Sweden
330
included only a very small attenuation of the effect of birth order after adjusting for total family size. Early-life predictors across generations In line with our third hypothesis, educational outcomes in the G3s were predicted by several of the early-life characteristics of their G1 grandparents (Table 4). There was no evidence in univariable analyses that these effects differed by type of grandparent (mother’s mother vs. mother’s father vs. father’s mother vs. father’s father: p>0.05 for interaction with all G1 early-life characteristics). In models adjusting for all early-life G1 characteristics, better G3 schoolmarks were predicted by higher G1 birthweight; G1 full-term vs. post-term birth; lower G1 birth order; and higher G1 family social class. The same factors predicted G3 entrance to tertiary education, with the exceptions that G1 term vs. post-term birth was no longer significant, but there was weak evidence of an effect of the G1 being born to an unmarried mother. As in previous analyses the social class effects were particularly striking. For example, the
proportion of G3 grandchildren entering tertiary education was 44% for G1s from high/mediate non-manual families vs. 29% for G1s from semi/unskilled manual families (for all schoolmark means and education continuation proportions, see the Supplementary Material). To assess whether these effects were explained by G3 childhood socio-economic position, we additionally adjusted for G3 family social class at birth, mother’s educational level and father’s educational level (Table 4, columns 3 and 6). This caused all effect sizes to attenuate substantially towards the null, and almost all variables to become highly non-significant (p>0.1). The only exception was that effect of G1 social class upon G3 schoolmarks remained significant (p=0.002), but even here the effect sizes decreased by a factor of at least four. These results therefore supported our fourth hypothesis that G3 childhood socio-economic position largely explained the effects of G1 early-life characteristics upon G3 educational outcomes.

Anna Goodman, Marit D Gisselmann, Ilona Koupil Early-life predictors of educational inequalities in Sweden
331
Table 4: Early-life characteristics in subjects from the Uppsala Birth Cohort (G1s, born 1915-1929) and the educational outcomes of their grandchildren (G3s, born 1973-1980)
G1 characteristics predicting G3 standardized schoolmarks: linear regression, regression coefficients & 95% CI
G1 characteristics predicting G3 entrance to tertiary education: logistic regression, odds ratios & 95% CI
Minimally adjusted†
Multivariable: all G1 early-life characteristics
Multivariable: all G1 early-life characteristics & G3 childhood socio-economic position††
Minimally adjusted†
Multivariable: all G1 early-life characteristics
Multivariable: all G1 early-life characteristics & G3 childhood socio-economic position††
N 9,706 9,706 9,706 9,706 9,706 9,706
Gender Male 0 0* 0 1 1 1
Female 0.03 (-0.02, 0.07) 0.05 (0.00, 0.09) 0.00 (-0.04, 0.04) 1.06 (0.96, 1.16) 1.09 (0.99, 1.20) 0.98 (0.88, 1.08)
Birthweight <2,500g -0.09 (-0.20, 0.03) -0.09 (-0.22, 0.05) -0.02 (-0.15, 0.10) 0.96 (0.75, 1.22) 0.94 (0.71, 1.24) 1.07 (0.79, 1.46)
2,500-3,000g -0.02 (-0.09, 0.05) -0.01 (-0.08, 0.06) -0.03 (-0.09, 0.04) 1.10 (0.95, 1.28) 1.12 (0.95, 1.31) 1.09 (0.93, 1.28)
3,000-3,500g 0 [p=0.08] 0* 0 1 1* 1
3,500-4,000g -0.01 (-0.06, 0.04) 0.01 (-0.05, 0.06) -0.02 (-0.06, 0.03) 1.06 (0.95, 1.19) 1.11 (0.98, 1.24) 1.06 (0.94, 1.20)
≥4,000g 0.07 (0.00, 0.14) 0.11 (0.03, 0.18) 0.04 (-0.03, 0.11) 1.18 (1.01, 1.37) 1.25 (1.07, 1.45) 1.10 (0.94, 1.30)
Gestational Pre-term -0.08 (-0.16, 0.01) -0.01 (-0.11, 0.08) -0.01 (-0.09, 0.08) 0.90 (0.75, 1.08) 0.95 (0.78, 1.16) 0.95 (0.77, 1.18)
age Term 0*** 0** 0 1 1 1
Post-term -0.13 (-0.20, -0.06) -0.13 (-0.20, -0.05) -0.07 (-0.13, 0.00) 0.93 (0.79, 1.09) 0.95 (0.81, 1.11) 1.08 (0.92, 1.28)
Birth Singleton 0 0 0 1 1 1
multiplicity Twin/triplet -0.10 (-0.23, 0.04) -0.07 (-0.21, 0.08) -0.01 (-0.14, 0.12) 0.98 (0.72, 1.33) 1.01 (0.72, 1.41) 1.18 (0.82, 1.68)
Birth order 1 0* 0*** 0 1* 1*** 1
2-3 0.00 (-0.05, 0.05) -0.08 (-0.14, -0.02) -0.03 (-0.08, 0.02) 0.98 (0.88, 1.10) 0.83 (0.73, 0.94) 0.92 (0.80, 1.04)
4-5 -0.08 (-0.15, -0.01) -0.19 (-0.27, -0.11) -0.07 (-0.14, 0.00) 0.85 (0.74, 0.99) 0.66 (0.56, 0.79) 0.83 (0.69, 0.99)
≥6 -0.07 (-0.14, 0.00) -0.17 (-0.27, -0.07) 0.01 (-0.08, 0.09) 0.83 (0.71, 0.96) 0.62 (0.51, 0.76) 0.88 (0.71, 1.09)
Anna Goodman, Marit D Gisselmann, Ilona Koupil Early-life predictors of educational inequalities in Sweden
332
(Table 4 cont’d)
Mother’s 15-19 years 0.00 (-0.11, 0.08) 0.04 (-0.06, 0.14) 0.02 (-0.07, 0.11) 0.98 (0.79, 1.21) 1.10 (0.88, 1.37) 1.07 (0.85, 1.35)
age 20-24 years 0** 0 0 1* 1 1
at birth 25-29 years 0.08 (0.02, 0.14) 0.06 (-0.01, 0.12) 0.02 (-0.04, 0.08) 1.14 (1.00, 1.29) 1.10 (0.96, 1.26) 1.02 (0.88, 1.18)
30-34 years 0.12 (0.06, 0.19) 0.10 (0.03, 0.18) 0.03 (-0.04, 0.10) 1.24 (1.08, 1.42) 1.23 (1.06, 1.44) 1.08 (0.91, 1.27)
35-39 years 0.09 (0.01, 0.16) 0.09 (0.00, 0.18) 0.00 (-0.08, 0.08) 1.20 (1.03, 1.41) 1.31 (1.09, 1.59) 1.10 (0.90, 1.35)
≥40 years 0.01 (-0.09, 0.10) 0.03 (-0.08, 0.15) -0.03 (-0.13, 0.07) 1.07 (0.87, 1.31) 1.27 (0.99, 1.63) 1.13 (0.87, 1.48)
Mother’s Married 0*** 0 0 1*** 1* 1
marital Unmarried -0.14 (-0.20, -0.09) -0.06 (-0.14, 0.02) 0.00 (-0.07, 0.07) 0.74 (0.65, 0.83) 0.80 (0.67, 0.94) 0.88 (0.74, 1.05)
status Widowed/divorced 0.11 (-0.12, 0.35) 0.14 (-0.09, 0.38) 0.02 (-0.20, 0.23) 1.18 (0.72, 1.91) 1.26 (0.75, 2.12) 0.98 (0.58, 1.67)
Family High/med non-manual 0*** 0*** 0** 1*** 1*** 1
social class Lower non-manual -0.17 (-0.28, -0.05) -0.15 (-0.27, -0.03) -0.04 (-0.14, 0.06) 0.85 (0.67, 1.07) 0.89 (0.70, 1.13) 1.13 (0.87, 1.48)
Skilled manual -0.33 (-0.43, -0.23) -0.29 (-0.39, -0.19) -0.04 (-0.13, 0.05) 0.62 (0.51, 0.76) 0.67 (0.55, 0.83) 1.12 (0.90, 1.41)
Semi/unskilled manual -0.40 (-0.49, -0.32) -0.36 (-0.45, -0.27) -0.07 (-0.15, 0.01) 0.50 (0.42, 0.59) 0.56 (0.47, 0.68) 0.99 (0.81, 1.21)
Self-employed -0.02 (-0.16, 0.11) -0.01 (-0.14, 0.13) 0.08 (-0.04, 0.20) 0.96 (0.71, 1.30) 0.97 (0.71, 1.31) 1.17 (0.85, 1.61)
Farmers -0.26 (-0.35, -0.16) -0.22 (-0.32, -0.12) 0.05 (-0.04, 0.14) 0.56 (0.45, 0.68) 0.60 (0.48, 0.74) 1.03 (0.82, 1.29)
Housedaughter -0.47 (-0.59, -0.35) -0.42 (-0.56, -0.28) -0.09 (-0.22, 0.04) 0.46 (0.35, 0.59) 0.55 (0.41, 0.74) 1.10 (0.80, 1.52)
*p<0.05, **p<0.01, ***p<0.001. †Minimally adjusted: variables entered separately, adjusting only for G3 gender and birthyear. ††G3 childhood socio-economic position:
G3 family social class at birth, G3 mother’s educational level and G3 father’s educational level.

Anna Goodman, Marit D Gisselmann, Ilona Koupil Early-life predictors of educational inequalities in Sweden
333
Discussion This paper has examined the early-life characteristics predicting educational outcomes across the lifecourse and across generations, using data from 12,674 Swedish infants born 1915-1929 (‘G1s’) and 9,706 of their grandchildren born 1973-1980 (‘G3s’). The predictors of school achievement and educational continuation were very similar in the two cohorts. The independent predictors of better schoolmarks were: female gender, heavier birthweight, lower birth order, older mother, married mother and higher family social class. Here and in all subsequent analyses, the social class effects were particularly large and were also largely independent of the effects of birth characteristics or family composition. There was no evidence of an independent effect of pre-term or twin status, but weak evidence of a disadvantage to post-term infants. The predictors of education continuation were very similar, the main exception being a marked male advantage in the G1s. The higher probability of education continuation among heavier birthweight individuals seemed to be explained by their better school achievement. By contrast, even after adjusting for school achievement, entrance to tertiary education was still predicted in both cohorts by lower birth order, older mother, married mother and higher family social class. In cross-generational analyses, higher G3 school achievement and education continuation were predicted by higher G1 birthweight; lower G1 birth order; and higher G1 family social class. These associations became non-significant and/or substantially attenuated after adjusting for G3 socio-economic position at birth, suggesting that intervening socio-economic position was the major mechanism underlying these cross-generational effects. Study limitations In interpreting these findings, it is important to bear in mind our study’s limitations. By definition, our G3 cohort consisted of infants with at least one grandparent born in Uppsala between 1915 and 1929. The G3s were therefore not fully representative of all Swedish births in 1973-1980; births to older parents were somewhat underrepresented and, by excluding all children with four foreign-born grandparents, our G3 cohort will also underrepresent the descendents of immigrants. Nevertheless, the close similarity between most G3
characteristics and total population data leads us to believe that many of our findings will generalise to all Swedish births from this time period. Moreover, although the G3s are not representative in the distribution of some early-life characteristics, we know of no reason to hypothesise that this will bias the associations between those characteristics and subsequent educational outcomes. Perhaps a more important limitation is that our educational outcomes are not fully comparable between the two cohorts. Schoolmarks were awarded at around age 10 in the G1s but at age 16 in the G3s. This is important because both social and biological characteristics may vary in the strength of their effects upon educational outcomes according to the age at which educational outcomes are assessed (Boardman et al 2002; Bradley and Corwyn 2002). Other possible sources of non-comparability between the cohorts include differences in the criteria applied by teachers when grading students, or differences in the degree of measurement error when assigning schoolmarks. We therefore believe it is not advisable to make direct comparisons of the magnitude of the schoolmark effect sizes between the two cohorts. Similarly, although we used the same measures of education continuation in both cohorts, their frequencies differ greatly – for example, 5% entering tertiary education in the G1s vs. 32% in the G3s. We partly addressed this issue by demonstrating that our substantive findings were generally unchanged when we used secondary school attendance as an alternative measure of education continuation, which had a G1 frequency which was comparable to the G3 frequency of tertiary education (28% vs. 32%). Nevertheless, the different frequency of educational continuation in the two cohorts again complicates direct comparisons of effect sizes. Thus while we have certainly demonstrated that large educational inequalities exist in both cohorts, we do not feel that we can comment with confidence how the magnitude of these inequalities has changed in Sweden over the twentieth century. It is for this reason that we have focused instead upon comparing the pattern of relative advantage and disadvantage between the two cohorts. Implications of study for understanding educational inequalities. Bearing these limitations in mind, what do our results reveal about the early-life predictors of
Anna Goodman, Marit D Gisselmann, Ilona Koupil Early-life predictors of educational inequalities in Sweden
334
educational outcomes? For birth characteristics, we did not find an independent effect of pre-term birth upon our educational outcomes but, in accordance with previous findings (Record et al 1969b; Yang et al 2010; Eide et al 2007), we did find some evidence of a disadvantage to post-term infants. We also showed that the effect of birthweight upon school achievement was not confined to low birthweight infants (<2,500g); rather it extended until at least the middle of the distribution in the G1s and right across the distribution in the G3s. This replicates a recent systematic review (Shenkin et al 2004) and extends it by including more evidence from study populations born pre-1945 and post-1965. The persistence of marked birthweight effects in the G3s highlights that birth outcomes are an important public health issue even in low mortality settings. This conclusion is reinforced by the fact that in both cohorts the poorer school achievement of lighter infants was translated into a lower probability of education continuation, thereby potentially having adverse implications for adult life chances. Indeed, these deleterious effects even seemed to extend across generations, with some evidence that the grandchildren of post-term and lighter birthweight G1s had poorer school achievement and/or lower entrance to tertiary education. To our knowledge, ours is the first paper to suggest such inter-generational effects of birth characteristics upon educational outcomes. With regard to family composition, the similarity between the two cohorts was striking, and included a continued marked disadvantage to G3 children of unmarried mothers. This may seem somewhat surprising given the substantially lower stigma attached to unmarried parenthood when the G3s were born. Moreover, our results plausibly underestimate the disadvantage to truly single G3 mothers, since many unmarried G3 mothers will have been living in stable partnerships with the child’s father. Our results are, however, in line with British findings which likewise show that the negative effect of parental divorce upon educational attainment did not decrease over the twentieth century despite divorce becoming substantially more common (Ely et al 1999). One interpretation is that a major mechanism of this disadvantage is not external stigma, but rather a reduction in the total amount of cognitive stimulation children get from their parents if they live with one parent rather than two. Reduced
parent stimulation is known to be associated with adverse effects across a range of cognitive outcomes, and has also been suggested as the key mechanism underlying the disadvantage to children of higher birth order and/or from larger families (Steelman et al 2002; Price, 2008). Indeed, while the G3 children of unmarried mothers may have benefitted from reduced stigma, it is plausible that for them, reduced parental stimulation was an even more important source of relative disadvantage than in the less gender-egalitarian G1 society – perhaps for the G1s even ‘present’ fathers played a relatively small role in child-rearing. Speculatively, large amounts of contact time with mothers and grandparents may partly explain why the school achievement of G1 children of housedaughters was no worse than average, despite this being the most disadvantaged group for education continuation. The extremely low probability of education continuation among G1 children of housedaughters contrasts with the large advantages to the highest social class; of all the early-life characteristics, high/mediate non-manual social class was the single strongest predictor of educational advantage for all three outcomes in both cohorts. In the G1s, social class also interacted with birth order and gender, highlighting a constellation of particular advantage to first-born, male children of non-manual families. That family social class affects educational outcomes is well-documented, including in Swedish populations born at similar times to our study samples al 1969; Husén and Boalt 1967; Björklund et al 2003; Berggren 2006; Erikson and Jonsson 1993; Erikson and Jonsson 1996). There is also some evidence of narrowing socio-economic inequalities in recent decades, particularly with respect to education continuation (Erikson and Jonsson 1996; Erikson and Jonsson 1993). Nevertheless, it was striking how little change there was in the pattern of social class differences between our two cohorts. This highlights the continued policy imperative to seek to narrow these socio-economic inequalities, particularly given our demonstration that strong social class effects persist after adjusting for multiple plausible mediators or confounders such as birth characteristics or family composition. By including these other biological and social characteristics, our study also permits some comparison of the magnitude of their different effects. We believe

Anna Goodman, Marit D Gisselmann, Ilona Koupil Early-life predictors of educational inequalities in Sweden
335
that one contribution of this paper is to demonstrate that socio-economic differences form only one important axis of inequality. In particular, there were substantial educational disparities by birth order, mother’s age and mother’s marital status, despite these receiving far less attention from academics and policy-makers than socio-economic differences. A further contribution of this paper has been to assess how far these early-life effects upon educational continuation could be explained by prior school achievement. In the G3s, schoolmarks explained almost all differences in secondary school attendance, which was also near-universal among those who achieved schoolmarks above the bottom fifth. This probably reflects the fact that G3s had few alternative occupational pathways at this age, and attending secondary school was therefore standard for those with adequate school achievement. By contrast, schoolmarks only partly explained the effects of family composition and social class upon G3 continuation to tertiary education. The same was true of G1 continuation to both secondary school and tertiary education. Previous Swedish studies have documented such effects for low social class (Erikson and Jonsson 1993; Erikson and Jonsson 1996; Husén and Boalt 1967), but to our knowledge this is the first demonstration that children with higher birth order, younger mothers or unmarried mothers are less likely to continue their education even after controlling for their school achievement. This suggests a ‘two-stage’ process in creating educational inequalities, with disadvantages in school achievement being compounded by a lower probability of education continuation net of school achievement (Boudon 1974). This again highlights the greater attention which family composition deserves as a source of educational inequalities across the lifecourse. A final, unique contribution of our paper is to demonstrate that birth characteristics, family composition and family social class may all have effects upon educational outcomes which extend across multiple generations. Specifically, we showed that both the school achievement and the
education continuation of Swedes born in 1973-1980 were predicted by their grandparents’ birthweight, birth order and family social class at birth – that is, the social class of their great-grandparents four generations before. We also showed that these effects seemed to be largely or entirely explained by the intervening educational attainment and social class of the parents of the G3s. This indicates the ongoing importance of education as a mechanism whereby early-life disadvantage is translated into social inequalities across the lifecourse, social inequalities which may then be recreated across generations to create a long-term legacy of social disadvantage.
Conclusion The Swedish education system underwent major reforms between the births of our two cohorts, many of which were explicitly designed to extend and democratise educational opportunities (Erikson and Jonsson 1993; Husén and Boalt 1967). This paper demonstrates Sweden’s success in increasing the proportion of young people entering secondary and tertiary education, and also in equalising participation by gender. Nevertheless, for most early-life characteristics the pattern of relative advantage and disadvantage changed little over the twentieth century. Moreover, early-life disadvantage was not only associated with educational inequalities across the lifecourse but was also found to predict educational inequalities over three generations, as mediated by intervening socio-economic position. These findings therefore indicate the persistent importance of multiple axes of educational inequality in Sweden, and suggest the continued need for policies which seek to equalise opportunities across children. The consistency of these findings across our two cohorts also suggests their potential relevance for understanding educational inequalities in populations around the world. Greater understanding of educational inequalities would, in turn, shed light onto a major mechanism whereby health inequalities are created and recreated across generations.

Anna Goodman, Marit D Gisselmann, Ilona Koupil Early-life predictors of educational inequalities in Sweden
336
Acknowledgements UBCoS Multigen is supported by grants from the Swedish Council for Working Life and Social Research (Grant No 2007-1010) and the Swedish Research Council (Grant No 2006-7498). The study was approved by the Regional Ethics committee in Stockholm (dnr 03-117 (2003-03-10), dnr 04-944T (2004-12-10), and dnr 2009/1115-32 (2009-06-29)). IK is currently funded by the Swedish Council for Working Life and Social Research. Many thanks to Bitte Modin, Arijeta Makoli, Lisa Holmberg, Lina Svensson and Isabelle Ljungkvist for their work in collecting the school achievement data; to Rawya Mohsen, Bitte Modin and Reidar Österman for their contribution to data management; to George Ploubidis for advice on statistical analysis; and to Bitte Modin, Denny Vågerö and Dave Leon for comments during preparation of this manuscript.
References Berggren C. (2006) Labour Market Influence on Recruitment to Higher Education – Gender and Class
Perspectives. Higher Education, 52, 121-148. Bhutta AT, Cleves MA, Casey PH, Cradock MM and Anand KJ. (2002) Cognitive and behavioral outcomes of
school-aged children who were born preterm: a meta-analysis. Journal of the American Medical Association, 288, 728-37.
Bjerkedal T, Kristensen P, Skjeret GA and Brevik JI. (2007) Intelligence test scores and birth order among young Norwegian men (conscripts) analyzed within and between families. Intelligence, 35, 503-14.
Björklund A, Lindahl M and Sund K. (2003) Family background and school performance during a turbulent era of school reforms. Swedish Economic Policy Review, 10, 111-136.
Boardman JD, Powers DA, Padilla YC and Hummer RA. (2002) Low birth weight, social factors, and developmental outcomes among children in the United States. Demography, 39, 353-68.
Boudon R. (1974) Education, Opportunity, and Social Inequality. John Wiley and Sons, New York. Bradley RH and Corwyn RF. (2002) Socioeconomic status and child development. Annual Review of
Psychology, 53, 371-99. Breslau N, Paneth NS and Lucia VC. (2004) The lingering academic deficits of low birth weight children.
Pediatrics, 114, 1035-40. Conley D and Bennett NG. (2000) Is Biology Destiny? Birth Weight and Life Chances. American Sociological
Review, 65, 458-467. Desai S, Chase-Lansdale PL and Michael RT. (1989) Mother or market? Effects of maternal employment on
the intellectual ability of 4-year-old children. Demography, 26, 545-61. Eckstein Z, Mira P and Wolpin KI. (1999) A Quantitative Analysis of Swedish Fertility Dynamics: 1751-1990.
Review of Economic Dynamics, 2, 137-165. Eide MG, Oyen N, Skjaerven R and Bjerkedal T. (2007) Associations of birth size, gestational age, and adult
size with intellectual performance: evidence from a cohort of Norwegian men. Pediatric Research, 62, 636-42.
Ely M, Richards MPM, Wadsworth MEJ and Elliott BJ. (1999) Secular changes in the association of parental divorce and children’s educational attainment - evidence from three British birth cohorts. Journal of Social Policy, 28, 437-455.
Erikson R. (1984) Social class of men, women and families. Sociology, 18, 500-514. Erikson R and Jonsson JO. (1993) Ursprung och utbildning. Social snedrekrytering til högre studier [Origin
and education. Social selection to higher education]. Stockholm: SOU, 1993: 85.Erikson R and Jonsson JO. (1996) Explaining Class Inequality in Education: the Swedish Test Case in
Erikson, R and Jonsson, JO, eds, Can Education Be Equalized? The Swedish Case in Comparative Perspective. Westview Press, Oxford.
Gisselmann M, Koupil I and De Stavola BL. (2010) The combined influence of parental education and preterm birth on school performance. Journal of Epidemiology and Community Health, Epub ahead of print, doi:10.1136/jech.2009.105569.
Goodman A and Koupil I. (2009) Social and biological determinants of reproductive success in Swedish males and females born 1915-1929. Evolution and Human Behavior, 30, 329-341.
Guo G. (1998) The timing of the influences of cumulative poverty on children’s cognitive ability and achievement. Social Forces, 77, 257-88.
Husén T and Boalt G. (1967) Educational Research and Educational Change: The Case of Sweden. John Wiley and Sons, Inc, New York. , Emanuelsson I, Fagerlind I and Liljefors R. (1969) Talent, opportunity and career : a twenty-six year follow-up of 1500 individuals. Almqvist and Wiksell, Stockholm.

Anna Goodman, Marit D Gisselmann, Ilona Koupil Early-life predictors of educational inequalities in Sweden
337
Erikson R and Jonsson JO. (1996) Explaining Class Inequality in Education: the Swedish Test Case in Erikson, R and Jonsson, JO, eds, Can Education Be Equalized? The Swedish Case in Comparative Perspective. Westview Press, Oxford.
Gisselmann M, Koupil I and De Stavola BL. (2010) The combined influence of parental education and preterm birth on school performance. Journal of Epidemiology and Community Health, Epub ahead of print, doi:10.1136/jech.2009.105569.
Goodman A and Koupil I. (2009) Social and biological determinants of reproductive success in Swedish males and females born 1915-1929. Evolution and Human Behavior, 30, 329-341.
Guo G. (1998) The timing of the influences of cumulative poverty on children’s cognitive ability and achievement. Social Forces, 77, 257-88.
Husén T and Boalt G. (1967) Educational Research and Educational Change: The Case of Sweden. John Wiley and Sons, Inc, New York. , Emanuelsson I, Fagerlind I and Liljefors R. (1969) Talent, opportunity and career : a twenty-six year follow-up of 1500 individuals. Almqvist and Wiksell, Stockholm.
Jefferis BJ, Power C and Hertzman C. (2002) Birth weight, childhood socioeconomic environment, and cognitive development in the 1958 British birth cohort study. British Medical Journal, 325, 305.
Jonsson JO. (2004) Equality to a halt? Social Mobility in Sweden, 1976-99 in Breen R, ed. Social mobility in Europe, pp 225-250. Oxford University Press, Oxford.
Koupil I. (2007) The Uppsala studies on developmental origins of health and disease. Journal of Internal Medicine, 261, 426-36.
Lawlor DA, Batty GD, Morton SM, Deary IJ, Macintyre S, Ronalds G and Leon DA. (2005) Early life predictors of childhood intelligence: evidence from the Aberdeen children of the 1950s study. Journal of Epidemiology and Community Health, 59, 656-63.
Lawlor DA, Najman JM, Batty GD, OCallaghan MJ, Williams GM and Bor W. (2006) Early life predictors of childhood intelligence: findings from the Mater-University study of pregnancy and its outcomes. Paediatric and Perinatal Epidemiology, 20, 148-62.
Modin B. (2002a) Birth order and educational career: a study of school performance and achieved education of children born in early twentieth century Sweden. Journal of Family History, 27, 25-39.
Modin B. (2002b) Birth order and mortality: a life-long follow-up of 14,200 boys and girls born in early 20th century Sweden. Social Science and Medicine, 54, 1051-64.
Modin B. (2003) Born out of wedlock and never married-it breaks a mans heart. Social Science and Medicine, 57, 487-501.
Price J. (2008) Parent-Child Quality Time: Does Birth Order Matter? Journal of Human Resources, 43, 240-265.
Rajaleid K, Manor O and Koupil I. (2008) Does the strength of the association between foetal growth rate and ischaemic heart disease mortality differ by social circumstances in early or later life? Journal of Epidemiology and Community Health, 62, e6.
Record RG, McKeown T and Edwards JH. (1969a) The relation of measured intelligence to birth order and maternal age. Annals of Human Genetics, 33, 61-9.
Record RG, McKeown T and Edwards JH. (1969b) The relation of measured intelligence to birth weight and duration of gestation. Annals of Human Genetics, 33, 71-9.
Shenkin SD, Starr JM and Deary IJ. (2004) Birth weight and cognitive ability in childhood: a systematic review. Psychological Bulletin, 130, 989-1013.
SOU (1942) Betänkande med utredning och förslag angående betygssättningen i folkskolan [Official report and proposal for elementary school grading]. Stockholm: SOU, 1942: 11.
Statistics Sweden (1989) Meddelanden i samordningsfrågor [Report on co-ordination issues]. Stockholm: Statistics Sweden, 1989: 5.
Steelman L, Powell B, Werum R and Carter S. (2002) Reconsidering the effects of sibling configuration: recent advances and challenges. Annual Review of Sociology, 28, 243-69.
Victora CG, Huttly SR, Fuchs SC and Olinto MT. (1997) The role of conceptual frameworks in epidemiological analysis: a hierarchical approach. International Journal of Epidemiology, 26, 224-7.
Walldén M. (1990) Sibling position and mental capacity. Research report 31 in Project Metropolitan: Stockholm University.
Walldén M. (1992) Sibling position and the educational career. Research report 37 in Project Metropolitan: Stockholm University.
World Health Organization (2008) Closing the gap in a generation: health equity through action on the social determinants of health. World Health Organization, Geneva.
Yang S, Platt RW and Kramer MS. (2010) Variation in child cognitive ability by week of gestation among healthy term births. American Journal of Epidemiology, 171, 399-406.

Anna Goodman, Marit D Gisselmann, Ilona Koupil Early-life predictors of educational inequalities in Sweden
338