bis analysis paper number 5: the impact of the working ... · work-life balance employee survey...
TRANSCRIPT

Pre-publicationEmbPrepublication
1
BIS ANALYSIS PAPER NUMBER 5
The Impact of the Working Time Regulations on the UK labour market: A review of evidence
DECEMBER 2014

Contents Aims and acknowledgements ................................................................................ 4
Executive Summary ................................................................................................ 5
1. Introduction ......................................................................................................... 9
Rationale for intervention ................................................................................ 11
Theoretical impacts of restricting working time ................................................ 13
2. The 48 hour working week ............................................................................... 21
The 48 hour working week .............................................................................. 21
Hours worked - International and historical context ......................................... 22
Long-hours working since 1998 ...................................................................... 24
Comparison with groups not covered by the regulations: Self-employed; Managers, Directors and Senior Officials; workers in the Transport sector ...... 28
Long-hours workers as a proportion of workers ............................................... 31
Changes in the distribution of working hours ................................................... 32
Impact on wages ............................................................................................. 34
3. The opt-out and the individual ......................................................................... 36
The desire to work long-hours ......................................................................... 37
The opt-out and other derogations .................................................................. 40
Importance of the opt-out to the UK ................................................................ 44
4. The impact of changes to paid leave entitlements ......................................... 46
Paid leave entitlements before and after the Working Time Regulations ......... 46
5. The impact of other provisions ........................................................................ 50
Minimum daily and weekly rest periods ........................................................... 51
Restrictions on night working .......................................................................... 57
6. The impact of legal rulings ............................................................................... 63
2

Implications of the SiMAP-Jaeger Rulings – On-call Working .......................... 63
Implications of the Stringer-Pereda (and other) rulings at the Court of Justice of the EU – Annual Leave ................................................................................... 64
Implications of CJEU Rulings on Holiday Pay (Williams v BA and Lock v British Gas) at the Court of Justice of the EU ............................................................. 65
7. Workplace Health and Safety in the UK ........................................................... 66
8. Conclusions ....................................................................................................... 71
Annex 1: A profile of long-hours working in the UK ........................................... 74
Annex 2: Description of data sources ................................................................. 80
Annex 3: Econometric Analysis ........................................................................... 81
Bibliography .......................................................................................................... 86
3

Aims and acknowledgements The Working Time Regulations were introduced in the UK in 1998 in order to ensure that UK employment regulations were compliant with the requirements of the European Working Time Directive. This paper comprehensively reviews the available evidence to assess the impact compliance with the Directive has had on the UK labour market1. As well as reviewing the existing literature, new data analysis is presented using a range of sources, primarily the Labour Force Survey (LFS). This BIS analysis paper considers the impact the regulations had when first introduced, as well as the important question of how the impacts have evolved over time.
This paper was written by Ciaran Devlin and Alex Shirvani in the Labour Market Directorate in BIS. The authors would like to thank the following people who have shaped the work through their comments and contributions to the analysis:
Alfie Lake, Bill Wells, Amy Newland, Beth Martin, Tristan Jose, Kevin Wrake, Ian Young, Syed Islam, Joshua Leedale and Ciara Lenoach.
1 As far as possible, evidence presented in this review covers the whole of the UK. However some important data sources cover Great Britain only.
4

Executive Summary Key Conclusions
• The Working Time Directive had the stated aim of ensuring workplace health and safety for workers. The UK already had one of the best workplace health and safety records in Europe prior to the introduction of the Working Time Directive, with workplace health and safety improving further in recent decades. It is difficult to assess whether there is any link between the introduction of the Working Time Directive and workplace health and safety in the UK.
• Since 1998 there has been a decline in the incidence of long-hours working in the UK and a general trend towards shorter working hours. It is possible that this is, at least in part, due to the introduction of the 48-hour maximum working week despite the existence of the opt-out. We have also seen a general trend over this period towards a more diverse range of working patterns.
• Our data analysis leads us to suggest that the impact of the regulations was mainly through increased employment of workers doing shorter working weeks, rather than through a reduction in total hours worked. It appears therefore that the decrease in long hours working was at least partly offset by increased employment of workers doing shorter working weeks.
• Long-hours working is generally more prevalent in high income and highly skilled occupations compared to lower income and medium and low-skilled occupations. It is more prevalent amongst males, people with management positions, and in certain sectors. Evidence suggests that many people working long hours do so for short periods of time, perhaps indicating that employees do exercise a choice over whether they work long hours.
• Retaining the opt-out is very important both to UK business and to UK employees. The evidence suggests that taking away the ability to opt-out would be harmful both to business and to the welfare of workers who currently opt-out. Survey evidence demonstrates that the majority of workers currently working above 48 hours would not want to reduce their hours if it meant less money.
• Annual leave entitlements have increased since the introduction of the Working Time Directive. Many employees receive a more generous leave entitlement than that prescribed by law. Domestic regulation introduced since 1998 gives a more generous minimum annual leave entitlement than that set out in the Working Time
5

Key Conclusions
Directive.
• For UK employers, the principal concerns are around court judgments in relation to: (a) holiday pay and non-guaranteed overtime/sales commission; (b) on-call time and compensatory rest which impact sectors carrying out on-call working; and (c) the interaction of sick leave, annual leave and other forms of leave.
This paper comprehensively reviews the available evidence to assess the impact compliance with the Working Time Directive (WTD) has had on the UK labour market. The Working Time Directive was introduced with the stated aim of protecting workers' health and safety. Prior to the introduction of the Working Time Regulations (WTRs), the UK had an excellent workplace health and safety record - and workplace health and safety has improved further in recent decades. The UK has one of the best health and safety records in Europe - whether measured by workplace fatalities, or by broader measures such as whether employees generally feel that their health is at risk because of their work. It is difficult to assess whether there is any link between the introduction of the Working Time Directive and workplace health and safety in the UK. The review considers a wide range of evidence. As well as reviewing the existing literature, new data analysis is presented using a range of sources, primarily the Labour Force Survey (LFS).
The 48 hour working week In the UK and in other developed countries, there has been a long term downward trend in working hours, with reductions in the working week associated with increases in productivity. This reduction has also taken place more recently in countries without widespread regulation of working time. There has been a reduction in the proportion of workers in the UK working long hours. Between 1997 and 2013, the number of employees doing excess of 48 hours decreased by 15%. Whilst this is part of the wider trend towards reduced working hours, the evidence suggests that the introduction of the Working Time Regulations has had some additional effect on reducing long-hours working in the UK. For example, the same trends were not observed in the transport sector until it came into scope of the regulations several years later. The trends in the labour market lead us to suggest tentatively that the reduction in long-hours working was at least partly offset by increased employment amongst workers doing shorter hours. Econometric analysis of
6

the data is consistent with this interpretation – our analysis suggests that the introduction of the WTRs had little discernible impact on total hours worked across the economy, but a small positive impact on employment. The UK labour market has evolved significantly since the early 1990s when the WTD was negotiated. Since then technological developments and the increase in flexible working practices mean that the boundary between ‘working time’ and leisure is increasingly blurred, with increasing numbers of employees exercising autonomy over when and where they do their work.
The opt-out and the individual The vast majority of long-hours workers would not like to work fewer than 48 hours per week if it meant less pay. There appears to be broad based support for the opt-out amongst UK business, long-hours workers, and the wider public. Use of the opt-out is reasonably widespread across UK businesses – roughly one third of workplaces have at least one employee opted out, whilst in 15% of workplaces all employees have opted out. Retaining the opt-out is very important both to UK business and to UK employees. The evidence suggests that taking away the ability to opt-out would be harmful both to business and to the welfare of workers who currently opt-out. Long-hours working is generally more prevalent in high income and highly skilled occupations compared to lower income and medium and low-skilled occupations. It is more prevalent amongst males, people with management positions, and in certain sectors. Evidence suggests that many people that work long hours do so for short periods of time, perhaps indicating that employees do exercise choice over whether they work long hours. Around half of those working over 48 hours do so for a consecutive period less than one year and close to a third do so for a period of 3 months or less.
The impact of changes to paid leave entitlements Article 7 of the Working Time Directive states that every worker is entitled to at least four weeks of paid leave per year. The Labour Force Survey data suggests that there was some effect of introducing a minimum entitlement of 20 days. The proportion of full-time employees receiving fewer than 12 days leave (excluding 8 public holidays2) fell from 6 per cent in 1998 to 3 per cent by 2001 and has remained at around that level since. Therefore in the UK, paid annual leave entitlements have become more generous since 1998, with a rising proportion of the full-time workforce receiving annual leave entitlements which are well above the minimum bounds of the regulations. Indeed, current UK domestic law sets minimum paid annual leave over and above the WTD minimum – an amendment to the
2 In Scotland there are 9 public holidays, in Northern Ireland there are 10.
7

WTRs in 2007 introduced an entitlement to 5.6 weeks of leave. The Fourth Work-Life Balance Employee Survey suggests 65 per cent of full time employees receive more than the statutory legal minimum. 75 per cent of full-time employees took the full amount of leave offered to them by their employer, compared with 79 per cent of part time workers. The introduction of the minimum annual leave provisions in the WTD may have contributed to the environment in which annual leave provision increased but it seems unlikely that the regulations are solely responsible for the increases.
The impact of other provisions The WTD sets out entitlements to minimum daily and weekly rest breaks, as well as some additional entitlements for night workers. Before the regulations were introduced, it was thought that complying with these provisions would have a substantial impact on employers. However, BIS analysis of the LFS data suggests that these provisions have not altered patterns of working in the way anticipated. We venture that this is partly because there are a large range of derogations which give some flexibility to the sectors that are particularly likely to be affected by the regulations. There have been relatively few calls to government advisory helplines about issues related to working time in the UK, perhaps suggesting that neither employers nor employees are encountering major difficulties with the core aspects of the regulations. However, there are several major issues with particular aspects of the Directive – in particular how the Directive has been interpreted in rulings of the Court of Justice of the European Union.
The impact of legal rulings Since the Working Time Directive was implemented in the UK there have been European Court judgments that have affected on-call work as well as aspects of annual leave. The Simap-Jaeger rulings around on-call working have meant complexity and some confusion for employers and workers where on-call working is a common practice. This in turn has an impact on public services, particularly health.
Two 2009 cases (Stringer/Pereda) about the interaction of annual leave and sick leave & other forms of leave have also caused concerns for employers. The rulings entitle workers to reschedule any period of leave which coincides with a period of sickness and if necessary, carry leave over into subsequent leave years.
More recently there have been several cases which have raised the issue of whether holiday pay should include non-regular overtime (Fulton v Bear Scotland, Employment Appeal Tribunal), Commission (Lock v British Gas, CJEU) or pilots’ flying supplements (BA v Williams).
8

1. Introduction Key points
• This chapter sets out the policy history in the area of working time regulation, explores the rationale for regulation in this area, considers the range of potential economic impacts that can arise from restricting working time, and briefly presents some of the existing literature in this area.
• The Working Time Directive was introduced with the stated aim of protecting workers’ health and safety. Prior to its introduction, there were no general regulations in the UK relating to working time or entitlement to leave.
• The economic rationale for a restriction on working time hinges on a market failure in the labour market. This could be in the form of imperfect information (workers are unaware of the health implications of long hours working), imperfect competition (workers have limited alternative employment opportunities) or externalities (working long hours imposes costs on others).
• According to macroeconomic theory, the predicted net economic impact of restricting working time is ambiguous. Although restricting the hours of individual workers would be expected to reduce output, if productivity increases or levels of employment increase, these might partially or wholly offset the fall in output. Therefore ex-post empirical analysis is required to identify which of these effects dominates.
• The impact of a restriction in Working Time may differ in the short term compared to the long term. In the short term, firms may have limited ability to adjust their allocation of resources. However in the longer term, adjustment of capital and labour within and between firms is likely to mean that any impacts diminish over time.
• Empirical evidence on the impact of restricting Working Time is mixed – a range of impacts on employment and wages have been found in studies assessing the impacts of restricting Working Time in a range of environments.
The Working Time Directive (WTD) was intended to protect workers’ health and safety by setting minimum requirements in relation to working hours, rest periods, and entitlement to paid annual leave. The Directive states that “the improvement of workers’ safety, hygiene and health at work is an objective which should not be subordinated to purely economic considerations”. 9
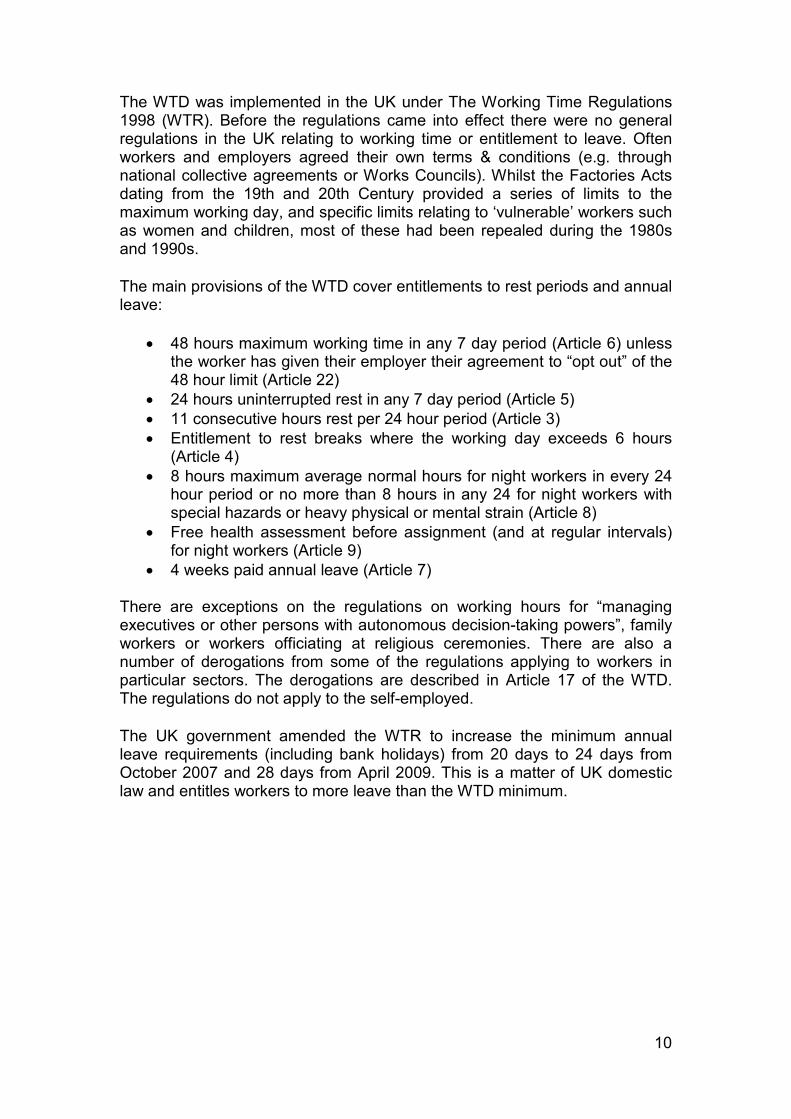
The WTD was implemented in the UK under The Working Time Regulations 1998 (WTR). Before the regulations came into effect there were no general regulations in the UK relating to working time or entitlement to leave. Often workers and employers agreed their own terms & conditions (e.g. through national collective agreements or Works Councils). Whilst the Factories Acts dating from the 19th and 20th Century provided a series of limits to the maximum working day, and specific limits relating to ‘vulnerable’ workers such as women and children, most of these had been repealed during the 1980s and 1990s.
The main provisions of the WTD cover entitlements to rest periods and annual leave:
• 48 hours maximum working time in any 7 day period (Article 6) unless the worker has given their employer their agreement to “opt out” of the 48 hour limit (Article 22)
• 24 hours uninterrupted rest in any 7 day period (Article 5) • 11 consecutive hours rest per 24 hour period (Article 3) • Entitlement to rest breaks where the working day exceeds 6 hours
(Article 4) • 8 hours maximum average normal hours for night workers in every 24
hour period or no more than 8 hours in any 24 for night workers with special hazards or heavy physical or mental strain (Article 8)
• Free health assessment before assignment (and at regular intervals) for night workers (Article 9)
• 4 weeks paid annual leave (Article 7)
There are exceptions on the regulations on working hours for “managing executives or other persons with autonomous decision-taking powers”, family workers or workers officiating at religious ceremonies. There are also a number of derogations from some of the regulations applying to workers in particular sectors. The derogations are described in Article 17 of the WTD. The regulations do not apply to the self-employed.
The UK government amended the WTR to increase the minimum annual leave requirements (including bank holidays) from 20 days to 24 days from October 2007 and 28 days from April 2009. This is a matter of UK domestic law and entitles workers to more leave than the WTD minimum.
10

Rationale for intervention
The WTD restricts working time by establishing minimum entitlements to rest periods and paid annual leave that place a limit on the hours an individual can work. This form of legislation restricts the freedom between an employee and a firm to negotiate the hours of work and so is a ‘second best’ solution that, in an economic sense, can only be justified in the presence of market failure. A market failure describes a situation where a market fails to reach an economically efficient equilibrium. In this case, the potential market failures which could justify restrictions in working time are information failures, imperfect competition and externalities – these are described in turn below. By intervening in the market (in this case by restricting working time), the objective is to help the market reach an efficient outcome.
A perfectly competitive labour market In a perfectly competitive labour market the most efficient outcome would be reached by allowing workers and firms to agree patterns of work by free bargaining. Each hour worked by a worker offers the benefit of earning the hourly wage offered by the firm and imposes a cost equal to the value the worker places on an extra hour of leisure time. When workers and firms are allowed to freely negotiate working patterns, a worker will work up to the point
Box 1.1: Amendments to the Working Time Regulations since 1998
1999 – The record-keeping requirements relating to workers who have decided to opt-out of the 48 hour were revised to make them less burdensome.
1999 – Changes to the regulations regarding unmeasured working time.
2001 – The 13 week qualifying period for annual leave was removed.
2003 – The regulations were revised to incorporate the remaining provisions from the Young Workers Directive.
2004 – The regulations were extended to certain workers in the following sectors - road, sea, inland waterways, lake transport, railway, offshore and aviation. Later in the year, they were extended to junior doctors.
2007 – The regulations were amended to increase the minimum UK leave entitlement (in two stages) from 4 weeks to 5.6 weeks. This was intended to end the situation where some workers had to include time off for bank and public holidays against their statutory leave entitlement
2009 – The maximum working hours for some junior doctors were increased from 48 to 51 hours.
2013 – The regulations were amended to reflect the abolition of the Agricultural Wages Board.
11

at which the hourly wage offered by the employer equals the value the worker places on an extra hour of leisure. This leads to the efficient level of work for both the worker and the firm. Assuming the employer offers to pay an hourly wage that reflects the value to the firm of that hour’s work from the worker, both parties reach a position where neither could be better off by working a different amount of hours without making the other worse off.
Premiums for overtime work reflect the fact that the cost to the individual of foregoing an extra hour of leisure will be higher when they are already working a lot of hours and have less leisure time available that week, so the employer has to offer a greater incentive. Individuals will differ in their respective preferences for the opportunity to earn more income relative to the opportunity to enjoy greater leisure time so workers who value their leisure time less will prefer to work longer hours than others.
Imperfect information However, individuals may fail to accurately value their leisure time due to underestimating the risks to their health and wellbeing of working long hours. If workers do not have full information on the extent to which working an extra hour may impose costs to their health then they are likely to work a greater number of hours than the socially efficient level. This was a key argument used by advocates of the WTD around the time of its introduction - it was introduced primarily as health and safety legislation.
Firms may also lack information on the health and safety effects of requiring their workers to work long hours. Workers that are better rested may be more productive and less likely to suffer personal injury at work or endanger the health and safety of colleagues due to workplace accidents. They are also less likely to suffer illness and have to miss work through ill health.
Imperfect competition Free bargaining between workers and firms is only possible where there is a competitive labour market and workers have a large number of alternative employment opportunities. Where workers have limited alternative opportunities firms can take advantage of their power as a purchaser of labour by offering lower wages and requiring workers to work longer hours, without the workers being able to easily move to rival employers. In this case workers have limited bargaining power and may end up working more hours than they wish.
12

Externalities Some of the costs of working long hours may be external to the two parties involved (firms and workers). This means that workers and employers may agree longer patterns of work than are socially optimal – for example if long hours work has health impacts, then this may impose costs on public healthcare services. According to this rationale, restricting working time may lead to a lower call on health services, reducing congestion in healthcare.
Theoretical impacts of restricting working time
Placing restrictions on working time affects the aggregate supply capacity of an economy, and can result in changes to output, employment and productivity. Rules on maximum working weeks and annual leave directly reduce the overall amount of hours any individual worker can supply in a given time period. Entitlements to daily and weekly rest breaks and limits to shifts for night workers restrict the length of a continuous period of work for an individual worker, which may also reduce the overall amount of hours an individual can supply if it is not possible to rearrange working shifts to maintain the level of hours worked whilst satisfying the entitlements.
Box 1.2: Evidence on the health and safety impacts of long-hours working
Health and safety literature points to some association between longer working hours and greater fatigue, with potential detrimental effects to well-being. A review of the literature carried out by the Health and Safety Laboratory (2003) concluded that long hours were associated with fatigue, although the evidence with regard to long hours on safety and accidents was inconclusive. The evidence on long hours and stress or ill health was mixed and indicated that the amount of control an individual has over their job and the way the individual thinks about their job would influence the relationship. There was some evidence (mostly from Japanese men) to suggest negative association between long hours and cardiovascular health.
However some research has argued that the relationship between working longer hours and negative effects on well-being is not directly linear. Glass and Fujimoto (1994) looked at the incidence of depression in US households and concluded that employment up to a certain level of hours (54 for men, 46 for women) had positive effects on mental health and suggested that job satisfaction when roles were not overloaded was beneficial even when working long-hours. Bell et al. (2011) find that adverse health effects are not simply correlated with long-hours working but with mismatches between actual and desired hours worked. A House of Lords report in 2004 concluded that from the evidence it received that there was no clear causal link between working long hours and detrimental effects on health and safety, nor was there evidence of a relationship between the voluntary opt-out from the 48-hour maximum working week and adverse health and safety consequences.
See Chapter 7 for a review of the UK’s workplace health and safety record.
13
Firm-level and individual responses to the restriction of working time Firms have various reasons for using sustained long-hours working: these include demand requirements (meeting deadlines, clearing backlogs), personnel reasons (staff shortages, cover for sickness or absence) or institutional reasons (Hogarth et al., 2003). In sectors where there is a low degree of substitutability between staff, or where there are skill shortages in the labour market, long-hours working may be necessary in order to meet demand.
The regulations around the 48 hour week mean that the decision to work long hours lies with the individual rather than the firm. Employers are not allowed to compel workers to work more than 48 hours if they are not willing to sign an opt-out, so the 48-hour limit imposes a restriction on the supply of long-hours workers. There may then be a difference between the available supply of workers willing to do more than 48 hours and the demand from firms for workers to work more than 48 hours. If the available supply of these workers does not meet the demand then there would be some effect on overall hours worked.
Where a firm which previously relied on long-hours working prior to the introduction of the regulations could not find enough workers who were willing to opt-out of the 48-hour limit, the firm’s potential short-run3 response could have been:
1. Reduce output: accepting the reduction in hours supplied and producing less output, reducing some costs by paying for fewer hours of labour.
2. Increase employment: maintaining the overall level of hours worked by hiring additional workers. However, if workers are not directly substitutable there may be some loss of productivity and output may fall.
3. No change: maintaining the overall level of hours worked by re-organising shift patterns amongst existing workers.
At the firm level, each firm would trade-off the cost of reducing output against the adjustment costs, using the most cost-effective form of adjustment. As well as the costs of adjustment in output, extra hiring or re-organisation of working patterns, firms may also have incurred an administrative cost of demonstrating compliance. This may have included setting up recording and monitoring systems to report on working time. These costs would have been borne by all firms whether or not their working practices were already compliant with the regulations, although some firms may have been able to
3 In the long run it may also be possible to maintain output by substituting capital for labour but in the short run if firms cannot adjust their levels of capital quickly this may not be an option. 14

absorb much of the costs by combining record-keeping on working time with mechanisms for reporting on other regulatory requirements.
The practicalities of managing the opt-out may also increase the cost of employing long-hours workers for firms. They face some organisational and administrative costs in setting up an opt-out for workers and they face the uncertainty that individual workers can choose to revoke their wish to opt-out at any time. This uncertainty could encourage employers that would otherwise have used business models that relied on long-hours working to shift towards business models that would still be functional if they were unable to find enough long-hours workers willing to opt out. The additional costs could mean the demand for long-hours workers from firms is lower than it would be in the absence of the limit.
Despite the flexibility within the regulation to allow individuals to opt out, it is likely that the introduction of a limit on weekly working hours would cause a decline in the incidence of long hours working. In the following chapter we assess whether or not such an effect can be observed in the data.
Aggregate-level responses At an aggregate level, firms that already complied with the regulations prior to their introduction will have developed a relative advantage over firms that had to incur adjustment costs, and over time some production may have shifted towards the firms already compliant or with lower adjustment costs whilst others may have lost output, market share or potentially exited the market. The overall economic impact would depend on how far the net additional costs of adjustment were passed on to prices and represented a reduction to the aggregate supply capacity of the economy.
General conditions in the labour market will have influenced the impact on costs: the availability of extra workers and the willingness of workers already working below maximum limits to supply additional hours’ labour or work more flexibly to re-organise shifts, will have influenced the marginal cost of employing extra hours of labour. Institutional factors such as the strength of trade unions and existing mechanisms for collective bargaining will also have influenced this cost.
Aggregate response: Employment Where workers are directly substitutable and there are unemployed workers in the economy, firms can maintain output by hiring more workers to maintain the overall level of labour hours, so a reduction in working hours could lead to additional employment. This is the basic argument for restricting hours leading to extra employment.
However there are several reasons why a restriction on working hours may not lead to a proportionate increase in employment to maintain the overall quantity of working hours. In many circumstances workers are not directly substitutable and there may be skill shortages, inefficiencies in job search and imperfect information available to match jobs to workers. There may be fixed
15
costs per worker associated with training and support costs, general overheads, or costs associated with taxes or pension provision that mean hiring extra workers is more expensive than employing existing workers to work more hours. This would increase the relative cost of labour. There may also be some degree of substitutability between labour and capital, so firms may respond to an increase in the cost or lack of availability of labour by using more capital or developing more capital intensive processes. The restriction on working time may therefore result in an overall lower number of hours worked in the economy, which may reduce or even eliminate the potential increase in employment.
Empirical studies on this issue show a mixed picture with some positive and some negative effects on employment depending on other factors like the stickiness of wages. Box 1.3 briefly summarises the evidence in the literature on this point and in Annex 3 we present some new econometric analysis of the aggregate impact of the Working Time regulations in the UK.
Aggregate response: productivity If firms responded to the restrictions by increasing employment there may have been productivity losses associated with new workers having lower levels of skills and experience, although these would have been expected to diminish over time. If firms responded by substituting capital for labour then there may have been productivity improvements for existing workers, and in the long run, firms will have had greater incentive to invest in accumulating capital or developing less labour-intensive production processes. Finally there may be an argument that short-hours workers are intrinsically more productive because they are better rested. It should be noted that these productivity increases will be in terms of output per hour worked, and output per worker may still fall due to the overall reduction of hours.
Another potential source of productivity gain is a reduction in unproductive working time. Lynch (1991) suggested there was extensive opportunity to realise productivity gains through better use of time: including ‘bell to bell working’, reducing slack periods and using greater flexibility of hours.
16

Box 1.3: Empirical evidence on the impact of restricting working hours on employment
A European Foundation (1998) study covering the period 1988-95 found that restrictions in working time in particular sectors, such as the German metallurgical industry, had a positive effect on employment growth. Reati (1998) shows that under certain circumstances including where working hours face a significant reduction (ten per cent or more) and cover a large share of employees in the labour market, reductions in working time can reduce unemployment at a macroeconomic level. However Reati also concludes that reducing working time is likely to reduce the amount of employer investment in skills as fewer hours worked result in a reduced rate of return on investment. Raposo and van Ours (2008) studied the effects of a restriction on working hours from 44 to 40 hours per week in Portugal in 1996 and found that hourly wages increased, reducing workers’ monthly wage only slightly.
Skuterud (2007) analysed the reduction in the standard working week in Quebec from 44 to 40 hours and found that the policy did not raise employment. Andrews et al. (2012) found that increases in standard working hours in a sample of German plants between 2001 and 2006 had a positive employment effect in plants that offered overtime whereas there were no employment effects associated with increasing hours for those that did not. Freeman (1998) found differences in effects between hours reductions imposed by government (which had only a small effect) and those that came about from market forces (which generally led to additional employment).
Crepon and Kramarz (2002) found employment losses of between two and four per cent as a response to the mandatory reduction of the working week from 40 to 39 hours in France in 1982. Estevao and Sa (2008) found that a further reduction in the French working week, from 39 to 35 hours for large firms in 2000 and small firms in 2002, increased job turnover, did not increase employment, and raised hourly wages with ambiguous effects on total weekly income.
Adnett and Hardy (2001) argue that the effects on employment of reducing hours are restricted by supply factors such as the distribution of skills between the unemployed and employed, and reluctance amongst the employed to reduce their income to share with additional employees. Marimon and Zilibotti (2000) suggest that small reductions in working time result in a small increase in equilibrium employment, but larger reductions reduce employment due to the effect of reducing overall output .
Lembcke (2014) analyses the impact of the increase in annual leave allowance on employment. Rather than an assessment of the aggregate employment effect, he focuses on the employment effects on those individuals affected by the regulations (i.e. individuals who received an increase in annual leave). He finds a small and statistically significant
17

Box 1.4: Empirical evidence on the impact of restricting working hours on productivity
Case study research into firm-level productivity and hours worked suggests declining rates of productivity as individual working hours increase, (Vernon, 1921; White, 1987; La Jeunesse, 1999), although other factors such as the intensity of physical effort also play a part. Shepard and Clifton (2000) applied a Cobb Douglas production function to analyse effects of overtime hours on productivity at a macroeconomic level and found for the majority of industries a productivity decline of 2 to 4 per cent for an increase in 10 per cent of overtime, concluding that as overtime increases and the average work week lengthens, there may be a threshold over which workers become increasingly inefficient.
There is some literature to suggest possible aggregate increases in Total Factor Productivity as a result of restricting working time. Eurofound (2010) demonstrated an inverse relationship between average annual hours and GDP per capita although this did not establish the direction of the correlation: it could be that productivity increases in a country facilitate shorter working hours rather than reductions in working time driving productivity increases.
A Deloitte (2010) study examining the effect of reducing working time on Total Factor Productivity presents evidence of an inverse relationship between productivity and annual working hours in the textiles, financial intermediation and electricity, gas and water supplies sectors in the UK. The results for the textiles and financial intermediation sectors were consistent with findings across other developed countries, whilst the results in the electricity, gas and water supplies sector varied across countries. However, again it is difficult to assess the direction of causality in the relationship between hours and productivity.
Crepon et al. (2005) examined the impact of the reduction in the French working week from 39 to 35 hours and estimated that the 10 per cent decrease in working time resulted in a 6.3 per cent increase in total factor
negative impact on employment in this group.
18

Box 1.4: Empirical evidence on the impact of restricting working hours on productivity
productivity. This suggests that a decrease in hours when accompanied by sticky wages can stimulate efficiency improvements to offset the other negative effects of increased hourly wage rates on competitiveness.
Diminishing costs over time At the time a restriction on working time is introduced it may represent a negative shock to aggregate supply in the short run by effectively reducing labour, one of the factors of production, as well as imposing additional administrative costs on firms as they seek to demonstrate compliance with the regulations.
However over a longer time period when other factors of production such as capital can be adjusted, the costs are likely to diminish. There may be general structural changes in the economy that change the way a firm uses labour - moving towards more capital-intensive forms of production may reduce the benefit to firms of employing workers for long continuous shifts and firms may prefer to employ fewer hours of labour per year.
When a regulation granting workers leave entitlements and restricting working hours has been in place for several years, more generous leave allowances and shorter working hours may become established as a new benchmark and become part of the overall compensation package with which firms bid for workers in a competitive market to hire labour (see for example Confederation of British Industry (CBI), 2014).
In addition, the administrative costs of demonstrating compliance are likely to fall especially if a regulation is in place for a long period of time where products may enter the market designed to reduce this type of reporting cost for firms.
After a regulation has been in place for a number of years, the relevant counterfactual to measure continuing impacts is whether a firm’s usual business practices have moved to a position that would meet the requirements of the regulation even if the regulation was removed. Over a time period long enough to allow adjustment in other factors of production such as capital and the state of technology, it is not necessarily accurate to assume that removing the regulations would see working patterns return to the position they were in before the regulations were introduced: the ‘business as usual’ position may have moved on.
19

However, even in the most extreme form of this situation where ‘business as usual’ had moved to a position that complied with all the working time restrictions even in the absence of the regulations, some cost savings would be associated with removing the regulations - the remaining administrative costs of compliance.
20

2. The 48 hour working week Key points
• In the UK and in other developed countries, there has been a long term downwards trend in working hours, with reductions in the working week associated with increases in productivity. This reduction has also taken place more recently in countries without widespread regulation of working time.
• There has been a reduction in the proportion of workers in the UK working long hours. Whilst this is part of the wider trend towards reduced working hours, the evidence suggests that the introduction of the Working Time Regulations has had some additional effect on reducing long-hours working in the UK – the same trends were not observed in the transport sector until it came into scope of the regulations several years later.
• The trends in the labour market suggest that the reduction in long-hours working was at least partly offset by increased employment amongst workers doing shorter hours. Econometric analysis of the data is consistent with this interpretation – our analysis suggests that the introduction of WTRs had little discernible impact on total hours worked, but a small positive impact on employment.
• The UK labour market has evolved significantly since the early 1990s when the WTD was negotiated. Since then technological developments and the increase in flexible working practices mean that the boundary between ‘working time’ and leisure is increasingly blurred, with increasing numbers of employees exercising autonomy over when and where they do their work.
This chapter examines the impact of the 48 hour maximum working week. It outlines the trends in patterns of working time prior to the introduction of the 1998 regulations, and considers how patterns of work were affected by the introduction of the 48 hour week.
The 48 hour working week
The 48-hour maximum working week is one of the more high profile aspects of the WTD. Article 6 of the WTD states that the average working time for each seven day period cannot exceed 48 hours, although this can be calculated over a reference period of four months.
21

The 48-hour limit on weekly working time is only partially binding. Article 22 of the WTD allows for workers to exceed 48 hours a week (averaged over the reference period) if they have first given their agreement to their employer. This is typically referred to as the ‘opt-out’. Firms are not allowed to apply pressure on workers to sign an opt-out.
In addition, Article 17 of the WTD allows for derogations from the 48-hour maximum where “on account of the specific characteristics of the activity concerned, the duration of the working time is not measured and/or predetermined or can be determined by the workers themselves”, particularly in the case of “managing executives or other persons with autonomous decision-taking powers”, family workers or workers officiating at religious ceremonies in churches and religious communities.
Before the implementation of the WTD in 1998 there was no restriction on weekly hours in the UK, so the most obvious way in which the WTD would affect working hours would be to reduce the incidence of working in excess of the 48-hour weekly maximum.
Hours worked - International and historical context
Across the industrialised world, there has been a long established trend of declining annual hours worked dating back to the end of the 19th century (Lee et al., 2007). Huberman (2002) presents an estimate of annual working hours which shows the fall in annual working hours in industrialised countries in the last century. The trend is remarkably similar across the countries presented, which include France, Germany, the Netherlands, the UK, Australia and the USA. Both economic and legal factors (broad convergence of legal standards towards shorter working hours) are likely to have played a key role in reducing the hours worked over the decades. Changes in working time in the UK since the introduction of the Working Time Directive need to be assessed against this historical context. Green (2001) tracked trends from 1977 to 1997 using the LFS and New Earnings Survey, and found that average hours levelled off over this period after a historic fall since the previous century. However there was an increase in the variation in hours worked, with proportions increasing at both ends of the hours worked distribution. Between 1983 and 1998, the proportion of employees working less than 20 hours per week increased from 10 per cent to over 14 per cent, but the proportion working over 48 hours per week also increased from 17 per cent to 20 per cent.
22

Chart 2.1: Historical trend in annual working hours in selected countries (1870 – 2000)
Source: Huberman (2002)
In their analysis for the International Labour Organisation, Lee et al. (2007) also examined data on actual weekly hours and concluded that while the introduction of the 48 hour working week (e.g. in the EU through the Working Time Directive, or outside the EU via a number of ILO conventions) has contributed to the reduced incidence of long hours working, in many countries long hours working remains widespread. The report estimated that roughly one in five workers (22 per cent) around the world was working longer than 48 hours a week.
Analysis of OECD data also shows that there is a high proportion of workers in OECD countries working more than 40 hours a week (see Table 2.1 below). Although this is a broader definition of long-hours working than that used elsewhere in this report, the data provide a useful guide to recent trends across the non-EU OECD countries. The data shows that there has also been a decline in long working hours in most of the non-EU OECD countries who were not affected by the Working Time Directive. Whilst by this measure the reduction in long hours working in the UK between 2001 and 2012 was amongst the largest in the countries presented, it is important to note the general trend towards reduced working hours both inside and outside the EU. Note however that this analysis does not distinguish between changes in the proportion of long hours working due to composition effects (e.g. because of greater labour market participation from workers wanting part-time work) and a reduction in the absolute number of workers doing long hours.
23

The findings of the fifth European Working Conditions Survey (2010) show that average working hours have reduced over time across the EU. In 1991, the average working time in the EU-12 was 40.5 hours a week; by 2010 it was 36.4 hours a week in the EU-15. 4 The survey also states that the number of people working part time has gradually increased from 17 per cent in the EU-12 in 1991 to 27 per cent in the EU-12 by 2010, while the number of people working long hours (working 48 hours or more per week) has decreased from 18 per cent in the EU-12 in 1991 to 12 per cent in the EU12 by 2010. Of course, the EU average masks important differences between countries – especially regarding the distribution of working hours. Although there is not much variance in the number of hours worked in some countries (for example, Hungary, Latvia and Lithuania), the spread is much larger in others (for example, in the UK, the Netherlands and in Ireland). In the UK, the labour market framework allows employers and employees to reach a wide range of agreements about the hours they work. This gives rise to a distribution of working hours with a large variance, meaning that while average weekly working hours in the UK are amongst the lowest in the EU, there is a tail of workers who work long hours.
Long-hours working since 1998
Average actual working hours declined after 1998 although there had been some suggestion of a decline in the years immediately before. Mean hours for full-time workers declined from 38.5 hours per week in 1997 to 37.0 per week by 2007, although there was a small increase to 37.5 hours per week by
4 The EU-12 countries are: Belgium, Denmark, France, Germany, Greece, Ireland, Italy, Luxembourg, Netherlands, Portugal, Spain and the United Kingdom. The EU-15 refers to the EU-12 countries plus Austria, Finland and Sweden.
Table 2.1: Workers usually doing more than 40 hours a week as a proportion of all employees in non-EU OECD countries
Country Proportion of long hours (>40 hours per week) workers
Percentage point change between 2001 and 2012
Turkey 92.6% -2.7% Chile 87.4% -7.5% Mexico 76.4% -5.4% United States 74.6% -2.2% Israel 72.9% 1.5% Switzerland 63.9% -1.8% New Zealand 63.9% -1.5% OECD average 63.0% -0.8% G7 average 60.2% -0.4% Canada 50.0% -1.6% Australia 46.2% -3.3% EU 15 average 45.7% 1.0% United Kingdom 44.2% -4.7% Norway 12.7% 1.0% Source: BIS analysis of OECD data. Data accessed 23rd June 2014.
24

2013. However, whilst average actual hours worked gives a good indication of the general downwards trend in working hours, it does not provide much insight into the specific impact of the Working Time regulations – because changes in average hours are affected by a range of factors and could reflect a general reduction in hours worked across the distribution, rather than a reduction in long hours working.
Chart 2.2: Mean average actual hours worked by full-time workers in main job5
5 Office for National Statistics, series YBUY 25
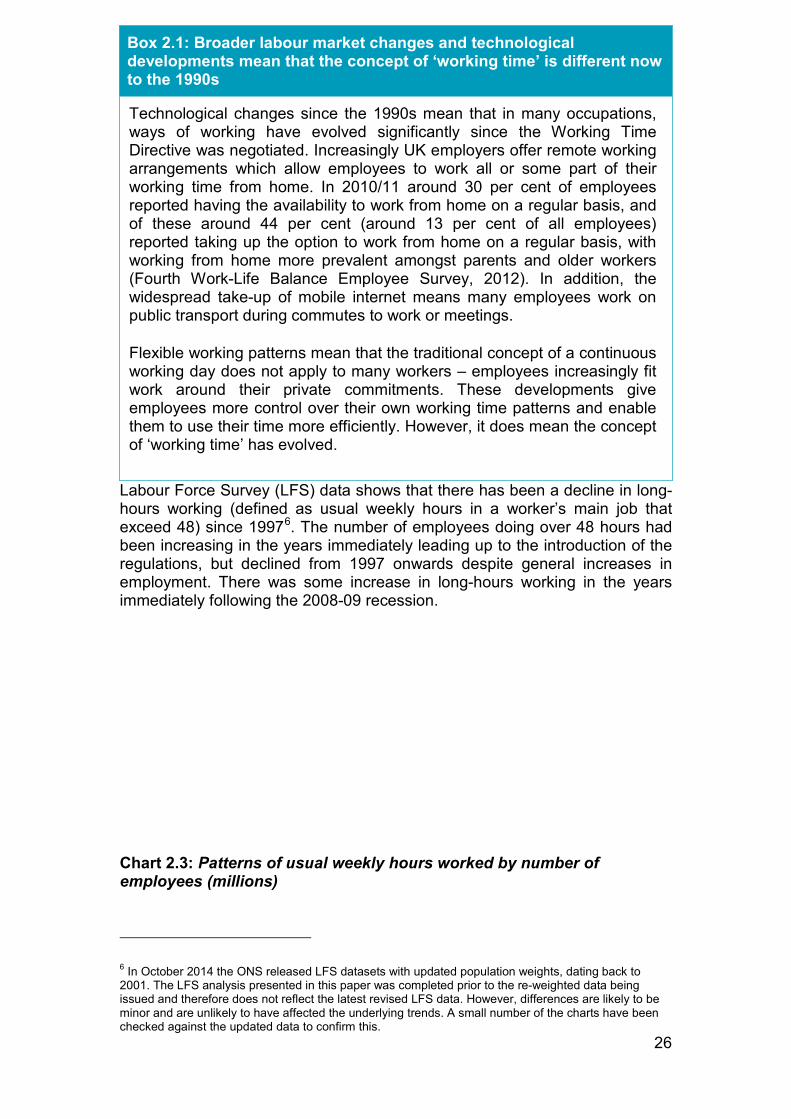
Labour Force Survey (LFS) data shows that there has been a decline in long-hours working (defined as usual weekly hours in a worker’s main job that exceed 48) since 19976. The number of employees doing over 48 hours had been increasing in the years immediately leading up to the introduction of the regulations, but declined from 1997 onwards despite general increases in employment. There was some increase in long-hours working in the years immediately following the 2008-09 recession.
Chart 2.3: Patterns of usual weekly hours worked by number of employees (millions)
6 In October 2014 the ONS released LFS datasets with updated population weights, dating back to 2001. The LFS analysis presented in this paper was completed prior to the re-weighted data being issued and therefore does not reflect the latest revised LFS data. However, differences are likely to be minor and are unlikely to have affected the underlying trends. A small number of the charts have been checked against the updated data to confirm this.
Box 2.1: Broader labour market changes and technological developments mean that the concept of ‘working time’ is different now to the 1990s
Technological changes since the 1990s mean that in many occupations, ways of working have evolved significantly since the Working Time Directive was negotiated. Increasingly UK employers offer remote working arrangements which allow employees to work all or some part of their working time from home. In 2010/11 around 30 per cent of employees reported having the availability to work from home on a regular basis, and of these around 44 per cent (around 13 per cent of all employees) reported taking up the option to work from home on a regular basis, with working from home more prevalent amongst parents and older workers (Fourth Work-Life Balance Employee Survey, 2012). In addition, the widespread take-up of mobile internet means many employees work on public transport during commutes to work or meetings.
Flexible working patterns mean that the traditional concept of a continuous working day does not apply to many workers – employees increasingly fit work around their private commitments. These developments give employees more control over their own working time patterns and enable them to use their time more efficiently. However, it does mean the concept of ‘working time’ has evolved.
26

The changes in employment can be represented in the form of an index relative to 1997 levels. Between 1997 and 2013, the number of employees doing in excess of 48 hours decreased by 15 per cent. Prior to the recession long-hours working had declined by around 20 per cent.
The number of workers working between 45 and 48 hours increased by 5 per cent by 2002, before falling back to levels slightly lower than 1997. Whilst this may be interpreted as an indication of some initial short term ‘bunching’ against the 48 hour margin that preceded longer term adjustment, it took place within an environment of generally strong employment growth.
The number of individuals working between 40 and 44 hours grew more steadily, by 5 per cent by 2002 and 12 per cent by 2013, but again the growth was lower than that seen in work patterns involving shorter working hours.
27

Chart 2.4: Growth in patterns of usual weekly hours worked by number of employees (indexed, 1997=100)
There is little evidence of a long-term increase in the proportion of workers in the group just below the 48-hour maximum. In the short term, there was a small initial increase in working up to the maximum, which subsequently fell back again. This may be evidence of firms adopting a short-term adjustment strategy which differs from a long-term strategy – for example adjusting workforce composition and capital/labour ratios may require several years to implement. Most of the growth in employment has taken place amongst workers doing shorter patterns of hours, particularly below 40 hours.
This evidence suggests that, at least in the long term, firms have not responded to the constraint at 48 hours by trying to work existing workers up to the maximum permitted by the regulations. The data is more consistent with firms replacing hours by increasing employment at shorter working patterns (a simplistic example would be hiring two workers to work 25 hours each rather than having one worker doing 50 hours). However it does not firmly establish that this is the case.
Comparison with groups not covered by the regulations: Self-employed; Managers, Directors and Senior Officials; workers in the Transport sector
Since 1998, there has also been a decline in the number of self-employed working over 48 hours per week. As the self-employed are not subject to the working time regulations, they can be seen as a rough comparison group to provide a form of counterfactual, though far from perfect as they have different 28

characteristics from employees. For example, there was already a pre-existing decline in long-hours working amongst the self-employed before 1998, at a time when there was an increase in long-hours working amongst employees.
Therefore it is likely that there are different factors determining working hours of the self-employed and employees. However, the sustained reduction in long-hours working amongst the self-employed (see Chart 2.4 below) suggests that there may be other factors determining the decline in long-hours working of employees in addition to any impact of the Working Time Regulations.
Chart 2.5: Patterns of usual weekly hours worked by number of self-employed (millions)
Another group that could provide a rough comparison group are “Managers, Directors and Senior Officials”. This occupational group is a rough proxy for those likely to be exempt from the 48 hour limit on usual weekly hours worked under the derogation for “managing executives or other persons with autonomous decision-taking powers” defined under Article 17 of the WTD. Amongst this group, we again see a rise in long-hours working in the years leading up to 1997 followed by a shallow decline, whilst there were increases in working shorter patterns of working. 7
7 Note that this data is only presented up to 2010, due to changes in the occupational coding (SOC) after 2010 which create a break in the series. 29

The extent to which this group actually serves as a valid control group is debateable. Although many workers in this group are likely to qualify as autonomous workers, firms and workers may not have been aware of the exemption and therefore some may have acted as if they were subject to the 48 hour limit. However, to the extent that this group does roughly capture genuinely autonomous workers, the observed gradual decline in long-hours working suggests that amongst employees as a whole, some of the decline in long-hours working can be attributed to factors other than the introduction of the WTRs.
Chart 2.6: Patterns of usual weekly hours worked by number of employees (millions): Managers, Directors and senior officials
A third potential comparison group is the transport sector, as many workers in this sector were initially excluded from the 48-hour limit until a horizontal amendment in 20038. Amongst transport sector workers there was little change in the level of long-hours working between 1994 and 2002, but there was a decline of 30 per cent between 2002 and 2007. This makes an interesting comparison – whilst long-hours working fell after 1998 amongst employees as a whole, it didn’t fall significantly for transport workers until they were brought into scope of the regulations several years later.
8 The horizontal amendment extended the 48-hour limit to previously excluded non-mobile workers in road, sea, inland waterways and lake transport, to all workers in the railway and offshore sectors, and to all workers in aviation who were not covered by the Civil Aviation (Working Time) Regulations 2003. These cannot be directly identified in the LFS, however these workers are likely to make up a reasonable proportion of the SIC codes for ‘transport by land, pipeline’, ‘water transport’ or ‘air transport’. 30

Chart 2.7: Number of employees in the transport sector usually working over 48 hours per week
Long-hours workers as a proportion of workers
The proportion of employees usually working over 48 hours a week has also declined over time. 13 per cent of all employees worked over 48 hours a week in 2013, compared to 18 per cent in 1997. This decline is not just due to the increase in part-time working over this period. Looking at full-time employees only, 18 per cent of all full-time employees worked over 48 hours a week in 2013, compared to 23 per cent in 1997. The declining proportion of long-hours workers appears to have now levelled off, and in fact has been increasing in the last couple of years.
31

Chart 2.8: Proportion of employees doing over 48 usual hours (per cent)
Changes in the distribution of working hours
The general distribution of working hours in the UK illustrates the diverse range of working patterns that are negotiated between workers and firms in the UK due to the flexible regulatory framework of the UK labour market. There is some evidence of a 37 to 42 hour working week being the normal pattern of full-time working in the UK, but there is much less standardisation of contracts based on large-scale collective agreements that is more common in continental Europe.
Charting the overall distribution of weekly hours worked allows changes in the wider trend of working hours over time to be visualised. Taking a comparison between 1997, 2000 and 2013 illustrates some short-term and longer-term developments since the introduction of the WTRs.
32

Chart 2.9: Distribution of usual weekly hours worked, number of employees (millions)
This suggests there have been no major changes in the fundamental shape of the distribution of usual hours worked. There have been increases in participation in the labour market that have increased employment at levels between 16 and 30 hours, and there have been further increases around the pre-existing peak between 37 and 42 hours, and a general decline in long hours working.
The ‘crossover point’ at which there has been a decline rather than an increase in employment levels between 1997 and 2013 comes between the 40 to 42 hour band and the 43 to 45 hour band. Between 1997 and 2000 there was some increase in working hours between 43 and 48 although this was not unusual in the context of other increases in the distribution at this time and does not suggest strong evidence of firms responding to the 48-hour limit by reducing the hours of long-hours workers down to the maximum allowed.
To take into account of the impact of the recession, Chart 2.10 compares the distribution in 2013 to the distribution in 2007, with the 1997 distribution as a baseline. Again the fundamental shape of the distribution has not changed, although the decline in incidence of working hours just below the 48 hour margin does not become apparent until after 2007. The 2007 distribution shows a slightly higher peak at 37 to 39 hours, and it appears that post-recession changes in working patterns have been increases at the lower end
33

of the distribution (between 16 and 30 hours) and decreases at the upper end of the distribution (over 44 hours).
Chart 2.10: Distribution of usual weekly hours worked, number of employees (millions) [part distribution shown]
Impact on wages
This paper focuses on the impacts of the Working Time regulations on employment and hours, and does not examine wage impacts in detail. The introduction of a weekly hourly limit on working time could have affected wages – if for example long hours working was reduced with no offsetting impact on productivity. Analysis of the impact of the Working Time Regulations on wages is complicated by the introduction of the National Minimum Wage in April 1999, shortly after the Working Time Regulations were introduced – this makes it hard to distinguish the impacts of the Working Time regulations from any minimum wage effects. The best source of data on wages is the ONS’ Annual Survey of Hours and Earnings, which replaced the New Earnings Survey in 2004. Further work could make use of a combined dataset joining the New Earnings Survey and ASHE from 1997 – 2013 to consider wage impacts in more depth9.
Chart 2.11 shows average weekly earnings growth over the last two decades, with the points at which the WTRs were implemented, and the national minimum wage introduced. From this descriptive presentation alone, no clear conclusions can be drawn (Chart 2.11 below).
Chart 2.11: Average weekly earnings growth, 1994 – 2014
9 http://discover.ukdataservice.ac.uk/catalogue?sn=6689 34

35

3. The opt-out and the individual Key points
• This chapter sets out the policy history in the area of working time regulation, explores the rationale for regulation in this area, considers the range of potential economic impacts that can arise from restricting working time, and briefly presents some of the existing literature in this area.
• The vast majority of long-hours workers would not like to work fewer than 48 hours per week if it meant less pay. There appears to be broad based support for the opt-out amongst UK business, long-hours workers, and the wider public.
• Use of the opt-out is reasonably widespread across UK businesses – roughly one third of workplaces have at least one employee opted out, whilst in 15% of workplaces all employees have opted out.
• Retaining the opt-out is very important both to UK business and to UK employees. The evidence suggests that taking away the ability to opt-out would be harmful both to business and to the welfare of workers who currently opt-out.
• Long-hours working is generally more prevalent in high income and highly skilled occupations compared to lower income and medium and low-skilled occupations. It is more prevalent amongst males, people with management positions, and in certain sectors.
• Most people that work long hours do so for short periods of time, perhaps indicating that employees do exercise choice over whether they work long hours.
The availability of the opt-out in the UK means that the decision to be a long-hours worker should rest with the individual. Employers cannot coerce individuals to work over 48 hours per week, but individuals can choose to opt-out and work longer than 48 hours per week. In this chapter we examine the use of the opt-out and the extent to which employers and employees who wish to work long-hours have been able to do so.
36

The desire to work long-hours
The LFS asks respondents whether they would prefer to work fewer hours. In 2013, 58 per cent of employees that usually worked more than 48 hours per week said they would prefer to work fewer hours, compared to 34 per cent of those that worked 48 or fewer hours. However, as the likely consequence of a reduction in working hours for most employees is a reduction in pay, a more useful measure of satisfaction with working hours is the response to a question qualified by whether the respondent would prefer to work fewer hours for less pay. In 2013, 17 per cent of employees that worked more than 48 hours said they would prefer to work fewer hours if it meant less pay, compared to 9 per cent of those that worked 48 or fewer hours.
A further question in the LFS asks those who would prefer to work fewer hours if it meant less pay to state the number of fewer hours they would like to work. This means it is possible to calculate the number of long-hours workers who would rather not work long-hours, even if meant less pay. By this measure, 13 per cent of those working over 48 hours would prefer to do 48 or fewer hours if it meant less pay. This proportion has stayed fairly constant between 2001 and 2013, suggesting that a large majority of those working over 48 hours do so by choice.
Chart 3.1: Proportion of employees usually working over 48 hours that would prefer to work 48 or fewer hours for less pay (per cent)
There is also some case study evidence that suggests long-hours workers are largely happy to work beyond the 48-hour restriction. A survey of workers’ experiences of the Working Time Regulations carried out in 2001 found that 58 per cent of long-hours workers would be happy if their employer limited them to no more than 48 hours a week. However, of this group only 20 per cent would remain happy if it meant a loss of earnings. Non-managers were more likely to say they would be unhappy with a 48-hour restriction because 37

they would get less money whilst managers were more likely to be unhappy because they would not get their work done (BMRB), 2004). Other case study evidence published in 2003 suggested that manual workers working long hours who were able to significantly boost their pay through long-hours working were not only satisfied by their hours but were also resistant to attempts to reduce working hours (Kodz et al., 2003).
Reasons for working long hours Literature around the motivations or benefits of long-hours working suggests that individuals that work longer hours can benefit from better career prospects as well as pay. Booth and Francesconi (1997) used the British Household Panel Survey to find evidence that those who worked an additional five hours a week of overtime significantly increased their chances of promotion. Scase et al. (1998) suggest long-hours workers have access to higher pay and higher earning jobs. Using the Labour Force Survey, Bell and Hart (1998) found that controlling for unpaid overtime significantly reduces the estimates for returns to higher education. Steptoe et al. (1998) suggest that a reduction in paid working hours could cause psychological distress through reduced income.
The Work-Life Balance Employee survey series asks questions regarding motivation for working overtime.10 According to the most recent Work-Life Balance Employee survey, 71 per cent of employees working overtime cited reasons related to workload demands: either meeting deadlines or finishing work off, feeling it was the nature of the role, having too much work to do or responding to staff shortages. 21 per cent cited personal reasons: mostly the opportunity to earn more money. 5 per cent worked over time due to the organisational culture: because it was the nature of the business they worked for, because the employer expected it or because their colleagues worked overtime. Unpaid overtime is more common amongst workers with higher incomes, managerial and professional staff and public sector workers. Workload demands are the most commonly cited reason for unpaid overtime (Fourth Work-Life Balance Employee Survey, 2011).
10 Although overtime working is not exactly the same as long-hours working, around 70 per cent of employees doing over 48 hours per week report that they sometimes do some overtime (either paid or unpaid) so the answers give some general insight in to the motivation to working additional hours.
38

The unused supply of long-hours workers There are also some workers that work 48 hours or fewer but would prefer to do more hours. These workers represent a potential unused supply of labour for firms that want long-hours workers. The number of such workers fell in the years immediately following 1998, but rose following the recession, suggesting there may be some cyclical element to the potential supply of unused long-hours workers.
Workers in this category may be disadvantaged in the labour market by the existence of the 48 hour limit. Although they would presumably be willing to
Box 3.1: Who are the long hours workers in the UK?
In 2012 around 13 per cent of employees in the UK usually worked over 48 hours per week (Annual Population Survey, January to December 2012). Men were more likely to work over 48 hours per week than women (19 per cent of male employees relative to 7 per cent of women). Women with a child aged under 5 were less likely to work long hours (4 per cent) although this was not true of men with a child under 5 (20 per cent). By age, workers in their forties were most likely to work over 48 hours (15 per cent).
Long hours working is more prevalent amongst highly skilled and highly paid workers. This is part of a wider trend in developed economies, confirmed by recent research from Oxford University (Gershuny and Fisher, 2014). Using an international dataset, the researchers show that working hours amongst the best educated and best paid workers are now longer than for the lower-skilled and lower paid, a reverse of the scenario up to the 1960s and 1970s.
Labour Force Survey data shows that long hours working was more likely to be found amongst managers, directors and senior officials (30 per cent) or those in professional occupations (19 per cent). There was considerable variation by industry sector, with mining and quarrying (36 per cent), agriculture, forestry and fishing (25 per cent), construction (21 per cent) and transport and storage (20 per cent) the industry groupings with the highest prevalence of long hours working.
Many workers that work long hours do so on a temporary rather than prolonged basis. Figures from the longitudinal Labour Force Survey suggest that around half of those working over 48 hours do so for a consecutive period less than one year and close to a third do so for a period less than three months.
Therefore, working long hours is not a permanent feature of working life for a large proportion of long hours workers. The reality is much more dynamic - workers appear to move in and out of long-hours working with a relatively high rate of turnover. This further suggests that workers enjoy a significant degree of choice over whether or not they want to work long hours.
See Annex 1 for a full profile of long-hours workers in the UK.
39

opt-out, they may be unable to find employers that have a structure set up to facilitate an opt-out, or employers may be unwilling to rely on workers opting out due to the uncertainty of employees subsequently revoking their opt-out.
However Chart 3.2 shows that the number of workers in this category fell significantly after 1998 and remained low for several years, increasing again after 2006. This suggests that the WTRs did not lead to an increase in the pool of workers who wanted to work long-hours but found themselves unable to do so.
Chart 3.2: Number of employees that usually work 48 or fewer hours that would prefer to work more than 48 hours for more pay
The opt-out and other derogations
Evidence on take-up of the opt-out varies – there is no authoritative data source that tracks use of the opt-out by employees. The latest Workplace Employment Relations Survey (WERS) provides the best source of data on use of the opt-out at the workplace level and suggests that in 2011, roughly one third (32 per cent) of British workplaces had at least one employee who had signed an opt-out agreement. In 21 per cent of workplaces, all managers had agreed to opt-out11, whilst at 15 per cent of workplaces in the UK, all employees were opted out. 12 per cent of all UK employees were located in a workplace where all employees were opted out.
11 Managers may be exempt from the 48-hour limit anyway due to the derogation for managing executives or other persons with autonomous decision-taking powers. 40

Chart 3.3: Take up of the opt-out by managers and non-managers across workplaces
Source: Workplace Employment Relations Survey, 2011
WERS also has data on the use of the opt-out by sector. Opt-out agreements were found to be more prevalent in private than public sector workplaces, with 34 per cent of private sector workplaces having at least one employee opted out compared to 15 per cent of public sector workplaces. The sector most likely to report opt-out agreements (40 per cent) was “other business services”, which includes non-financial professional occupations such as lawyers. Average working hours were found to be longer in workplaces that use opt-out agreements: where all employees had signed an opt-out, full-time employees were working an average of 43 hours per week, compared to 39 hours where no employees were opted out (Workplace Employment Relations Survey, 2011).
Other evidence on take-up of the opt-out from the Work-Life Balance employer survey series suggests lower levels of take-up, but does show a slight increase over time. In 2013, 8 per cent of workplaces reported having some managerial staff opted-out and 5 per cent had non-managerial staff opted-out. In 2007, 6 per cent of workplaces were found to have managerial staff that had opted out of the regulations and only 5 per cent were found to have non-managerial staff opting out (Third Work-Life Balance Employer Survey, 2007). The hotel and restaurant industry (managers at 17 per cent and non-managers at 13 per cent) or agriculture, mining and fisheries (managers at 14 per cent and non-managers at 30 per cent) were most likely to have reported use of the opt-out (Second Work-Life Balance Employer Survey, 2003). In 2002, only 6 per cent of workplaces had managerial staff opted-out and 7 per cent had non-managerial staff opted out, with workplaces
41

in the hotel and restaurant industry (managers at 19 per cent and non-managers at 13 per cent) or agriculture, mining and fisheries (managers at 17 per cent and non-managers at 16 per cent) most likely to have reported use of the opt-out (Second Work-Life Balance Employer Survey, 2003).
A question about whether long-hours workers had signed the opt-out was included in the Second Work-Life Balance employee survey in 2004. It found that around 19 per cent of employees worked or were contracted to work more than 48 hours per week, and of these 27 per cent had signed the opt-out, 70 per cent had not signed the opt-out and 3 per cent did not know. Managers and professionals, the occupation type most likely to work long-hours, were the least likely to have signed an opt-out, but many of these may have been covered by the managerial derogation (Second Work-Life Balance Employee Survey, 2004). There are several reasons why individuals working more than 48 hours may not report having signed an opt-out – they may be covered by one of the derogations or, as the data is self-reported, they may have signed the opt-out (perhaps at the start of their employment) and subsequently forgotten about it.
Other evidence from surveys and case studies also suggest fairly widespread usage of the opt-out and that employees often opt-out even when they do not routinely work long hours. The Business Context to Long Hours Working survey in 2002 indicated that 19 per cent of the workforce or 3.8 million employees had signed an opt-out and estimated that the proportion signing the opt-out was five times the number who worked sustained long hours (Hogarth et al., 2003). A 2004 Chartered Institute of Personnel and Development (CIPD) survey found that 22 per cent of workers that worked more than 48 hours per week had signed an opt-out.
The 2006 CBI Employment Trends Survey reported around 30 per cent of workers signing the opt-out, a higher proportion than the number actually working over 48 hours a week. The sectors with the highest proportion opted-out were construction (45 per cent), transport and communication (43 per cent), and manufacturing (39 per cent). In the 2009 CBI Employment Trends Survey, 27 per cent of respondents stated that 75 per cent or more of their employees had opted out, but only 7 per cent of respondents said their employees regularly worked more than 48 hours per week. A 2009 EEF Employment Survey of firms in the manufacturing sector found that two-thirds of employers have at least some workers opted-out and 38 per cent had more than half their workforce opted out. In 2003 the British Hospitality Association found that 15 per cent of workers in the hospitality sector used the opt-out, with the proportion rising to 60 per cent for long-hours workers12.
According to the TUC in 2010, around two thirds of long-hours workers have signed the individual opt-out, but an estimated additional 2 million workers that do not work more than 48 hours per week have signed the opt-out as a precautionary measure13. A DTI research note in 2002 estimated that
12 Evidence cited in Deloitte (2010) 13 Evidence cited in Deloitte (2010) 42

approximately 3 million people would be affected by the removal of the individual opt-out; Deloitte (2010) believed that this estimate may ‘remain broadly accurate’ in 2010 because although long-hours working had declined, there was a tendency from larger employers to ask employees to sign individual opt-outs on a ‘just in case’ basis.
A 2001 DTI evaluation based on a non-random sample of 20 employers, selected to reflect a variety of different types of organisations, found that the individual opt-out was the most common response to the need to provide for long-hours working. The Warwick Pay and Working Time Survey based on a sample of around 300 employers in the printing, engineering, health and retail sectors found that almost two-thirds of engineering employers and around half of the sample in each of the other three sectors made use of individual opt-outs14. A case study of 40 interviews in the education, health, manufacturing and engineering, financial and legal services; and hotel and catering sectors found “extensive but varied” use of individual opt-outs (Barnard et al., 2004).
Compulsion to opt-out There have been claims that in some cases employees are pressurised in to signing the opt-out, which is not permitted under the WTD. The TUC evidence to the House of Lords European Union (EU) Committee in 2004 suggested that approximately a quarter of long-hours workers faced some kind of compulsion to sign the opt-out, although the evidence was based on ‘some quite limited polling’ (House of Lords EU Committee, 2004). There were also some situations of employers pressuring individuals to opt-out cited in a Cambridge University case study research of 13 organisations for the European Commission (Barnard et al., 2002).
A survey of workers’ experiences of the Working Time Regulations in 2001 found that 23 per cent of long hours workers who had not signed an opt-out said they had experienced employer pressure to work longer, around half of whom thought it was understood as a condition of working at their workplace (BMRB, 2004). According to the 2004 CIPD survey, one in five (21 per cent) of those that had signed the opt-out felt a degree of employer compulsion, although this was based on a small sample.
Use of derogations Given the potential range of work that would be classified as having unmeasured working time or time not determined by the workers themselves it is impossible to accurately estimate the proportion of those working over 48 hours a week that are eligible for the derogations under Article 17.
According to the LFS, just under a third of employees classified as managers or senior officials usually worked over 48 hours per week in 2013. This accounts for around 725,000 of the 3.35 million total long-hours workers, around 22 per cent. This suggests that a substantial group of the long-hours workers in the UK would be covered by the managerial derogation regardless
14 Evidence cited in Neathey and Arrowsmith (2001) 43

of whether they exercise a formal opt-out. However, it is clear that employers value the certainty that having a signed opt-out agreement brings, given that it is not clear exactly which workers qualify for the managerial derogations.
Importance of the opt-out to the UK
Although the evidence on the extent of use of the opt-out differs, with the Work- Life Balance surveys consistently showing lower levels of usage than reported in the Workplace Employment Relations survey and other surveys or case studies, the evidence is clear that many UK businesses use the opt-out.
A strict limit on working in excess of 48 hours a week would affect 3.35 million employees and place significant costs on UK business. To some extent this may be mitigated by increased use of the derogations for unmeasured working time, particularly in the case of managerial staff. A CBR Research programme working paper in 2004 concluded that the other derogations in the Directive would to some degree duplicate the effect of the individual opt-out if removed: “the fate of the opt-out may not warrant the hopes and fears that have been invested in it” (Barnard et al., 2004), although research by the same authors in 2002 concluded that it was by no means certain that these derogations would provide a satisfactory alternative in the UK to the opt-out (Barnard et al., 2002).
Business views of the opt-out The available evidence suggests strong business support for keeping the opt-out. In 2003 a CIPD survey stated 78 per cent of employers strongly supported keeping the individual opt-out while 80 per cent believed that without it their overall level of efficiency would suffer (House of Lords, 2004). A 2003 survey by the CBI said 60 per cent of employers believed the loss of the opt-out would have a serious impact on their business. More recently, the 2012 CBI/Harvey Nash Employment Trends survey found that 18 per cent of firms believed losing the opt-out would have a ‘severe impact’ (up from 10 per cent in response to the same question in the 2009 Employment Trends survey), with a further 28 per cent believing it would have ‘significant impact’ (up from 25 per cent in 2009).
Reasons cited by business for retaining the opt-out include; there being some jobs that require highly specialised skills that are in short supply, the need to respond to short-term demand increases that do not warrant additional recruitment costs or work processes in areas like construction and safety maintenance where once started, work had to be completed. There could also be employee relations difficulties resulting from denying overtime to current employees or from hiring staff to cope with peaks in demand and then making them redundant during a downturn (CBI evidence to House of Lords EU Committee, 2004 based on findings from CBI, 2003). There are also concerns that, in the long term, labour supply in the UK is relatively tight, as indicated
44

by rising employment of migrants and a greater proportion of workers staying on past retirement age15.
Certain sectors have particular concerns: within financial and legal services employers have argued that the volume of work and time of day it needs to be done means that long hours are needed, and as workers in these sectors are highly skilled and qualified they could find alternative employment opportunities if they wished to work shorter hours (Barnard et al., 2002). Within the public sector, there are concerns that removing the opt-out would affect ability to meet the demands of 24/7 public service provision, particularly in rural areas where removing resourcing flexibility may lead to gaps in provision (Deloitte, 2010).
Respondents to the Barnard et al. (2004) case study claimed that the option to use opt-outs for individual workers rather than rely on collective agreements created an element of flexibility that was important for the UK where industrial relations typically do not have the same mechanisms of employee representation to implement continental European models of agreeing working time reductions. CBI evidence to a House of Lords EU committee in 2004 made the same point: other EU states have a greater ability to use collective agreements for sectoral exclusion to secure flexibility than is possible in the UK.
Employee views of the opt-out Removing the opt-out may also face opposition from employees. As shown above, the majority of employees that currently work long-hours would not wish to reduce their hours to 48 or fewer if it meant less opportunity to earn income. The 2004 CIPD survey found that 55 per cent of workers that worked over 48 hours per week thought the opt-out should not be removed, 35 per cent thought it should be removed and 10 per cent did not know. A YouGov poll of 1858 people in 2013 found that 66 per cent thought that workers should be able to opt-out, 25 per cent thought they should not and 10 per cent did not know (YouGov, 2013).
However there has been opposition to the opt-out from trade unions. TUC evidence to the House of Lords EU committee in 2004 claimed there was “no real evidence” that long-hours working had given the UK any competitive advantage, and suggested the removal of the opt-out would give British employers and managers an incentive to achieve functional flexibility through changes in work organisation, the introduction of new technology and better management techniques rather than using overtime as the easy way out (House of Lords EU Committee, 2004).
15 This was a view given by the Department of Business, Innovation and Skills in Deloitte (2010) 45

4. The impact of changes to paid leave entitlements Key points
• In the UK, paid annual leave entitlements have become more generous since 1998, with a rising proportion of the full-time workforce receiving annual leave entitlements which are well above the minimum bounds of the regulations. Indeed, current UK domestic law sets minimum paid annual leave over and above the WTD minimum.
• Therefore the introduction of the minimum annual leave provisions in the WTD may have contributed to the environment in which annual leave provision increased but it seems unlikely that the regulations are solely responsible for the increases.
Article 7 of the WTD states that every worker is entitled to at least four weeks of paid leave per year. This minimum cannot be replaced by an allowance in lieu apart from where the employment relationship is terminated, and it applies to all workers. The derogations for managerial or autonomous workers or workers from specific sectors that apply to other aspects of the regulations do not apply to paid leave.
In the United Kingdom, the Working Time (Amendment) Regulations 2007 increased the minimum annual leave entitlement from 4 weeks to 5.6 weeks. This increase was implemented in two stages: from 1 October 2007 paid leave entitlement in the UK rose to 4.8 weeks and from 1 April 2009 it rose to 5.6 weeks. These changes represented an increase of eight days for full-time workers, equivalent to the eight days’ public holiday in England and Wales16. The WTD placed no requirement for workers to receive extra leave for national public holidays in addition to the four weeks minimum entitlement, so the extra entitlement under UK domestic law meant that workers effectively received twenty days plus bank holidays whereas before they would have only needed to be given twelve days leave if their employer was granting them time off for public holidays.
Paid leave entitlements before and after the Working Time Regulations
The LFS allows for changes in paid leave entitlements over time to be measured by asking respondents the number of days paid holiday they receive in a year excluding public holidays. It does not allow easy identification of whether or not individuals receive paid leave entitlement for
16 There are nine public holidays in Scotland and ten in Northern Ireland. For simplicity however this analysis will take eight as the number of public holidays usually available to employees in the UK. 46
public holiday: whilst it asks whether individuals have worked on public holidays in the last year and been paid for doing so, it does not allow identification of individuals that get leave in lieu for working public holidays. There are therefore some limitations with the LFS data in this area. Moreover, the data is based on self-reporting and respondents may provide the number of days leave that they actually take, rather than their entitlement. However, an employer’s compliance with the regulations is based on providing an entitlement to employees; there is no requirement to ensure that the entitlement is used.
The analysis in this section focuses on two groups of employees – firstly those who report entitlement to fewer than 12 days (who may not be taking a minimum of 20 days leave even if they get time off for public holidays) and secondly those who report entitlement to fewer than 20 days (who may not be receiving the WTD minimums if they do not receive time off for public holidays).
In 1998, 671,000 full-time employees said they had fewer than 12 days annual leave, this represented around 6 per cent of all full-time employees. Around 15 per cent had fewer than 20 days annual leave. 48 per cent of full-time employees had 24 or more days annual leave17.
The following two charts illustrate the changes in paid leave entitlements (excluding public holidays) over time by showing frequencies by banded annual leave entitlement levels. For ease of visualisation only every third year is shown. The first chart illustrates leave entitlements by absolute number of employees; the second chart illustrates leave entitlements by proportion of employees.
17 These proportions are given as proportions out of the overall number of full-time employees including those that said they did not know, rather than the total excluding the “don’t knows”. 47

Chart 4.1: Days of annual paid leave excluding public holidays (number of full-time employees)
Chart 4.2: Days of annual paid leave excluding public holidays (proportion of full-time employees)
48

The data suggest that there was some effect of introducing a minimum entitlement of 20 days. The proportion of full-time employees receiving fewer than 12 days excluding public holidays fell from 6 per cent in 1998 to 3 per cent by 2001 and has remained at around that level since. The proportion of full-time employees receiving fewer than 20 days excluding public holidays fell from 15 per cent in 1998 to 9 per cent by 2001, 6 per cent by 2007 and has been around 5 per cent in recent years.
However there have also been significant increases further up the distribution. In particular, paid annual leave entitlements from between 28 and 31 days appear to have become much more prevalent, with the proportion of full-time employees in this category rising from 11 per cent in 1997 to 16 per cent by 2006, and further to 21 per cent by 2013. Whilst an effect following 2009 would have been expected due to the extra leave entitlements granted under the Working Time (Amendment) Regulations 2007, there already appears to have been an increase in the generosity of leave entitlements over and above that driven by minimum regulatory requirements in the years following the implementation of the WTD. The CBI (2013) recently outlined how the lack of domestic debate on this issue suggests that annual leave provisions would remain unchanged in the UK if the WTD was repealed.
49

5. The impact of other provisions Key points
• The WTD sets out entitlements to minimum daily and weekly rest breaks, as well as some additional entitlements for night workers. Before the regulations were introduced, it was thought that complying with these provisions would have a substantial impact on employers.
• However, BIS analysis of the LFS data suggests that these provisions have not altered patterns of working in the way anticipated. We venture that this is partly because there are a large range of derogations which give some flexibility to the sectors that are particularly likely to be affected by the regulations.
• There have been relatively few calls to government advisory helplines18 about issues relating to working time in the UK, suggesting that neither employers nor employees are encountering major difficulties with the core aspects of the regulations. However, there are several major issues with particular aspects of the Directive – these are explored in more detail in Chapter 7.
In addition to the 48 hour weekly working limit, and the annual leave requirements, the other provisions in the WTD include entitlements to minimum periods of rest that break up the working week and limit the length of an individual shift. Night workers are given additional entitlements. These are less well known aspects of the WTD and their impact is not as straightforward to measure as that for the overall weekly working hours or annual leave entitlements.
The provisions discussed in this section, relating to Articles 3, 5 and 8 of the WTD, have not led to large scale legal challenges from employees against their employers, and do not feature in the main concerns from business or trade unions about the provisions of the WTD. However the methodology used in the 1998 Regulatory Impact Assessment attributed a large proportion of the total anticipated cost of implementing the WTD to these aspects of the regulations.
18 For example, the Pay and Work Rights Helpline 50

Minimum daily and weekly rest periods
Aside from the maximum working week of 48 hours, the WTD specifies certain entitlements to rest periods that restrict the length of continuous working for any individual.
These are:
• The entitlement to a minimum rest period of 11 consecutive hours per 24-hour period (Article 3)
• The entitlement to rest breaks where the working day is longer than 6 hours (Article 4)
• The entitlement to a minimum uninterrupted rest period of 24 hours in any 7 day period19 in addition to the minimum 11 hours rest in every 24 hours (Article 5)
These entitlements do not apply to those covered by the unmeasured working time derogation. Some workers in a range of special circumstances may be excluded from the rest entitlements, as may shift workers. However, in these cases there is a requirement to make provisions for ‘compensatory rest’.
The entitlements to daily and weekly rest periods may be modified or excluded by collective or workforce agreement but again compensatory rest provision is required.
Case study evidence The Neathey and Arrowsmith (2001) case study found that eighteen months after implementation, most employers were providing the entitlements to daily and weekly rest periods. The study concluded that “it seemed that most organisations had in place formal provision to comply with the Regulations”, whilst also finding “a number of cases where operational pressures or employee concerns about loss of earnings meant that these provisions were not always applied in practice”.
Where companies’ existing rest provisions were not in line with the WTD minimum entitlements, it was mainly due to shift patterns or overtime working. In some cases, weekend overtime working meant some workers did not get the 24 hours rest in a week covered by Article 5. Some daily rest periods were shorter than 11 hours due to individuals changing shifts or doing weekday overtime. Some employers had used the flexibilities of collective/workforce agreements and/or one of the derogations to reduce the daily rest break requirement. However the study concluded that “employers seemed more inclined to implement the weekly rest provision in full and to use the Regulations to challenge seven-day-a-week working”.
19 Article 16 allows for weekly rest to be calculated by averaging over 14 days. 51

The BRMB (2004) survey of workers’ experience of the Working Time Regulations carried out two surveys in 2001, one based on a random sample of 420 people taken from the ‘general employed’ population and a second focusing on specific groups that were not receiving the full entitlements of the regulations.
In total, 15 per cent of the ‘general employed’ survey came under the category ‘without full rest breaks’. 3 per cent did not usually get one day off per week, 6 per cent of those working more than six hours per day said they did not receive 11 hours rest in every working day and 8 per cent did not receive at least one twenty-minute break. 79 per cent of those that worked without full rest breaks claimed they never received compensatory rest for this: 10 per cent sometimes did and 11 per cent always did.
12 per cent of those not receiving full rest breaks claimed they had felt some form of employer pressure to work without their full entitlements. 4 per cent of those working without full rest breaks believed they were covered by a collective agreement at their workplace regarding rest breaks and a further 2 per cent claimed to be covered by company-wide individual agreements.
Just over half of the workers that were not receiving full rest breaks were aware that there were regulations governing entitlements to rest breaks, although many claiming awareness could demonstrate only limited knowledge of the actual entitlements. However, 62 per cent of workers that did not have full rest breaks said they did not want more rest breaks.
Limitations of the Labour Force Survey evidence The DTI’s 1998 Regulatory Impact Assessment used the LFS to attempt to estimate the extent of working patterns in 1997 that would not be compliant with the daily and weekly rest break entitlements. The estimates were based on two measures: the number of employees usually working in excess of 78 hours per week and the number of employees usually working 78 or fewer hours that said they work on all seven days a week. 78 hours is the maximum possible working week compliant with Articles 3 and 5 even if an individual is opted-out of the 48-hour maximum working week. This measures the extent of extreme long-hours working that should be prohibited under the WTD.
The number of employees working on all seven days of the week was taken as a proxy to estimate the extent to which employees do not receive the 24 hours rest in seven days covered in Article 5. However, this was likely to overestimate the affected population, as it is possible to receive 24 hours per week rest whilst working every day, for instance in the case of a shift worker clocking off at 5pm one day and beginning the start of the next shift after 5pm the next day.
The LFS does not measure the extent to which individuals that are working fewer than 78 hours are not receiving their minimum entitlements. The 1998 Regulatory Impact Assessment used an estimate of the numbers that did not receive 11 hours rest in every 24 hours based on a 1990 National Opinion Polls survey for the Employment Department that recorded the number of
52

workers that worked 13 hours continuously on at least one day per week. However no more recent comparable survey data is available to update this estimate.
Working over 78 hours per week20
Before the WTD was implemented in the UK, just under 130,000 employees were usually working over 78 hours per week. This represented around 0.75 per cent of full-time employees - around 1 in 130 full-time employees in the UK.
Chart 5.1: Number and proportion of full-time employees usually working over 78 hours per week
Following the implementation of the WTD, the proportion dropped to around 0.60 per cent of full-time employees, or around 1 in 170. Prior to the recession this had fallen to around 0.40 per cent (around 1 in 250) but the incidence of extreme long-hours working rose again after 2009, reaching 0.51 per cent in 2013 (around 1 in 200).
20 The analysis in this section is based on a time series using the April to June quarters of the LFS. This was chosen to be roughly comparable with the 1998 Regulatory Impact Assessment (IA) which assessed the likely impact of the WTRs before they were introduced. The IA used the Spring 97 LFS data, although the time series here uses reweighted LFS data following census revisions, so the figures may differ slightly from those published in the 1998 IA.
53

These figures suggest that the introduction of the WTD did have an effect on reducing, although not eliminating, the incidence of extreme long-hours working. As was suggested in the Neathey and Arrowsmith (2001) and BRMB (2004) case studies, most employers are complying with the regulations but there is some evidence of individuals not receiving or choosing not to take their entitlements. It is important to emphasise that because of the various derogations available, the introduction of the regulations was not expected to eliminate all working above 78 hours per week.
A similar pattern holds when excluding employees in the SOC code for Managers and Senior Officials (of whom many could potentially be eligible to derogate under the provision for autonomous workers). There was a decline in the incidence of extreme long hours working following the implementation of the WTD, it rose following the recession but did not return to the levels seen before 1998.
Chart 5.2: Number and proportion of full-time employees usually working over 78 hours per week (excluding managers and senior officials)
Working seven days per week The 1998 Regulatory Impact Assessment used the number of employees reporting that they worked every day of the week as an indication of the potential extent of working without receiving the 24 hours rest in every 7 days covered in Article 5.
This is an imperfect proxy because it is possible for employers to ensure workers receive 24 hours rest even when working every day by organising the shifts so that a worker starts one shift during the seven days at least 24 hours 54

after finishing the previous day’s shift. Therefore this approach is likely to have overestimated the population affected by the introduction of the regulations. For a full-time worker this will typically involve switching from a day shift to a night shift. Part-time workers may be able to stay as day workers only: for instance a ‘morning shift’ of 9am to 1pm and an ‘afternoon shift’ of 1pm to 5pm would provide the 24 hours rest when a worker switched from a morning shift on one day to an afternoon shift the next.
It is not possible to directly observe the number of workers that are not receiving the 24 hour rest period in every 7 days from the responses to this question in the LFS. However it is reasonable to assume that the workers who usually work on all seven days and work long hours are more likely to be failing to receive the 24 hour rest period than those that work shorter hours.
In 1997, around 500,000 employees were usually working on all seven days of the week and working 78 hours or fewer21. This was approximately 2.28 per cent of the total number of employees. There was no indication of any change in the proportion of workers working all seven days a week as a result of the implementation of the WTD, instead the proportion remained fairly constant – albeit with a step increase in 2006 as a result of a change in LFS methodology. 22
Chart 5.3: Number and proportion of employees usually working 7 days a week
21 The 1998 Regulatory Impact Assessment excluded employees that were doing in excess of 78 hours per week to avoid double counting them when estimating the potential number of employees that would be affected by the regulations. This approach has been repeated here. 22 There is an apparent ‘step’ in the data in 2006. The question about number of days of the week usually worked is a historical quarterly specific question, and the discrepancy could be related to the switch of the LFS from seasonal to calendar quarters in 2006 meaning that historic calendar quarter estimates going back to 1997 are based on a smaller number of respondents. 55

When considering long-hours workers only, the data is more stable albeit with another apparent ‘step’ in 2006. 1.41 per cent of full-time employees were usually working over 48 hours per week and working on all seven days in 1997. This proportion appeared to fall slightly in the years following the implementation of the WTD, whilst still showing variability in the data, before rising after 2006.
Chart 5.4: Number and proportion of employees usually working 7 days a week and working over 48 hours a week
Again it is difficult to draw firm conclusions about what this data shows. Both before and after the implementation of the WTD there is a consistent core of over 200,000 employees usually working on all seven days a week and working over 48 hours a week. This suggests that a pattern of working that had originally been thought to be potentially affected by the entitlements to daily and weekly rest breaks has not been affected as much as had been anticipated. This could be because a large number of the affected employees fall under one or more of the available derogations, or because employers have been able to re-organise shift patterns to provide for seven-days-a-week working whilst meeting the entitlement to the 24 hours of rest. Alternatively, non-compliance cannot be ruled out.
56

Restrictions on night working
In addition to the requirements for daily and weekly rest periods detailed in Articles 3 and 5, the WTD requires extra entitlements for night workers:
Normal hours of work for night workers should not exceed an average of eight hours in any 24 hour period23 and night workers whose work involves special hazards or heavy physical or mental strain should not work more than eight hours in any period of 24 hours when they perform night work. (Article 8)
Night workers are entitled to a free health assessment before taking up their night-working assignment and at regular intervals, and workers identified as suffering from health problems related to the fact that they work at night should be transferred to day work wherever possible (Article 9).
Night time is defined in the WTD as any period of not less than seven hours, which must include the period between midnight and 5:00am. A night worker is defined as a worker whose working time includes at least three hours of night time:
• On most days they work, or
• On a proportion of the days they work which is specified in a collective or workforce agreement, or
• Often enough for it to be said that they work such hours as a ‘normal course’
Case study evidence The Neathey and Arrowsmith (2001) case study found that only a small number of organisations were exceeding the limits on night-working prior to the regulations being implemented, although half of the case study organisations had some night workers as defined by the regulations. It concluded that “the introduction of health assessments for night workers seemed to be the most significant element of this part of the Regulations for companies with night work”, although no evidence was found that the health assessments had resulted in workers being moved away from night work. The Neathey (2003) follow-up study found that by early 2003 all the organisations followed-up had an established system for conducting health assessments of new recruits to night-work posts, often as part of a general pre-employment screening process. Employers had “some concerns relating to the need for repeat assessments, but generally had seen little in terms of real impact, with “just two companies reporting one or two cases of staff being moved from or refused a night-work position as a result of screening”.
23 Article 16 allows for the usual reference period of seventeen weeks to be extended by collective agreement between two sides of industry at national or regional level. In the United Kingdom this can be up to 52 weeks. 57

In the BRMB (2004) survey, night workers made up 15 per cent of the ‘general employed’ sample, working an average of 8.2 hours per shift. They were disproportionately likely to be male and to suffer from an illness or disability. 55 per cent usually worked more than eight hours per shift. 35 per cent of night workers were aware of laws governing the number of hours people can work at night, compared to 24 per cent of the general employed although again actual knowledge of the regulations appeared quite limited.
The same BRMB survey found that night workers were more likely to be part of a trade union or staff association, and 39 per cent claimed to be governed by an agreement concerning their night work. 11 per cent said they had experienced employer pressure to work long hours at night. 48 per cent of night workers said they would prefer to work fewer hours at night, although only 39 per cent of this group would do so for less money (17 per cent of all night workers surveyed). 31 per cent of night workers had been offered a free health assessment by their employer, most of whom accepted (72 per cent). Regular health assessments had only been offered to 14 per cent of night workers. 9 per cent claimed they had had some form of health problem (including fatigue) associated with their night work.
The most striking finding from the case study evidence is the average of over 8 hours per shift reported in the BRMB study, with over 55 per cent claiming to usually work in excess of eight hours per shift. The survey for this study took place in 2001, indicating that three years following the implementation of the WTD in the UK there was some evidence that a large number of night workers were working shifts that were longer than those permitted under Article 8, unless a derogation applied.
Labour Force Survey evidence The 1998 Regulatory Impact Assessment estimated the number of employees that would be affected by the restriction on night-working shifts by taking the number of employees that claimed to be usually working at night, and working in excess of 48 hours per week. Assuming workers only do six shifts a week in order to receive the minimum 24 hours rest in every 7 days (an assumption that is not entirely accurate, as described above), working over 48 hours implies that these night workers are working average shifts in excess of eight hours.
This form of estimate does not capture all workers that could be working patterns in breach of the WTD. It does not account for workers that may come in to the category of facing special hazards or mental/physical strain, who restricted from working in excess of eight hours on any shift, and it does not account for workers that may work fewer than six night shifts a week but do more than eight hours in a single shift.
However this form of estimate also risks overestimating the number of workers that are working truly non-compliant patterns, due to the ambiguity over what people mean when they report that they are usually working ‘at night’ and how closely this matches the WTD definition of usually working at least three hours between midnight and 5am.
58

In 1997, around 250,000 employees (1.12 per cent of all employees) were usually working at night and working in excess of 48 hours per week. A difficulty in comparing responses to this question over time comes from a change in 1999 in the way the question was asked which meant the estimated number of people usually working at night was around double the previous estimate24. As a result there was a sudden increase to over 2 per cent of employees usually working at night and over 48 hours per week in 1999. Thereafter, the proportion has remained around 2 per cent.
Chart 5.5: Number and proportion of employees usually working at night and working over 48 hours per week
The variability in the data makes it difficult to draw any firm conclusions from the LFS about the impact of the night-working restrictions other than to suggest that the WTD does not appear to have impacted on the incidence of long-hours working amongst people that usually work at night.
Since 1999, the data presented on the charts above is based on an LFS question that asks respondents whether within their regular pattern of work it is usual for them to work during the day, during the evening or at night. The rather high numbers of employees shown above that usually worked at night and in excess of 48 hours per week include all those that said they usually worked at night regardless of whether they also said they usually worked in the day or in the evening. This could therefore be a large overestimate of the
24 This issue is discussed in the ‘Regulatory Impact Assessment for the Working Time (Amendment) Regulations 2002’ and ‘2003 Compendium of Regulatory Impact Assessments’ (Department for Trade and Industry Employment Relations Research Series No.28) 59

number of night workers affected by the WTRs as many of these long-hours workers could be working patterns that vary by shift rotation or spread over parts of the day, evening and night whilst not usually working at least three hours between midnight and 5 am.
Excluding those that usually work in the day reduces the overall number of long-hours workers that usually work at night by around 90 per cent, and gives an estimate of a group that are much more likely to be actual ‘night workers’ under the WTD who are working shifts in excess of 48 hours. Further excluding those that usually work evenings reduces the overall number even more, by around 95 per cent. In conclusion, whilst the LFS cannot be used to accurately identify the true number of employees that are usually working at night and working an average shift that is in excess of the limits stated in Article 8, it is likely to be closer to the number generated by excluding those long-hours workers that claim to usually work in the day as well as usually working at night.
Chart 5.6: Number of employees usually working at night and over 48 hours per week by whether or not they also usually work during the day or evening
This section has illustrated the difficulty in using survey data from the LFS to try to estimate the extent to which working patterns were affected by the requirements for daily and weekly rest breaks. It has also shown the difficulty in determining whether workers are in fact receiving the rest breaks they are entitled to given that there are various derogations which mean that the entitlement to the rest breaks is not absolute. Articles 3, 5 and 8 are covered by a wide range of sectoral derogations under Article 17 in addition to the derogation available for managers or autonomous workers. It is difficult to 60
accurately identify employees in potentially excluded sectors on the LFS as the exclusions do not directly match up to Standard Industry Classifications. The data above suggests that there are a small number of workers whose patterns of work are ostensibly incompatible with the Working Time Regulations, but some or all of these workers could be covered by a sectoral derogation.
Another difficulty is that the LFS is not a bespoke survey directly asking questions about whether workers are receiving WTD entitlements - estimates about the affected groups are inferred from answers to other survey questions. The assumptions and proxies involved introduces a significant margin of error.
It remains possible that the data shows a degree of non-compliance with the daily and weekly rest breaks and night working requirements. However, one way of estimating the degree of non-compliance or difficulty in compliance is to look at the extent to which employers or workers make use of advisory helpline services to enquire about working time issues.
The Pay and Work Rights Helpline offers help and advice to employers and workers on working rights. Since it was established in 2009, it has received an average of around 3300 calls per year relating to the Working Time Regulations. To put this in context, this is around one fifth of the volume of calls relating to the National Minimum Wage. Around 11 per cent of the calls were from employers, a similar proportion to calls received on other topics, suggesting that employers do not find the regulations more difficult to understand than they do other similar regulations. Most of the calls relating to the regulations concerned the 48 hour week and opt out (44 per cent), with 9 per cent concerning young workers, 3 per cent night workers and fewer than 8 per cent relating to complaints about the regulations – a lower proportion than that found for other regulations25. A similar pattern of results emerges from analysing calls to the Advisory, Conciliation and Arbitration Service (ACAS) helpline, with fewer than 2 per cent of calls related to working time issues26.
Another way of estimating the degree of compliance is by looking at data on employment tribunal claims relating to Working Time issues. A difficulty in interpreting this data is that the figures are distorted from 2005 onwards by repeated multiple claims from employees of one large firm who for legal reasons submit a new claim every three months.
Analysis of claims disposed (withdrawn, settled, dismissed or decided at hearing) reveals an increasing volume of claims related to working time: 3500 in 2000/01 (3 per cent of all disposed claims), 4000 in 2003/04 (3 per cent), 13000 in 2007/08 (8 per cent) and 23,500 in 2011/12 (10 per cent)27. Whilst this suggests an increasing level of legal activity related to working time
25 BIS Analysis of Management Information from the Pay and Work Rights Helpline. These figures relate to calls received by the helpline in 2012 26 ACAS helpline calls Q1 2010 to Q2 2013 27 Employment Tribunal Statistics, HM Courts and Tribunals Service 61

issues, it is driven heavily by one particular dispute, which makes it difficult to draw more general conclusions.
In general however, there have been relatively few calls to advisory helplines about issues relating to working time in the UK, suggesting that neither employers nor employees are encountering major difficulties with the core aspects of the regulations.
The survey data available to measure the effects of these Articles on working patterns is not comprehensive enough to draw firm conclusions regarding the impact of the regulations, however the data does suggest that working patterns have not changed in the way anticipated in the original Regulatory Impact Assessment. Therefore the overall costs of these aspects of the regulations are likely to be much lower than originally predicted.
62

6. The impact of legal rulings Key points
• Since the Working Time Directive was implemented in the UK there have been European Court judgments that have affected on-call work as well as aspects of annual leave.
• Although only around 17 per cent of employees do any on-call work, the Simap-Jaeger rulings have meant complexity and some confusion for employers and workers where on-call working is a common practice. This in turn has an impact on public services, particularly health.
• Rulings (Stringer-Pereda and others) around the accrual and carry-over of leave are complex and employers find them difficult to navigate
• There is the potential for more recent rulings on holiday pay to lead to increased employer costs in the future.
European Court of Justice (CJEU) rulings around the implementation of the Working Time Directive have had an impact in the UK. The most important of these are the SiMAP and Jaeger rulings relating to the classification of time spent ‘on-call’ as working time and the Stringer and Pereda rulings that relate to the right to compensatory paid leave when workers are sick during periods of paid leave, and accrual of annual leave during periods of maternity/paternity leave.
Implications of the SiMAP-Jaeger Rulings – On-call Working
Regular on-call work is uncommon amongst UK employees and the on-call hours that are worked are concentrated amongst a small minority of workers. The SiMAP (2000) and Jaeger (2003) cases established the principle that time spent on-call at the workplace counts as working time and compensatory rest periods must be taken immediately after the end of the working period to which it relates.
Data relating to on-call working is only available for recent time periods. The Fourth Work Life Balance Employee survey reported that in 2011, 17 per cent of employees were required to work on call in their current job. There is a lot of variation in terms of the amount of time spent on call. 22 per cent of employees who do some on-call work spent less than five hours per calendar month on call, whilst 17 per cent spent more than one hundred hours on call. Employees that spent all of their on-call time at the workplace averaged 22 hours per month whilst those that split their time between the workplace and another location averaged 68 hours per month.
63

A large proportion of the time reported as being on-call is not spent working. Around 48 per cent said they spent all their time on-call actually working, averaging 18 hours per month, but for the remaining 52 per cent only a proportion of on-call time was spent working: averaging 10 hours working out of a total of 40 on-call hours per month.
There have been concerns in the UK about the impact of the Directive in general, and these rulings in particular, on the National Health Service (NHS). The UK Department of Health recently commissioned a Taskforce, chaired by the Royal College of Surgeons, to look at the implementation of the Working Time Directive and its impact on the NHS and Doctors28. A number of interested groups submitted evidence on the impact – especially representative bodies for the various medical specialisms.
Evidence suggests that impacts can include higher staff costs, difficulties for junior doctors in training (a subject that was also explored in detail in a 2010 report by Professor Sir John Temple) and concerns about continuity of patient care.
Following the SiMAP and Jaeger judgments there was a move from on-call rota systems to shift systems. This meant that nights were increasingly covered by shifts rather than Doctors on-call. However, where for example consultants are still on-call, their requirement for immediate compensatory rest can lead to short notice cancellation of elective procedures and outpatient appointments.
In the UK fire service, these rulings mean the service is quite restricted in how it responds to changes in fire and rescue trends. For example, the number of house fires in the UK has fallen markedly, reducing overall demand for firefighters. However, to comply with on-call time and compensatory rest rulings ultimately means higher staff costs and reduced flexibility in running the fire service.
A number of other sectors, whilst involving small overall numbers of employees, also rely heavily on on-call working. Examples include security services, IT support and tourism industries. Common complaints are around complexity, for example around what exactly constitutes work time, what exactly constitutes rest time.
Implications of the Stringer-Pereda (and other) rulings at the Court of Justice of the EU – Annual Leave
The Stringer and Pereda and subsequent rulings on annual leave and sickness have caused concern to UK employers. The Stringer and Pereda rulings established principles that workers continue to accrue annual leave during periods of sickness absence, and are entitled to carry over annual
28 http://www.rcseng.ac.uk/policy/documents/wtd-taskforce-report-2014 64
leave that coincides with a period of sickness, to a time when they are not sick.
Business organisations in the UK are now quite vocal about the difficulties of the rulings. The Confederation of British Industry have raised concerns that the implications of the rulings could leave firms open to abuse by workers (CBI, 2010). Whilst more recently, the EU Business Taskforce report, 2013 (commissioned by the Prime Minister David Cameron) heard more complaints about these rulings, leading it to make recommendations in this area. Among the concerns are the ability of workers to abuse their right to reschedule annual leave when they fall sick on annual leave, and covering additional absence from work.
As these rulings are relatively recent, the precise impact on the UK labour market is so far unclear, but it is likely that they impose costs on employers in excess of £100 million per year, mostly related to additional absences from work. Correspondingly, that money will be going to workers.
Implications of CJEU Rulings on Holiday Pay (Williams v BA and Lock v British Gas) at the Court of Justice of the EU
It is possible that recent EU court judgments may have further impact on UK employers and workers. In Lock v British Gas the CJEU has recently ruled that commission payments will need to be captured in holiday pay, which has since been referred back to the Employment Tribunal by the CJEU, with a preliminary hearing scheduled for February 2015, so it is not yet clear what the impacts will be. Similarly, the initial judgement on a number of cases in the UK Employment Appeal Tribunal (Lead case: Fulton v Bear Scotland) about the inclusion of non-guaranteed overtime in holiday pay has been handed down. The judgment stipulated that non-guaranteed overtime should be included and consequently there is potential for a significant increase in costs for some employers both on an on-going basis and with backdated liabilities.
65

7. Workplace Health and Safety in the UK Key points
• The Working Time Directive was introduced with the stated aim of protecting workers’ health and safety.
• Prior to the introduction of the Working Time Regulations, the UK had an excellent workplace health and safety record – and workplace health and safety has improved further in recent decades.
• The UK has one of the best health and safety records in Europe – whether measured by workplace fatalities, or by broader measures such as whether employees generally feel that their health is at risk because of their work, or are satisfied with their job.
• It is difficult to assess whether there is any link between the regulation of working time and workplace health and safety in the UK.
The Working Time Directive was brought in under a health and safety legal base, although this was contested by the UK at the time (HMG, 2014). As such, a review of the impact of the Working Time Directive would not be complete without an assessment of how it has affected health and safety outcomes in UK workplaces.
The available data suggests that the UK has an excellent workplace health and safety record, which has been improving consistently over time. As Chart 7.1 shows, official statistics from the Health and Safety Executive demonstrate that the number and rate of workplace injuries has been broadly declining over the last twenty years. Given the long-term steady decline in workplace fatalities, it seems unlikely that this can be attributed to the impact of the introduction of the WTRs in 1998, although an effect cannot be ruled out. It seems more likely that the decline can be attributed to increased awareness of health and safety at work, as well as changes in the composition of the labour market, with fewer workers exposed to physical risks.
66

Chart 7.1: Number and rate of fatal injuries to workers in the UK since 1994/95
Source: Statistics on fatal injuries in the workplace in Great Britain29 2014, Health and Safety Executive
Comparing the UK’s health and safety record against that of other European member states, Eurostat figures show that the UK has one of the lowest fatality rates in the EU, with a fatality rate less than half that in France and Spain, for example.
Chart 7.2: Standardised incidence rates (per 100,000 workers) of fatal accidents at work for 2011
Source: Statistics on fatal injuries in the workplace in Great Britain 2014, Health and Safety Executive, using Eurostat data.
Of course, workplace fatalities are a somewhat narrow metric for workplace health and safety. On broader measures the UK also comes out well – for example Chart 7.3 presents data from the European Working Conditions Survey which demonstrates that UK workers are on average exposed to fewer physical risks than in most other EU countries30. The EWCS data also shows
29 These statistics do not include workplace fatalities in Northern Ireland. 30 The country comparison of risk exposure in the figure shows the scores for each country on separate indices measuring exposure to posture-related, biological and chemical, and ambient risks. The EU27 67

that over the last ten years, exposure to physical risk has decreased in the UK (Eurofound, 2012a).
Chart 7.3: Exposure to combined physical risks, by country
Source: European Working Conditions Survey, 2012a
Whilst the above figures show that in terms of workplace health and safety outcomes, the UK is one of the best in Europe, there are other measures that perhaps indicate how the UK achieves such a good workplace safety record. Chart 7.4 shows that, amongst European countries, the UK has the highest percentage of establishments with a documented policy, system or action plan on Health and Safety.
average has been set to 100. Countries showing relatively low levels of risk exposure are the Netherlands, Denmark, the United Kingdom, and Ireland.
68

Chart 7.4: Proportion of establishments with a documented policy, system or action plan on health and safety, 2009
Source: European Survey of New and Emerging Risks (ESENER), 2009
In addition, more UK employees feel that they are well informed about the health and safety risks at work compared to most other EU member states (EWCS, 2010)31, and the UK has shown the biggest improvement on this measure in the last fifteen years.
Chart 7.5: Proportion of employees who feel they are well informed about health and safety risks at work, 2010
Source: European Working Conditions Survey, 2010. * Data only available since 2000 for some countries.
31 http://www.eurofound.europa.eu/surveys/smt/ewcs/ewcs2010_07_02.htm
0%10%20%30%40%50%60%70%80%90%
100%
-10.0%
-7.5%
-5.0%
-2.5%
0.0%
2.5%
5.0%
7.5%
10.0%
60.0%
65.0%
70.0%
75.0%
80.0%
85.0%
90.0%
95.0%
100.0%
IE LV SK PL CZ DE RO ES SE SI PT LU BE IT FR
Proportion of employees who are very well informed about the health and safety risks atwork, 2010 (LHS)
Change since 1995/2000* (RHS)
69

Chart 7.6: Proportion of workers answering 'Yes' to the question 'Do you feel your health or safety is at risk because of your work?'
Source: European Working Conditions Survey, 2010
Chart 7.7 presents further data from the EWCS 2010, which shows that job satisfaction in the UK is high – in the EU the UK is second only to Denmark in terms of the proportion of employees who are very satisfied or satisfied with their job.
Chart 7.7: Job satisfaction by country across the EU
Source: European Working Conditions Survey, 2010
0%5%
10%15%20%25%30%35%40%45%50%
70

8. Conclusions This paper has presented a comprehensive analysis of the available data and the existing literature on the impacts of the Working Time Regulations in the UK. There are limitations in all of the data sources we have reviewed - these mean the conclusions which follow are made tentatively.
Since the introduction of the Working Time regulations, there has been a reduction in the proportion of workers in the UK working long hours. Whilst this is part of a wider trend towards reduced working hours, it is likely that the introduction of the Working Time Regulations has had some effect on reducing long-hours working in the UK. Comparison with a group that was not covered by the regulations (the self-employed) and a group for whom the regulations were implemented later (transport workers) provides some more tentative evidence to suggest the 48-hour limit did have an effect on reducing the extent of long-hours working.
There is little evidence of any increase in the incidence of working hourly patterns just below the 48-hour limit, suggesting the regulations did not lead to large numbers of workers’ hours being capped at 48 hours - either because use of the opt-out was widespread amongst long hours workers, or employers found other ways to adjust. Our descriptive analysis of the data, as well as econometric analysis suggests that one of the main channels through which the Regulations had an impact was on the composition of employment. It appears that the decrease in long hours working was at least partly offset by increased employment of workers doing shorter working weeks. However, it is difficult to say how much of the increase in employment below 48 hours after the introduction of the WTD can be attributed to this effect. The econometric analysis that we have carried out is consistent with our descriptive analysis – we find a positive and significant effect of the Working Time regulations on employment, but do not find any association with total hours worked.
In the longer term there may have been a structural adjustment in the economy away from types of work that rely on long-hours working and investment in extra capital to substitute for long hours of labour. However it is difficult to say the extent to which this has now occurred.
Retaining the opt-out is very important both to UK business and to UK employees. The evidence suggests that taking away the ability to opt-out would be harmful both to business and to the welfare of workers who currently opt-out. Surveys of businesses have repeatedly shown that firms have concerns over the potential negative impacts of losing the individual opt-out, although there is some support for removing the opt-out amongst trade unions.
Most long-hours working reflects the preference of the individual worker. In 2013 only 13 per cent of those usually working over 48 hours per week would prefer to work 48 hours or fewer if it meant reducing their pay. 71

This proportion has stayed fairly constant over time. Increasingly, long hours working is carried out by high income occupations such as managers and professionals and becoming less prevalent in lower income occupations.
Long hours working is not necessarily a permanent career choice. Many people that work long hours do so for short periods of time, perhaps indicating that employees do exercise choice over whether they work long hours.
The concept of ‘working time’ is different now compared to the 1990s. Technological changes since the 1990s mean that in many occupations, ways of working have evolved significantly since the Working Time Directive was negotiated. Increasingly UK employers offer remote working arrangements which allow employees to work all or some part of their working time from home. In addition, the increasing availability of mobile internet means many employees work on public transport during commutes to work or meetings. Flexible working patterns mean that the traditional concept of a continuous working day does not apply to many workers – employees increasingly fit work around their private commitments. These developments give employees more control over their own working time patterns and enable them to use their time more efficiently. However, it does mean the concept of ‘working time’ has changed.
Paid annual leave entitlements have become more generous since 1998. Following the implementation of the Working Time Directive in the UK, there was a sharp reduction in the reported number of full-time employees with low paid annual leave entitlements (19 days or fewer including public holidays). However especially in the period after 2004, there was a shift towards higher annual leave entitlements higher up the distribution, with fewer full-time employees reporting annual leave entitlements just above the 20 day minimum required by the Working Time Directive, and an increasing proportion receiving annual leave of 28 days or more. This can partly be explained by changes to UK domestic law that made leave entitlements in the UK more generous than required under the Working Time Directive minimums.
There is little specific evidence to assess the extent to which entitlements to minimum daily and weekly rest breaks and restrictions on night working have had an effect on the UK labour market at the aggregate level. A large proportion of the costs expected to come from implementing the Working Time Directive in the 1998 Regulatory Impact Assessment were based on the impacts from daily and weekly rest breaks. The survey data available to measure the effects of these Articles on working patterns is not comprehensive enough to draw firm conclusions over the impact of the regulations, however the data does suggest that working patterns have not changed in the way anticipated in the original impact assessment. Therefore the overall costs of these aspects of the regulations are likely to be much lower than originally predicted.
72

Impact of legal rulings – The issues most commonly cited by business groups in relation to the WTD generally do not relate to the core provisions of the Directive, but instead centre around the impacts of rulings made by the CJEU after the Directive was adopted. These appear to have increased employer costs significantly, with the possibility of more impacts from the most recent judgments around holiday pay.
The UK continues to have an excellent workplace health and safety record. The UK had an excellent workplace health and safety record prior to 1998, and workplace health and safety has improved since then. Amongst EU countries, the UK has one of the best workplace health and safety records. It is difficult to make a direct link in the data between regulation of working hours and workplace health and safety outcomes.
73

Annex 1: A profile of long-hours working in the UK This Annex describes the characteristics of long-hours workers in the UK, based primarily on analysis of the Labour Force Survey (LFS)32. In Q4 2013 there were 3.35 million employees that usually worked over 48 hours per week. This is around 18 per cent of full-time employees, and around 13 per cent of all employees.
Gender Around three-quarters of long-hours workers are men. Men are more likely to work long-hours than women: 22 per cent of full-time male employees work over 48 hours per week, compared to 12 per cent of full-time female employees.
Table A1.1: Long-hours working by gender
Men Women Total
Number
As % of full time
employees Number
As % of full time
employees Number
As % of full time
employees Working more than 48 hours 2,475,000 21.7 876,000 11.9 3,350,000 17.8
Working more than 60 hours 377,000 3.3 109,000 1.5 486,000 2.6 Working more than 78 hrs 90,000 0.8 14,000 0.2 104,000 0.6
Amongst the whole population, 15 per cent of men33 with at least one dependent child34 work over 48 hours, compared to only 3 per cent of women with at least one child. However amongst full-time workers, 24 per cent of male full-time workers with children work over 48 hours, whilst 11 per cent of female full-time workers with children work over 48 hours.
Age Prevalence of long-hours working is at its highest amongst workers in their 40s, especially those aged 45 to 49, but is generally evenly spread amongst workers over the age of 30. Young workers are less likely to work long hours.
32 As elsewhere in this document, ‘long-hours working’ refers to usually working over 48 hours per week 33 ‘Men’ and ‘Women’ here refers to adults aged 18 or over 34 Defined as at least one dependent child in the family aged under 16 74

Table A1.2: Long-hours working by age
Age Full time employees working long hours
As a proportion of all full-time employees (%)
18 - 24 218,000 10.6 25 - 29 391,000 14.7 30 - 34 415,000 17.3 35 - 39 394,000 19.0 40 - 44 487,000 21.4 45 - 49 542,000 21.7 50 - 54 429,000 19.0 55 - 59 294,000 18.3 60 - 64 143,000 18.0
65+ 37,000 18.9
Qualifications The prevalence of long hours working varies with qualification levels. 15 per cent of employees with a postgraduate degree work more than 48 hours a week compared to 3 per cent with either no qualifications, GCSEs only, or A levels (Fourth Work Life Balance Employee Survey, 2012).
Occupation Long hours workers are more likely to be in managerial positions – the grouping most likely to fit the derogation from the 48 hours limit for managerial and autonomous workers. Long hours working amongst sales, customer service, administrative and secretarial occupations is relatively rare.
Table A1.3: Long-hours working by occupation
Occupation
FT Employees working long hours
Total FT employees
As a proportion of all full-time employees (%)
Managers, Directors and Senior Officials 724,000 2,101,000 34.5
Professional Occupations 994,000 4,363,000 22.8 Process, Plant And Machine Operatives 314,000 1,387,000 22.6
Skilled Trades Occupations 360,000 1,839,000 19.6 Associate Professional And Technical Occs 478,000 2,981,000 16.0
Elementary Occupations 186,000 1,539,000 12.1 Caring, Leisure And Other Service Occs 124,000 1,448,000 8.5
Sales And Customer Service Occupations 76,000 1,078,000 7.1
Administrative And Secretarial Occupations 89,000 2,037,000 4.3
75

Over time, a larger share of long-hours working has been taken up by workers in managerial or professional occupations. In 1995, 43 per cent of long-hours workers came from these types of occupations; in 2013, 51 per cent of long-hours workers came from these occupations. This is a continuation of the trend identified by Gershuny (2000), who showed that between the 1960s and 1990s, there was a change in the duration of hours worked of high-status work relative to low-status work: working hours in high-status work increased whilst hours in low-status work declined.
There has been a fall in the proportion of long-hours workers that work in elementary occupations. Data here only goes back to 2001, as before this the LFS Standard Occupational Classification structure did not include a comparable “elementary occupations” grouping. In 2001, 8 per cent of long-hours workers were in elementary occupations, whilst only 6 per cent of long-hours workers in 2013 were in elementary occupations.
Chart A1.4: Proportion of long-hours workers in managerial/professional or elementary roles
However the proportion of full-time managerial or professional workers that work long hours has also fallen over time: from 30 per cent in 1995 to 23 per cent in 2013. Amongst full-time elementary workers, the proportion usually working over 48 hours per week fell from 10 per cent in 2001 to 7 per cent in 2013.
76

Chart A1.1: Proportion of employees in managerial/professional or elementary roles working long hours
Income Higher incomes are associated with longer hours working. 24 per cent of employees with personal income of £40,000 or more work more than 48 hours in a usual week, compared with less than one per cent of employees earning below £10,000 (Fourth Work-Life Balance Employee Survey, 2012).
Public/private sector Employees in the private sector are more likely to work longer hours. 7 per cent of private sector employees work more than 48 hours a week, compared with 4 per cent of public sector employees (Fourth Work-Life Balance Employee Survey, 2012).
Regions Long-hours working is more prevalent in southern and eastern England and is least prevalent in the north of England, Northern Ireland, Wales and Scotland. Employees in Inner London are most likely to work long hours, with around a fifth working over 48 hours a week.
77

Table A1.4: Long-hours working by region
Region FT Employees working long hours
Total FT employees
As a proportion of all full-time employees (%)
Inner London 276,000 1,077,000 25.7 Eastern 387,000 1,847,000 20.9 South East 557,000 2,668,000 20.9 Rest of Yorkshire & Humberside 98,000 510,000 19.3 Rest of West Midlands 150,000 804,000 18.7 Rest of North East 76,000 418,000 18.1 East Midlands 249,000 1,388,000 18.0 Outer London 259,000 1,507,000 17.2 South West 256,000 1,498,000 17.1 Rest of Scotland 154,000 951,000 16.2 South Yorkshire 64,000 408,000 15.7 Rest of North West 127,000 825,000 15.4 West Yorkshire 101,000 670,000 15.0 West Midlands Metropolitan County 113,000 756,000 15.0
Tyne and Wear 49,000 327,000 14.9 Strathclyde 99,000 669,000 14.8 Wales 123,000 839,000 14.7 Merseyside 53,000 376,000 14.0 Greater Manchester 104,000 764,000 13.6 Northern Ireland 56,000 505,000 11.0
Industry Long hours working is observed across all industry sectors, but is particularly prevalent in the agriculture, construction and energy sectors. Around 40 per cent of full-time employees in the SIC 1-digit industry sector Agriculture, forestry and fishing35, and around a quarter of full-time employees in the construction or energy and water industries work over 48 hours per week. However these sectors combined account for only around 13 per cent of all long-hours workers.
35 Standard Industry Classification codes classify broad sectors at the 1-digit level and disaggregate to more specific sectors at 2-digit and 3-digit levels. Although data at higher digit levels is more specific about a particular industry, smaller sample sizes often mean there is less certainty of conclusions derived from the analysis. 78

Table A1.5: Long-hours working by industry (SIC 1 digit-level)
Industry FT Employees working long hours
Total FT employees
As a proportion of all full-time employees (%)
Agriculture, forestry and fishing 46,932 114,442 41.0 % Construction 280,766 1,152,252 24.4 % Energy and water 100,376 436,497 23.0 % Transport and communication 418,694 1,968,844 21.3 % Banking and finance 615,685 3,216,611 19.1 % Distribution, hotels and restaurants 469,588 2,850,710 16.5 %
Manufacturing 406,932 2,519,890 16.1 % Public admin, education and health 900,807 5,728,762 15.7 %
Other services 104,784 730,933 14.3 % Flexible practices related to long hours Employees that take up the right to work from home are significantly more likely to work long hours. 18 per cent of full-time workers that regularly work from home work more than 48 hours a week, compared with 6 per cent that do not regularly work from home. Other forms of flexible working, such as flexitime, annualised working hours, compressed working week, temporarily reduced hours, working school term-time only or job sharing are not significantly related to the number of hours worked in a usual week for full-time employees (Fourth Work-Life Balance Employee Survey, 2012).
Duration of long-hours working The five-quarter longitudinal LFS dataset allows individuals to be tracked over a period of five consecutive quarters. The longitudinal nature of this data can therefore be exploited in order to understand the duration of long hours working. BIS analysis of the longitudinal LFS between Q4 2011 and Q4 2012 shows that, of those employees who usually work over 48 hours a week, on average 68 per cent continue to do so in the following quarter, and just over 51 per cent are still working long hours a year later. This suggests that around a third of long-hours working has a duration of three months or less, and around half is sustained for longer than a year36. A comparable analysis from Q4 1997 to Q4 1998 found similar transition rates - indicating that both before, and since the introduction of the WTD, for many workers long-hours working is a temporary state rather than a sustained or permanent mode of working.
36 BIS analysis of LFS longitudinal dataset, Q4 2011 to Q4 2012 79

Annex 2: Description of data sources The Labour Force Survey (LFS) is a quarterly survey of households living at private addresses in the UK. Its purpose is to provide information on the UK labour market which can then be used to develop, manage, evaluate and report on labour market policies.
The Workplace Employment Relations Study (WERS) is a national survey of people at work in Great Britain. It collects data from employers, employee representatives and employees in a representative sample of workplaces. WERS has been undertaken six times: 1980, 1984, 1990, 1998, 2004 and 2011. Key information produced includes: how workplaces are managed and organised; individual and collective representation at work; trade union recognition and membership; dispute resolution; fair treatment at work; family-friendly policies; employment equality, selection and recruitment; how learning and training activities are undertaken and adoption of high involvement management practices.
The Work-Life Balance Employer and Employee Surveys (WLB) are a series of surveys of employers and employees covering a wide range of issues relating to work-life balance including working hours, provision and take-up of flexible working arrangements, awareness of changes to legislation, leave provision, support for working parents and employers’ attitudes to work-life balance issues. The Fourth Work Life Balance Employee survey was published in 2012. The Annual Survey of Hours and Earnings (ASHE) – is a one per cent UK sample of employee jobs taken from HM Revenue & Customs (HMRC) PAYE records. Information obtained from employers includes the levels, distribution and make-up of earnings and hours worked for employees in all industries and occupations. ASHE does not cover the self-employed nor does it cover employees not paid during the reference period.
The Health and Safety Executive (HSE) publishes a range of statistics relating to workplace health and safety in Great Britain, including statistics comparing UK performance against other European countries.
Conducted every five years since its launch in 1990, the European Working Conditions Survey (EWCS) provides an overview of working conditions in Europe. Themes covered include employment status, working time duration and organisation, work organisation, learning and training, physical and psychosocial risk factors, health and safety, work-life balance, worker participation, earnings and financial security, as well as work and health.
80

Annex 3: Econometric Analysis As part of our review of evidence, we carried out some econometric analysis to investigate the links between the introduction of the Working Time Regulations and total hours worked, and total employment in the UK, controlling for as many other factors as possible. The results of this analysis are presented in brief below. These results should be considered with caution, as there are a number of limitations with the methodology available for this type of analysis.
Research objective To assess whether, after stripping out the impact of demographic changes, demand shifts and other effects, the introduction of the Working Time Regulations in 1998 had an observable impact on total hours worked, and total employment.
Data Dependent variables: Log total hours worked (usual and actual) Log total employment Log # employees
Treatment variables: Working Time Dummy – Dummy variable equal to 1 after Q4 1998, zero before Control variables: Demographic – population split into five age groups – under 16, 16-24, 25-54, 55-64, 65+ Qualifications – e.g. number of adults (16+) with high, medium and low levels of qualification (proxied by age left full time education) Participation – Number of adults (16+) in full-time education Demand – regional GVA, regional gross fixed capital formation All data used at the regional level – across 11 major regions of Great Britain. All control variables in natural logs. All labour market and demographic data taken from Labour Force Survey; GVA and gross fixed capital formation from ONS releases.
Basic Specification Regress dependent variable in region i in time period t on the demographic variables, GVA, % young people in FTE, adding a dummy variable capturing before and after the introduction of the WTRs. This gives an estimate (in percentage terms) of the average difference in total hours worked after the WTRs were introduced, holding everything else constant.
81
Log dependent variable i,t = α0 + β 1 Working Time Dummyt + β2 Xi,t + ε i,t
Identification issues However, this basic specification likely to suffer from endogeneity issues because of the inclusion of GDP37. This is because changes in demand (as measured by GDP) are likely to lead to changes in hours worked/employment, but changes in hours worked/employment could impact upon GDP. This is likely to mean that the estimated impacts of the WTD will be biased (i.e. an over or under estimate of the true value).
Ideally you would use a variable that moves with demand, but does not directly impact upon hours worked/employment other than through its effect on demand (an instrumental variable). It is unlikely that a suitable instrumental variable can be identified in this context however.
An alternative approach is to include fixed region (θ i) and time effects (λt). This will significantly reduce, but not eliminate the endogeneity issue.
Log dependent variable i,t = α0 + β 1 Working Time Dummy i,t + β2 Xi,t + θ i + λ t + ε i,t
Finally, you could omit demand factors altogether - if for example long term labour market outcomes are determined more by supply factors, and the year fixed effects capture enough of the short-term demand effects. Variations of these specifications have been run and results are presented in full in the Annex and summarised below.
Results The tables below display the results for each of the four dependent variables in turn: total usual hours, total actual hours, total employment, and number of employees. Each of the tables displays the same set of specifications:
1. Simple correlation, no controls, no fixed effects 2. Full set of controls except demand variables, no fixed effects 3. Full set of controls except demand variables, time fixed effects 4. Full set of controls except demand variables, time and region fixed
effects 5. Full set of controls including regional GVA, time and region fixed
effects 6. Full set of controls including regional gross fixed capital formation, time
and region fixed effects. Interpretation of the results: As the dependent variable is in logs and the treatment variable is a dummy variable, the coefficient, β1, on the working time dummy variables should be interpreted as “the introduction of Working Time is associated with a 100* β1% change in the dependent variable”.
37 The demographic variables may also be endogenous, because of migration (e.g. a growing economy, where total hours worked is increasing, may attract more migrant workers, which adds to total hours worked). 82

Table A3.1: Dependent variable - Log total usual hours
1
2
3
4
5
6
Working Time 0.0512*** -0.0019
0.0008
-0.0006
-0.0003
-0.0022
(-0.0101) (-0.0116)
(-0.0056)
(-0.0045)
(-0.0046)
(-0.0046)
Demographic and education controls N Y Y Y Y Y
Year fixed effects N N Y Y Y Y
Region fixed effects N N N Y Y Y
GVA control N N N N Y N
Gross fixed capital formation control N N N N N Y
N 957 891 891 891 847 704
R-sq 0.004 0.994 0.996
0.82 0.842 0.801
Standard errors in parentheses
="* p<0.05 ** p<0.01 *** p<0.001"
Table A3.2: Dependent variable – Log total actual hours
1 2
3 4 5
6
Working Time 0.0549*** -0.0069 0.0158* 0.0111 0.0107 0.0077
(0.0106) (0.0114) (0.0063) (0.0055) (0.0057) (0.0062)
Demographic and education controls N Y Y Y Y Y
Year fixed effects N N Y Y Y Y
Region fixed effects N N N Y Y Y
GVA control N N N N Y N
Gross fixed capital formation control N N N N N Y
N 957 891 891 891 847 704
R-sq 0.004 0.991
0.629 0.612 0.578
Standard errors in parentheses
="* p<0.05 ** p<0.01 *** p<0.001"
83

Table A3.3: Dependent variable – Log total employment
1
2
3
4
5
6
Working Time 0.1035*** 0.0103 0.0094* 0.0073* 0.0074* 0.0061
(-0.0091) (-0.0103) (-0.0042) (-0.0028) (-0.0029) (-0.003)
Demographic and education controls N Y Y Y Y Y
Year fixed effects N N Y Y Y Y
Region fixed effects N N N Y Y Y
GVA control N N N N Y N
Gross fixed capital formation control N N N N N Y
N 957 891 891 891 847 704
R-sq 0.016 0.996
0.948 0.956 0.941
Standard errors in parentheses
="* p<0.05 ** p<0.01 *** p<0.001"
Table A3.4: Dependent variable – Log number of employees 1
2
3
4
5
6
Working Time 0.1110*** 0.0289* 0.0126** 0.0102* 0.0103* 0.0092* (-0.0091) (-0.0113) (-0.0039) (-0.0039) (-0.0039) (-0.0041) Demographic and education controls N Y Y Y Y Y Year fixed effects N N Y Y Y Y Region fixed effects N N N Y Y Y GVA control N N N N Y N Gross fixed capital formation control N N N N N Y N 957 891 891 891 847 704
R-sq 0.019 0.995
0.928 0.939 0.919
Standard errors in parentheses ="* p<0.05 ** p<0.01 *** p<0.001"
84

Summary of the results There appears to be little correlation between hours worked (whether usual or actual) and the introduction of the WT regulations, once demographic factors are controlled for. There is stronger evidence of a significant and positive association between the introduction of the WT regulations and total employment. When employment is used as the dependent variable, the coefficient on the WT dummy is significant (at 5% level) across most of the specifications. The point estimates are all fairly similar, at around 0.01. This would imply a 1% increase in employment associated with the regulations. A similar picture emerges when we look only at employees – the coefficient on the crude working time dummy is significant in all specifications and is similar in magnitude at around 0.01, again implying a 1% increase. Conclusions The analysis should be treated cautiously. The econometric approach here is relatively simplistic and likely to retain some elements of endogeneity. The results should therefore not be interpreted as a fully identified assessment of the causal impact of the WT Directive. Rather they should be viewed as a) one element of the wider analysis and b) providing a guide or an indication as to the likely scale and direction of the effects, but not a definitive assessment. Due to endogeneity, the magnitude of the estimates in particular should not be unduly emphasised, given the scope for bias.
The analysis does offer tentative support for the conclusions from the wider evidence review, namely:
- That there were some observable changes in the labour market around the time the Working Time Regulations were introduced. This appears to have largely been a compositional effect – with increased employment at the lower end of the hours distribution. This is supported by the significant and positive estimate of the impact on employment in the econometric analysis above.
- There may not have been a significant impact on total hours worked as a result of the regulations – partly due to the reasonably widespread use of the opt-out from the 48 hours limit, and partly because the main impact appears to have been through increased employment lower down the hours distribution.
85

Bibliography Adnett, N. and Hardy, S. (2001), ‘Reviewing the Working Time Directive: rationale implementation and case law’, Industrial Relations Journal, Vol. 32, No. 2, pp 114-125.
Andrews, M., Gerner, H., Schank, T. and Upward, R. (2012) ‘More Hours, More Jobs? The Employment Effects of Longer Working Hours’, Institute for the Study of Labor IZA Discussion Paper No. 6652, Bonn.
Barnard, C., Deakin, S. and Hobbs, R. (2002) ‘The use and necessity of Article 18.1(b)(i) of the Working Time Directive in the United Kingdom’, University of Cambridge.
Barnard, C., Deakin, S. and Hobbs, R. (2004), ‘Opting out of the 48-hour week – employer necessity or individual choice? An empirical study of the operation of Article 18(1)(b) of the Working Time Directive in the UK’, ESRC Centre for Business Research, University of Cambridge, Working Paper No. 282.
Bell, D., Otterbach, S. and Sousa-Poza, A. (2011) ‘Work Hours Constraints and Health’, Institute for the Study of Labor IZA Discussion Paper No. 6126, Bonn.
Bell, D. and Hart R. (1998) ‘Working time in Great Britain, 1975-1994: evidence from the New Earnings Survey panel data’, Journal of the Royal Statistics Society, 161, Part 3, pp 327-348.
Beswick, J. and White, J. (2003) ‘Working Long Hours’, HSL/2003/02
Booth, A and Francesconi M. (1997) ‘Career mobility in Britain’, ESRC Research Centre on Micro-Social Change, University of Essex.
BRMB Social Research (2004) ‘A survey of workers’ experiences of the Working Time Regulations’, Employment Relations Research Series No.31, Department of Trade and Industry.
Business Taskforce (2013) ‘Cut EU red tape: Report from the Business Taskforce’. Available at: https://www.gov.uk/government/uploads/system/uploads/attachment_data/file/249969/TaskForce-report-15-October.pdf
Confederation of British Industry (2003) ‘Maintaining a dynamic labour market: the Working Time Directive and the individual opt-out’.
Confederation of British Industry (2010) ‘Making Britain the place to work: an employment agenda for the new government’.
Confederation of British Industry (2013) ‘Our Global Future: The business vision for a reformed EU’. London: CBI.
86

Confederation of British Industry (2006) ‘Employment Trends Survey 2006: People at the Heart of Competitiveness’. London: CBI.
Confederation of British Industry/Harvey Nash (2009) ‘Easing up?: CBI/Harvey Nash employment trends survey 2009’. London: CBI.
Confederation of British Industry/Harvey Nash (2012) ‘Facing the future: CBI/Harvey Nash employment trends survey 2012’. London: CBI.
Chartered Institute of Personnel and Development (2004) ‘The Working Time Regulations, calling time on working time: Survey report’.
Crepon, B. and Kramarz, F. (2002) ‘Employed 40 hours or Not Employed 39: Lessons from the 1982 Mandatory Reduction of the Workweek’, Journal of Political Economy, Vol. 110(6), pp 1355-1389.
Crepon, B., Leclair, M. and Roux, S. (2005) ‘The Shorter Working Week, Productivity and Employment: New Estimates Based on Business Data’, Economie et Statistique, Institut National de la Statistique et des Etudes Economiques, Vol. 376-377, p 55-89.
De Meza, D. and Myles, G. (1997) ‘Should Working Hours be Restricted?’, University of Exeter paper, May 1997.
Deloitte (2010) ‘Study to support an Impact Assessment on further action at European level regarding Directive 2003/88/EC and the evolution of working time organisation’, European Commission DG for Employment, Social Affairs and Equal Opportunities.
Department for Trade and Industry (1998) ‘Working Time Regulations Regulatory Appraisal’.
Directive of the European Parliament and of the Council (2003/88/EC) of 4 November 2003 concerning certain aspects of the organisation of Working Time.
EEF Employment Survey, 2009
Employment Market Analysis and Research (2004) ‘2003 Compendium of Regulatory Impact Assessments’, Employment Relations Research Series No. 28, Department of Trade and Industry.
Estevao, M. and Sa, F. (2008) ‘The 35-hour week in France: Straightjacket or welfare improvement?’ Economic Policy, 23(55), pp 417-463.
European Agency for Safety and Health at Work (2010) ‘ESENER – European Survey of Enterprises on New and Emerging Risks’. Luxembourg: Publications Office of the European Union.
European Foundation for the Improvement of Living and Working Conditions (1998) ‘Reduction in Working Time (A Literature Review)’. Luxembourg: Office for Official Publications of the European Communities.
87

European Foundation for the Improvement of Living and Working Conditions (2010) ‘Comparative analysis of working time in the European Union’. Luxembourg: Office for Official Publications of the European Communities.
European Foundation for the Improvement of Living and Working Conditions (2012a) ‘Fifth European Working Conditions Survey’. Luxembourg: Office for Official Publications of the European Communities.
European Foundation for the Improvement of Living and Working Conditions (2012b) ‘Health and well-being at work: A report based on the fifth European Working Conditions Survey’, Dublin.
Fourth Work-Life Balance Employee Survey, 2012
Freeman, R. (1998) ‘Work-Sharing to Full Employment: Serious Option or Populist Fallacy?’. In Generating Jobs: How to Increase Demand for Less-skilled Workers, Freeman, R. and Gottschalk, P. (eds). New York: Russell Sage Foundation.
Gershuny, J. (2000) ‘Changing Times: Work and Leisure in Postindustrial Society’, Oxford University Press.
Gershuny, J. and Fisher, K. (2014) ‘Post-industrious society: Why work time will not disappear for our grandchildren’, Sociology Working Papers No. 2014-03, Centre for Time Use Research, Department of Sociology, University of Oxford.
Glass, J. and Fujimoto, T. (1994) ‘Housework, Paid Work and Depression Among Husbands and Wives’, Journal of Health and Social Behaviour, Vol. 35, No. 2, pp179-191.
Green, F. (2001) ‘It’s Been A Hard Day’s Night: The Concentration and Intensification of Work in Late Twentieth-Century Britain’, British Journal of Industrial Relations, Vol. 39, No. 1, pp 53-80.
Her Majesty’s Government (2014) ‘Review of Balance of Competences between the United Kingdom and the European Union: Social and Employment Policy’. London: HMG.
Hogarth, T., Daniel, W.W., Dickerson, A.P., Campbell, D., Wintherbotham, M. and Vivian, D. (2003) ‘The business context to long hours working’, Employment Relations Research Series No.23, Department of Trade and Industry.
House of Lords European Union Committee (2004) ‘The Working Time Directive: A Response to the European Commission’s Review, Session 2003-04’, HL Paper 67. London: House of Lords. Available at: http://www.publications.parliament.uk/pa/ld200304/ldselect/ldeucom/67/67.pdf Accessed 14th October 2014.
Huberman, M. (2002) ‘Working Hours of the World Unite? New International Evidence on Worktime, 1870-1900’, CIRANO Scientific Series 2002s-77, CIRANO, Montreal.
Independent Working Time Regulations Taskforce (2014) ‘The Implementation of the Working Time Directive, and its impact on the NHS and health professionals’, Report of
88

the Independent Working Time Regulations Taskforce to the Department of Health. London: RCS Publications.
Kodz et al. (2003) ‘Working long hours: a review of the evidence. Volume 1 – Main report’, Employment Relations Research Series No. 16, Department of Trade and Industry.
LaJeunesse, R. (1999) ‘Toward an Efficiency Week’, Challenge Vol. 42, No. 1, pp 92-109.
Landeshauptstadt Kiel v Jaeger (2003) (European Court of Justice Case C-151/02)
Lee, S., McCann, D. and Messenger, J.C. (2007) ‘Working Time Around the World: Trends in working hours, laws and policies in a global comparative perspective’, London and Geneva: Routledge and International Labour Organisation.
Lembcke, A.C., (2014) ‘The Impact of Mandatory Entitlement to Paid Leave on Employment in the UK’, Centre for Economic Performance Discussion Paper No. 1262. London: Centre for Economic Performance, London School of Economics. Lynch, P. (1991) ‘Making time for productivity’, Personnel Management, Vol. 23, No. 3, March, pp 30-35. Marimon, R. and Zilibotti, F. (2000) ‘Employment and distributional effects of restricting working time’, European Economic Review, Vol. 44, pp 1291-1326.
Neathey, F. and Arrowsmith, J. (2001), ‘Implementation of the Working Time Regulations’ Employment Relations Research Series No. 11, Department of Trade and Industry.
Neathey, F. (2003) ‘Implementation of the Working Time Regulations: follow-up study’, Employment Relations Research Series No. 19, Department of Trade and Industry.
Raposo, P. and van Ours, J. (2008) ‘How Working Time Reduction Affects Employment and Earnings’, Institute for the Study of Labor IZA Discussion Paper No. 3723, Bonn.
Reati, A. (1998) ‘The Reduction of Working Time as Means of Solving the Unemployment Problem’, Employment, technology and economic needs: theory, evidence and public policy, pp 338-349.
Scase et al. (1998) ‘Work Now – Pay Later? The Impact of Long Work Hours on Health and Family Life’, ESRC Connect Insights.
Second Work-Life Balance Employer Survey, 2003
Second Work-Life Balance Employee Survey, 2004
Sindicato de Médicos de Asistencia Pública (Simap) v Conselleria de Sanidad y Consumo de la Generalidad Valenciana (2000) (European Court of Justice Case C-303/98)
89

Skuterud, M. (2007) ‘Identifying the Potential of Work-Sharing as a Job-Creation Strategy’ Journal of Labor Economics, Vol. 25, No. 2, pp 265-287.
Shepard E. and Clifton T. (2000) ‘Are longer hours reducing productivity in manufacturing?’ International Journal of Manpower Vol. 21, No. 7, pp 540-552.
Steptoe et al. (1998) ‘A longitudinal study of work load, and variations in psychological well-being, cortisol, smoking, and alcohol consumption’, Annals of Behavioural Medicine, Vol. 20, No. 2, pp 84-91.
Third Work-Life Balance Employer Survey, 2007
Vernon, H. (1921) ‘Industrial Fatigue and Efficiency’, London: Routledge.
White, M. (1987) ‘Working Hours: Assessing the Potential for Reduction’, International Labour Office: Geneva.
Workplace Employment Relations Survey, 2011
The Working Time Regulations 1998
The Working Time (Amendment) Regulations 2007
YouGov (2013) ‘Working sixty hours a week is dangerous’. Available at: http://yougov.co.uk/news/2013/08/23/working-sixty-hours-week-dangerous/ Accessed [14th October 2014].
Temple, J. (2010) ‘Time for Training: A Review of the impact of the European Working Time Directive on the quality of training.
90

© Crown copyright 2014
You may re-use this information (not including logos) free of charge in any format or medium, under the terms of the Open Government Licence. Visit www.nationalarchives.gov.uk/doc/open-government-licence, write to the Information Policy Team, The National Archives, Kew, London TW9 4DU, or email: [email protected].
This publication is also available on our website at www.bis.gov.uk
Any enquiries regarding this publication should be sent to: Department for Business, Innovation and Skills 1 Victoria Street London SW1H 0ET Tel: 020 7215 5000
If you require this publication in an alternative format, email [email protected], or call 020 7215 5000.
BIS/14/1287