bis working papers · pdf filebis working papers no 514 . ... prominence following the great...
TRANSCRIPT
BIS Working Papers No 514
The influence of monetary policy on bank profitability by Claudio Borio, Leonardo Gambacorta and
Boris Hofmann
Monetary and Economic Department
October 2015
JEL classification: C53, E43, E52, G21
Keywords: monetary policy, bank profitability, financial crisis

BIS Working Papers are written by members of the Monetary and Economic Department of the Bank for International Settlements, and from time to time by other economists, and are published by the Bank. The papers are on subjects of topical interest and are technical in character. The views expressed in them are those of their authors and not necessarily the views of the BIS.
This publication is available on the BIS website (www.bis.org).
© Bank for International Settlements 2015. All rights reserved. Brief excerpts may be reproduced or translated provided the source is stated.
ISSN 1020-0959 (print) ISSN 1682-7678 (online)

WP514 The influence of monetary policy on bank profitability 1
The influence of monetary policy on bank profitability
Claudio Borio, Leonardo Gambacorta and Boris Hofmann1
Abstract
This paper investigates how monetary policy affects bank profitability. We use data for 109 large international banks headquartered in 14 major advanced economies for the period 1995–2012. Overall, we find a positive relationship between the level of short-term rates and the slope of the yield curve (the “interest rate structure”, for short), on the one hand, and bank profitability – return on assets – on the other. This suggests that the positive impact of the interest rate structure on net interest income dominates the negative one on loan loss provisions and on non-interest income. We also find that the effect is stronger when the interest rate level is lower and the slope less steep, ie that non-linearities are present. All this suggests that, over time, unusually low interest rates and an unusually flat term structure erode bank profitability.
JEL classification: C53, E43, E52, G21.
Keywords: monetary policy, bank profitability, financial crisis.
1 The authors wish to thank Michael Brei, Giuseppe Della Corte, Rochelle Edge, Enisse Kharroubi and
participants at the Workshop on Stress Testing for Interest Rate Risk (Bank of England, 28 May 2014), the 2nd Macro Banking and Finance Workshop (Tor Vergata Rome, 19 September 2014) and the Computational and Financial Econometrics Conference (University of Pisa, 6 December 2014) for comments and suggestions. Michela Scatigna and Pablo Garcia-Luna have provided excellent research assistance. The opinions expressed in this paper are those of the authors and do not necessarily reflect those of the Bank for International Settlements.

2 WP514 The influence of monetary policy on bank profitability
Contents
Introduction ............................................................................................................................................... 3
1. Analytical framework .................................................................................................................... 4
Impact on net interest income .................................................................................................. 5
Impact on non-interest income ................................................................................................ 8
Impact on loan loss provisions ................................................................................................. 9
Testable hypotheses ................................................................................................................... 10
2. Empirical analysis.......................................................................................................................... 11
Data ................................................................................................................................................... 11
Econometric framework ............................................................................................................ 12
Results .............................................................................................................................................. 14
Net interest income ........................................................................................................... 14
Non-interest income ......................................................................................................... 15
Provisions ............................................................................................................................... 16
Return on assets .................................................................................................................. 16
Conclusion ................................................................................................................................................ 16
Annex: A simple illustrative theoretical model .......................................................................... 19
References ................................................................................................................................................ 24

WP514 The influence of monetary policy on bank profitability 3
Introduction
Understanding the link between interest rates and bank profitability is important for evaluating the effect of the monetary policy stance – as captured by the interest rate structure, ie the level and slope of the yield curve – on the soundness of the financial sector. While monetary policy is not, of course, the only influence on the interest rate structure, it has a major impact on it: the central bank sets the short-term rate and influences longer-term rates through direct purchases of securities and by guiding market participants’ expectations about the short-term rate.
The link between monetary policy and bank profitability has gained prominence following the Great Financial Crisis. In the major advanced economies, short-term interest rates have sagged to near zero and long-term interest rates to historically low levels (Figure 1, left-hand and middle panel), notably in the wake of central bank forward guidance and large-scale central bank asset purchases (Figure 1, right-hand panel). Importantly, estimated 10-year term premia have been mostly negative in a number of jurisdictions since 2011 (Figure 1, middle panel).
There is widespread agreement that central banks’ aggressive response at the early stages of the crisis was critical for helping prevent a financial and economic meltdown. However, in recent years, concerns have been growing that the net benefits of prolonged monetary accommodation might be declining due to its negative side effects (eg Dale (2012), Plosser (2012), Praet (2012), Rajan (2013), Bank for International Settlements (2012)). One such side effect is the negative effect of a low interest rate structure on bank profitability and hence on the soundness of the banking sector.
Surprisingly, the link between monetary policy and bank profitability is an under-researched area. Many papers analyse the link between bank profitability and business conditions, producing results on the link between the interest rate structure and bank profitability only as a by-product. In particular, Demirgüç-Kunt and Huizinga (1999) were among the first to relate bank profits to macroeconomic indicators, such as real interest rates. They find that high real interest rates are associated with higher interest margins and profitability, especially in developing countries where demand deposits frequently pay below-market interest rates. Recent examples from this strand of literature include Albertazzi and Gambacorta (2009), who use aggregate data for the banking sector in 10 OECD countries and find a significant relationship between net interest rate income and the yield curve slope. They also find a positive relationship between bank loss provisions and the short-term interest rate. Bolt et al (2012) obtain similar results using bank-level data and allowing for asymmetrical effects over the business cycle.
Only few studies have focused specifically on the impact of interest rates on bank profitability. English (2002) studies the link between interest rate risk and bank interest rate margins in 10 industrialised countries. He finds that, as the average yield on bank assets is more closely related to long-term rates than the average yield on liabilities, a steep yield curve raises interest margins. Recently, Alessandri and Nelson (2014) establish a positive long-run link between the level and slope of the yield curve and bank profitability in the United Kingdom.
In this paper, we explore the link between monetary policy and bank profitability in more depth, focusing precisely on the relationship between the interest rate structure and bank performance. This, of course, means that we take

4 WP514 The influence of monetary policy on bank profitability
macroeconomic conditions as given and do not include any effects that operate indirectly, through monetary policy’s independent impact on aggregate demand.
We contribute to the literature in two main ways. First, we analyse the link more comprehensively, based on a large set of international banks and all the main components of banks’ balance sheets. To this end, we draw on a data set that covers 109 large international banks headquartered in 14 advanced economies for the period 1995–2012. And we look at net interest income, non-interest income, loan loss provisions and overall return on assets (ROA). Second, we allow for non-linearities in the relationship between interest rates and bank profitability – an aspect that so far has been neglected in empirical work despite its intuitive appeal. Importantly, if such non-linearities are sizeable, ignoring them underestimates the effects of very low interest rates.
The analysis yields the following main results.2 First, we find a positive relationship between the interest rate structure and bank profitability. This results from two contrasting forces. On the one hand, the level of short-term interest rates and the slope of the yield curve are positively associated with banks’ net interest income, reflecting their positive effect on bank margins and on returns from maturity transformation, respectively. On the other hand, higher interest rates boost loan loss provisions, consistent with their impact on debt service costs and default probabilities, and depress non-interest income, most probably because of their negative impact on securities’ valuations. Second, we also find that the impact on profitability declines with the level of interest rates and the slope of the yield curve, ie that there are significant non-linearities. This indicates that the impact of interest rates on bank profitability is particularly large when they are low. All this suggests that, over time, unusually low interest rates and an unusually flat term structure erode bank profitability.
The rest of the paper is organised as follows. The first section lays out the analytical framework and considers the main channels through which monetary policy influences bank profitability. The second section presents the empirical analysis. It describes the data set and, to set the context, the evolution of bank profitability and monetary policy in the period under investigation. It then presents the econometric framework and discusses the main empirical results. The conclusion highlights the main findings and their implications.
1. Analytical framework
Monetary policy operates primarily through its proximate effect on the short-term interest rate and the slope of the yield curve. The central bank controls the short-term rate quite closely through the policy rate. Its influence on the yield curve is more indirect, through its impact on market participants’ expectations about the future policy rate path (the signalling channel) and through large-scale operations in government securities specifically intended to have an impact on their price – a common example of “balance sheet policies“ (Borio and Disyatat (2010)).
2 We estimate the regressions using a System Generalized Method of Moments (S-GMM) panel
methodology in order to control for potential endogeneity (Arellano and Bond (1991)).

WP514 The influence of monetary policy on bank profitability 5
Since the crisis, as policy rates have sagged to zero or thereabouts, attempts to influence the yield curve have become much more prominent as a means of providing extra stimulus. The heavy reliance on forward guidance about future policy rates and on large-scale asset purchases are testimony to these efforts. There is growing empirical evidence that, taken together, these policies have had considerable impact on the yield curve at all maturities, with large-scale purchases complementing at the longer end the effect of forward guidance at shorter maturities, say, up to two years or so.3 Importantly, the impact has not only been on the pure expectations component of the yield curve but also on the term premium.4 Indeed, estimates indicate that this premium has been unusually compressed and, for prolonged periods, even substantially negative.5
In the analysis that follows, we are specifically interested in the impact of monetary policy on bank profitability taking macroeconomic conditions as given. A more comprehensive analysis would require a full macroeconomic dynamic general equilibrium model, and hence would be largely determined by that model’s characteristics. Moreover, given that extant models are not well suited to capturing the richness of the effects, the corresponding analysis would inevitably have to be carried out at a high level of aggregation. By narrowing down the focus on the more direct impact of monetary policy on bank profitability, we can enrich the empirical investigation, illuminate further the various channels and take advantage of available bank-level data.
In what follows, we consider, sequentially, the ways in which the level of interest rates and the slope of the yield curve can be expected to affect the various components of bank profitability, ie net interest income, non-interest income and loan loss provisions. The Annex presents a very simple model that can help to provide further intuition about the main channels.
Impact on net interest income
Under quite general conditions, there are good reasons to believe that both the level of interest rates and the slope of the yield curve are associated with higher net
3 See eg Meaning and Zhu (2011) on the impact of the Federal Reserve and Bank of England asset-
purchase programmes on Treasury yields and other financial asset prices. On the financial market impact of forward guidance, see eg Filardo and Hofmann (2014).
4 Central bank asset purchases are widely seen as affecting mainly term premia in long-term interest rates via a portfolio rebalancing channel (see eg Bernanke (2013)). For instance, Banerjee et al (2012) and Cahill et al (2013) present evidence suggesting that the Bank of England’s and Federal Reserve’s asset purchases have mainly worked through this channel. However, monetary policy can affect risk, and hence also term, premia not just through large-scale operations in the relevant securities but also through the level of interest rates, forward guidance, and market expectations of the response of policy to untoward market developments (eg “implicit puts”).
5 For instance, affine term structure models (Kim and Wright (2005) and Hördahl and Tristani (2014)) typically find very low and mostly negative term premia for the United States and the euro area. See www.federalreserve.gov/econresdata/researchdata/feds200533.html and Bank for International Settlements (2015), respectively (see also Figure 1, middle panel).
6 WP514 The influence of monetary policy on bank profitability
interest income. This relationship is likely to be especially strong at very low levels of nominal interest rates and to fade as interest rates move higher, ie to be concave.6
In the case of the level of interest rates, at least four mechanisms are relevant: (i) a “retail deposits endowment effect”; (ii) a “capital endowment effect”; (iii) a “quantity effect” that counterbalances the “price effect”; and (iv) the dynamics of transition between equilibria, including repricing lags and credit-loss accounting.
The “retail deposits endowment effect” derives from the fact that bank deposits are typically priced as a markdown on market rates, typically reflecting some form of oligopolistic power and transaction services. If the markdown becomes smaller as interest rates decline, then monetary policy tightening will increase net interest income. The endowment effect was a big source of profits at high inflation rates and when competition within the banking sector and between banks and non-banks was very limited, such as in many countries in the late 1970s. It has again become quite prominent, but operating in reverse, post-crisis, as interest rates have become extraordinarily low: as the deposit rate cannot fall below zero, at least to any significant extent, the markdown is compressed when the policy rate is reduced to very low levels. This means that the relationship between net interest income and interest rates is non-linear (concave).
The “capital endowment effect” is, functionally, an extreme case of the “retail deposit endowment effect”: by construction, equity capital does not pay interest. Thus, as interest rates fall, the return on assets covered by capital mechanically declines. Quantitatively, this effect is generally smaller than that for deposits because capital is a smaller share of total assets. That said, it operates at all interest rate levels.7
Changes in the level of market rates will also have quantity effects, notably influencing the volume of bank loans and deposits. To the extent that, on balance, the demand for loans is more responsive (elastic) to interest rates than that for deposits, at some point higher interest rates would erode profitability.8 That point is determined, inter alia, by the sensitivity of the demand for loans (and deposits) to market rates in general equilibrium, since other sectors will also be affected by the same changes in market conditions, which tends to offset any partial equilibrium forces.
Dynamic effects in the transmission of the level of interest rates to net interest income take two forms.
The first relates to lags in price (rate) adjustments, possibly reflecting oligopolistic behaviour or views that the changes in market rates are only temporary. There is a vast literature documenting that if banks have oligopolistic
6 The Annex shows that, also in the case of a simple Monti-Klein model, the short-term interest rate
and the yield curve slope could influence net interest income in a quadratic way. 7 Of course, capital is not costless. But this is not relevant for current purposes except to the extent
that (i) banks impute a cost of equity capital to their loans (quite plausible; eg Basel Committee on Banking Supervision (2010), Elliot (2010)); and (ii) the wedge between that cost and market rates varies with their level (less obvious). Under these conditions, the spread between loan rates and market rates could vary with the level of market rates. In any case, these are likely to be second-order effects.
8 See also the Annex for a derivation of this result in the context of a simple model.

WP514 The influence of monetary policy on bank profitability 7
power, deposit rates adjust more sluggishly than lending rates.9 This means that, all else equal, banks make profits when the monetary policy stance changes. In any case, these adjustments typically take place within one year and are not modelled in our econometric setup, as we use annual data.
The second form, which is more relevant, relates to accounting practices. Any interest margin on new loans also covers expected losses. But provisions in the period we examine follow the “incurred loss model”, so that, in contrast to interest rates, they are not forward-looking. As a result, extending new loans raises profitability temporarily, since losses normally materialise only a few years later,10 at which point loans also become non-performing, eroding the interest margin. This also means that if lower market rates induce more lending, they will temporarily boost net interest margins. The strength of this effect will depend on background economic conditions. For instance, it is likely to be weak precisely when interest rates are unusually low and the demand for loans anaemic.11
Beyond the level of interest rates, the slope of the yield curve should also influence net interest income. Specifically, a steeper yield curve should have a positive effect on banks’ net interest income. Part of this effect is temporary. This is because if all banks’ liabilities were at market rates, the only lasting component of the gains would be the term premium:12 over time, surprises aside, market rates would catch up with those implicit in the yield curve and hence in forward rates. This means that a negative term premium is very damaging for bank profitability. The permanent component of the effect of the yield curve on net interest income can exceed the term premium only if banks enjoy oligopolistic power in some funding segment, such as retail deposits, allowing them to charge a markdown over market rates.
Changes in the slope of the yield curve will also have quantity effects, notably influencing the volume of banks’ fixed-rate mortgages. Similarly to what is discussed above, to the extent that, on balance, the demand for mortgages is more
9 The stickiness of deposit rates with respect to monetary policy changes has been extensively
analysed (for a review, see Freixas and Rochet (1997)). Moreover, the degree of stickiness of deposit rates could be non-linear. Among the market factors that have been found to affect the responsiveness of bank deposit rates are the direction of the change in market rates (Hannan and Berger (1991)), whether the bank interest rate is above or below a target rate (Hutchison (1995); Neumark and Sharpe (1992)) and market concentration in the bank’s deposit market (Hannan and Berger (1991)). Rosen (2002) develops a model of price setting in the presence of heterogeneous customers to explain why bank deposit rates respond sluggishly to some persistent changes in money market rates but not to others. Gambacorta and Iannotti (2007) find that the interest rate adjustment in response to positive and negative shocks is asymmetrical, in that banks adjust their loan (deposit) rate faster during periods of monetary tightening (easing). Hofmann and Mizen (2004) present evidence for UK banks and building societies suggesting that the speed of adjustment of deposit and lending rates to policy rates depends on their expected future path. For a review of the main institutional factors that influence the response of bank lending rates to policy rate changes, see, among others, Borio and Fritz (1995).
10 This “seasoning effect” should be distinguished from the influence of background macroeconomic conditions, as it operates independently.
11 Such low rates will tend to prevail following banking crises and balance sheet recessions, in which debt overhangs depress the demand for additional borrowing and make it less responsive to declines in interest rates (eg Bech et al (2014), Borio (2014)).
12 The term premium reflects the returns to maturity transformation and, related to this, any interest rate risk that banks decide to incur (eg Dietrich and Wanzeried (2012)).

8 WP514 The influence of monetary policy on bank profitability
responsive (elastic) to changes in the slope than that for medium-term deposits, at some point a higher level of the slope would erode profitability.13
Impact on non-interest income
The link between interest rates and non-interest income is less clear and has received little attention. On balance, however, higher interest rates could lead to lower non-interest income and therefore offset (at least partially) the positive effects discussed so far. Three components of non-interest income are relevant: (i) valuation effects on securities; (ii) hedging through derivatives; and (iii) fees and commissions.
Other things equal, higher interest rates should generate losses on banks’ securities portfolios. The impact on the profit and loss account will depend on accounting conventions. The losses will feed directly into the income statement if the securities are marked to market (eg if they are in the trading book), will bypass it entirely and go straight into equity if they are treated as available for sale, and have an impact only when realised if the securities are treated as held to maturity. Importantly, any such effect is only temporary: it is related to the change in the interest rate and disappears once the change is over. This once-and-for-all impact contrasts with the permanent one of the various endowment effects on net interest margins.
Hedging of interest rate risk is important for banks.14 It is done largely through interest rate swaps, with valuation effects typically reported as non-interest income (Gorton and Rosen (1995)). Since, structurally, banks’ liabilities have a shorter maturity than their assets, and hence typically also shorter repricing intervals, banks tend to pay fixed rates and receive floating rates. Thus, in any given period, (unexpectedly) higher interest rates and a yield curve steepening will result in valuation gains, partly reinforcing the improvement in interest margins linked to the endowment effects on interest margins. If banks hedged completely, they could not profit from interest rate risk. In fact, hedging is only partial. Consistent with this, Esposito et al (2013) and English et al (2013) find that bank stock prices decline substantially following an unanticipated increase in the level of interest rates or a steepening of the yield curve.
Fees and commissions represent more than 60% of total non-interest income (more than 90% during the crisis period). They come in many varieties, ranging from those directly linked to lending and deposit activity (eg credit lines, transaction services) to those related to more investment-banking-type activities (eg trading, mergers and acquisitions, and market making). It is therefore hard to establish a clear link between them and the level and structure of interest rates. That said, it may be argued that, for given macroeconomic conditions, higher rates might reduce this income component. One possible channel is through the impact of interest rates on asset valuations and the search for yield: at low rates, asset prices are higher, and so typically are volumes, and the search for yield is stronger (eg
13 See the Annex for a derivation of this result. 14 We do not discuss here the hedging of exchange rate risk since gains and losses are less obviously
related to the level of interest rates.

WP514 The influence of monetary policy on bank profitability 9
Rajan (2005)). Likewise, at low rates, savers may demand more professional services to manage their portfolios (Albertazzi and Gambacorta (2009)).
There are reasons to believe that the effect of interest rates on non-interest income is also non-linear, becoming stronger at rather low levels of interest rates, ie convex. For instance, the search for yield becomes especially intense as interest rates fall well below historical norms, and, as a consequence, valuation effects associated with given basis point declines in interest rates become stronger. This, of course, assumes that these effects more than offset the valuation losses associated with the hedging of interest rate risk through derivatives.
Impact on loan loss provisions
For given macroeconomic conditions, higher interest rates and, to a lesser extent, a steeper yield curve slope should be expected to go hand in hand with higher loan losses. Moreover, at least over the sample period of our analysis, the relationship may fade at higher levels of interest rates, ie it would be concave.
Abstracting from the accounting lag in the recognition of expected losses, higher interest rates are likely to have at least two effects, which are partly offsetting. First, higher rates boost the default probability on the existing stock of variable-rate loans, by increasing debt service burdens. Second, they may induce less risk-taking on new loans through the so-called risk-taking channel (Borio and Zhu (2012)). Indeed, there is growing empirical evidence that a key way in which monetary policy is transmitted is by influencing banks’ perceptions and attitudes towards risk, ie by influencing the market price of risk (eg Altunbas et al (2013), Dell’Ariccia (2013) and Buch et al (2014)). Since the stock of variable-rate loans is bound to be considerably larger than the flow of new loans, the overall impact on provisions should be positive, depressing profitability measured per unit of loans, at least over horizons of more than one year.
The sensitivity of loan loss provisions to interest rates should be expected to be especially high at very low interest rates. This is because, given central banks’ typical reaction function, such low rates are likely to prevail following financial crises, when banks’ as well as their customers’ balance sheets are in bad shape. This can make banks especially reluctant to accept further losses and hence to “evergreen” the loans, ie “extend and pretend” (eg Barseghyan (2010)). This effect comes in addition to the lower probability of default linked to lower debt service burdens. There is considerable evidence for this mechanism, some of it going back to the post-bubble experience in Japan during the 1990s (eg Caballero et al (2008)) and some relating to the post-crisis experience in Europe (eg Albertazzi and Marchetti (2010), Enria (2013) and Bank of England (2010)).
The sensitivity of loan loss provisions could also increase at relatively high interest rates. Above a certain threshold, comparatively high rates would tip a growing fraction of borrowers into default. That said, over the sample of our empirical analysis, interest rates have exhibited a downward trend without major spikes. As a result, this effect is not really relevant. Moreover, for higher interest

10 WP514 The influence of monetary policy on bank profitability
rates as well, the demand for loans decreases and at a certain point this effect could dominate, making the relationship between provisions and interest rates concave.15
The delayed loan loss recognition implied by accounting practices can further add to the positive relationship between interest rates and loan loss provisions over the relevant interval. This occurs to the extent that lower interest rates encourage loan growth, driving down the ratio of loan loss provisions to the stock of loans.
The relationship between the slope of the yield curve and loan losses is likely to be qualitatively similar.16 For a given short-term rate, a steeper slope increases the average level of interest rates. This would at least raise debt service burdens on the stock that needs to be renewed at longer maturities
Testable hypotheses
To summarise, this analysis points to a number of testable hypotheses. Controlling for macroeconomic conditions, we should expect:
a) a positive and likely concave relationship between net interest income, on the one hand, and the level of interest rates and the yield curve slope, on the other (endowment effects, sensitivity of the volume of loans to the loan rate, lag between loan extension and defaults);
b) a negative and possibly convex relationship between the same variables and non-interest income (valuation effects and impact of the level of interest rates on fees and commissions);
c) a positive and possibly concave relationship between the same variables and loan loss provisions (impact of higher interest rates on defaults; evergreening of loans);
d) a positive, and possibly concave, relationship between the level of interest rates and the yield curve slope on overall bank profitability. To be sure, the impact is, in principle, uncertain. Higher interest rates go hand in hand with higher profits only if the impact on net interest income is stronger than that on non-interest income and provisions. But we expect this to be the case, given the importance of interest margins and the long-lasting, as opposed to transitory, impact that interest rates have on them.
15 See the Annex for a derivation of this result. 16 That said, empirically, in this case, controlling well for background macroeconomic conditions is
even more important: it is well known that a positive slope is normally associated with an expanding economy, possibly because of the anticipated central bank response. See Benati and Goodhart (2008) for a historical cross-country assessment of the predictive power of the yield spread for output growth and an assessment of different competing explanations for this stylised fact.
WP514 The influence of monetary policy on bank profitability 11
2. Empirical analysis
Data
We use bank-level data from BankScope, a commercial database maintained by Fitch and Bureau van Dijk. We consider consolidated balance sheet statements, in line with the view that an internationally active bank takes strategic decisions on its worldwide consolidated assets and liabilities. All major international banks are included. The sample covers 18 years from 1995 to 2012, a period spanning different economic cycles, a wave of consolidation, and the Great Financial Crisis. The data are annual.
We adjust the sample in a number of ways. First, we control for 159 mergers and acquisitions over the period by constructing pro forma entities at the bank holding level. This procedure obviously limits the number of banks in the sample. To ensure consistently broad coverage, we select banks by country in descending order of size so as to cover at least 80% of the domestic banking systems in the G10 countries (Belgium, Canada, France, Germany, Italy, Japan, the Netherlands, Sweden, Switzerland, the United Kingdom, and the United States) plus Austria, Australia and Spain. The merger-adjusted sample comprises a final set of 108 pro forma banks, including the acquisitions in each bank’s merger history based on 267 banks in total. The sample thus covers over 70% of worldwide bank assets as reported in The Banker Magazine for the Top 1,000 banks for end-2008. For each country, Table 1 shows the number of banks in the sample that are headquartered in each country.
Second, we control for the fact that the banks are major global firms. This requires some adjustments that would be unnecessary in a purely domestic context. The major banks run large international operations (Goodhart and Schoenmaker (2009); McCauley et al (2012)), fund themselves in several currencies (McGuire and von Peter (2009)) and are exposed to different markets. This affects their funding costs as well as the macroeconomic conditions that influence the demand for their lending. Ideally, we could control for these factors based on bank-level information. Unfortunately, such detailed information is not included in the database. As a result, we approximate it with information from the BIS International Banking Statistics, which have similar data but at the level of the aggregate of the internationally active banks from the various countries, based on the location of the banks’ headquarters (“nationality”). The broad coverage of the statistics and the concentration of international operations in a few large banks tend to mitigate any measurement error.17
We approximate funding costs based on the best estimate of the funding composition of the banks’ liabilities, weighting the monetary policy indicators – ie the policy rate, the long-term rate and therefore also the yield curve slope – correspondingly. The weighting can make a large difference. For example, while US banks are mostly funded in US dollars, over half of Swiss bank liabilities are in that currency – less than one quarter is in Swiss francs (Table 1, column 11). As a result, for these banks, US dollar funding conditions are more important than those in the domestic currency. As a result of this weighting, each bank in our sample faces
17 Indeed, extensive cross-currency funding among European banks led to the US dollar shortage at
the height of the crisis (McGuire and von Peter (2009)).
12 WP514 The influence of monetary policy on bank profitability
different monetary conditions, as captured by the weighted policy rate and yield curve slope. And this translates into different monetary conditions for the individual countries’ banking sectors as a whole (Table 1, sixth and seventh columns). The average of the weighted level of the short-term rates in the individual jurisdictions ranges from 1.08–6.48%, while the average yield curve slope varies from 0.65–1.90%.
Figure 2 shows the average of the weighted short- and long-term interest rates and the corresponding yield spread across all banks. The chart reveals that short- and long-term interest rates have been trending down over the sample period, reaching record low levels of 0.75% and 2.5% in 2012, the last observation in our sample period. The yield spread (yield curve slope) fluctuated between 0 and 2% until 2009, when it rose above 2% before falling back below it in 2012. The persistently low rates have resulted in unusually accommodative monetary conditions for a substantial part of the sample. In one fifth of the observations, the short-term real interest rate has been negative, with a remarkable difference across banks (38% for Spanish banks, 0% for Australian banks).
Similar to the construction of liability-weighted funding cost measures, we construct bank-specific proxies of aggregate demand conditions by using the composition of the banks’ assets (domestic vs foreign claims). More specifically, we weight the country macroeconomic indicators based on the location of banks’ assets. As macroeconomic indicators, we focus on the growth rates of nominal GDP, stock market indices and house prices. Table 1 (columns 8, 9, and 10) provides the average of the weighted level of the three demand indicators across banks for individual jurisdictions. Figure 3 shows the estimated distribution across individual banks of the three bank-specific macroeconomic indicators in the sample (median and quartiles). As expected, there is considerable variation across banks.
Figure 4 reports the distribution of the main profit and loss components over the whole sample;18 Table 1 reports the main cross-country differences. Despite the convergence in bank profitability since the mid-1990s, especially among euro area countries, differences in ROA are still sizeable. Over the period 1995–2012, the average ROA ranges from a minimum of around 0.1–0.3% for Austrian, German and Japanese banks to a maximum of 1.6% for US banks. The degree of activity diversification, as measured by the ratio of non-interest to total income, varies from 30% in Austria, Italy and Spain to 70% in Switzerland (see also Gambacorta, Yang and Scatigna (2014)). And the ratio of provisions to total assets also varies widely, with the maximum – 1.0% for Japanese banks – five times bigger than the minimum – 0.2% for Belgian, Dutch and German banks.
Econometric framework
Indexing individual banks with k, countries where banks are headquartered with j and years with t, we carry out the econometric analysis using the following benchmark model:
18 These differences could be due at least in part to different accounting standards. Most countries
(except Canada, Japan and the United States) changed accounting standards from local Generally Accepted Accounting Practices (GAAP) to International Financial Reporting Standards (IFRS) in 2005–06.

WP514 The influence of monetary policy on bank profitability 13
𝑌𝑌𝑘𝑘,𝑗𝑗,𝑡𝑡 = 𝛿𝛿𝑌𝑌𝑘𝑘,𝑗𝑗,𝑡𝑡−1 + 𝛼𝛼0𝑟𝑟𝑗𝑗,𝑡𝑡 + 𝛼𝛼1𝑟𝑟𝑗𝑗,𝑡𝑡2 + 𝛽𝛽0𝜃𝜃𝑗𝑗,𝑡𝑡 + 𝛽𝛽1𝜃𝜃𝑗𝑗,𝑡𝑡
2 + 𝛾𝛾𝜎𝜎𝑗𝑗,𝑡𝑡 +
𝛷𝛷′𝐶𝐶𝑘𝑘,𝑗𝑗,𝑡𝑡+𝛹𝛹′𝑋𝑋𝑘𝑘,𝑗𝑗,𝑡𝑡−1+𝜗𝜗𝑘𝑘 + 𝑐𝑐𝑟𝑟𝑐𝑐𝑐𝑐𝑐𝑐𝑐𝑐 + 𝜀𝜀𝑘𝑘,𝑗𝑗,𝑡𝑡 (1)
where 𝑌𝑌 is the relevant income component (net interest income, other non-interest income, provisions,19 and pre-tax profit) as a ratio of total assets.20 The monetary policy indicators are the three-month interbank rate ( 𝑟𝑟 ), and the slope of the yield curve ( 𝜃𝜃 ), ie the difference between the 10-year government bond yield and 𝑟𝑟. These indicators enter the equation also in quadratic form, in line with the discussion in Section 1 and also with the simple theoretical model described in the Annex.21 The yield curve slope allows us to control for the effects of unconventional monetary policy. As discussed in the previous section, all monetary policy measures are weighted averages across the jurisdictions in which each bank gets funding.
We use several control variables. The macroeconomic indicators in the vector C (the growth rate of nominal GDP, stock market indices and house prices) have been weighted based on banks’ exposures to different countries. We also include the coefficient of variation of the three-month interbank rate ( σ ) in order to capture perceived uncertainty about financial conditions. A dummy crisis takes the value of 1 in the period 2008–12.
In order to take into account bank characteristics, we include a set of bank-fixed effects ( kϑ ) and a vector of (time-varying) bank-specific indicators ( )X . The latter are crucial in order to control for loan supply and loan demand factors. Our strategy, in line with the bank-lending channel literature, relies on the hypothesis that certain bank-specific characteristics (eg size, liquidity, short-term funding, cost-to-income ratio and capitalisation) only influence the loan supply. Broadly speaking, this approach assumes that banks differ in their ability to shield themselves from shocks. For instance, it assumes that they differ in the extent to which, following monetary tightening, they can prevent a contraction in their loans or experience a drop in the availability of total deposits. In particular, small and less capitalised banks, which are penalised by markets (ie are more subject to a variety of “informational frictions”), face a higher cost in raising non-secured deposits and may therefore have to cut their lending more substantially. Similarly, illiquid banks have less room to shield their customers by drawing down cash and securities. Other relevant variables include the composition of banks’ funding sources and their sensitivity to market rates.
Taking into account the above considerations, our vector X contains (i) bank size (the natural logarithm of total assets (Kashyap and Stein (1995), (2000))); (ii) bank leverage (equity-to-total assets ratio (Kishan and Opiela (2000); Adrian and Shin (2010))); (iii) bank liquidity (the liquidity-to-total assets ratio (Stein (1998)); (iv) the share of short-term liabilities (Gambacorta and Marques (2011)); (v) the cost-to-income ratio; and (vi) asset volatility (the standard deviation of the annual
19 Loan loss provisions account for 84% of total provisions. 20 The analysis of the pre-tax profits is preferable in order to exclude possible effects due to different
taxation regimes (Albertazzi and Gambacorta (2010)). 21 There are two main differences between the econometric model (1) and the theoretical model. First,
all income statement components are divided by total assets to have stationary variables. Second, we have introduced a lagged dependent variable to mitigate the problem of the possible omission of some relevant variables.

14 WP514 The influence of monetary policy on bank profitability
percentage change in the market value of a firm's assets, from Moody’s (Gropp and Heider (2010))).
One possible identification problem is endogeneity. Bank profitability could have an impact on the balance sheet items listed above as well as on monetary policy decisions. We address this potential problem in two ways. First, we lag all bank-specific characteristics by one period. Second, we use the dynamic System Generalized Method of Moments (S-GMM) panel methodology, which should yield consistent and unbiased estimates. This methodology reduces endogeneity bias and takes into account the heterogeneity in the data caused by unobservable factors affecting individual banks. We use the instruments suggested in Blundell and Bond (1998): exogenous variables, transformed in first differences, are instrumented by themselves; endogenous variables (also transformed in first differences), by their lags in levels.22
In addition, other considerations suggest that the endogeneity problem may not be as serious owing to the characteristics of our sample. While aggregate banking conditions could influence monetary policy, the profitability of any given bank is less likely to affect central bank decisions. In addition, the fact that banks operate in several jurisdictions, and need not be that large in several of them, reduces this risk further. For example, we can presume that the conditions of the Swiss banking industry are important for macroeconomic conditions in Switzerland but that they do not influence the US economy in the same way.
Results
We consider next, sequentially, the main findings concerning the impact of interest rates on net interest income, non-interest income, loan loss provisions and ROA.
Net interest income
In line with the analytical discussion, net interest income is positively correlated with the level of the short-term rate and the yield curve slope. Moreover, the relationship between net interest income and interest rates is concave.
The first column of Table 2 reports the estimated coefficients for the equation for net interest income ( NII , the difference between interest received on lending and that paid on funding, divided by total assets). The total effect of the money market rate, 𝑟𝑟, on banks’ net interest income is positive. And the quadratic term is negative, indicating that the functional relationship is concave. This means, in particular, that changes in 𝑟𝑟 have a larger impact when it is close to zero.
More generally, panel (a) of Figure 5 gives a graphical interpretation of the estimated partial derivative 𝜕𝜕𝜕𝜕𝜕𝜕𝜕𝜕
𝜕𝜕𝜕𝜕. This is always positive but decreasing in 𝑟𝑟. For
example, monetary policy tightening that brings the short-term rate from 0% to 1% gives rise to an increase in net interest income over total assets of 0.5 percentage points over one year, while the effect is only 0.2 percentage points if the short-term
22 This approach is commonly applied to deal with possible endogeneity biases. For instance, Blundell
and Bond (1998) use it to estimate a labour demand model while Beck et al (2000) apply it to investigate the relationship between financial development and economic growth. For an application to the analysis of the bank lending channel, see Altunbas et al (2009).

WP514 The influence of monetary policy on bank profitability 15
rate increases from 6% to 7%. It is interesting to note that for high interest rate levels (greater than 8%), the derivative is not statistically different from zero, as indicated by the shaded area.
The impact of the slope of the yield curve is in general also positive and decreasing in the steepness of the slope (see panel (a) of Figure 6). An increase in the yield curve slope initially boosts net interest income but the impact declines and tends to become not statistically different from zero when 𝜃𝜃 > 2.5. An increase of the slope from -2 percentage points to -1 percentage point boosts the net interest income-to-total assets ratio by 0.2 percentage points over one year, but by only 0.07 percentage points if the slope increases from 1 percentage point to 2 percentage points.23
Non-interest income
The results for non-interest income are also broadly consistent with the previous analysis. Results indicate that an increase in the level of interest rates has a negative impact on non-interest income, therefore offsetting (at least partially) the positive effect on net interest income. The relationship between non-interest income and the interest rate structure is convex.
The detailed results are reported in the second column of Table 2. The relationship between non-interest rate income and the interest rate structure is convex with respect to both the short-term rate (see Figure 5 panel (b)) and the yield curve slope (Figure 6 panel (b)).24 For example, an increase in the short-term rate from 0% to 1% leads to a drop in non-interest income over total assets of 0.7 percentage points over one year, while the reduction is 0.25 percentage points if the short-term rate increases from 6% to 7%. Similarly, an increase in the slope from -2 percentage points to -1 percentage point reduces the non-interest income-to-total assets ratio by 1.6 percentage points, while the reduction is only 0.4 percentage points if the slope increases from 1 percentage point to 2 percentage points.
23 The effect of interest rate volatility on net interest income is positive and statistically significant.
This might reflect the possibility that the reduction in lending volumes associated with greater uncertainty in the credit market is more than compensated for by the higher margin that banks demand to compensate for higher risk (Ho and Saunders (1981), Angbazo (1997), Maudos and de Guevara (2004)). Among the bank-specific characteristics, the leverage ratio is significant: well capitalised banks have higher net interest income. This is consistent with the existence of a “capital endowment” effect. The positive impact of capitalisation on net interest income is also in line with McShane and Sharpe (1985), who suggest that bank capitalisation, as captured by the equity-to-assets ratio, is a good proxy for bank risk aversion and that banks that are more risk-averse require higher margins to cover the higher cost of equity financing compared to debt financing. As for the coefficients on the macroeconomic controls, house price growth and stock market growth are positively and significantly correlated with net interest income, indicating a positive effect of the value of collateral on lending. The weak correlation with GDP growth, controlling for the positive effects on demand via collateral, could depend upon a self-financing effect via firms’ profits that reduces, other things equal, the proportion of bank debt (Friedman and Kuttner (1993)).
24 As for bank-specific characteristics, only the liquidity ratio has a positive and significant impact on non-interest income, probably indicating the relative importance of securities holdings. Non-interest income is positively correlated with growth in stock and house prices. The lack of a statistically significant relationship with GDP growth may reflect a low sensitivity to it of a range of bank services (eg cash management, safekeeping, securities brokerage and mutual fund sales). The coefficient for volatility is significant and positive, which is reasonable: high volatility often coincides with large transaction volumes (for example, the demand for financial derivatives, used for hedging purposes, increases with volatility).

16 WP514 The influence of monetary policy on bank profitability
Provisions
As expected, provisions are positively correlated with the interest rate structure and the relationship is concave.
Detailed results for provisions are reported in the third column of Table 2. Bank provisions are a positive function of the level of the money market rate only up to a given threshold (see panel (c) in Figure 5). For example, an increase in the money market rate from 0% to 1% boosts provisions over total assets by 1.5 percentage points over one year, while the increase is only 0.3 percentage points if the short-term rate increases from 6% to 7%. Very similar results apply to the impact of the yield curve slope (see panel (c) in Figure 6). For a given short-term rate, a steeper yield curve translates into higher rates on medium- and long-term loan contracts, such as mortgages. The effect becomes statistically insignificant for values of the slope exceeding 2 percentage points.
Return on assets
On balance, higher interest rates boost overall bank profitability. This means that the positive effect on net interest income more than offsets the negative effects on non-interest income and provisions. Moreover, the relationship between bank profitability and the interest rate structure is concave (both for the level of the interest rate and the yield curve slope).
In the final column of Table 2, we report the results for the return on assets (ROA). Again, the impact of interest rates fades as they rise, eventually becoming not statistically significant. For example, monetary policy tightening that brings the short-term rate from 0% to 1% raises the ROA by 0.4 percentage points over one year, while the effect is only 0.15 percentage points if the short-term rate increases from 6% to 7% (see panel (d) in Figure 5). The impact that we find for low levels of the interest rate is significantly greater than that estimated by standard linear models. For example, Alessandri and Nelson (2015) find that the ROA increases by around 0.2 percentage points in the event of a 1% increase in the market rate. And for Genay and Podjasek (2014), the impact is even lower (0.1 percentage points).
An increase in the slope of the yield curve from -2 percentage points to -1 percentage point raises the ROA by 1.2 percentage points over one year, while the effect is 0.6 percentage points if the slope goes from 1 percentage point to 2 percentage points (see panel (d) in Figure 6). In this case, too, our estimates are significantly higher than those obtained by studies using standard linear empirical models (0.1–0.7 percentage points): that said, comparisons are harder, given the different slope measures used in the literature.
Conclusion
This paper studies the link between monetary policy and bank profitability through a non-linear approach. Using a data set covering 109 large international banks headquartered in 14 advanced economies for the period 1995–2012, we consider the impact of changes in the interest rate structure (level of the short-term rate and yield curve slope) on all main income statement components – net interest income, non-interest income and bank loss provisions – as well as on overall profitability, measured by ROA. We control for both macroeconomic conditions and typical
WP514 The influence of monetary policy on bank profitability 17
bank-specific characteristics. As the banks analysed run large international operations, across countries and currencies, we adjust for these factors. In the absence of detailed bank-level data on these characteristics, we rely on the BIS International Banking Statistics, which provide data at the level of banking systems, to construct approximate bank-specific monetary policy indicators, covering both funding currencies and macroeconomic conditions.
We find that the correlation between the level of interest rates and the steepness of the yield curve, on the one hand, and ROA, on the other, is positive: higher rates and a steeper yield curve boost profitability. This reflects two contrasting forces. On the one hand, higher short-term interest rates and a steeper yield curve increase banks’ net interest income, as they raise bank interest margins and returns from maturity transformation, respectively. On the other hand, higher interest rates increase loan loss provisions, consistent with their impact on debt service costs and default probabilities, and decrease non-interest income, because of their negative impact on securities’ valuations. Thus, the effect on net interest income more than offsets that on non-interest income and provisions.
We also find significant non-linearities in the link between the interest rate structure and bank profitability. This reflects, among other things, a reduction of the “deposit endowment effect” on bank profitability when interest rates are low: as the deposit rate cannot fall below zero, at least to any significant extent, the markdown (the difference between the market rate and the deposit rate) is compressed when the policy rate is reduced to very low levels. Non-linear effects are also found for the relationship between bank profitability and the slope of the yield curve, likely reflecting non-linearities arising from demand for long-term loans and bank services, and from provisions. The result holds controlling for different business cycle conditions and bank-specific characteristics such as size, liquidity, capitalisation and incidence of market funding.
These findings have implications for the possible unintended side effects of unusually accommodative monetary policy, designed to keep both short-term and long-term rates very low for very long periods. For given macroeconomic conditions, bank profitability tends to suffer from unusually low, possibly zero or lightly negative, short-term interest rates, combined with a very flat yield curve, possibly alongside negative term premia. Moreover, under those conditions, some of the profitability may be artificially high, such as that owing to evergreening practices. And it is also likely to be temporary, as valuation gains only have a one-off impact on profitability. That is, valuation gains dissipate, but lower interest margins stay.
Abstracting from macroeconomic effects, our findings help shed light on the impact of monetary policy on bank profitability after the crisis. Taking our results at face value, we find that the impact, on balance, was positive in the first two years post-crisis (2009–10) but turned negative in the following four years (2011–14). In the first two years, ROA was boosted by an estimated cumulative 0.3 percentage points: the negative effect on bank profitability linked to the decrease in the short-term rate was more than compensated for by the positive one deriving from the increase in the yield curve slope. In contrast, in the following four years, the further decrease in short-term rates and flattening of the yield curve cut ROA by an estimated cumulative 0.6 percentage points. With an average annual ROA of 0.64 over the sample period (1995-2012, Table 1), this means that over 2011–14, the

18 WP514 The influence of monetary policy on bank profitability
average bank in the sample lost one year of profits as a consequence of low interest rates and compressed yield spreads.
Of course, the overall effect of monetary policy on bank profits will also depend on the impact of monetary policy on macroeconomic conditions. In particular, it will crucially hinge on the efficacy of monetary policy in boosting aggregate demand at the zero lower bound and in adverse balance sheet conditions. Both factors would tend to undermine its effectiveness (see eg Bouis et al (2013), Borio (2014), Bank for International Settlements (2014)). Assessing this point is, however, beyond the scope of this paper.
WP514 The influence of monetary policy on bank profitability 19
Annex: A simple illustrative theoretical model
This Annex presents an adapted version of the Monti-Klein (MK) model for the case of oligopolistic competition between N banks. The purpose is mainly to give a possible set of micro-foundations to the regressions used to help discipline our econometric analysis and fix ideas. That said, of course, the model necessarily omits a number of considerations relevant for the interpretation of the results, as discussed further in the main text.
Our illustrative model differs from the standard MK model in two respects: (i) the introduction of the marginal cost of maturity transformation and minimum capital requirements; (ii) the inclusion of a stylised equation for loan loss provisions. The model incorporates the case of monopoly (N=1) and perfect competition (N=∞).
Relative to the discussion in the main text, we make two important simplifications. First, we assume that banks perform only traditional intermediation activity, ie we exclude other forms of revenues, such as trading income and fee from services. Second, we include the cost for derivative hedging directly in the net interest margin.
The demand for loans is described by the inverse demand function 𝑙𝑙 = 𝑙𝑙(𝐿𝐿). It represents the amount of loans borrowers are willing to demand (𝐿𝐿) at a given loan interest rate (𝑙𝑙). The partial derivative 𝑙𝑙𝐿𝐿′ (𝐿𝐿) is negative: a higher lending rate reduces loan demand. As a mirror image, the inverse supply of deposits is given by the function 𝑑𝑑 = 𝑑𝑑(𝐷𝐷): the volume of deposits 𝐷𝐷, increases with the rate paid on them (𝑑𝑑), ie the partial derivative 𝑑𝑑𝐷𝐷′ (𝐷𝐷) is positive. As deposits provide also payment services, we assume that deposits are not very responsive to the deposit rate, ie the banking sector has considerable oligopolistic power over retail deposits – 𝑑𝑑𝐷𝐷′ (𝐷𝐷) is not particularly high.
The cost function of the N identical banks is assumed to be linear and separable (ie, there are no joint costs in the production of loans and deposits):
𝐶𝐶𝑗𝑗 = 𝛾𝛾𝐹𝐹 + 𝛾𝛾𝐿𝐿𝐿𝐿𝑗𝑗 + 𝛾𝛾𝐷𝐷𝐷𝐷𝑗𝑗 (A1)
where 𝐿𝐿𝑗𝑗 and 𝐷𝐷𝑗𝑗 are the quantities of loans and deposits for bank j, with j=1,...,N, while 𝛾𝛾𝐹𝐹 , 𝛾𝛾𝐿𝐿 and 𝛾𝛾𝐷𝐷 are positive parameters.
Banks can borrow (or lend) on a competitive market at the exogenous money market rate r. One can think of that market as combining interbank claims as well as other securities (eg, banks’ own debt and government and corporate securities). Because they are assumed to be perfect substitutes, the model only determines the net amount in banks’ balance sheet, 𝑀𝑀.25 This market sets the exogenous marginal cost and marginal revenue that ultimately determines the volume of deposits and loans, net of production costs. It may be best to think of it as the money market.
We also assume that, all else equal, banks face a structural maturity (strictly speaking, pricing) mismatch between loans and deposits. This exposes banks to interest rate risk. Banks can reduce this risk by hedging through derivatives, but at a
25 This also means that we assume away any maturity mismatch in this part of the portfolio (see
below).
20 WP514 The influence of monetary policy on bank profitability
cost. For simplicity, we simply assume that the cost 𝜓𝜓(𝜃𝜃)𝐿𝐿𝑗𝑗 ≥ 0 depends positively on the slope of the yield curve (𝜓𝜓𝜃𝜃′ ≥ 0). As long as the interest rate on deposits is not a market rate, it is reasonable to assume that the incentive to engage in maturity transformation increases with the slope of the yield curve, as opposed to the term premium per se. If loans are only short-term and there is no maturity mismatch, then (𝜓𝜓(𝜃𝜃) = 0) and we come back to the standard MK model. Thus, bank’s net interest income is given by:
𝑁𝑁𝑁𝑁𝑁𝑁𝑗𝑗 = (𝑙𝑙 − 𝜓𝜓(𝜃𝜃))𝐿𝐿𝑗𝑗 + 𝑟𝑟𝑀𝑀𝑗𝑗 − 𝑑𝑑𝐷𝐷𝑗𝑗 (A2)
For simplicity, we assume that bank capital 𝐾𝐾𝑗𝑗 is equal to a minimum capital requirement and that this is a function of loans, as opposed to portfolio size. This can be justified if it is assumed that the requirements are risk-weighted, any securities held have zero risk weight ratio and derivatives are excluded. This assumption, in fact, is quite common in the literature and serves to simplify the analysis (eg, Bolton and Freixas, 2006). We thus assume that the amount of equity is a given fraction 0< 𝜌𝜌 <1 of loans:
𝐾𝐾𝑗𝑗 = 𝜌𝜌𝐿𝐿𝑗𝑗 (A3)
Loan loss provisions (𝑃𝑃𝑗𝑗) are assumed to be a fraction 𝜇𝜇 of loans. This fraction, in turn, depends on the borrowers’ probability of default, which is assumed to rise with the average level of interest rates, ie with both the market rate and the yield curve slope. We thus have:
𝑃𝑃𝑗𝑗 = 𝜇𝜇(𝑟𝑟,𝜃𝜃)𝐿𝐿𝑗𝑗 (A4)
where 𝜇𝜇𝜕𝜕′ ≥ 0 and 𝜇𝜇𝜃𝜃′ ≥ 0. If the bank engages in no maturity transformation activity the derivative 𝜇𝜇𝜃𝜃′ is equal to zero. Note that, since the model is static, we assume that provisions are incurred as soon as the loan is granted.
The balance sheet for bank j is thus given by:
𝑅𝑅𝑗𝑗 + 𝐿𝐿𝑗𝑗 + 𝑀𝑀𝑗𝑗 = 𝐷𝐷𝑗𝑗 + 𝐾𝐾𝑗𝑗 (A5)
where 𝑅𝑅𝑗𝑗 = 𝛼𝛼𝐷𝐷𝑗𝑗 represent the reserve requirements, with 𝛼𝛼 > 0.
The bank decides the level for 𝐿𝐿 and 𝐷𝐷 by maximising profits:
𝜋𝜋𝑗𝑗 = 𝑁𝑁𝑁𝑁𝑁𝑁𝑗𝑗 − 𝐶𝐶𝑗𝑗 − 𝑃𝑃𝑗𝑗 (A6)
subject to constraints (A3)-(A5). Rearranging the terms, the maximisation problem can be written as:
𝜋𝜋𝑗𝑗 = �𝑙𝑙�𝐿𝐿𝑗𝑗 + 𝐿𝐿−𝑗𝑗� − 𝜏𝜏�𝐿𝐿𝑗𝑗 − [𝑑𝑑�𝐷𝐷𝑗𝑗 + 𝐷𝐷−𝑗𝑗� − 𝜔𝜔]𝐷𝐷𝑗𝑗𝐿𝐿𝑗𝑗,𝐷𝐷𝑗𝑗𝑚𝑚𝑚𝑚𝑚𝑚 (A7)
where 𝐿𝐿𝑗𝑗 = ∑ 𝐿𝐿ℎ𝜕𝜕ℎ=1,ℎ≠𝑗𝑗 , 𝐷𝐷𝑗𝑗 = ∑ 𝐷𝐷ℎ𝜕𝜕
ℎ=1,ℎ≠𝑗𝑗 , 𝜏𝜏 = (1 − 𝜌𝜌)𝑟𝑟 + 𝜇𝜇(𝑟𝑟,𝜃𝜃) + ψ(θ) + 𝛾𝛾𝐿𝐿 > 0 and 𝜔𝜔 = (1 − 𝛼𝛼)𝑟𝑟 − 𝛾𝛾𝐷𝐷.
As costs are additive, a standard result is that the bank’s decision problem is separable: the optimal deposit rate, and hence the deposit volume, is independent of the characteristics of the loan market, and the optimal loan rate, and hence the loan volume, is independent of the characteristics of the deposit market. The effect of 𝑟𝑟 on both the market for loans and that of deposits are derived from the first order conditions and from the assumption of symmetric equilibrium:
𝑙𝑙(𝐿𝐿∗) = 𝜏𝜏
1− 1𝑁𝑁𝜀𝜀𝐿𝐿(𝐿𝐿∗)
𝑑𝑑(𝐷𝐷∗) = 𝜔𝜔
1+ 1𝑁𝑁𝜀𝜀𝐷𝐷(𝐷𝐷∗)
(A8)
WP514 The influence of monetary policy on bank profitability 21
where 𝜀𝜀𝐿𝐿(𝐿𝐿∗) and 𝜀𝜀𝐷𝐷(𝐷𝐷∗) are two positive quantities denoting the coefficients of elasticity of the demand function of loans and supply of deposits, respectively.26
An assumption that greatly simplifies the notation and has no qualitative impact on the results of interest is that loans and deposit functions have a constant elasticity, 𝜀𝜀𝐿𝐿(𝐿𝐿∗) = 𝜀𝜀𝐿𝐿 and 𝜀𝜀𝐷𝐷(𝐷𝐷∗) = 𝜀𝜀𝐷𝐷. With this assumption, by applying the implicit function theorem to equations (A8), we obtain:
𝜕𝜕𝐿𝐿∗
𝜕𝜕𝜕𝜕= 1−𝜌𝜌+𝜇𝜇𝑟𝑟′
𝑙𝑙𝐿𝐿′ (𝐿𝐿∗)(1− 1
𝑁𝑁𝜀𝜀𝐿𝐿)
< 0
𝜕𝜕𝐷𝐷∗
𝜕𝜕𝜕𝜕= 1−𝛼𝛼
𝑑𝑑𝐷𝐷′ (𝐷𝐷∗)(1+ 1
𝑁𝑁𝜀𝜀𝐷𝐷)
> 0 (A9)
If the loan demand elasticity (𝜀𝜀𝐿𝐿) is greater than 1𝜕𝜕 the first derivative is negative
because for higher values of the lending rate the aggregate volume of loans declines (𝑙𝑙𝐿𝐿′ (𝐿𝐿∗) < 0). The condition 𝜀𝜀𝐿𝐿 > 1
𝜕𝜕 can be easily satisfied if the degree of
competition (captured by the number of banks 𝑁𝑁) is sufficiently high. The second derivative is positive: for higher 𝑑𝑑 the supply of deposits increases (𝑑𝑑𝐷𝐷′ (𝐷𝐷∗) > 0). Naturally, if the supply of deposit is inelastic with respect to the deposit rate (𝜀𝜀𝐷𝐷 ≈0), the responsiveness of deposits to market rates becomes low (𝜕𝜕𝐷𝐷
∗
𝜕𝜕𝜕𝜕≈ 0). We can
also evaluate the analogous effects of changes in the slope on the equilibrium levels of loans and deposits.
𝜕𝜕𝐿𝐿∗
𝜕𝜕𝜃𝜃= 𝜓𝜓𝜃𝜃
′ +𝜇𝜇𝜃𝜃′
𝑙𝑙𝐿𝐿′ (𝐿𝐿∗)(1− 1
𝑁𝑁𝜀𝜀𝐿𝐿)
< 0
𝜕𝜕𝐷𝐷∗
𝜕𝜕𝜃𝜃= 0
(A10)
Similarly to what discussed before, under the condition 𝜀𝜀𝐿𝐿 > 1𝜕𝜕
, the first derivative is negative. The equilibrium volume of loans as a function of the yield curve slope depends on the extent to which banks engage in maturity transformation: if it is negligible (𝜓𝜓𝜃𝜃′ = 𝜇𝜇𝜃𝜃′ = 0), the optimal amount of loans will be independent of changes in the yield curve. This could happen, for example, if banks had only short-term loans (strictly speaking, if loan rate re-pricing intervals resulted in no interest rate risk). By contrast, given the assumption that the cost of hedging is a function of L and the cost function (A1) is separable, the yield curve slope, 𝜃𝜃, does not affect the equilibrium volume of deposits.
The effect of changes in the monetary policy rate – here assumed to be equal to the market rate, 𝑟𝑟 – and in the yield curve slope, 𝜃𝜃, on the equilibrium loan and deposit rates is given by the following equations:
𝜕𝜕𝑙𝑙(𝐿𝐿∗)𝜕𝜕𝜕𝜕
= 1−𝜌𝜌+𝜇𝜇𝑟𝑟′
(1− 1𝑁𝑁𝜀𝜀𝐿𝐿
)> 0
𝜕𝜕𝑑𝑑(𝐷𝐷∗)𝜕𝜕𝜕𝜕
= 1−𝛼𝛼
(1+ 1𝑁𝑁𝜀𝜀𝐷𝐷
)> 0
𝜕𝜕𝑙𝑙(𝐿𝐿∗)𝜕𝜕𝜃𝜃
= 𝜓𝜓𝜃𝜃′ +𝜇𝜇𝜃𝜃
′
(1− 1𝑁𝑁𝜀𝜀𝐿𝐿
)> 0
𝜕𝜕𝑑𝑑(𝐷𝐷∗)𝜕𝜕𝜃𝜃
= 0 (A11)
26 In symbols: 𝜀𝜀𝐿𝐿(𝐿𝐿∗, 𝑟𝑟) = −𝜕𝜕𝐿𝐿
𝜕𝜕𝑙𝑙𝑙𝑙𝐿𝐿 and 𝜀𝜀𝐷𝐷(𝐷𝐷∗, 𝑟𝑟) = 𝜕𝜕𝐷𝐷
𝜕𝜕𝑑𝑑𝑑𝑑𝐷𝐷
. Second order conditions are satisfied.
22 WP514 The influence of monetary policy on bank profitability
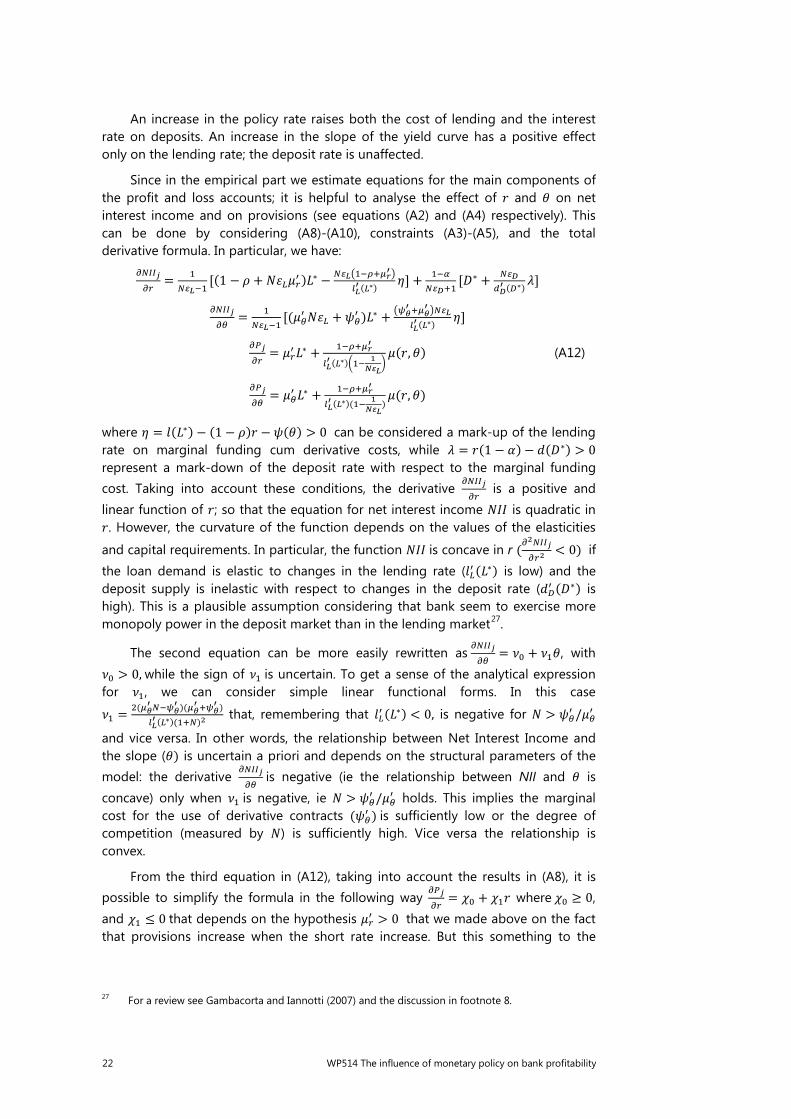
An increase in the policy rate raises both the cost of lending and the interest rate on deposits. An increase in the slope of the yield curve has a positive effect only on the lending rate; the deposit rate is unaffected.
Since in the empirical part we estimate equations for the main components of the profit and loss accounts; it is helpful to analyse the effect of 𝑟𝑟 and 𝜃𝜃 on net interest income and on provisions (see equations (A2) and (A4) respectively). This can be done by considering (A8)-(A10), constraints (A3)-(A5), and the total derivative formula. In particular, we have:
𝜕𝜕𝜕𝜕𝜕𝜕𝜕𝜕𝑗𝑗𝜕𝜕𝜕𝜕
= 1𝜕𝜕𝜀𝜀𝐿𝐿−1
[(1 − 𝜌𝜌 + 𝑁𝑁𝜀𝜀𝐿𝐿𝜇𝜇𝜕𝜕′ )𝐿𝐿∗ − 𝜕𝜕𝜀𝜀𝐿𝐿�1−𝜌𝜌+𝜇𝜇𝑟𝑟′�𝑙𝑙𝐿𝐿′ (𝐿𝐿∗)
𝜂𝜂] + 1−𝛼𝛼𝜕𝜕𝜀𝜀𝐷𝐷+1
[𝐷𝐷∗ + 𝜕𝜕𝜀𝜀𝐷𝐷𝑑𝑑𝐷𝐷′ (𝐷𝐷∗)
𝜆𝜆]
𝜕𝜕𝜕𝜕𝜕𝜕𝜕𝜕𝑗𝑗𝜕𝜕𝜃𝜃
= 1𝜕𝜕𝜀𝜀𝐿𝐿−1
[(𝜇𝜇𝜃𝜃′ 𝑁𝑁𝜀𝜀𝐿𝐿 + 𝜓𝜓𝜃𝜃′ )𝐿𝐿∗ + �𝜓𝜓𝜃𝜃′ +𝜇𝜇𝜃𝜃
′ �𝜕𝜕𝜀𝜀𝐿𝐿𝑙𝑙𝐿𝐿′ (𝐿𝐿∗)
𝜂𝜂]
𝜕𝜕𝑃𝑃𝑗𝑗𝜕𝜕𝜕𝜕
= 𝜇𝜇𝜕𝜕′ 𝐿𝐿∗ + 1−𝜌𝜌+𝜇𝜇𝑟𝑟′
𝑙𝑙𝐿𝐿′ (𝐿𝐿∗)�1− 1
𝑁𝑁𝜀𝜀𝐿𝐿�𝜇𝜇(𝑟𝑟,𝜃𝜃) (A12)
𝜕𝜕𝑃𝑃𝑗𝑗𝜕𝜕𝜃𝜃
= 𝜇𝜇𝜃𝜃′ 𝐿𝐿∗ + 1−𝜌𝜌+𝜇𝜇𝑟𝑟′
𝑙𝑙𝐿𝐿′ (𝐿𝐿∗)(1− 1
𝑁𝑁𝜀𝜀𝐿𝐿)𝜇𝜇(𝑟𝑟,𝜃𝜃)
where 𝜂𝜂 = 𝑙𝑙(𝐿𝐿∗) − (1 − 𝜌𝜌)𝑟𝑟 − 𝜓𝜓(𝜃𝜃) > 0 can be considered a mark-up of the lending rate on marginal funding cum derivative costs, while 𝜆𝜆 = 𝑟𝑟(1 − 𝛼𝛼) − 𝑑𝑑(𝐷𝐷∗) > 0 represent a mark-down of the deposit rate with respect to the marginal funding cost. Taking into account these conditions, the derivative
𝜕𝜕𝜕𝜕𝜕𝜕𝜕𝜕𝑗𝑗𝜕𝜕𝜕𝜕
is a positive and linear function of 𝑟𝑟; so that the equation for net interest income 𝑁𝑁𝑁𝑁𝑁𝑁 is quadratic in 𝑟𝑟. However, the curvature of the function depends on the values of the elasticities
and capital requirements. In particular, the function 𝑁𝑁𝑁𝑁𝑁𝑁 is concave in r (𝜕𝜕2𝜕𝜕𝜕𝜕𝜕𝜕𝑗𝑗𝜕𝜕𝜕𝜕2
< 0) if the loan demand is elastic to changes in the lending rate (𝑙𝑙𝐿𝐿′ (𝐿𝐿∗) is low) and the deposit supply is inelastic with respect to changes in the deposit rate (𝑑𝑑𝐷𝐷′ (𝐷𝐷∗) is high). This is a plausible assumption considering that bank seem to exercise more monopoly power in the deposit market than in the lending market27.
The second equation can be more easily rewritten as 𝜕𝜕𝜕𝜕𝜕𝜕𝜕𝜕𝑗𝑗𝜕𝜕𝜃𝜃
= 𝜈𝜈0 + 𝜈𝜈1𝜃𝜃, with 𝜈𝜈0 > 0, while the sign of 𝜈𝜈1 is uncertain. To get a sense of the analytical expression for 𝜈𝜈1, we can consider simple linear functional forms. In this case
𝜈𝜈1 = 2(𝜇𝜇𝜃𝜃′ 𝜕𝜕−𝜓𝜓𝜃𝜃
′ )(𝜇𝜇𝜃𝜃′ +𝜓𝜓𝜃𝜃
′ )𝑙𝑙𝐿𝐿′ (𝐿𝐿∗)(1+𝜕𝜕)2
that, remembering that 𝑙𝑙𝐿𝐿′ (𝐿𝐿∗) < 0, is negative for 𝑁𝑁 > 𝜓𝜓𝜃𝜃′ /𝜇𝜇𝜃𝜃′
and vice versa. In other words, the relationship between Net Interest Income and the slope (𝜃𝜃) is uncertain a priori and depends on the structural parameters of the model: the derivative
𝜕𝜕𝜕𝜕𝜕𝜕𝜕𝜕𝑗𝑗𝜕𝜕𝜃𝜃
is negative (ie the relationship between NII and 𝜃𝜃 is concave) only when 𝜈𝜈1 is negative, ie 𝑁𝑁 > 𝜓𝜓𝜃𝜃′ /𝜇𝜇𝜃𝜃′ holds. This implies the marginal cost for the use of derivative contracts (𝜓𝜓𝜃𝜃′ ) is sufficiently low or the degree of competition (measured by 𝑁𝑁) is sufficiently high. Vice versa the relationship is convex.
From the third equation in (A12), taking into account the results in (A8), it is possible to simplify the formula in the following way
𝜕𝜕𝑃𝑃𝑗𝑗𝜕𝜕𝜕𝜕
= 𝜒𝜒0 + 𝜒𝜒1𝑟𝑟 where 𝜒𝜒0 ≥ 0, and 𝜒𝜒1 ≤ 0 that depends on the hypothesis 𝜇𝜇𝜕𝜕′ > 0 that we made above on the fact that provisions increase when the short rate increase. But this something to the
27 For a review see Gambacorta and Iannotti (2007) and the discussion in footnote 8.

WP514 The influence of monetary policy on bank profitability 23
discussion: if this condition hold the provision equation is not only positively related to 𝑟𝑟 but also concave in 𝑟𝑟. On the contrary if we consider the case in which provisions are insensitive to 𝑟𝑟 (𝜇𝜇𝜕𝜕′ = 0) we have 𝜇𝜇(𝑟𝑟,𝜃𝜃) = �̅�𝜇 > 0 and therefore 𝜕𝜕𝑃𝑃𝑗𝑗𝜕𝜕𝜕𝜕
= 𝜒𝜒0 < 0; that is provisions are convex in 𝑟𝑟. This implies, therefore, that testing for the curvature of the provision equation on the econometrical ground provides an indirect way to verify if provisions are positively related to the level of the nominal interest rate. Similar predictions are obtained by analysing the last derivative
𝜕𝜕𝑃𝑃𝑗𝑗𝜕𝜕𝜃𝜃
.
24 WP514 The influence of monetary policy on bank profitability
References
Adrian, T and H S Shin (2010): “Liquidity and leverage”, Journal of Financial Intermediation, vol 19, issue 3, pp 418–37.
Albertazzi, U and L Gambacorta (2009): “Bank profitability and the business cycle”, Journal of Financial Stability, vol 5, issue 4, pp 393–409.
______ (2010): “Bank profitability and taxation”, Journal of Banking and Finance, vol 34, issue 11, pp 2801–10.
Albertazzi, U and D Marchetti (2010): “Lending supply and unnatural selection: an analysis of bank-firm relationships in Italy after Lehman”, Bank of Italy, Temi di Discussione, no 756, April.
Alessandri, P and B Nelson (2015): “Simple banking: profitability and the yield curve”, Journal of Money Credit and Banking, vol 47, no 1, pp 143–75.
Altunbas, Y, L Gambacorta and D Marques-Ibanez (2009): “Securitisation and the bank lending channel”, European Economic Review, vol 53, no 8, pp 996–1009.
______ (2014): "Does monetary policy affect bank risk?", International Journal of Central Banking, vol 10, no 1, pp 95–136.
Angbazo, L (1997): “Commercial bank net interest margins, default risk, interest rate risk, and off-balance sheet banking”, Journal of Banking and Finance, vol 21, issue 1, pp 55–87.
Arellano, M and S Bond (1991): “Some tests of specification for panel data: Monte Carlo evidence and an application to employment equations”, Review of Economic Studies, vol 58, no 2, pp 277–97.
Arellano, M and O Bover (1995): “Another look at the instrumental-variable estimation of error-component models”, Journal of Econometrics, vol 68, issue 1, pp 29–51.
Banerjee, R, D Latto and N McLaren (2012): “Using changes in auction maturity sectors to help identify the impact of QE on gilt yields”, Bank of England, Quarterly Bulletin, vol 52, no 2, pp 129–37.
Bank for International Settlements (2012): 82nd Annual Report, June.
______ (2014): 84th Annual Report, June.
______ (2015): 85th Annual Report, June.
Bank of England (2010): Financial Stability Report, no 28, December.
Barseghyan, L (2010): “Non-performing loans, prospective bailouts, and Japan’s slowdown”, Journal of Monetary Economics, vol 57, issue 7, pp 873–90.
Basel Committee on Banking Supervision (2010): An assessment of the long-term impact of stronger capital and liquidity requirements, August.
Bech, M, L Gambacorta and E Kharroubi (2014): “Monetary policy in a downturn: are financial crises special?”, International Finance, vol 17, no 1, pp 99–119.
Beck, T, R Levine and N Loayza (2000): “Finance and the sources of growth”, Journal of Financial Economics, vol 58, no 1-2, pp 261–300.

WP514 The influence of monetary policy on bank profitability 25
Benati, L and C Goodhart (2008): "Investigating time-variation in the marginal predictive power of the yield spread", Journal of Economic Dynamics and Control, vol 32, no 4, pp 1236–72.
Bernanke, B (2013): “Communication and monetary policy”, speech at the National Economists Club Annual Dinner, Herbert Stein Memorial Lecture, Washington, DC, 19 November.
Blundell, R and S Bond (1998): “Initial conditions and moment restrictions in dynamic panel data models”, Journal of Econometrics, vol 87, no 2, pp 115–43.
Bolt, W, L de Haan, M Hoeberichts, M R C van Oordt and J Swank (2012): “Bank profitability during recessions”, Journal of Banking and Finance, vol 36, issue 9, pp 2552–64.
Bolton, P and X Freixas (2006): “Corporate finance and the monetary transmission mechanism”, Review of Financial Studies, vol 19, issue 3, pp 829–70.
Borio, C (2014): “Monetary policy and financial stability: what role in prevention and recovery?”, BIS Working Papers, no 440, January.
Borio, C and P Disyatat (2010): “Unconventional monetary policies: an appraisal”, The Manchester School, vol 78, pp 53-89.
Borio, C and W Fritz (1995): “The response of short-term bank lending rates to policy rates: a cross-country perspective”, BIS, Working paper no 27, May.
Borio C and H Zhu (2012): “Capital regulation, risk-taking and monetary policy: a missing link in the transmission mechanism?”, Journal of Financial Stability, vol 8, issue 4, pp 236–51.
Bouis, R, L Rawdanowicz, J-P Renne, S Watanabe and A K Christensen (2013): “The effectiveness of monetary policy since the onset of the financial crisis”, OECD, Economics Department Working Paper, no 1081, November.
Buch, C, S Eickmeier and E Prieto (2014): "Macroeconomic factors and micro-level bank behavior", Journal of Money, Credit and Banking, vol 46, no 4, pp 715–51.
Caballero, R, T Hoshi and A Kashyap (2008): “Zombie lending and depressed restructuring in Japan”, American Economic Review, vol 98, no 5, 1943–77.
Cahill, M, S D’Amico, C Li and J Sears (2013): “Duration risk versus local supply channel in Treasury yields: evidence from the Federal Reserve’s asset purchase announcements”, Finance and Economics Discussion Series, 2013–35, Board of Governors of the Federal Reserve System.
Dale, S (2012): “Limits of monetary policy”, speech at the 44th annual Money, Macro and Finance Conference at Trinity College, Dublin, 8 September 2012.
Dell'Ariccia, G, L Laeven and G Suarez (2013): “Bank leverage and monetary policy's risk-taking channel: evidence from the United States”, IMF Working Paper, no 143, June.
Demirguç-Kunt, A, and H Huizinga (1999): “Determinants of commercial bank interest margins and profitability: some international evidence”, The World Bank Economic Review, vol 13, no 2, pp 379-408.
Dietrich, A and G Wanzenried (2011): “Determinants of bank profitability before and during the crisis: evidence from Switzerland”, Journal of International Financial Markets, Institutions and Money, vol 21, issue 3, pp 307–27.

26 WP514 The influence of monetary policy on bank profitability
Elliot, D (2010): Basel III, the banks and the economy, The Brookings Institution, July.
English, W B (2002): “Interest rate risk and bank net interest margins”, BIS Quarterly Review, December, pp 67-82.
English, W B, S van den Heuvel and E Zakrajsek (2012): “Interest rate risk and bank equity valuations”, Finance and Economics Discussion Series, 2012–26, Board of Governors of the Federal Reserve System.
Enria, A (2013): “Progress in banking sector and institutional repair in the European Union”, speech at the Institute of International Finance – International Capital Markets and Emerging Markets Roundtable, Washington DC, 21 April 2013.
Esposito, L, A Nobili and T Ropele (2013): “The management of interest rate risk during the crisis: evidence from Italian banks”, Bank of Italy, Temi di Discussione, no 933, September.
Filardo, A and B Hofmann (2014): “Forward guidance at the zero lower bound”, BIS Quarterly Review, March, pp 37–53.
Freixas, X and J C Rochet (1997): Microeconomics of Banking, Cambridge, MIT Press.
Friedman, B and K Kuttner (1993): “Economic activity and the short-term credit markets: an analysis of prices and quantities”, Brooking Papers on Economic Activity, no 2, pp 193–283.
Gambacorta, L (2005): “Inside the bank lending channel”, European Economic Review, vol 49, issue 7, pp 1737–59.
Gambacorta, L and S Iannotti (2007): “Are there asymmetries in the response of bank interest rates to monetary shocks?”, Applied Economics, vol 39, no 19, pp 2503–17.
Gambacorta, L and D Marques-Ibanez (2011): “Bank lending channel: lessons from the crisis”, Economic Policy, April, pp 135–82.
Genay, H and R Podjasek (2014): “What is the impact of a low interest rate environment on bank profitability?”, Chicago FED Letter, no 324, July.
Goodhart, C and D Schoenmaker (2009): “Fiscal burden sharing in cross-border banking crises”, International Journal of Central Banking, vol 5, no 1, pp 141–65.
Gorton, G B and R J Rosen (1995): “Banks and derivatives”, NBER Working Paper Series, no 5100, April.
Gropp, R and F Heider (2010): “The determinants of bank capital structure”, Review of Finance, vol 14, issue 4, pp 587–622.
Hannan, T H and A N Berger (1991): “The rigidity of prices: evidence from banking industry”, American Economic Review, vol 81, no 4, pp 938–45.
Ho, T S Y and A Saunders (1981): “The determinants of bank interest margins: theory and empirical evidence”, Journal of Financial and Quantitative Analysis, vol 16, no 2, pp 581–600.
Hofmann, B and P Mizen (2004): “Interest rate pass-through and monetary transmission: evidence from individual financial institutions’ retail rates”, Economica, vol 71, issue 281, pp 99–123.
Hördahl, P and O Tristani (2014): "Inflation risk premia in the euro area and the United States", International Journal of Central Banking, vol 10, no 3, pp 1–47.

WP514 The influence of monetary policy on bank profitability 27
Hutchison D E (1995): “Retail bank deposit pricing: an intertemporal asset pricing approach”, Journal of Money Credit and Banking, vol 27, no 1, pp 217–31.
Kashyap, A K and J C Stein (1995): “The impact of monetary policy on bank balance sheets”, Carnegie-Rochester Conference Series on Public Policy, vol 42, pp 151–95.
______ (2000): “What do a million observations on banks say about the transmission of monetary policy”, American Economic Review, vol 90, no 3, pp 407–28.
Kim, D H and J H Wright (2005): “An arbitrage-free three-factor term structure model and the recent behavior of long-term yields and distant-horizon forward rates,” Finance and Economics Discussion Series, 2005–33, Board of Governors of the Federal Reserve System.
Maudos, J and J Fernandez de Guevara (2004): “Factors explaining the interest margin in the banking sectors of the European Union”, Journal of Banking and Finance, vol 28, no 9, pp 2259–81.
McCauley, R, P McGuire and G von Peter (2012): “After the global financial crisis: from international to multinational banking?”, Journal of Economics and Business, vol 64, issue 1, pp 7–23.
McGuire, P and G von Peter (2009): “The US dollar shortage in global banking and the international policy response”, BIS Working Papers, no 291, October.
McShane, R and I Sharpe (1985): “A time series/cross section analysis of the determinants of Australian trading bank loan/deposit interest margins: 1962–1981”, Journal of Banking and Finance, vol 9, no 1, pp 115–36.
Meaning, J and F Zhu (2011): “The impact of recent central bank asset purchase programmes”, BIS Quarterly Review, December, pp 73–83.
Neumark, D and S A Sharpe (1992): “Market structure and the nature of price rigidity: evidence from the market for consumer deposits”, Quarterly Journal of Economics, vol 107, no 2, pp 657–80.
Plosser, C (2012): “Economic outlook and the limits of monetary policy”, speech at the Southern Chester County Chamber of Commerce, October 11.
Praet, P (2012): “Deleveraging and monetary policy”, speech at the Hyman P Minsky Conference on Debt, deficits and unstable markets, 26 November.
Rajan, R (2005): “Has financial development made the world riskier?”, NBER Working Paper Series, no 11728, November.
______ (2013): “A step in the dark: unconventional monetary policy after the crisis”, Andrew Crockett Memorial Lecture, BIS, Basel, 23 June.
Rosen, R J (2002): “What goes up must come down? Asymmetries and persistence in bank deposit rates”, Journal of Financial Service Research, vol 21, no 3, pp 173–93.
Stein, J C (1998): “An adverse-selection model of bank asset and liability management with implications for the transmission of monetary policy”, RAND Journal of Economics, vol 29, no 3, pp 466–86.
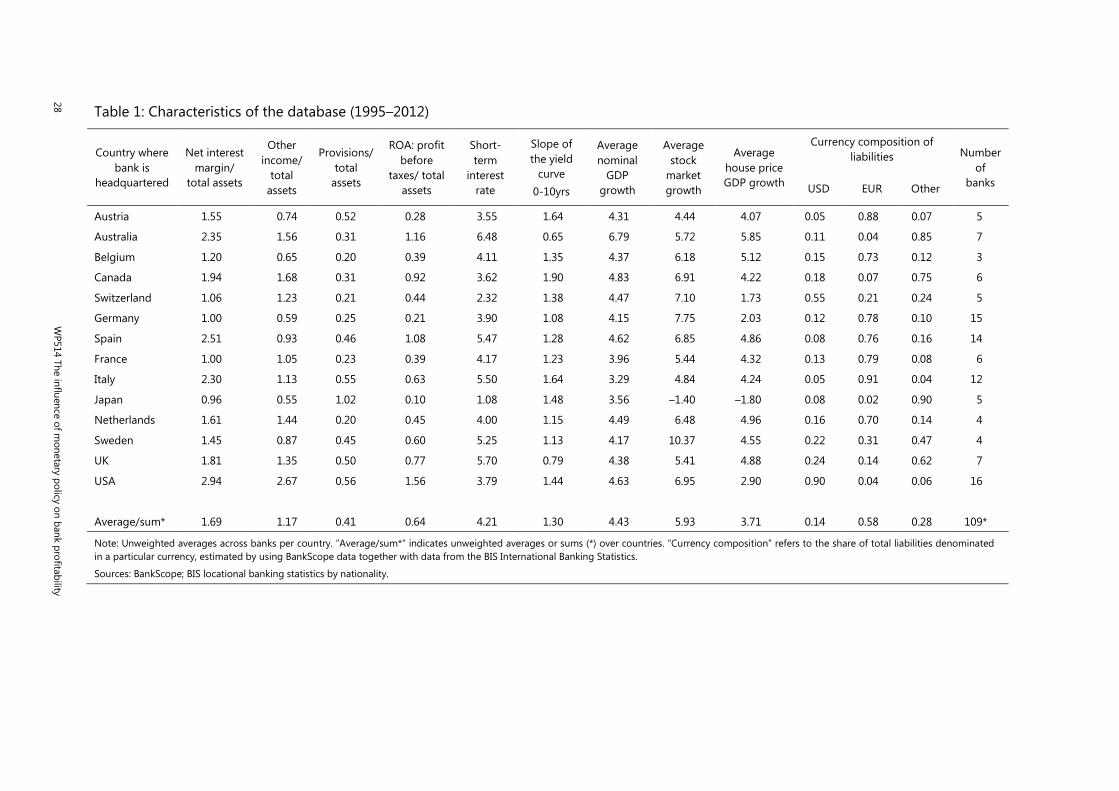
28 W
P514 The influence of monetary policy on bank profitability
Table 1: Characteristics of the database (1995–2012)
Country where bank is
headquartered
Net interest margin/
total assets
Other income/
total assets
Provisions/ total
assets
ROA: profit before
taxes/ total assets
Short-term
interest rate
Slope of the yield
curve 0-10yrs
Average nominal
GDP growth
Average stock
market growth
Average house price GDP growth
Currency composition of liabilities Number
of banks USD EUR Other
Austria 1.55 0.74 0.52 0.28 3.55 1.64 4.31 4.44 4.07 0.05 0.88 0.07 5
Australia 2.35 1.56 0.31 1.16 6.48 0.65 6.79 5.72 5.85 0.11 0.04 0.85 7
Belgium 1.20 0.65 0.20 0.39 4.11 1.35 4.37 6.18 5.12 0.15 0.73 0.12 3
Canada 1.94 1.68 0.31 0.92 3.62 1.90 4.83 6.91 4.22 0.18 0.07 0.75 6
Switzerland 1.06 1.23 0.21 0.44 2.32 1.38 4.47 7.10 1.73 0.55 0.21 0.24 5
Germany 1.00 0.59 0.25 0.21 3.90 1.08 4.15 7.75 2.03 0.12 0.78 0.10 15
Spain 2.51 0.93 0.46 1.08 5.47 1.28 4.62 6.85 4.86 0.08 0.76 0.16 14
France 1.00 1.05 0.23 0.39 4.17 1.23 3.96 5.44 4.32 0.13 0.79 0.08 6
Italy 2.30 1.13 0.55 0.63 5.50 1.64 3.29 4.84 4.24 0.05 0.91 0.04 12
Japan 0.96 0.55 1.02 0.10 1.08 1.48 3.56 –1.40 –1.80 0.08 0.02 0.90 5
Netherlands 1.61 1.44 0.20 0.45 4.00 1.15 4.49 6.48 4.96 0.16 0.70 0.14 4
Sweden 1.45 0.87 0.45 0.60 5.25 1.13 4.17 10.37 4.55 0.22 0.31 0.47 4
UK 1.81 1.35 0.50 0.77 5.70 0.79 4.38 5.41 4.88 0.24 0.14 0.62 7
USA 2.94 2.67 0.56 1.56 3.79 1.44 4.63 6.95 2.90 0.90 0.04 0.06 16
Average/sum* 1.69 1.17 0.41 0.64 4.21 1.30 4.43 5.93 3.71 0.14 0.58 0.28 109*
Note: Unweighted averages across banks per country. “Average/sum*” indicates unweighted averages or sums (*) over countries. “Currency composition” refers to the share of total liabilities denominated in a particular currency, estimated by using BankScope data together with data from the BIS International Banking Statistics.
Sources: BankScope; BIS locational banking statistics by nationality.

WP514 The influence of monetary policy on bank profitability 29
Table 2: Results
Explanatory variables:
Dependent variables:
(I) (II) (III) (IV)
Net interest income to total
assets
Non-interest income to total
assets
Provisions to total assets
ROA: profit before taxes to
total assets
Lagged dependent variable 0.8255*** 0.7406*** 0.5682*** 0.2739*** (0.0747) (0.0546) (0.0609) (0.0609) Short-term rate 0.5327*** –0.6693** 1.6369*** 0.4556*** (0.0682) (0.3035) (0.4953) (0.1284) Short-term rate^2 –0.0270*** 0.0337* –0.1033*** –0.0191*** (0.0073) (0.0172) (0.0350) (0.007) Slope of the yield curve 0.1385*** –0.9782*** 3.4794** 0.9878*** (0.0370) (0.3315) (1.3576) (0.2770) Slope of the yield curve^2 –0.0214** 0.2030*** –0.7896** –0.2417*** (0.0084) (0.0763) (0.3204) (0.0694) Coefficient of variation short-term rate 1.3589*** 1.0421** 3.0622*** 0.7210 (0.3525) (0.5206) (0.752) (0.6247) Log of total assets 0.0009 0.0019 –0.0314* 0.0374** (0.0147) (0.0174) (0.0190) (0.0186) Capital-to-total assets ratio 0.0239** 0.0094 –0.0513* 0.0830*** (0.0110) (0.0136) (0.0284) (0.0206) Liquidity to total assets 0.0021 0.0021* 0.0008 0.0098** (0.0033) (0.0012) (0.0052) (0.0049) Efficiency 0.0004 0.0004 –0.0000 0.0004 (0.0003) (0.0004) (0.0002) (0.0003) Share of short-term funding –0.0011 –0.0012 –0.0008 0.0037 (0.0016) (0.0014) (0.0034) (0.0038) Asset volatility 5.0172** –2.2529* 6.8097 4.3827 (1.9639) (1.2850) (4.7863) (4.7076) GDP growth 0.0044 0.0095 0.0057 0.0369 (0.0094) (0.0090) (0.0219) (0.0336) Stock index growth 0.0078*** 0.0190** –0.0917** 0.0061* (0.0023) (0.0096) (0.0404) (0.0033) House price growth 0.0284*** 0.0184* –0.1070*** 0.0485*** (0.0094) (0.0105) (0.0368) (0.0138) Crisis and IFRS dummies yes yes yes yes
Number of banks and observations 109/1,667 109/1,664 109/1,603 109/1,677
Serial correlation test (1) 0.216 0.718 0.970 0.138
Hansen test (2) 0.134 0.304 0.582 0.379 Note: The sample goes from 1995 to 2012. All estimations are based on the Arellano and Bover (1995) System GMM estimator. Robust standard errors are reported in brackets. (***, **, *) indicate significance at the 1%, 5%, 10% level. Significant coefficients are in bold. (1) Reports p-values for the null hypothesis that the errors in the first difference regression exhibit no second-order serial correlation. (2) Reports p-values for the null hypothesis that the instruments used are not correlated with the residuals.
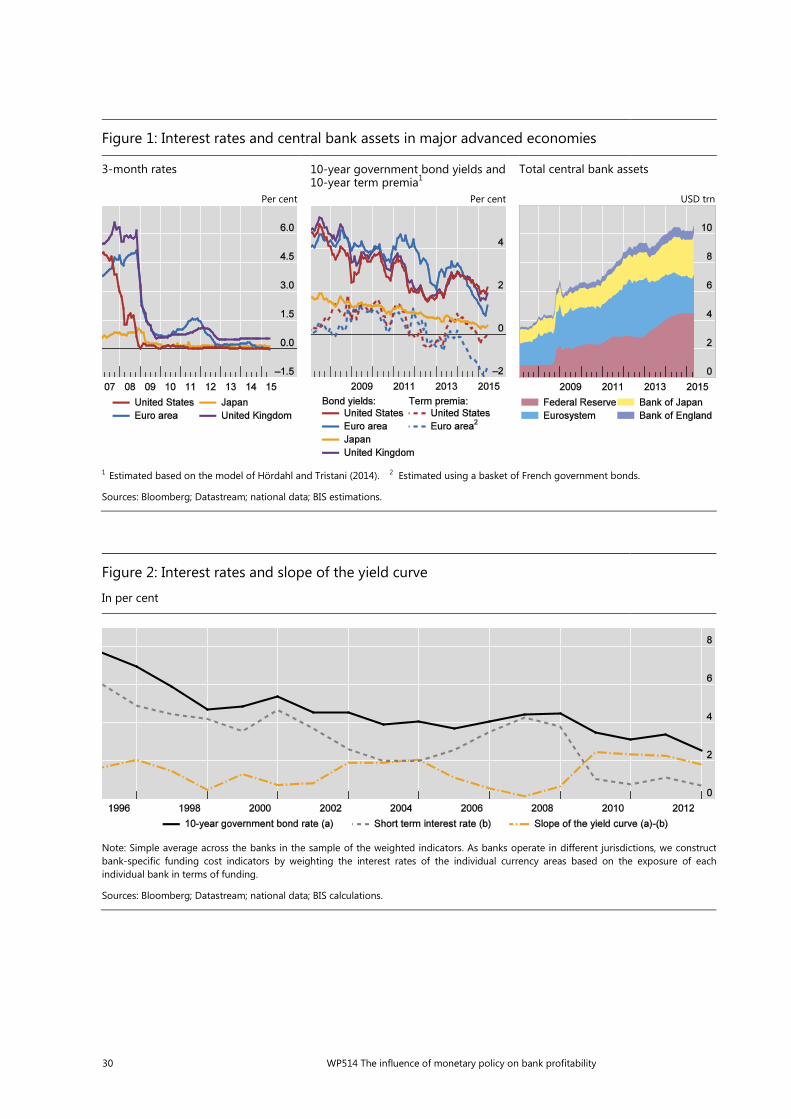
30 WP514 The influence of monetary policy on bank profitability
Figure 1: Interest rates and central bank assets in major advanced economies
3-month rates 10-year government bond yields and 10-year term premia1
Total central bank assets
Per cent Per cent USD trn
1 Estimated based on the model of Hördahl and Tristani (2014). 2 Estimated using a basket of French government bonds.
Sources: Bloomberg; Datastream; national data; BIS estimations.
Figure 2: Interest rates and slope of the yield curve
In per cent
Note: Simple average across the banks in the sample of the weighted indicators. As banks operate in different jurisdictions, we construct bank-specific funding cost indicators by weighting the interest rates of the individual currency areas based on the exposure of each individual bank in terms of funding.
Sources: Bloomberg; Datastream; national data; BIS calculations.

WP514 The influence of monetary policy on bank profitability 31
Figure 3: Distribution of bank-specific business cycle indicators
In per cent
(A) Nominal GDP, annual growth rate
(B) Stock prices, annual growth rate
(C) House prices, annual growth rate
Note: Bank-specific business cycle indicators are constructed based on the composition of the banks’ assets, ie by weighting the country based on the locational activity of the individual bank. The solid lines represent the median value of each bank-specific cycle indicator. The shaded areas delimit the second and third quartile of the distribution.
Sources: Bloomberg; Datastream; national data; BIS
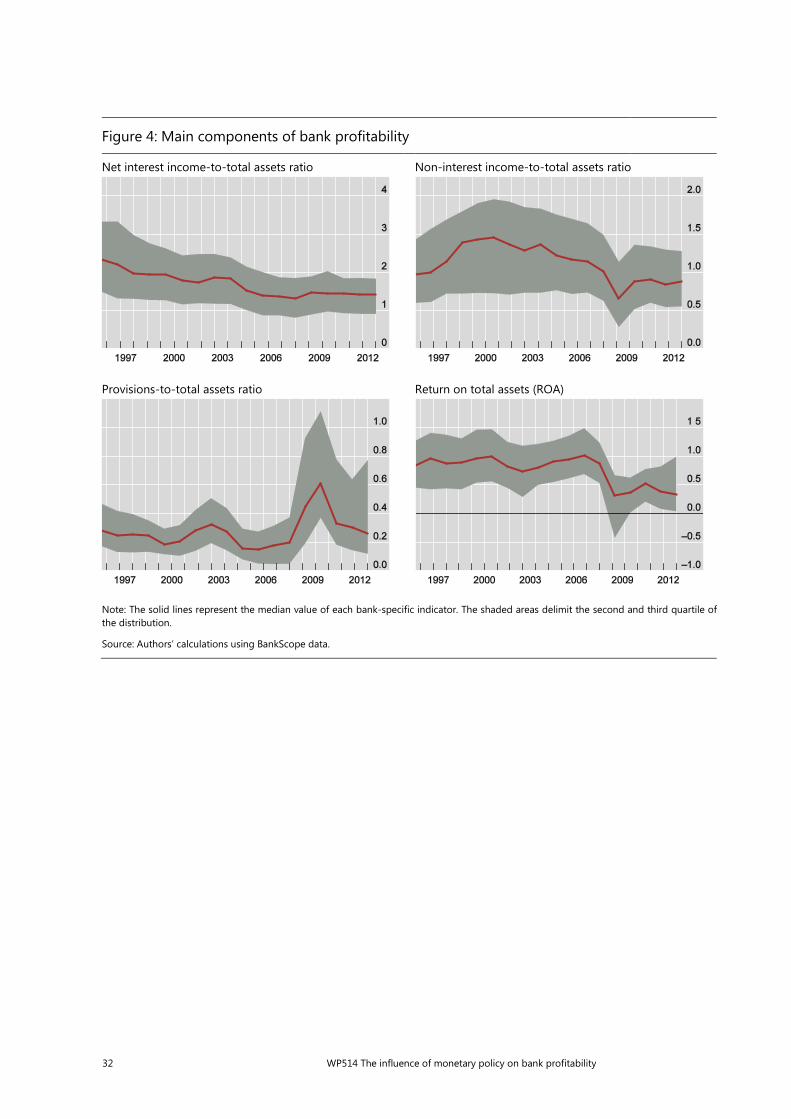
32 WP514 The influence of monetary policy on bank profitability
Figure 4: Main components of bank profitability
Net interest income-to-total assets ratio Non-interest income-to-total assets ratio
Provisions-to-total assets ratio Return on total assets (ROA)
Note: The solid lines represent the median value of each bank-specific indicator. The shaded areas delimit the second and third quartile of the distribution.
Source: Authors’ calculations using BankScope data.

WP514 The influence of monetary policy on bank profitability 33
Figure 5: Effect of changes in the short-term interest rate on bank profitability
(a) Impact on net interest income-to-total assets ratio (b) Impact on non-interest income-to-total assets ratio
(c) Impact on provisions-to-total assets ratio (d) Impact on return on assets (ROA)
Note: The horizontal axis shows the nominal level of the money market rate (r). The vertical axis shows the derivative of each bank profitability component with respect to the short-term rate, in percentage points. The shaded area indicates 95% confidence bands.
Source: Authors’ calculations.

34 WP514 The influence of monetary policy on bank profitability
Figure 6: Effect of changes in the slope of the yield curve on bank profitability
(a) Impact on net interest income-to-total assets ratio (b) Impact on non-interest income-to-total assets ratio
(c) Impact on provisions-to-total assets ratio (d) Impact on return on assets (ROA)
Note: The horizontal axis shows possible values for the slope of the yield curve (the difference between the 10-year government bond and the three-month interbank rate, in percentage points. The vertical axis shows the derivative of each bank profitability component with respect to the slope. The shaded area indicates 95% confidence bands.
Source: Authors’ calculations.

All volumes are available on our website www.bis.org.
Previous volumes in this series
No Title Author
513 September 2015
The determinants of long-term debt issuance by European banks: evidence of two crises
Adrian van Rixtel, Luna Romo González and Jing Yang
512 September 2015
International reserves and gross capital flow dynamics
Enrique Alberola, Aitor Erce and José María Serena
511 September 2015
Higher Bank Capital Requirements and Mortgage Pricing: Evidence from the Countercyclical Capital Buffer (CCB)
Christoph Basten and Cathérine Koch
510 August 2015
Global dollar credit and carry trades: a firm-level analysis
Valentina Bruno and Hyun Song Shin
509 August 2015
Investor redemptions and fund manager sales of emerging market bonds: how are they related?
Jimmy Shek, Ilhyock Shim and Hyun Song Shin
508 August 2015
Bond markets and monetary policy dilemmas for the emerging markets
Jhuvesh Sobrun and Philip Turner
507 July 2015
Macroeconomic Effects of Banking Sector Losses across Structural Models
Luca Guerrieri, Matteo Iacoviello, Francisco Covas, John C. Driscoll, Mohammad Jahan-Parvar, Michael Kiley, Albert Queralto and Jae Sim
506 July 2015
Macroprudential Policies in a Commodity Exporting Economy
Andrés González, Franz Hamann and Diego Rodríguez
505 July 2015
Phases of Global Liquidity, Fundamentals News, and the Design of Macroprudential Policy
Javier Bianchi and Enrique G. Mendoza
504 July 2015
Credit and Macroprudential Policy in an Emerging Economy a Structural Model Assessment
Horacio A. Aguirre and Emilio F. Blanco
503 July 2015
Inflation targeting and financial stability: providing policymakers with relevant information
Anders Vredin
502 June 2015
Comparative assessment of macroprudential policies
Valentina Bruno, Ilhyock Shim and Hyun Song Shin
501 May 2015
Leverage dynamics and the real burden of debt
Mikael Juselius and Mathias Drehmann
500 April 2015
Prolonged reserves accumulation, credit booms, asset prices and monetary policy in Asia
Andrew J Filardo and Pierre L Siklos
499 March 2015
Foreign exchange intervention: strategies and effectiveness
Nuttathum Chutasripanich and James Yetman