bitcoin live: scalable system for detecting bitcoin...
TRANSCRIPT

Bitcoin Live: Scalable system for detecting bitcoin network behaviors in real time.
Sergio Ivan Marcin [email protected] December 9, 2015
Abstract Digital currencies and transactions are becoming more prevailing these days. Systems like Bitcoin digital currency[1], run on purely digital monetary transactions which are technically verified for correctness and validity, but unregulated or unchecked for fraudulence. In massive networks like the Bitcoin transaction graph, thousands of network updates or transactions occur per minute, and it becomes critical to be able to analyze a high volume of transactions in a way that makes it feasible to detect frauds and other behaviors. Given that bitcoin transactions are anonymous, fraud detection algorithms require to do network analysis, and current systems either work on batches, offline information, or graphs smaller in size than the bitcoin network, all of which present limitations when trying to do analysis of each transaction before being confirmed. This paper describes the implementation of a scalable graph analysis system, which performs bitcoin long chain transaction behavior analysis in real time. We approach real time analytics with the use of a modified PageRank[11] algorithm as a data sampling rate function, which ranks incoming transactions for deeper graph analysis processing. With the insight gained from this project: we 1) Identify long chain bitcoin transactions live, 2) apply a modified PageRank as a first step filter to select processing, 3) show the feasibility of performing real time multi layer analysis that scales horizontally
1 Introduction In Bitcoin, money is represented as a graph (blockchain). Money resides in a node of the graph (wallet) and it can be transferred to other wallets. Each of this transfers, or transactions, is modeled as a directed edge. This graph contains information of every single transaction: from the origin of the network with the first bitcoin ever created, to creation of new bitcoin, and how money has shifted owner over time.
fig 0 plot of a day of bitcoin transactions as a graph. Long chain transactions (bitcoins passing in the same amount through
different owners in a chain) are highlighted by color

The bitcoin network is anonymous by design in contrast to our current banking system, which renders classic fraud detection algorithms unfeasible. Fraud detection instead relies on history of transaction, which makes network analysis necessary. While network analysis for detecting fraud is proved useful[1], it has the additional challenge of being computationally expensive. Fraud detection algorithms are more useful when executed before approving a transaction, similar to a bank checking purchase patterns before authorizing a purchase. This is critical, since due to Bitcoin’s nature, once a transaction is confirmed, the change is permanent [1]. The graph of bitcoin financial transactions continuously grows in size exponentially[2]. In 2013 the network was processing around 86,000 transactions per day[2]. The record for 2015 was 211,121 transactions per day[2]. At this growth rate it is expected that the transaction graph will grow to over 40TB in size by 2024[3]. Performing graph analysis on a single computer becomes less and less feasible as the network grows exponentially over time. In this paper we propose the implementation of a real time analytics system. The system achieves scale by splitting analysis by tiers. Using a modified PageRank algorithm which takes in consideration transaction weight as a data sampling rate function, the system can decide in real time which transactions require deeper graph analysis processing. Each tier has a specialized analysis pipeline, and ranking helps decide in which tier a transaction should be processed. Computation among tiers can be scaled by adding more compute nodes, which increases the transaction per second throughput of the system, achieving horizontal scalability. This methodology differs from other existing system which do processing offline in batches like Hive [4], or do real time calculations, but over static datasets like GraphX [5]. The feasibility of the system was evaluated by implementing a specific algorithm for fraud detection, long chain behavior detection[6], using network analysis over bitcoin data. This methodology was verified by connecting the analytics system to the bitcoin network, reading inputs in real time to perform long chain detection.
2 Terminology Address: Hash key to where a bitcoin value is assigned to. The equivalent to a bank account number. [7] Block: A record of transactions between addresses. Bitcoin value is defined by an initial mined amount, and a list of transactions of where such money has gone through. Blockchain: The bitcoin transaction database shared by all nodes. It contains the copy of every transaction ever executed. This helps calculate the value belonging to each address at any point in history. Each block in the chain is stored chronologically, and it’s computationally impractical to be modified, given every block generated afterwards would have to be regenerated, thus preventing doublespending of bitcoins. Mining: The act of generating bitcoins. Transaction: a set of input and output addresses, and an amount of bitcoin transferred between each. A transaction can have multiple inputs and outputs.

3 Dataset Information
I Description Initially, a snapshot of the bitcoin graph with transactions up to January of 2013 collected by Ivan Brugere[8] was utilized to test the hypothesis of the project. A second dataset was generated by generating a new full dump of the bitcoin transaction graph up to Sept 3rd of 2014. This was performed by initializing a transaction verification node using bitcoinqt core and PostgresDB. Once all transactions were locally downloaded, the whole history of bitcoin transactions from genesis (transaction 1) was parsed from binary data into a PotsgresDB database. Data from postgres was finally then exported to a format usable by Snap and Gephi to perform network analysis. The datasets were reconstructed into graphs in Snap by setting each transaction to be a set of nodes labeled with the addresses of the source and destination account hashes, and creating directed edges between them with weights set to the monetary bitcoin value transferred in the transaction. Direction of the edges was set such that vectors would point from the source, to the destination address. The indegree distribution was calculated in segments of the graph equivalent to a days worth of transactions. As we can see in figure 1
fig 1 indegree distributions from slices of the bitcoin graph. Transaction slices shown are IDs in ranges 1 Million to 1.1
Million, 10 Million to 10.2 Million, and 45.0 Million to 45.8 Million respectively.
Live transaction information were ingested via a direct connection to the bitcoin network, to validate the real time performance of the system. The connection was stablished from a set of data collector servers, connecting via the websocket protocol provided by blockchain.info [17]
II Dataset Statistics Bitcoin graph
20130106 Static Dataset[7] Nodes: Total users: 6,336,769 Edges: 37,450,461
20140903 Static Dataset Nodes: Total users: 45,867,004 Edges: 109,956,739
Live Data (transactions in real time) Peak: 7 TPS(Hard limit)[9] Avg. Rate: 2.37 Transactions per second
4 Previous Work Structure and Anonymity of the Bitcoin Transaction Graph (Ober, M., Katzenbeisser S., and Hamacher, K., 2013) In this paper [10], the authors study the graph structure as a whole of a snapshot of a bitcoin graph, using a snapshot of 215,399 blocks in an attempt to measure how truly anonymous the bitcoin graph is. Authors here come to a similar conclusion as [1] where appears that wallet addresses used in the same origin transaction very likely pertain to the same owner. The authors also measure transactions per public key, or entity, and graph the distribution on transactions, which per their results follows a power law distribution, with a longer tail increasing in size as time passes in the bitcoin network. From analyzing the data further, authors observe that multiple separate transactions, sharing a common address as origin, can be grouped together in a “merging event”. This is what I consider the most important finding of this paper. There is validation that is very likely that diffused transactions which have multiple source addresses(which we know are likely to be from the same author) will share source addresses from other transactions. This NxX linking help us create a map of tagged addresses, which simplifies enormously the lookup of wallets to tag for further analysis. Rather than attempting the NP algorithm of finding cliques or triads across the whole bitcoin graph, we start by generating this common addresses maps, link them together, and then analyze the much smaller subset of subgraphs. The authors analyze these merging events histograms and follow the trail of some of them, and were able to validate their theory by finding the addresses pertaining to SatoshiDice, a bitcoin casino. GraphX: A Resilient Distributed Graph System on Spark (J E. Gonzalez , RS. Xin, et.,, 2013) This paper [5] describes a distributed system for real time graph processing of graphs. Graph is an Apache project built on top of the Spark platform, meant to perform real time analytics over a variety of inputs, in a resilient way. The system is well tested and according to [8], performs significantly faster than Hive for doing queries over the sample dataset. While the model is proven and used today in production, as a graph analytics system is meant to execute many queries per second, over graphs that don’t change much over time. The underlying storage system utilized, RDD ( resilient distributed dataset ) is meant to be a read only, replicated data set , partitioned to produce performance optimizations. The nature of RDD’s mean that doing a node append operation will result in having to copy the RDD into a new RDD with the appended node. Given we want to continuously append several times per second new nodes and transactions into the graph, on a dataset like the bitcoin network with 45 Million nodes this will prove impractical, as every write will result in a copy of 45 Million nodes. There were a lot of learnings from the GraphX system implementation that served as inspiration of this project, thus why we attempt to build a modified system meant for processing in realtime, but with continuous writes and modifications in mind.
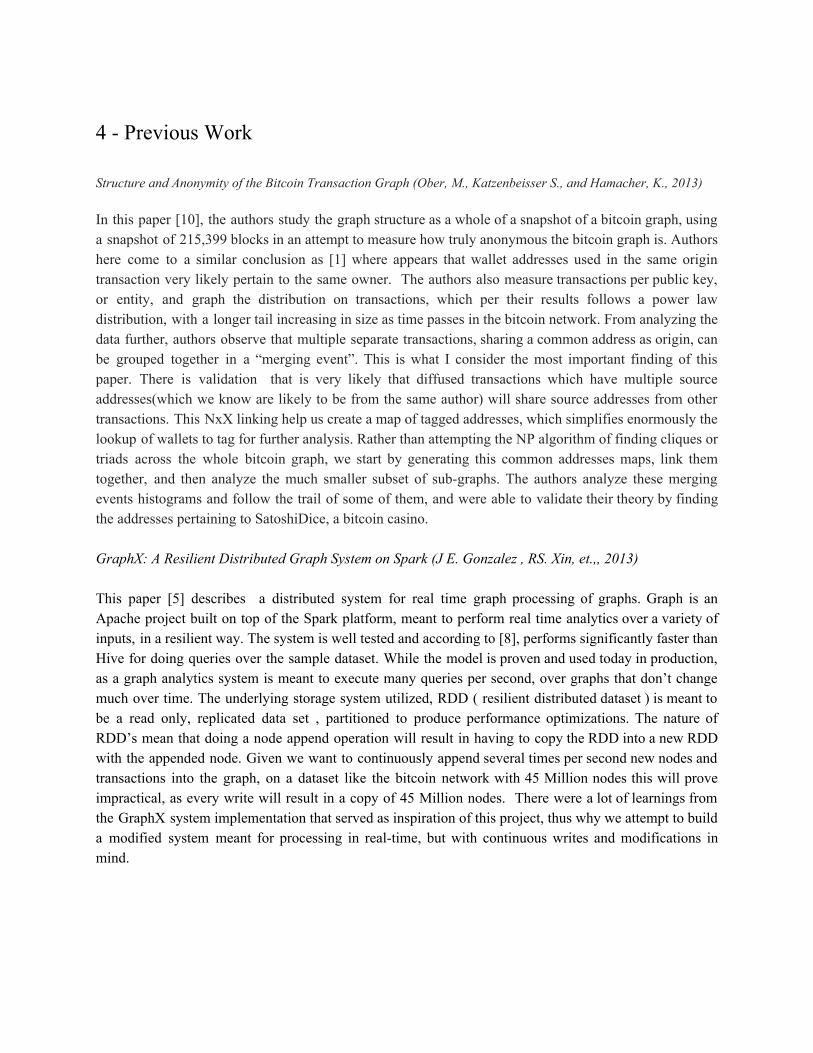
5 Methodology In the following section we first describe the overall architecture of the processing system. Next we describe how a modified version of PageRank[11] is applied to incoming data to selectively process information, and then describe the data partition and processing methodology applied to split the large graph across a number of nodes.
fig 2 Overview of the flow of a transaction being processed in the system
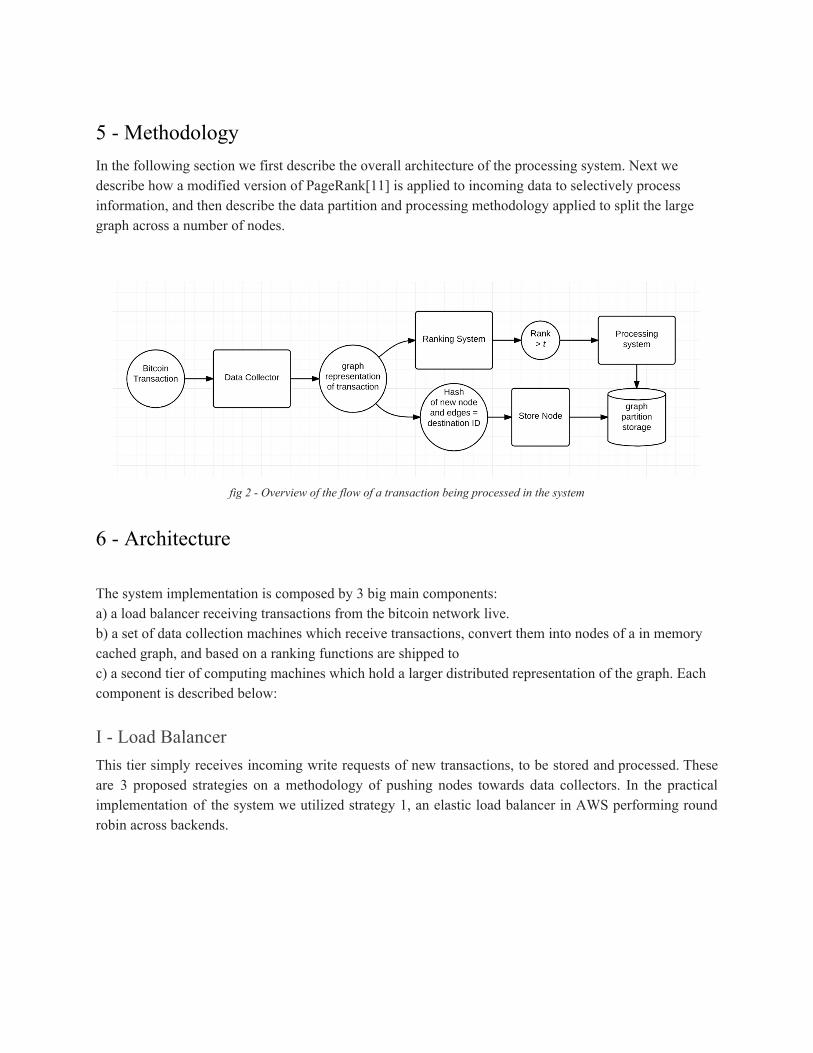
6 Architecture The system implementation is composed by 3 big main components: a) a load balancer receiving transactions from the bitcoin network live. b) a set of data collection machines which receive transactions, convert them into nodes of a in memory cached graph, and based on a ranking functions are shipped to c) a second tier of computing machines which hold a larger distributed representation of the graph. Each component is described below:
I Load Balancer This tier simply receives incoming write requests of new transactions, to be stored and processed. These are 3 proposed strategies on a methodology of pushing nodes towards data collectors. In the practical implementation of the system we utilized strategy 1, an elastic load balancer in AWS performing round robin across backends.
fig 3 Architecture diagram of the system implementation
1) Round robin across collectors: this has the advantage of splitting the total system load of
incoming TPS by a factor N ,where N is the number of collector nodes. This allows to increase throughput with the same class of machines by adding mode data collectors. The trade off is that there has to be a balance of cluster size and collectors node count. If there’s too many collector nodes, the local graph generated within each node can become too disconnected, which will degrade performance of the ranking algorithm.
2) Send incoming transactions to all collector nodes: the balancer copies and forwards the transaction B collector nodes out of N total collectors, where . This has the added value 1 ≤ β ≤ N that connectivity in the local graph in the collector, won’t be affected if . If more than 1 β = N node but less than N is used. the probability of the node being connected becomes the probability that a node connection landed on the same node on a previous transaction, thus probability of connectivity becomes:
r(C) ( )P = ∏i
i−>N
1β
The tradeoff of this technique is the increased computational cost, and tuning the B parameter would be highly dependant of cluster settings vs graph shape.
3) Use location hints: We did not implement this option, given the anonymity of the bitcoin graph, but a locality hint could help the balancer route a data input to a certain collector node(s).
In our implementation, data is being collected by reading transactions from a websocket connected to blockchain.info. Data is ingested from the socket, and then copied over to the balancer, which ships it to a collector node.

II Data Collector This tier is composed of a group of compute nodes all of which perform a) cache incoming data
in a local graph representation. b) rank nodes in the local cache graph c) dispatch nodes for analysis to the processing tier
III Local graph cache Data written into a collector node will be converted into a node format and appended into a graph
held in the collector’s memory as a cache. This cache will serve as data source to calculate ranking and decide whether to process or node the incoming node.
The local cache works similarly to an LRU, with 2 basic distinctions: 1) It will store a graph representation of the data (nodes and edges) rather than a map. 2) Rather than ejecting the least frequently accessed node, the lowest ranked nodes will be evicted by the cache eviction algorithm.
IV Cache eviction algorithm Rather than attempting to hold a complete graph in memory, instead this system keeps the nodes inserted into the graph in the last t time. This are all the incoming transactions being pushed in real time. Therefore, the size of the cache directly correlates to the time slice of data that will be cached. Given data input timestamps vary, rather than keeping the last S seconds of data in memory and shed older nodes, we attempt to shed least valuable nodes. We attempt to target node evictions with an LVO ( Least Valuable Out) cache. The nodes with the least valuable weight and least connectivity or PageRank will be removed first. Given our modified PageRank algorithm calculates this, we simply evict the least valuable transactions in a scheduled manner, or when the cache is close to full capacity. Algorithm 1: LVO caching 1: while receiving_transactions is true: 2: append node N to cache graph CG 3: compute updated of static undirected pagerank 4: compute rank(N) based on pagerank and weights of node 5: if size(CG) > eviction_threshold t: 6: compute eviction_rank = max(rank(n)) in border of lowest 10th percentile of ranks 7: for node n in CG: 8: if rank(n) < eviction_rank : 9: delete n from CG
V Incoming nodes Ranking: Modified PageRank Algorithm The goal of this system is to collect node data, and perform network analysis algorithm over the
node to detect certain behaviors. We address the scenario, on this bitcoin graph, where fraud behaviors are more likely to occur on transactions which are more connected and of greater transaction weight.

Transactions which are disconnected from the graph, with very small or minimal transaction amounts, are the ones which will yield the least results from network analysis. Therefore, this system filters this transactions using a ProcessingRank algorithm. This algorithm, based on Pagerank, ranks all nodes and caps heavy processing only on high ranking nodes
VI Analyze Rank Given the most valuable nodes should be processed in the graph, we want to select those who
have a combination of the most valuable weight based on a combination of properties, and the ones which are more connected, or connected to other very valuable nodes. PageRank will yield a list of ranks for every node in the network by computing:
The second factor we want to consider is the property weight from the incoming data, or WeightScore. We can calculating this by averaging the weights of all properties in Pi
S (pi) eight(x)W = n1 ∑
1
x−>pw
In the case of bitcoin transactions, we only look at transaction amount for weight, and we want to normalize the transaction weight to be between 1 and 0, therefore WeightScore becomes:
S(pi) W = weight(pi)
max(weight(pi) Once we normalize both PageRank and WeightScore values between 0 and 1, we can combine
them to yield a single value between 0 and 1 with: PRNormalized(PR(pi)) + Normalized(WS(pi) / 2 It becomes a simple matter of having a Threshold t, and schedule processing if our rank for pi > t.
Say we just want to assign compute power to process 20% of incoming transactions, then this will miss important transactions unless they’re both well connected and of enough value. In the case of our analysis, being connected matters more than the amount, therefore, an added damping factor D is added to AnalyzeRank. This is simply a constant to tune and choose which metric to weight higher. Therefore, AnalyzeRank becomes:
nalyzeRank(pi) (1 ) PR(pi) WS(pi) ) 2 A = ( − D + 1D /
7 Processing Tier
I Calculating behaviors The processing tier job is to receive data from the ranking tier, and perform network analysis for such node. in our case, the testing behavior algorithm is detection of long chains of transactions in the network.[12] The processing tier contains a simple http interface to receive node data, as well as have an

in memory set of nodes and edges. The node and edge information is appended to the graph, and then a thread is started to run the behavior detection over the node ID. If the behavior is a match, the resulting data is pushed into a log with the matching data. Algorithm 2: Long Chain detection 1: compute recursive continues_chain(node, transaction_amount, current_hop): 2: if current_hop > max_hops : 3: return node 4: else: 5: for edge in node: 6: if abs( edge weight transaction_amount) < transaction delta: 7: return continues_chain( edge.destination_node, transaction_amount, current_hop + 1) 8: 9: compute long chain(node, transaction_amount): 11: set max_hops 10: return compute recursive continues_chain( node, transaction_amount, 0)
II Split Graph Storage In order to accommodate the use of machines with relatively low resources, e.f. qws m1.medium instances, with 2 vCPU’s and 4 Gib of ram, we split the graph across several machines. This is achieved by performing node partitioning in combination with consistent hashing. Taking the ID of the node being inserted, we can calculate the MD5 hash of it’s ID on the fly, and mod the value to get the ID of the processing node that will store the node.
estinationNode(P i) MD5( ID(P i) ) % NodeCount D =
fig 4 Example of how a sample graph would be partitioned in storage nodes
IV Connecting nodes Across machines In order to connect nodes stored in different processing machines, when writing a node, we also write its edges, plus the target nodes of such edges, marked as jump nodes. When iterating over nodes in a processing machine, if the algorithm falls under a jump node, then it just needs to continue the computation reading node data from a different machine.

Algorithm 3 : Store Node 1: compute node_hash = MD5(node.ID) 2: compute target_storage = node_hash % processing_node_count 3: write node in target_storage 4: for edge in node: 5: write edge.target_node in target_storage as jump node 6: write edge between node and target_node in target_storage One limitation this methodology overcomes is of dealing with continuous writes. Some existing systems which deal with real time processing like spark, treat data as immutable in order to ease partitioning. This means that adding a node requires rewriting the whole dataset. When a dataset is the size of the bitcoin network with many transactions per second, rewriting the dataset per incoming node becomes impractical. With this methodology every node is appended on the fly on separate Nodes as long as the total memory of all nodes is greater than the max size of the dataset to hold. Future improvements not implemented on this project would be handling failures of such nodes by replicating data, or increasing capacity of the cluster dynamically by adding more nodes.
8 Results
fig 5 YuanYu plots of subgraphs containing detected longchain transactions( highlighted in purple) . Sub graphs were dumped
from slice of live data where longchains transactions were found. By having the system read transactions live from the web socket and running the algorithm, it was possible to get matches detected as long chain bitcoin transactions. To verify this transactions, the data from the transaction, along a slice of the transactions in the temporal cache for the last 10 minutes was exported, and loaded into gephi. Edges with higher weight were then selectively highlighted to bring up the shapes of long chained transactions. The patterns surrounding long chains varied in length and diffusion, nevertheless, long chains were promptly detected. In some cases the Avg. length was short 3 or 5 hops, though in some cases it was possible to find 20 or more hops in the long chain, from transactions passing through addresses in very quick succession. The graph slices dumped containing long chains were then analyzed, and it was possible to conclude that they were mostly similar in shape. With very low average degree coming from all the sparse one to one transactions surrounding the longchain, but with a higher network diameter in average coming from the long chains, as seen in table 2.

Avg Degree 0.949
Network Diameter 6
Graph Density 0.001
Modularity 0.957
Connected Components 151
Avg Path Length 2.914
Table 2 Statistics averaged from a collection of 10 sub graph samples.
After verifying the correctness of the algorithm, and validating that it is possible to detect long chains from the ranking and then post processing, a performance test was executed by logging each transaction processed as these were read from a websocket pushing live transactions. Setup for the benchmarking was running the test on a machine running an intel Core i7 processor, on 4 cores @ 2.5ghz, with 16Gib of ram. The max rate benchmark was run over a physical core to prevent noise introduced in benchmarks over virtual machines like AWS compute nodes, as processing rate can vary depending on neighbors sharing the compute node.
fig 6 Collector’s rate of live bitcoin transactions processed per minute
Instrumentation was added into the live processing to measuring the number of transactions and timing of each node evaluation, adding the transaction rate every 10 seconds, before aggregating into 1 minute segments.Figure 6 shows a plot of the transaction rates against (unix epoch) timestamps, read for the duration of the test (1 hour). Transaction rates bottomed at near 4 TPM, while peaked at 77 TPM. Then, Transactions incoming to the collector were executed on top of AWS on m1.medium compute nodes under an elastic beanstalk app. The application was setup with an autoscale group hooked with a CPU load trigger, to spin up new instances when CPU usage would go over 80%. The collector was set to read transaction live as a test of the system as a whole and observe cpu behavior. In this version we can see cpu usage being relatively stable, as the system currently does not spin up multiple threads to parallelize processing. Thus cpu usage remains relatively stable as show in cloudwatch metrics (fig7) monitoring the collector. As incoming transaction messages are buffered when being read from the websocket, and picked until processing execution is completed. This increased delay in processing for
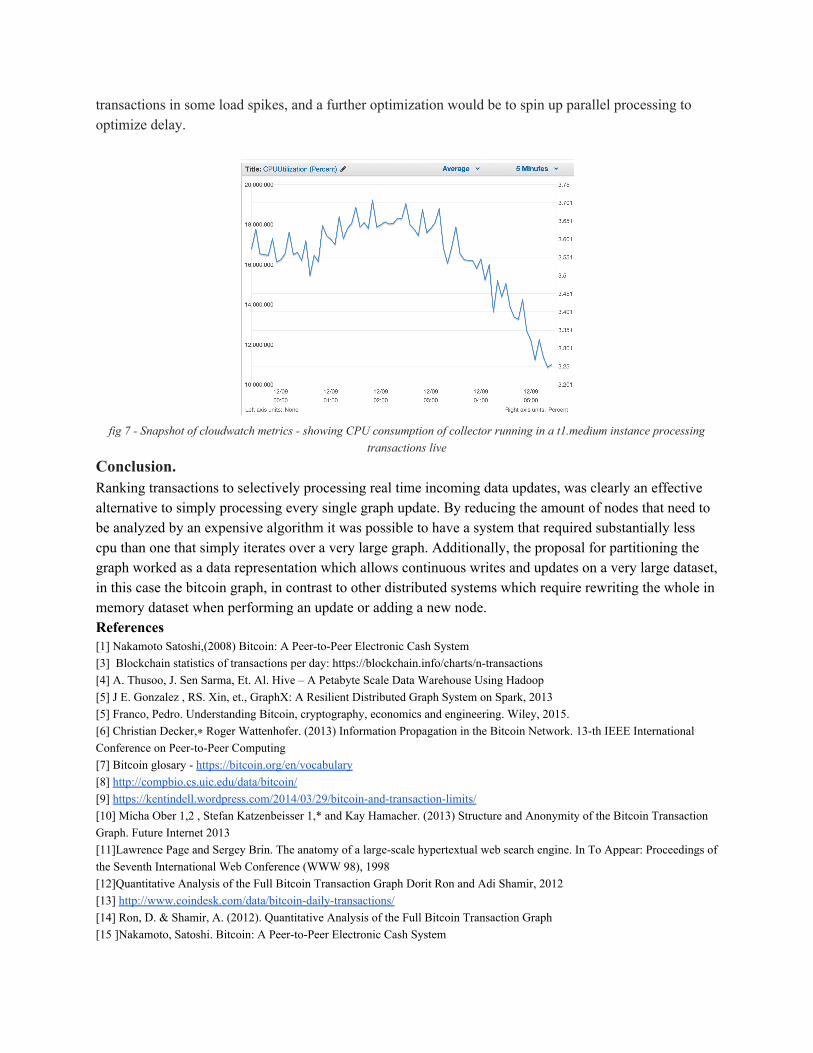
transactions in some load spikes, and a further optimization would be to spin up parallel processing to optimize delay.
fig 7 Snapshot of cloudwatch metrics showing CPU consumption of collector running in a t1.medium instance processing
transactions live Conclusion. Ranking transactions to selectively processing real time incoming data updates, was clearly an effective alternative to simply processing every single graph update. By reducing the amount of nodes that need to be analyzed by an expensive algorithm it was possible to have a system that required substantially less cpu than one that simply iterates over a very large graph. Additionally, the proposal for partitioning the graph worked as a data representation which allows continuous writes and updates on a very large dataset, in this case the bitcoin graph, in contrast to other distributed systems which require rewriting the whole in memory dataset when performing an update or adding a new node. References [1] Nakamoto Satoshi,(2008) Bitcoin: A PeertoPeer Electronic Cash System [3] Blockchain statistics of transactions per day: https://blockchain.info/charts/ntransactions [4] A. Thusoo, J. Sen Sarma, Et. Al. Hive – A Petabyte Scale Data Warehouse Using Hadoop [5] J E. Gonzalez , RS. Xin, et., GraphX: A Resilient Distributed Graph System on Spark, 2013 [5] Franco, Pedro. Understanding Bitcoin, cryptography, economics and engineering. Wiley, 2015. [6] Christian Decker,∗ Roger Wattenhofer. (2013) Information Propagation in the Bitcoin Network. 13th IEEE International Conference on PeertoPeer Computing [7] Bitcoin glosary https://bitcoin.org/en/vocabulary [8] http://compbio.cs.uic.edu/data/bitcoin/ [9] https://kentindell.wordpress.com/2014/03/29/bitcoinandtransactionlimits/ [10] Micha Ober 1,2 , Stefan Katzenbeisser 1,* and Kay Hamacher. (2013) Structure and Anonymity of the Bitcoin Transaction Graph. Future Internet 2013 [11]Lawrence Page and Sergey Brin. The anatomy of a largescale hypertextual web search engine. In To Appear: Proceedings of the Seventh International Web Conference (WWW 98), 1998 [12]Quantitative Analysis of the Full Bitcoin Transaction Graph Dorit Ron and Adi Shamir, 2012 [13] http://www.coindesk.com/data/bitcoindailytransactions/ [14] Ron, D. & Shamir, A. (2012). Quantitative Analysis of the Full Bitcoin Transaction Graph [15 ]Nakamoto, Satoshi. Bitcoin: A PeertoPeer Electronic Cash System