bitumen beyond combustion – phase 2 report - report 2 (web)_0.pdfoil sands bitumen has an api of...
TRANSCRIPT

Bitumen Beyond Combustion – Phase 2 Report
January 31, 2018 (Original Submittal) Revised February 12, 2018
Prepared for: Alberta Innovates Prepared by: Stantec Consulting Ltd.

This page is intentionally blank.


BITUMEN BEYOND COMBUSTION – PHASE 2 REPORT
Table of Contents
ACKNOWLEDGEMENTS .......................................................................................................... V
EXECUTIVE SUMMARY .......................................................................................................... VI
ABBREVIATIONS ..................................................................................................................... X
1 INTRODUCTION ........................................................................................................ 1.12
2 STUDY EXECUTION PLAN ....................................................................................... 2.12 2.1 STAGE 1 – INFORMATION GATHERING ................................................................. 2.13 2.2 STAGE 2 – DECISION ANALYSIS (MID TERM WORKSHOP) .................................. 2.14
2.2.1 Market ....................................................................................................... 2.14 2.2.2 Production ................................................................................................. 2.14 2.2.3 Business Case (Including CAPEX and OPEX Where Possible) ................ 2.14 2.2.4 Environmental Net Effects ......................................................................... 2.14 2.2.5 Social Acceptance ..................................................................................... 2.14 2.2.6 Manufacturing Location ............................................................................. 2.14 2.2.7 Technology Readiness Levels ................................................................... 2.15
2.3 STAGE 3 – FOCUSED TECHNO ECONOMIC ANALYSIS ........................................ 2.15 2.4 STAGE 4 – DETAILED SUMMARIES......................................................................... 2.15
3 DETAILED SUMMARIES ........................................................................................... 3.16 3.1 CARBON FIBER AND COMBINATION PRODUCTS ................................................. 3.16
3.1.1 Overview ................................................................................................... 3.16 3.1.2 Market ....................................................................................................... 3.23 3.1.3 Production ................................................................................................. 3.42 3.1.4 Business Case .......................................................................................... 3.49 3.1.5 Social Acceptance ..................................................................................... 3.54 3.1.6 Environmental Net Effects ......................................................................... 3.54 3.1.7 Manufacturing Locations ........................................................................... 3.55 3.1.8 Technology Readiness Levels ................................................................... 3.56 3.1.9 Intellectual Property .................................................................................. 3.57 3.1.10 Insights and Conclusions .......................................................................... 3.59
3.2 ASPHALT TRANSPORTATION ................................................................................. 3.60 3.2.1 Overview ................................................................................................... 3.60 3.2.2 Market ....................................................................................................... 3.60 3.2.3 Production ................................................................................................. 3.62 3.2.4 Transportation of Asphalt Infrastructure Overview ..................................... 3.63 3.2.5 Technology Readiness Levels ................................................................... 3.71 3.2.6 Business Case .......................................................................................... 3.72 3.2.7 Social Acceptance and Environmental Net Effects .................................... 3.75 3.2.8 Manufacturing Locations ........................................................................... 3.76 3.2.9 Benefits of Asphalt from Oil sands ............................................................ 3.76 3.2.10 Insights and Conclusions .......................................................................... 3.76
3.3 POLYMERS ............................................................................................................... 3.77

BITUMEN BEYOND COMBUSTION – PHASE 2 REPORT
3.3.1 Overview ................................................................................................... 3.77 3.3.2 Insights and Conclusions .......................................................................... 3.81
3.4 VANADIUM FLOW BATTERIES ................................................................................. 3.83 3.4.1 Overview ................................................................................................... 3.83 3.4.2 How do Flow Batteries Work? ................................................................... 3.84 3.4.3 Market ....................................................................................................... 3.87 3.4.4 Production ................................................................................................. 3.94 3.4.5 Vanadium Sources with Mass Balance ..................................................... 3.95 3.4.6 Business Case ........................................................................................ 3.102 3.4.7 Social Acceptance ................................................................................... 3.104 3.4.8 Environmental Net Effects ....................................................................... 3.104 3.4.9 Manufacturing Locations ......................................................................... 3.104 3.4.10 Technology Readiness Levels ................................................................. 3.105 3.4.11 Insights and Conclusions ........................................................................ 3.105
3.5 OVERARCHING CONCLUSIONS ............................................................................ 3.106
4 APPENDIX ..................................................................................................................... 1 4.1.1 What are Quinones? ...................................................................................... 1 4.1.2 Why Quinones?.............................................................................................. 1
LIST OF TABLES Table 1: Small Working Groups ............................................................................................. 2.15 Table 2: Properties of Carbon Fiber versus Other Materials ................................................... 3.17 Table 3: Carbon Yield for Various Raw Materials for CF Production ...................................... 3.20 Table 4: Definitions ................................................................................................................ 3.21 Table 5: Global Carbon Fiber Demand and Corresponding Bitumen Requirements ............... 3.24 Table 6: Properties and Structural Parameters of Various Carbon Fibers, .............................. 3.25 Table 7: Comparison of Feed Costs - PAN versus PE ........................................................... 3.26 Table 8: Cement Production - The G20 Group. Units: million tons ......................................... 3.27 Table 9: CF Addition Rate by Weight to Concrete – Literature References ............................ 3.31 Table 10: Quantity of CF Required at Four Assumed Dosage Rates (wt. % of Cement) at
100% Market Penetration ........................................................................................ 3.32 Table 11: Gross Global Demand for Bitumen and Asphaltene per Assumed Dosage
Rates (wt. %) at 100% Market Penetration .............................................................. 3.32 Table 12: Areas of Steel Usage that May Be Targeted with CF Product ................................ 3.38 Table 13: Demand for CF per Assumption ............................................................................. 3.38 Table 14: Global Asphaltene and Bitumen Requirement per Assumption Set ........................ 3.39 Table 15: OSB - Demand for CF, asphaltene and bitumen .................................................... 3.41 Table 16: VROOM for Asphaltene Extraction ......................................................................... 3.48 Table 17: CAPEX - Very rough order of magnitude (Units: C$) .............................................. 3.50 Table 18: Percentage cost of Acrlylonitrile, PAN precursor, CF and end product by
market application.................................................................................................... 3.52 Table 19: Price Comparison of Various Feedstocks Relative to Automotive Designated
CF ........................................................................................................................... 3.53 Table 20: Alternative Feedstocks and Processes for the Production of CF ............................ 3.58 Table 21: VROOM CAPEX and OPEX Asphalt production ..................................................... 3.72 Table 22: Container Costs - Vancouver to Asia ...................................................................... 3.73

BITUMEN BEYOND COMBUSTION – PHASE 2 REPORT
Table 23: Selling Prices of Asphalt Cement, February 2016 (Don Wessel, 2016) .................. 3.74 Table 24: Global Bitumen* Prices, Aug 2015 (Argus, 2017) ................................................... 3.74 Table 25: General Asphalt OPEX Overview – Fort McMurray to Shanghai ............................ 3.75 Table 26: Polymer list developed in BBC Phase 2 ................................................................. 3.78 Table 27: List of Vanadium Oxides and Derivative Chemicals ................................................ 3.90 Table 28: Example of Vanadium Requirement in a VRFB ...................................................... 3.91 Table 29: Forecast Demand for Vanadium per Assumptions and for a 75% Market Share
of VRFB ................................................................................................................... 3.92 Table 30: Chemical Analysis of Various Fly Ashes (Units: wt %) .......................................... 3.100 Table 31: Theoretical Vanadium Available at Different Bitumen Production Rates ............... 3.100 Table 32: Theoretical Recovery of Vanadium from Fly Ash Post Combustion of 100k bpd
of Bitumen ............................................................................................................. 3.101 Table 33: Vanadium Price and Production, US Geological Survey, 2017 ............................. 3.103 Table 34: Turnover on Vanadium Recovered ....................................................................... 3.103 Table 35: Flow Cell – Cost Comparison ..................................................................................... 2
LIST OF FIGURES Figure 1: Project Timeline ...................................................................................................... 2.12 Figure 2: Mind Map ................................................................................................................ 2.13 Figure 3: Technology Readiness Level .................................................................................. 2.15 Figure 4: From CF Textile Layer to Components .................................................................... 3.18 Figure 5: From PAN White Fiber to CF................................................................................... 3.19 Figure 6: Model of Carbonization / Graphitization ................................................................... 3.22 Figure 7: Trends and Forecasts in Carbon Fiber .................................................................... 3.23 Figure 8: Cement Production split (%) – the G20 Group (2015) ............................................. 3.28 Figure 9: Steel Fiber Reinforced Concrete (SFRC) ................................................................ 3.29 Figure 10: Carbon Fiber Reinforced Structures and 3D Printing ............................................. 3.30 Figure 11: 3D Printing trends in Building and Construction (1997-2016) - Publications by
Country .................................................................................................................... 3.33 Figure 12: CFRP as Structural Materials in the Automotive and Built Sector .......................... 3.35 Figure 13: Apple’s Use of CFRP ............................................................................................ 3.36 Figure 14: Forecast CF Demand by Main Application ............................................................ 3.37 Figure 15: World Crude Steel Production ............................................................................... 3.37 Figure 16: Examples of CFRW ............................................................................................... 3.40 Figure 17: CF Honeycomb Structures and Reinforcing Belt ................................................... 3.41 Figure 18: CF Supply Chain from Resource to Final Product ................................................. 3.43 Figure 19: CF Produced from PAN ......................................................................................... 3.44 Figure 20: Coker off Gas – Source of Propane....................................................................... 3.44 Figure 21: Propane Fraction of Coker Off-Gas ....................................................................... 3.45 Figure 22: Feed Comparison .................................................................................................. 3.47 Figure 23: Carbon Fiber Feedstock from Bitumen (Asphaltenes) ........................................... 3.48 Figure 24: Production of Carbon Fiber ................................................................................... 3.49 Figure 25: CF and Value Chain for CFRP .............................................................................. 3.51 Figure 26: Carbon Fiber Supply and Value Chain: Japan to USA to Germany ....................... 3.56 Figure 27: Technology Readiness Level ................................................................................ 3.57 Figure 28: Production of Carbon Fiber ................................................................................... 3.57 Figure 29: Global Asphalt Market Size ................................................................................... 3.61

BITUMEN BEYOND COMBUSTION – PHASE 2 REPORT
Figure 30: 2016 Global Asphalt Market by Application ........................................................... 3.61 Figure 31: 2030 Global Asphalt Market by Application ........................................................... 3.62 Figure 32: Asphalt production from Bitumen .......................................................................... 3.63 Figure 33: Bitumen Balls ........................................................................................................ 3.65 Figure 34: Nitech’s Asphalt cement Pellets ............................................................................ 3.66 Figure 35: RoadMender - Asphalt cement Pellets on Pallets .................................................. 3.67 Figure 36: North American Rail Network ................................................................................ 3.68 Figure 37: CP Facilities Map .................................................................................................. 3.68 Figure 38: Trans-Asian Railway Network ............................................................................... 3.69 Figure 39: AAPA Canadian Member Ports ............................................................................. 3.70 Figure 40: AAPA U.S. Member Ports ..................................................................................... 3.71 Figure 41: TRL for Asphalt Transportation Technologies ....................................................... 3.72 Figure 42: The environmental impact of widely used modern polymers ................................. 3.79 Figure 43: A Comparison of Transportation Costs .................................................................. 3.81 Figure 44: Examples of Platform Molecules ........................................................................... 3.83 Figure 45: Illustration of a flow battery – electrolyte reservoirs and electrochemical cell ......... 3.84 Figure 46: 60 MWh VRFB Demonstration Facility Built by Sumitomo at Yokohama Works
in 2012 ..................................................................................................................... 3.85 Figure 47: VRFB: Redox Chemistry During Charge and Discharge........................................ 3.85 Figure 48: Publications About Redox Flow Batteries .............................................................. 3.86 Figure 49: Regenesys ............................................................................................................ 3.86 Figure 50: The Chemical Cost for Storage for Representative Rechargeable Batteries .......... 3.87 Figure 51: Forecast growth in VRFB - Bloomberg .................................................................. 3.88 Figure 52: VRFB Electrolyte Preparation Sequence and Method - Vanadium Source:
Vanadyl Sulfate ....................................................................................................... 3.90 Figure 53: Demand for Vanadium as Function of Energy Density and Market Share ............. 3.93 Figure 54: Incremental and Forecast Demand for Vanadium for VRFB - Bloomberg .............. 3.94 Figure 55: Oxovanadium (IV) Complexes of Alkyl Porphyrins. Crude source: Orinoco
Basin, Venezuela. .................................................................................................... 3.95 Figure 56: Paths for the Treatment of Vanadium Raw Materials ............................................ 3.96 Figure 57: Overview of the General Layout of the Evraz Highveld Steel and Vanadium
Facility ..................................................................................................................... 3.97 Figure 58: Shaking Ladle Chemistry for Removal and Oxidation of Vanadium to the Slag
Phase ...................................................................................................................... 3.98 Figure 59: Roasting Chemistries for the Extraction of Vanadium from Titanomagnetite ......... 3.98 Figure 60: SOTEX Process: Extraction of Vanadium and Nickel from Soot and Fly Ash ........ 3.99 Figure 61: Material Flow to a SOTEX Unit .............................................................................. 3.99 Figure 62: Vanadium in Fly Ash (Gasified Asphaltenes) ....................................................... 3.102 Figure 63: TRL for Vanadium Extraction .............................................................................. 3.105 Figure 64: Examples of Quinones .............................................................................................. 1 Figure 65: Hydro- and Benzo-quinone ....................................................................................... 2

BITUMEN BEYOND COMBUSTION – PHASE 2 REPORT
v
Acknowledgements
For the support, advice and continuous endeavors from members of the project team and their organizations:
Alberta Innovates: Axel Meisen, John Zhou, Shunlan Liu, Bryan Helfenbaum
Bowman Centre for Sustainable Energy: Don Wood, Ed Brost
Nexen: Nestor Zerpa
MEG Energy: Darius Remesat
CNRL: Gary Millard, Joy Romero
BASF Canada: Daniel Hebert, Irene Young
Cenovus: Clementina Sosa
Suncor: Todd Pugsley
Canmet Energy: Jinwen Chen, Cecile Siewe
All efforts are gratefully acknowledged, as are the perspectives provided by numerous others.

BITUMEN BEYOND COMBUSTION – PHASE 2 REPORT
vi
Executive Summary
Alberta's oil sands are the third largest oil reserves in the world. As of 2016, Alberta's oil sands proven reserves were 165 billion barrels. Unofficial estimates of reserves have been projected up to 2 trillion barrels of oil.
Oil sands bitumen has an API of less than 10°. The most unique aspect of bitumen is the complex asphaltene molecular structure, imparting a high viscosity to the oil. Asphaltenes make bitumen sticky and "heavy", carrying with it nickel, sulphur and vanadium.
The main objectives of the Bitumen Beyond Combustion (BBC) Phase 2 study were to identify high potential non-combustion products that could be manufactured from oil sands, and assess the market potential for these products up to 2030. The non-combustion aspect of the products is particularly relevant, with respect to identifying potential new markets and opportunities for diversification from conventional combustible products. A significant factor for determining the potential of new products was that the market for each promising product should approach or exceed 100k barrels per day (bpd) bitumen equivalent.
Stantec, Alberta Innovates, participant companies and research institutions (BBC team), worked on developing a Mind Map of potential products, split out into distinct sections – organics, inorganics, combination products and a catch-all ‘future global products’ group. Considering the 100k bpd benchmark, a number of unique products that would not achieve this production rate were not considered.
The BBC team identified a total of 14 different products, outlined in the Mind Map. A decision analysis methodology was developed including different assessment criteria that would be used to determine the top four areas of focus for the detailed analysis stage of the study.
The team determined the following focus areas for the BBC Phase 2 study:
Carbon fibers (CFs) and CF combination products (steel, cement, wood)
Solid Asphalt transportation
Quinone and Vanadium flow batteries
Polymers – review of potential products
Small working groups were assembled to analyze the four selected focus areas.
SUMMARY FINDINGS
Carbon Fiber
CF markets globally are growing at a compound annual growth rate (CAGR) in excess of 10%, although from a small production base of less than 100,000 tons per annum (tpa), this is expected to grow to 250,000 tpa by 2030. Current high feedstock and manufacturing costs are limiting this growth.

BITUMEN BEYOND COMBUSTION – PHASE 2 REPORT
vii
Production of CF is currently derived from both a synthetic feedstock Polyacrylonitrile (PAN) and a synthetic pitch. This study has discovered that bitumen can be used for producing PAN (from cracked gas propane) and potentially a pitch product, utilizing the high-asphaltene content that makes oil sands bitumen unique.
CF physical properties are greatly more favorable than those of steel (greater strength and lower weight). For these and other reasons, CF is widely touted to become the material of the 21st century. If CF production is to grow exponentially, it will need to integrate and replace major global commodities such as Steel, Cement and Wood based products. The impact of exponential growth of CF production could be extremely interesting for oil sands producers.
For example, this study has determined that, if CF could penetrate just 1% of the global steel market by 2030 (26 million tpa), this would require approximately 500,000 bpd of asphaltenes. This could represent a multibillion dollar non-combustion supply opportunity if realized.
CF production can be broken out into three main areas – precursor feedstock, fiber spinning and carbonisation, and end-product manufacturing.
Considering the growth potential and relative early stage of development of the CF industry, there is a tremendous opportunity to work towards oil sands-based feedstocks becoming a major component in the evolving CF industry in the future. Additional aspects of CF production, such as spinning and end product manufacturing, could also present a major economic benefit for Alberta and Canada.
Solid Asphalt Transportation
Global asphalt (binder) markets are experiencing year-on-year growth of 4.1% CAGR. This is expected to continue globally to 2030. The market is driven primarily by infrastructure (roads) construction: the global asphalt binder market is estimated to be over US$50 billion annually (127 million tpa @ US$400/ton average).
Bitumen from Alberta’s oil sands could provide an excellent and consistent quality of asphalt with relatively easy processing. However, to this point, Alberta’s production of asphalt has not found major markets outside of western Canada due to molten-shipping limitations. Current practices involve loading and unloading of asphalt into railcars at 150 °C. Energy-intensive infrastructure is currently needed to load and unload railcars.
The use of alternative asphalt transportation technology, such as pellets or balls at ambient conditions, has the potential to significantly change the overall economics of asphalt shipment from Alberta to other parts of North America and beyond. For example, Asphalt is currently sold in China at C$539/t, leveraging existing processing equipment from oil sands operators to produce an asphalt cut, adding pelletizing and shipment costs would look to be highly competitive. This study projected an estimated cost of C$430/t for asphalt in solid form to arrive in Shanghai.
Asphalt transportation technology represents an opportunity to move significant quantities of oil sands-derived asphalt to markets in the near and medium term and, thus, should be investigated further.
Flow Batteries
The global energy storage market is set to expand rapidly leading up to 2030. This growth is expected to come from expected increases in renewable energy such as solar and wind, as well as the wider adoption of electrical vehicles (EV). Flow batteries are not expected to play a significant role in EV development directly. However, they are poised
BITUMEN BEYOND COMBUSTION – PHASE 2 REPORT
viii
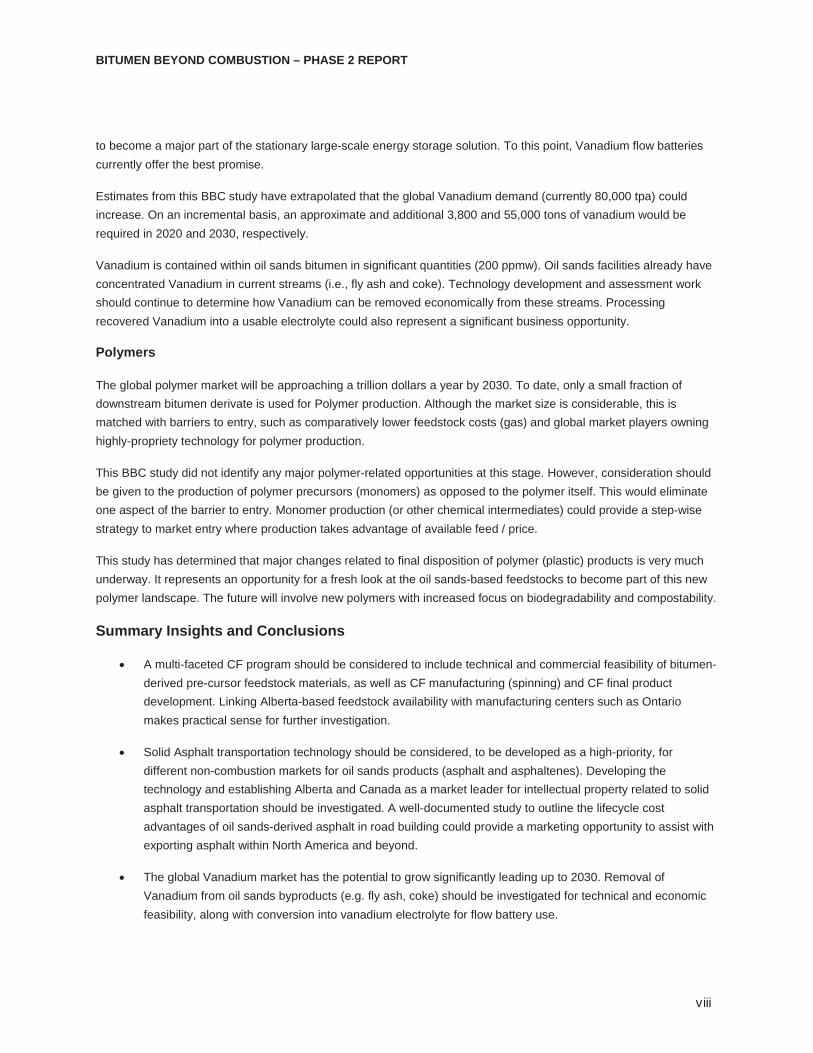
to become a major part of the stationary large-scale energy storage solution. To this point, Vanadium flow batteries currently offer the best promise.
Estimates from this BBC study have extrapolated that the global Vanadium demand (currently 80,000 tpa) could increase. On an incremental basis, an approximate and additional 3,800 and 55,000 tons of vanadium would be required in 2020 and 2030, respectively.
Vanadium is contained within oil sands bitumen in significant quantities (200 ppmw). Oil sands facilities already have concentrated Vanadium in current streams (i.e., fly ash and coke). Technology development and assessment work should continue to determine how Vanadium can be removed economically from these streams. Processing recovered Vanadium into a usable electrolyte could also represent a significant business opportunity.
Polymers
The global polymer market will be approaching a trillion dollars a year by 2030. To date, only a small fraction of downstream bitumen derivate is used for Polymer production. Although the market size is considerable, this is matched with barriers to entry, such as comparatively lower feedstock costs (gas) and global market players owning highly-propriety technology for polymer production.
This BBC study did not identify any major polymer-related opportunities at this stage. However, consideration should be given to the production of polymer precursors (monomers) as opposed to the polymer itself. This would eliminate one aspect of the barrier to entry. Monomer production (or other chemical intermediates) could provide a step-wise strategy to market entry where production takes advantage of available feed / price.
This study has determined that major changes related to final disposition of polymer (plastic) products is very much underway. It represents an opportunity for a fresh look at the oil sands-based feedstocks to become part of this new polymer landscape. The future will involve new polymers with increased focus on biodegradability and compostability.
Summary Insights and Conclusions
A multi-faceted CF program should be considered to include technical and commercial feasibility of bitumen-derived pre-cursor feedstock materials, as well as CF manufacturing (spinning) and CF final product development. Linking Alberta-based feedstock availability with manufacturing centers such as Ontario makes practical sense for further investigation.
Solid Asphalt transportation technology should be considered, to be developed as a high-priority, for different non-combustion markets for oil sands products (asphalt and asphaltenes). Developing the technology and establishing Alberta and Canada as a market leader for intellectual property related to solid asphalt transportation should be investigated. A well-documented study to outline the lifecycle cost advantages of oil sands-derived asphalt in road building could provide a marketing opportunity to assist with exporting asphalt within North America and beyond.
The global Vanadium market has the potential to grow significantly leading up to 2030. Removal of Vanadium from oil sands byproducts (e.g. fly ash, coke) should be investigated for technical and economic feasibility, along with conversion into vanadium electrolyte for flow battery use.

BITUMEN BEYOND COMBUSTION – PHASE 2 REPORT
ix
Review of oil sands feedstocks for future intermediate polymers (monomers) and polymers that incorporate biodegradability and compostability elements to be considered.

BITUMEN BEYOND COMBUSTION – PHASE 2 REPORT
x
Abbreviations
AA acrylic acid
ABS acrylonitrile butadiene styrene resin
ACN acrylonitrile
AIH Alberta Industrial Heartland
AAPA American Association of Port Authorities
ASA acrylonitrile styrene acrylate resin
B&C building and construction
BBC Bitumen Beyond Combustion
bbl barrels
bpd barrels per day
CAGR compound annual growth rate
CAPEX capital cost
CF carbon fiber
CFRC carbon fiber reinforced concrete
CFRP carbon fiber reinforced plastic
CN Canadian National Railways
CP Canadian Pacific
cSt centistoke
EV electrical vehicles
EVA ethylene vinyl acetate
GCOS Great Canadian Oil Sand
GDP Gross Domestic Product
GHG greenhouse gas
GP general purpose
GWh gigawatt hours
HMA hot mix asphalt
HP high performance
LPG Liquefied Petroleum Gas
OPEX operating cost
ORNL Oak Ridge National Laboratory
OSB oriented strand board
PA polyamides
PAH polycyclic aromatic hydrocarbons
PAM polyacrylamide

BITUMEN BEYOND COMBUSTION – PHASE 2 REPORT
xi
PAN polyacrylonitrile
PASA polyaspartic acid
PBAT polybutyrate adipate terephthalate
PBS polybutylene succinate
PBT polybutylene terephthalate
PC polycarbonate
PDH propane dehydrogenation
PE (LD, LLD, MD, HD) polyethylene series
PMA polymer modified asphalt
PP Polypropylene
PS polystyrene
RAP Recycled Asphalt Pavement
SABIC Saudi Basic Industries Corp.
SARA Saturate, Aromatic, Resin, Asphaltene
SMA stone matrix asphalt
tpa ton per annum
USGC US Gulf Coast
USGS US Geological Survey
WMA warm mix asphalt

BITUMEN BEYOND COMBUSTION – PHASE 2 REPORT
Introduction
an c:\users\nashcroft\documents\stantec - business development advisor\general business development\bitumen beyond combustion\post po\final report\12th february\bbc phase ii report_14_a.docx 2.12
1 INTRODUCTIONThe Bowman Centre for Sustainable Energy (BCSE), with Alberta Innovates in attendance held a workshop in January 2016. The objective of the workshop was to identify potential non combustion products that were derived from oil sands bitumen. Following further collaboration, Alberta Innovates (AI) commissioned and released the BBC Phase 1 report in April 2017.
Owing to the wide range of products identified in the Phase 1 report as well as the forward projections of corresponding bitumen production to 2030, it was agreed to proceed to a phase 2. The Phase 1 report has been an invaluable reference throughout the Phase 2 work.
The principal objectives of Phase 2 were to identify new products (in addition to Phase 1) where possible and to distill the combination of all products to 4 or 5 focus areas, and to complete a more detailed technical and economic assessment for the most promising products. Considering this, an execution methodology plan was developed specifically for the purposes of the BBC study in Phase 2.
2 STUDY EXECUTION PLAN The Stantec BBC Phase 2 study execution plan involved breaking out the study into four distinct stages. This process was developed to identify the wider number of products in a relatively short order of time, and apply a quantitative ‘screen’ process to contract the number of products down to a maximum of five, to complete the more detailed techno-economic assessment stage of the study. Of note, the end date of the study was revised to 31 January 2018.
The outline of the execution plan is shown in Figure 1.
Figure 1: Project Timeline

BITUMEN BEYOND COMBUSTION – PHASE 2 REPORT
Study Execution Plan
an c:\users\nashcroft\documents\stantec - business development advisor\general business development\bitumen beyond combustion\post po\final report\12th february\bbc phase ii report_14_a.docx 2.13
2.1 STAGE 1 – INFORMATION GATHERING
Stage 1 involved kicking off the BBC Phase 2 study in August 2017 with a collective BBC team meeting. Following this, Stantec initiated individual meetings with participants and provided tabulated areas of interest for each of the participants with a high-level record of work completed to date.
The process of identifying new products was completed using existing group knowledge of oil sands constituents, as well as building on details that were outlined in the Phase 1 report. The Mind Map tool was used to outline the products that would be evaluated in Stage 2 of the study, as shown in Figure 2.
Figure 2: Mind Map
From the mind map, efforts were made to identify not only products that were clearly able to be manufactured from bitumen (forward looking products), also identifying future global products that could potentially identify new products for consideration. Although ‘future global products’ presented some interesting discussion, no major ‘new’ products were identified.

BITUMEN BEYOND COMBUSTION – PHASE 2 REPORT
Study Execution Plan
an c:\users\nashcroft\documents\stantec - business development advisor\general business development\bitumen beyond combustion\post po\final report\12th february\bbc phase ii report_14_a.docx 2.14
2.2 STAGE 2 – DECISION ANALYSIS (MID TERM WORKSHOP)
Stantec adapted established decision analysis tools to assist with evaluating the products identified in the mind map in Figure 2. The decision analysis tools involved outlining key assessment criteria for each product, as described in the following sections.
2.2.1 Market
Assessing the size of market (the number of buyers or the width of the market) and barriers to entry or accessibility, referring to the hurdles or structural roadblocks for a new product to enter the market in 2030. This invites the question; can this market align with a bitumen equivalent production of 100k bpd or greater?
2.2.2 Production
The forecast of production of the product from oil sands in 2030 in bpd correlates to 100k bpd or greater. It is important to determine whether the potential future products can be produced economically from bitumen.
2.2.3 Business Case (Including CAPEX and OPEX Where Possible)
Ranking the production of the product on a financial risk and return basis. If the development of the product involves the acceptance of a high degree of risk, the return on the product needs to be commensurate. A mismatch between risk and return, where the return on a product is lower than required for the risk, will dissuade investment in the product production.
Where applicable, comparing the relative capital cost (CAPEX) and operating cost (OPEX) of producing the product from an oil sands based feedstock in comparison to functional competitors.
2.2.4 Environmental Net Effects
High level assessment of greenhouse gas (GHG) and water usage. Other issues include changes to air quality, effluent discharge, and general land use. In this conceptual screening analysis the risk to the project resulting from issues of environmental degradation and risk are assessed. This includes the product, its manufacture, transportation, and end of life characteristics.
2.2.5 Social Acceptance
Identifying and evaluating the strength of resistance of the general public, based on any social issues around the manufacture of the product in Alberta and Canada. Broadly based benefit, risk distribution, and mitigation are determinants of social acceptance.
2.2.6 Manufacturing Location
Measures the "natural" or "status quo" pros and cons of manufacturing the product in Alberta or Canada. Manufacturing facilities are grouped into one or more of the following categories: those that are close to the source of production, those that are close to transportation hubs, and those that are close to markets. Different types of product may be advantaged based on location.

BITUMEN BEYOND COMBUSTION – PHASE 2 REPORT
Study Execution Plan
an c:\users\nashcroft\documents\stantec - business development advisor\general business development\bitumen beyond combustion\post po\final report\12th february\bbc phase ii report_14_a.docx 2.15
2.2.7 Technology Readiness Levels
Based on the Government of Canada guideline, a technology readiness level (TRL) ranking of 1 to 10 to include a terminal value of 10 indicating a commercially mature product.
Figure 3: Technology Readiness Level
2.3 STAGE 3 – FOCUSED TECHNO ECONOMIC ANALYSIS
The decision analysis (mid-term workshop), identified the following four areas as the products and areas of focus for further review in Stage 3.
Carbon fibers and combination products (the latter products were originally separate)
Solid Asphalt transportation
Polymers
Vanadium flow batteries
Small working groups were set up to align areas of interest to expedite progress on selected focus areas, Table 1.
Table 1: Small Working Groups
Focus area CNRL BASF Suncor MEG Energy Cenovus Bowman Nexen
CNOOC NRC / Canmet
Energy
Carbon Fibers X X X X X Observer
Combination Products X X X Observer
Asphalt – Transportation X X X X X Observer
Polymers X X X X Observer
Vanadium - Flow Batteries X X X Observer
2.4 STAGE 4 – DETAILED SUMMARIES
The detailed summaries for the four selected products are detailed in the following section.

BITUMEN BEYOND COMBUSTION – PHASE 2 REPORT
Detailed Summaries
an c:\users\nashcroft\documents\stantec - business development advisor\general business development\bitumen beyond combustion\post po\final report\12th february\bbc phase ii report_14_a.docx 3.16
3 DETAILED SUMMARIES
3.1 CARBON FIBER AND COMBINATION PRODUCTS
3.1.1 Overview
A CF is made up of 1,000 to 24,000 individual filaments called a “tow”. Commercially, CF is available at different tows. Each filament in the fiber is approximately 5-10 microns in diameter and is principally composed of carbon atoms, more or less aligned along the fiber axis. Products that incorporate CF generally display high stiffness, high tensile strength, high chemical resistance, and temperature tolerance with low thermal expansion. Most importantly, CFs are able to do this at a lower weight than comparable materials. Refer to Table 2 for the comparison. CF has consequently found wide application in technically demanding sectors such as aerospace, civil engineering, military, motorsports and sporting goods industries. Once CF has been manufactured and wound to spool, the spooled fiber (or thread) in terms of further processing has parallels to the textile industry. Each thread is wound into thicker thread (per specification), then woven into mat or rope form. By example: a high tensile strength PAN fiber might end up as a CF rope1 or in sheet-form for the cone of an aircraft / radar dome. In contrast, where stiffness is a key factor, a sheet of cloth (where the CF is pitch derived) may be the material of choice.
1 KONE UltraRope™, http://www.kone.com/en/stories-and-references/stories/its-all-about-a-rope.aspx. Accessed 16th Jan. 2018.

BITUMEN BEYOND COMBUSTION – PHASE 2 REPORT
Detailed Summaries
an c:\users\nashcroft\documents\stantec - business development advisor\general business development\bitumen beyond combustion\post po\final report\12th february\bbc phase ii report_14_a.docx 3.17
Table 2: Properties of Carbon Fiber versus Other Materials
Despite the evident advantages of CF, it currently suffers from two key disadvantages. The high manufacturing cost of the CF and precursor polymer or alternative feed (e.g., pitch) and the need for new more cost-effective manufacturing technologies. CF presents considerable weight saving opportunities in the automotive sector, resulting in fuel savings, but it cannot be stamped or welded like sheet metal. Modified and new production line technology covering activities like vacuum forming and autoclaves (for resin cure, as shown in Figure 4) is required.
No MaterialHeat
conductionSpecific Gravity
Stiffness (Young's modulus) GPa
Tensile strengthMpa
Diameter(microns)
Remarks
1 Aluminium 210 2.70 69 124 - 290
2 Steel 50 7.80 200200 - 800 (conventional)
800 - 2000 (high strength)
3CF - Lignin (Hardwood
Kraft)- - 40 420
Non-structural applications e.g.
insulation.
4 CF - PAN 1.7 - 1.79 230 - 380 3,500 - 5,800 5 - 10High strength applications.
5 CF - pitch 2 - 2.2 500 - 800 3,100 5 - 10High stiffness applications.
6 CF - Rayon - 33 276 15
Ablative applications e.g. solid rocket motor and exit
nozzles.
7 Kevlar 149 - 1.50 179 3,450 Varies8 Polyethylene (HDPE) - 0.9 - 1.4 0.18 - 1.6 15
References
Recent Developments on Carbon Fibers from Rayon-Based Precursors, slide 7. G. Bhat et al, University of Tennessee
Carbon Fiber from Biomass, A. Milbrandt et al, Clean Energy Manufacturing Centre, Technical Report NREL/TP-6A50-66386, Sept. 2016
5 - 7
http://www.dexcraft.com/articles/carbon-fiber-composites/aluminium-vs-carbon-fiber-comparison-of-materials/#weight_and_density
http://www.worldautosteel.org/steel-basics/automotive-steel-definitions/
https://www.engineeringtoolbox.com/engineering-materials-properties-d_1225.html
Carbon Fibers from Kraft Lignin, PDF page 31, I. Norberg, Thesis, HTH Royal Inst. of Technology, School of Chemical Science and Eng. Dept. of Fiber and Polymer Technology, Division of Wood Chemistry and Pulp Technology.
Stockholm 2012.

BITUMEN BEYOND COMBUSTION – PHASE 2 REPORT
Detailed Summaries
an c:\users\nashcroft\documents\stantec - business development advisor\general business development\bitumen beyond combustion\post po\final report\12th february\bbc phase ii report_14_a.docx 3.18
Figure 4: From CF Textile Layer to Components
As a result, despite the promise of CF, the growth of the industry has been constrained.
Literature suggests that 96% of all CF entering the market is produced from PAN (polyacrylonitrile), with the remaining being largely derived from a pitch-type feedstock2. The high cost for PAN based CF is a function of the cost of the starting raw material (propylene), the intermediate chemical conversion steps (propylene to acrylonitrile3, acrylonitrile to PAN) and the technology needed to spin PAN to fiber, to carbonize said fiber and getting it to a point where it can be woven. In summary, the production of CF from PAN involves numerous complex chemical conversion and mechanical steps that are capital and energy intensive, as well as proprietary.
The preceding information tells of the industry structure. The barriers to entry are high but raise its attractiveness. The high cost of CF along with the need for adjusted and or new manufacturing techniques has meant that its use and deeper penetration into the market has been limited to technically demanding products that justify the investment. On this basis, it is suggested that while there is a degree of maturity in the CF market, it is at the medium (e.g., luxury automotive) to higher end (e.g., aerospace) of the market and not the medium to lower end, where it remains somewhat open if the cost of fiber and attendant technologies can be addressed to make it attractive to this segment. Accordingly, existing and aspiring CF producers have looked to the complete value chain to lower costs to open
2 Global Carbon Fiber Composites Supply Chain Competitiveness Analysis, Sujit Das, Josh Warren, and Devin West. Energy and Transportation Science Division, Oak Ridge National Laboratory. May 2016, PDF page no. 15.
3 Until the mid-2000’s the only commercial technology to produce ACN was the BP Sohio process.
29
Carbon fiber textile layer to component
BMWi production conceptSource: https://gaycarboys.com/2013/09/22/a-revolution-in-car-making-bmw-i-production/. Accessed 11th Jan. 2018
Wet compression molding is used to produce "Carbon Core" passenger cell
components for the BMW 7 Series.Source:
https://www.compositesworld.com/blog/post/wet-compression-molding/. Accessed 11th Jan. 2018
BITUMEN BEYOND COMBUSTION – PHASE 2 REPORT
Detailed Summaries
an c:\users\nashcroft\documents\stantec - business development advisor\general business development\bitumen beyond combustion\post po\final report\12th february\bbc phase ii report_14_a.docx 3.19
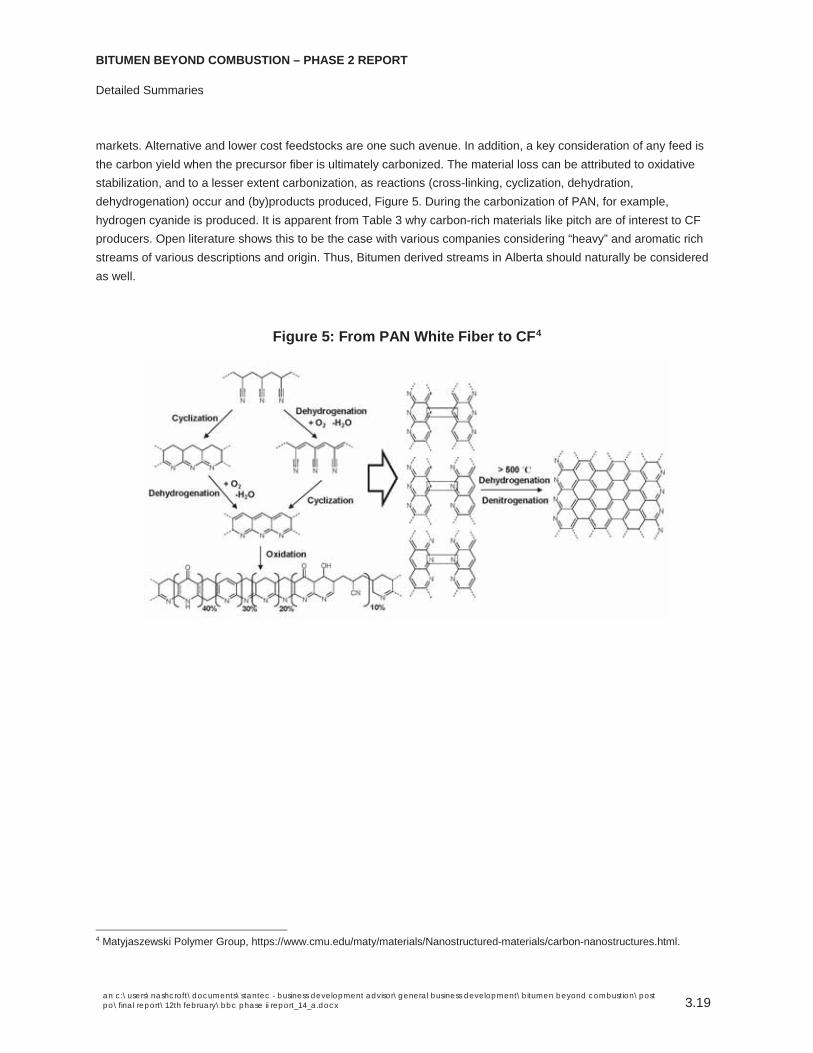
markets. Alternative and lower cost feedstocks are one such avenue. In addition, a key consideration of any feed is the carbon yield when the precursor fiber is ultimately carbonized. The material loss can be attributed to oxidative stabilization, and to a lesser extent carbonization, as reactions (cross-linking, cyclization, dehydration, dehydrogenation) occur and (by)products produced, Figure 5. During the carbonization of PAN, for example, hydrogen cyanide is produced. It is apparent from Table 3 why carbon-rich materials like pitch are of interest to CF producers. Open literature shows this to be the case with various companies considering “heavy” and aromatic rich streams of various descriptions and origin. Thus, Bitumen derived streams in Alberta should naturally be considered as well.
Figure 5: From PAN White Fiber to CF4
4 Matyjaszewski Polymer Group, https://www.cmu.edu/maty/materials/Nanostructured-materials/carbon-nanostructures.html.
BITUMEN BEYOND COMBUSTION – PHASE 2 REPORT
Detailed Summaries
an c:\users\nashcroft\documents\stantec - business development advisor\general business development\bitumen beyond combustion\post po\final report\12th february\bbc phase ii report_14_a.docx 3.20
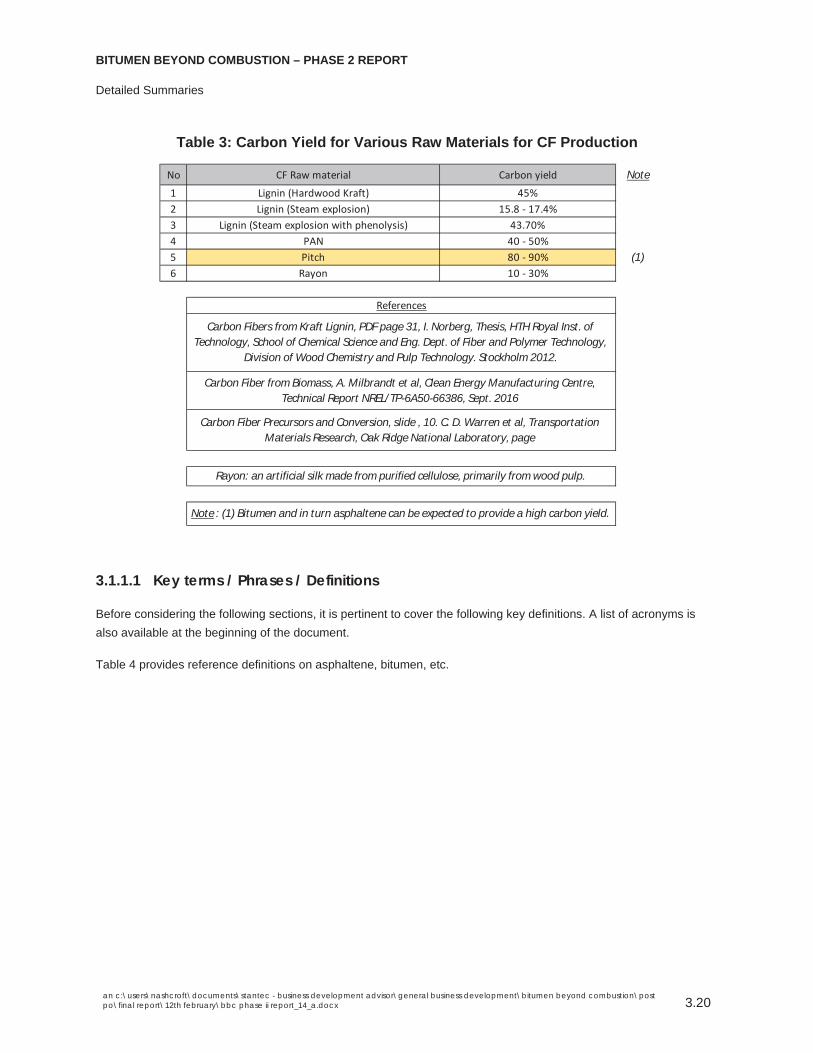
Table 3: Carbon Yield for Various Raw Materials for CF Production
3.1.1.1 Key terms / Phrases / Definitions
Before considering the following sections, it is pertinent to cover the following key definitions. A list of acronyms is also available at the beginning of the document.
Table 4 provides reference definitions on asphaltene, bitumen, etc.
No CF Raw material Carbon yield Note1 Lignin (Hardwood Kraft) 45%2 Lignin (Steam explosion) 15.8 - 17.4%3 Lignin (Steam explosion with phenolysis) 43.70%4 PAN 40 - 50%5 Pitch 80 - 90% (1)6 Rayon 10 - 30%
Note : (1) Bitumen and in turn asphaltene can be expected to provide a high carbon yield.
Carbon Fibers from Kraft Lignin, PDF page 31, I. Norberg, Thesis, HTH Royal Inst. of Technology, School of Chemical Science and Eng. Dept. of Fiber and Polymer Technology,
Division of Wood Chemistry and Pulp Technology. Stockholm 2012.
References
Carbon Fiber from Biomass, A. Milbrandt et al, Clean Energy Manufacturing Centre, Technical Report NREL/TP-6A50-66386, Sept. 2016
Carbon Fiber Precursors and Conversion, slide , 10. C. D. Warren et al, Transportation Materials Research, Oak Ridge National Laboratory, page
Rayon: an artificial silk made from purified cellulose, primarily from wood pulp.

BITUMEN BEYOND COMBUSTION – PHASE 2 REPORT
Detailed Summaries
an c:\users\nashcroft\documents\stantec - business development advisor\general business development\bitumen beyond combustion\post po\final report\12th february\bbc phase ii report_14_a.docx 3.21
Table 4: Definitions
No Word / phrase Description Note
1 Asphaltene
A subset of bitumen. A carbonaceous material that can be found in any carbon source. Typically found as part of the "heavy" or bottoms fractions obtained through a variety of chemical processes (e.g. FCC, Vacuum residue etc.). Also found as a colloidally dispersed
fraction in crude oil, typical mass fraction 0-10%. Composition: highly aromatic - 7 membered fused aromatic rings with alkyl substitution as well as cycloalkanes. Molecular
weight range (400-600, possibly as high as 1,000). Alkyl bridging forms clusters of aromatic compounds. Overall the composition of asphaltenes are extremely diverse.
Composition is a function of primary origin (coal, petroleum) and processing history and therefore will contain variable concentrations of metals, nitrogen and sulphur species. At an operational level asphaltenes are characterised by their solubility in e.g. toluene and
paraffinic solvents (pentane, n-heptane).
(1)
2 Bitumen (Alberta)
(i) A black viscous mixture of hydrocarbons obtained naturally or as a residue from petroleum distillation.
(ii) Composition: a range of hydrocarbons from lights to heavies with a higher proportion of heavies where this covers "SARA": Saturates (16 - 25)%, Mr(460), Aromatics (31 -45)%, Mr(522), Resins (20-38)% Mr(1,040), Asphaltenes (5-22%) Mr(+1,800). API: 8 - 12. C5 and
C7 insolubles: 17 - 30wt%. Sulphur ~5%.
(2)
3 Pitch (modified)A pitch that has been subjected to one or more process steps to increase the meso-phase
content with a view to spinning the material to CF.(3)
4 Pitch (natural)Produced by the destructive distillation of coal / petroleum or other carbonaceous
material.
5 Pitch (synthetic)Produced by the pyrolysis of synthetic polymers. Or via the catalytic polymerisation of
naphthalene / anthracene.(4)
6 ResidueSomething that remains after a part is taken, separated, or designated or after the
completion of a process. (Merriam Webster).
Reference
(1)Asphaltene Molecular-Mass Distribution Determined by Two-Step Laser Mass
Spectrometry, A. Pomerantz et al., Energy Fuels, 2009, 23(3).
(2)Characterisation and Asphaltene Precipitation Modelling of Native and Reacted Crude
Oils, PhD thesis, D. Power. U. of Calgary 2014.
(3) Patent US4999099 (Conoco): Process for making mesophase pitch.
(4)
(i) US4670129 (Mitsubishi).(ii) "High Performance Moderate Cost Mesophase Pitch Based Carbon Fibers ", I. Mochida
et al. Inst. Of Advanced Material Study, Kyushu University and Mitsubishi Gas Chemical Company.

BITUMEN BEYOND COMBUSTION – PHASE 2 REPORT
Detailed Summaries
an c:\users\nashcroft\documents\stantec - business development advisor\general business development\bitumen beyond combustion\post po\final report\12th february\bbc phase ii report_14_a.docx 3.22
The following are key to appreciating what feedstocks are suitable for producing CF and the grade. A feed like pitch can be defined as being:
Isotropic pitch: a pitch or asphaltenic feed that is largely characterized as isotropic. Such material is typically used to produce general purpose (GP) CF and would be used for less technically demanding applications.
Mesophase pitch: a pitch that has been processed to create internal structure through the chemistry itself of the feed. The result is layered / stacked and oriented polyaromatic rings (i.e., the molecules are oriented in a way that will later aid the carbonization / graphitization process proposed by March and Griffiths, shown in Figure 6). Consequently, the produced CF is expected to show high stiffness and tensile strength and might be used for higher performance (HP) applications like wind turbines. Such pitch would be described as anistropic.
Where “anistropic” and isotropic mean:
Anistropy(ic): where the properties of a material vary in different [crystallographic] orientations.
Isotropy(ic): where the properties of a material are the same in different [crystallographic] orientations.
Figure 6: Model of Carbonization / Graphitization5
5 The “carbonization” of a fiber is achieved as a progression of the following steps: (i) Oxidative Stabilisation: 200-400oC in air; (ii) Carbonisation (dehydrogenation and denitrogenation): 900-1,600oC in inert atmosphere; (iii) Graphitization: 1,800-3,000oC in inert atmosphere.

BITUMEN BEYOND COMBUSTION – PHASE 2 REPORT
Detailed Summaries
an c:\users\nashcroft\documents\stantec - business development advisor\general business development\bitumen beyond combustion\post po\final report\12th february\bbc phase ii report_14_a.docx 3.23
3.1.2 Market
Total annual production (2015) for CF, relative to other bulk commodities such as polymers and steel, is quite small, at roughly 80,000 tpa. For comparative purposes, global steel production in 2016 was 1.6 billion tons.
The global Carbon Fiber Reinforced Plastic6 (CFRP7) market is projected to reach US$37 billion by 2022, and approximately US$77 billion by 2030. Growing off a small base, the demand for CF is expected to reach 93,000 t by 2018, representing a 12.5% CAGR. This is based off three industry projections of demand growth made in 2012 and 20138.
Major factors fueling the growth of the CFRP market include the increased use of CF composites in the large aircraft industry. A rise in demand is also expected on the back of demand for lightweight, fuel-efficient vehicles9 and for production of wind turbine blades for renewable energy.
Figure 7: Trends and Forecasts in Carbon Fiber
A major restraint for growth of the CFRP market is the claimed high overall manufacturing cost of fiber. The price of automotive grade CF is approximately US$15/lb. If this price is decreased to between US$5/lb and US$7/lb, then CF could potentially be used for mass production of automobiles. Automotive is the fastest-growing end-use industry segment of the CFRP market.
The following are key market observations aspects from the referenced Oak Ridge National Laboratory report.
6 Note: the words plastic and polymer are used interchangeably. 7 While CFRP is the abbreviation commonly used, it can be misleading in terms of the use of the word “plastic”. ‘Plastic” is used interchangeably with “polymer”. In the case of CFRP is intended to mean any intermediate or final product that contains CF (chopped / unchopped). 8 Global Carbon Fiber Composites Supply Chain Competitiveness Analysis, Sujit Das, Josh Warren, and Devin West. Energy and Transportation Science Division, Oak Ridge National Laboratory. May 2016 9 Cars, trucks, busses and similar where the effect of lower weight materials benefits fuel consumption.

BITUMEN BEYOND COMBUSTION – PHASE 2 REPORT
Detailed Summaries
an c:\users\nashcroft\documents\stantec - business development advisor\general business development\bitumen beyond combustion\post po\final report\12th february\bbc phase ii report_14_a.docx 3.24
Europe leads the world in CF and CFRP demand, and is expected to retain that lead.
Demand growth in North America is expected to follow Europe and exceed demand growth rates of both Asia and Japan.
Excess manufacturing capacity exists currently, especially in small-tow10 capacity in North America and Asia. Recent forecasts suggest significant demand growth in the large-tow markets of wind and automotive applications necessitating capacity expansions to meet demand. This creates a potential export opportunity for North American manufacturers.
Wind energy: CFs used here are moderate to large-tow fibers (a group of parallel filaments) accounting for approximately 17% of total CF demand. Projected growth: 17,600 tpa to 25,000 tpa in 2018.
Aerospace: strict performance requirements, uses small-tow fibers. Production capacity is centered in Asia. Production in major supply chains includes precursor and CF nodes located in the US. Capacity exceeds current demand.
Automotive: the sector has slowly expanded its use of CF and CFRP. A continued CAGR of 20% or higher is expected in the next several years. Most of the demand is from BMW.
Pressure vessels: North America leads the world in current and projected production of CF pressure vessels. Seven of the eight leading manufacturers of these Type III and IV pressure vessels are in North America, five of which are in the US. Materials account for 90% of the total cost of CFRP pressure vessels. While the outlook for CF is promising, it is off a small base.
Table 5 from the BBC Phase 1 report shows what the forecasted demand means for the supply side of the equation with respect to bitumen- and Asphaltene-based CF production.
Table 5: Global Carbon Fiber Demand and Corresponding Bitumen Requirements
10 Tow: the word “tow: refers to an untwisted bundle of continuous filaments. The type of tow varies as a function of the number of filaments. By example: 12K means the tow contains approximately 12,000 filaments. Commercially available tows cover: 1K to 350K. Small tow: 1K to 24K. Large tow: >24K.

BITUMEN BEYOND COMBUSTION – PHASE 2 REPORT
Detailed Summaries
an c:\users\nashcroft\documents\stantec - business development advisor\general business development\bitumen beyond combustion\post po\final report\12th february\bbc phase ii report_14_a.docx 3.25
3.1.2.1 PAN Derived Versus Pitch Based Carbon Fiber
Du Pont produced the first PAN fiber in 1946 in the US. It can reasonably be assumed that when development on PAN (copolymer11) based CF started, it did so off an understood technical base of PAN destined for fabrics, as well as the skills and machinery of the textile industry.
PAN as a CF precursor was obvious and circumstantially the default choice. At the time, pitches were (and remain relatively speaking) poorly understood. Analytical techniques and separations technology had yet to develop to current levels. It was possible that propylene of a suitable quality and grade was readily available. There was a viable market for “heavies” (e.g., bunker fuel, asphalts for road building) and the market had a different outlook on the environment with no pressing need to find alternative markets / applications. Lastly, the PAN route offered a production route that carried lower development risk and offered a faster route to commercial success.
The focus of any emerging technology must also be on those market segments that can afford the technology. The high-end CF markets received this first attention. It was only with the steady adoption of CF that the middle to lower segments received attention. Because cost was and remains a factor for the latter, alternatives to PAN-based CF began to receive attention. A further reason is that pitch-based CF’s offer a product with different performance properties (Table 6) where they do not serve the same market.
Table 6: Properties and Structural Parameters of Various Carbon Fibers12,13
The high cost of CF across the full supply chain, relative to traditional materials like steel (and later aluminum) in the automotive sector, has been a key factor to a slow adoption rate of the fiber. Consequently, it is only companies of
11 In most literature, it is stated that PAN is the precursor to 80-96% of CF produced currently. It is an important distinction to note that whilst this is not incorrect, at a deeper technical level, it is more correct to say the precursor is a “polyacrylonitrile copolymer”. i.e., whilst the bulk of the polymer is made up of acrylonitrile monomer”, the remainder comprises other monomer(s). Examples could be: acrylic acid, methacrylic acid, itaconic acid. The role of the comonomer is to effect oxidation / carbonization, the production and properties of intermediate CF produced as well as fiber conditioning (sizing). 12 “High Strength and high modulus carbon fibers”, H. Gi Chae et al, School of Materials Science and Engineering, Georgia Inst. Of Technology. Carbon 93 (2015). pages 81 – 87. 13 WAXD analysis: Wide Angle X-Ray Diffraction.

BITUMEN BEYOND COMBUSTION – PHASE 2 REPORT
Detailed Summaries
an c:\users\nashcroft\documents\stantec - business development advisor\general business development\bitumen beyond combustion\post po\final report\12th february\bbc phase ii report_14_a.docx 3.26
the caliber of BMW that are willing to expend significant effort to get CF into their vehicles. Cost remains a concern and it is pertinent considering the discussion on propane, that ORNL reported in 2012 on a process for producing CF from polyethylene14 (PE).
A separate 2015 article15 suggests CF from PE as opposed to PAN could be as much as 30% cheaper. Wortberg (2015)16 reports on a process for producing CF from various polyethylene (PE) grades via stabilizing the PE by sulfonation. Cost comparisons for PAN as a feed for CF (row 3 and 4) versus PE (row 5 and 6) are shown in Table 7.
Table 7: Comparison of Feed Costs - PAN versus PE
3.1.2.2 Combination Products
The major step change and subsequent demand for CF in theory should occur when it is more widely adopted as a construction (filler) and structural material. This includes: carbon fiber reinforced concrete (CFRC), light weight CFRP structural beams and other products where the use of CF provides a more efficient and a lower environmental impact
14 “ORNL process converts polyethylene into carbon fiber”, March 27, 2012. https://www.ornl.gov/news/ornl-process-converts-polyethylene-carbon-fiber. 15 “How BMW weaves, bakes, and builds the carbon fiber 7 Series”. Bill Howard, 15th July 2015. Source: https://www.extremetech.com/extreme/209812-how-bmw-weaves-bakes-and-builds-the-carbon-fiber-7-series 16 “Polyethylene-Based Carbon Fibers by the Use of Sulphonation for Stabilization”, Gisa Wortberg et al, Institut für Textiltechnik, RWTH Aachen University, Otto-Blumenthal-Straße 1, 52074 Aachen, Germany. http://www.mdpi.com/2079-6439/3/3/373.
No Description Unit1 US$ / kg 18 312 € / kg 15 25
3 US$ / kg 9 154 € / kg 7 12
5 US$ / kg 1.2 1.86 € / kg 1 1.5
(2) “How BMW weaves, bakes, and builds the carbon fiber 7 Series”. Bill Howard, 15th July 2015. https://www.extremetech.com/extreme/209812-
how-bmw-weaves-bakes-and-builds-the-carbon-fiber-7-series.
Value (range)
CF cost (PAN based)
PAN (CF grade) - cost of
Polyethylene - cost of
References(1) “Polyethylene-Based Carbon Fibers by the Use of Sulphonation for Stabilization”,
Gisa Wortberg et al, Institut für Textiltechnik, RWTH Aachen University, Otto-Blumenthal-Straße 1, 52074 Aachen, Germany. http://www.mdpi.com/2079-
6439/3/3/373.

BITUMEN BEYOND COMBUSTION – PHASE 2 REPORT
Detailed Summaries
an c:\users\nashcroft\documents\stantec - business development advisor\general business development\bitumen beyond combustion\post po\final report\12th february\bbc phase ii report_14_a.docx 3.27
solution. This includes material such as carbon fiber reinforced wood (CFRW) products, commonly and collectively referred to as bio-composites. CFRC, CFRP, and CFRW are discussed separately as follows.
3.1.2.3 Carbon Fiber Reinforced Cement
In this section “carbon fiber” should be read to mean chopped CF (e.g., length 3-10 mm, diameter 13-18 μm17 ) and not continuous CF that exists in the form of structural elements such as bars. CF in the form of structural elements is covered in Section 3.1.2.4, page 3.35.
Concrete is the most widely used construction material in the world; US and G20 cement production in 2015 totaled 83 million and 3.5 billion tons per annum (tpa) respectively, Table 8. China, at 2.4 billion tpa has and is expected to maintain the dominant demand position. The percentage split for the G20 producers is shown in Figure 8. According to the reference18, the concrete and cement sector is forecast to grow at a CAGR of 5.4% over an undisclosed period.
Table 8: Cement Production - The G20 Group. Units: million tons
17 Osaka Gas Chemicals, Japan. DONACARBO Chop; http://www.ogc.co.jp/e/products/carbon-f/donacarbo_chop.html 18 Global Concrete & Cement Market Growth 5.36% CAGR by 2020 - Analysis, Technologies & Forecasts Report 2015-2020 - Vendors: Cemex, SAB, Heidelberg Cement - Research and Markets. Source: https://www.businesswire.com/news/home/20161028005807/en/Global-Concrete-Cement-Market-Growth-5.36-CAGR. Accessed 8th Jan. 2018.
No Country 2001 2007 2008 2009 2010 2011 2012 2013 2014 2015CAGR
(2007 - 2015)
G20 production split (2015)
1 China 661 1,361.2 1,388.4 1,644.0 1,881.9 2,063.2 2,137.0 2,420.0 2,480.0 2,350.0 7.1% 67.5%2 India 103 170.5 185.0 205.0 220.0 240.0 270.0 280.0 260.0 270.0 5.9% 7.8%3 EU28 226 269.1 250.8 209.0 192.1 191.6 172.6 166.6 166.8 167.2 -5.8% 4.8%4 USA 89 95.5 86.3 63.9 65.2 68.6 74.9 77.4 83.2 83.4 -1.7% 2.4%5 Brazil 39 45.9 51.6 51.7 59.1 63.0 68.8 70.0 72.0 72.0 5.8% 2.1%6 Turkey 30 49.3 51.4 54.0 62.7 63.4 63.9 72.7 71.2 72.8 5.0% 2.1%7 Russian Federation 29 59.9 53.5 44.3 50.4 56.1 53.0 72.0 68.4 69.0 1.8% 2.0%8 Indonesia 31 35.0 38.5 36.9 39.5 45.2 32.0 56.0 65.0 65.0 8.0% 1.9%9 South Korea 52 52.2 51.7 50.1 47.4 48.2 48.0 47.3 63.2 63.0 2.4% 1.8%
10 Japan 80 71.4 67.6 59.6 65.6 56.4 51.3 57.4 53.8 55.0 -3.2% 1.6%11 Saudi Arabia 20 30.3 37.4 37.8 42.5 48.0 50.0 57.0 55.0 55.0 7.7% 1.6%12 Mexico 33 38.8 37.1 35.1 34.5 35.4 35.4 34.6 35.0 35.0 -1.3% 1.0%13 Germany 32 33.4 33.6 30.4 29.9 33.5 32.4 31.5 32.1 31.1 -0.9% 0.9%14 Italy 40 47.5 43.0 36.3 34.4 33.1 26.2 23.1 24.0 20.8 -9.8% 0.6%15 France 19 22.1 21.2 18.1 18.0 19.4 18.0 17.5 16.4 15.6 -4.3% 0.4%16 South Africa 8 13.7 13.4 11.8 10.9 11.2 13.8 14.9 13.8 14.0 0.3% 0.4%17 Canada 12 15.1 13.7 11.0 112.4 12.0 12.5 12.1 12.8 12.5 -2.3% 0.4%18 Argentina 6 9.6 9.7 9.4 10.4 11.6 10.7 11.9 11.8 12.2 3.0% 0.4%19 United Kingdom 12 12.6 10.5 7.8 7.9 8.5 7.9 8.5 9.3 9.6 -3.3% 0.3%20 Australia 7 9.2 9.4 9.2 8.3 8.6 8.8 8.6 9.0 9.1 -0.1% 0.3%
21 Total 1,528 2,442 2,454 2,625 2,993 3,117 3,187 3,539 3,603 3,482 4.5% 100%
Source: https://cembureau.eu/cement-101/key-facts-figures/Accessed 8th Jan. 2018

BITUMEN BEYOND COMBUSTION – PHASE 2 REPORT
Detailed Summaries
an c:\users\nashcroft\documents\stantec - business development advisor\general business development\bitumen beyond combustion\post po\final report\12th february\bbc phase ii report_14_a.docx 3.28
Figure 8: Cement Production split (%) – the G20 Group (2015)
Global markets for CF in concrete are already commercially available for use in on grade slabs, as well as a shotcrete or spray on coatings for rock face stabilization and tunnel linings, amongst other applications. The application has been in development for several decades and commercially available for at least 5 years. By example, SGL Group presented a product CARBOCRETE® in Singapore in 201319. Whilst CFRC demonstrates superior structural properties, its use as a structural component has not yet been wide spread. This is possibly due to a delay in the development and implementation of the necessary building codes and industry conservativeness.
It should be noted that the concept of adding fiber as a solid to provide first crack, shrinkage crack and drying shrinkage crack reinforcement to concrete is not new. Examples from ABC Polymer Industries20 (Alabama, US) demonstrate this:
Polymer fiber:
o FIBERFORCE 1000 HP21: “a monofilament macrosynthetic fiber developed from a specific blend of polypropylene and polyethylene resins”
Steel fiber:
o STEEL PRO T122: “a cold-drawn steel wire fiber solely for use as secondary / post-first crack reinforcement in concrete.” See Figure 9.
19 “Carbon Materials for Tropical Megacities: SGL Group Presents New CARBOCRETE® Material in Singapore”, 30th April 2013. https://www.sglgroup.com/cms/international/press-lounge/news/2013/04/04302013_p.html?__locale=en. Accessed 9th January 2018. 20 http://abcpolymerindustries.com/about/ 21 http://abcpolymerindustries.com/fibers/fiberforce-1000-hp/ 22 http://abcpolymerindustries.com/fibers/steel-pro-t1/

BITUMEN BEYOND COMBUSTION – PHASE 2 REPORT
Detailed Summaries
an c:\users\nashcroft\documents\stantec - business development advisor\general business development\bitumen beyond combustion\post po\final report\12th february\bbc phase ii report_14_a.docx 3.29
Figure 9: Steel Fiber Reinforced Concrete (SFRC)
A major future demand for CFRC could be in the development of 3D printed structures, Figure 10, (B) to (D). This new form of construction has shown significant advantages over traditional methods in many functional areas and has high potential to compete on cost as traditional labour intensive reinforcement is replaced with fiber. This potential is driven through the ability to produce higher value structures using robotic construction machines that do not require form work and have a lower labor contribution. A further possible advantage of carbon over steel fiber is pumpability; CF is flexible and is possibly less prone to causing blockages than steel fiber.
24
Steel fiber reinforced concrete (SFRC)
Different shapes of commercially available steel fiber. Steel fiber is
dispersed at between 0.3% and 2.5% by volume in plain concrete.
Lesa Systems. Source:
http://www.lesasystems.com.au/products/steel_fibres/index.aspx
SFRCSourcehttps://www.euroquarz.com/products/toll-
manufacturing/charging-and-mixing/

BITUMEN BEYOND COMBUSTION – PHASE 2 REPORT
Detailed Summaries
an c:\users\nashcroft\documents\stantec - business development advisor\general business development\bitumen beyond combustion\post po\final report\12th february\bbc phase ii report_14_a.docx 3.30
Figure 10: Carbon Fiber Reinforced Structures and 3D Printing
The technology of using fibers and CFs in concrete to improve on strength has been extensively researched. In the case of CF, the material is for example, first dispersed in a solution of water along with various chemical additives to aid fiber wettability (e.g., cellulose, fumed silica) followed by forced mixing with the concrete itself prior to application of the concrete. Wang (2014)23 suggests there are a variety of dispersion chemistries24 where the CFs surface chemistry (in terms of wettability) is considered. Fiber wettability affects the dosage rate and ease of addition. These then impact the overall demand for CF and the cost of addition. All the aforesaid impacts the final properties of the concrete. Literature indicates that research into the dispersion of CF into cement continues.
Depending on the application and the properties of the CF (length, diameter and physical properties), the manner of dispersion into the concrete mix has been shown25 to increase compressive and tensile strength by up to 43% and 17% respectively, with a high consistency of mechanical characteristics.
At what quantity is CF mixed into cement?
23 “Quantitative evaluation of carbon fiber dispersion in cement based composites”, Elsevier – Construction and Building Materials, 12th July 2014. Z. Wang et al, School of Material Science and Engineering, Chang’an University, Xi’an, China. 24 “Dispersion of Carbon Fibers in Cement”, D.D.L. Chung, Composite Materials Research Laboratory, University at Buffalo State University of New York. Paper 2004. 25 “Improvement of cement concrete strength properties by carbon fiber additives”, AIP Conference Proceedings 1698, 070005 (2016); https://doi.org/10.1063/1.4937875. Andrey Nevsky et al.
Carbon Fiber Reinforced Concrete (CFRC)

BITUMEN BEYOND COMBUSTION – PHASE 2 REPORT
Detailed Summaries
an c:\users\nashcroft\documents\stantec - business development advisor\general business development\bitumen beyond combustion\post po\final report\12th february\bbc phase ii report_14_a.docx 3.31
Common engineering practice informs that the CF to cement ratio will vary as function of the cement application and desired end properties of the structure. From literature, it was established that CF addition rates are: > 0 and < 3 weight%, Table 9.
Table 9: CF Addition Rate by Weight to Concrete – Literature References
The following is not intended to be quantitatively definitive, but rather to establish an order of magnitude value as regarding material volumes where this may serve as a reference for discussion. For the purposes of this study and as guided by Table 9, we have focused on a dosage rate of 2% and use this as a reference point for discussion in the tables that follow. This leads to a significant global demand for CF and asphaltene (Table 10, tons per annum) at a CF : Asphaltene ratio of 1.2. Table 11 shows the volume required in terms of Bitumen and Asphaltenes in barrels per day. In arriving at these numbers, it was assumed that 90% of all cement produced is reinforced.
No. CF type Range Year published Reference
1 not stated 2wt% 2014
“Quantitative evaluation of carbon fiber dispersion in cement based composites ”, Elsevier – Construction and Building Materials, 12th July
2014. Z. Wang et al, School of Material Science and Engineering, Chang’an University, Xi’an, China.
2 not stated 0-3wt% 2014
"Cement-Matrix Composites Reinforced with Carbon Fibers as a Multifunctional Material", F.J Baldenebro-Lopez. Centro de Investigacion
en Materiales Avanzados (CIMAV), Laboratorio Nacional de Nanotecnologia, Miguel de cervantes 120, 31109, Chihuahua, Chih.,
Mexico.
3 PAN based 1-3vol.% 1992"Behaviour of Carbon Fiber Reinforced Cement Composites in Direct
Tension ", H.A. Toutanji, Dept. of Civil Engineering, Worcestor Polytechnivc, MA. US. 14th July 1992
vol%:wt%: weight percent
volume percent

BITUMEN BEYOND COMBUSTION – PHASE 2 REPORT
Detailed Summaries
an c:\users\nashcroft\documents\stantec - business development advisor\general business development\bitumen beyond combustion\post po\final report\12th february\bbc phase ii report_14_a.docx 3.32
Table 10: Quantity of CF Required at Four Assumed Dosage Rates (wt. % of Cement) at 100% Market Penetration
Table 11: Gross Global Demand for Bitumen and Asphaltene per Assumed Dosage Rates (wt. %) at 100% Market Penetration
Cement production (G20 production)
NoteVolume of Cement that
is reinforced
(million tons per annum) (million tons per annum) 1.00% 1.50% 2.00% 2.50% 1.00% 1.50% 2.00% 2.50%1 2013 3,539 (1) 3,185 31,852,000 47,778,000 63,704,000 79,630,000 1 2013 38,222,000 57,334,000 76,445,000 95,556,0002 2014 3,603 (1) 3,243 32,425,000 48,638,000 64,850,000 81,063,000 2 2014 38,910,000 58,366,000 77,820,000 97,276,0003 2015 3,482 (1) 3,134 31,341,000 47,011,000 62,681,000 78,352,000 3 2015 37,609,000 56,413,000 75,217,000 94,022,0004 2016 3,622 3,259 32,594,000 48,891,000 65,189,000 81,486,000 4 2016 39,113,000 58,669,000 78,227,000 97,783,0005 2017 3,766 3,390 33,898,000 50,847,000 67,796,000 84,745,000 5 2017 40,678,000 61,016,000 81,355,000 101,694,0006 2018 3,917 3,525 35,254,000 52,881,000 70,508,000 88,135,000 6 2018 42,305,000 63,457,000 84,610,000 105,762,0007 2019 4,074 3,666 36,664,000 54,996,000 73,328,000 91,660,000 7 2019 43,997,000 65,995,000 87,994,000 109,992,0008 2020 4,237 3,813 38,131,000 57,196,000 76,262,000 95,327,000 8 2020 45,757,000 68,635,000 91,514,000 114,392,0009 2021 4,406 3,966 39,656,000 59,484,000 79,312,000 99,140,000 9 2021 47,587,000 71,381,000 95,174,000 118,968,000
10 2022 4,582 4,124 41,242,000 61,863,000 82,484,000 103,106,000 10 2022 49,490,000 74,236,000 98,981,000 123,727,00011 2023 4,766 4,289 42,892,000 64,338,000 85,784,000 107,230,000 11 2023 51,470,000 77,206,000 102,941,000 128,676,00012 2024 4,956 4,461 44,608,000 66,911,000 89,215,000 111,519,000 12 2024 53,530,000 80,293,000 107,058,000 133,823,00013 2025 5,155 4,639 46,392,000 69,588,000 92,784,000 115,980,000 13 2025 55,670,000 83,506,000 111,341,000 139,176,00014 2026 5,361 4,825 48,248,000 72,371,000 96,495,000 120,619,000 14 2026 57,898,000 86,845,000 115,794,000 144,743,00015 2027 5,575 5,018 50,177,000 75,266,000 100,355,000 125,444,000 15 2027 60,212,000 90,319,000 120,426,000 150,533,00016 2028 5,798 5,218 52,185,000 78,277,000 104,369,000 130,461,000 16 2028 62,622,000 93,932,000 125,243,000 156,553,00017 2029 6,030 5,427 54,272,000 81,408,000 108,544,000 135,680,000 17 2029 65,126,000 97,690,000 130,253,000 162,816,00018 2030 6,271 5,644 56,443,000 84,664,000 112,886,000 141,107,000 18 2030 67,732,000 101,597,000 135,463,000 169,328,000
CAGR (assumption)% of Cement reinforced
(assumption)1.2
4.0% 90%
Forecast
Note: (1)
Gross global Asphaltene requirement (by assumption)
Unit (results): tons per annum.
Asphaltene: Carbon Fiber ratioSource: BBC-1 Report, page 20
Values to left (2013 - 2015) from: Cement Production - The G20 Group. Units: million tons
Source: https://cembureau.eu/cement-101/key-facts-figures/Accessed 8th Jan. 2018
No Year
Note: Whilst the table refers to the "Global Asphaltene" requirement, it should be interpreted that
the material, need not specifically be asphaltene.
YearNoCarbon fiber dosage by weight% - assumption
Unit (results): tons per annum.
1.00% 1.50% 2.00% 2.50% 1.00% 1.50% 2.00% 2.50%1 2013 3,738,000 5,613,000 7,481,000 9,350,000 1 2013 654,000 982,000 1,309,000 1,636,0002 2014 3,806,000 5,713,000 7,613,000 9,519,000 2 2014 666,000 1,000,000 1,332,000 1,666,0003 2015 3,681,000 5,519,000 7,363,000 9,200,000 3 2015 644,000 966,000 1,289,000 1,610,0004 2016 3,825,000 5,738,000 7,656,000 9,569,000 4 2016 669,000 1,004,000 1,340,000 1,675,0005 2017 3,981,000 5,969,000 7,963,000 9,950,000 5 2017 697,000 1,045,000 1,394,000 1,741,0006 2018 4,138,000 6,206,000 8,281,000 10,350,000 6 2018 724,000 1,086,000 1,449,000 1,811,0007 2019 4,306,000 6,456,000 8,613,000 10,763,000 7 2019 754,000 1,130,000 1,507,000 1,884,0008 2020 4,475,000 6,719,000 8,956,000 11,194,000 8 2020 783,000 1,176,000 1,567,000 1,959,0009 2021 4,656,000 6,988,000 9,313,000 11,644,000 9 2021 815,000 1,223,000 1,630,000 2,038,00010 2022 4,844,000 7,263,000 9,688,000 12,106,000 10 2022 848,000 1,271,000 1,695,000 2,119,00011 2023 5,038,000 7,556,000 10,075,000 12,588,000 11 2023 882,000 1,322,000 1,763,000 2,203,00012 2024 5,238,000 7,856,000 10,475,000 13,094,000 12 2024 917,000 1,375,000 1,833,000 2,291,00013 2025 5,450,000 8,169,000 10,894,000 13,619,000 13 2025 954,000 1,430,000 1,906,000 2,383,00014 2026 5,663,000 8,500,000 11,331,000 14,163,000 14 2026 991,000 1,488,000 1,983,000 2,479,00015 2027 5,894,000 8,838,000 11,781,000 14,731,000 15 2027 1,031,000 1,547,000 2,062,000 2,578,00016 2028 6,125,000 9,194,000 12,256,000 15,319,000 16 2028 1,072,000 1,609,000 2,145,000 2,681,00017 2029 6,375,000 9,556,000 12,744,000 15,931,000 17 2029 1,116,000 1,672,000 2,230,000 2,788,00018 2030 6,625,000 9,944,000 13,256,000 16,569,000 18 2030 1,159,000 1,740,000 2,320,000 2,900,000
6.25 17.50%
No Year
Cement: Gross global Asphaltene (raw) requirement (by assumption)
Unit (results): barrels per day.
Assumed asphaltene content in Bitumen
Cement: Gross global Bitumen (raw) requirement (by assumption)
Unit (results): barrels per day.No Year
Convert Tons to barrels

BITUMEN BEYOND COMBUSTION – PHASE 2 REPORT
Detailed Summaries
an c:\users\nashcroft\documents\stantec - business development advisor\general business development\bitumen beyond combustion\post po\final report\12th february\bbc phase ii report_14_a.docx 3.33
Although the current demand for CFRC is low as would be expected for any emerging product, the potential from a performance and environmental perspective suggests this may become a growth area and hence, a bitumen diversification opportunity. Even a modest capture of the existing reinforced concrete market produces a sizeable requirement for CF and from bitumen at large (Table 11). For example: in 2030, at 2wt% of CF in cement, at 1% market penetration, the demand for CF would equate to 132,000 bpd and 23,200 bpd of bitumen and asphaltene respectively.
A relatively recent and new development in the construction industry that may have positive implications for fiber and CF reinforced cements is that of 3D printing. The printing of concrete structures requires prior layers to have sufficient strength to withstand the loading of subsequent layers. With the absence of traditional formwork (needed for pouring of concrete), alternative means of reinforcement, such as fibers, are needed. Considering 3D printing in the aerospace and manufacturing sector, it is reasonable to assume that advances here will benefit and reduce costs for building and construction applications. Figure 11 provides a feel of those countries giving the subject attention. What the 3D opportunity turns out to be is currently unknown and cannot be predicted with any degree of reliability.
Figure 11: 3D Printing trends in Building and Construction (1997-2016) - Publications by Country
CF reinforced concrete has exciting potential for use in the construction industry, for repairing and strengthening bridges, tunnels, old buildings, as well as in the construction of new printed buildings. As an example of these applications, the CF / concrete composite branded by the SGL Group as CARBOCRETE is being used as an alternative to steel-reinforced concrete with claims of it being 75% lighter, has a longer service life and is corrosion resistant. Concrete may be reinforced with CFs in a range of forms, including multiaxial and woven fabrics, specially developed grids and chopped fibers.
Considering global demand to reduce CO2 emissions, there is a need for innovative construction technologies to not only pave the way towards a future of sustainable construction, but also to reduce construction and facility management costs while providing a competitive edge. Printed structure methodology avoids the requirement for

BITUMEN BEYOND COMBUSTION – PHASE 2 REPORT
Detailed Summaries
an c:\users\nashcroft\documents\stantec - business development advisor\general business development\bitumen beyond combustion\post po\final report\12th february\bbc phase ii report_14_a.docx 3.34
construction formwork, which typically accounts for 40% of the total budget for concrete work. Avoiding the requirement for formwork during the building process will significantly reduce the project timeline without incurring additional cost26. In addition, using 3D printing technology expands the use of concrete as a building material, as the design of structures need not be limited to a collection of monotonous (standard) straight walls.
CFRC and concrete has superior operating characteristics compared to traditional steel bar reinforcement including27,28:
No corrosion of internal reinforcement.
Better electrical conductivity can be used for in-slab heating used for de-icing process.
Provides post- first crack residual strength to concrete.
Provides temperature-shrinkage reinforcement.
Increases concrete durability - including impact and abrasion resistance and fatigue strength.
Reduces plastic shrinkage and settlement cracking.
Measurably reduces permeability, thus increasing freeze / thaw durability.
Provides uniformly distributed reinforcement throughout the concrete, not just in one plane as with traditional steel reinforcement.
Fiber- and CF-reinforced concrete offers the promise of higher performance buildings and infrastructure that have a lower life cycle cost, has superior product utility compared to the status quo, and will have a likely lower environmental footprint in terms of waste and GHG emissions. This is supported by the following:
Dr. Victor Li, University of Michigan states (2005) in an industry article on the use of fiber materials in cement in general 29:
“Using this material may lead to elimination of shear reinforcing bars, resulting in a reduction of material and labor costs. A thinner structure reduces material volume and dead load, and makes transportation easier. These overall cost reductions can easily justify the cost of the fiber-reinforced material.”
Dow Chemical subsidiary, DowAksa30 – one of the world’s leading manufacturers of PAN based CF states:
26 “How 3D printing technology changes the rules of the game: Insights from the construction sector”, I. Kothman et al, Lectoraat Business Development, Saxion University of Applied Sciences, Deventer, The Netherlands. Journal of Manufacturing Technology Management, Vol. 27 Issue: 7, pp.932-943, https://doi.org/10.1108/JMTM-01-2016-0010 2016 27 “Composites And Concrete”, Composites World, 4th January 2005. https://www.compositesworld.com/articles/composites-and-concrete. 28 “A hidden revolution: FRP rebar gains strength”, Composites World, 12th January 2011. https://www.compositesworld.com/articles/a-hidden-revolution-frp-rebar-gains-strength 29 https://www.compositesworld.com/articles/composites-and-concrete. Accessed 15th Jan 2018. 30 DowAksa: http://www.dowaksa.com/. Established in 2012, DowAksa is a joint venture (50:50) between The Dow Chemical Company and Aksa Akrilik Kimya Sanayii of Turkey (http://www.aksa.com/en). https://www.compositesworld.com/news/dowaksa-to-establish-us-carbon-fiber-manufacturing-presence. Ford formed a relationship (2015) with DowAksa regarding automotive CF applications.

BITUMEN BEYOND COMBUSTION – PHASE 2 REPORT
Detailed Summaries
an c:\users\nashcroft\documents\stantec - business development advisor\general business development\bitumen beyond combustion\post po\final report\12th february\bbc phase ii report_14_a.docx 3.35
Good for the Old, Great for the New31
“Use of CFR composites in retrofit projects can extend the service life of aged infrastructure by as much as 50 to 75 years. That extended lifespan avoids costs for demolition and rebuilding, reduces particulates and debris from demolition and lowers demand for material transport, as well as noise pollution. And for new construction projects, structures reinforced with CFR composites can carry heavier loads and offer better protection from aging, leading to stronger, longer-lasting and more cost-effective infrastructure.”
3.1.2.4 Carbon Fiber in Structural Applications
In this section “carbon fiber” should be read to mean CF in the form of strands / mat (as opposed to chopped CF) where it exists as a structural element such as mat or bar.
The use of carbon fiber reinforced plastic (CFRP) for use as structural materials in the automotive, buildings and construction sector are shown in Figure 12. CFRP is also used in the aerospace and renewable energy sectors (wind turbine blades) and is gaining a hold in the manufacture of certain types of pressure vessels. As new manufacturing and assembly methodologies suited to take advantage of the properties of CF are developed, so will its use grow.
Figure 12: CFRP as Structural Materials in the Automotive and Built Sector
The use of CFRP in structural elements has been demonstrated in several high-end architectural structures where strength and light weight were of paramount importance. Examples are shown in Figure 13.
31 Dow document [form] no. 878-00070-0114BBI. //www.dow.com/-/media/dow/business-units/dow-us
25
Carbon Fiber Reinforced Plastic (CFRP)
Source: https://www.pinterest.ca/pin/
481955597596429438/
“How BMW weaves, bakes, and builds the carbon fiber 7 Series”. Bill Howard, 15th July 2015.
BMW has expanded the use of CF from flat panels to the passenger cells. Source:
https://www.extremetech.com/extreme/209812-how-bmw-weaves-bakes-and-builds-the-carbon-fiber-7-series
(a) To (c): Carbon fiber trusses & beams.Element-6, NY, USA.Source: http://element6composites.com/applications-trusses-beams.asp
NOTE: only certain components in the above image are made of CF.
(a)
(b)
(c)

BITUMEN BEYOND COMBUSTION – PHASE 2 REPORT
Detailed Summaries
an c:\users\nashcroft\documents\stantec - business development advisor\general business development\bitumen beyond combustion\post po\final report\12th february\bbc phase ii report_14_a.docx 3.36
Figure 13: Apple’s Use of CFRP
These projects demonstrate the utility of CF structural components where long self-supporting spans are required. As the cost of CF decreases it is anticipated that its superior properties in comparison to traditional steel beams and other building materials, will stimulate demand for CF.
As with CFRC, CFRP may also be used in the 3D printing of structures. Said application lends itself to complicated geometric forms, but it is not anticipated that it will produce a high volumetric demand. This assumption may prove wrong with the advent of multi material printed structures.
CF reinforced products have been produced in an assortment of shapes and properties for use in a variety of sectors as structural materials. Oak Ridge National laboratory32 forecast four major application areas of growth (Figure 14) where these represent a capturing of the market occupied by (e.g., steel and aluminum) that at this future time would be considered less efficient.
32 “Global Carbon Fiber Composites Supply Chain Competitiveness Analysis”, page 9. Oak Ridge National Laboratory, May 2018
Carbon Fiber Reinforced Plastic (CFRP)

BITUMEN BEYOND COMBUSTION – PHASE 2 REPORT
Detailed Summaries
an c:\users\nashcroft\documents\stantec - business development advisor\general business development\bitumen beyond combustion\post po\final report\12th february\bbc phase ii report_14_a.docx 3.37
Figure 14: Forecast CF Demand by Main Application
Because a reasonable level of market information on the sectors in the previous graphic would be difficult to come by, we have used the steel sector as reference to determine the market opportunity for CF in structural applications. As with cement, the following is not intended to be quantitatively definitive, but rather intends to establish an order of magnitude regarding material (CF with corresponding bitumen) volumes, where this can serve as a reference for discussion.
Since the 1950s, total steel usage has grown dramatically (Figure 15) rising from 189 to 1,630 million tons in 1950 and 2016 respectively and representing a CAGR of 3.4%.
Figure 15: World Crude Steel Production
Drawing on the Global Steel Monitor Report (2016), Table 12 shows how steel is used and what was assumed as a CF substitution rate.

BITUMEN BEYOND COMBUSTION – PHASE 2 REPORT
Detailed Summaries
an c:\users\nashcroft\documents\stantec - business development advisor\general business development\bitumen beyond combustion\post po\final report\12th february\bbc phase ii report_14_a.docx 3.38
Table 12: Areas of Steel Usage that May Be Targeted with CF Product
Table 13 follows to show the annual demand for CF. At forecasted steel production of 2.6 billion tons in 2030 (CAGR 3.4%), if CF could secure 1% of this market, this would create demand for 26 and 31 million tons of CF and asphaltene, respectively. Years 2020 and 2030 are highlighted for reference.
Table 13: Demand for CF per Assumption
No YearGlobal Steel Demand by End
Use Market (2014)CF penetration (assumption)
1 Building and infrastructure 50% 0.5%2 Mechanical equipment 16% 0.0%3 Automotive 13% 0.5%4 Metal products 11% 0.0%5 Other transport 5% 0.0%6 Electrical equipment 3% 0.0%7 Domestic applicances 2% 0.0%
100% 1.0%
Reference: Global Steel Trade Monitor, July 2016, PDF page 10. International Trade Administration, Dept. of Commerce,
USA.CF substitution (assumption).
Global Crude Steel Production
Steel: Global CF demand per substitution
assumption
Steel: Gross global Asphaltene requirement (by assumption)
(million tons) (million tons) (million tons)
1 2005 1,148 11.5 13.82 2006 1,250 12.5 15.03 2007 1,348 13.5 16.24 2008 1,343 13.4 16.15 2009 1,239 12.4 14.96 2010 1,433 14.3 17.27 2011 1,538 15.4 18.58 2012 1,560 15.6 18.79 2013 1,650 16.5 19.8
10 2014 1,670 16.7 20.011 2015 1,623 16.2 19.512 2016 1,630 16.3 19.613 2017 1,685 16.9 20.214 2018 1,743 17.4 20.915 2019 1,802 18.0 21.616 2020 1,863 18.6 22.417 2021 1,927 19.3 23.118 2022 1,992 19.9 23.919 2023 2,060 20.6 24.720 2024 2,130 21.3 25.621 2025 2,202 22.0 26.422 2026 2,277 22.8 27.323 2027 2,355 23.5 28.324 2028 2,435 24.3 29.225 2029 2,517 25.2 30.226 2030 2,603 26.0 31.2
CF substitution (assumption)
Asphaltene: Carbon Fiber ratioSource: BBC-1 Report, page 20
Forecast 1% 1.2
No Year

BITUMEN BEYOND COMBUSTION – PHASE 2 REPORT
Detailed Summaries
an c:\users\nashcroft\documents\stantec - business development advisor\general business development\bitumen beyond combustion\post po\final report\12th february\bbc phase ii report_14_a.docx 3.39
In Table 14, columns A and B show the global asphaltene requirement at 1wt% CF substitution of structural steel in millions of tons per annum and per day. This is followed by the global asphaltene and bitumen requirement in barrels per day in columns D and E. Years 2020 and 2030 are highlighted for reference.
Table 14: Global Asphaltene and Bitumen Requirement per Assumption Set
In summary, at the forecasted steel production of 2.6 billion tons in 2030, were CF to secure 1% of this market, this would create demand for:
26 million ton of CF (Table 13, row 26);
31 million tons (Table 13, row 26) i.e., 535,000 barrels per day of asphaltene (Table 14, column D row 26) or equivalent for another feedstock; and
3 million barrels per day of bitumen (Table 14, column E row 26).
( A ) ( B ) ( C ) ( D ) ( E )
No YearSteel: Gross global
Asphaltene requirement (by assumption)
Steel: Gross global Asphaltene requirement (by assumption)
Steel: Gross global Bitumen (raw) requirement (by
assumption)
Steel: Gross global Asphaltene (raw) requirement (by
assumption)
Steel: Gross global Bitumen (raw) requirement (by
assumption)
(million tons) (tons per day) Unit (results): tons per day Unit (results): barrels per day Unit (results): barrels per day
1 2005 13.8 37,700 215,429 235,625 1,346,4292 2006 15.0 41,100 234,857 256,875 1,467,8573 2007 16.2 44,300 253,143 276,875 1,582,1434 2008 16.1 44,200 252,571 276,250 1,578,5715 2009 14.9 40,700 232,571 254,375 1,453,5716 2010 17.2 47,100 269,143 294,375 1,682,1437 2011 18.5 50,600 289,143 316,250 1,807,1438 2012 18.7 51,300 293,143 320,625 1,832,1439 2013 19.8 54,200 309,714 338,750 1,935,71410 2014 20.0 54,900 313,714 343,125 1,960,71411 2015 19.5 53,400 305,143 333,750 1,907,14312 2016 19.6 53,600 306,286 335,000 1,914,28613 2017 20.2 55,400 316,571 346,250 1,978,57114 2018 20.9 57,300 327,429 358,125 2,046,42915 2019 21.6 59,200 338,286 370,000 2,114,28616 2020 22.4 61,300 350,286 383,125 2,189,28617 2021 23.1 63,300 361,714 395,625 2,260,71418 2022 23.9 65,500 374,286 409,375 2,339,28619 2023 24.7 67,700 386,857 423,125 2,417,85720 2024 25.6 70,000 400,000 437,500 2,500,00021 2025 26.4 72,400 413,714 452,500 2,585,71422 2026 27.3 74,900 428,000 468,125 2,675,00023 2027 28.3 77,400 442,286 483,750 2,764,28624 2028 29.2 80,000 457,143 500,000 2,857,14325 2029 30.2 82,800 473,143 517,500 2,957,14326 2030 31.2 85,600 489,143 535,000 3,057,143
Asphaltene: Carbon Fiber ratio
Source: BBC-1 Report, page 20
DaysAssumed asphaltene content
in BitumenConvert Tons to barrels Convert Tons to barrels
1.2 365 17.50% 6.25 6.25
Forecast

BITUMEN BEYOND COMBUSTION – PHASE 2 REPORT
Detailed Summaries
an c:\users\nashcroft\documents\stantec - business development advisor\general business development\bitumen beyond combustion\post po\final report\12th february\bbc phase ii report_14_a.docx 3.40
The demand for bitumen above equates closely to Alberta’s 2016 production of 2.5 million bpd33.
3.1.2.5 Carbon Fiber Reinforced Wood
Carbon fiber reinforced wood products (CFRW)34 are discussed in two forms, as laminate and as a composite. In the former, the CF exists as a bonded layer externally or internally (sandwiched). Commercial examples are shown in Figure 1635,36. Alternatively, chopped CF might be uniformly distributed throughout a structure as in orientated strand board (OSB).
Figure 16: Examples of CFRW
The advanced fiber-reinforced wood (AFRW) product Teijin37 developed (shown in Figure 16) includes aramid and CF produced by Toho Tenax38. The company claims the product provides twice the flexural stiffness of conventional laminated timber with greater durability and design qualities for use as structural beams. The company is targeting medium-rise buildings as a market. However, due to the high cost of the end product relative to a standard glue laminate beam design, the products use is only attractive for architectural purposes or where space restrictions limit the depth of traditional wooden materials.
33 “Alberta Energy: Facts and Statistics”, http://www.energy.alberta.ca/OilSands/791.asp. Accessed 23rd Jan. 2018. 34 CFRW forms a subset of the broader classification of “bio-composites”. Bio-composites typically refers to a product where the primary raw materials are a non-renewable synthetic resin (virgin or recycled) and biological e.g., wood waste. Further reading: http://www.nrcan.gc.ca/forests/industry/products-applications/15859 35 Dragon Plate. https://dragonplate.com/sections/technology.asp 36 Biocomposites Conference Cologne, 7th Conference on Wood and Natural Fiber Composites, 6–7 December 2017, Maternushaus, Germany. http://biocompositescc.com/media/files/2017/leaflet/BCC-2017.pdf 37 https://www.teijin.com/news/2015/ebd150204_30.html 38 https://www.tohotenax.com/
26
Carbon Fiber Reinforced Wood (CFRW)
Teijin to Develop Advanced Fiber-reinforced Wood for Medium- and Low-rise Wooden Buildings.Tokyo, Japan, February 4, 2015. Source: https://www.teijin.com/news/2015/ebd150204_30.html
DragonPlate™ Carbon Fiber sandwich sheets.Source:
https://dragonplate.com/ecart/categories.asp?cID=3

BITUMEN BEYOND COMBUSTION – PHASE 2 REPORT
Detailed Summaries
an c:\users\nashcroft\documents\stantec - business development advisor\general business development\bitumen beyond combustion\post po\final report\12th february\bbc phase ii report_14_a.docx 3.41
Woven CF sheets bonded to plywood are also commercially available, but are used more for architectural purposes rather than utilitarian requirements. Woven CF sheets bonded to wooden beams provide a significant increase in structural strength. Other CFRW products are high-end furniture or sports products where a slender profile, light weight, and high strength are required.
With respect to OSB, Table 15 from the BBC Phase 1 report shows what the forecasted demand means for the supply side of the equation with respect to Bitumen and Asphaltene based CF production.
Table 15: OSB - Demand for CF, asphaltene and bitumen
3.1.2.6 Other Carbon Fiber Reinforcing Applications
Further applications of CF are shown in Figure 17.
Figure 17: CF Honeycomb Structures and Reinforcing Belt
27
Other Carbon Fiber Reinforcing applications
Carbon Fiber Aluminum Honeycomb PanelsSource: http://www.china-composites.net/composite-sandwich-panels/carbon-fiber-sandwich-panels/carbon-fiber-aluminum-honeycomb-panels.html
Carbon Fiber Foam Panels, Rockwest Composites, Utah, US
Source: https://www.rockwestcomposites.com/cftfs-mm-dl-group
Basement wall reinforcementSource: https://www.frontierbasementsystems.com/foundation-repair/foundation-repair-products/wall-reinforcing-systems.html

BITUMEN BEYOND COMBUSTION – PHASE 2 REPORT
Detailed Summaries
an c:\users\nashcroft\documents\stantec - business development advisor\general business development\bitumen beyond combustion\post po\final report\12th february\bbc phase ii report_14_a.docx 3.42
3.1.3 Production
As discussed earlier, the production of CF currently comprises two key feedstocks, namely PAN copolymer and modified pitch (carbon rich) feed.
3.1.3.1 Introduction
While CF can be produced from a variety of raw materials such as lignin and rayon, CF is principally and commercially produced from PAN. The production of CF covers the key activities and industries described in Figure 18. The SGL Composites facility at Moses Lake, Washington is used as an example.
(a) Production of the precursor
o Step (1-2): Production and import of crude oil.
o Step (3): Refining of crude oil and production of ammonia and propylene.
o Steps (4): Japan: Production of the acrylonitrile monomer.
o Step (5): Japan: Polymerisation of acrylonitrile (and comonomers) to PAN polymer.
(b) Manufacture of fiber (uncarbonized and carbonized)
o Step (6): Mitsubishi Rayon, Japan: spinning of PAN from solution39 to a white fiber and winding to spool.
o Step (7): SGL, Moses Lake, US: oxidation and carbonisation of the white PAN fiber to black CF, winding to spool.
(c) Weaving of carbonized fiber
o Step (8): Wackersdorf, Germany: weaving of CF from spools into textile layers.
o Step (9): BMW, Landshut and Leipzig, Germany: lay-up, mat cutting and forming of CF components.
(d) Lay-up for final product
o Step (10): BMW, Leipzig, Germany: incorporation of CF components into the final form (component and in turn part of the vehicle assemblage).
39 PAN fiber is coagulated from solution where the polymer has been dissolved in a solvent. In wet spinning, the fibers are extruded into a liquid bath, in dry spinning they are extruded into air.

BITUMEN BEYOND COMBUSTION – PHASE 2 REPORT
Detailed Summaries
an c:\users\nashcroft\documents\stantec - business development advisor\general business development\bitumen beyond combustion\post po\final report\12th february\bbc phase ii report_14_a.docx 3.43
Figure 18: CF Supply Chain from Resource to Final Product
The process for the manufacture of the CF (step 7 above) follows a series of standard steps shown in
Figure 28, page 3.57. The costs are discussed in further detail at Table 18, page 3.52.
3.1.3.2 From PAN
Approximately 90% of global CF production starts from the polymer precursor PAN, where PAN is produced via the polymerization of the primary monomer, acrylonitrile (ACN) along with comonomers. ACN is produced commercially via one of two processes as shown in Figure 19.
BP Sohio process: ammoxidation of propylene. A mature and proven technology developed in the 1950s and commercialized by BP. Close to all produced ACN is produced via this process.
Asahi Kasei process: ammoxidation of propane.
o Commercialized 2007 in Thailand, capacity: 200k tpa. Ammonia imported.
o Feedstock: Ammonia (NH3), propylene or propane.
The route to CF from bitumen and asphaltene is shown for comparative purposes, Route-3.
28
Carbon fiber supply chain – resource to final product
RefineryTransport Chemical facility
Fiber facilityCarbon Fiber facility
Carbon Fiber
weaving
Componentmanufacture
Polymer facility
Final product manufacture
Mitsubishi Rayon in Otake, Japan – PAN fiber
Air freigh PAN fiber
SGL, Moses Lake, OR, US
Air freight
Wackersdorf, Germany –textile layers
BMW, Landshut and
Leipzig, Germany -body parts
Japan
BMW, Leipzig, Germany
Japan
ImportCrude
(1)
(5)
(4)(3)(2)
(7) (6)
(8) (10)(9)
Ammonia, propylene,
Acrylonitrile / comonomers

BITUMEN BEYOND COMBUSTION – PHASE 2 REPORT
Detailed Summaries
an c:\users\nashcroft\documents\stantec - business development advisor\general business development\bitumen beyond combustion\post po\final report\12th february\bbc phase ii report_14_a.docx 3.44
Figure 19: CF Produced from PAN
Oil Sands upgrading (to synthetic crude) currently involves a delayed or continuous coking process (high temperature ~500 °C) shown in Figure 20. From this process, there are thermally cracked off-gasses produced, containing a significant propane fraction, Figure 21.
Figure 20: Coker off Gas – Source of Propane

BITUMEN BEYOND COMBUSTION – PHASE 2 REPORT
Detailed Summaries
an c:\users\nashcroft\documents\stantec - business development advisor\general business development\bitumen beyond combustion\post po\final report\12th february\bbc phase ii report_14_a.docx 3.45
Figure 21: Propane Fraction of Coker Off-Gas
Off-gases from Oil Sands Coker units are currently liquefied in the Fort McMurray, Alberta area for pipelining to midstream facilities for additional separation, Remaining gases are returned back to the region.
3.1.3.3 From Pitch
Due to the high cost of producing CF from PAN, existing and aspirant CF producers have looked for alternatives ofPAN from which to produce CF. Carbon rich streams in various forms and names have attracted attention from both a supplier and customer perspective. The topic is discussed further in Section 3.1.9.1, page 3.58.
From a material (carbon) utilization perspective, an additional incentive when considering feeds other than PAN is the carbon yield at the end of oxidative stabilization and carbonization, where reaction products are driven off under an inert atmosphere (between 300-1,800°C and possibly higher) to produce CF. Pitch has an expected carbon yield of 80%-90%, shown in Table 3, page 3.20.
It is not the intention of this report to provide an exhaustive analysis of what streams have been considered, other than to specifically highlight that, at its most basic, the production of CF from feeds other than PAN is not merely a matter of isolating a suitable carbon fraction and proceeding through the established process steps for the manufacture of CF shown in Figure 24, page 3.49. Patent US4670129 (Mitsubishi) provides valuable insight into the challenges that can be expected from pitch type feeds. In short, straight unmodified pitch is unlikely to meet the necessary specifications for a spinnable pitch. As a function of the material, various processing steps such as the following may be required.
Separation
Purification
Modification

BITUMEN BEYOND COMBUSTION – PHASE 2 REPORT
Detailed Summaries
an c:\users\nashcroft\documents\stantec - business development advisor\general business development\bitumen beyond combustion\post po\final report\12th february\bbc phase ii report_14_a.docx 3.46
In addition, and again as a function of the feeds geographical origin and processing history, consideration of the following will be required:
Compositional effects (catalytic mineral content, heteroatom content, molecular weight distribution, pH, Saturate, Aromatic, Resin, Asphaltene [SARA] content).
Volatisation effects – solvent / plasticizer (nature of volatile components, rate of volatilization, effects on macro-chemistry during vitalization).
Chemistry (e.g., polymerization, condensation [inter-and intra-molecular], de-alkylation, dehydrogenation).
Conditioning (e.g., heat treatment – isothermal or staged).
Process conditions.
All the above contribute to complexity, cost and time to market.
It is possible for the reasons stated previously, that CFs in their early stages of development were based off PAN, as opposed to other raw materials where the quality of the feed (propylene) and intermediates (acrylonitrile, comonomers, PAN) were more easily identified, evaluated, corrected, monitored, and over time, controlled. Comparatively speaking, the chemical and physical properties of PAN as precursor along with its own precursor (acrylonitrile / comonomers) would have been substantially better understood and predictable than alternatives like carbon dense feeds like pitch. These factors alone would have provided a stable research platform for CF development.
Figure 22 provides some insight into the chemical and physical differences that can be expected between pitch and PAN fibers, and the processing steps the former is required to undergo before it can be spun into fiber. Pitch feeds must be transformed by heat treatment from the isotropic to a mesophase before they can be spun. The degree and nature of processing will likely vary as a function of the desired quality of fiber and the inherent properties (positive and negative) in the feedstock as well.
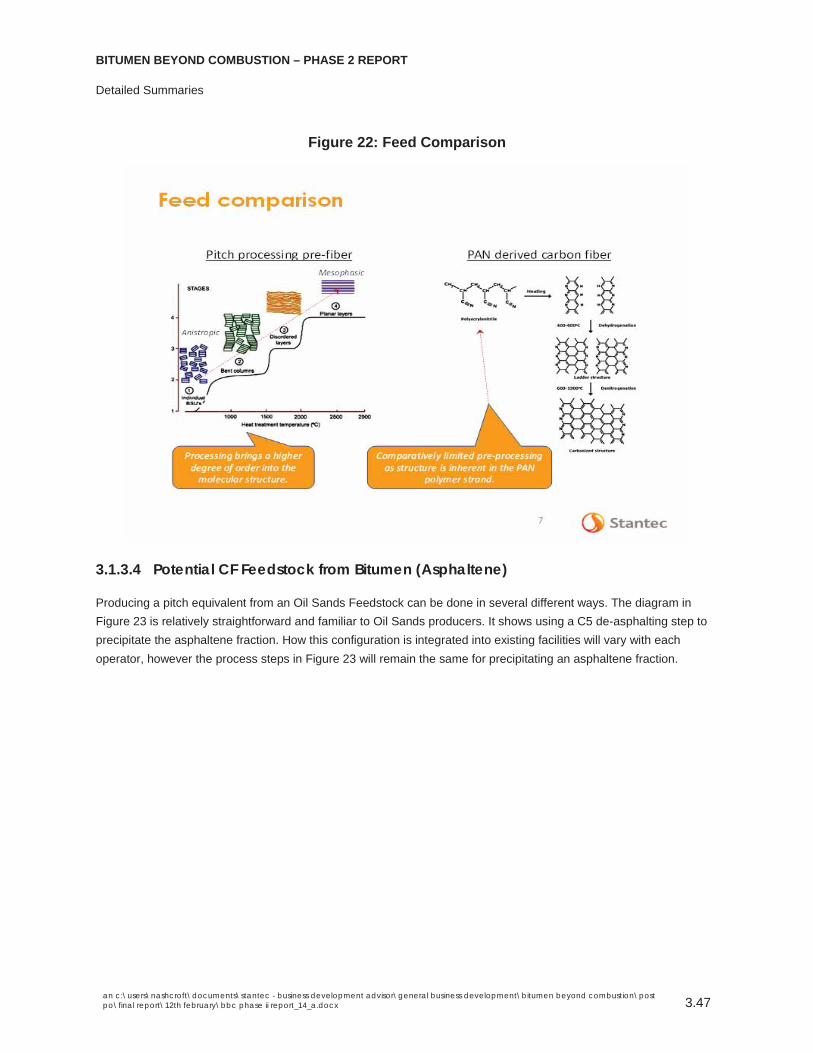
BITUMEN BEYOND COMBUSTION – PHASE 2 REPORT
Detailed Summaries
an c:\users\nashcroft\documents\stantec - business development advisor\general business development\bitumen beyond combustion\post po\final report\12th february\bbc phase ii report_14_a.docx 3.47
Figure 22: Feed Comparison
3.1.3.4 Potential CF Feedstock from Bitumen (Asphaltene)
Producing a pitch equivalent from an Oil Sands Feedstock can be done in several different ways. The diagram in Figure 23 is relatively straightforward and familiar to Oil Sands producers. It shows using a C5 de-asphalting step to precipitate the asphaltene fraction. How this configuration is integrated into existing facilities will vary with each operator, however the process steps in Figure 23 will remain the same for precipitating an asphaltene fraction.

BITUMEN BEYOND COMBUSTION – PHASE 2 REPORT
Detailed Summaries
an c:\users\nashcroft\documents\stantec - business development advisor\general business development\bitumen beyond combustion\post po\final report\12th february\bbc phase ii report_14_a.docx 3.48
Figure 23: Carbon Fiber Feedstock from Bitumen (Asphaltenes)
3.1.3.5 Capital and Operational Expenditure: Order of Magnitude Assessment
There are numerous de-asphalting processes. However, to provide a high-level estimate, Nexen40 have indicated an approximate value of C$2,300/ bpd processing cost for de-asphalting of bitumen.
Table 16: VROOM for Asphaltene Extraction
Bitumen Production (throughput)
Nexen estimate - C$2,300 / bpd for a ‘conceptual’ cost of de-asphalting unit
Throughput versus C$/bpd for given technology (de-asphalting)
CAPEX @ Very rough order of magnitude (VROM)
Annual OPEX (VROM) @ 10% of capital cost
30,000 bpd C$2,300 / bpd 30,000 x C$2,300 C$69,000,000 C$6,900,000
3.1.3.6 Production of Carbon Fiber
Irrespective of whether the feed for the manufacture of CF is PAN, pitch derived or similar, the eleven steps at a macro-level of definition, shown in Figure 24 remain generally the same41. Adjustments within / between process steps will be required for particular feedstocks and as function of the type (general purpose / high performance) of CF being produced. For example: PAN derived CF’s are wet or dry spun, while pitches are melt spun.
40 Personal communication with N Zerpa, January 2018. 41 Soo-Jin Park, Carbon Fibers, Springer Series in Material Science, 210 p 37 (2015).

BITUMEN BEYOND COMBUSTION – PHASE 2 REPORT
Detailed Summaries
an c:\users\nashcroft\documents\stantec - business development advisor\general business development\bitumen beyond combustion\post po\final report\12th february\bbc phase ii report_14_a.docx 3.49
Figure 24: Production of Carbon Fiber
CF capital expenditure costs can only be estimated from existing known costs at this time. BMW / SGL announced an expansion of production capacity in Moses Lake, Washington costing US$200 million for an increased capacity of 3,000 tpa in 201442. Assuming inflation from 2014 and converting to Canadian dollars, the extrapolated cost of building a new 3,000 tons / year CF facility in Canada is in the order of C$300-C$400 million. It should be noted this part of the CF production process is available for license by ORNL43 and that there are vendors that design and build complete CF production lines44.
3.1.4 Business Case
Table 17 provides a very rough order of magnitude (VROOM) CAPEX to produce CF across the full supply chain.
42 “BMW and SGL to triple production capacity at Moses Lake carbon fiber plant with $200M expansion; world’s largest carbon fiber plant”, 09th May 2014. http://www.greencarcongress.com/2014/05/20140509-sglacf.html 43 “Oak Ridge National Laboratory Seeking U.S. Manufacturers to License Low-Cost Carbon Fiber Process”, 23rd March 2016. https://energy.gov/technologytransitions/articles/oak-ridge-national-laboratory-seeking-us-manufacturers-license-low 44 Harper International Corp., 4455 Genesee Street, Suite 123, Buffalo, NY 14225, USA https://www.harperintl.com/complete-carbon-fiber-lines/

BITUMEN BEYOND COMBUSTION – PHASE 2 REPORT
Detailed Summaries
an c:\users\nashcroft\documents\stantec - business development advisor\general business development\bitumen beyond combustion\post po\final report\12th february\bbc phase ii report_14_a.docx 3.50
Table 17: CAPEX - Very rough order of magnitude (Units: C$)
The cost breakdown as reported by ORNL (2016)45 for CF production from PAN fiber is shown below, Figure 25.
45 Global Carbon Fiber Composites Supply Chain Competitiveness Analysis, Sujit Das, Josh Warren, and Devin West. Energy and Transportation Science Division, Oak Ridge National Laboratory. May 2016, PDF page no. 17
( A ) ( B ) ( C ) ( D ) ( E ) ( F ) ( G ) ( H )
No Description CAPEX OPEXNote
CAPEX OPEX CAPEX OPEX CAPEX OPEX
1 Production of Precursor
2 Raw bitumen (30,000bpd) to isolated Asphaltene fraction (2,300bpd)
23 2.3
3Asphaltene fraction- modification (iso to meso-phase)
23 - (1)
4 Total 46 2.3
5 Manufacture of Fiber
6(i) Asphaltene (modified) to Fiber: spinning to spool(ii) Carbonisation
300 210
7 Total 300 210
8 Weaving of Carbonised Fiber9 Weaving of CF spool - -
10 Pattern cutting / lay-up / form-work 660 011 Total
12 Lay-up for final product13 Incorporation of CF components into final form - -14 Total 0 0
15 Sub-Totals 46 300 660 0
16 TOTAL (CAPEX) 1,006
NotesUnits: C$ millionValues ( VROOM ): Very rough order of magnitude(1) The nature of the processing required will be a function of feedstock properties. US5182011 speaks to 4-steps: heat soak, distillation, solvent extraction and 2 nd distillation.
Data not available -
activity internal to Converter.
Capacity: 3,000 tons CF / annum.
SGL Composites as proxy.
Data not available -
activity internal to Converter.
Data not available -
activity internal to Converter.
Capacity: 3,000 tons CF equivalent finished product.

BITUMEN BEYOND COMBUSTION – PHASE 2 REPORT
Detailed Summaries
an c:\users\nashcroft\documents\stantec - business development advisor\general business development\bitumen beyond combustion\post po\final report\12th february\bbc phase ii report_14_a.docx 3.51
Figure 25: CF and Value Chain for CFRP
Kg = kilogram, RTM = resin transfer molding, VARM = vacuum assist resin transfer molding, LT – low temperature, HT = high temperature
The cost build-up of the PAN (white) fiber prior to carbonization, to the CF in the final product, is shown in Table 18. Sub-table A shows the cost elements to producing spooled white PAN fiber. Sub-table B reflects the cost of PAN fiber as a percentage of the cost of spooled carbonized CF for four industry sectors. Sub-tables C and D show the percentage cost of spooled black CF against final product and PAN white spooled fiber against market sector. The variation in cost across the different market sectors reflects the different process conditions required to produce different grades of CF, the engineering and labor effort needed for cutting, lay-up, compression molding, autoclaving, etc., as well as the safety and regulatory aspect of introducing a new product into demanding and at times first of kind applications.

BITUMEN BEYOND COMBUSTION – PHASE 2 REPORT
Detailed Summaries
an c:\users\nashcroft\documents\stantec - business development advisor\general business development\bitumen beyond combustion\post po\final report\12th february\bbc phase ii report_14_a.docx 3.52
Table 18: Percentage cost of Acrlylonitrile, PAN precursor, CF and end product by market application
(A)
No. Description Cost (USD / kg) % split
1 Oil (USD100 / bbl) 0.72 7.3%2 Propylene 1.25 12.6%3 Acrylonitrile 2.20 22.2%4 PAN precursor 4.50 45.5%6 Natural gas 0.36 3.6%7 Ammonia 0.86 8.7%8 Total (PAN precursor) 9.89 100.0%
(B)
No. Description Cost (USD / kg) Carbon fiber
13 PAN precursor 9.89 Cost (USD / kg)
14 Aerospace 113 8.8%15 Automotive 25 39.6%16 Pressure Vessels 30 33.0%17 Wind 27 36.6%
(C)
Carbon fiber End Product
Cost (USD / kg) Cost (USD / kg)
9 Aerospace 113 332 34.0%10 Automotive 25 100 25.0%11 Pressure Vessels 30 102 29.4%12 Wind 27 97 27.8%
(D)
No. Description Cost (USD / kg) End Product
18 PAN precursor 9.89 Cost (USD / kg)
19 Aerospace 332 3.0%20 Automotive 100 9.9%21 Pressure Vessels 102 9.7%22 Wind 97 10.2%
Description
% split
% split
No. % split
Source: Global Carbon Fiber Composites Supply Chain Competitiveness Analysis, Sujit Das, Josh Warren, and Devin West. Energy and
Transportation Science Division, Oak Ridge National Laboratory. May 2016, PDF page no. 17.
% cost of CF as function of market
application.
% cost of PAN precursor as cost of CF per market
application.
% cost of PAN precursor as function
of End Product.

BITUMEN BEYOND COMBUSTION – PHASE 2 REPORT
Detailed Summaries
an c:\users\nashcroft\documents\stantec - business development advisor\general business development\bitumen beyond combustion\post po\final report\12th february\bbc phase ii report_14_a.docx 3.53
One major restraint on growth and wider adoption of CF globally is the cost to produce spooled CF which ranges between US$8/lb (US$18/kg) and US$16/lb (US$35/kg) for the final product (automotive grade), shown in rows 5 and 11 of Table 19. ORNL46 reports that current feedstock for high-performance (HP) CF, (PAN) cost around US$3-6/lb (7-13 US$/kg) in 2017, rows 4 and 10. It is suggested that if a target price for spooled CF of US$5/lb (US$11/kg) can be achieved, adoption of CF will increase, shown in rows 6 and 12. Major research is underway at ORNL to find lower cost CF feedstock materials, with a wide range of feedstock materials under development. It can be expected in turn that “converters”, companies that develop and build the equipment necessary to process fiber from for example: mat to shaped form will progress their technology to drive down cost.
Table 19 further illustrates the cost advantage that bitumen / asphaltene streams could have in comparison to PAN based feeds, row 7 to 10. The cost of Bitumen on a simplified basis is approximately C$0.15/lb (based on WTI at US$50). Even with significant fluctuation in crude oil prices, there appears to be a significant margin to pre-treat an oil sands derived feedstock to potentially produce CF (isotropic to mesophase, shown in Figure 22). One oil sands operator is currently removing the asphaltene fraction and selling it at a market coal price per ton (approximately US$40/ton). This represents a cost of C$0.02/lb for comparative purposes.
Table 19: Price Comparison of Various Feedstocks Relative to Automotive Designated CF
Table 19 further illustrates the cost advantage that bitumen / asphaltene streams could have in comparison to PAN based feeds, row 7 to 10. The cost of Bitumen on a simplified basis is approximately C$15 cents/lb (based on WTI at USD $50). Even with significant fluctuation in crude oil prices, there appears to be significant margin to pre-treat 46 Personal communication with Merlin Theodore, ORNL, October 2017.
No Description Units Ref.1 Asphaltene (sold @ "coal" price) - 2017 US$ / ton 40 - (1)2 Asphaltene US cents / lb 2 - (2)3 Bitumen US cents / lb 15 - (3)4 CF: PAN (HP) US$ / lb 3 6 (4)
5 Automotive grade CF (current) US$ / lb 8 16 (5)6 Automotive grade CF (target) US$ / lb 5 -
Convert lb to kg 0.453592
No Description Units % of % of7 Asphaltene (sold @ "coal" price) 40.00 - 0.2% 0.4%8 Asphaltene 44.09 - 0.3% 0.4%9 Bitumen 331 - 1.9% 3.0%10 CF: PAN (HP) 6,614 13,228 37.5% 60.0%
11 Automotive grade CF (current) 17,637 35,274 112 Automotive grade CF (target) 11,023 - 1
(5) Global Carbon Fiber Composites Supply Chain Competitiveness Analysis, Sujit Das, Josh Warren, and Devin West. Energy and Transportation Science Division, Oak Ridge National
Laboratory. May 2016, PDF page no. 17
Value (range)
Value (range)
US$ / ton
US$ / ton
Reference
(4) Personal communication, ORNL, Merlin Theodore, Oct 2017.
(3) Public domain.(2) Personal communication MEG Energy.(1) Personal communication MEG Energy.

BITUMEN BEYOND COMBUSTION – PHASE 2 REPORT
Detailed Summaries
an c:\users\nashcroft\documents\stantec - business development advisor\general business development\bitumen beyond combustion\post po\final report\12th february\bbc phase ii report_14_a.docx 3.54
(isotropic to mesophase shown in Figure 22) an Oil Sands derived feedstock to potentially produce CF. One Oil Sands operator is removing the asphaltene fraction currently and selling the asphaltene at a market ‘coal’ price per ton (approximately US$40/ton), this represents a cost of US 2c/ lb for comparative purposes. Should CF production and use become more widespread, it is possible that asphaltenes may see their value increase.
Work completed by Nexen47 has concluded that removing asphaltenes from bitumen can reduce the viscosity from 1 million centistokes (cSt) at reservoir conditions (approximately 7.5 °C) to 54,000 cSt, significantly reducing diluent requirements (estimated up to 50% reduction). Alberta has an abundance of bitumen and propane (bitumen-derived and other). The opportunity to provide a lower cost CF precursor, either through propane-derived PAN or a mesophase-bitumen derivative, is compelling.
The automotive industry (the 3rd largest market for steel globally, Table 14, page 3.39) has indicated that if CF costs can be reduced to a target US$6/lb (currently US$12/lb), then widespread adoption could be considered. This would be a major game-changer for the automotive industry, considering the weight and corresponding fuel efficiency advantages.
In order for CF costs to reduce to meet this target (US$6/lb.), CF precursor feedstock would need to be reduced by an order of magnitude. Alberta is well placed to investigate, potentially providing this order of magnitude cost reduction.
3.1.5 Social Acceptance
New investment, creation of tech jobs, generation of royalties, taxes, and other revenues / supporting industries associated with making inroads into CF production in Canada would be well received.
The benefits of CF (e.g., lighter weight and potentially more fuel efficient automobiles and aircraft) would be seen as very positive development. If CF production starts to replace parts of existing industries, (steel, wood etc.), there could be negative connotations. However, this remains to be seen.
The barriers to entry into CF production are currently relatively high, with other countries leading the technology development. All elements of the CF supply chain, such as pre-cursor, CF spinning and end product manufacture, have significant associated intellectual property. From this perspective, barriers to entry would appear to be considered high. Partnering opportunities with existing CF players could reduce this.
3.1.6 Environmental Net Effects
The greenhouse gas emissions with producing the feedstock material, whether this is asphaltene or propane, are already accounted for in large part, as these have been extracted and processed into a product. Additional processing to create a suitable derived pitch from bitumen would represent a GHG addition.
Whether CF is produced from PAN or from a pitch derived feedstock, there are numerous high temperature process steps (see Figure 24 page 3.49 to reduce the feedstock to a purer form of carbon (i.e., evolution of hydrogen and other constituents.)
47 In correspondence with N. Zerpa, Nexen, January 2018.

BITUMEN BEYOND COMBUSTION – PHASE 2 REPORT
Detailed Summaries
an c:\users\nashcroft\documents\stantec - business development advisor\general business development\bitumen beyond combustion\post po\final report\12th february\bbc phase ii report_14_a.docx 3.55
Toray48 have evaluated the benefit of CF to the environment. Using a cradle to grave approach, the total life cycle assessment (TLCA) for CF they report is as follows:
Aircraft: a 20% reduction in fuselage weight means: CO2 emissions are reduced by 1,400 tons over a life cycle of 10 years per ton of CF used.
Automobile: a 30% reduction in a cars body weight means: CO2 emissions are reduced by 50 tons over a life cycle of 10 years per ton of CF used.
SGL (USA) at their Moses Lake CF production facility utilizes readily available hydropower to aid their manufacturing processes. Canada is well-placed to utilize the same clean hydropower for CF production.
Recycling CF products is a relatively new business. Reports on mechanical strength reduction from the recycling process indicate potential limitations.
CF products do not break down over time. From a user perspective, this is excellent and represents long-term product value. However, from a lifecycle perspective, when CF goods are discarded, if recycling is a challenge, long-term storage in landfills could be an issue. End of life solutions, such as incineration and gasification, may be an option.
3.1.7 Manufacturing Locations
Low volume, high value products such as CFs are typically insensitive to where they are produced. The ORNL report supports this statement. A prime example of this is the relationship that exists between Mitsubishi (Japan), SGL (USA) and BMW (Germany). Figure 26 and the points that follow describe the relationship across the value chain.
48 http://www.torayca.com/en/aboutus/abo_003.html. Accessed 7th February 2018.

BITUMEN BEYOND COMBUSTION – PHASE 2 REPORT
Detailed Summaries
an c:\users\nashcroft\documents\stantec - business development advisor\general business development\bitumen beyond combustion\post po\final report\12th february\bbc phase ii report_14_a.docx 3.56
Figure 26: Carbon Fiber Supply and Value Chain: Japan to USA to Germany
If we compare the manufacturing route for eventual CF use in BMW vehicles, it is apparent that there must be extensive logistical costs within this supply chain.
The CF precursor, PAN is produced from crude oil derived propylene in Japan by Mitsubishi. The subsequent conversion of the PAN fiber to CF is done at SGL ‘s facility in Moses Lake, Washington. The operation takes advantage of available hydroelectric power. The company is located there for this reason, for the low cost as much as for the renewable aspect. CF, now on spools, is exported from Moses Lake to BMW in Germany for processing into vehicle components.
Comparatively, Alberta currently has extensive propane production and vast reserves of a pitch equivalent feedstock for CF manufacture. If this is coupled with end user markets for major industries, such as automotive, aircraft, steel, and concrete, it is logical that CF precursor feedstock (monomer, polymer or spun fiber) could be produced within Alberta, with the resulting intermediate moved across Canada closer to a larger manufacturing hub such as southern Ontario for PAN and end product manufacturing. Likewise, as the PAN or pitch equivalent could be shipped in solid form rail access to major ports, such as Vancouver, British Columbia provides for export via a relatively straight forward supply-chain.
Utilizing clean power such as hydropower for part of the production chain could potentially be attractive to jurisdictions like Ontario as a suitable PAN and CF manufacturing destination.
3.1.8 Technology Readiness Levels
The BP and Asahi technologies to produce acrylonitrile from propylene and propane with ammonia, respectively, both have commercial references and can be concluded to be at Technology Readiness Level (TRL) 10. Whether either of the technologies are available for license from these licensors is undetermined.

BITUMEN BEYOND COMBUSTION – PHASE 2 REPORT
Detailed Summaries
an c:\users\nashcroft\documents\stantec - business development advisor\general business development\bitumen beyond combustion\post po\final report\12th february\bbc phase ii report_14_a.docx 3.57
Producing CF from and oil sands-derived pitch / asphaltene has yet to be completed. However, other CF manufacturers are currently producing CF from similar feedstocks. A TRL level of 3 would appear appropriate.
Figure 27: Technology Readiness Level
3.1.9 Intellectual Property As shown by Figure 28, the technology to produce CF proceeds through a series of discrete process steps. Each step represents a specialized technology in its own right and hence, opportunity to patent (indicated by a blue dot in the figure). Companies active in CF rigorously protect their technology. The following is quoted from the Oak Ridge report.
“All CF manufacturers in the market place have their own in-house polymerization and precursor spinning capabilities and as such the processes and recipes used to convert acrylonitrile into CF-grade PAN and then the precursor are closely guarded intellectual property that the manufacturers are reluctant to outsource.”
Figure 28: Production of Carbon Fiber

BITUMEN BEYOND COMBUSTION – PHASE 2 REPORT
Detailed Summaries
an c:\users\nashcroft\documents\stantec - business development advisor\general business development\bitumen beyond combustion\post po\final report\12th february\bbc phase ii report_14_a.docx 3.58
3.1.9.1 Alternative Feedstocks
Due to PAN-derived CF’s higher cost, as well as the reduced carbon yield, other possible feeds have received the attention of industry, as shown in Table 20.
Table 20: Alternative Feedstocks and Processes for the Production of CF
Other streams that have received attention are: steam cracker tar, coal tars from coal carbonization of different severity (thermal) treatments, and liquid asphaltene stream from Cokers. For example, US20140175688 (Honeywell) speaks to making a CF from an asphaltene isolated during the upgrading of a heavy oil feed during coking. Consideration of US4670129 (Mitsubishi) is interesting in that the mesophase feed is prepared via the controlled polymerization of specific low molecular weight alkylbenzenes. The rationale for the approach is that the physical properties of traditionally derived pitch present problems for spinning. Specifically, said pitch has a high softening point and requires spinning at temperatures in the order of 340 °C to 380 °C. What is outlined in the invention, proposes a fundamentally different route for producing pitch for CF. It is in essence a synthetic pitch, where a higher control of the final polymer’s molecular weight distribution and the softening point are allowed, which affects both the spinning conditions and the properties of the final fiber. The invention further claims an advantage to the process, as it is largely free of sulfur and metal contaminants that could otherwise cause fiber defects. The latter informs and is
No. Patent Assignee Filing datePublication
dateTitle Description
2 US4999099 Conoco - Mar-91Process for Making Mesophase Pitch
An improved process for producing anisotropic pitch product suitable for CF manufacture from heavy oil FCC (e.g. 482OC + fraction) feed with 75-90% aromatics. Said feed is heated at temperature (350 - 450oC) while passing a reactive sparging oxidative [oxygen, ozone, formic acid, hydrogen peroxide, hydrogen chloride] gas thru the feed. The gas contains 0.1 - 2vol% oxygen. Process produces an anisotropic pitch with 50 - 100vol% mesophase that is suitable for melt spinning. Sulphur and nitrogen components in the feed should be <4wt%. Mr range
(200-1,000).
3 US4518483 DuPont - May-85Aromatic Pitch from Asphaltene Fractions
A pitch suitable for carbon artifact manufacture such as CFs, is obtained by heat soaking an asphaltene fraction of a heavy aromatic feedstock at 380-440OC for about 1-500 minutes.
4 US4414095 Exxon - Nov-83Mesophase Pitch using
Steam Cracker Tar
A feedstock for carbon artifact manufacture is obtained from a steam cracker tar by heat soaking the steam cracker tar or a vacuum stripped steam cracker tar with a polycondensed
aromatic oil thereby providing a pitch suitable for carbon artifact manufacture.
5 US20130040520Honeywell Federal Manufacturing and
TechnologiesFeb-13 -
Carbonized Asphaltene-Based Carbon-Carbon
Fiber Composites
A method of making a carbon binder reinforced carbon fiber composite is provided using asphaltenes as the carbon binder.
6 US20140175688Honeywell Federal Manufacturing and
TechnologiesJun-14 -
Methods of Making Carbon Fiber from
Asphaltenes
CF is made from asphaltenes obtained from heavy oil feedstocks undergoing upgrading in a continuous coking reactor. Summary speaks to removing a liquid asphaltene (a heavy
residium) stream from the coking reactor where it has been heat treated (450 - 550OC), filtering it yield a purified asphaltene stream before it is melt spun.
7 US5182011Maruzen
Petrochemical- Jan-93
Process for Preparing Pitches
Process for the production of a pitch with improved mesophase content. Four step process: (i) heat treatment, (ii) distillation, (iii) BTX solvent extraction; (iv) distillation. Patent also speaks to hydrogenation. Feed: heavy oil of a pitch of coal free of monocyclic aromatic
insolubles.
8 US4670129 Mitsubishi Oil Co. - Jun-87Pitch for the
Production of Carbon Fibers
A pitch having optical anisotropy for use in the production of CFs, wherein the pitch is prepared using a composition represented by the formula as a raw material and subjecting
the compound to thermal modification and then removing light fractions. Patent refers to a "synthetic pitch" using a mesitylene-formalin (alkylbenzene) as a raw material. Feed
examples: C10 aromatic and Nikanol resin (trade name - http://www.fudow.co.jp/en/products/nikanol.html)
9 US5308599 Petroca - May-94Process for Preparing Pitch based Carbon
Fiber
A process is disclosed for producing pitch-based CF which comprise melt spinning an optically isotropic pitch or mesophase pitch to form CF.
Note : the above table represents a sample to demonstrate that industry players have explored alternative feeds; it does not imply that a detailed review of publicly available information or patent literature has been done.

BITUMEN BEYOND COMBUSTION – PHASE 2 REPORT
Detailed Summaries
an c:\users\nashcroft\documents\stantec - business development advisor\general business development\bitumen beyond combustion\post po\final report\12th february\bbc phase ii report_14_a.docx 3.59
supported by the reference49, that at its most basic, it is not merely a matter of isolating a suitable fraction of carbon material, spinning it and processing further to produce CF.
3.1.10 Insights and Conclusions
For CF manufacturing to grow substantially and become a meaningful destination for bitumen and propane producers (100k+ bpd of bitumen), CF will need to displace and integrate with major commodities such as steel, concrete, and, to a lesser extent, wood products, as shown in Table 10 and Table 13.
The displacement of steel for major industries (automotive, aircraft) will only materialize when the cost point of CF production drops to a level where the production economics are in balance with the benefits of the end product.
The cost structure of CF production can be split out into three components:
o Pre-cursor feedstock (PAN, Pitch / Asphaltene)
o CF production
o End product manufacturing
As previously discussed, high performance CF from PAN costs are estimated to be between US$3-4/lb (US$ 6,700 – 8,800 /ton). Although not a direct comparison, asphaltene and bitumen costs are US$0.02/lb (US$44/ton) and US$0.15/lb (US$331/ton) respectively, representing a tremendous starting point to investigate lower cost pathways for CF production from these feedstocks.
Determining the commercial viability of CF production from Alberta feedstocks, merits thorough investigation, particularly asphaltene and synthetic pitch types.
As two paths to CF production have been identified (Propane-PAN and Asphaltene-Pitch), a portfolio of feedstock options potentially allows the following:
o Positioning to offer different customer solutions, e.g., general purpose to high performance fibers.
o Technical developments to be shared across product categories.
o Economy of scale from multifaceted research and production alternatives.
o The feedstock producer to differentiate from the competition.
o Risk (market) mitigation and diversification opportunities.
Combining the upstream and petrochemical industry within Alberta with a manufacturing hub such as Ontario for end product manufacturing (or potentially CF production) appears to be a significant opportunity. Additionally, utilizing clean power such as hydropower for end product manufacture would also potentially lend support to Ontario as a suitable PAN and CF manufacturing destination.
49 Chapter 2. Carbon_fiber_from_PAN_and_Pitch, page 28. Soo-Join Park and Gun-Young Heo. www.springer.com/cda/content/document/cda.../9789401794770-c2.pdf

BITUMEN BEYOND COMBUSTION – PHASE 2 REPORT
Detailed Summaries
an c:\users\nashcroft\documents\stantec - business development advisor\general business development\bitumen beyond combustion\post po\final report\12th february\bbc phase ii report_14_a.docx 3.60
3.2 ASPHALT TRANSPORTATION
3.2.1 Overview
Asphalt, also known as asphalt binder and asphalt cement, is a sticky, highly viscous mixture of dark bituminous pitch and is part of the heavy residue of the crude oil refining process. Its primary use, 78% (201650), is in road construction, where is it used as the glue or binder mixed with aggregate particles such as sand, gravel, and crushed stone to create asphalt concrete. Asphalt concrete refers to the composite material of mineral aggregate adhered with the asphalt binder51.
Asphalt is not to be confused with asphaltenes, as defined in Table 4, page 3.21. Asphalt is composed almost entirely of a pitch like mixture and is a complex mixture of hydrocarbons that can be separated into two major fractions – asphaltenes and maltenes52. Asphaltenes are a component of asphalt, typically (5%-25%) by mass53.
In roadway construction, a typical mix is 5 wt.% asphalt as the binder to 95 wt.% aggregate mix. However, this content may vary. Additional uses for asphalt include waterproofing products such as roofing felt and sealant for flat roofs. It also has applications in recreation areas, such as for use in playgrounds, running tracks, greenway trails, and basketball and tennis courts.
Asphalt binder can be mixed with aggregate in many ways, depending on the desired characteristics of the product. Some types of asphalt include:
Hot mix asphalt
Cut-back asphalt
Warm mix asphalt
Mastic asphalt or sheet asphalt
Natural asphalt
3.2.2 Market
The global asphalt market was estimated at 128 million tons in 201754. From an Oil Sands perspective, this corresponds to 2.1 million bpd of asphalt (at 1:0.6 ratio) and 3.6 million bpd of bitumen. This is clearly a significant market.
50 Infinity, R. L. (2017). Global Asphalt Market 2017-2021. Technavio.com. 51 Wikipedia, 2018. 52 Asphalt as a Product Of Asphaltenes. (2018, 01 12). Retrieved from Lloydminster Heavy Oil: http://www.lloydminsterheavyoil.com/asphalt.htm. 53 Steven Manolis, P. (2014, March 25). Engineering Properties of Asphalt Cement Binders and their Relation to Pavement Performance. Retrieved from Asphalt Institute: http://www.asphaltinstitute.org/wp-content/uploads/Thickness_Mix/2014-pptbyManolis-EngineeringPropertiesofACBindersandRelationtoPavementPerformance.pdf 54 Infinity, R. L. (2017). Global Asphalt Market 2017-2021. Technavio.com.

BITUMEN BEYOND COMBUSTION – PHASE 2 REPORT
Detailed Summaries
an c:\users\nashcroft\documents\stantec - business development advisor\general business development\bitumen beyond combustion\post po\final report\12th february\bbc phase ii report_14_a.docx 3.61
The market is expected to grow (Figure 29) at a CAGR of 4.1%. Growth can be attributed to: the need for building and rebuilding assets, such as roads, bridges and buildings, a rising demand for asphalt roofing / waterproofing products, need for asphalt emulsions, an upsurge in the use of reclaimed asphalt pavement and public funding55.
Figure 29: Global Asphalt Market Size
Roadways were the largest market sector for asphalt (96 million tons) in 2016, it is expected reach 180 million tons in 2030; Figure 30 and Figure 31.
.
Figure 30: 2016 Global Asphalt Market by Application
55 Infinity, R. L. (2017). Global Asphalt Market 2017-2021. Technavio.com.
96.0
18.5
4.9 3.7
2016 Global Asphalt Market By Application
Million Metric Tons - Roadways Million Metric Tons - Waterproofing
Million Metric Tons - Recreation Million Metric Tons - Other

BITUMEN BEYOND COMBUSTION – PHASE 2 REPORT
Detailed Summaries
an c:\users\nashcroft\documents\stantec - business development advisor\general business development\bitumen beyond combustion\post po\final report\12th february\bbc phase ii report_14_a.docx 3.62
Figure 31: 2030 Global Asphalt Market by Application
Asia Pacific was the dominant market in 2016 accounting for greater than 28% of global volume. Growth is expected to continue because rising construction growth in India, China, Thailand, and Vietnam56. Asia Pacific’s asphalt market’s CAGR is 4.1%. Reconstruction of the Silk Road (belt and road initiative) is leading to additional paving requirements in E. Europe and Asia. The top global vendors of asphalt include:
BP (UK)
CEMEX (Mexico)
Exxon Mobil (US)
Imperial Oil (Canada)
Royal Dutch Shell (Netherlands)
3.2.3 Production
Producing asphalt from bitumen is a straight forward distillation process that will involve adding energy (heat) to thermally distill the asphalt fraction (at approximately 350 °C). The lighter fraction can be integrated back into the processing facility. The distillation temperature is critical to ensure enough light ends are removed from the asphalt product. A study completed by MEG Energy in conjunction with Western Research Institute (2014) determined the criticality of the cut temperature. For the BBC study, we have outlined a process scheme with a 350 °C temperature target temperature.
56 Grand View, R. (2017, September 28). Bitumen Market Projected To Be Worth $79.91 Billion by 2024. Retrieved from Grand View Research: https://www.slideshare.net/DhanashreePawar2/bitumen-market-is-expected-to-witness-significant-growth-owing-to-increasing-use-in-various-roadways-and-waterproofing-applications-till-2024

BITUMEN BEYOND COMBUSTION – PHASE 2 REPORT
Detailed Summaries
an c:\users\nashcroft\documents\stantec - business development advisor\general business development\bitumen beyond combustion\post po\final report\12th february\bbc phase ii report_14_a.docx 3.63
Depending on the specification of asphalt required, the ratio will change with bitumen. From Figure 32, a ratio of 1:0.6 is estimated.
Production of asphalt from bitumen can be developed to meet any future market demand. Meeting or surpassing the 100k bpd threshold is not an issue.
Figure 32: Asphalt production from Bitumen
3.2.4 Transportation of Asphalt Infrastructure Overview
The primary means of transporting asphalt binder are listed below. Each have advantages and disadvantages.
Rail
o Commonly done in 90 t cars. The delivery temperature of the asphalt directly affects unloading time and heating costs. When the cars are not heated in transit they may require reheating. This depends on ambient temperature and travel time. Some railcars may spend as much as three weeks in transit and require reheating. This can take 24 hours before the asphalt is ready for unloading.
Water (Shipping)
o Offers low costs over great distances. Tankers and barges are relatively clean and cost-effective for long distances. However, maintaining the asphalt binder at the correct temperature is a major consideration. Tankers load at ocean terminals, suggesting there is a limited availability of loading and offloading sites at waterways. This method may also be prone to delays due to weather conditions.
Road (Truck)

BITUMEN BEYOND COMBUSTION – PHASE 2 REPORT
Detailed Summaries
an c:\users\nashcroft\documents\stantec - business development advisor\general business development\bitumen beyond combustion\post po\final report\12th february\bbc phase ii report_14_a.docx 3.64
o Offers the most control over delivery time. However, it is generally the more costly option and best suited to short-haul. Heat loss and product contamination can be a concern.
In all three modes of transportation, managing heat loss and limiting the need for re-heating is a key consideration. Loading and unloading methods tend to be time-consuming and require specialized equipment. Dedicated equipment may be required to avoid contamination. A potential solution to the heat challenge could be to transport the asphalt in solid form. This is explored in the following sections.
3.2.4.1 CanaPux
CanaPux is a technology being developed by Canadian National Railway (CN) in collaboration with Inno-Tech Alberta. The technology wraps bitumen with a layer of polymer, transforming the bitumen into a buoyant solid puck designed to not leak or sink in water and to be stackable57 . In principle, the technology could be used for transporting asphalt.
The polymer used to coat the asphalt pucks could be one that remains with the asphalt to enhance performance and might be a form of polymer modified asphalt (PMA). Potential coating options could include:
Natural polymers (e.g., Lignin).
Thermoplastics / plastomers (e.g., polypropylene, polyethylene and derivatives, ethylene vinyl acetate [EVA]).
Elastomers (e.g., natural rubber, synthetic rubber, polybutadiene, butyl rubber).
Thermoplastic elastomers (e.g., styrenic block copolymers: styrene-butadiene-styrene [SBS], styrene-butadiene [SB], styrene-butadiene-rubber [SBR], polyolefin blends, thermoplastic polyurethane).
Ground tire rubber (e.g., reclaimed scrap tires)58.
Some practical requirements for asphalt cement modifiers include:
Improve performance properties: high temperature rutting, low temperature cracking, fatigue resistance, adhesion to aggregate.
Storage stability: it must resist separating from asphalt cement.
Processability: the modifier must be pump-able and miscible.
Negatively impact roll, and ability to be compacted during application.
57 Mining, &. E. (2017, November 23). "CanaPux" - converting crude oil to solid pellets touted by CN. Retrieved from Canadian Mining & Energy: http://www.miningandenergy.ca/energyinsider/article/canapux_converting_crude_oil_to_solid_pellets_touted_by_cn 58 Eurobitume, 2017. http://www.eurobitume.eu/about/mission/.

BITUMEN BEYOND COMBUSTION – PHASE 2 REPORT
Detailed Summaries
an c:\users\nashcroft\documents\stantec - business development advisor\general business development\bitumen beyond combustion\post po\final report\12th february\bbc phase ii report_14_a.docx 3.65
Cost effective and (readily) available59.
3.2.4.2 Bitumen Balls
Bitumen balls is a technology being developed by the University of Calgary. The technology is a self-sealing ball, where the seal is reportedly an asphaltene coating. The concept was initially developed for shipping bitumen in rail cars. Since bitumen and asphalt have similar properties, the concept might apply to asphalt.
If this technology is developed with the performance characteristics claimed and can be used for asphalt balls. Claimed benefits of transforming bitumen into balls include the following.
Can be quickly formed. The skin protects and stores a liquid bitumen core, it no longer needs to be transported in a tanker car.
No need for additives, potentially making them better than other polymer-based sealants that require additional chemicals.
The energy needed to make the balls is approximately the same as what’s needed to heat the bitumen for traditional transport.
Can be easily be loaded into existing rail cars designed for coal. No heating during transit needed means lower costs.
Figure 33: Bitumen Balls60
59 Manolis, S. (2014, March 25). Engineering Properties of Asphalt Cement Binders and their Relation to Pavement Performance. Retrieved from Coco Asphalt Engineering: http://www.asphaltinstitute.org/wp-content/uploads/Thickness_Mix/2014-pptbyManolis-EngineeringPropertiesofACBindersandRelationtoPavementPerformance.pdf 60 Gibson, J. (2017, November 23). Balls of bitumen: Calgary breakthrough could bypass pipeline problem, researcher says. Retrieved from CBC News: http://www.cbc.ca/news/canada/calgary/bitumen-balls-pellets-pipelines-rail-train-transport-energy-alberta-technology-1.4277320

BITUMEN BEYOND COMBUSTION – PHASE 2 REPORT
Detailed Summaries
an c:\users\nashcroft\documents\stantec - business development advisor\general business development\bitumen beyond combustion\post po\final report\12th february\bbc phase ii report_14_a.docx 3.66
3.2.4.3 Asphalt cement pellets
Asphalt-cement or paving ready pellets are a current technology already in use for transporting and delivering unheated solid asphalt-cement for small road repairs. NiTech61 and RoadMender62,63 are two examples. Previous disadvantages of the concept were high production costs and agglomeration in storage. Both have been improved64, however this technology does not appear to have been applied at scale.
Asphalt-cement ready pellets offer the benefits of:
No need for primary asphalt terminals. No heated storage tanks or insulated tanker trucks. This means reduced energy consumption and greenhouse emissions.
No dangerous handling of hot asphalt in drums.
Recycled Asphalt Pavement (RAP) can be preheated and mixed with pellets, enabling higher RAP concentrations.
Warm Mix Asphalt (WMA): saving of energy and emissions can be maintained.
Convenient to deliver to remote locations.
Less waste (asphalt mix too cold; unused additives).
Figure 34: Nitech’s Asphalt cement Pellets65
61 http://www.nitechcorp.com/PelletizedAsphalt.html 62 Roadmender was previously Billian International (www.pavingpellets.com). 63 http://www.roadmenderasphalt.com/ 64 Rocky Mountain Asphalt. (2015). Asphalt Pellets: An Alternative Delivery System for Asphalt Products. Retrieved November 2017, from Rocky Mountain Asphalt: http://www.rockymountainasphalt.com/Asphalt%20Pellet%20white%20paper.pdf 65 Note: the label “bitumen” in the figure should be read to mean asphalt.

BITUMEN BEYOND COMBUSTION – PHASE 2 REPORT
Detailed Summaries
an c:\users\nashcroft\documents\stantec - business development advisor\general business development\bitumen beyond combustion\post po\final report\12th february\bbc phase ii report_14_a.docx 3.67
Figure 35: RoadMender - Asphalt cement Pellets on Pallets66
3.2.4.4 Existing Rail Network in North America
In comparison to transporting hot molten asphalt, transporting asphalt as a solid ball or puck at ambient temperature offers the following benefits.
Energy: cost savings from not having to maintain the asphalt at elevated temperature over long distances for extended periods.
Handling: reduced requirement for specialized equipment for liquids handling with respect to loading / unloading equipment.
Health and Safety: minimize burn incidents and exposure to carcinogens in asphalt fumes67.
Logistics: the possibility of being able to potentially use existing coal or other solids handling infrastructure.
There is an extensive rail network in North America, shown in Figure 36.
66 Roadmender, A. (2017, November 23). Volumetric HOT_MIX Asphalt. Retrieved from Road Mender Asphalt: http://www.roadmenderasphalt.com/wp-content/uploads/2016/11/collage-bags-material-drum-discharge-web.png 67 Butler, M., Burr, G., Dankovic, D., Lunsford, R., Miller, A., Nguyen, M., Zumwalde, R. (2000, December). Health Effects of Occupational Exposure to Asphalt. Retrieved from Centers for Disease Control and Prevention: https://www.cdc.gov/niosh/docs/2001-110/pdfs/2001-110.pdf

BITUMEN BEYOND COMBUSTION – PHASE 2 REPORT
Detailed Summaries
an c:\users\nashcroft\documents\stantec - business development advisor\general business development\bitumen beyond combustion\post po\final report\12th february\bbc phase ii report_14_a.docx 3.68
Figure 36: North American Rail Network68
Canadian National Railway Company, CN, has moved 13 million tons of coal annually as of 200969, which is the equivalent of 130,000 car loads/year or in terms of asphalt, 210,000 bpd. The infrastructure is currently in place for port interfaces, mine interfaces, and equipment allocation. By transporting asphalt in a solid form, existing infrastructure could be taken advantage of with the potential decline in coal production and consumption. Figure 37 illustrates a Canadian Pacific Railway (CP) logistics network.
Figure 37: CP Facilities Map
68 CP Network Map 2016. (2016, March 22). Retrieved from CP Rail: http://www.cpr.ca/en/choose-rail-site/Documents/cp-network-map-2016.pdf 69 Meyer, R. (2009). Transportation Solutions for Oil Sands Production Phase. Calgary: Canadian Heavy Oil Association

BITUMEN BEYOND COMBUSTION – PHASE 2 REPORT
Detailed Summaries
an c:\users\nashcroft\documents\stantec - business development advisor\general business development\bitumen beyond combustion\post po\final report\12th february\bbc phase ii report_14_a.docx 3.69
In Asia, there are plans to develop the rail network to connect Kunming (Yunnan province, China) to Vientiane (Laos), Bangkok (Thailand), Kuala Lumpur (Malaysia), and Singapore, adding 3,900 km by 202070.
Figure 38: Trans-Asian Railway Network71
From the preceding maps, there is significant rail infrastructure to transport asphalt from the oil sands throughout North America and into the Asian markets.
With the potential to ship asphalt in solid form at ambient temperatures comes the potential to ship the product in open gondola rail cars or intermodal [shipping] containers via rail / barge / ship, thereby reducing loading and unloading times and costs. Also, by using containers, the potential is there to return the containers at a lower cost on back-haul routes, as opposed to paying for shipping the empty container back to origin.
3.2.4.5 Existing Major Ports in North America
There are numerous ports that form part of the American Association of Port Authorities (AAPA). Major North American ports on the west coast include:
Canada:
o Prince Rupert Port Authority
o Vancouver Fraser Port Authority
70 Cheng, H. (2016, July 7). Rail freight comes of age in Asia as network expands. Retrieved from Fwd News: https://www.fwd.news/rail-freight-asia-network-expands/ 71 Srisakulk. (2016, November 1). Trans-Asian Railway Network. Retrieved from United Nations Economic and Social Commission for Asia and the Pacific: http://www.unescap.org/sites/default/files/TAR%20map_1Nov2016.pdf

BITUMEN BEYOND COMBUSTION – PHASE 2 REPORT
Detailed Summaries
an c:\users\nashcroft\documents\stantec - business development advisor\general business development\bitumen beyond combustion\post po\final report\12th february\bbc phase ii report_14_a.docx 3.70
USA: Port of
o Seattle
o Tacoma
o Greys Harbor
o Longview
o Vancouver (USA)
o Coos Bay
o Oakland
o Richmond
o Los Angeles
o Long Beach
Depending on the Asian destination, Canada’s key west coast ports are Prince Rupert and Vancouver. For eastern markets, Ontario ports such as Hamilton are of interest, as shown in Figure 39 and Figure 40.
Figure 39: AAPA Canadian Member Ports72
72 AAPA. (2017). AAPA Canadian Member Ports. Retrieved from American Association of Port Authorities: http://aapa.files.cms-plus.com/images/2017_DelegationMap_Canada.jpg

BITUMEN BEYOND COMBUSTION – PHASE 2 REPORT
Detailed Summaries
an c:\users\nashcroft\documents\stantec - business development advisor\general business development\bitumen beyond combustion\post po\final report\12th february\bbc phase ii report_14_a.docx 3.71
Figure 40: AAPA U.S. Member Ports73
Regarding Asian destinations, there is an extensive array of ports across countries in the region. Major ports include:
China: Hong Kong, Shanghai, Shenzhen, Tianjin
Japan: Kobe, Yokohama
Malaysia: Port Klang
Singapore
South Korea: Busan
Taiwan: Kaohsiung
Vietnam: Ho Chi Minh City – Saigon Port
3.2.5 Technology Readiness Levels
The asphalt industry from the refinery into the market is well established. However, shipping asphalt long distances in significant quantities is challenging due to the sophisticated (heated) storage, handling, transportation, and safety requirements. This is related to the mixing and transporting temperatures of asphalt which are greater than 150 °C. Asphalt must be handled at these temperatures due to the product’s high viscosity and to prevent set up.
73 AAPA. (2017). AAPA U.S. Member Ports. Retrieved from American Association of Port Authorities: http://aapa.files.cms-plus.com/images/2017_DelegationMap_USA.jpg

BITUMEN BEYOND COMBUSTION – PHASE 2 REPORT
Detailed Summaries
an c:\users\nashcroft\documents\stantec - business development advisor\general business development\bitumen beyond combustion\post po\final report\12th february\bbc phase ii report_14_a.docx 3.72
Shipping asphalt to the growing markets in North America and overseas is challenging. The added logistical costs often deem it uneconomical. Shipping asphalt in solid form would simplify the logistics and would potentially enable Alberta-produced asphalt to reach growing markets.
Currently, asphalt is stored in heated tanks with gentle agitation that keeps it at a constant temperature. The tanks can be heated using the following methods: thermal fluid, direct-fired, or electric heating. Transportation of hot asphalt is at TRL 10, and as a solid (ball / puck) is at TRL 3.
Figure 41: TRL for Asphalt Transportation Technologies
3.2.6 Business Case
There are various processes to distill an asphalt fraction from crude residues. An atmospheric and vacuum distillation arrangement is most common. Existing upgraders utilise this arrangement with a coker typically, to produce synthetic crude. If this configuration installed at an In Situ facility, it would require a fired heater to increase the feed temperature for distillation.
In order to provide a very rough order of magnitude (VROOM) of cost, if we extrapolate the Nexen74 values of $2,300/bpd processing cost for de-asphalting of bitumen to a factor of 1.5 (allowing for additional more complex equipment) to give $3450/bpd to use as a basis.
Table 21: VROOM CAPEX and OPEX Asphalt production
Bitumen Production
(throughput)
Nexen estimate
‘conceptual’ cost of
de-asphalting unit
Factor to atmospheric and vacuum distillation –
approximately 1.5
Throughput C$/bpd for
given technology (de-
asphalting)
CAPEX @ Very rough order of
magnitude (VROOM)
Daily OPEX (VROOM) @ 10%
increase on Bitumen bbl. Cost (see Table 25) to produce Asphalt
daily (30kbpd)
30,000 bpd C$2,300 / bpd
C$3,450/bpd 30,000 × $3,450 C$103,500,000 C$4,500,000
74 Personal communication with N Zerpa, January 2018.

BITUMEN BEYOND COMBUSTION – PHASE 2 REPORT
Detailed Summaries
an c:\users\nashcroft\documents\stantec - business development advisor\general business development\bitumen beyond combustion\post po\final report\12th february\bbc phase ii report_14_a.docx 3.73
Table 22 provides order of magnitude costs for shipping asphalt to Hong Kong and Shanghai. Twenty-foot containers provide the most cost-effective option.
Table 22: Container Costs - Vancouver to Asia
The price of asphalt can vary greatly and is a function of:
Asphalt supply and demand
Crude prices / refinery economics / cokers / bunkers
Refining margins and capacity
Bunker, fuel and residual (supply / demand)
General: natural disasters, international markets
Transportation – trucks, rail, barge
The China asphalt spot price on January 3, 2018, was RMB28007 75 (C$539/ton). Selling prices for asphalt cement per ton in Canada are reported in Table 23.
75 SunSirs. (2018, 01 04). SunSirs Commodity Data Group. Retrieved from China Asphalt Price: http://www.sunsirs.com/uk/prodetail-1022.html
No Description Unit Value Unit Value1 lb (max) 47,810 ton (max) 1052 ft3 (max) 1,171
3 lb (max) 59,140 ton (max) 1304 ft3 (max) 2,386
Convert lb to kg 0.4536
No Mode Unit Value Ref. Unit Value Ratio5 20 ft 842 7.99 1.216 40 ft 1,257 9.64
7 20 ft 993 9.42 1.218 40 ft 1,483 11.37
(1)
US$ / ton
US$ / ton
(1) MoverDB. (2017, December 19). 2017 Overseas Cargo & Freight Costs From Canada. Retrieved from Mover DB: https://moverdb.com/freight-costs-canada/
Reference
US$ / container
US$ / container
Barge
Barge
Description
Shipping container - standard 20 ft.
Shipping container - standard 40 ft.
Vancouver - Shanghai
Vancouver - Hong Kong

BITUMEN BEYOND COMBUSTION – PHASE 2 REPORT
Detailed Summaries
an c:\users\nashcroft\documents\stantec - business development advisor\general business development\bitumen beyond combustion\post po\final report\12th february\bbc phase ii report_14_a.docx 3.74
Table 23: Selling Prices of Asphalt Cement, February 2016 (Don Wessel, 2016)
Canada Selling Prices Asphalt Cement C$ / ton
British Columbia 622
Alberta 612
Saskatchewan/ Manitoba 595
Toronto, Ontario 625
Montreal, Quebec 562
Table 24 presents bitumen prices in several global locations. Note that in Europe bitumen refers to the liquid binder, whereas in North America, liquid binder is referred to as asphalt or asphalt cement76.
Table 24: Global Bitumen* Prices, Aug 2015 (Argus, 2017)
Domestic Bitumen Prices, Aug 2015 US$/ton
South Korea 728
Mumbai, India 475
Thailand 338
Indonesia 430
Singapore 420
Japan 456
Northern Germany 308
Northern France 353
Hungary 339
Italy 311
South Africa 408 *Outside of North America, asphalt is referred to as bitumen.
Table 25 shows that assuming the given rail and tanker costs, as well as an assumed C$75/ton cost from the Shanghai tanker terminal to location and a C$539/ton selling price of asphalt in China, the approximate margin per ton varies with the cost of production and pelletizing as shown in Table 25. It is important to note that these costs of transportation vary substantially per contract.
76 Bitumen. (2018, 01 10). Retrieved from Isfahan Bitumen Production Group: http://www.iranbitumen.com/Bitumen/What-is-bitumen

BITUMEN BEYOND COMBUSTION – PHASE 2 REPORT
Detailed Summaries
an c:\users\nashcroft\documents\stantec - business development advisor\general business development\bitumen beyond combustion\post po\final report\12th february\bbc phase ii report_14_a.docx 3.75
Table 25: General Asphalt OPEX Overview – Fort McMurray to Shanghai77
Description C$/bbl.
(Asphalt 10% Increase on Diluted Bitumen ($21.60)78
C$/ton Basis
Production 24 150 Suncor Q3 financial reporting.
Pelletizing 8 65 Stantec conservative estimate. – Bio-mass pelletizing costs as basis2
Rail (Ft McMurray – Vancouver) 15 90 Spot pricing
Cargo Ship (Vancouver – Shanghai) 8 50 Spot pricing
Shanghai Terminal - Location 12 75 Stantec estimate - variable on location.
Total 67 430 bbl to ton conversion at 6.3 (rounded up)
With a selling price in China of C$539/ton and an estimated the cost to market of C$430/ton, this gives a margin potential of C$124/ton. This estimate was a very high-level cost-check, no taxes, tariffs or special commercial costs were investigated.
As discussed in the previous section, the cost of transporting asphalt from Fort McMurray across North America and beyond is relatively low. Existing infrastructure across road, rail, and shipping can be utilized with shipping asphalt in a solid form.
3.2.7 Social Acceptance and Environmental Net Effects
The general public is widely accepting of using asphalt for road construction. Producing significant quantities of asphalt from oil sands would not be expected to receive considerable attention. Given the advantages of asphalt derived from oil sands, there could be positive aspects related to the total lifecycle of a more durable product. The near total recyclability of asphalt is an added benefit.
Exporting significant quantities of asphalt to a wider North American market and beyond, would also create significant additional revenue and provide additional employment.
Shipment of hot asphalt has historically had significant safety issues related to severe burns, toxic fumes, and fire incidents. The potential to switch to a solid form of asphalt shipment effectively eliminates many of these challenges, as the points of handling and temperatures are greatly reduced.
Utilizing existing infrastructure and equipment such as atmospheric and vacuum distillation equipment currently installed in upgraders to produce an asphalt stream would not increase the GHG emissions as this is already accounted for. However, installing new distillation arrangements and fired heaters for processing asphalt from a diluted bitumen stream for example, would incur additional GHG emissions.
77 (i)http://www.suncor.com/newsroom/news-releases/2166941. (ii) http://www.bestpelletplant.com/Biomass-Wood-Pelletization-Cost-Analysis.html1 78 http://www.suncor.com/newsroom/news-releases/2166941

BITUMEN BEYOND COMBUSTION – PHASE 2 REPORT
Detailed Summaries
an c:\users\nashcroft\documents\stantec - business development advisor\general business development\bitumen beyond combustion\post po\final report\12th february\bbc phase ii report_14_a.docx 3.76
Transporting asphalt in solid form offers reduced energy consumption and greenhouse emissions over molten asphalt, due to no longer requiring additional energy for transporting and storing hot asphalt, as well as reducing the need for cleaning of transport vessels after unloading.
Additionally, alternative roadway construction using continuously reinforced concrete pavement, CRCP, was reviewed with respect to sustainability regarding energy consumption and material waste generation. Asphalt pavement generates less waste than CRCP79.
3.2.8 Manufacturing Locations
Producing asphalt at the source of oil sands makes sense if the breakthrough solid form technology can be developed. This may reduce or remove the need for transporting diluent with bitumen to a distant facility and removes the burden of transporting molten asphalt over great distances. Additionally, the source is near to existing rail facilities, which can transport the solid-form asphalt directly to the west coast and elsewhere across North America using existing infrastructure.
3.2.9 Benefits of Asphalt from Oil sands
Alberta bitumen is widely perceived to produce high quality asphalt cement. This is due to its generally low paraffin and wax content. The lower paraffin and wax content is responsible for superior asphalt mixture performance with respect to rutting and low temperature cracking. The presence of wax in the bitumen results in physical hardening at low temperatures80. The wax content in Albertan bitumen is estimated to be below 1%, whereas comparatively, the wax content from other global locations could be above 12%81. Additionally, bitumen from Alberta’s oil sands yield a higher percentage of asphalt per ton of bitumen when compared with the amount of asphalt that is produced from the same amount of oil from elsewhere in Alberta.
3.2.10 Insights and Conclusions
The asphalt market globally is large and steady growth is envisaged through to 2030 and beyond. Asphalt production from Alberta has a limited market at this point in time and is unable to compete globally due to molten transportation limitations.
Molten transportation limitations can be overcome if a technology to ‘solidify’ asphalt into ball or pellet form can be developed and proven commercially. If proven, exporting Oil Sands derived asphalt in solid form could utilize extensive rail, ports and terminal infrastructure to open up a major new export industry in a relatively short period of time.
79 John A. Gambatese, S. R. (2005). Sustainable Roadway Construction: Energy Consumption and Material Waste Generation of Roadways. Reston, VA: American Society of Civil Engineers, Construction Research Congress. 80 Lu, X. (2007, November). ResearchGate. Retrieved from Effect of bitumen wax on asphalt mixture performance: https://www.researchgate.net/publication/238381310_Effect_of_bitumen_wax_on_asphalt_mixture_performance 81 Lu, X. (2015, August 27). ResearchGate. Retrieved from A simple test method for determination of waxes in crude oils and bitumens: https://www.researchgate.net/publication/266000674_A_SIMPLE_TEST_METHOD_FOR_DETERMINATION_OF_WAXES_IN_CRUDE_OILS_AND_BITUMENS

BITUMEN BEYOND COMBUSTION – PHASE 2 REPORT
Detailed Summaries
an c:\users\nashcroft\documents\stantec - business development advisor\general business development\bitumen beyond combustion\post po\final report\12th february\bbc phase ii report_14_a.docx 3.77
Concerted efforts to develop a suitable technology appears to have merit. This is effectively a ‘gateway’ technology to possible significant commercial opportunities over many years. The technology may also be applicable for shipment of Asphaltenes, for additional new market opportunities.
In addition to pointing to developing ‘solid form’ asphalt technology, the BBC study has found that asphalt derived from bitumen is particularly high in quality (low wax, low paraffin content), with tangible lifecycle cost advantages over many poorer and inconsistent asphalts that are used currently. The tangible benefits in financial terms at this time, do not appear to be factored into the asphalt market. A study to outline the technical and economic benefits of oil sands derived asphalt seems appropriate.
3.3 POLYMERS
3.3.1 Overview
A list of commodity and lesser known polymers used by modern society was developed, see Table 26. The list was in alignment with the project objective, to identify potential new demand for 100k bpd of bitumen.
Whilst there are visible links in the list to Bitumen in terms of feedstock (e.g., ethane, propylene) for well-known polymers like polyethylene (PE) and polypropylene (PP), for the bulk of the polymers, their monomers and co-monomers, the link is more distant. This is especially so where the required monomer / family of (co)monomers are not directly available by virtue of the number of discrete chemical conversions needed to produce them before the target polymer can be produced.
In addition to the above, it became evident during the study that environmental concerns around traditional polymers with respect to their poor bio-degradability and compostability are, and will increasingly influence social acceptance to products that are not demonstrably different. Examples of industries response are provided later in this section. What is further notable, is that when companies like Natureworks embark on developing “greener”82 polymers, they follow a renewable based production path to the chemical(s) they need to produce the polymer. To do otherwise would be a contradiction of what they set out to achieve and, as is demonstrated by Coco-Cola, would not be to their customers liking as there is often a brand and reputational value in the polymer being developed. It is key to note that the concept of product biodegradability / compostability is separate from feedstock renewability. Just because a product and chemical precursors are made from a renewable feedstock, it does imply they and the final are biodegradable or compostable.
82 The term “green” has been italicized as not all polymers and their precursors that claim to be green are necessarily so. By example: (i) the technology Gevo is developing is for a non-petrochemical route to para-Xylene via fermented iso-Butanol. Purified terephthalic acid (PTA) is produced from para-Xylene and PTA is a key component of Polyethylene terephthalic acid (PET) which is used to produce beverage bottles. PET is not biodegradable / compostable. (ii) PBS: Polybutylene succinic acid. Produced from Succinic acid and 1,4-Butanediol. Whilst both chemicals are available from the traditional butane / maleic anhydride value chain, they can be produced via fermentation (BioAmber, Sarnia; Reverdia, Netherlands, Succinicity - BASF and Corbion JV). PBS is biodegradeable; reference: http://www.succinity.com/images/succinity_broschure.pdf; PDF page 2; DIN EN 13432. It is pertinent to note the contradiction: PBS is biodegradable and can be produced from petrochemical streams. Gevo is developing a route to a momomer via fermentation, the targeted polymer (PET) is not biodegradable. The Gevo technology by virtue of the final product PET is not without an environmental impact.

BITUMEN BEYOND COMBUSTION – PHASE 2 REPORT
Detailed Summaries
an c:\users\nashcroft\documents\stantec - business development advisor\general business development\bitumen beyond combustion\post po\final report\12th february\bbc phase ii report_14_a.docx 3.78
In the context of what we consider as traditional polymers, how existing companies, new entrants and feedstock suppliers might fully respond to environmental concern is currently unclear. Following internal discussion and based on social acceptance (a criterion of this study) it was agreed that Table 26 would not be extensively reported on. Further explanation of the decision is provided following the table.
Table 26: Polymer list developed in BBC Phase 2
No. Abbreviation Name1 ABS Acrylonitrile butadiene styrene resin
2 ASA Acrylonitrile styrene acrylate resin
3 MF Melamine formaldehyde
4 NP Neoprene
5 PA Polyamides
6 PAM Polyacrylamide
7 PAN Polyacrylonitrile
8 PASA Polyaspartic acid
9 PBS Polybutylene succinate
10 PBAT Polybutyrate adipate terephthalate
11 PBT Polybutylene terephthalate
12 PC Polycarbonate
13 PEEK Polyetheretherketone
14 PE (LD, LLD, MD, HD) Polyethylene series
15 PE Polyesters
16 PEF Polyethylene Furanoate
17 PET Polyethylene terephthalate
18 PF Phenol formaldehyde (e.g. Bakelite)
19 PI Polyisoprene
20 PLA Polylactic acid
21 PMMA Polymethylmethacrylate
22 POM Polyoxymethylene
23 PP Polypropylene
24 PS Polystrene
25 PS-E Polystyrene (expanded)
26 PTFE Polytetrafluoroethylene
27 PTMEG Polytetramethylene ether glycol [Spandex]
28 PTT Polytrimethylene terephthalate
29 PUR Polyurethane
30 PVC Polyvinyl chloride
31 SAN Styrene acrylonitrile
32 SBR Styrene Butadiene Rubber
33 UF Urea formaldehyde

BITUMEN BEYOND COMBUSTION – PHASE 2 REPORT
Detailed Summaries
an c:\users\nashcroft\documents\stantec - business development advisor\general business development\bitumen beyond combustion\post po\final report\12th february\bbc phase ii report_14_a.docx 3.79
Environment: a key feature increasingly capturing public and government attention is the environmental impact polymers have on the environment, (see, Figure 42 and its associated comments that follow it). Of the polymers listed in Table 26, only a few had to a degree, a “greener” profile. For example, Polybutylene succinic acid (PBS) is biodegradable, but Succinic acid and 1,4-Butanediol can be produced via fermentation as opposed to the traditional petrochemical route.
Figure 42: The environmental impact of widely used modern polymers
Polymer producers and plastic users are both responding to the environmental outcry, the following are examples:
BioAmber83
o Located at Sarnia, ON, BioAmber is focused on the production of succinic anhydride via fermentation from glucose; capacity 30,000 tpa. Succinic acid is considered a ”platform molecule” from which numerous derivatives can be made, including food, industrial, and textile related chemicals.
Gevo
o 201184: Gevo announced an agreement with Coca-Cola to create renewable para-xylene85 from plant-based isobutanol.
83 https://www.bio-amber.com/ 84 http://www.gevo.com/?casestudy=bio-based-isobutanol-to-enable-coca-cola-to-develop-second-generation-plantbottle-packaging 85 US20110087000: for the production of para-Xylene from iso-Butanol.
BITUMEN BEYOND COMBUSTION – PHASE 2 REPORT
Detailed Summaries
an c:\users\nashcroft\documents\stantec - business development advisor\general business development\bitumen beyond combustion\post po\final report\12th february\bbc phase ii report_14_a.docx 3.80
o 2014, June86: “Gevo and Toray Industries, successfully produce renewable and recyclable PET from isobutanol.”
o PlantBottle: video - http://www.coca-colacompany.com/videos/introducing-plant-bottle-ytaevvjxqwaz8
Natureworks87
o Located in Blair, NB, USA, previously a joint venture between Dow and Cargill have developed polylactic acid (PLA). It is used in fibers, films, blow-molding, etc. PLA is produced via the polymerization of lactic acid which is produced from plant sugars.
Feedstock: Advances in technology have enabled polymer producers to decouple their value chain from crude oil and the geopolitical factors that impact them. Ethane cracking and propane dehydrogenation (PDH) are two examples of this where both feeds in Alberta can be procured from sources other than bitumen should volumes permit.
Location: polymer projects must consider the full value chain from access to feedstock, conversion to polymer and access to customer. It is not unusual today that customers are located outside of the country in which an intermediate or finished product is produced. Access to a competitive logistics chain is hence essential. It is not unusual for polymer projects to be evaluated across numerous international geographies with logistics being a key component of evaluating and ranking locations before an investment decision is made. Alberta would just be one of them, where the added rail cost to the total logistics cost is a factor; see orange bar in Figure 43. The figure compares the cost for transporting liquids from Alberta with two international chemical hubs.
86 http://www.gevo.com/?casestudy=renewable-pet-will-help-toray-meet-consumer-demand-for-environmentally-friendly-plastic-packaging 87 https://www.natureworksllc.com/About-NatureWorks

BITUMEN BEYOND COMBUSTION – PHASE 2 REPORT
Detailed Summaries
an c:\users\nashcroft\documents\stantec - business development advisor\general business development\bitumen beyond combustion\post po\final report\12th february\bbc phase ii report_14_a.docx 3.81
Figure 43: A Comparison of Transportation Costs88
Industry structure: The polymer landscape is dominated by large reputable players that are typically back and forward integrated. The barrier to entry is high.
Market access: Market reach and access are critical issues for polymer producers. Over the years there have been numerous examples of companies that have intentionally positioned themselves forward via strategic acquisitions. Saudi Basic Industries (SABIC is such an example).
2003: SABIC acquired DSM’s European polyolefins business at US$1.96 billion giving it a European foothold.
2007: SABIC acquires GE Plastics, US$11.6 billion.
Technology access: While the technology readiness level (TRL) for most polymers is high, it does not imply that the technology is available. Technology leadership is often used to create a barrier of entry where the owner has no intention to license. Furthermore, propriety technologies are common across the full value chain (monomepolymeriz ) with patenting rigorously pursued to protect technology and market share. The barrier to new entrants is high.
3.3.2 Insights and Conclusions
Where might opportunities exist? Opportunities may lie in the confluence of several areas, but principally where it is led by technology and feedstock availability.
88 Alberta Industrial Heartland Association (AIHA) Investor Presentation, March 2017, AFPM International Petrochemical Conference

BITUMEN BEYOND COMBUSTION – PHASE 2 REPORT
Detailed Summaries
an c:\users\nashcroft\documents\stantec - business development advisor\general business development\bitumen beyond combustion\post po\final report\12th february\bbc phase ii report_14_a.docx 3.82
Technology: disruptive technologies that can compete with current commercial operations based on older costlier / less environmentally fitting technology. For example:
o Polyisoprene: Kuraray have reportedly developed a two-stage process utilizing isobutylene and formaldehyde89.
o Polystyrene: since 2002, Dow & Snamprogetti have reportedly investigated producing styrene from ethane and benzene as opposed to ethylene and benzene.
Feedstock: along with competitive pricing, access to and availability of feedstock by an established and expanding resource and midstream sector.
Infrastructure: Canada has a well-developed upstream and midstream sector with an excellent distribution network.
Strategic relationships with virtual vertical integration: this aspect will require a strategic and multi-faceted approach between industry and government where it recognizes the opportunity shale gas / associated liquids together with chemical conversion technology presents to Alberta. This proposes intentional identification of companies active in advanced technology where they require access to cost advantaged feedstock. An example of this may be that of producing acrylonitrile from propane (as opposed to propylene) and subsequently carrying this into the CF value and supply chain.
Market trend: as commented to elsewhere in this section, the standard polymers are and can be expected to face increasing environmental pressure. Companies have responded. Examples of environmentally friendlier polymers are PBAT (Polybutyrate adipate terephthalate), PBS (Polybutylene succinate) and PASA (Polyaspartic acid). Further work is required to identify what other opportunities may exit for less environmentally harmful polymers and what paths (technology / market) producers of traditional polymers are examining.
Platform molecules and chemical intermediates: Consideration could be given to the production of polymer precursors [monomers] as opposed to the polymers themselves. This could eliminate one aspect of the barrier to entry. Monomer production (or other chemical intermediates) could provide a step-wise strategy to market entry where their production takes advantage of available feed / price and a strategic-virtual integration with customer(s) in countries that do not have the same resource and cost base as Canada e.g., Japan, S. Korea. An example of such relationship is that between Mitsubishi Rayon (Japan), SGL Composites (Moses Lake, Washington, US), and BMW (Germany) to produce CF from PAN, see Figure 26, page 3.56.
o Examples of chemical intermediates may be:
acrylonitrile (from propane; used in production of acrylonitrile butadiene styrene (ABS) resins),
acrylamide (from acrylonitrile),
89 https://www.ihs.com/products/report-pepreview-2015-04-isoprene-production-via-isoprene-formaldehyde-process.html

BITUMEN BEYOND COMBUSTION – PHASE 2 REPORT
Detailed Summaries
an c:\users\nashcroft\documents\stantec - business development advisor\general business development\bitumen beyond combustion\post po\final report\12th february\bbc phase ii report_14_a.docx 3.83
butadiene (from butene; used in production of acrylonitrile butadiene styrene resins), styrene (from ethane and benzene).
o An extension of the notion of chemical intermediates is the concept of platform molecules. Platform molecules are chemical compounds that have a number of end uses in diverse sectors. Succinic acid and Polypropiolactone (PLL) are two examples, Figure 44.
Figure 44: Examples of Platform Molecules
3.4 VANADIUM FLOW BATTERIES
3.4.1 Overview
A recurring theme for intermittent renewable energy utilities (such as solar or wind), is how to store energy to cover demand when they are not generating energy or when production exceeds demand. From a design, installation, operating and maintenance perspective, flow batteries offer a relatively easy, attractive solution to solve the problem of a fluctuation in demand and supply. As will be shown the power pack of the flow battery, the cell (i.e., the electrochemical conversion device) can be sized as a function of demand for power and independent of the two energy storage reservoirs. The latter are sized as a function of weather conditions or solar radiation. In short, flow batteries appear to provide an elegant solution on numerous fronts that solid state batteries may not able to cover.
(a) SA – Succinic acid and derivatives
(b) PPL – Polypropiolactone
Novomer: https://www.no
vomer.com/

BITUMEN BEYOND COMBUSTION – PHASE 2 REPORT
Detailed Summaries
an c:\users\nashcroft\documents\stantec - business development advisor\general business development\bitumen beyond combustion\post po\final report\12th february\bbc phase ii report_14_a.docx 3.84
An example of a flow battery is shown in Figure 45. In this setup, the respective electrolytes, purple [anolyte] and yellow [catholyte] are circulated between the two reservoirs and electrolytic cell.
Figure 45: Illustration of a flow battery – electrolyte reservoirs and electrochemical cell
3.4.2 How do Flow Batteries Work?
Flow batteries are based on the principle of oxidation and reduction of tailored electrolytic solutions. To generate electricity, species in the anolyte undergo a chemical reaction (called oxidation) releasing electrons to the circuit. Once the anolyte has discharged, the same species in the solution (now in their oxidized state), will be charged via renewable means (solar / wind), i.e., receive electrons back in a process called reduction. The chemistry in the anolyte is balanced by the chemistry in the catholyte.
The cycle described is akin to what happens in rechargeable solid state batteries. Ideally the discharge and charge reactions should be fully reversible. In practise, they are not and overtime there is a progressive decline in battery efficiency and performance. The rate of decline is a function of battery design and chemistry. Achieving a high cycle rate is a key technical performance requirement; how that is achieved comes down to the chemical make-up of the electrolytes (primary and secondary constituents), the electrodes (material of manufacture, surface properties, surface conditioning) and operating conditions amongst others.
Consideration of information in the public domain suggests vanadium redox flow batteries (VRFB) have been and currently are the preferred commercial solution. An example of a VRFB demonstration facility is shown in Figure 46.

BITUMEN BEYOND COMBUSTION – PHASE 2 REPORT
Detailed Summaries
an c:\users\nashcroft\documents\stantec - business development advisor\general business development\bitumen beyond combustion\post po\final report\12th february\bbc phase ii report_14_a.docx 3.85
Figure 46: 60 MWh VRFB Demonstration Facility Built by Sumitomo at Yokohama Works in 2012
Photo Credit: Sumitomo Electric Industries, Ltd.
By all accounts the demonstration at Yokohama was successful. Summitomo are now operating a facility at the Minami-hayakita substation that is 15 times larger than that at Yokohama Works90.
To ensure the redox chemistry over many cycles, Figure 47, the vanadium electrolyte in flow batteries must be electrochemical grade.
Figure 47: VRFB: Redox Chemistry During Charge and Discharge91
Vanadium electrolytes however, are not the only chemical systems to have received attention for flow batteries. The reference92 provides insight into flow battery history, showing numerous systems (see Figure 48 to Figure 50).
90 “The world's largest-scale flow battery system operates in Hokkaido.”. Sumitomo Electric. http://global-sei.com/company/sei-world/2016/02/feature.html. Accessed 7th February 2018. 91 “Understanding the Vanadium Redox Flow Batteries”, Christian Blanc, Laboratoire d’Electronique Industrielle, École Polytechnique Federal de Lausanne, Switzerland. 92 “Flow Batteries – a Historical Perspective”, R.F. Savinell, Case Western Reserve University, US DOE Flow Battery Workshop, March 2012

BITUMEN BEYOND COMBUSTION – PHASE 2 REPORT
Detailed Summaries
an c:\users\nashcroft\documents\stantec - business development advisor\general business development\bitumen beyond combustion\post po\final report\12th february\bbc phase ii report_14_a.docx 3.86
Figure 48: Publications About Redox Flow Batteries93
Figure 49: Regenesys94
Figure 50 demonstrates the development history from the 1950s to current for various systems in the quest to drive chemical cost ($/kWh) down. No doubt, whilst pilot and commercial VRFBs represent a degree of technology maturing, it does not imply development has plateaued.
93 “Advances in Redox Flow Batteries”; slide 21. A. Jossen, First International Renewable Energy Storage Conference, October
2006, Gelsenkirchen, Germany.
94 “Advances in Redox Flow Batteries”; slide 15. A. Jossen, First International Renewable Energy Storage Conference, October 2006, Gelsenkirchen, Germany.

BITUMEN BEYOND COMBUSTION – PHASE 2 REPORT
Detailed Summaries
an c:\users\nashcroft\documents\stantec - business development advisor\general business development\bitumen beyond combustion\post po\final report\12th february\bbc phase ii report_14_a.docx 3.87
Figure 50: The Chemical Cost for Storage for Representative Rechargeable Batteries95
A material will, however, only enjoy market position so long it has meaningful total-life-cycle metrics (i.e., is cost effective, efficient [manufacturing and disposal], safe to handle [non-corrosive], safe to operate, does not carry undue environmental risk and achieves this cost effectively) until another platform emerges. A class of organic molecules that has recently attracted attention are “Quinones”. Like any new technical development, the reason for this lies in the new generation’s ability to improve on prior technology. So far as we are aware, no large scale quinone based flow batteries have been commercialized. The commercial opportunity, however of electricity storage and a global drive to increase the renewable content in energy usage, suggests this is unlikely to remain so for long. Whilst quinones were identified in the BBC Phase 1 as an area for consideration, the results of that evaluation are not reported here as it was established that bitumen is an unsuitable feed for this class of organic molecules and particularly for specific quinones where they are better produced by “synthesis” as opposed to traditional refining.
3.4.3 Market
Technavio96 forecasts the global VRFB market will reach US$ 139 million by 2021 at an approximate 9% CAGR.
According to Bloomberg97, the wider global energy storage market will “double six times” between 2017 and 2030, Figure 51. While robust growth, it starts from a small base of less than 5 gigawatt-hours (GWh) in 2016 and reaches more than 300 GWh; 125 gigawatts (GW) capacity by 2030.
95 “Air Breathing Aqueous Sulfur Flow Battery for Ultralow-Cost Long Duration Electrical Storage”. Zheng Li et al, Dept. of Materials
Science and Engineering, MIT, USA. Joule 1, 306-327, 11th October 2017, Elsevier Inc.
96 http://www.vanadiumcorp.com/news/blog/581-top-3-emerging-trends-impacting-the-global-vanadium-redox-battery-market-from-2017-2021-technavio. 97 “Global market for energy storage poised for rapid growth to 2030, says Bloomberg”, Energize Weekly, 29th November 2017 studyhttps://www.euci.com/global-market-for-energy-storage-poised-for-rapid-growth-to-2030-says-bloomberg-study/

BITUMEN BEYOND COMBUSTION – PHASE 2 REPORT
Detailed Summaries
an c:\users\nashcroft\documents\stantec - business development advisor\general business development\bitumen beyond combustion\post po\final report\12th february\bbc phase ii report_14_a.docx 3.88
Figure 51: Forecast growth in VRFB - Bloomberg
It is uncertain what this means for the global vanadium supply / demand. What we do know currently is that VRFB are enjoying attention and are the leading flow battery technology today, they are likely however to be challenged by alternative flow battery technologies due to the attractiveness of the [renewable] energy storage market. At varying degrees of commercial development, competing technologies to VRFB are based on lithium, quinone, hydrogen bromine and zinc bromine chemistry.
It is thus too early to say which redox platform will achieve market eminence and in turn how the demand for vanadium will be impacted. However, given the indications of tremendous growth in the energy storage sector, the outlook for Vanadium production is generally promising, also considering the fact that global Vanadium markets are relatively small at 80,000 tpa according to the US Geological survey in 2015.
To determine what the demand for Vanadium may be in 2030, forward projections were made by using the stated in Table 29, page 3.92.
3.4.3.1 Electrolyte composition
To develop an approximation of the quantity of vanadium that may be required should VRFB commercialize, it is necessary to understand the electrolyte composition and factors that shape that part of the industry and supply chain. The oxidation states of the vanadium in the anolyte and catholyte in an operating VRFB are as follows:
Anolyte: V 2+, V 3+
Catholyte: V 4+, V 5+
A particular advantage of VRFB is the fact that both anolyte and catholyte have vanadium in common. This lowers the risk of cross-contamination across the membrane that separates the anolyte and catholyte in the electrolytic cell. Less favorable aspects of the technology are the: high cost of the membrane in the electrolytic cell, low solubility of the vanadium ions and ion stability over a wide temperature range. The latter means that the battery needs to operate

BITUMEN BEYOND COMBUSTION – PHASE 2 REPORT
Detailed Summaries
an c:\users\nashcroft\documents\stantec - business development advisor\general business development\bitumen beyond combustion\post po\final report\12th february\bbc phase ii report_14_a.docx 3.89
in a temperature range of 10-35°C98. In contrast, other redox systems, like iron-chrome (Fe-Cr) are reported to have a lower cost99.
Electrolyte purity and hence that of the vanadium source be it oxide or salt, is an important consideration for the successful operation of flow batteries if they are to operate effectively over many charge and discharge cycles. Impurities such as the alkali earth metals100 and silicon are reported to precipitate on the electrodes and separating membrane affecting current efficiencies. Battery and electrolyte producers have imposed increasingly tight specifications on electrolyte suppliers. Table 27 provides a list of the forms vanadium is available in. The basis for selection of an oxide or salt to prepare the electrolyte, has been a balance between cost, purity, solubility and ease of charging the selected vanadium compound to the needed oxidation state to put the battery into operation. Except for vanadium tri- and tetra-chloride, most of the remaining forms listed have been considered as ingredients for preparing VRFB electrolytes. The primary source of vanadium, for the present, remains the vanadium pentoxide (V2O5) or trioxide (V2O3). The low solubility of both in deionized water and acid media when preparing the electrolyte has somewhat discouraged the direct production of high concentration electrolytes from said oxides, alternative dissolution techniques have and are being researched. For example:
Vanadium pentoxide: In 2017, Sandia101 laboratories proposed a route to prepare electrolyte from inexpensive vanadium pentoxide (V2O5, 99.6% purity) by dissolving in concentrated Hydrochloric (12M) and Sulfuric acid. The addition of glycerol is used to reduce the V5+ (VO2 +) to V4+ (VO2+). This gives a base electrolyte from which the required oxidation states V5+ and V3+ / V2+ are formed to give the anolyte and catholyte solutions, respectively.
Vanadyl sulfate: electrolytic grade Vanadyl (IV) sulfate (VOSO4) is a suitable ingredient for both the anolyte and catholyte solutions. During battery preparation, the V4+ ion is charged to the appropriate oxidation state102 through a sequence of steps (see Figure 52). Depending on the technology / electrolyte vendor other electrolyte ingredients may include de-ionized water, hydrochloric acid, sulfuric acid, oxidation additives (e.g., ethanol, formic acid, glycerol, oxalic acid). Vanadyl sulfate is produced by reducing vanadium pentoxide (V2O5) with sulfur dioxide (SO2).
98 Vanadyl sulfate (VOSO4) can precipitate at low temperatures and vanadium pentoxide (V2O5) at high temperatures. 99 “Advanced Redox Flow Batteries for Stationary Electrical Energy Storage”, L. Li et al. Pacific Northwest National Laboratory, Report no. PNNL-21174, PDF page 7-8. US DOE Contract no. DE-AC05-76RL01830. 100 Barium, beryllium, calcium magnesium, radium, strontium. 101 “Vanadium Flow Battery Electrolyte Synthesis via Chemical Reduction of V2O5 in Aqueous HCl and H2SO4”, Leo J. Small et all. Sandia Report. SAND2017-0875, January 2017, PDF page 7-8. 102 “Vanadium Redox-Flow-Battery (VRFB) System Electrolyte Preparation with Reducing Agents: W.N. Li et al, United Technologies Research Center (UTRC) east Hartford, CT, 06108, USA. Abstract #491, 223rd ECS Meeting, The Electrochemical Society.

BITUMEN BEYOND COMBUSTION – PHASE 2 REPORT
Detailed Summaries
an c:\users\nashcroft\documents\stantec - business development advisor\general business development\bitumen beyond combustion\post po\final report\12th february\bbc phase ii report_14_a.docx 3.90
Figure 52: VRFB Electrolyte Preparation Sequence and Method - Vanadium Source: Vanadyl Sulfate
Vanadium trichloride: row 5 of Table 27. Carbochlorination was successfully used to produce electrolytic (>99% purity) grade vanadium trichloride (VOCl3) from metallurgical (98.5%) grade vanadium pentoxide (V2O5).
Table 27: List of Vanadium Oxides and Derivative Chemicals
No Name Production State Formula Mr (g / mol)
1Vanadium (V) PentoxideDivanadium Pentoxide
Produced from vanadium ore or a rich residue which is treated with sodium carbonate to produce sodium metavanadate. Acidfied with sulphuric acid, the latter yields "red cake" .
Melted at 690 °C the cake produces crude V2O5.
Yellow solid V2O5 181.88
2 Vanadium (III) Trioxide Reduction of V2O5 with H2 or carbon monoxide (CO) Black powder V2O3 149.88
No Name Production State Formula Mr (g / mol)
3
Vanadium(IV) oxide sulfateVanadium(IV) sulfate
Vanadium(IV) oxysulfateVanadyl Sulfate
Reduction of vanadium pentoxide (V2O5) with sulfur dioxide (SO2).
V2O5 + 7 H2O + SO2 + H2SO4 2 [V(O)(H2O)4]SO4
Blue solid VOSO4 253.07
4Vanadium(IV) Oxide Sulphate
PentahydrateHydrate of Vanadium(IV) oxide sulfate Blue solid VOSO4. 5H2O 253.07
5 Vanadium(V) Oxytricloride
Carbochlorination (400-600oC) of metallurgical grade V2O5 or V2O3 followed by distillation.
3 Cl2 + V2O5 2 VOCl3 + 1.5 O2
3 Cl2 + V2O3 2 VOCl3 + 0.5 O2
Yellow liquid VOCl3 173.30
6Vanadium(III) sulfateVanadium trisulfate
Divanadium trisulfate
Prepared by treating V2O5 in sulfuric acid with elemental sulfur.
V2O5 + S + 3 H2SO4 V2(SO4)3 + SO2 + 3 H2OYellow powder V2(SO4)3 390.07
7 Vanadium (III) trichlorideProduced by heating VCl4 (160–170°C) under flowing inert gas
to remove formed chlorine.Purple VCl3 157.3
8 Vanadium (IVI) tetrachloride Made by chlorination of vanadium metal. Red liquid VCl4 192.75

BITUMEN BEYOND COMBUSTION – PHASE 2 REPORT
Detailed Summaries
an c:\users\nashcroft\documents\stantec - business development advisor\general business development\bitumen beyond combustion\post po\final report\12th february\bbc phase ii report_14_a.docx 3.91
As stated previously103, the market for flow batteries is expected to double six times by 2030. Based on available information the demand for vanadium has been determined in Table 28 and Table 29.
By way of example, Table 28 considers the vanadium and electrolyte requirement at China’s Dalian VRFB facility. The impact of an increase in energy density (highlighted cells – row 4) from 25 Wh/L to 42 Wh/L (Watt hours per liter) on electrolyte volume and vanadium are shown in rows 5 and 14 respectively.
Table 28: Example of Vanadium Requirement in a VRFB
Table 29 considers the demand for vanadium and electrolyte per stated assumptions. The global installed battery capacity in 2030 is expected to be 305 GWh. Should flow batteries secure 50% of this market and VRFB 75% of the latter, this equates to 114 GWh of installed capacity. The cumulative demand for vanadium from 2017 to 2030 is 103 "Global Storage Market to Double Six Times by 2030", 20th November 2017. https://about.bnef.com/blog/global-storage-market-double-six-times-2030/
NoVanadium Redox Flow Battery
(VRFB) parameters(an example)
Units Value Ref. Value Ref.
1 MW 200 2002 MWh 800 8003 Wh 800,000,000 800,000,0004 Energy density Wh / liter 25 (2) 42 (5)5 Electrolyte requirement liters 32,000,000 19,047,619
No Description Units Value Value6 Electrolyte [ V ] M (moles / dm3) 1.6 (3) 1.67 g / mol 50.94 50.948 n (mols) 1.60 1.609 Electrolyte [ V ] grams / dm3 81.51 81.51
1011 Electrolyte requirement liters 32,000,000 (4) 19,047,61912 grams / dm3 81.51 81.5113 grams 2,608,204,800 1,552,502,85714 kg 2,608,205 (4) 1,552,503
15 Capacity assumption Wh 800,000,000 800,000,00016 kg 2,608,205 1,552,50317 grams / Whr 3.3 1.918 kg / kWh 3.3 1.919 ton / MWh 3.3 1.9
(1) Rongke Power, Dalian, China. https://electrek.co/2017/12/21/worlds-largest-battery-200mw-800mwh-vanadium-flow-battery-rongke-power/. Accessed 15th Jan 2018.
(2) Advanced Redox Flow Batteries for Stationary Electrical Energy Storage, L. Li et al. Pacific Northwest National Laboratory, Report no. PNNL-21174, PDF page 7. US DOE Contract no. DE-AC05-76RL01830.
(3) GfE Gesellschaft für Elektrometallurgie, Germany. http://www.gfe.com/en/product-range/vanadium-chemicals/applications/energy-storage/
(5) Advanced Redox Flow Batteries for Stationary Electrical Energy Storage, L. Li et al. Pacific Northwest National Laboratory, Report no. PNNL-21174, PDF page 8. US DOE Contract no. DE-AC05-76RL01830.
References
(1)
Vanadium
Capacity assumption
(4) Quantities not confirmed per example.
Vanadium requirement
Vanadium
2012: Pacific Northwest National
Laboratory announce a 70% improvement in
current density.
Practical value (2011): 32 Wh / l.

BITUMEN BEYOND COMBUSTION – PHASE 2 REPORT
Detailed Summaries
an c:\users\nashcroft\documents\stantec - business development advisor\general business development\bitumen beyond combustion\post po\final report\12th february\bbc phase ii report_14_a.docx 3.92
projected to be 220k ton to 370k ton at an energy density of 42 Wh/L and 25 Wh/L, respectively, row 11 and 17. It is expected that the actual numbers will differ from those suggested for the following reasons.
The operating life104 of a VRFB is expected to be in the order of 10 years and possibly 20 years105.
Once batteries have reached the end of their operating life, it can be expected that the vanadium will be recovered as means to manage total-cost and to reduce the environmental footprint106. The net impact of this will be to create a closed supply loop limiting the need for fresh vanadium into the market and thus a tempering of the demand curve.
Electrolyte ownership: the reference indicates the industry is considering electrolyte leasing107.
Table 29: Forecast Demand for Vanadium per Assumptions and for a 75% Market Share
of VRFB
104 “Preparation and Electrochemical Properties of High Purity Mixed-Acid Electrolytes for High Energy Density Vanadium Redox Flow Battery”, PDF page 5. Chuanlin Fan et al. State Key Laboratory of Multiphase Complex Systems, Inst. Of Process Eng., Chinese Academy of Sciences, Beijing, PRC. International J. Electrochem. Sci. 12 (2017) 7728 – 7738. 105 “It’s Big and Long-Lived, and It Won’t Catch Fire: The Vanadium Redox-Flow Battery”, Z. Gary Zang 26th Oct. 2017. https://spectrum.ieee.org/green-tech/fuel-cells/its-big-and-longlived-and-it-wont-catch-fire-the-vanadium-redoxflow-battery 106 “Imergy Uses Recycled Vanadium to Cut Materials Costs for Flow Batteries, A look at the company’s secret slag-to-energy-storage vanadium recipe”, J. St. John, 4th Aug. 2014. https://www.greentechmedia.com/articles/read/imergys-slag-to-energy-storage-vanadium-recipe#gs.U6AS7_A 107 ‘Developing MW-scale Chloride-containing All Vanadium Redox Flow Battery System”, PDF page 13. L. Li, Chief technical Officer, 23rd Sept. 2015, UniEnergy Technologies.
(A) (B)
No Description Units Value Value Ref.
1 Market assumptions -2 GWh 305 3053 GW 125 125
4 % Flow Battery capacity % 50% 50%
5Flow Battery installed capacity
(assumption)GWh 153 153
6 % installed VRFB % 75% 75%
7VRFB installed capacity
(assumption)GWh 114 114
8% VRFB of total installed
battery capacity% 37.5% 37.5%
9 GWh 114 114
10 Wh 114,375,000,000 114,375,000,00011 Energy density Wh / liter 25 42
12 Electrolyte volume at designated concenration
liter 4,575,000,000 2,723,214,286
13 Electrolyte [ V ] M (moles / dm3) 1.6 1.6
14 Electrolyte [ V ] grams / dm3 81.51 81.51
15Electrolyte volume at
designated concenrationliter 4,575,000,000 2,723,214,286
16 grams 372,891,780,000 221,959,392,857
17 tons 372,892 221,959
18 Ratio tons V / GWh 3,260 1,941
(1)Global installed battery
capacity (2030)
References
(1) "Global Storage Market to Double Six Times by 2030", 20th November, 2017. https://about.bnef.com/blog/global-storage-market-double-six-times-2030/
VRFB installed capacity (assumption)
Vanadium requirement(per assumptions)
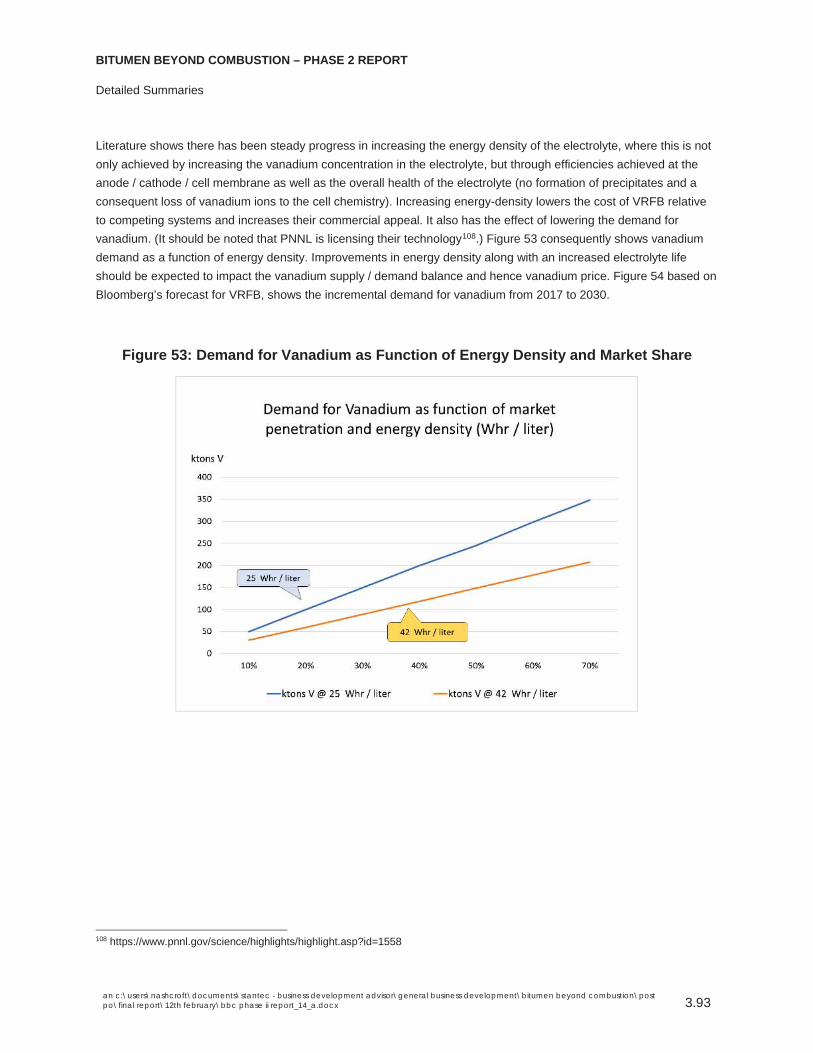
BITUMEN BEYOND COMBUSTION – PHASE 2 REPORT
Detailed Summaries
an c:\users\nashcroft\documents\stantec - business development advisor\general business development\bitumen beyond combustion\post po\final report\12th february\bbc phase ii report_14_a.docx 3.93
Literature shows there has been steady progress in increasing the energy density of the electrolyte, where this is not only achieved by increasing the vanadium concentration in the electrolyte, but through efficiencies achieved at the anode / cathode / cell membrane as well as the overall health of the electrolyte (no formation of precipitates and a consequent loss of vanadium ions to the cell chemistry). Increasing energy-density lowers the cost of VRFB relative to competing systems and increases their commercial appeal. It also has the effect of lowering the demand for vanadium. (It should be noted that PNNL is licensing their technology108.) Figure 53 consequently shows vanadium demand as a function of energy density. Improvements in energy density along with an increased electrolyte life should be expected to impact the vanadium supply / demand balance and hence vanadium price. Figure 54 based on Bloomberg’s forecast for VRFB, shows the incremental demand for vanadium from 2017 to 2030.
Figure 53: Demand for Vanadium as Function of Energy Density and Market Share
108 https://www.pnnl.gov/science/highlights/highlight.asp?id=1558

BITUMEN BEYOND COMBUSTION – PHASE 2 REPORT
Detailed Summaries
an c:\users\nashcroft\documents\stantec - business development advisor\general business development\bitumen beyond combustion\post po\final report\12th february\bbc phase ii report_14_a.docx 3.94
Figure 54: Incremental and Forecast Demand for Vanadium for VRFB - Bloomberg
3.4.4 Production
The extraction of vanadium from mined ore bodies is an established process. Alternative vanadium sources are soot and fly ash residue generated as byproduct from the combustion of heavy oil and other fuel sources for power generation. Alberta’s oil sands contain approximately 200 ppmw and 60 ppmw of vanadium and nickel, respectively. Due to the similarity between Canadian and Venezuelan oils, the vanadium in Alberta’s reserves can be expected to be present in the form of porphyrins, Figure 55.

BITUMEN BEYOND COMBUSTION – PHASE 2 REPORT
Detailed Summaries
an c:\users\nashcroft\documents\stantec - business development advisor\general business development\bitumen beyond combustion\post po\final report\12th february\bbc phase ii report_14_a.docx 3.95
Figure 55: Oxovanadium (IV) Complexes of Alkyl Porphyrins109. Crude source: Orinoco Basin, Venezuela.
Due to vanadium’s low concentration in bitumen, direct recovery is an unlikely option. Having a concentrated feedstock is a key consideration, which has been (at least initially and unintentionally) achieved by combustion of fossil fuels and subsequently produced fly ash becoming a viable source. Depending on the nature of the feed (presence of other metals, etc.) and combustion conditions, combustion / pyrolysis can have undesirable side effects that impact further downstream processing to isolate and purify the vanadium. The recovery of vanadium from Alberta fly ash had previously received attention110.
Vanadium metal and the oxides are typically produced by established mining, smelting and downstream refining. A second and important source of vanadium is from the recycling of spent chemical catalysts and the processing of petroleum ash residue from the combustion of coke or heating oils. Both routes represent an established industry.
While the forecast in VRFB is good news for an initiative that considers extracting vanadium from Alberta bitumen, the scale of the opportunity can be expected to be tempered by the fact that a forecast increase in demand will likely encourage existing producers to expand and new players to enter the supply side of the market.
3.4.5 Vanadium Sources with Mass Balance
3.4.5.1 Vanadium Recovery
Vanadium is recovered commercially from primary and secondary sources where these are:
109 “New Vanadium Compounds in Venezuela Heavy Crude Oil Detected by Positive-ion Electrospray Ionization Fourier Transform Ion Cyclotron Resonance Mass Spectrometry”, Xu Zhao, March 2014. https://www.nature.com/articles/srep05373.
110 “Extraction of Vanadium from Athabasca Tar Sands Fly Ash”; C.O. Gomez-Bueneo et al Metallurgical Transaction B, American
Chemical Society for Metals and the Metallurgical Society of AIME, Volume 12B, June 1981-341.

BITUMEN BEYOND COMBUSTION – PHASE 2 REPORT
Detailed Summaries
an c:\users\nashcroft\documents\stantec - business development advisor\general business development\bitumen beyond combustion\post po\final report\12th february\bbc phase ii report_14_a.docx 3.96
Ore bodies
fly ash, spent chemical catalysts and waste metal.
The total supply chain covering various process steps to effect recovery is made up of a combination of technologies classified as either pyro- or hydro-metallurgical, as shown in Figure 56. The former refers to process steps in which a high temperature is used to condition the metals present in a mined ore, fly ash, or spent catalyst for recovery using rotary kilns and furnaces or not as the case may be. Hydrometallurgy in turn, refers to the use of aqueous chemistry (water, acid or base) to dissolve, extract / separate, and purify targeted metals. Hydrometallurgy can be extended to include the use of solvents and specific complexing agents and oxidation additives amongst others.
Figure 56: Paths for the Treatment of Vanadium Raw Materials111
Sections 3.4.5.2 and 3.4.5.3 limit themselves to a description of the prevailing commercial paths to recovering vanadium. The sections do not provide a comprehensive technology landscape (historical / current / future) of
111 F. Habashi, 1998, Handbook of extractive metallurgy. Wiley-VCH, Germany.

BITUMEN BEYOND COMBUSTION – PHASE 2 REPORT
Detailed Summaries
an c:\users\nashcroft\documents\stantec - business development advisor\general business development\bitumen beyond combustion\post po\final report\12th february\bbc phase ii report_14_a.docx 3.97
research done in the laboratory, at scale in a pilot or demonstration facility. The reader is referred to the provided reference112 for a literature overview of existing technology and experimental work on leaching and solvent extraction.
3.4.5.2 Primary Recovery of Vanadium
Geologically speaking, vanadium is found in deposits of phosphate rock, titaniferous magnetite, uraniferous sandstone, siltstone, and in carbonaceous deposits (coal, crude oil, shale oil, oil sands etc.) Vanadium is typically not the primary objective when recovered from an ore body, it is recovered as a byproduct. Approximately 88% of the world’s vanadium is recovered from titanomagnetite113. The vanadium content of a typical ore is in the order of 1.2% (weight) V2O5. There are two processes for the recovery of vanadium from ore:
Vanadium and steel co-production smelting process: Figure 57 shows the general process scheme at the South African Evraz Highveld Steel and Vanadium facility114. The primary product is steel, vanadium is removed in the slag via the “shaking ladle” in which the metal is oxidized to the oxide, Figure 58. The V2O3
content of produced slag is in the region of 25% (Figure 58, Equation 3).
Figure 57: Overview of the General Layout of the Evraz Highveld Steel and Vanadium Facility
In the case of the Evraz group115 it appears the crushed slag from South Africa and other global operations are shipped to their Hot Springs, Arkansas, US facility for further processing into specification vanadium oxides, sulfates and specialties116.
112 “Vanadium Leaching and Solvent Extraction”, M. Tavakolikhaledi, University of British Columbia, Vancouver, 2014. 113 “A comparative study of vanadium recovery from titaniferous magnetite using salt, sulphate and soda ash roast leach process”, S. Nkosi eta l. Mintek. South Africa, March 2017 114 “The History and Development of the pyrometallurgical processes at Evrax Highveld Steel and Vanadium”, W. S. Steinberg, Evraz Highveld Steel and vanadium, South Africa. Southern African Pyrometallurgy 2011. 115 https://vanadium.evraz.com/products/ 116 https://vanadium.evraz.com/products/chemicals/
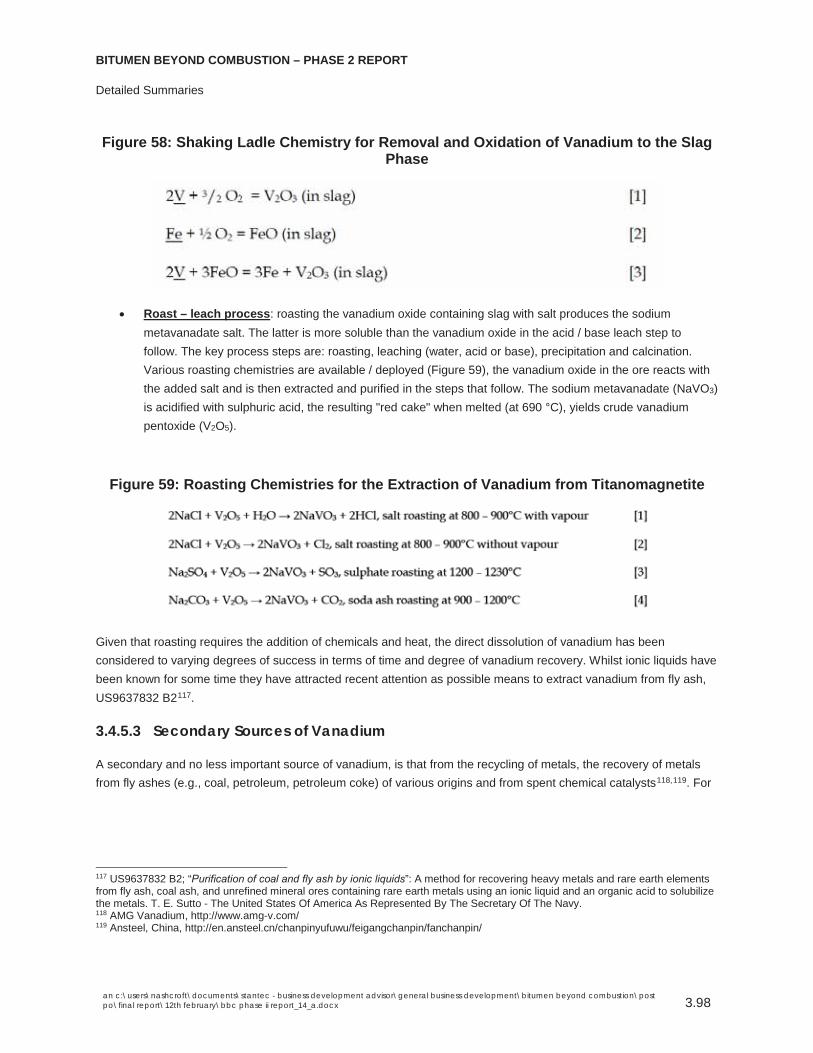
BITUMEN BEYOND COMBUSTION – PHASE 2 REPORT
Detailed Summaries
an c:\users\nashcroft\documents\stantec - business development advisor\general business development\bitumen beyond combustion\post po\final report\12th february\bbc phase ii report_14_a.docx 3.98
Figure 58: Shaking Ladle Chemistry for Removal and Oxidation of Vanadium to the Slag Phase
Roast – leach process: roasting the vanadium oxide containing slag with salt produces the sodium metavanadate salt. The latter is more soluble than the vanadium oxide in the acid / base leach step to follow. The key process steps are: roasting, leaching (water, acid or base), precipitation and calcination. Various roasting chemistries are available / deployed (Figure 59), the vanadium oxide in the ore reacts with the added salt and is then extracted and purified in the steps that follow. The sodium metavanadate (NaVO3) is acidified with sulphuric acid, the resulting "red cake" when melted (at 690 °C), yields crude vanadium pentoxide (V2O5).
Figure 59: Roasting Chemistries for the Extraction of Vanadium from Titanomagnetite
Given that roasting requires the addition of chemicals and heat, the direct dissolution of vanadium has been considered to varying degrees of success in terms of time and degree of vanadium recovery. Whilst ionic liquids have been known for some time they have attracted recent attention as possible means to extract vanadium from fly ash, US9637832 B2117.
3.4.5.3 Secondary Sources of Vanadium
A secondary and no less important source of vanadium, is that from the recycling of metals, the recovery of metals from fly ashes (e.g., coal, petroleum, petroleum coke) of various origins and from spent chemical catalysts118,119. For
117 US9637832 B2; “Purification of coal and fly ash by ionic liquids”: A method for recovering heavy metals and rare earth elements from fly ash, coal ash, and unrefined mineral ores containing rare earth metals using an ionic liquid and an organic acid to solubilize the metals. T. E. Sutto - The United States Of America As Represented By The Secretary Of The Navy. 118 AMG Vanadium, http://www.amg-v.com/ 119 Ansteel, China, http://en.ansteel.cn/chanpinyufuwu/feigangchanpin/fanchanpin/

BITUMEN BEYOND COMBUSTION – PHASE 2 REPORT
Detailed Summaries
an c:\users\nashcroft\documents\stantec - business development advisor\general business development\bitumen beyond combustion\post po\final report\12th february\bbc phase ii report_14_a.docx 3.99
example, MEAB120 of Sweden developed the SOTEX121 process for the recovery of vanadium and nickel from fly ash from Orimulsion122 fired power stations, Figure 60.
.
Figure 60: SOTEX Process: Extraction of Vanadium and Nickel from Soot and Fly Ash
Figure 61: Material Flow to a SOTEX Unit
120 http://www.meab-mx.se/ 121 http://www.meab-mx.se/pdf/The_Sotex_process.pdf 122 Orimulsion is a fuel derived from bitumen that occurs naturally in large reserves in the 700 km long Orinoco oil belt in Venezuela. It is extracted, processed and distributed by Bitumenes Orinoco SA (Bitor). Source: researchbriefings.files.parliament.uk/documents/POST-PN-84/POST-PN-84.pdf

BITUMEN BEYOND COMBUSTION – PHASE 2 REPORT
Detailed Summaries
an c:\users\nashcroft\documents\stantec - business development advisor\general business development\bitumen beyond combustion\post po\final report\12th february\bbc phase ii report_14_a.docx 3.100
Irrespective of the process used to extract the vanadium, the vanadium content of the fly ash along with the prevailing market price for the metal are key considerations. In 1981, Gomez-Bueno et al123 evaluated the roast-leach process for recovering vanadium from Great Canadian Oil Sands (GCOS 124) Athabasca fly ash, Table 30. The process evaluated, used sodium chloride (NaCl) and water vapor as reagents followed by atmospheric leaching with dilute sodium hydroxide to affect an 85% recovery of crude vanadium oxide from a fully oxidized fly ash.
Table 30: Chemical Analysis of Various Fly Ashes (Units: wt %)
The theoretical volume of vanadium available at different bitumen production rates is shown in Table 31.
.
Table 31: Theoretical Vanadium Available at Different Bitumen Production Rates
To arrive at an approximate value of how much vanadium might be recovered from Albertan bitumen, the following key assumptions are made.
100,000 bpd of bitumen with an average asphaltene content of 17.5%125 where it is assumed that all the vanadium in the bitumen reports to the asphaltene fraction where when combusted it yields 2% to 3.6% fly ash (see Table 32).
Assuming an 90% recovery efficiency for vanadium.
123 “Extraction of Vanadium from Athabasca Tar Sands Fly Ash”; C.O. Gomez-Bueno et al, Dept. of Chemical Eng. U. Waterloo, ON, Canada. Metallurgical Transactions B, Volume 12B, June 1981, page 341. 124 Predecessor company to Suncor Energy. 125 Source: BBC_Project__Phase_1 - report_0416, page 13
No Origin V2O5 NiO Fe2O3 Al2O3 SiO2 S C1 Amuay (Venezuela) 16.24 0.89 8.58 - - - -2 Canadina Petrofina 13.9 1.03 0.67 3.77 6.4 2.75 543 Long Island Lighting Co., USA 35-40 3 - - - 10-Jun 14 Long Island Lighting Co., USA 8-12 - - - - - -5 Great Canadian Oil Sands 2.49 0.84 5.5 14.6 24.8 2.16 39.86 Great Canadian Oil Sands 3.58 1.74 6.66 15.63 33.1 2.48 267 Flue Dust from Venezuelan Oil 35.28 6.01 4.8 0.5 2.5 29.94 2.84
Reference: “Extraction of Vanadium from Athabasca Tar Sands Fly Ash”; C.O. Gomez-Bueno et al, Dept. of Chemical Eng. U. Waterloo, ON, Canada. Metallurgical Transactions B, Volume 12B, June 1981, page 341.
No.Bitumen
(bpd )Bitumen
(bbl / year)Conversion (bbl to tons)
Bitumen(ton / year)
Vanadium(ppm-w)
Vanadium content (tons) in bitumen
Vanadium content (tons / day) in bitumen
Recovery(assumption)
Vanadium recovered (tons / year)
Vanadium(tons / day)
1 100,000 36,500,000 6.30 5,793,651 200 1,159 3.17 90% 1,043 2.86
2 500,000 182,500,000 6.30 28,968,254 200 5,794 15.87 90% 5,214 14.29
3 1,000,000 365,000,000 6.30 57,936,508 200 11,587 31.75 90% 10,429 28.57
4 1,500,000 547,500,000 6.30 86,904,762 200 17,381 47.62 90% 15,643 42.86

BITUMEN BEYOND COMBUSTION – PHASE 2 REPORT
Detailed Summaries
an c:\users\nashcroft\documents\stantec - business development advisor\general business development\bitumen beyond combustion\post po\final report\12th february\bbc phase ii report_14_a.docx 3.101
The theoretical quantity of vanadium available is thus in the range of 1-3 tpd; 360-1,100 tpa, (see Table 32).
Table 32: Theoretical Recovery of Vanadium from Fly Ash Post Combustion of 100k bpd of Bitumen
3.4.5.4 Vanadium recovery from Bitumen
In mineable Oil Sands, Vanadium is typically concentrated in two streams:
For extraction with naphtha based froth treatment: Vanadium is concentrated in the coke that is created in the delayed coking process. The coke is shipped from Fort McMurray to Asia for furnace fuel in the
No Decsription Units Value1 100,000 bpd 100,0002 (bbl / year) 36,500,0003 Conversion factor 6.304 Bitumen tons / year 5,793,651
5 ppm - w 2006 no. 0.00027 tons / year 1,1598 tons / day 3.17
9 Recovery assumption % 90%10 tons / year 1,04311 tons / day 2.86
No Description Units Value Value12 Bitumen tons / year 5,793,65113 Asphaltene content % 17.5%14 Asphaltene tons / year 1,013,889
15Fly ash yield(assumption)
% 2.0% 3.6%
16 Fly ash (yield) tons / year 20,278 36,500
17 % 2.0% 2.0%18 % 3.6% 3.6%
19 tons / year 406 73020 tons / year 730 1,314
21 Recovery assumption % 90% 90%
22 tons / year 365 65723 tons / year 657 1,183
Vanadium
Vanadium
Vanadium recovered(theoretical)
Vanadium
Vanadium content(range)

BITUMEN BEYOND COMBUSTION – PHASE 2 REPORT
Detailed Summaries
an c:\users\nashcroft\documents\stantec - business development advisor\general business development\bitumen beyond combustion\post po\final report\12th february\bbc phase ii report_14_a.docx 3.102
production of steel. The resulting ash as a byproduct of combustion, would provide a rich source of Vanadium.
For extraction with paraffinic based froth treatment: Vanadium is associated with the partially precipitated asphaltenes which are directed to the tailings pond along with water and minerals (clay and sand) for disposal. A tailings stream is likely impractical (for recovery of Vanadium) and will not be cost effective, primarily as the volume of the flow is substantial (3,000 t/h minimum) and where steady flow is critical to the upstream process operations. At Long Lake (an InSitu oil sands facility), Nexen precipitate and gasify an asphaltene fraction obtained by treating bitumen froth with pentane. The produced ash is a potential source of Vanadium. Figure 62 shows how Vanadium is concentrated following the gasification of the asphaltene fraction following precipitation from bitumen.
Figure 62: Vanadium in Fly Ash (Gasified Asphaltenes)
Extracting Vanadium from straight bitumen is not practical, considering the small quantity (200 ppmw per bbl of bitumen) that would need to be extracted.
3.4.6 Business Case
Roughly 85% of the world’s vanadium is produced by China, Russia, and South Africa. Annual production is presently in the order of 80,000 tons per annum126. Vanadium is primarily used in the steel industry, VRFB would provide the industry with a new and exciting market as suggested by Figure 51, page 3.88. At either of the energy densities assumed, if the market accepts VRFB the net impact will be to create notable demand. A 20%-50% market share would see the demand for vanadium grow by 50%-100%, i.e., a growth of 40,000-80,000 tons. On an incremental basis, an approximate additional 3,800 tons and 55,000 tons of vanadium would be required in years 2020 and 2030, respectively.
126 US Geological Survey Vanadium Report, 2017. https://minerals.usgs.gov/minerals/pubs/commodity/vanadium/mcs-2017-vanad.pdf

BITUMEN BEYOND COMBUSTION – PHASE 2 REPORT
Detailed Summaries
an c:\users\nashcroft\documents\stantec - business development advisor\general business development\bitumen beyond combustion\post po\final report\12th february\bbc phase ii report_14_a.docx 3.103
Vanadium prices have fluctuated significantly ranging from a low US$5,000 (1993) to a high of US$64,000/ton (2005). The price of vanadium averaged US$12,920/ton in 2011-2015, Table 33, row 12. At a global production level of 76,000 tons (2016) this gives a turnover of US$981 million or US$1.1 billion at US$15,000/ton.
Table 33: Vanadium Price and Production, US Geological Survey, 2017
When reflecting on Table 32, if we assume that 1 million tons of asphaltene (row 14) from 5.8 million tons of bitumen (row 12) is combusted to yield a 20,000 to 36,500 tons of fly ash per annum (row 16) and an average of 1,000 tons (2.9 tpd) (row 22 and 23) of crude vanadium is recovered, then the expected turnover is in the region of C$17 to C$20 million per annum, as shown in Table 34, row 4.
Table 34: Turnover on Vanadium Recovered
Value Ref.US$ / lb (V2O5)
1 2011 6.762 2012 6.493 2013 6.044 2014 5.615 2015 4.406 Average (2011 - 2015) 5.86
Convert lb to kg 0.453592
ValueUS$ / kg (V2O5)
7 2011 14.908 2012 14.319 2013 13.3210 2014 12.3711 2015 9.7012 Average (2011 - 2015) 12.92
No Description Units Value Ref. Value13 Vanadium production (global) - 2017 tons 76,000 76,000
14Vanadium selling price average (2011 - 2015)
US$ / ton 12,919 15,000
15 Global Turnover - 2017 US$ 981,900,000 1,140,000,000
References(1) (a) US Geological Survey Vanadium Report, 2017.
https://minerals.usgs.gov/minerals/pubs/commodity/vanadium/mcs-2017-vanad.pdf
(b) http://www.vanadiumprice.com/
(1)
No Year
No Year
(1)
No Description Units Value Value1 Vanadium recovered (assumption) tons per annum 1,000 1,0002 Selling price (assumption) US$ / ton 12,919 15,0003 US$ 12,919,099 15,000,0004 C$ 16,794,829 19,500,000
CAD : USD 1.3
Turnover

BITUMEN BEYOND COMBUSTION – PHASE 2 REPORT
Detailed Summaries
an c:\users\nashcroft\documents\stantec - business development advisor\general business development\bitumen beyond combustion\post po\final report\12th february\bbc phase ii report_14_a.docx 3.104
A business case to extract vanadium from bitumen derived fly ash will need to be benchmarked against prevailing technology, the traditional iron-vanadium mining industry, its supply chain and industry wide developments as companies look to take advantage of forecast demand growth. For example, Prism Diversified127 is contemplating a mine north of Grande Prairie with a reported ore body of 557 and 1.2 million tons of iron (~33%) and vanadium (21-24% V2O5), respectively.
3.4.7 Social Acceptance
Communities are increasingly demanding industry to act in a socially responsible manner, not only to meet existing environmental regulatory requirements, but often to exceed these where evidence suggests the need.
There appears to be little resistance to the concept of large scale energy storage involving Vanadium electrolyte. However, as scale increased and inevitable environmental issues, leaks, etc., will happen, more scrutiny will happen.
Although there are different types of electrolyte used in flow-batteries, all will be expected to be hazardous to varying degrees. Storage and handling of hazardous liquids is an everyday common activity. Metals toxicity is well known and understood, however growth of Vanadium usage may represent increasing challenges.
In due course, less hazardous and more cost-effective electrolytes will be developed.
3.4.8 Environmental Net Effects
Environmental net effects exist at two levels: (i) the extraction vanadium from bitumen and (ii) the storage of energy in conjunction with variable renewable energy sources.
Post gasification, extracting Vanadium from fly ash by removal of vanadium using leaching and either solvent extraction or selective precipitation is not considered a high GHG process. Effects on land, water, and air quality are minimal.
3.4.9 Manufacturing Locations
When considering the nature of the feedstock the inclination would be for the primary vanadium concentrating step to be located close to the feedstock. This is certainly the case in mining and smelting operations for primary recovery.
In the case of secondary recovery, once the vanadium is concentrated in the form of a slag, fly ash or similar form, there is evidence suggesting the solid is transported to another locale for further processing (pyro- and hydro- metallurgical) and purification. Vertically integrated Evraz serves as an example of such arrangement. This is supported by the US Geologic Survey (USGS) 2016 report that shows the US imports a variety of vanadium containing streams (ferrovanadium, [fly] ash and residues, scrap) for refining and that the US suspended128 mined vanadium activity in 2013.
Without further work, it is not apparent where US plants processing secondary sourced vanadium are located. What the evidence presently suggests is that whilst the location needs to be cognizant of raw material availability, utilities, access to logistics, etc., that the location of secondary activities is independent of the point of primary production. In a
127 https://www.prismdiversified.com/. Previously known as Ironstone Resources. 128 Whether permanently or temporarily has not been established.

BITUMEN BEYOND COMBUSTION – PHASE 2 REPORT
Detailed Summaries
an c:\users\nashcroft\documents\stantec - business development advisor\general business development\bitumen beyond combustion\post po\final report\12th february\bbc phase ii report_14_a.docx 3.105
Canadian context of fly ash and coke containing vanadium, further work might consider if there are any existing metallurgical operations in Canada that would benefit from added volume where they might feature as part of a larger process scheme.
As quantities of fly ash are relatively small, their shipment for further processing would appear to be favourable.
3.4.10 Technology Readiness Levels
The mining and downstream processing of vanadium containing ore bodies is a well-established and commercially proven technology. Companies / countries active in primary recover are those with vanadium reserves like Australia, Brazil, China, Russia and South Africa. According to the USGS (2016) vanadium was last mined in the US in 2013. The same report states that the US imports ferro vanadium (FeV), recycles spent chemical catalyst and processes petroleum fly ash for its vanadium needs.
In the case being considered, the vanadium would not be directly recovered from bitumen but from a concentrated stream, like coke or fly ash. While vanadium can in principle be extracted from said feeds, it cannot be said that there will be no challenges. What these specifically are cannot be determined without further study. It is pertinent to note that Gomez (1981)129 report that whilst vanadium can be recovered from petroleum fly ash, it could not be recovered from GCOS fly ash without process changes due to the higher alumina and silica content. This is dated work and further investigation is required to determine if this would still be the case.
Figure 63: TRL for Vanadium Extraction
Extracting Vanadium from fly ash is in operation today130, however extracting from bitumen is not commercial and would rate a TRL between 2 and 4 from high-level.
3.4.11 Insights and Conclusions
This is not the first time that the extraction of vanadium from a carbon originating source has been considered in Canada. From the reference131 we know that in 1965 Bechtel built a plant for Canadian Petrofina at Pointe-aux-Trembles, Quebec, to recover vanadium from petroleum fly ash (not Athabasca bitumen derived fly ash). While the
129 Extraction of Vanadium from Athabasca Tar Sands Fly Ash”; C.O. Gomez-Bueneo et al 130 Metal & Catalyst Resources, Houston, USA. http://www.metalandcatalyst.com/metals/vanadium/ 131 Gomez (1981).

BITUMEN BEYOND COMBUSTION – PHASE 2 REPORT
Detailed Summaries
an c:\users\nashcroft\documents\stantec - business development advisor\general business development\bitumen beyond combustion\post po\final report\12th february\bbc phase ii report_14_a.docx 3.106
development of VRFB may present future opportunities, competitive forces dictate the traditional vanadium mining and recycling sectors also respond. There is also the possibility of alternative electrolytic technologies like quinones.
A project very close to home is that of Ironstone Resources’132. The company has a vanadium project in NW Alberta called Clear Hills that is focused on developing mining and production of vanadium pentoxide on a large scale. Further work is required to fully understand the impact the Ironstone project and others like it could have on the on an initiative to recover vanadium from carbon streams.
The Nexen produced filter cake represented the most concentrated form of vanadium within an oil sands facility identified during this study. This process is unique for oil sands. The quantities of vanadium are significant if recovered to a respectable degree (70 %+), as this could represent a significant portion of vanadium production globally. However, further technical advances in technology would be required.
Extracting Vanadium from straight bitumen is not practical, considering the small quantity (200 ppmw per bbl of bitumen) that would need to be extracted.
3.5 OVERARCHING CONCLUSIONS
Alberta and Canada are effectively non-players in the global CF world currently. Further investigation is warranted considering the potential that exists over the decades to come for this market to dramatically increase in size. As discussed in this report, a 1% market penetration into the steel industry by 2030 (not unreasonable), would effectively take all produced asphaltenes available from bitumen. When other global commodities such aluminum, cement and wood are considered, the likelihood of one or a combination of all them developing with CF integration are reasonably high.
A multi-faceted CF program would include technical and commercial feasibility of bitumen-derived pre-cursor feedstock materials, as well as CF manufacturing (spinning) and CF final product development. CF represents a potentially major economic diversification opportunity for non-combustion related products from bitumen.
Using asphaltenes as CF feedstock could yield a significant win-win, with asphaltene removal partially upgrading diluent based bitumen that is currently produced. There are many other significant near-term advantages.
Oil sands derived asphalt is widely considered to have superior quality compared with many other currently available asphalts. Developing solid form technologies that would enable export of asphalt to the global market merits investigation. A solid form technology could also provide a market outlet for bitumen and potentially asphaltenes as asphalt additives.
A well-documented study to outline the lifecycle cost advantages of oil sands-derived asphalt would complement efforts to market and export asphalt in North America and beyond.
Both the asphaltene and asphalt opportunities detailed in this study effectively deal with the bottom of the barrel, by giving it greater value. The remaining barrel of bitumen will be significantly impacted. The changes not only affect the
132 https://www.ironstoneresources.com/about/

BITUMEN BEYOND COMBUSTION – PHASE 2 REPORT
Detailed Summaries
an c:\users\nashcroft\documents\stantec - business development advisor\general business development\bitumen beyond combustion\post po\final report\12th february\bbc phase ii report_14_a.docx 3.107
API, but also the molecular structure. Future work on the remaining barrel should be considered to evaluate the potential future uses and advantages of this new barrel.
The global Vanadium market has the potential to grow significantly leading up to 2030; perhaps over 5 times its current value. Removal of Vanadium from oil sands byproducts (e.g., fly ash and coke) merits investigation for technical and economic feasibility, along with conversion into vanadium electrolytes for use in redox flow batteries.
A review of oil sands feedstocks for future polymers that incorporate biodegradability and compostability objectives would be an important initiative. A review of platform molecules also has merit.

BITUMEN BEYOND COMBUSTION – PHASE 2 REPORT
1
4 APPENDIX 4.1.1 What are Quinones?
The term quinone refers to a specific functionality and chemical structure within an organic molecule. The quinone feature is not a discrete molecule, per se.
Two molecules can both have the quinone structure, but due to a different overall structure cannot be said to be equivalent and consequently will display different chemical / physical properties and thus suitability for a specific function like flow batteries. Examples of quinones are shown in Figure 64. A common feature to all are the two carbonyl groups (a carbon atom joined to an oxygen atom by a double bond); see (1) para-Benzoquinone – the two red circles. The similarity ends here; examples (2) to (6) all have the same two carbonyl groups but differ at the macro level. Each compound will consequently display different chemical and physical properties such as solubility, miscibility, oxidation / reduction potential.
Figure 64: Examples of Quinones
4.1.2 Why Quinones?
Reversible chemical reactions are the foundation of rechargeable battery chemistry. Because of their structure quinones display reversible chemistry.
This structure is best explained via Figure 65. Depending on conditions, the molecule is shown either as the hydroquinone133 or benzoquinone. At an anode, in solution and under oxidizing conditions, hydroquinone will give up two electrons to the circuit and assume the structure of benzoquinone. The reaction is reversible under cathodic (reducing) conditions. Here, the benzoquinone receives two electrons from the circuit and assumes the hydroquinone structure.
133 “Hydroquinone”: the prefix “hydro” refers to the hydroxyl groups (-OH) shown in the figure.
2-Methylanthraqui
none
Anthraquinone
para-Benzoquinone
1,4-Naphthoquinone
2-Ethylanthraquinone
Anthraquinone-2-sulfonic acid sodium salt
monohydrate
1 3
2 4
5
6

BITUMEN BEYOND COMBUSTION – PHASE 2 REPORT
2
Figure 65: Hydro- and Benzo-quinone
It is important to note that not all the quinones behave in the same manner (i.e., show a high degree of reaction reversibility). As function of the overall molecule structure, quinones will oxidize and reduce at different potentials. During either of these reactions and depending on conditions, the molecules are prone to side reactions. Side reactions result in new molecules that have their own chemistry. The net effect is a loss in battery performance along with possible electrode fouling.
Quinones have some additional favorable features. They include:
Aqueous electrolytes: low fire hazard, ease of electrolyte replacement during routine maintenance.
Cost: a possible alternative to vanadium flow cells, shown in Table 35.
Chemistry: strongly reversible reactions and rapid redox kinetics.
Molecular structure: synthetic organic chemistry allows the design and exploration of a variety of molecules.
Table 35: Flow Cell – Cost Comparison134
No Full Cell US$/kAh US$/kWh
1 Anthraquinone with Bromine <23.66 <27.58
2 Anthraquinone with Benzoquinone <29.04 <32.09
3 Vanadium with vanadium 97.54 81.28
134 Aziz-Princeton-Slides-2014-10-20-Organic-Based-Aqueous-Flow-Batteries-for-Massive-Electrical-Energy-Storage