biz2bis: a socio-technical approach to design inter
TRANSCRIPT

BIZ2BIS: a socio-technical approach to design
inter-organizational business models and their
underlying information systems
Cristina Margarida Chuva Costa
UNIVERSITY OF COIMBRA
Department of Informatics Engineering
Faculty of Sciences and Technology
PhD thesis submitted to the Faculty of Sciences and Technology of the University of Coimbra
Coimbra, March 2013


Advisor
Prof. Doutor Paulo José Osório Rupino da Cunha
Assistant Professor
Informatics Engineering Department
Faculty of Sciences and Technology of the University of Coimbra


“The importance of the lopsided, the thing that’s skewed a little. You were looking for
balance, beautiful balance, equal parts, equal sides. I know this. I know you. But you should
have been tracking the yen in its tics and quirks. The little quirk. The misshape.”
Don Delillo in Cosmopolis


Acknowledgments
I would not have been able to successfully complete this thesis without the aid and support
of countless people.
First of all, I would like to express my gratitude to Prof. Paulo Rupino, my thesis advisor,
for his encouragement, guidance, and support during the course of this research. To work with
him has been a challenging and rewarding experience. These few words are not sufficient to
express my extreme gratitude.
I would also like to thank to Prof. António Dias de Figueiredo and Prof. Rosário Cação.
Their comments and suggestions in particular moments of this work were always very inspiring.
The main ideas within this thesis have been tuned and improved thanks to various
contributions in the academic circle. In particular, I would like to thank the participating
professors and fellow PhD candidates of the two Doctoral Consortia I attended: one organized by
the European Conference on Information Systems in 2007 and the other by the Mediterranean
Conference on Information Systems in 2006. The dissertation also benefited from very interesting
discussions when presenting versions of the developed work at the meetings organized by the
Information Systems Group of CISUC (Centre for Informatics and Systems of the University of
Coimbra).
For all the support I have received and for making my fieldwork not only possible and
enlightening, but a highly enjoyable experience quest, I would like to thank to all the ones
involved in the addressed cases.
I am very grateful to the Portuguese Foundation for Science and Technology, CISUC, and
Polytechnic Institute of Coimbra/Coimbra Engineering Institute. Their support created favourable
conditions that helped this work reach a successful conclusion. I also extend my gratitude to my
colleagues at the Polytechnic of Coimbra for having aided me in many different ways. In
particular, I would like to thank Anabela Gomes, Simão Paredes, Teresa Rocha, José Marinho,
and Olga Craveiro who have privileged me with their friendship. They were my favorite punching
bags.
I am also indebted to Joana Martins and Paulo Mariano for their outstanding friendship and
for having the patience to analyze my work and to question it. I also acknowledge the precious
help of Elizabeth Santos for her captivating classes that significantly improved my English.
Finally, I wish to express a heartfelt thanks to my parents, my grandfather, and family.
Their encouragement, patience, and infinite support make everything possible. To Pedro, thank
you for having shared the chaotic moments with me, resisted to the confinement brought forth by
our theses, and always being there for me.

i
Abstract
Information and communication technologies (ICTs), especially the Internet, have been
gradually changing the playing field for organizations. The unparalleled connectivity achieved at
minor costs altered the balance between transaction and coordination expenditures as well as the
social, commercial, and geographical boundaries between companies. Inter-organizational
networks flourished and their participants were given the chance to define new processes with
different business rules and innovative value propositions. In these new and complex settings,
organizations can cooperate and share goals while competing for a particular advantage. They can
also leverage resources and intelligence to generate solutions that no firm alone would be able to
achieve.
Inter-organizational business models are frequently decentralized environments, without a
single point of authority for decision-making or a hierarchy mandated to assign roles to the
stakeholders. These can share interests but can also possess different and conflicting expectations.
Moreover, the interconnected nature of inter-organizational networks makes it difficult to identify
their boundaries and handle their dynamics. To maintain stability in the long run, the networked
business model must be able to provide attractive and balanced value propositions for all those
involved. Due to the difficulty in satisfying individual expectations and simultaneously promote
the network goals, there is a need for guidelines to assist in designing and tuning the right
business model.
We developed a new approach, called BIZ2BIS (from Business Models to the Blueprint of
the Information System) to discuss, design, and evaluate inter-organizational business models and
derive high-level requirements for the underlying information system. It consists of an iterative
and incremental process that involves the various stakeholders in seeking a set of value
propositions that ensure that the various elements are willing to participate in a sustained manner.
To conceive BIZ2BIS, we started with an exhaustive literature review on business models, which
disclosed key topics and underlined the importance of their socio-technical nature. To address this
dimension, we grounded our approach on the tenets of Actor-Network Theory (ANT). The
approach also uses insights obtained from the study of business models to systematically identify
the high-level requirements of their underlying information system in a business model driven
way. We used the first draft of BIZ2BIS and two of its updated versions to analyze our three case
studies: HowMuchIsIt, publishing an online journal, and GreenHomes. This allowed us to weed
out potential preliminary problems and progressively enhance the approach maturity. In our last
case, InovWine, we had the chance to act on its scenario. Action research guided BIZ2BIS
application and our intervention.
The process and instruments proposed in BIZ2BIS enable the systematic reasoning about
inter-organizational business models, thus facilitating the discovery of potential dependencies,
problems, and solutions to better the chances of getting the sustained commitment of the parties in
these complex settings. It also provides an initial blueprint of the supporting information system.

iii
Resumo
A evolução protagonizada pelas Tecnologias de Informação e Comunicação, em particular a
Internet, tem alterado gradualmente a forma como as organizações operam e interagem. O
fenómeno da comunicação em rede atingiu níveis sem precedentes, com custos de suporte
comportáveis para a generalidade das instituições e dos cidadãos, o que alterou o equilíbrio entre
as despesas de transacção e coordenação, assim como as fronteiras geográficas, sociais e
comerciais. Proliferam redes inter-organizacionais que possibilitaram a definição de novos
processos, com regras de negócio e propostas de valor inovadoras. Neste contexto, as
organizações têm a possibilidade de explorar formas de cooperação que lhes sejam vantajosas.
Os modelos de negócio inter-organizacionais são usualmente ambientes descentralizados
desprovidos de um único ponto de controlo ou de uma hierarquia bem definida à qual seja
reconhecida a capacidade de coordenar e atribuir papéis. Se por um lado as entidades envolvidas
podem partilhar interesses, por outro podem possuir expectativas antagónicas. A complexidade
das relações existentes cria ainda dificuldades adicionais à identificação dos limites da rede
criada, ao papel de cada um dos seus elementos, à forma como interagem e à percepção da
dinâmica da rede. Para manter a sua estabilidade a longo prazo, os modelos de negócio devem ser
capazes de proporcionar propostas de valor atractivas, que fomentem o alinhamento dos diferentes
interesses coexistentes e que promovam a participação de todos os envolvidos. A dificuldade em
conciliar interesses individuais com os objectivos da rede enfatiza ainda a relevância de propor
orientações para o desenho e refinamento do modelo de negócio.
Nós desenvolvemos uma nova abordagem, denominada de BIZ2BIS (from Business Models
to the Blueprint of the Information System) que possibilita a discussão, desenho e avaliação de
modelos de negócio inter-organizacionais, bem como a identificação dos requisitos de alto nível
dos seus sistemas de informação de suporte. Consiste num processo incremental que envolve os
elementos da rede na procura de um conjunto de propostas de valor que os motive a participar na
solução adoptada. A proposta teve como base uma revisão detalhada da literatura em modelos de
negócio, o que nos permitiu identificar tópicos a abordar e detectar a importância de considerar a
sua natureza sócio-técnica. Para abordar esta dimensão, inspirámo-nos nos princípios da Actor-
Network Theory (ANT). A BIZ2BIS também utiliza contribuições obtidas a partir de modelos de
negócio a que recorremos como casos. A sua primeira versão e duas posteriores actualizações
foram utilizadas para analisar três estudos de caso: HowMuchIsIt, revista online e GreenHomes, o
que nos permitiu, numa fase preliminar, eliminar potenciais problemas e progressivamente
contribuir para a maturidade da abordagem. No quarto caso, InovWine, as nossas sugestões
resultaram em alterações à forma como o modelo de negócio estava a ser concebido. A
investigação-acção orientou o uso da BIZ2BIS e a nossa intervenção.
O processo e os instrumentos propostos possibilitam o estudo sistemático de modelos de
negócio inter-organizacionais, facilitando assim a descoberta de dependências, problemas e
soluções que promovam o envolvimento sustentado das partes envolvidas. Este conhecimento é
utilizado pela abordagem para especificar os requisitos de alto nível dos sistemas de informação
de suporte.


v
Table of contents
CHAPTER 1 INTRODUCTION................................................................................................................. 1
1.1 PROBLEM STATEMENT ........................................................................................................................... 1 1.2 BACKGROUND LITERATURE .................................................................................................................. 4 1.3 RESEARCH PURPOSE AND QUESTIONS ................................................................................................... 6 1.4 RELEVANCE OF THIS THESIS .................................................................................................................. 7 1.5 RESEARCH APPROACH........................................................................................................................... 8 1.6 OUTLINE ................................................................................................................................................ 9
CHAPTER 2 BUSINESS MODELS ......................................................................................................... 11
2.1 BUSINESS MODELS THEORETICAL FRAMEWORK .................................................................................. 12 2.1.1 Definitions ..................................................................................................................................... 14 2.1.2 Typologies ..................................................................................................................................... 20 2.1.3 Conceptual models and their components ................................................................................ 29 2.1.4 Adoption factors ........................................................................................................................... 48 2.1.5 Business models evaluation ........................................................................................................ 49 2.1.6 Change methodologies ................................................................................................................ 53
2.2 BUSINESS MODELS AND VALUE NETWORKS ........................................................................................ 54 2.3 CONCLUSION ....................................................................................................................................... 58
CHAPTER 3 THE SOCIAL DIMENSION OF BUSINESS MODELS ............................................... 63
3.1 SOCIAL AND TECHNICAL INTERTWINE IN BUSINESS MODELS ............................................................. 64 3.2 SITUATING ANT .................................................................................................................................. 65 3.3 ANT’S VOCABULARY TRANSLATED TO THE BUSINESS MODEL DOMAIN ............................................ 70
3.3.1 Actor and actant ............................................................................................................................ 71 3.3.2 Network ......................................................................................................................................... 72 3.3.3 Theory ............................................................................................................................................ 74 3.3.4 Translation ..................................................................................................................................... 74 3.3.5 Inscription ...................................................................................................................................... 77 3.3.6 Black Box and Punctualization ................................................................................................... 79 3.3.7 Immutable mobile and multiple realities .................................................................................. 80 3.3.8 Intermediary versus mediator .................................................................................................... 82 3.3.9 Power .............................................................................................................................................. 82
3.4 WHY SEEK INSPIRATION IN ANT ........................................................................................................ 83 3.5 FROM DESCRIPTION TO ACTION .......................................................................................................... 87 3.6 COMPLEMENTARY ASPECTS TO ANT ................................................................................................. 89
3.6.1 Structuration Theory .................................................................................................................... 90 3.6.2 Social Capital ................................................................................................................................. 92
3.7 OUTCOMES FROM THE SOCIAL DOMAIN ............................................................................................. 93 3.8 CONCLUSION ....................................................................................................................................... 95
CHAPTER 4 RESEARCH STRATEGY ................................................................................................... 97
4.1 INTRODUCTION ................................................................................................................................... 97 4.2 UNDERLYING EPISTEMOLOGY ............................................................................................................. 98 4.3 RESEARCH METHODS ......................................................................................................................... 101 4.4 CASE STUDY ....................................................................................................................................... 102
4.4.1 Case study definition and history ............................................................................................ 102 4.4.2 Why choose case study? ............................................................................................................ 103 4.4.3 Research design........................................................................................................................... 105

vi
4.4.4 Reliability and validity in a case study .................................................................................... 110 4.5 ACTION RESEARCH ............................................................................................................................ 111
4.5.1 Action research definition .......................................................................................................... 111 4.5.2 Action research historical background .................................................................................... 113 4.5.3 Why choose action research? ..................................................................................................... 113 4.5.4 Action research description ....................................................................................................... 115 4.5.5 Rigor and validity in action research ....................................................................................... 119 4.5.6 Generalization in action research .............................................................................................. 122
4.6 CONCLUSION ..................................................................................................................................... 123
CHAPTER 5 BIZ2BIS: BUSINESS MODEL AND IS DESIGN ........................................................ 125
5.1 INTRODUCTION .................................................................................................................................. 125 5.2 BIZ2BIS OUTLINE .............................................................................................................................. 126 5.3 BIZ2BIS STEP BY STEP ........................................................................................................................ 129
5.3.1 Phase I, from Step I.a to Step I.c – Business model characterization ................................... 129 5.3.2 Phase II, from Step II.a to Step II.e – Business model refinement ........................................ 143 5.3.3 Phase III, Step III.a – Stability assessment ............................................................................... 157 5.3.4 Phase IV, Step IV. a- Information system specification ......................................................... 167
5.4 CONCLUSIONS ................................................................................................................................... 173
CHAPTER 6 THE ROADMAP TO THE BIZ2BIS PROPOSAL ....................................................... 175
6.1 INTRODUCTION .................................................................................................................................. 175 6.2 CONTRIBUTION OF THREE CASE STUDIES TO BIZ2BIS ...................................................................... 176
6.2.1 Case one: HowMuchIsIt ............................................................................................................. 176 6.2.2 Case two: Publishing an online journal ................................................................................... 181 6.2.3 Case three: GreenHomes ............................................................................................................ 185
6.3 CONTRIBUTION OF ACTION RESEARCH TO BIZ2BIS ......................................................................... 190 6.3.1 InovWine research context ........................................................................................................ 190 6.3.2 Reasons for InovWine study ..................................................................................................... 192 6.3.3 Potential limitations of the InovWine study ........................................................................... 193 6.3.4 Chronology of the project .......................................................................................................... 193 6.3.5 Lessons learned ........................................................................................................................... 197
6.4 RETROSPECTIVE LOOK OVER THE ARTIFACTS OF BIZ2BIS ................................................................ 198 6.5 CONCLUSION ..................................................................................................................................... 211
CHAPTER 7 INOVWINE: AN EXAMPLE OF USING BIZ2BIS ...................................................... 213
7.1 INTRODUCTION .................................................................................................................................. 213 7.2 AN ACTION RESEARCH STUDY: USING BIZ2BIS IN THE INOVWINE PROJECT .................................. 214
7.2.1 Phase I, Step I.a, I.b, I.c - Characterization of the submitted proposal ................................ 215 7.2.2 Phase II, Step II.d, II.c –Identification of weaknesses in the proposal ................................. 237 7.2.3 Findings after the first BIZ2BIS iteration ................................................................................. 244 7.2.4 Phase II, Step II.a – Dependencies in the redesigned business model ................................. 247 7.2.5 Phase II, Step II.b – Identification of actor affinities ............................................................... 249 7.2.6 Phase II, Step II.c – Negotiation of actor contributions .......................................................... 253 7.2.7 Phase I, Step I.c – Representation of the redesigned business model .................................. 258 7.2.8 Phase II, step II.d –Discussion of threats to the redesigned business model ...................... 261 7.2.9 Phase I, step II.c –Representation of complementing scenarios ........................................... 263 7.2.10 Phase II, Step II.e – Stabilization of the envisioned value propositions .............................. 266 7.2.11 Phase III, Step III.a – Evaluation of the actors perceptions ................................................... 269 7.2.12 Phase IV, Step IV.a – Specification of information system requirements ........................... 278 7.2.13 Findings after the second BIZ2BIS iteration ............................................................................ 293
7.3 CONCLUSION ..................................................................................................................................... 295

vii
CHAPTER 8 CONCLUSIONS ............................................................................................................... 297
8.1 OVERVIEW OF THE PROBLEM STATEMENT......................................................................................... 297 8.2 REVIEWING THE RESEARCH ISSUE ..................................................................................................... 298 8.3 RESEARCH CONTRIBUTIONS .............................................................................................................. 305
8.3.1 Theoretical contributions ........................................................................................................... 305 8.3.2 Practical contributions ............................................................................................................... 308
8.4 LIMITATIONS ..................................................................................................................................... 310 8.5 DIRECTIONS FOR FUTURE RESEARCH ................................................................................................ 310
REFERENCES ................................................................................................................................................... 313
APPENDIX A MEETINGS/INTERVIEWS HELD DURING THE INOVWINE PROJECT .......... 335


ix
List of Figures FIGURE 1: ELEMENTS TO COVER WHEN STUDYING BUSINESS MODELS ....................................................................................... 19
FIGURE 2: TIMMERS’ CLASSIFICATION OF INTERNET BUSINESS MODELS .................................................................................... 22
FIGURE 3: BUSINESS WEB TAXONOMY ....................................................................................................................................... 27
FIGURE 4: HAMEL’S COMPONENTS OF THE BUSINESS MODEL .................................................................................................... 32
FIGURE 5: ALT AND ZIMMERMANN’S GENERIC ELEMENTS OF BUSINESS MODELS ..................................................................... 33
FIGURE 6: LINDER AND CANTRELL OUTLINED OPERATING BUSINESS MODEL ........................................................................... 34
FIGURE 7: EXAMPLE OF AN E-BUSINESS MODEL SCHEMATIC: E-BROKERING WITH FULL-SERVICE FINANCIAL PROVIDER ........... 35
FIGURE 8: CISCO’S VALUE MAP ................................................................................................................................................. 36
FIGURE 9: LEVELS OF DECISION MAKING................................................................................................................................... 37
FIGURE 10: CATEGORIES OF BUSINESS MODEL COMPONENTS .................................................................................................... 38
FIGURE 11: CONCEPTS AND RELATIONS OF E3-VALUE ONTOLOGY ........................................................................................... 39
FIGURE 12: EDUCATIONAL E3-VALUE EXAMPLE ....................................................................................................................... 40
FIGURE 13: E3-FAMILY, DESIGNING NETWORK ANALYSIS .......................................................................................................... 41
FIGURE 14: BUSINESS MODEL ONTOLOGY ................................................................................................................................ 43
FIGURE 15: BUSINESS MODEL CANVAS TEMPLATE ................................................................................................................... 44
FIGURE 16: STOF BUSINESS MODEL FRAMEWORK ..................................................................................................................... 45
FIGURE 17: STOF CRITICAL DESIGN ISSUES AND CRITICAL SUCCESS FACTORS FOR CREATING CUSTOMER VALUE .................... 46
FIGURE 18: PORTERS’ VALUE CHAIN ......................................................................................................................................... 55
FIGURE 19: GENERIC VALUE-CREATING SYSTEM IN THE ELECTRONIC PUBLISHING INDUSTRY .................................................. 57
FIGURE 20: DIMENSIONS OF THE DUALITY OF STRUCTURE ........................................................................................................ 90
FIGURE 21: THE RESEARCH “ONION” ..................................................................................................................................... 101
FIGURE 22: SIMPLIFIED ACTION RESEARCH CYCLE .................................................................................................................. 116
FIGURE 23: ACTION RESEARCH CYCLE .................................................................................................................................... 116
FIGURE 24: ACTION RESEARCH DUAL CYCLE PROCESS ............................................................................................................ 118
FIGURE 25: GENERIC OUTLINE OF BIZ2BIS ............................................................................................................................ 128
FIGURE 26: LAYERS OF FLOWS ................................................................................................................................................. 140
FIGURE 27: “FLOW DIAGRAM” APPLIED TO GREENHOMES .................................................................................................... 141
FIGURE 28: “COMMON GOAL DIAGRAM” APPLIED TO GREENHOMES .................................................................................... 145
FIGURE 29: “NEGOTIATION DIAGRAM” APPLIED TO GREENHOMES ....................................................................................... 150
FIGURE 30: “DEPENDENCY FLOW DIAGRAM” APPLIED TO GREENHOMES .............................................................................. 154
FIGURE 31: “VALUE PROPOSITION TRACEABILITY DIAGRAM” APPLIED TO GREENHOMES ..................................................... 161
FIGURE 32: CONTRIBUTIONS FROM PHASE I, PHASE II, AND PHASE I TO THE “SERVICE SPECIFICATION CHART” .................. 171
FIGURE 33: EVOLUTION OF THE “NETWORKED BUSINESS MODEL DESCRIPTION CHART” ....................................................... 199
FIGURE 34: EVOLUTION OF THE “ACTOR DESCRIPTION CHART” ............................................................................................ 200
FIGURE 35: EVOLUTION OF THE “FLOW DIAGRAM” ................................................................................................................ 202
FIGURE 36: EVOLUTION OF THE “COMMON GOAL DIAGRAM” ............................................................................................... 203

x
FIGURE 37: EVOLUTION OF THE “ACTORS/GOALS AFFINITY CHART” .................................................................................... 204
FIGURE 38: EVOLUTION OF THE “NEGOTIATION DIAGRAM” .................................................................................................. 206
FIGURE 39: EVOLUTION OF THE “DEPENDENCY DIAGRAM” .................................................................................................. 207
FIGURE 40: EVOLUTION OF THE “BUSINESS FLOWS/VALUE PROPOSITIONS CHART” .............................................................. 208
FIGURE 41: EVOLUTION OF THE “INTERVIEW CHART” ........................................................................................................... 210
FIGURE 42: EVOLUTION OF THE “SERVICE SPECIFICATION CHART” ....................................................................................... 211
FIGURE 43: FLOW DIAGRAM OF THE INOVWINE BUSINESS MODEL PROPOSED IN THE NSRF SUBMISSION ............................. 220
FIGURE 44: FLOW DIAGRAM OF THE COOPERATIVE BUSINESS MODEL PRIOR TO INOVWINE PROJECT .................................... 224
FIGURE 45: DEPENDENCY DIAGRAM FOR THE INFORMATION FLOWS TO BE ENTERED BY THE PRODUCERS ............................. 239
FIGURE 46: “IMPROVE THE VINEYARDS TREATMENT THROUGH INOVWINE” NEGOTIATION DIAGRAM ................................. 241
FIGURE 47: INOVWINE COMMON GOAL DIAGRAM ................................................................................................................ 248
FIGURE 48: “IMPROVE VINEYARDS TREATMENT USING INOVWINE SYSTEM” NEGOTIATION DIAGRAM .................................. 255
FIGURE 49: “ENHANCE THE QUALITY OF THE PRODUCED WINE” NEGOTIATION DIAGRAM.................................................... 257
FIGURE 50: FLOW DIAGRAM OF THE ENVISIONED INOVWINE BUSINESS MODEL .................................................................... 259
FIGURE 51: FLOW DIAGRAM OF THE INOVWINE COMMERCIAL INTERACTIONS ...................................................................... 260
FIGURE 52: DEPENDENCY DIAGRAM OF THE INOVWINE MAINTENANCE PROTOCOL/CONTRACT .......................................... 262
FIGURE 53: FLOW DIAGRAM OF SYNERGIES WITH A METEOROLOGICAL STATION ................................................................... 264
FIGURE 54: DEPENDENCIES AMONG VALUE PROPOSITIONS IDENTIFIED BY ACC ................................................................... 276
FIGURE 55: DEPENDENCIES AMONG VALUE PROPOSITIONS IDENTIFIED BY THE PRODUCER.................................................... 276
FIGURE 56: WEB INTERFACES DEVELOPED .............................................................................................................................. 293

xi
List of Tables TABLE 1: BUSINESS MODEL CONTRIBUTIONS ............................................................................................................................. 13
TABLE 2: BUSINESS MODEL DEFINITIONS ................................................................................................................................... 16
TABLE 3: BUSINESS MODEL CLASSIFICATIONS ........................................................................................................................... 23
TABLE 4: BUSINESS MODEL COMPONENTS ................................................................................................................................. 31
TABLE 5: COMPONENTS OF THE BUSINESS MODEL ONTOLOGY ................................................................................................ 43
TABLE 6: BUSINESS MODEL GUIDELINES TO THE DEVELOPMENT OF BIZ2BIS ........................................................................... 62
TABLE 7: CONTRIBUTIONS FROM ANT, STRUCTURATION THEORY, AND SOCIAL CAPITAL TO BIZ2BIS ................................. 95
TABLE 8: RESEARCH QUESTIONS COVERED BY THE CASE STUDIES ........................................................................................... 107
TABLE 9: PRINCIPLES TO ENHANCE ACTION RESEARCH RIGOR ............................................................................................... 120
TABLE 10: PHASE I - STEPS AND SUPPORTING ARTIFACTS ....................................................................................................... 130
TABLE 11: “NETWORKED BUSINESS MODEL CHART” APPLIED TO THE GREENHOMES CASE ................................................... 132
TABLE 12: “ACTOR DESCRIPTION CHART” APPLIED TO THE GREENHOMES’ MONITORED USER ............................................. 136
TABLE 13: PHASE II – STEPS AND SUPPORTING ARTIFACTS ..................................................................................................... 144
TABLE 14: “ACTORS/GOALS AFFINITY CHART” APPLIED TO GREENHOMES ........................................................................... 148
TABLE 15: “BUSINESS FLOWS/VALUE PROPOSITIONS CHART” APPLIED TO GREENHOMES ..................................................... 156
TABLE 16: PHASE III - STEP AND SUPPORTING ARTIFACTS ...................................................................................................... 158
TABLE 17: INTERVIEW CHART USED IN GREENHOMES ............................................................................................................ 160
TABLE 18: PHASE IV – STEP AND SUPPORTING ARTIFACT ....................................................................................................... 167
TABLE 19: SERVICE SPECIFICATION CHART APPLIED TO GREENHOMES .................................................................................. 169
TABLE 20: INOVWINE’S NETWORKED BUSINESS MODEL DESCRIPTION (PROPOSAL SUBMITTED TO NSRF) .............................. 216
TABLE 21: ASSOCIAÇÃO COOPERATIVA DE CANTANHEDE DESCRIPTION (PROPOSAL SUBMITTED TO NSRF)......................... 217
TABLE 22: PRODUCERS DESCRIPTION (PROPOSAL SUBMITTED TO NSRF)................................................................................ 217
TABLE 23: BIOCANT DESCRIPTION (PROPOSAL SUBMITTED TO NSRF) .................................................................................... 217
TABLE 24: IPN - LIS DESCRIPTION (PROPOSAL SUBMITTED TO NSRF) ................................................................................... 218
TABLE 25: IPN - LAS DESCRIPTION (PROPOSAL SUBMITTED TO NSRF) ................................................................................. 218
TABLE 26: VVPB DESCRIPTION (PROPOSAL SUBMITTED TO NSRF) ........................................................................................ 218
TABLE 27: IPN – INOVWINE APPLICATION DESCRIPTION (PROPOSAL SUBMITTED TO NSRF) ................................................ 218
TABLE 28: INOVWINE’S UPDATED NETWORKED BUSINESS MODEL SCENARIO ......................................................................... 226
TABLE 29: ADEGA COOPERATIVA DE CANTANHEDE UPDATED DESCRIPTION ........................................................................ 231
TABLE 30: PRODUCERS UPDATED DESCRIPTION ...................................................................................................................... 233
TABLE 31: BIOCANT UPDATED DESCRIPTION........................................................................................................................... 234
TABLE 32: IPN-LIS UPDATED DESCRIPTION ........................................................................................................................... 234
TABLE 33: IPN-LAS UPDATED DESCRIPTION .......................................................................................................................... 235
TABLE 34: GRAPEVINE NURSERY UPDATED DESCRIPTION ....................................................................................................... 235
TABLE 35: INOVWINE SYSTEM UPDATED DESCRIPTION ........................................................................................................... 236
TABLE 36: METEOROLOGICAL STATION OF BAIRRADA UPDATED DESCRIPTION ..................................................................... 236
xii
TABLE 37: MAJOR PRODUCER UPDATED DESCRIPTION ........................................................................................................... 237
TABLE 38: INOVWINE ACTORS/GOALS AFFINITY CHART ....................................................................................................... 250
TABLE 39: INOVWINE BUSINESS FLOWS/VALUE PROPOSITIONS CHART ................................................................................. 267
TABLE 40: INTERVIEW CHART ................................................................................................................................................. 270
TABLE 41: INOVWINE INFORMATION SYSTEM SERVICES ......................................................................................................... 279
TABLE 42: SPECIFICATION OF THE SERVICE “AUTHENTICATION OF USER CREDENTIALS” ...................................................... 281
TABLE 43: SPECIFICATION OF THE SERVICE “REGISTRATION OF HARVEST” ............................................................................ 282
TABLE 44: SPECIFICATION OF THE SERVICE “REGISTRATION OF DISEASE” .............................................................................. 283
TABLE 45: SPECIFICATION OF THE SERVICE “REGISTRATION OF PLAGUE” .............................................................................. 285
TABLE 46: SPECIFICATION OF THE SERVICE “REGISTRATION OF THE SENSOR NODE INFORMATION” ...................................... 287
TABLE 47: SPECIFICATION OF THE SERVICE “SEARCH FOR INFORMATION ABOUT THE VINEYARD” ........................................ 288
TABLE 48: SPECIFICATION OF THE SERVICE “GENERATE WARNINGS” .................................................................................... 290
TABLE 49: INOVWINE INFORMATION SYSTEM INTERFACES .................................................................................................... 292

xiii
List of Matrices MATRIX 1: “FLOW MATRIX” APPLIED TO GREENHOMES ........................................................................................................ 142
MATRIX 2: FLOW MATRIX OF THE COOPERATIVE BUSINESS MODEL PRIOR TO INOVWINE PROJECT ........................................ 225
MATRIX 3: FLOW MATRIX OF THE UPDATED VERSION OF THE INOVWINE BUSINESS MODEL (INCLUDES COMPLEMENTING
SCENARIOS) ................................................................................................................................................................... 265


xv
List of Graphs GRAPH 1: GAINS AND EFFORTS OF THE ACC IN THE INOVWINE BUSINESS MODEL ................................................................ 271
GRAPH 2: GAINS AND EFFORTS OF PRODUCERS IN THE INOVWINE BUSINESS MODEL ............................................................. 272
GRAPH 3: GAINS AND EFFORTS OF THE IPN IN THE INOVWINE BUSINESS MODEL ................................................................. 272
GRAPH 4: GAINS AND EFFORTS OF THE BIOCANT IN THE INOVWINE BUSINESS MODEL ......................................................... 273
GRAPH 5: GAIN THAT THE ACTORS OF THE INOVWINE BUSINESS MODEL OBTAIN PER VALUE PROPOSITION.......................... 274
GRAPH 6: EFFORT THAT THE ACTORS OF THE INOVWINE BUSINESS MODEL SPEND PER VALUE PROPOSITION ........................ 274


1
Chapter 1
Introduction
In this chapter, we introduce the thesis by presenting its problem space. Then, we briefly
describe the theoretical perspectives that influenced our work, in particular inputs from the
business model domain and Actor-Network Theory. Next, we present the formulated research
purpose and questions, as well as the strategy adopted in the attempt to answer them. Finally, we
discuss its contributions and outline the thesis structure.
1.1 Problem statement
In the course of history, technology has enabled innovative business opportunities through
incremental or radical innovation (Schumpeter, 1934, p. 11). This also holds true in the Internet
era. The progress in the information and communications technologies (ICTs) has afforded radical
changes in communication formats (Tapscott et al., 2000) and on how information has been
handled (accessed, manipulated, transmitted, and stored). The advances made reshaped economic
relationships, organizational structures, and enterprise processes. Ever since the first online
business model started to offer their services, in the mid 1990s, the way of doing business has
never been quite the same (Turban et al., 2002).
Technological advances cleared away geographical, physical, and temporal restrictions and
changed companies and customers social, commercial, and geographical bounds. It became
possible to buy products without leaving home, 24 hours a day, seven days a week, from
companies anywhere around the globe, cutting out middlemen. New communication and
distribution channels brought companies and their customers closer than ever before. Intermediary
businesses and information brokers were circumvented and the guiding logic behind some
established industries began to fall apart (Amit and Zott, 2001). ICTs changed the rules of making
business and caught traditional enterprises off guard. For instance, the Encyclopædia Britannica,
that relied on sales of hard cover books, almost disappeared when online alternatives like
Wikipedia and Encarta were made available for free or at lower prices (Hales, 2005). In March
2012, the company decided to focus on its online version and announced it would no longer
publish its printed editions.
ICTs paved the way for new businesses and powered the dot-com bubble, which is usually
defined as the period of investment and speculation in Internet firms from roughly 1995 to 2001.

Chapter 1 – Introduction
2
This period was marked by the founding of a group of new Internet-based companies, commonly
referred to as dot-coms. The investors answered with enthusiasm to their appeal and a
combination of rapidly increasing stock prices, individual speculation, and widely available
venture capital created massive expectations (Gray et al., 2007).
In the dot-com bubble, these new ventures gathered the support of many people that
believed in the potential of those companies to transform the business landscape, for instance
Wood (2000). At the time, investors were convinced to participate in earlier stages of a business
enterprise and the company’s business models were invoked to give some legitimacy to what
remained as an unproven idea (Magreta, 2002). During this phase, most companies undertook
unusual and daring business practices to explore the new opportunities. Most neglected clients’
value propositions and engaged in a policy of growth over profit (Gordjin, 2002). They assumed
that if they built up their customer base, their revenues would rise as well. However, many of
them were not able to render their ideas lucrative and serious corrections took place causing the
stock market to tumble. In the year 2000, the NASDAQ collapsed and many dot-coms demised
(Fox, 2000). This event was designated by the dotcom bubble burst and made it clear that a
number of these business initiatives were unsuccessful (Shama, 2001, Vickers, 2000).
In spite of a scenario of desolation, panic, bankruptcies, and discredit in the post-dot-com
era, the advantages of using ICTs were, and are, undeniable. Their wide dissemination and
implementation reinforced their economic and social impact. A 2001 report from the OECD
attests their contribution to the development of several countries in various fields: providing the
necessary conditions to create innovative business configurations, supporting business
interactions, increasing the quality of the services provided, fostering collaborations, and
promoting employment (OECD, 2001).
The relationship between technological evolution and business model is readily seen in the
ever-changing stock prices of Amazon. We can see how they rose from the initial 18 dollars to
around 100 dollars in 1999. The impact of the bubble burst plummeted their value back to 18
dollars during 2000. Then, in the summer of 2001, it collapsed even further to 8 dollars (Harford,
2006). Signs of recovery were evident when the relation between business models and technology
became more mature. For instance, in November 2002 their value was 19.5 dollars and in
November 2003 was 55 dollars. In November 2012 their value achieved 226 dollars (Yahoo!
Finance, 2012). The irrefutable role and acceptance of ICTs in today’s world demands that
countries and companies have a continuous capacity to empower them. For instance, the rise of
successful user-generated content sites like Facebook and YouTube shows the vitality of field and
the continuous possibilities of exploring new businesses.
The unprecedented ubiquitous connectivity achieved at negligible costs reduced
coordination and transaction costs among firms (Heck and Vervest, 2007). With the use of the
Internet as a business platform, firms are more properly viewed as connected to each other in
multiple networks (Gulati et al., 2000). They were given the chance to open their boundaries, to
establish complex and diversified business settings, access new markets, and define innovative
processes with different business rules and original value propositions. They aimed at maximizing
resources and intelligence to generate innovative solutions, in order to reach common goals that a

1.1 Problem statement
3
firm alone would not be able to achieve (Svendsen and Laberge, 2005, Gulati et al., 2000).
Several organizations can work together to address a complex shared cross-boundary problem,
issue or opportunity and forge collaborations to jointly create value and offer more complex
services. They can promote shared interests, offer joint value propositions, split revenue streams,
minimize costs, or build-up common distribution networks.
The connections in inter-organizational networks can be of different types (e.g.,
collaboration, partnership, or competition) and cover diverse topics (e.g., money, data, services,
knowledge, reputation, or prestige) (Ballejos and Montagna, 2008). In addition to the rich variety
of links, the presence of several stakeholders introduces an extra complexity in the study of the
business models. Their profile can be extremely diverse. They can originate from different areas,
possess their own interests and sensibilities (each with their own business logic), as well as
opposing positions that can lead to scenarios of competition. The possibility of eminent conflicts
makes it difficult to ensure the sustained interest of the involved parties and the stability of the
bonds, which can threaten the stability of the network of business partners and cause its collapse.
Furthermore, the lack of formal authority of any one participant over its peers also gives rise to
complex interdependencies that increase the difficulties in establishing network coordinating
mechanisms and the network boundaries (Harrigan, 1987).
In the last years, researchers like Gordjin (2002) and Osterwalder (2004) proposed
approaches that detail business model descriptions and avoid past mistakes in their
conceptualization. Nonetheless, the work developed neglects the environmental complexity of
networks and the specificities of the context of each element. It does not manage the contributions
and returns for the participating organizations in order to ensure that all end up with attractive
value propositions that regard their individual interests. Moreover, the proposals available do not
provide guidelines to scrutinize and tune the delicate network balance. Individual analyses do not
work when the success of a company depends on the collective satisfaction of all the other
elements of the network (Iansiti and Levin, 2004). The complexity and highly dynamic nature of
inter-organizational business models requires new forms of analysis capable of describing in
detail the richness and potential of the forged networks. It is necessary, and urgent, to develop
new paradigms and approaches to investigate and explore the potentialities offered by the network
concept and facilitate co-working between its various elements, thus promoting robustness. In this
research, we focused our analysis on inter-organizational networks.
As exposed, technology is one of the pillars of business model innovation. In turn, the
constraints of a business model shape their technological support and exert a strong influence in
the specification of the underlying information system. In spite of the attention devoted to the
business model field by academics and practitioners, the exploration of connection points between
business models and information systems is underrepresented in the literature (Bouwman et al.,
2012). Addressing their dependencies is a challenge that goes beyond the sum of the parts (a
business or an information system problem). Clear advantages can be obtained when specifying
and conceptualizing business models by establishing connections points and detecting influences
between both domains (Chan and Reich, 2007). However, the understanding of the dependencies
between both fields is often hindered by the difficulty in describing networked business models in

Chapter 1 – Introduction
4
detail. Vague business ideas can hide inconsistencies and lead to false assumptions. This lack of
information and imprecision can compromise the elicitation of business constraints that ultimately
should be met in an early requirement phase by the information system supporting the business
model (Gordjin, 2002). Therefore, in addition to the need to address and detail networked
business model particularities, it is also crucial to create a new direction of research able to expose
the connections between both domains and explore their synergies.
1.2 Background literature
Several schools of thought aided us in comprehending the problems at hand and pointed us
towards a path of research. In this section, we discuss inspiring and relevant insights that
grounded our investigation as well as identified gaps.
The conducted literature review helped us obtain the theoretical underpinnings that started
to mold our answer to the needs identified in the previous section. We started by focusing our
attention on the business model field (Chapter 2), which is characterized by some lack of
consensus and diversified viewpoints. The youth of the field, the amount of different perspectives
available, and the diversified origins of the research areas of business model investigators have
contributed to explain the existing fuzziness (Zott et al., 2011). Through an exhaustive analysis of
the available literature, Pateli and Giaglis (2004) perceived there was a lack of theoretical tools to
organize the research in the field and proposed an analytical framework. We used it to outline our
work and systematize the information already analyzed in the following sub-domains of business
model research: definitions, components, taxonomies, representation models, evaluation, and
adoption factors. The performed survey on the first three of these domains enabled us the
identification of concepts that stood out regularly. For instance, value propositions, business
organization, established partnerships, existing relationships, exchanged items, business
participants, financial issues, performed activities, available resources, or distribution channels.
Next, we analyzed available business model representations. In most of the cases their graphical
notations were not very elaborated. In spite of the noted limitations, the addressed topics allowed
us to confirm the relevance of the already identified concepts and to detect an additional effort in
detailing the type of flows exchanged among the business participants (e.g. financial, information,
goods and services, and intangibles).
The literature review also disclosed trends and open research questions. In the few cases
where the assessment of the business models was discussed, we became aware that it was mainly
confined to financial aspects. However, other types of flows (beyond the financial) can sway the
interest of the involved organizations towards the business model, as well as its viability.
Neglecting flows like innovative industrial formulas, annual reports, brand recognition, reputation
or prestige may imply the omission of relevant information for the business model sustainability.
In the literature, we also noticed that most of the proposals did not focus on the study of an inter-
organizational business model, but on the business model of a particular organization. In order to
enrich our research with viewpoints on complex network arrangements, we also focused our

1.2 Background literature
5
attention on value constellations, strategic networks, and value networks. Our analysis suggested
the necessity of describing business models in detail to create a common ground and enable
discussion. The obtained insights stressed the urgency in introducing in the business model study
the specificities of the network environment and of its elements (e.g., collaborations,
dependencies, conflicts, or joint value propositions). In spite of this awareness, there were no
indications on how to approach the issues raised in the business model sub-domains of research.
This partial vision in which the network concept is faded away hinders the inter-organizational
business model understanding and, consequently, the translation of its restrictions in the high-
level requirements of its information system.
To take into account the socio-technical nature of networked business models, we
complemented our understanding of the business model domain with inputs from Actor-Network
Theory (ANT) (Chapter 3). Its insights were especially significant, since they brought to our
research the social context of the network and of its elements.
ANT characterizes a network by its relations, fluidity, and dynamics, matching aspects that
we consider relevant when analyzing inter-organizational business models. It incites us to follow
the elements of the network, disclose their partners, perceive their interactions, and search for the
alignment of their interests. ANT goes beyond the traditional conceptualization that views
networks as a collection of nodes and connections that form a web-like structure (Barab et al.,
2001). It guides us into a world of associations and relations without considering distance or
measurement, challenging our notions of far/close, small scale/large scale and inside/outside
(Latour, 1996b). The actor-network spatial and temporal implications are profound, since it
recognizes that “what is acting at the same moment in any place is coming from many other
places, many distant materials, and many faraway actors” (Latour, 2005, p. 200). To include
ANT’s viewpoints in our approach, we established connection points between them and the issues
covered by business model theory.
ANT’s perspective of time and space reinforced the importance we had already detected in
comprehending the context and dynamics of business models. Its influences and concepts helped
us obtain clues on how to perceive the level of satisfaction of the network elements. It inspired us
to detect problematic situations and disclose alternatives to mitigate them, thus strengthening the
business model viability. Furthermore, ANT’s worldview of a network as a collective of human
and non-human actors, a heterogeneous reality built of multidimensional and continually evolving
entanglements (Grabher, 2006), showed us a new dimension of analysis. Its unique perception
complemented our understanding on how information systems influence – and are influenced – by
the contexts of their business models and helped us establish connections between these two
domains. Taking into account that information systems often fail, usually more due to social and
organizational factors than technical ones (Carbone, 2004, Graham, 2008, Doherty and King,
1998), ANT gave us the chance to regard the role that non-human actors possess and their impact
on the network. Furthermore, it encouraged us to include in our research a link between the
knowledge acquired on human actors and the roles of non-human, revealing how human interests
are materialized in non-humans.

Chapter 1 – Introduction
6
1.3 Research purpose and questions
Based on the established theoretical background and on the gaps identified in the previous
section, we formulated the following research purpose:
The purpose of the thesis is to develop BIZ2BIS: an approach to discuss, design,
and evaluate inter-organizational business models, which will equally contribute to
disclose their underlying information system requirements. By exploring the socio-
technical nature of business models in a networked configuration, the approach aims to be
used as an effective means to guide the search towards beneficial arrangements of value
propositions that can lead to stable networks.
The conducted literature review helped us generate the theoretical underpinnings that led us
to the formulation of the following research questions:
RQ1. How can the discussion, design, and evaluation of business models in network
configurations benefit from the contribution of ANT?
The work progress clarified and detailed directions of research, providing the
knowledge to refine RQ1 as presented below:
a. How to account for socio-technical aspects in business models?
b. How to identify the stakeholders and represent a networked business model so
that it is clear to all involved?
c. How to create an approach capable of aligning the goals of the various
stakeholders?
d. How can indications about the business model stability be provided to
stakeholders?
e. How to consider the dynamic nature of inter-organizational business models?
The need to overcome the gap between business models and the information systems
domain also gave rise to the additional research question:
RQ2. How can business model requirements (including its social context) be translated
to its underlying information system specification?
Inspired by ANT’s “lens of investigation” and adapting its tenets to the business model
domain, we explored the socio-technical nature of networked business models and used the
obtained insights to develop BIZ2BIS (from Business Models to the Blueprint of the Information
System). ANT’s ability to reveal network spaces, their human and non-human actors, existing
relationships, and dynamics offered us tools to describe and perceive how business models can be
shaped by social, political, economical, organizational, and technological issues. The combination
of these contributions with the ones from the business model field enabled us to create innovative

1.4 Relevance of this thesis
7
ways of disclosing what drives stakeholders, unveil their interactions, identify problematic
occurrences, and mediate their interests. BIZ2BIS uses the gathered wealth of information to
obtain indications to mitigate threats, strengthen business models, and support and smooth the
specification of the high-level requirements of their underlying information systems. Furthermore,
the approach offers additional confidence on their suitability to satisfy the demands and
expectations of the network participants.
1.4 Relevance of this thesis
ICTs have been steadily transforming the way companies conduct business. Technological
developments in fields such as enterprise application integration, message oriented middleware,
and service oriented architecture, provided the necessary resources to develop infrastructures,
platforms, and applications into separate layers that can be combined among several
organizations. The conditions created have indisputably sharpened the need for innovation and
companies have been increasingly led to explore new configurations that may transcend their
traditional boundaries. For example, by sharing their business processes, a set of firms from
different industries has the possibility of offering very complex services that would otherwise be
impracticable.
Throughout this research, we were involved in the study of scenarios in which several
entities cooperated to achieve a certain goal. The established contacts enabled us to witness that
those responsible for the business models ideas and for their implementation faced difficulties in
their specification. They were unaware of the topics that should be addressed, as well as the
techniques that could be used to represent and describe the business model. These flaws
contributed to the limitation of the available information at an initial stage of the study, which
made it difficult to discuss the ideas in question and detect possible incoherencies.
BIZ2BIS intends to be a source of systematized knowledge aiding those interested in
designing, evaluating, and refining inter-organizational business models. It consists in an iterative
and incremental process of negotiation that seeks the alignment of the stakeholders’ interests, so
that each one can find an attractive value proposition. The perception of the interactions,
influences, aims, and dynamics of the networked business model enables the disclosure of the
interplay of interests, identify its strengths and weaknesses, and assess its stability and viability.
These are valuable tools to discover actions that can promote the stakeholders’ continued
commitment to the business model (e.g., future features to develop), strengthening its stability and
enduring success. Furthermore, we use the information collected to aid specifying the information
system that will support the idealized business model.
We engineered BIZ2BIS to be light, while combining textual and graphical techniques. It is
organized in four phases. In the first, we characterize the network by identifying its actors and
their relationships, as well as the structural aspects that influence their behavior. In the second
phase, we analyze the network and suggest eventual adjustments to better align the interests of the
stakeholders, so that each can find an attractive and sustainable value proposition. In the third

Chapter 1 – Introduction
8
phase, we assess the business model stability according to the perspectives of its stakeholders, in
order to detect possible dissatisfaction that may compromise its network. The outcome is a
balanced network of interests that documents the actors’ roles, their interactions, contributions,
aims, and value propositions. Based on this stabilization of the networked business model, in the
fourth phase the approach derives high-level requirements for its underlying information system.
The obtained requirements will guide the work of the team responsible for the deployment of the
information system that will support the business model.
Although it is unquestionable that an inter-organizational business model influences and is
influenced by the individual companies own business models, this study does not aim to describe
the latter. It explores the existing bi-directional connection, but its scope is the network of
organizations. Moreover, we state that, in spite of BIZ2BIS being an approach that aids in the
discussion, design, and evaluation of the business model, it cannot provide assurance that it will
be successful. There are always unexpected factors and occurrences that can limit this type of
study (e.g., a change in a governmental law, a new technological trend, an unexpected conflict
between organizations, an erroneous importance assigned to a value proposition, a miscalculated
cost, or value propositions whose importance vary with time).
1.5 Research approach
To answer the proposed questions, we started by conducting a literature review on business
models. The gathered knowledge reinforced our belief in the advantages of analyzing business
models with a socio-technical focus. It also provided some premises that guided our study and
assisted us in the refinement of the research questions (quite general at this stage).
We used the identified premises as a basis for the development of BIZ2BIS, which was
applied to three case studies carried out in sequence. The first one (HowMuchIsIt) addressed the
business model employed in a portal-supported mediation service for the acquisition of
technological equipment. The second (Online Journal) involved the development of a journal
portal and the assessment of sound business models for its activities. The third case
(GreenHomes) was concerned with improving environmental efficiency in a community
supported by an IT platform. All three cases covered common aspects of the sub-research
questions. All were focused on how ANT’s notions could be suitably applied to the study of
networked business models, creating a common background of knowledge that could be clear to
all the actors involved. The specificities of each case (e.g., availability of funds and aims of the
stakeholders) prevented us from completely addressing our sub research questions. For instance,
HowMuchIsIt allowed us to tune evaluation issues. The Online Journal aided us in perceiving
how business model restrictions could be used to specify the high-level requirements of its
information system. In turn, GreenHomes enabled us to develop negotiation mechanisms to
balance existing interests. During our research, case studies acquired a formative role, they aided
us to gradually confirm and reveal relevant lines of research, refining our research questions. They
tuned our approach and endowed it with a level of maturity that gave us some reassurance about
its capacity to address rather complex cases.
1.6 Outline
9
To continue our research, it was fundamental to go into the world of practitioners, work in
close collaboration with participating organizations, jointly apply our approach, and use its
insights to intervene on the business model under study (which had not been done so far). It was
crucial for us to understand if the feedback of our analysis and evaluation was an added value to
solve their problems. InovWine, a project in the wine sector with the aim of enhancing wine
quality and production through technological support, was the answer to our expectations. We
adopted action research when applying BIZ2BIS to help design its business model. Its suitability
to address partially defined and ill-structured problems (like most of the business model ideas at
an initial stage) and the chance to intervene in a real complex business model contributed to this
choice.
We were able to inquire into InovWine by following the actors and disclosing vital
interplays among technical, economic, organizational, human, cultural, and political aspects.
Action research allowed us to reinforce our perception on ANT’s ability to reveal, enhance, and
detail contextual influences with impact on business models. The partnerships developed during
InovWine allowed us to merge research with practice. Practitioners were encouraged to reflect on
how BIZ2BIS was being applied and to regularly discuss the proposed interventions, as well as its
outcomes. The obtained feedback contributed to the achievement of their goals and was used to
enhance our approach. Furthermore, the collaborative and action-oriented nature of the applied
research strategy, combined with the need to develop a supporting information system for
InovWine, created a privileged scenario to explore how a bridge between business models and
information systems could be set up. We had the chance to use BIZ2BIS in the analysis and
design of the business model together with others involved in its development. Supported by the
BIZ2BIS’ artifacts, we translated the insights obtained into the high-level requirements of
InovWine’s information system in a systematized way. These requirements were used by the
elements of the team responsible for the system deployment as their main source of information.
Based on this experience, they provided relevant feedback on the suitability of the provided
information and on BIZ2BIS’ potential.
1.6 Outline
The remainder of this thesis is organized as follows:
Chapter 2: Business models. We present the origins of the concept, clarify its scope in this
dissertation, and provide an overview of the literature on the subject. Next, we enrich this vision
by complementing it with the study of approaches focused on business models operating in
complex network arrangements, such as value constellations, strategic networks, and value
networks. This theoretical exploration started to construct the beliefs with which we started to
conceptualize BIZ2BIS.
Chapter 3: The social dimension of business models. We offer a detailed introduction to
ANT and highlight key concepts that will be used throughout this thesis. Then, we explain its
emphasis on following the actors, thinking of the human, the social, and the technical all at once.

Chapter 1 – Introduction
10
We reflect on business models in all their complexity, searching inspiration in ANT to understand
and discuss the network, conceive procedures that can reinforce the alignment among its
participants, and strengthen the stability and success of their business models. To complement
ANT’s view, Structuration Theory and Social Capital are also explored in this chapter. Their
potential contributions toward the business model domain are discussed.
Chapter 4: Research strategy. We present the philosophical assumptions underpinning
this research, as well as the research strategy we followed. Next, we introduce case study and
action research, describe how they were carried out, and discuss their contribution to expose the
iterative advances that led to BIZ2BIS. Particular attention is given to the rigor, validity of the
performed research, and to the generalization of the results obtained.
Chapter 5: BIZ2BIS: business model and IS design. Building on the previous chapters,
we introduce and describe the major contribution of the dissertation: BIZ2BIS, the approach to
guide the discussion, design, and evaluation of networked business models. The approach also
derives the high-level requirements of the information systems that will support these business
models.
Chapter 6: The roadmap to the BIZ2BIS proposal. We begin by discussing how the case
studies contributed to the development of BIZ2BIS. Then, we detail how action research guided
its use in a rather complex project and the findings we obtained for the involved practitioners and
for the enhancement of BIZ2BIS. Finally, we present a chronological evolution of the conceived
artifacts.
Chapter 7: InovWine: an example of using BIZ2BIS. We illustrate from the InovWine
project how the future users of BIZ2BIS can employ it in a concrete networked business model.
We use the approach to describe the scenario under study, diagnose problems, support
negotiations, conceive interventions, evaluate value propositions, and reflect on the obtained
findings (for researchers and practitioners).
Chapter 8: Conclusions. We start by presenting the contribution of this thesis in
addressing the research questions and their implications. Then, we point out its theoretical
implications and provide recommendations to practitioners. We close by discussing its limitations
as well as opportunities for further research.

11
Chapter 2
Business models
A business model is a blueprint for how a business generates and captures value from
services or products (Chesbrough and Rosenbloom, 2002). It can be used as a frame of mind to
articulate on-going ideas, as well as discuss, understand, communicate, describe, and analyze the
aims and prospects of an organization or networks of organizations. The outcome of its study
facilitates choices for corporate decision makers. Furthermore, by informing the design of its
underlying information systems it also supports a link to the technological domain. It is
unquestionable that business models matter. An initiative, when taken to the market through
different business models, will present distinct results (Weill et al., 2005, Chesbrough, 2010).
Therefore, organizations can not afford “fuzzy thinking” about their business models (Magretta,
2002). They should continuously nurture them to support their activities and adapt them according
to their needs (Pateli and Giaglis, 2004, Osterwalder and Pigneur, 2010).
The main driving force behind the focus of attention on business models has been the
creation of new opportunities by information and communication technologies (ICTs), especially
the Internet (Afuah and Tucci, 2003, Zott et al., 2011). They have provided the chance to support
the re-evaluation of the (traditional) business model concept, as more and more organizations
have tried to understand how to develop their models in creative and successful manners (Seddon
et al., 2004). Having the right business model became a key factor in understanding how
organizations can accomplish their goals.
In this chapter, our contribution is twofold. First, we present an up-to-date literature review
on business models and critically discuss the gathered insights, while searching for shared aspects
and dissonances. Second, grounded in relevant literature, we point out gaps and present
suggestions for features to be included in our approach. To organize our findings, we made use of
the topics addressed on the framework of Pateli and Giaglis (2003).
In section 2.1, we begin by following the hot debate around the meaning and purpose of the
concept business model. Next, we analyze business model taxonomies to understand the identified
categories. After that, we present the evolution on business model components, from items
presented as “shopping lists” to frameworks that address the relationships among them. Then, we
discuss business models adoption factors, evaluation, and change methodologies. In section 2.2,
we look upon the potential offered by network configurations to the business model domain.

Chapter 2 – Business models
12
Finally, in section 2.3, we bring up features to integrate in our proposal based on common
denominators, critics, limitations, and future trends identified in the literature review.
At the end of the chapter, the reader should be able to:
Have a holistic perspective of the business model domain;
Understand how ICTs have impacted business model analysis and design;
Identify open issues in the study of networked business models;
Be aware of our main guidelines for the development of an approach that addresses the
challenges and needs of the study of networked business models.
2.1 Business models theoretical framework
When we started our literature review on the business model domain, we tried to
chronologically analyze contributions to outline their evolution. We soon realized the large
amount of proposals and the diversity of the domains addressed. Meanwhile, we came across the
work of Pateli and Giaglis (2003), who had already detected the absence of theoretical tools to
organize the research in this field. With the aim of further maturing the domain and creating a
foundation on past research, they developed an explanatory framework on business models based
on identified themes and detected patterns. The framework decomposes the business model field
into seven research sub-domains, as follows:
Definitions – describe the purpose, scope, and what constitutes a business model;
Taxonomies – classify business models into a number of typologies based on various
criteria;
Components – decompose the business model into its fundamental constructs;
Conceptual models – propose representational formalisms for visualizing the main
components of the business model. In more comprehensive proposals, they identify and
describe the relationships among these components;
Adoption factors – analyze factors that affect the organizational adoption of business
models, as well as research on socio-economic implications of business model
innovation;
Evaluation models – identify criteria for assessing the feasibility, viability, and
profitability of new or established business models;
Change methodologies – formulate guidelines for either changing existing business
models or choosing new ones to adapt to an innovation.
We used this framework to classify and structure our literature review. The analyzed
publications were identified based on the number of citations or on their contributions to the field.
They are systematized in Table 1 according to the framework sub-domains. Some of the authors
addressed had already been mentioned in Pateli and Giaglis (2003, 2004). These contributions are
marked with an asterisk.
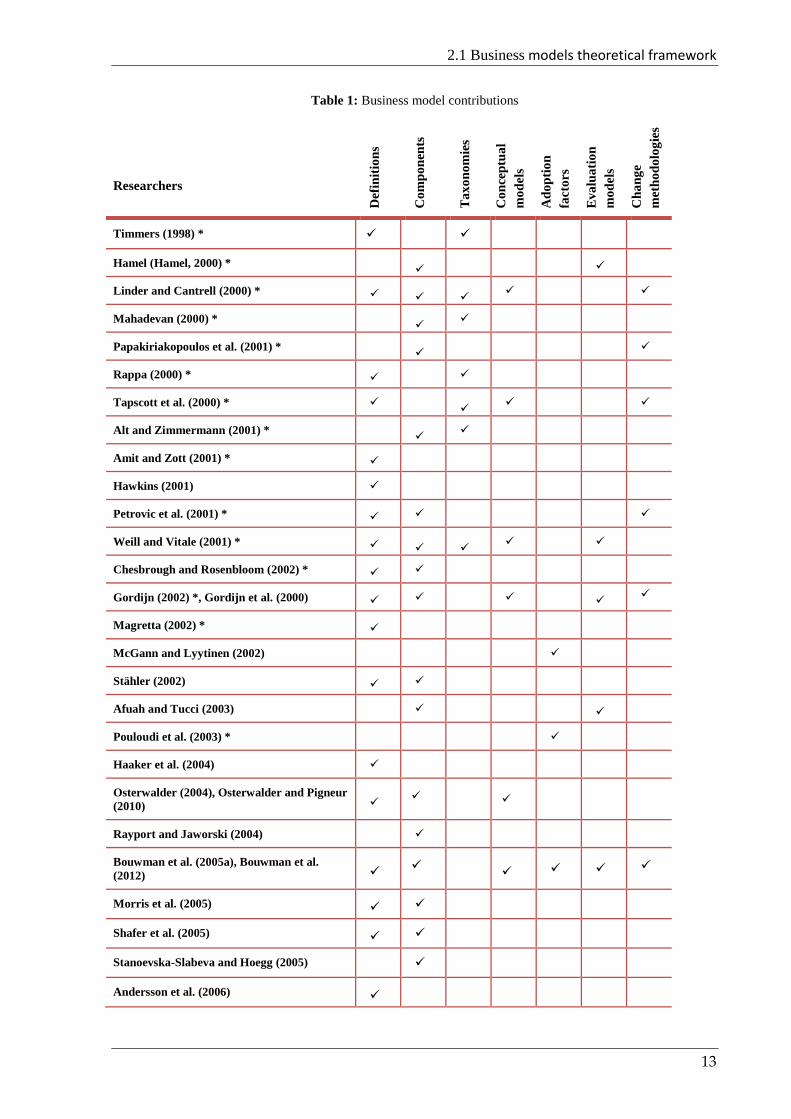
2.1 Business models theoretical framework
13
Table 1: Business model contributions
Researchers
Def
init
ion
s
Co
mp
on
ents
Ta
xo
no
mie
s
Co
nce
ptu
al
mo
del
s
Ad
op
tio
n
fact
ors
Ev
alu
ati
on
mo
del
s
Ch
an
ge
met
ho
do
log
ies
Timmers (1998) *
Hamel (Hamel, 2000) *
Linder and Cantrell (2000) *
Mahadevan (2000) *
Papakiriakopoulos et al. (2001) *
Rappa (2000) *
Tapscott et al. (2000) *
Alt and Zimmermann (2001) *
Amit and Zott (2001) *
Hawkins (2001)
Petrovic et al. (2001) *
Weill and Vitale (2001) *
Chesbrough and Rosenbloom (2002) *
Gordijn (2002) *, Gordijn et al. (2000)
Magretta (2002) *
McGann and Lyytinen (2002)
Stähler (2002)
Afuah and Tucci (2003)
Pouloudi et al. (2003) *
Haaker et al. (2004)
Osterwalder (2004), Osterwalder and Pigneur
(2010)
Rayport and Jaworski (2004)
Bouwman et al. (2005a), Bouwman et al.
(2012)
Morris et al. (2005)
Shafer et al. (2005)
Stanoevska-Slabeva and Hoegg (2005)
Andersson et al. (2006)

Chapter 2 – Business models
14
Researchers
Def
init
ion
s
Co
mp
on
ents
Ta
xo
no
mie
s
Co
nce
ptu
al
mo
del
s
Ad
op
tio
n
fact
ors
Ev
alu
ati
on
mo
del
s
Ch
an
ge
met
ho
do
log
ies
Kallio et al. (2006)
Al-Debei and Avison (2010)
Source: Expanded from Pateli and Giaglis (2004).
We also used the framework to organize the structure of the subsequent sections. Each one
of the identified business model sub-domains resulted in a section of this chapter. We only made
two minor adjustments. The first was based on the reviewed literature, which led us to substitute
the designation “Taxonomy” for “Typology”. The second was merging “Components” and
“Conceptual models” to facilitate reader understanding, due to the strong dependencies between
them.
2.1.1 Definitions
Osterwalder et al. (2005) traced the origins of the business model discussion in scholarly
business journals and obtained results that go back to articles published in 1957 and 1960
(Bellman et al., 1957, Jones, 1960). According to Ghaziani and Ventresca (2005), the public talk
about these topics started in the early 1970s. The term was applied to describe and map business
processes and information and communication patterns within a company for the purpose of
building an information technology system (Stähler, 2002). From the 1990s onwards, the concept
gained relevance in everyday business news and non-academic magazines (Stähler, 2002), and it
has been gathering momentum since then (Zott et al., 2011). Chesbrough and Rosenbloom (2002)
found 107 000 references to the term “business model” searching on the Internet. In 2012, we
found approximately 33 800 000 sources with reference to the term on the Google search engine.
We focused our initial research effort on the clarification of the business model concept in
order to leverage our capacity to understand, cover, explore, and apply it. Numerous definitions
have been outlined. Despite an intuitive understanding that seems to be widespread, a careful
analysis of the expression shows different perspectives and persistent confusion. The concept is
used to describe everything from how a company profits to how it structures itself. For example,
sometimes the concept can be used in perspectives as diverse as: describe coordination
mechanisms in economic processes, discuss intermediation or disintermediation trends, represent
a conceptual and architectural implementation (blueprint) of a business strategy, or address a
particular type of business model. While some authors are intrigued by one particular aspect,
others assign it little significance and concentrate their attention on different features. Even in the
information systems literature, alone, different terms, such as Internet business model (Afuah and
Tucci, 2001), business model in electronic commerce (Mahadevan, 2000), business model on the

2.1 Business models theoretical framework
15
web (Rappa, 2000), and “electronic business model” (Osterwalder, 2004, Horsti, 2007), are used
interchangeably to address the concept.
The lack of consensus around the business model concept made it earn the label of being
the most discussed and least understood aspect on the web (Rappa, 2000, Alt and Zimmermann,
2001). Even today, the community has not been able to form and recognize a universal definition
and the term draws considerably differing opinions on its compositional facets (Al-Debei and
Avison, 2010). Al-Debei and Avison (2010) advanced three reasons for the murkiness around the
business model term. First, the youthfulness of the domain and of its associated research. Second,
the fact that it comes from distinct fields (e.g., computer science, management, and economics),
which provides a variety of analysis lenses. The backgrounds of the researchers influence their
motivations, aims, options, and contributions. This raises difficulties in coordinating efforts or
standardizing notions, but offers different sources of inspiration that can enrich the research.
Third, the newness of sectors within which the concept is being investigated (e.g., mobile
providers).
In Table 2 we present an overview of different definitions available in established
publications in the period 1998-2010 (right and middle column), as well as the main elements
addressed by each of them (right column). Next, we will discuss some of these definitions and
identify similarities and differences among them.

Chapter 2 – Business models
16
Table 2: Business model definitions
Author Business model definition Elements of the
concept
Timmers
(1998)
An architecture for the product, service and information flows, including a
description of the various actors and their roles; a description of the
potential benefits for the various actors; and a description of the sources of
revenues
Business architecture
Business actors/roles
Value proposition
Revenue sources
Business benefits
Gordijn et al.
(2000)
A business model answers the question: “who is offering what to whom
and expects what in return?” It explains the creation and addition of value
in a multi-party stakeholder network, as well as the exchange of value
between stakeholders.
Value proposition
Revenue sources
Network partnerships
Business actors
Linder and
Cantrell
(2000)
The organization’s core logic for creating value. The business model for a
profit-oriented enterprise explains how it makes money
Value proposition
Revenue sources
Business architecture
Rappa (2000) The method of doing business by which a company can sustain itself, that
is, generate revenue. The business model spells out how a company makes
money by specifying where it is positioned in the value chain
Revenue sources
Tapscott et
al. (2000)
A business model is about the invention of new value propositions that
transform the rules of competition, and mobilize people and resources in a
network configuration to unprecedented levels of performance
Value proposition
Network partnerships
Business architecture
Amit and
Zott (2001)
It depicts the content, structure, and governance of transactions so as to
create value through the explosion of new business opportunities
Business architecture
Value proposition
Governance
Hawkins
(2001)
A description of the commercial relationship between a business enterprise
and the products and/or services it provides in the market. More
specifically, it is a way of structuring various, cost and revenue streams
such that a business becomes viable, usually in the sense of being able to
sustain itself based on the income it generates
Market segments
Revenue sources
Petrovic et al.
(2001)
A description of the logic of a “business system” for creating value that
lies behind the actual processes
Value proposition
Business architecture
Weil and
Vitale (2001)
A description of the roles and relationships among a firm’s consumers,
customers, allies and suppliers that identify the major flow of products,
information, and money, and the major benefits to participants
Business architecture
Business actors/roles
Value proposition
Revenue sources
Business benefits
Network partnerships
Chesbrough
and
Rosenbloom
(2002)
A framework that takes technological characteristics and potentials as
inputs, and converts them through customers and markets into economic
outputs
Technological trends
Revenue sources
Business architecture
Market segments
Magretta
(2002)
The business model tells a logical story explaining who your customers
are, what they value, and how you will make money in providing them that
value
Value proposition
Revenue sources
Market segments
Link with strategy
Stähler
(2002)
A model is always a simplification of the complex reality. It helps to
understand the essentials of a business or to plan how a future business
should look. It answers the following 4 questions: What value the business
creates for its stakeholders? - What does it sell? - How and through what
configuration is value created? - With what it is possible to earn money?
Reality simplification
Dynamic nature
Value proposition
Market segments
Business architecture
Revenue sources
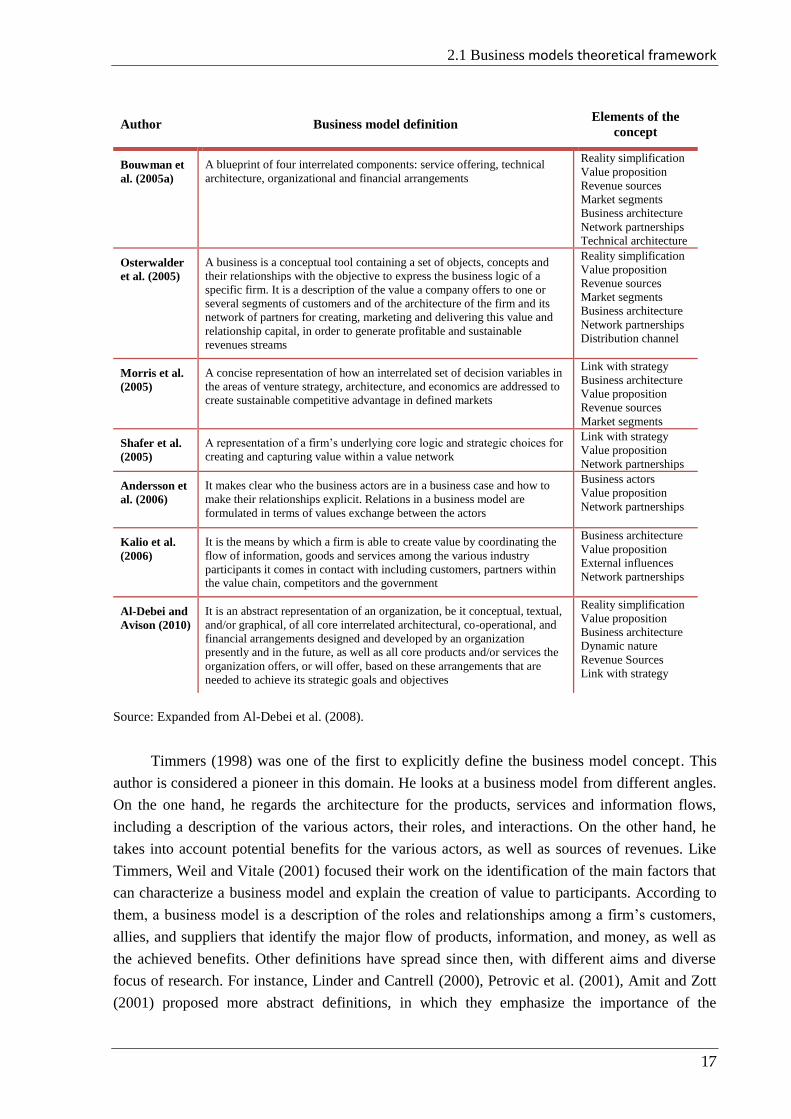
2.1 Business models theoretical framework
17
Author Business model definition Elements of the
concept
Bouwman et
al. (2005a)
A blueprint of four interrelated components: service offering, technical
architecture, organizational and financial arrangements
Reality simplification
Value proposition
Revenue sources
Market segments
Business architecture
Network partnerships
Technical architecture
Osterwalder
et al. (2005)
A business is a conceptual tool containing a set of objects, concepts and
their relationships with the objective to express the business logic of a
specific firm. It is a description of the value a company offers to one or
several segments of customers and of the architecture of the firm and its
network of partners for creating, marketing and delivering this value and
relationship capital, in order to generate profitable and sustainable
revenues streams
Reality simplification
Value proposition
Revenue sources
Market segments
Business architecture
Network partnerships
Distribution channel
Morris et al.
(2005)
A concise representation of how an interrelated set of decision variables in
the areas of venture strategy, architecture, and economics are addressed to
create sustainable competitive advantage in defined markets
Link with strategy
Business architecture
Value proposition
Revenue sources
Market segments
Shafer et al.
(2005)
A representation of a firm’s underlying core logic and strategic choices for
creating and capturing value within a value network
Link with strategy
Value proposition
Network partnerships
Andersson et
al. (2006)
It makes clear who the business actors are in a business case and how to
make their relationships explicit. Relations in a business model are
formulated in terms of values exchange between the actors
Business actors
Value proposition
Network partnerships
Kalio et al.
(2006)
It is the means by which a firm is able to create value by coordinating the
flow of information, goods and services among the various industry
participants it comes in contact with including customers, partners within
the value chain, competitors and the government
Business architecture
Value proposition
External influences
Network partnerships
Al-Debei and
Avison (2010)
It is an abstract representation of an organization, be it conceptual, textual,
and/or graphical, of all core interrelated architectural, co-operational, and
financial arrangements designed and developed by an organization
presently and in the future, as well as all core products and/or services the
organization offers, or will offer, based on these arrangements that are
needed to achieve its strategic goals and objectives
Reality simplification
Value proposition
Business architecture
Dynamic nature
Revenue Sources
Link with strategy
Source: Expanded from Al-Debei et al. (2008).
Timmers (1998) was one of the first to explicitly define the business model concept. This
author is considered a pioneer in this domain. He looks at a business model from different angles.
On the one hand, he regards the architecture for the products, services and information flows,
including a description of the various actors, their roles, and interactions. On the other hand, he
takes into account potential benefits for the various actors, as well as sources of revenues. Like
Timmers, Weil and Vitale (2001) focused their work on the identification of the main factors that
can characterize a business model and explain the creation of value to participants. According to
them, a business model is a description of the roles and relationships among a firm’s customers,
allies, and suppliers that identify the major flow of products, information, and money, as well as
the achieved benefits. Other definitions have spread since then, with different aims and diverse
focus of research. For instance, Linder and Cantrell (2000), Petrovic et al. (2001), Amit and Zott
(2001) proposed more abstract definitions, in which they emphasize the importance of the
Chapter 2 – Business models
18
business value propositions. Others, like Rappa (2000) and Hawkins (2001), essentially covered
financial elements of the value propositions, due to their importance to the business model
sustainability. This emphasis on the economic dimension is usually associated with the search for
competitive advantage.
The relationship between business models and strategy was reinforced by Shafter, Smith,
and Linder (2005) and Morris et al. (2005), who integrated the notion of strategic choice into the
definition of the business model concept. Osterwalder and Pigneur (2002) adopted a different
view. They positioned business models as the link between strategy and business processes. These
authors argue that business models can work as a shared and common understanding of the
domain that facilitates communication between people, in order to guarantee a smooth strategy
execution.
In their research on business models, Linder and Cantrell (2000), Magretta (2002),
Chesbrough and Rosenbloom (2002), and Stähler (2002) also contributed in distinguishing the
difference between business models and strategy. Magretta (2002) offers a more process-oriented
perspective: “a story that explains how an enterprise works”. This author argues that business
models describe how the pieces of a business fit together, but, unlike strategy, do not factor in one
critical dimension of performance: competition. Chesbrough and Rosenbloom (2002) underline
that the business model puts more focus on customers and how to deliver them value, while
strategy addresses more macro-level issues (e.g., creation of value for shareholders). In turn,
Linder and Cantrell (2000) underline that strategy should communicate how the change in the
business model is intended to take advantage of shifting markets and new opportunities. Stähler
(2002) also gave input on the relationship between business and strategy and showed how a
deliberate change or an innovation in a business model can be strategic. This author also
introduced another role assigned to the business model; he emphasized the idea that a model is a
simplification of the complex reality, which helps understand the business or plan how it should
be conceptualized and performed.
In their definitions, researchers like Rappa (2000) and Osterwalder (2004) address the
business model of a particular entity (e.g., a company). Others emphasize the relevance and
impact of the network configuration (Tapscott et al., 2000, Amit and Zott, 2001, Haaker et al.,
2006, Kallio et al., 2006, Andersson et al., 2006). For instance, Tapscott et al. (2000) introduced
the idea of business webs, which include not only the organization itself, but its partners (e.g.,
suppliers, distributors, commerce service providers, and infrastructure providers). The established
network gathers entities from distinct sectors, with diverse interests, which can contribute to the
business web achievements.
More recently, detailed working definitions (which point out what constitutes a business
model) were proposed and used as the basis for the development of more comprehensive
frameworks (Gordijn, 2002, Osterwalder et al., 2005, Bouwman et al., 2005a, Bouwman et al.,
2005b). The latter two contributions also highlight the role of technology, which had also been be
done by Chesbrough and Rosenbloom (2002), reflecting the importance of the authors contexts in
their research (all have maintained strong connections with the information systems domain). For
instance, Bouwman et al. (2008c) focus their attention on provided services.

2.1 Business models theoretical framework
19
In our approach, we mainly address business model scenarios in network configurations
supported by information and communication technologies. However, our scope is broader than
pure play Internet business models. When setting the boundaries of the business model we also
consider offline presences, since some of their behaviors can have severe implications on the
network. For instance, a brick-and-mortar company can control the access to an asset essential to
the network, whose absence can compromise its goals. We consider that an electronic business (e-
business) is just one more type of business. For this motive, when in the future the term “business
model” is applied in this document, it will concern business models that are largely supported by
the Internet, but that can also consider offline activities. This option is supported by Hamel
(2000), who claims that thinking about “e” as a pure play business model is not the right way to
look at it. Or by Rayport (1999), who claims that “In the end, an e-business is just another
business”.
Business models are subject to a set of influences (e.g., unexpected economic scenarios,
market issues, regulatory trends, or social, political, and organizational issues) that boost their
dynamic nature. The relationships in network configurations enclose a level of complexity that
amplifies this dynamics. We not only have to take into account the external factors at a certain
moment, but also manage the delicate balance among the individual expectations of the business
models’ participants and the overarching aims of the network. Authors like Stähler (2002) and Al-
Debei et al. (2008) emphasize the dynamic nature of the business models in their definitions.
However, it is not one of the aspects more discussed in the definitions. The same applies to the
external influences that may affect business models.
The elements identified in the right column of Table 2 are presented in an alternative
configuration in Figure 1. Our aim is to outline the topics usually mentioned in the literature and,
at the same time, we indicate and emphasize (through larger font sizes) the ones that appear more
frequently. Through the performed analysis, we confirmed the diversity of definitions and how
they differ significantly in scope. Even so, it was possible to detect common denominators, as we
will detail.
Figure 1: Elements to cover when studying business models
Most definitions covered value proposition issues, with two different approaches: the way
an organization creates value, with its partners, for its customers; and how an organization,
Chapter 2 – Business models
20
together with its stakeholders, creates value for each party involved (Al-Debei and Avison, 2010).
We also detected many references to the business architecture, which discusses the required
resources and capabilities of a firm to implement a business model, including its technological
architecture, organizational infrastructure, and their configurations. Many definitions also assign
relevant importance to the business network, which clarifies how the various stakeholders interact
with each other, the performed roles, and how value is exchanged. We note that organizations are
not the only ones included in the network. For instance, customers also have a key role
(Chesbrough and Rosenbloom, 2002, Osterwalder et al., 2005). The presented definitions also
address the earnings logic, showing the importance of explaining how the firms expect to generate
revenues from their activities. Like Allee (2000) and Al-Debei and Avison (2010), we consider
that financial aspects represent an important dimension of the created value, however it is not the
only one. Ultimately, the object of study can be a not-for-profit business model. We argue that to
gather a broader perspective of the business model we must consider flows like data, prestige,
influence, or social responsibility. Taking into account our research aims, we also assigned a main
role to technological aspects of the business model and to how its context can influence it.
In the available definitions of the business model concept, we can notice the influence of
different contexts and the impact of distinct purposes, as well as the difficulty in capturing its
holistic perspective. This gap reinforces the importance of this review, since it allowed us to
obtain clues of business model’s elements that can be integrated in our approach. Nevertheless, to
obtain a comprehensive perception of the domain it is also important to clarify the available
business models. To make this clear, several authors classified and grouped them into specific
categories based on a set of criteria. These categories are usually designated by typologies, and
will be described in the next section.
2.1.2 Typologies
Typologies identify, describe, and cluster the plethora of perceived business models, mainly
enabled by Internet, into different groups (Zott et al., 2011). Due to their higher level of
abstraction, they make the discussion, understanding, and communication on business models
easier than definitions or components.
The ongoing research concerning business model has proposed several typologies,
sometimes in slightly modified or more detailed versions. Similarly to business model definitions,
the variety of available classifications causes misunderstandings and increases difficulties in
building a unique and coherent picture. Each business model typology has its own categorization
criteria, consistent with the perspectives of its authors, neglecting, in most cases, the literature on
business model and the possibility to reuse and consolidate the existing classifications. In general,
the available typologies are essentially lists of business activities, which are described by formless
narratives, or through the use of a few variables that regard specific viewpoints (Lambert, 2006).
Even the designations assigned by the researchers to name their work differ considerably
and illustrate the lack of standardization. For instance, some use the term “typology”, others
“taxonomy”, “classification”, “classification scheme”, or “operating business models”. According
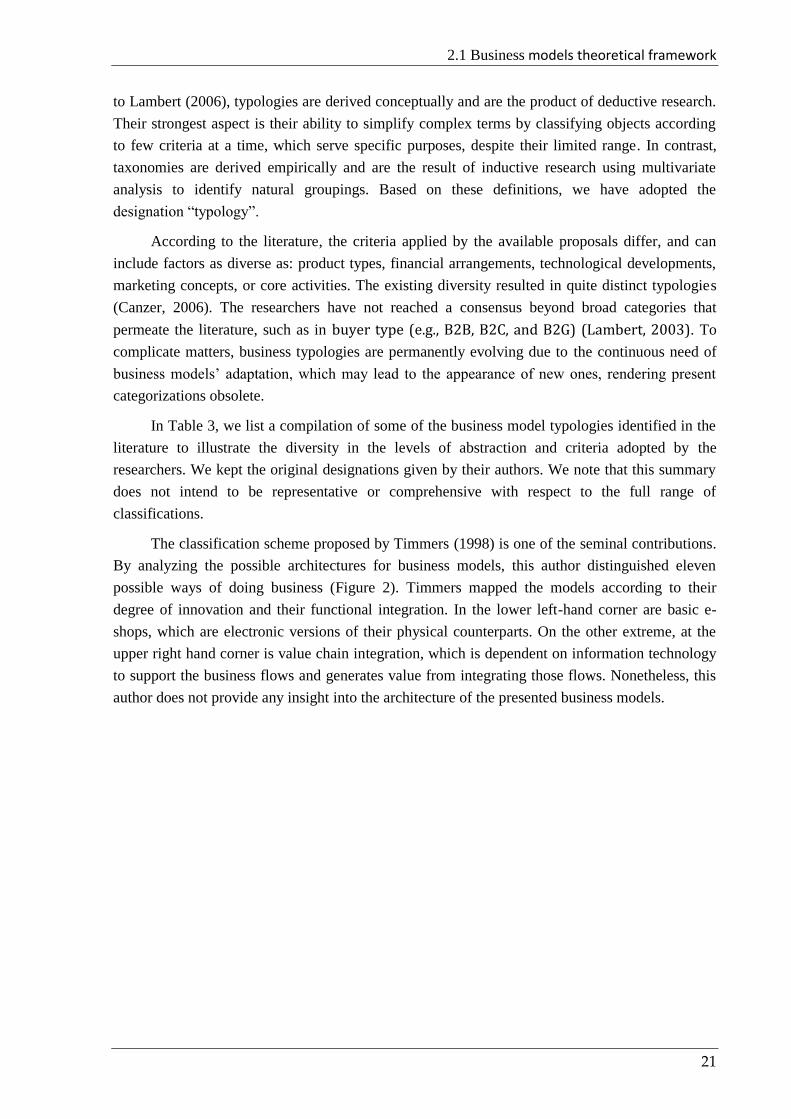
2.1 Business models theoretical framework
21
to Lambert (2006), typologies are derived conceptually and are the product of deductive research.
Their strongest aspect is their ability to simplify complex terms by classifying objects according
to few criteria at a time, which serve specific purposes, despite their limited range. In contrast,
taxonomies are derived empirically and are the result of inductive research using multivariate
analysis to identify natural groupings. Based on these definitions, we have adopted the
designation “typology”.
According to the literature, the criteria applied by the available proposals differ, and can
include factors as diverse as: product types, financial arrangements, technological developments,
marketing concepts, or core activities. The existing diversity resulted in quite distinct typologies
(Canzer, 2006). The researchers have not reached a consensus beyond broad categories that
permeate the literature, such as in buyer type (e.g., B2B, B2C, and B2G) (Lambert, 2003). To
complicate matters, business typologies are permanently evolving due to the continuous need of
business models’ adaptation, which may lead to the appearance of new ones, rendering present
categorizations obsolete.
In Table 3, we list a compilation of some of the business model typologies identified in the
literature to illustrate the diversity in the levels of abstraction and criteria adopted by the
researchers. We kept the original designations given by their authors. We note that this summary
does not intend to be representative or comprehensive with respect to the full range of
classifications.
The classification scheme proposed by Timmers (1998) is one of the seminal contributions.
By analyzing the possible architectures for business models, this author distinguished eleven
possible ways of doing business (Figure 2). Timmers mapped the models according to their
degree of innovation and their functional integration. In the lower left-hand corner are basic e-
shops, which are electronic versions of their physical counterparts. On the other extreme, at the
upper right hand corner is value chain integration, which is dependent on information technology
to support the business flows and generates value from integrating those flows. Nonetheless, this
author does not provide any insight into the architecture of the presented business models.
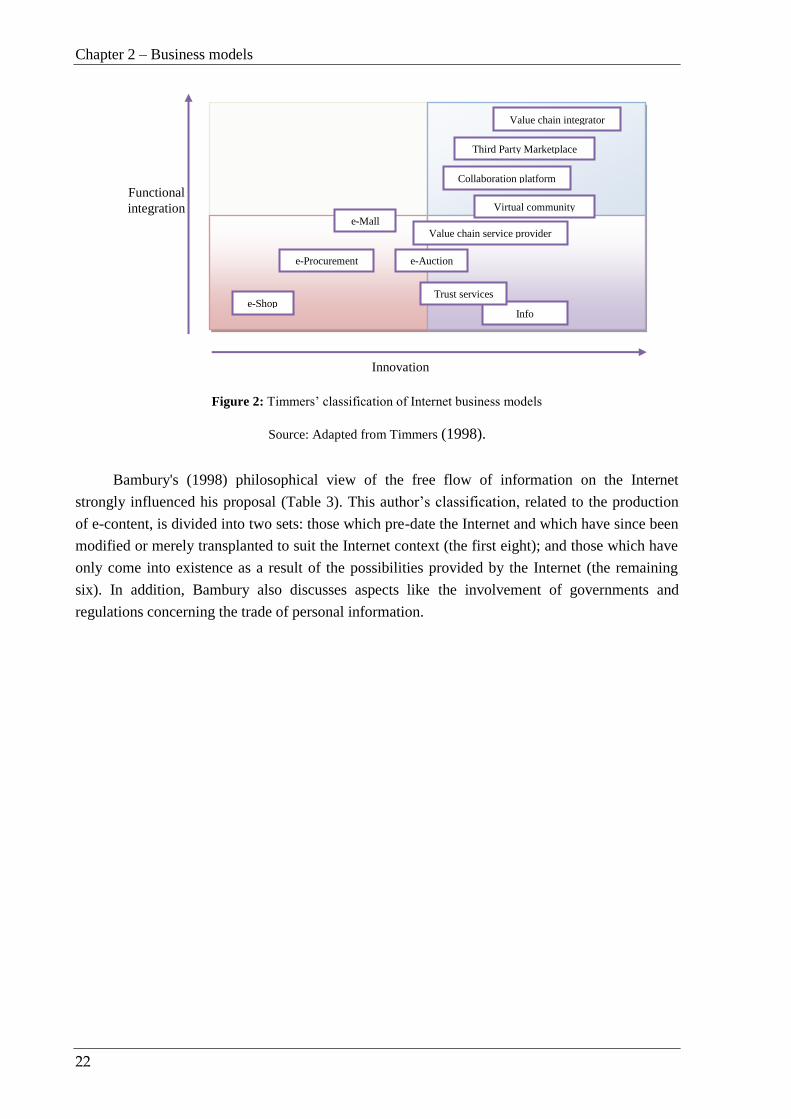
Chapter 2 – Business models
22
Figure 2: Timmers’ classification of Internet business models
Source: Adapted from Timmers (1998).
Bambury's (1998) philosophical view of the free flow of information on the Internet
strongly influenced his proposal (Table 3). This author’s classification, related to the production
of e-content, is divided into two sets: those which pre-date the Internet and which have since been
modified or merely transplanted to suit the Internet context (the first eight); and those which have
only come into existence as a result of the possibilities provided by the Internet (the remaining
six). In addition, Bambury also discusses aspects like the involvement of governments and
regulations concerning the trade of personal information.
e-Shop
e-Procurement
e-Mall
e-Auction
Info
Brokerage
Trust services
Value chain service provider
Virtual community
Collaboration platform
Third Party Marketplace
Value chain integrator
Innovation
Functional
integration

2.1 Business models theoretical framework
23
Table 3: Business model classifications
Description of business model classifications
Tim
mer
s’ (
19
98
) cl
ass
ific
ati
on
e-Shop Allows web marketing. It aims to promote the organization and its goods or services. Increasingly added is the possibility to order and to pay
e-Procurement Consists in electronic tendering and procurement of goods and services. It permits a wider choice of suppliers, which can lead to better conditions
e-Auction Offers an electronic implementation of the bidding mechanism. Usually this function is integrated with contracting, payments, and delivery features
e-Mall Consists of a collection of e-shops, usually enhanced by a common umbrella
3rd party marketplace Suits situations where companies wish to leave the web marketing to a 3rd party (possibly as an add-on to their own channels)
Virtual communities Describes models that obtain value from the actions of its members (customers or partners). Can be an important add-on to other marketing operations
Value chain service provider Specializes on a particular function for the value chain, such as electronic payment, with the intention to make that into their competitive advantage
Value chain integrators Represents the companies that focus on integrating multiple steps of the value chain
Collaboration platforms Provides a set of tools and an information environment for collaboration among enterprises
Information brokerage Gathers a range of services to add value to the huge amount of data available on the open networks or coming from integrated business operations
Trust and other services Embraces a special type of services, the ones provided by certification authorities, electronic notaries, and other trusted third parties
Ba
mb
ury
's (
19
98
) cl
ass
ific
ati
on
sch
eme
Mail-order A web site shop front is employed to sell physical goods which are then posted or delivered
Advertising The advertising revenues support the operation of a free service
Subscription Subscribes of a digital service for a specified period of time
Free trial A service is available for free but will only work for a limited period or will not be fully functional until a fee is paid
Direct marketing A product advertising is performed through the use of a personal electronic e-mail
Real estate Sell web features like: domain names and e-mail addresses
Incentive schemes Offers a benefit to entice customers to have a certain behavior
Business to business Entails the business relationships between companies via the Internet
Combinations Combines various business models
Library Offers free information
Freeware Provides the free access to services
Information barter Involves some sort of exchange of information over the Internet between individuals and companies
Digital products and delivery Covers digital products’ transactions
Access provision Includes activities that support Internet access
Web site hosting and other
Internet services
Provides services such as hosting web services, electronic mail and re-direction services

Chapter 2 – Business models
24
Description of business model classifications L
ind
er a
nd
Ca
ntr
ell’
s (2
00
0)
ov
erv
iew
of
op
era
tin
g b
usi
nes
s
mo
del
s Price Includes several options to charge clients (e.g., round up buyers with attractive prices and use purchase volume to gain discounts)
Convenience Provides propitious conditions to promote a product/service (e.g., attract busy buyers who will pay a premium for convenience)
Commodity-plus Explores useful items that can be turned into commercial advantage (e.g., predictable commodity service wins customers who pay a small price)
Experience Offers special conditions of access and interaction (e.g., use a carefully designed environment to attract customers who pay premium prices)
Channel Characterizes the means used to access and communicate with customers (e.g., focus on particular target audience or provide expert advice about how to
use items effectively)
Intermediary Describes models in which an entity acts as a mediator (e.g., use appealing content to draw the attention of an audience in order to convert that attention
to advertising)
Trust Provides services to nurture the users’ expectations and earn their confidence (e.g., fault-tolerant systems and security mechanisms)
Innovation Offers unique services (e.g., use research and development skills and explore opportunity identification)
Wei
ll a
nd
Vit
ale
‘s
(200
1)
typ
olo
gy
of
ato
mic
bu
sin
ess
mo
del
s
Content provider Distributes contents (information, products, or services) in digital form to users, via intermediaries
Direct to consumer Establishes direct interaction among customers and providers, frequently bypassing traditional channels members
Full service provider Offers a full range of services in a specific domain that demands multiple services or products (e.g., financial services and health care)
Intermediary Concentrates information that allow to link buyers and sellers
Shared infrastructure Brings together competitors through the use of a common information technology infrastructure, which allows the development of collaborations
Value net integrator Coordinates flows among the business elements by gathering, synthesizing, and distributing information
Virtual community Creates and facilitates an online community. Frequently its members share a common interest and provide support to each other
Whole of
enterprise/government
Provides a single point of contact for the business customer, consolidating all the services provided by an organization (this model plays an important
role in the public sector)
Ra
pp
a’s
(2
00
0)
taxo
nom
y o
f b
usi
nes
s
mo
del
s
Brokerage Encompasses online marketplaces in which buyers and sellers are brought together to facilitate transactions. Usually a broker charges a fee or
commission for each transaction
Advertising Provides content or services mixed with advertising (e.g., portal, and Content-Targeted Advertising)
Infomediary Gathers data about producers, products, consumers, and their habits. This information can be sell/used to assist buyers/sellers in understanding a given
market
Merchant Encloses wholesalers and retailers of goods and services. Their sales may be made based on list prices or through auction (e.g., virtual merchant, click
and mortar)
Manufacturer (direct) Uses Internet diffusion capabilities to allow a manufacturer to reach buyers directly and thereby reduce intermediaries (e.g., purchase and lease)
Affiliate Supply purchase opportunities by offering financial incentives to affiliate partners. The affiliates provide purchase-point-click-through to the merchant
(e.g., pay-per-click)
Community Relies on users’ participation to achieve its viability. Revenues can be based on advertising, subscriptions or contributions
Subscription Charges the users with a periodic fee (for instance, daily, monthly or annual) to subscribe a service
Utility Employs a metering usage. Unlike subscriber services, it is based on actual usage rates. For instance, some Internet service providers charge customers
for connection minutes

2.1 Business models theoretical framework
25
Description of business model classifications O
ster
wa
lder
an
d P
ign
eur’
s
(201
0)
pa
tter
ns Unbundling Separates three types of businesses: “customer relationships”, “product innovation”, and “infrastructure” into separate entities (they may co-exist within
a single organization)
Long tail Provides a wide range of niche products, each of which sells quite occasionally. It is supported by strong-platforms to make content readily available
Multi-sided platforms Merges two or more distinct, but interdependent, groups of customers. It depends on the extent it attracts more users
Free Offers free services to at least one customer segment. Non-paying customers are financed by others
Open Open the companies’ research process and promotes collaborations with outside partners
Jo
hn
son
’s (
201
0)
bu
sin
ess
mo
del
an
alo
gie
s
Affinity club Offers exclusive membership advantages. It exchanges royalties for access to a larger customer base
Brokerage Promotes transactions between buyers and sellers. It charges a fee on successful transactions
Bundling Simplifies complex transactions by packing together related products
Cell phone Sells a service through multiple plans (different prices, dependent on the type of use)
Crowd sourcing Outsources content construction to a broad group in exchange for access to other users’ content
Disintermediation Delivers directly a product or a service to customers, removing usual intermediaries
Fractionalization Allows users to pay just a part of the product or service, but get full use if necessary
Freemium Offers basic services for free, but charges premium ones
Leasing Makes expensive products affordable by having the customer rent rather than buy them
Low-touch Provides low-cost, self-service version in place of a traditionally high-end offering
Negative operating cycle Maintains low inventory and receives item payment up front
Pay-as-you-go Charges customers for metered services according to actual usage rates
Razor/blades Offers expensive items for low or no cost, creating tied market for consumables
Reverse auction Sets a ceiling price and allows bidding downward
Reverse razor/blades Provides low-cost or free consumables to sell high-margin products
Product-to-service Sells the services that a product performs, rather than sell the product outright
Standardization Provides low-cost standardized solutions instead of high-cost customized ones
Subscription club Charges a subscription fee to gain access to a product or service
User communities Manages a network, granting revenue through membership fees or advertisements
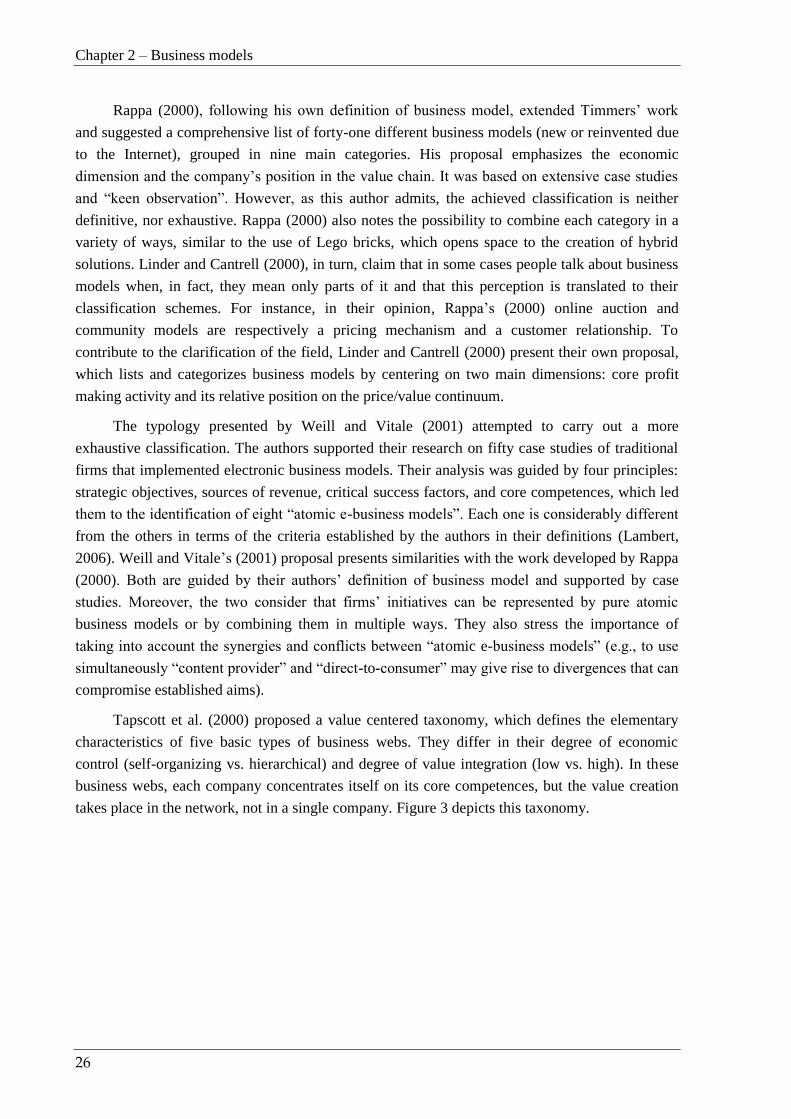
Chapter 2 – Business models
26
Rappa (2000), following his own definition of business model, extended Timmers’ work
and suggested a comprehensive list of forty-one different business models (new or reinvented due
to the Internet), grouped in nine main categories. His proposal emphasizes the economic
dimension and the company’s position in the value chain. It was based on extensive case studies
and “keen observation”. However, as this author admits, the achieved classification is neither
definitive, nor exhaustive. Rappa (2000) also notes the possibility to combine each category in a
variety of ways, similar to the use of Lego bricks, which opens space to the creation of hybrid
solutions. Linder and Cantrell (2000), in turn, claim that in some cases people talk about business
models when, in fact, they mean only parts of it and that this perception is translated to their
classification schemes. For instance, in their opinion, Rappa’s (2000) online auction and
community models are respectively a pricing mechanism and a customer relationship. To
contribute to the clarification of the field, Linder and Cantrell (2000) present their own proposal,
which lists and categorizes business models by centering on two main dimensions: core profit
making activity and its relative position on the price/value continuum.
The typology presented by Weill and Vitale (2001) attempted to carry out a more
exhaustive classification. The authors supported their research on fifty case studies of traditional
firms that implemented electronic business models. Their analysis was guided by four principles:
strategic objectives, sources of revenue, critical success factors, and core competences, which led
them to the identification of eight “atomic e-business models”. Each one is considerably different
from the others in terms of the criteria established by the authors in their definitions (Lambert,
2006). Weill and Vitale’s (2001) proposal presents similarities with the work developed by Rappa
(2000). Both are guided by their authors’ definition of business model and supported by case
studies. Moreover, the two consider that firms’ initiatives can be represented by pure atomic
business models or by combining them in multiple ways. They also stress the importance of
taking into account the synergies and conflicts between “atomic e-business models” (e.g., to use
simultaneously “content provider” and “direct-to-consumer” may give rise to divergences that can
compromise established aims).
Tapscott et al. (2000) proposed a value centered taxonomy, which defines the elementary
characteristics of five basic types of business webs. They differ in their degree of economic
control (self-organizing vs. hierarchical) and degree of value integration (low vs. high). In these
business webs, each company concentrates itself on its core competences, but the value creation
takes place in the network, not in a single company. Figure 3 depicts this taxonomy.
2.1 Business models theoretical framework
27
Figure 3: Business web taxonomy
Source: Adapted from Tapscott et al. (2000).
The five basic types of business webs are Tapscott et al. (2000):
Agora - illustrates markets where buyers and sellers meet to freely negotiate item
values. It facilitates exchanges between buyers and sellers (e.g., as in eBay). Since
sellers may offer a wide and often unpredictable variety and quantity of goods, its value
integration is low.
Aggregation – addresses scenarios where one company leads, positioning itself as a
value-adding intermediary between producers and customers. It takes the responsibility
for selecting items, targeting market segments, setting prices, and ensuring fulfillment
(e.g., Amazon). It offers a variety of items and its value integration is low.
Value Chain – represents a context provider that structures and directs the business web
to produce a highly integrated value proposition (e.g., Cisco).
Alliance - strives for high value integration without hierarchical control. Its participants
collaborate and share experiences. Alliances usually depend on rules that govern
interactions, the behavior of the participants, and the determination of value.
Distributive Network - serves the other types of business webs by allocating and
delivering goods – whether information, objects, money, or resources - from providers
to users. The more customers use the network, the more value it provides to them.
Weil et al. (2005) decided to analyze the effect of applying a particular business model to
the financial performance of companies to derive implications. To answer this challenge, they
developed and applied a typology to classify the business models of the top 1000 firms in the US
economy in the year 2000, based on two fundamental dimensions. The first considers what types
of rights are being sold and comprises the following scenarios: creator (buys raw materials or
components from suppliers and then transforms or assembles them to create a product); distributor
(buys a product and resells essentially the same product to someone else); landlord (sells the right
to use an asset, but not to own it); and broker (facilitates sales by matching potential buyers and
sellers). The second dimension accounts for the type of assets involved. Four important
Agora
Low High
Co
ntr
ol
Self-organizing
Hierarchical
Alliance
Value chain Aggregation
Distributive network
Value integration

Chapter 2 – Business models
28
classifications are distinguished: physical, financial, intangible, and human. The outcome shows
that some business models do indeed perform better than others, thereby demonstrating the value
of the business model at use. For instance, in most cases the right to use assets was more
profitable and more highly valued by the market than selling ownership of assets. This
information emphasizes the relevance of choosing the correct business model.
As we have shown, in the early 2000s the classification of business models received several
contributions. Despite the evident lack of consensus, the existing ones provided an awareness of
possible business models and improved the perception of possible typologies. The descriptive
nature of the developed work made it easy to comprehend and transmit the meaning and relevance
of a business model. Furthermore, the achieved range of classifications aided to discuss and
perceive their scenarios, supporting the business model design and innovation. In the following
years, the research focal point has changed from developing taxonomies that enlist and describe
various generic business models to identifying their different constituent components and the
relationships among them. However, a decade later, Osterwalder and Pigneur (2010) and Johnson
(2010) underlined the role that can be assigned to classifications as jump-starts of a creative
business model process of discussion. They used them as patterns that can be explored in different
contexts to converge into a solution able to pursue the aims of a particular business model. Both
authors reflect the already detected diversity of classifications, the current trend to explore
collaborations among business partners, the offering of basic services for free and the charge of
premium ones, the use of subscriptions or fees, and advertisement. The ability to explore business
models for monetizing Internet applications has also been considered a point of interest for
scholars (Zott et al., 2011). A clear and timely example of the relevance of this topic is the
difficulty Facebook is facing in convincing the markets of its ability to monetize almost a billion
users (Ortutay, 2012).
Business model classification is a challenge for future research. It can help to disclose
possible business variables fundamental to perform their categorization and aid in the
development of a framework to compare the different business models, as it was performed in
Weill et al. (2005). However, a general classification, a holistic and exhaustive taxonomy is yet to
be defined (Pateli and Giaglis, 2004, Keen and Qureshi, 2006, Lambert, 2006). Most of the
available proposals are unstructured and appear to be developed in an ad hoc manner, with no
direct reference to the business model attributes proposed by the respective authors (Lambert,
2003). For instance, Bamburry (1998) described some classifications using an unstructured
narrative. Others meet the requirements of a systematically constructed business model typology,
suitable as basis for deductive, empirical research, based on a small number of variables. This is
the case of Timmers (1998), Linder and Cantrell (2000), and Tapscott et al. (2000), who use two
criteria, while Weill and Vitale (2005), for example, use four.
This field does not share common guidelines and its evolution is not sufficiently integrated
and supported by the outcomes of other business model sub-domains. Due to its fuzziness, it is
difficult to establish a criterion to determine when a particular business model is indeed a
category. Business model definitions, as well as business model components and frameworks can
aid to define aspects to consider in this decision. In the next section, we will address components.

2.1 Business models theoretical framework
29
2.1.3 Conceptual models and their components
Business model components, also known as “functions”, “elements”, “attributes”, or
“building blocks” are closely related to the business model definitions and describe what a
business model is made off. Their identification and detailed description shed some light on how
they can be assembled in new arrangements and support the creation and development of original
business models. Similar to business model classifications, they can assist managers in
understanding the scenarios of their companies and possible alternatives.
The components identified in the literature do not only differ with respect to their
abstraction level, but also in their scope and elaboration. Some consist of an enumerated list,
while others evolved to conceptual models that address the relationships among components. To
outline the research progress we will start to discuss the enumerated lists.
As in the above sub-domains, we detected a lack of consensus on the key components to
address in a business model. For instance, Morris et al. (2005) identified twenty-four, while in a
similar study Shafer et al. (2005) pointed out forty-two. Despite the differences, there is one
overarching aspect that unifies the available proposals - each component can be viewed as a
building block of the companies’ business plans for creating value. Next, we will discuss some of
the most popular proposals published in reference journals or books, or with specific
characteristics of interest for our research.
2.1.3.1 Enumerated lists and representations
Due to the wide acceptance of Timmers’ (1998) business model definition, several authors
used it to identify business model components or as a foundation to develop their own definitions,
which subsequently led to their proposals. We chose three contributions to illustrate this line of
research: Papakiriakopoulos et al. (2001), Stanoevska-Slabeva and Hoegg (2005), and Stähler
(2002), which we detail in Table 4. All have in common the adoption of a network-centric
perspective.
Papakiriakopoulos et al. (2001) proposed four components: coordination, cooperation-
competition, customer value, and core competences. These authors focused on identifying actors
and understanding their relationships, as well as on coordination mechanisms to manage the
dependencies between the business resources and activities. In this work, a relevant role is also
assigned to customers, since its authors intend to consider how their needs influence the products
and services provided by the network. In a similar way, Petrovic et al. (2001), and Stanoevska-
Slabeva and Hoegg (2005) also proposed components to address customers’ characteristics and
expectations. These components integrate marketing specific issues into the business model
frameworks in order to support the selection of a suitable environment for the business model
operations. Furthermore, they aid in the management of customer relationships (how to reach,
serve, and maintain their presence).
By following an integrative perspective, Stähler (2002) identified four components that are
a direct outcome of the questions introduced by this author in his business model definition (Table

Chapter 2 – Business models
30
4). Like Timmers (1998), Stähler (2002) defined components for products or services, value
architecture, and the revenue model. In addition, he identified a fourth component: “value
proposition”. This author was one of the first to assign the designation “value proposition” to the
value an entity gains from the business model (it concentrates on the customer needs, but also on
the requirements of network peers). In turn, the work developed by Stanoevska-Slabeva and
Hoegg (2005) revealed less explored perspectives of the business models. Supported by the
outcomes of their work on generic components for mobile data services, they added to
Timmers’(1998) proposal two components: “medium” and “societal environment”. The former
establishes a direct connection with technological resources that can be used by the business
model, while the latter reflects its external influences.
Afuah and Tucci (2003) also addressed a value-centered perspective (Table 4), but in a line
of research different from the one adopted by Timmers (1998). They emphasized monetary
aspects, which led them to define components, such as revenue sources (it clarifies questions like
“Where do the dollars come from?”), sustainability (takes into account what a firm must do to
sustain any advantage), and cost structure (expresses the relationships between revenues and the
costs of generating those revenues). According to the authors, the success of the business model
depends not only on these key components, but also on how well the links among them work.
They also portrayed technology and the environment of a firm as influencing factors, which urges
organizations to be always ready to be reinvented, highlighting their changeability.
In a similar vein, Mahadevan (2000) and Rayport and Jaworski (2004) identified
components such as value proposition, revenue generation, market segments, and resource
systems. The same happened with Chesbrough and Rosenbloom (2002). However, these latter
authors made a clear connection with strategy, proposing a component to address the firm’s
competitiveness. Due to clear similarities with aspects of the proposals presented above and their
proximity to strategy (which is outside the scope of our work), these contributions were not
described in detail.

2.1 Business models theoretical framework
31
Table 4: Business model components
Author Description of business model components
Papakiriakop
oulo et al.
(2001)
Coordination Manages dependencies that reflect the interconnections between the resources
and the activities
Cooperation -
competition
Describes the relationships among companies which can be of competition, or
cooperation, or both at the same time
Customer value Aligns the business model with the market and customers needs
Core competence Identifies the specific skills and cognitive traits directed towards the attainment
of the highest possible levels of customer satisfaction
Stähler
(2002)
Value proposition Describes the benefits and therefore the value a customer or a value partner
gains from the business model
Product or service Is the link between the firm and the customer
Value architecture Delineates the value chain, the economic agents that participate in the value
creation and their roles. Comprises aspects like market design, and internal and
external value architecture
Revenue model Describes the basis and the sources of income for the firm
Stanoevska-
Slabeva and
Hoegg (2005)
Product/Service Comprises the actual design of a product or service, the way it is perceived and
consumed by the customers and the value proposition for the customer
Medium Defines possibilities for interaction via certain media among the stakeholders of
a business model from a technical point of view
Customers Refers to the target groups of an offered product or service and to their needs
Value chain Reflects all the players involved in the creation of value and their relationships
Financial flow Describes the financial transactions among different stakeholders
Flow of goods and
services
Describes the stakeholders’ activities that are essential for the creation of the
product or service
Societal
environment
Reflects relevant outside influences on a business model (e.g., legal aspects and
competitive situation)
Afuah and
Tucci (2003)
Customer value Differentiates the offered value from competitors’ value
Scope Approaches the market segments to which the value is being offered and the
range of services that embody that value
Pricing Regards the pricing strategy
Revenue sources Determines the revenue sources
Connected
activities
The activities a firm must perform to underpin the value it offers
Implementation Consists in carrying out the decisions made in the different elements
Capabilities It covers resources, competences, and competitive advantage
Sustainability Addresses what a firm must do to sustain any advantage
Cost structure Expresses the relationships between revenues and the costs of generating those
revenues
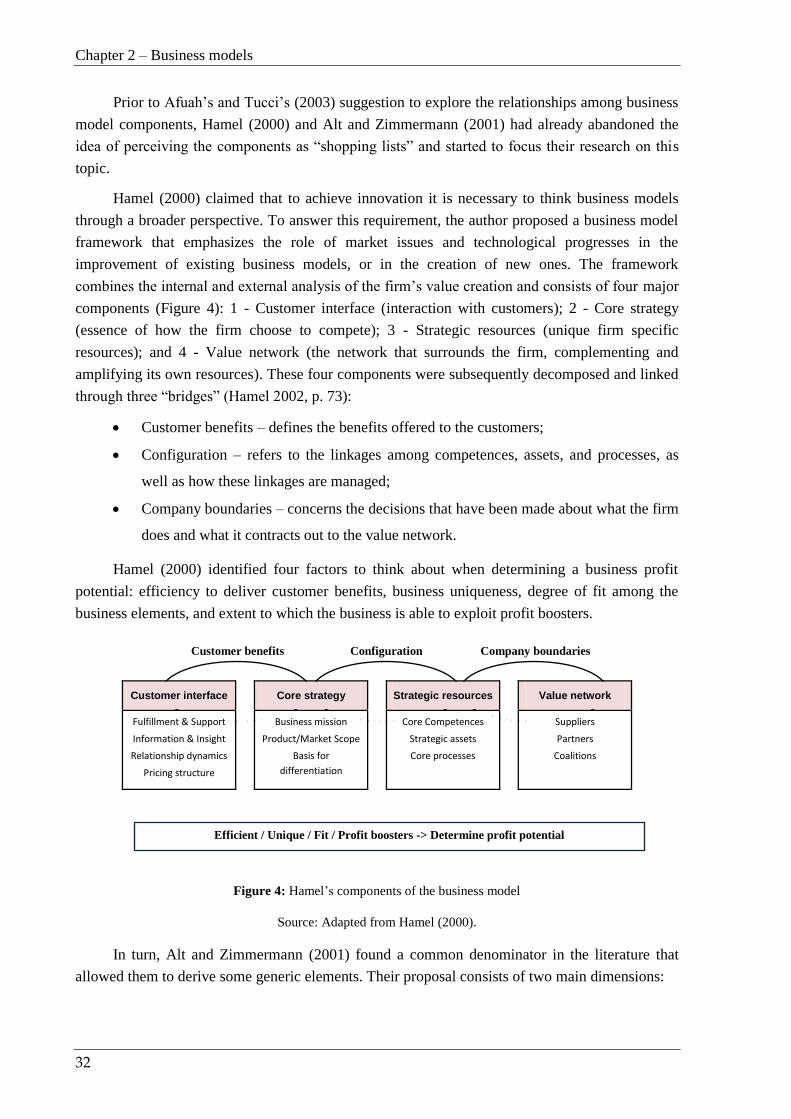
Chapter 2 – Business models
32
Company boundaries Configuration Customer benefits
Efficient / Unique / Fit / Profit boosters -> Determine profit potential
Prior to Afuah’s and Tucci’s (2003) suggestion to explore the relationships among business
model components, Hamel (2000) and Alt and Zimmermann (2001) had already abandoned the
idea of perceiving the components as “shopping lists” and started to focus their research on this
topic.
Hamel (2000) claimed that to achieve innovation it is necessary to think business models
through a broader perspective. To answer this requirement, the author proposed a business model
framework that emphasizes the role of market issues and technological progresses in the
improvement of existing business models, or in the creation of new ones. The framework
combines the internal and external analysis of the firm’s value creation and consists of four major
components (Figure 4): 1 - Customer interface (interaction with customers); 2 - Core strategy
(essence of how the firm choose to compete); 3 - Strategic resources (unique firm specific
resources); and 4 - Value network (the network that surrounds the firm, complementing and
amplifying its own resources). These four components were subsequently decomposed and linked
through three “bridges” (Hamel 2002, p. 73):
Customer benefits – defines the benefits offered to the customers;
Configuration – refers to the linkages among competences, assets, and processes, as
well as how these linkages are managed;
Company boundaries – concerns the decisions that have been made about what the firm
does and what it contracts out to the value network.
Hamel (2000) identified four factors to think about when determining a business profit
potential: efficiency to deliver customer benefits, business uniqueness, degree of fit among the
business elements, and extent to which the business is able to exploit profit boosters.
Customer interface Core strategy Strategic resources Value network
Fulfillment & Support
Information & Insight
Relationship dynamics
Pricing structure
Business mission
Product/Market Scope
Basis for
differentiation
Core Competences
Strategic assets
Core processes
Suppliers
Partners
Coalitions
Figure 4: Hamel’s components of the business model
Source: Adapted from Hamel (2000).
In turn, Alt and Zimmermann (2001) found a common denominator in the literature that
allowed them to derive some generic elements. Their proposal consists of two main dimensions:
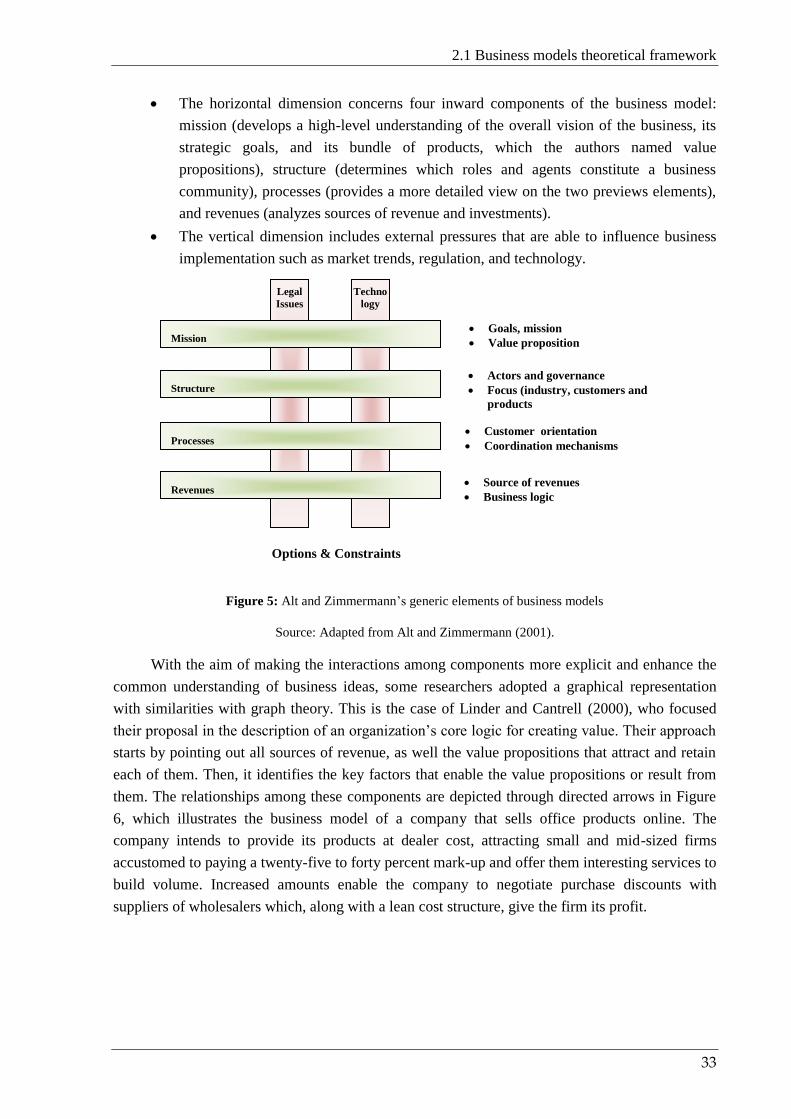
2.1 Business models theoretical framework
33
The horizontal dimension concerns four inward components of the business model:
mission (develops a high-level understanding of the overall vision of the business, its
strategic goals, and its bundle of products, which the authors named value
propositions), structure (determines which roles and agents constitute a business
community), processes (provides a more detailed view on the two previews elements),
and revenues (analyzes sources of revenue and investments).
The vertical dimension includes external pressures that are able to influence business
implementation such as market trends, regulation, and technology.
Figure 5: Alt and Zimmermann’s generic elements of business models
Source: Adapted from Alt and Zimmermann (2001).
With the aim of making the interactions among components more explicit and enhance the
common understanding of business ideas, some researchers adopted a graphical representation
with similarities with graph theory. This is the case of Linder and Cantrell (2000), who focused
their proposal in the description of an organization’s core logic for creating value. Their approach
starts by pointing out all sources of revenue, as well the value propositions that attract and retain
each of them. Then, it identifies the key factors that enable the value propositions or result from
them. The relationships among these components are depicted through directed arrows in Figure
6, which illustrates the business model of a company that sells office products online. The
company intends to provide its products at dealer cost, attracting small and mid-sized firms
accustomed to paying a twenty-five to forty percent mark-up and offer them interesting services to
build volume. Increased amounts enable the company to negotiate purchase discounts with
suppliers of wholesalers which, along with a lean cost structure, give the firm its profit.
Techno
logy
Legal
Issues
Actors and governance
Focus (industry, customers and
products
Mission
Structure
Processes
Revenues
Goals, mission
Value proposition
Customer orientation
Coordination mechanisms
Source of revenues
Business logic
Options & Constraints
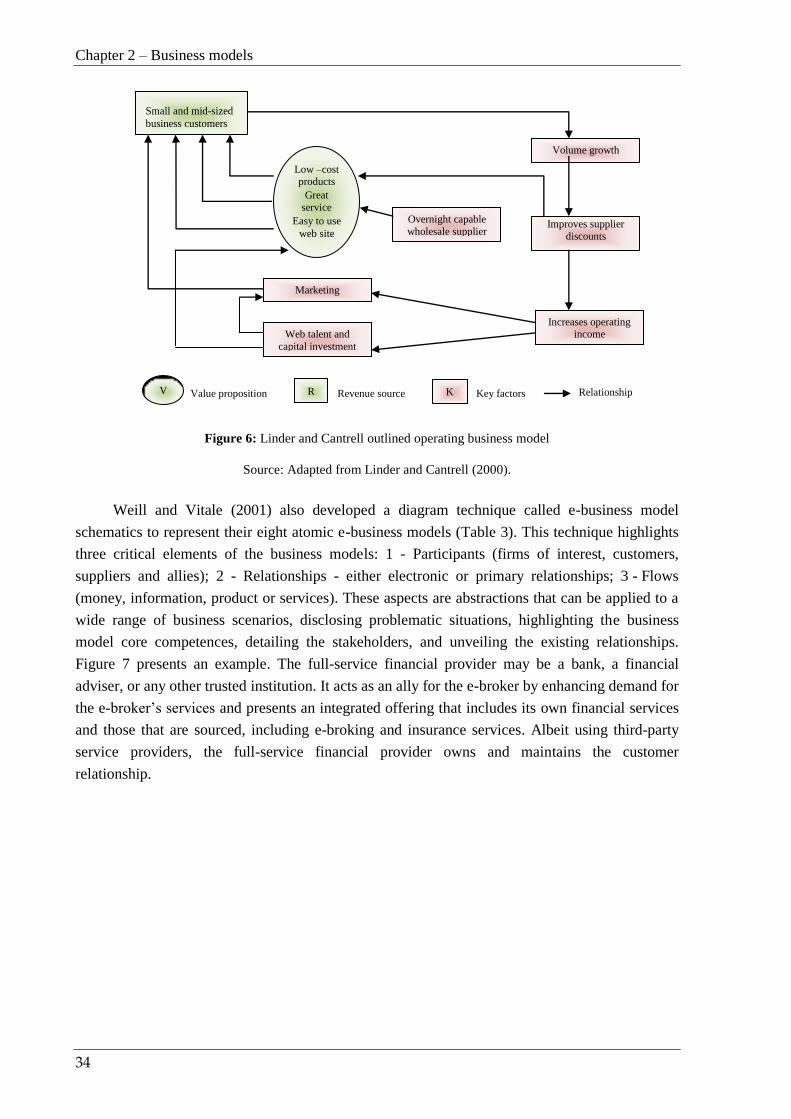
Chapter 2 – Business models
34
Figure 6: Linder and Cantrell outlined operating business model
Source: Adapted from Linder and Cantrell (2000).
Weill and Vitale (2001) also developed a diagram technique called e-business model
schematics to represent their eight atomic e-business models (Table 3). This technique highlights
three critical elements of the business models: 1 - Participants (firms of interest, customers,
suppliers and allies); 2 - Relationships - either electronic or primary relationships; 3 - Flows
(money, information, product or services). These aspects are abstractions that can be applied to a
wide range of business scenarios, disclosing problematic situations, highlighting the business
model core competences, detailing the stakeholders, and unveiling the existing relationships.
Figure 7 presents an example. The full-service financial provider may be a bank, a financial
adviser, or any other trusted institution. It acts as an ally for the e-broker by enhancing demand for
the e-broker’s services and presents an integrated offering that includes its own financial services
and those that are sourced, including e-broking and insurance services. Albeit using third-party
service providers, the full-service financial provider owns and maintains the customer
relationship.
V R Value proposition Revenue source K Key factors Relationship
Small and mid-sized
business customers
Low –cost products
Great
service
Easy to use
web site
Volume growth
Improves supplier
discounts
Increases operating income
Marketing
Web talent and
capital investment
Overnight capable
wholesale supplier

2.1 Business models theoretical framework
35
Figure 7: Example of an e-business model schematic: e-brokering with full-service financial provider
Source: Adapted from Weill and Vitale (2001).
In turn, Tapscott et al. (2000) developed value maps for depicting how a business model
operates, or will operate, in the future. Their proposal identifies all key classes of participants
(e.g., partners, customers, and suppliers) and describes the complex web in which participants
exchange value. The networks engage in two orders of value exchange:
Tangible exchanges of goods, services, and revenues: includes all exchanges involving
contracts and invoices, return receipt of orders, request for proposals, confirmations or
payment. Knowledge products or services that directly generate revenue, or that are
expected (contractual) and paid as part of a service or good (e.g., reports) are also
considered tangible exchanges.
Intangible exchanges of benefits and knowledge: exchanges of value that go beyond
the services that are accounted for in traditional financial measures (not contractual)
such as sense of community, customer loyalty, image enhancement, reputation or co-
branding opportunities. Knowledge exchanges are also considered intangible (for
example, strategic information, planning knowledge, process knowledge, technical
know-how, collaborative design, and policy development).
Figure 8 illustrates the Cisco’s value map. The ovals represent the nodes of the network
(participants or roles) and the arrows show the direction of the flows. The company delegates
physical production and other non-core functions to partners around the world. It concentrates
itself on increasing the value proposition of its services (Tapscott et al., 2000).
E-
broker
Insurance
company
Investor
Full-
service
Financial
Provider
$
P
Fees for advertising
or leads
Fee for service subscription
Portfolio analysis
Financial advice
Financial product
$ fee
$ fee
Trades P
Insurance P
P Flow of
product Flow of
money
Flow of
information
Primary
relationship
Electronic
relationship
F S C A Firm of interest A supplier to
the firm
A customer of
the firm An ally of the firm
$ I
$
$
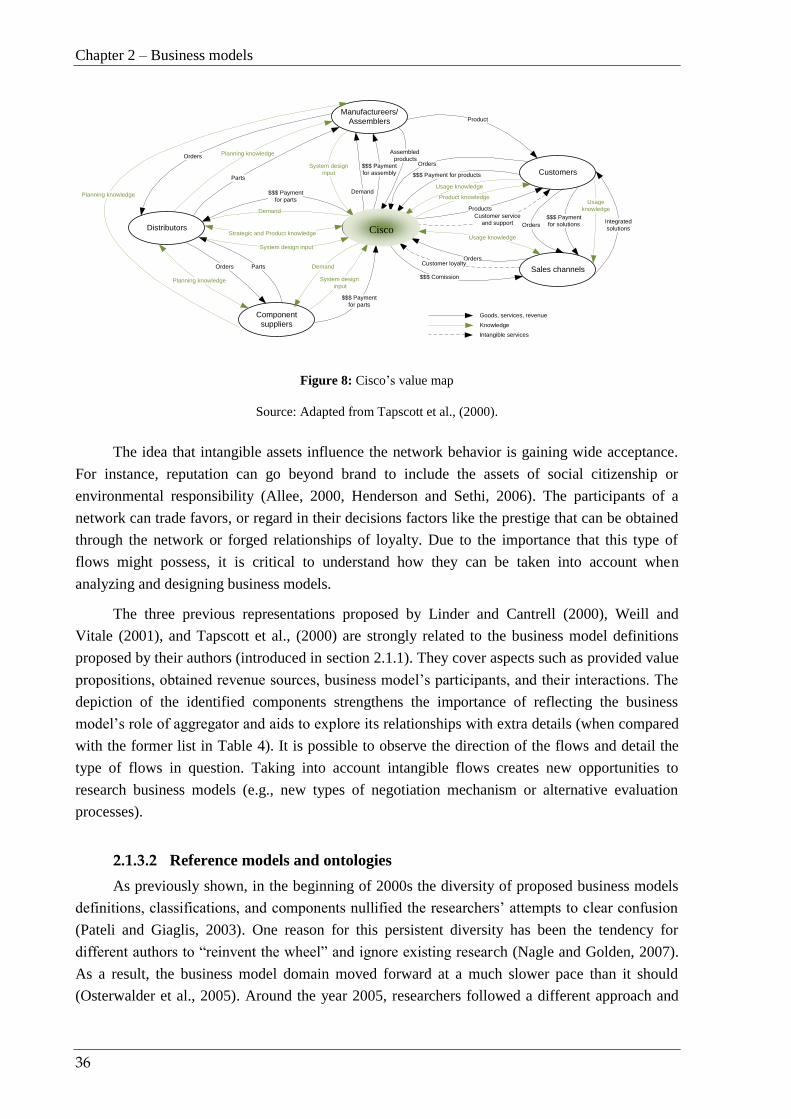
Chapter 2 – Business models
36
Cisco
Manufactureers/
Assemblers
Distributors
Customers
Sales channels
Component
suppliers
Orders
Parts
Planning knowledge
Planning knowledge
Planning knowledge
Orders Parts
Orders
$$$ Comission
Customer loyalty
Usage knowledgeStrategic and Product knowledge
Demand
Demand
System design input
System design
input
$$$ Payment
for parts
$$$ Payment
for parts
System design
input
Demand
$$$ Payment
for assembly
Assembled
products
Product
Orders
$$$ Payment for products
Usage knowledge
Product knowledge
Products
Customer service
and support Orders
$$$ Payment
for solutions
Usage
knowledge
Integrated
solutions
Goods, services, revenue
Knowledge
Intangible services
Figure 8: Cisco’s value map
Source: Adapted from Tapscott et al., (2000).
The idea that intangible assets influence the network behavior is gaining wide acceptance.
For instance, reputation can go beyond brand to include the assets of social citizenship or
environmental responsibility (Allee, 2000, Henderson and Sethi, 2006). The participants of a
network can trade favors, or regard in their decisions factors like the prestige that can be obtained
through the network or forged relationships of loyalty. Due to the importance that this type of
flows might possess, it is critical to understand how they can be taken into account when
analyzing and designing business models.
The three previous representations proposed by Linder and Cantrell (2000), Weill and
Vitale (2001), and Tapscott et al., (2000) are strongly related to the business model definitions
proposed by their authors (introduced in section 2.1.1). They cover aspects such as provided value
propositions, obtained revenue sources, business model’s participants, and their interactions. The
depiction of the identified components strengthens the importance of reflecting the business
model’s role of aggregator and aids to explore its relationships with extra details (when compared
with the former list in Table 4). It is possible to observe the direction of the flows and detail the
type of flows in question. Taking into account intangible flows creates new opportunities to
research business models (e.g., new types of negotiation mechanism or alternative evaluation
processes).
2.1.3.2 Reference models and ontologies
As previously shown, in the beginning of 2000s the diversity of proposed business models
definitions, classifications, and components nullified the researchers’ attempts to clear confusion
(Pateli and Giaglis, 2003). One reason for this persistent diversity has been the tendency for
different authors to “reinvent the wheel” and ignore existing research (Nagle and Golden, 2007).
As a result, the business model domain moved forward at a much slower pace than it should
(Osterwalder et al., 2005). Around the year 2005, researchers followed a different approach and
Cisco

2.1 Business models theoretical framework
37
started to synthesize the large quantities of past research, see for instance (Morris et al., 2005,
Shafer et al., 2005, Osterwalder et al., 2005). Even though these works presented clear
distinctions, the common aspects addressed by them were a clear indicator that the field was
acquiring an extra level of maturity, which has been promoting the evolution of less explored
business model sub-domains of research. Next, we will discuss these works of synthesis, as well
as their outcomes.
Morris et al. (2005) analyzed the existing literature on business models from an a cross-
theoretical perspective and combined it with theoretical underpinnings from fields like business
strategy (Porter, 1985, 1996), resource-based theory (Barney, 1991), strategic network theory
(Jarillo, 1993), cooperative strategy (Dyer and Singh, 1998), and Schumpeterian theory
(Schumpeter, 1934). Figure 9 presents their proposal, which addresses strategic issues and
operational effectiveness.
Figure 9: Levels of decision making
Source: Adapted from (Morris et al., 2005).
The developed work consists of three increasing levels of decision making, termed
“foundation”, “proprietary”, and “rules” (the items in the rectangles) that reveal the different
managerial purposes of the model. Further, each level addresses six common basic decision areas.
The “foundation” level makes generic decisions based on business model characteristics (e.g.,
growth opportunities and possible partnerships). It enables comparisons across different venture
types (e.g., subsistence, income, growth, and speculation) and supports the recognition of
universal models. The “proprietary” level promotes the development of unique combinations
among decision variables that may result in marketplace advantage. It represents an architectural
configuration focused on internal activities that enable the creation of value in each of the six
components. The “rules” level delineates guiding principles regarding the execution of decisions
made at the two preceding levels. The authors related these three levels to the progression of the
business model development. The foundation level may evolve progressively towards a more
detailed model at the proprietary and rules levels. The dependencies among the levels also imply
links between components, which can also be influenced by the specific characteristics of the
different types of ventures carried out.
In a similar study, Shafer et al. (2005) reviewed business model definitions in established
publications during the period 1998-2002. They catalogued the components cited at least twice
Factors related to offering
Market factors
Internal capability factors
Competitive strategy factors
Economic factors
Personal/investor factors
Foundation level
Proprietary level
Rules level
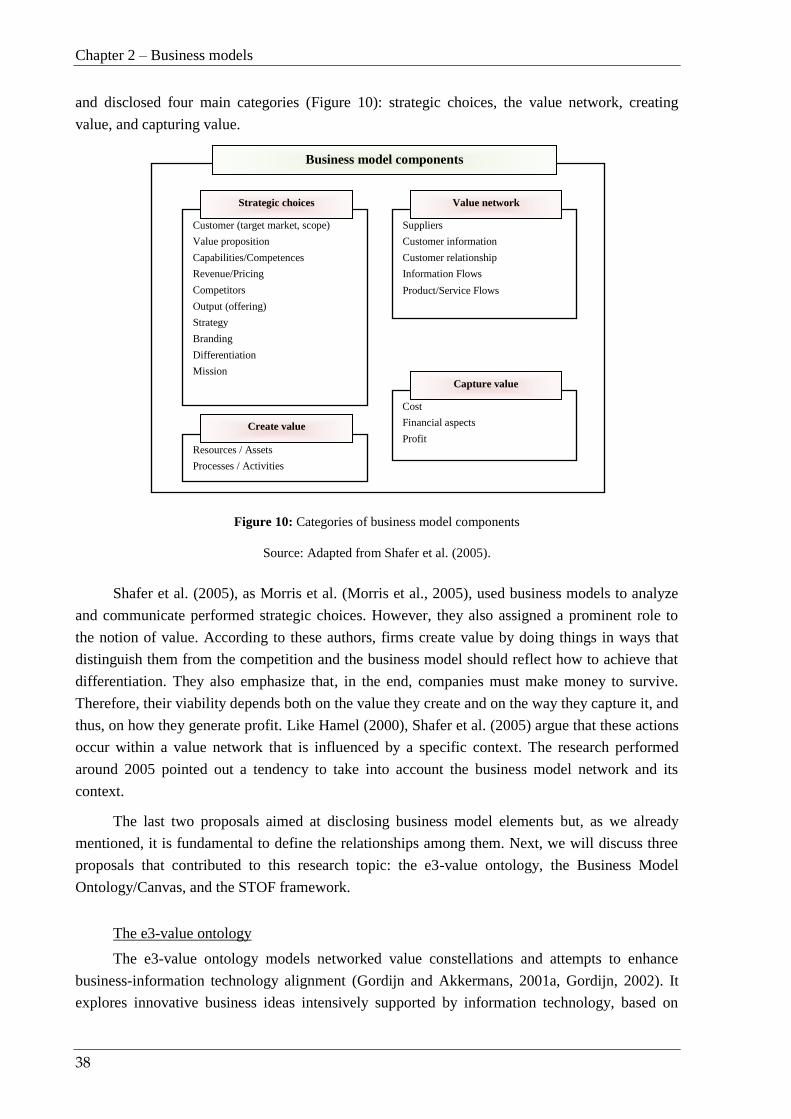
Chapter 2 – Business models
38
and disclosed four main categories (Figure 10): strategic choices, the value network, creating
value, and capturing value.
Figure 10: Categories of business model components
Source: Adapted from Shafer et al. (2005).
Shafer et al. (2005), as Morris et al. (Morris et al., 2005), used business models to analyze
and communicate performed strategic choices. However, they also assigned a prominent role to
the notion of value. According to these authors, firms create value by doing things in ways that
distinguish them from the competition and the business model should reflect how to achieve that
differentiation. They also emphasize that, in the end, companies must make money to survive.
Therefore, their viability depends both on the value they create and on the way they capture it, and
thus, on how they generate profit. Like Hamel (2000), Shafer et al. (2005) argue that these actions
occur within a value network that is influenced by a specific context. The research performed
around 2005 pointed out a tendency to take into account the business model network and its
context.
The last two proposals aimed at disclosing business model elements but, as we already
mentioned, it is fundamental to define the relationships among them. Next, we will discuss three
proposals that contributed to this research topic: the e3-value ontology, the Business Model
Ontology/Canvas, and the STOF framework.
The e3-value ontology
The e3-value ontology models networked value constellations and attempts to enhance
business-information technology alignment (Gordijn and Akkermans, 2001a, Gordijn, 2002). It
explores innovative business ideas intensively supported by information technology, based on
Business model components
Customer (target market, scope)
Value proposition
Capabilities/Competences
Revenue/Pricing
Competitors
Output (offering)
Strategy
Branding
Differentiation
Mission
Strategic choices
Suppliers
Customer information
Customer relationship
Information Flows
Product/Service Flows
Value network
Cost
Financial aspects
Profit
Capture value
Resources / Assets
Processes / Activities
Create value
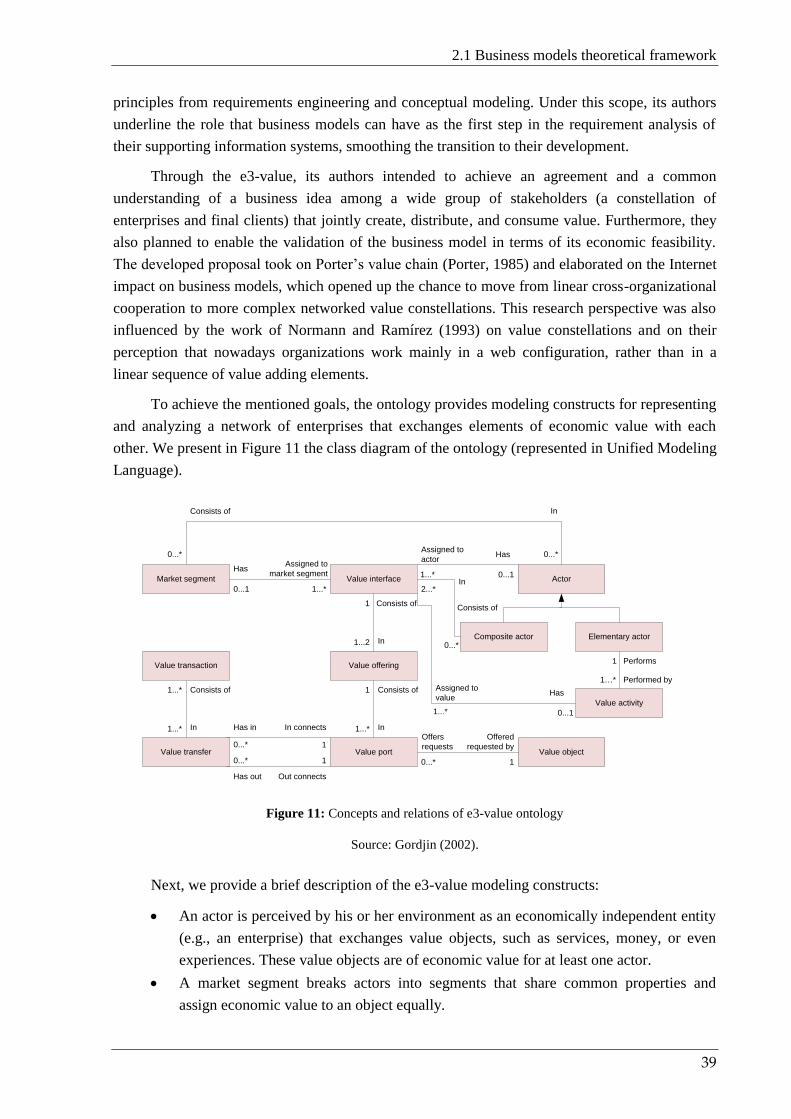
2.1 Business models theoretical framework
39
principles from requirements engineering and conceptual modeling. Under this scope, its authors
underline the role that business models can have as the first step in the requirement analysis of
their supporting information systems, smoothing the transition to their development.
Through the e3-value, its authors intended to achieve an agreement and a common
understanding of a business idea among a wide group of stakeholders (a constellation of
enterprises and final clients) that jointly create, distribute, and consume value. Furthermore, they
also planned to enable the validation of the business model in terms of its economic feasibility.
The developed proposal took on Porter’s value chain (Porter, 1985) and elaborated on the Internet
impact on business models, which opened up the chance to move from linear cross-organizational
cooperation to more complex networked value constellations. This research perspective was also
influenced by the work of Normann and Ramírez (1993) on value constellations and on their
perception that nowadays organizations work mainly in a web configuration, rather than in a
linear sequence of value adding elements.
To achieve the mentioned goals, the ontology provides modeling constructs for representing
and analyzing a network of enterprises that exchanges elements of economic value with each
other. We present in Figure 11 the class diagram of the ontology (represented in Unified Modeling
Language).
Market segment Value interface Actor
Value offeringValue transaction
Value transfer Value port Value object
HasAssigned to
market segment
Assigned to
actorHas
Consists of
In
Consists of
InOffers
requests
Offered
requested by
Consists of
In Has in In connects
Has out Out connects
0...1 1...*
1...* 0...1
1
1...2
1
1...*
1...*
1...*
0...* 1
0...*
0...*
1
1
Consists of In
0...* 0...*
Composite actor Elementary actor
Value activity
Performs
Performed by
1
1…*
In
Consists of
2...*
0...*
Assigned to
valueHas
1...* 0...1
Figure 11: Concepts and relations of e3-value ontology
Source: Gordjin (2002).
Next, we provide a brief description of the e3-value modeling constructs:
An actor is perceived by his or her environment as an economically independent entity
(e.g., an enterprise) that exchanges value objects, such as services, money, or even
experiences. These value objects are of economic value for at least one actor.
A market segment breaks actors into segments that share common properties and
assign economic value to an object equally.
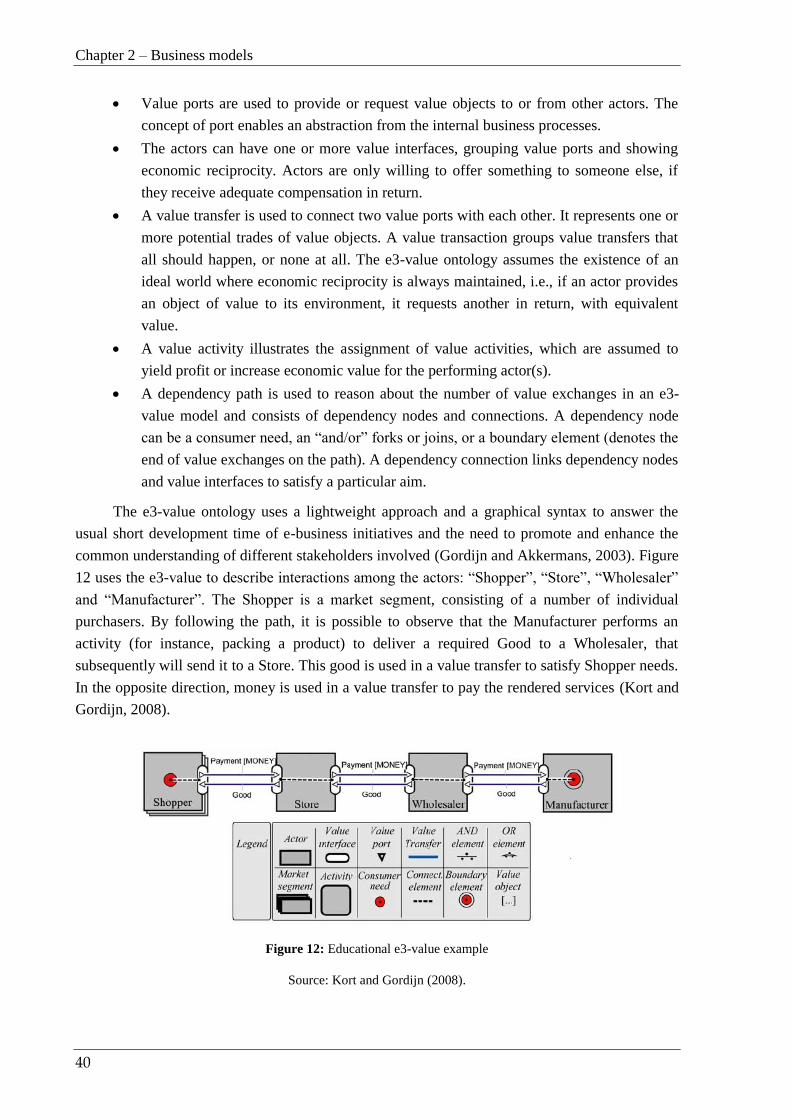
Chapter 2 – Business models
40
Value ports are used to provide or request value objects to or from other actors. The
concept of port enables an abstraction from the internal business processes.
The actors can have one or more value interfaces, grouping value ports and showing
economic reciprocity. Actors are only willing to offer something to someone else, if
they receive adequate compensation in return.
A value transfer is used to connect two value ports with each other. It represents one or
more potential trades of value objects. A value transaction groups value transfers that
all should happen, or none at all. The e3-value ontology assumes the existence of an
ideal world where economic reciprocity is always maintained, i.e., if an actor provides
an object of value to its environment, it requests another in return, with equivalent
value.
A value activity illustrates the assignment of value activities, which are assumed to
yield profit or increase economic value for the performing actor(s).
A dependency path is used to reason about the number of value exchanges in an e3-
value model and consists of dependency nodes and connections. A dependency node
can be a consumer need, an “and/or” forks or joins, or a boundary element (denotes the
end of value exchanges on the path). A dependency connection links dependency nodes
and value interfaces to satisfy a particular aim.
The e3-value ontology uses a lightweight approach and a graphical syntax to answer the
usual short development time of e-business initiatives and the need to promote and enhance the
common understanding of different stakeholders involved (Gordijn and Akkermans, 2003). Figure
12 uses the e3-value to describe interactions among the actors: “Shopper”, “Store”, “Wholesaler”
and “Manufacturer”. The Shopper is a market segment, consisting of a number of individual
purchasers. By following the path, it is possible to observe that the Manufacturer performs an
activity (for instance, packing a product) to deliver a required Good to a Wholesaler, that
subsequently will send it to a Store. This good is used in a value transfer to satisfy Shopper needs.
In the opposite direction, money is used in a value transfer to pay the rendered services (Kort and
Gordijn, 2008).
Figure 12: Educational e3-value example
Source: Kort and Gordijn (2008).

2.1 Business models theoretical framework
41
Given an e3-value model with its scenario paths, it is possible to observe which value
objects are exchanged by actors. According to Gordjin (2002), this description allows the creation
of profitability sheets on a per actor basis, which provide indications about the potential
profitability of the scenario under study. To carry out this assessment, two types of actors are
involved: enterprises and end-consumers. Since enterprises strive to maximize their profits, when
calculating enterprise profit sheets, e3-value ontology only takes into account value objects
denoting money. However, the main aim of end-consumers is not profit, but to satisfy their needs,
which introduces an extra complexity not covered in the e3-value ontology. It is necessary to
understand how an end-consumer assigns economic value, especially to non-money objects. This
assignment is a very subjective task (Holbrook, 1999), and adds that this subjectivity extends
itself to enterprises, since they may negotiate items, whose value can be very difficult to quantify.
Over time, the e3-value ontology has been extended and has originated the e3-family
depicted in Figure 13. In addition to the aspects initially covered, the e3-family offers additional
viewpoints (Gordijn et al., 2009): e3-strategy (models strategic motivations associated with
environmental pressures), e3-service (addresses services, in particular e-services, bridging the
customer and supplier perspective), e3-control (configures solutions that may fight fraudulent
behavior and is grounded in inter-organizational auditing and control). Transversally to the
described layers, two others were idealized: e3-alignment and e3-domain. The e3-alignment
intends to assist in keeping all e3-family models consistent, aligning their different concerns. If
problems or concerns are found in one perspective, the others are refined to regard the identified
issues. In turn, the e3-domain includes knowledge about a specific industry to enable the use of
the ontology by practitioners.
Figure 13: e3-family, designing network analysis
Source: Adapted from Kartseva (2008).
The e3-family had as one of its purposes to reason about the contextual socio-economical
aspects of e-services. More recently, the literature has been focused on automatically generating
e3-value instance models and on dynamic service bundling. To understand the business model
context and integrate its influences in the value model remains an open issue.
The e3-ontology, especially the e3-value layer, promotes a common understanding of a
business idea. It portrays all the actors of the value constellation, the interchanged value
propositions, and the performed activities. It also provides an indication of the involved economic
e3-strategy
e3-value
e3-service
e3-control
e3-aligment
e3-domain

Chapter 2 – Business models
42
values. Nonetheless, e3-value constraint on the economic reciprocity assumes the existence of an
ideal environment, excluding inappropriate behaviors.
Business Model Ontology
The Business Model Ontology improves communication about a company’s business
model, providing guidelines to better formulate, comprehend, manipulate, share, and develop
business ideas. It was developed by Osterwalder and Pigneur (2002), whose work was influenced
by the Balanced Scorecard (Kaplan and Maxwell, 1994). The latter identifies four perspectives
that should be followed to conduct successful businesses and for each encourages the answer to a
question, as detailed next: 1 - Customer (“How the customers see us?”); 2 - Innovation and
learning (“How can we continue to improve and create value?”); 3 - Internal (“What must we
excel at?”); 4 - Financial (“How can we continue to improve and create value?”). Through their
translation to the business model, Osterwalder and Pigneur (2002) identified four areas that a
business model should address:
Product - what the company offers to their customers;
Customer interface – who are the customers, how they are reached, and how the
relationships are built;
Infrastructure management – how the company performs infrastructural or logistical
issues, with whom, and as what kind of network enterprise;
Financial aspects – What are the company revenues, its cost and its pricing.
Osterwalder and Pigneur (2002) combined the described perspectives with the business
model components identified through an exhaustive survey in the literature. They excluded the
ones related to competition and to business model implementation since, in their perspective,
these components have connections with the business model but are not an internal part of it.
Through the obtained outcome, they detailed the identified four pillars into the nine business
model building blocks outlined in Table 5. They form the basis for the Business Model Ontology.

2.1 Business models theoretical framework
43
Table 5: Components of the Business Model Ontology
Grouping Business model building block
Product Value proposition Overall view of a organization’s bundle of products
Customer interface Target customer Segments of customers an organization wants to offer value
Distribution channel Various means of an organization to get in touch with its
customers
Relationship Kind of links an organization establishes between itself and its
different customer segments
Infrastructure
management
Value configuration Arrangement of activities and resources
Core capability The competences needed to execute the business model
Partner network Network of cooperative agreements with other organizations
Financial aspects Cost structure Monetary consequences of employing a business model
Revenue model Revenue flows through which an organization makes money
Figure 14 presents the Business Model Ontology and describes how its components relate to
each other. The light lilac rectangles represent the components, the black line describes
relationships, and the arrows specify what composes a component.
Figure 14: Business Model Ontology
Source: Adapted from Osterwalder (2004).
The value proposition component is composed by a set of one-or-more offerings(s) and it is
characterized by five attributes: 1 - Description (explains the value proposition); 2 - Reasoning
(justifies why the value proposition could be beneficial); 3- Life cycle (studies the value
Customer relationship
Who?
Infrastructure management
How?
Mechanism Agreement
Relationship Actor Partnership
Product innovation
What?
Customer Value proposition Channel Value configuration Capability
Criterion Link Offering Activity Resource
Cost
Pricing Account
Revenue Profit
Financial aspects
How much?

Chapter 2 – Business models
44
proposition life cycle); 4 - Value level (measures an offer to analyze its utility for the customer);
5 - Price level (compares the value proposition price to the competitors). In turn, the customer
relationship group covers the entire customer’s buying cycle (customers’ awareness, their
evaluation of the company’s value proposition, the moment of purchase, and after sales). It
considers the nature of customers’ relationships in three different stages: acquiring new
customers, retaining existing ones, and selling them additional value propositions. The
infrastructure management describes the value system configuration that delivers the value
propositions and was inspired by the e3-value ontology (Gordjin, 2002). It comprises the value
activity configuration of the firms, the established relationships to carry out a project, and the
available capabilities (in-house and the ones acquired through partnerships). Finally, the financial
aspects determine the firm’s profit-or-loss making logic and are transversal to all the others.
The Business Model Ontology later led to the development of a handy tool, which its
authors designated by Business Model Canvas (Osterwalder and Pigneur, 2010). According to
them, by visually depicting a business model it is possible to transform tacit assumptions into
explicit knowledge. They claim that it is difficult to understand a model without sketching it out.
Therefore, these authors resort to techniques like visual thinking, prototyping, storytelling and
scenarios to develop their tool. Visual thinking was considered indispensable and consists in using
visual artifacts like pictures, Post-it notes, or drawings. Figure 15 shows how the Business Model
Canvas uses a provided template that should be printed out on a large surface and put on a wall to
allow researchers or practitioners to stick or write their ideas. They can address a particular
component, dependencies among components, or the business model as a whole. The Business
Model Canvas only describes the business logic of a single firm.
Figure 15: Business Model Canvas template
Source: Osterwalder and Pigneur (2010).
The Business model ontology helps to construct a common understanding of a business
model. It promotes communication and discussion among stakeholders, supports the decision
making process, and facilitates change and innovation.

2.1 Business models theoretical framework
45
STOF framework
When comparing different business model definitions and frameworks, Faber et al. (2003)
realized that the developed work provided a rather limited perspective on cross-company
collaboration in complex value networks. The majority of the available proposals addressed single
companies and did not pay much attention to the linkages between variables of different business
model topics (e.g., organizational and financial) or to cross-company collaborations (Bouwman et
al., 2005a). The researchers also noticed the need to develop methods for defining and designing
business model services. To address these limitations, they searched for common components that
could be used in networked business model, in particular for innovative mobile ICTs services. The
result was the STOF framework that stands for Service, Technology, Organization, and Finance
domains (Figure 16), which integrates the identified components.
Figure 16: STOF business model framework
Source: Adapted from Faber et al. (2004).
The components are interrelated and do not function independently. The topics covered by
each of them are (Bouwman et al., 2008b):
Service component: describes the value proposition (added value of a service offering)
and the market segment at which the offering is aimed;
Technology component: details how the service offering can be carried out in a
technical perspective. It is based on the requirements of the service component;
Organization component: describes the structure of the multi-actor value network
required to create and distribute the service offering (includes resources and
Business model
Service
Offering
Value proposition
Market segment
Technology
Architecture Functionality
required
Finance
Arrangements
Cost structure
Profit potential
Organization
Arrangements
Structure of value
network
Regulatory changes
(e.g., antitrust and privacy)
legislation
Market opportunities
(e.g., changing customer)
demands
Technological
advancements
(e.g., ambient
Awareness)
Economic value
(e.g., revenues)
Customer value
(e.g., ease of use,
costs, experience)
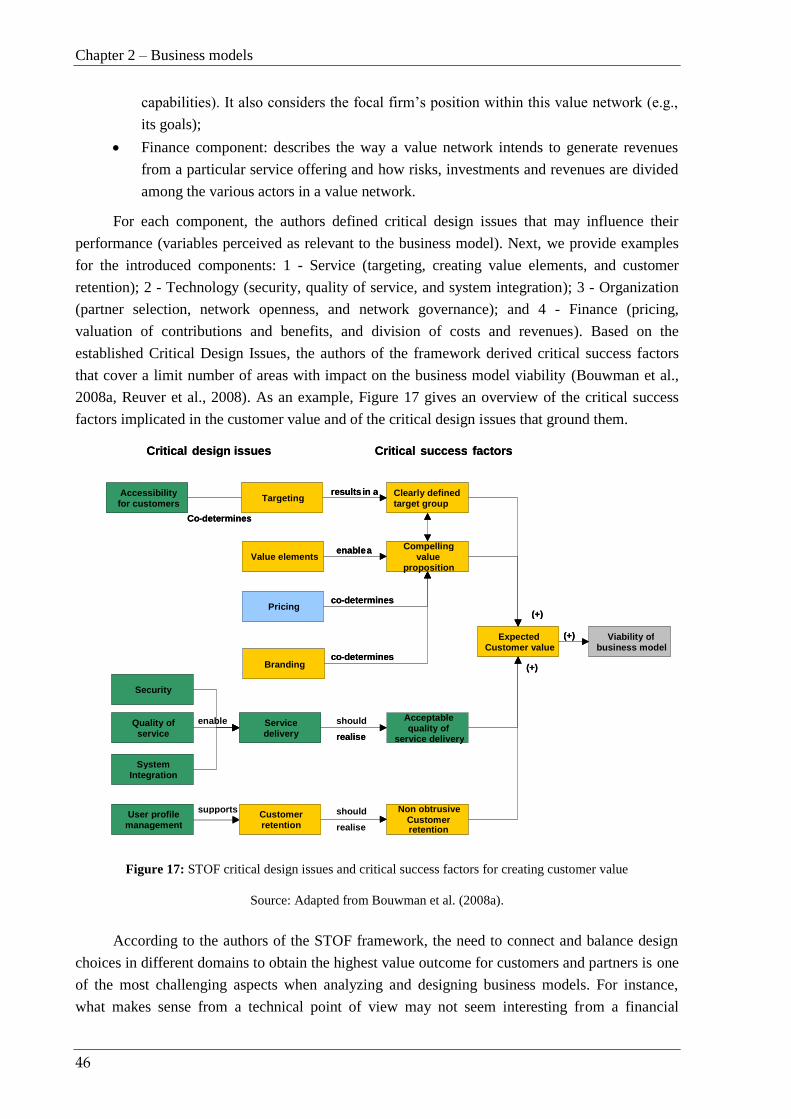
Chapter 2 – Business models
46
capabilities). It also considers the focal firm’s position within this value network (e.g.,
its goals);
Finance component: describes the way a value network intends to generate revenues
from a particular service offering and how risks, investments and revenues are divided
among the various actors in a value network.
For each component, the authors defined critical design issues that may influence their
performance (variables perceived as relevant to the business model). Next, we provide examples
for the introduced components: 1 - Service (targeting, creating value elements, and customer
retention); 2 - Technology (security, quality of service, and system integration); 3 - Organization
(partner selection, network openness, and network governance); and 4 - Finance (pricing,
valuation of contributions and benefits, and division of costs and revenues). Based on the
established Critical Design Issues, the authors of the framework derived critical success factors
that cover a limit number of areas with impact on the business model viability (Bouwman et al.,
2008a, Reuver et al., 2008). As an example, Figure 17 gives an overview of the critical success
factors implicated in the customer value and of the critical design issues that ground them.
Figure 17: STOF critical design issues and critical success factors for creating customer value
Source: Adapted from Bouwman et al. (2008a).
According to the authors of the STOF framework, the need to connect and balance design
choices in different domains to obtain the highest value outcome for customers and partners is one
of the most challenging aspects when analyzing and designing business models. For instance,
what makes sense from a technical point of view may not seem interesting from a financial
Security
System Integration
Quality of service
Acceptable quality of
service delivery
enable
Critical design issues Critical success factors
Targeting
Value elements
Clarity of target group
Compelling value
proposition
results in a
enable a
Non obtrusive Customer retention
Branding
User profile management
supports
Pricing
Viability of business model
Expected Customer value
(+)
(+)
co - determines
(+)
Accessibility for customers
Co - determines
co - determines
Service delivery
should realise
Customer retention
should realise
Security
System Integration
Quality of service
Critical design issues Critical success factors
Targeting
Value elements
Clearly defined target group
Compelling value
proposition
results in a
enable a
Non obtrusive Customer retention
Branding
User profile management
Pricing
Viability of business model
Expected Customer value
(+)
(+)
co - determines
(+)
Accessibility for customers
Co - determines
co - determines
Service delivery realise
Customer retention
2.1 Business models theoretical framework
47
perspective. These authors also underline the relevance in addressing collaborations in value
networks and recognize that a business has to take into account its contextual influences such as
technological, market trends, and regulatory impact.
Through this section, we showed that business model components have evolved from
“shopping lists” to building blocks, reference models, and ontologies (Gordijn et al., 2005). In this
process, we detected significant similarities between the available proposals, but also noteworthy
differences. Next, we will detail our analysis, which is focused on the preceding five proposals,
since they comprise a detailed bibliographic analysis of the previously developed work.
Applying one of the most widely used set of criteria for evaluating a model: 1 – simplicity;
2 – accuracy; and 3 generalisability (Miller and Dess, 1993), we note that the components
identified in the e3-value ontology (Gordijn and Akkermans, 2001b), the Business Model
Ontology (Osterwalder, 2004), and the STOF framework (Faber et al., 2003) seem more
developed. Shafer et al. (2005) present twenty subcomponents, in comparison to a more simplified
four components in the STOF framework, nine subcomponents in the Business Model Ontology,
and ten in the e3-value ontology. In a different approach, Morris et al. (2005) address essentially
strategy issues, falling outside the aim of identifying inward business model components.
Gordijn et al. (2005) compared the e3-value ontology and the Business Model Ontology.
These authors argue that both share common purposes in their aim of improving the design,
understanding, management and analysis of business models. For instance, both use a semi-formal
approach rather than a strict formal one to promote the participation of stakeholders that do not
understand formal models very well. Furthermore, the concept of value proposition and the
arrangements of activities and resources are common denominators. Similarly, the STOF
framework is also constituted by components that overlap with Business Model Ontology and e3-
value (e.g., the ones that cover value propositions, market features, financial issues, and
organizational arrangements).
There are points of contact between the three proposals. Yet, their scope of analysis is
different. While the Business Model Ontology addresses the business logic of a specific firm, the
other two adopted a wider perspective by addressing inter-organizational business models. Their
differences are propitious to the establishment of complementarities in the field of a firm inter-
operability. While the e3-value and the STOF framework provide insights on the network value
exchanges, the Business Model Ontology contributes with detailed data on firm’s partnerships,
customers’ relationships, core capabilities, and distribution channels. Therefore, it is possible to
establish a connection between an inter-organizational business model framework and the
Business Model Ontology applied to the individual business model of the entities that compose
the network.
Other differences can be pointed out. The e3-value assigns a higher importance to the
economic evaluation of the value propositions in the business model. Its semi-formal
representation links value models to business process models and provides a bridge between the
business model, requirements engineering, and systems development fields. This
conceptualization in different levels was also adopted in (Morris et al., 2005). In turn, the STOF

Chapter 2 – Business models
48
framework assigns a special attention to technological factors that promote the interaction among
the elements of the partnerships established in complex value networks, and between the network
and its customers. Therefore, the role of technology, and its relationships with the other domains,
is explicitly made. The STOF framework also discusses critical success factors, which are also
covered by Weill and Vitale (2001). The Business Model Canvas (the newer version of the
Business Model Ontology) clearly emphasizes its use as a designing tool for promoting
innovation.
2.1.4 Adoption factors
Factors like geography, policy, culture, ethics, organizational issues, religion, power
relationships, and conflicts influence, directly or indirectly, the perception, development, and
adoption of business models. The study of the impact of these factors may be used as a crucial
element to disclose guidelines that aid to achieve the viability, stability, and success in business
models. Nevertheless, only a smaller segment of the research community pursues this direction
(Pateli and Giaglis, 2004). An example is the work developed by Pouloudi et al. (2003). They
proposed a framework to study how key social factors could influence the adoption of business
models and grouped them in seven general categories: region/geography, culture,
legal/regulatory/policy, economic, ethical, professional, social networks, and social structure.
According to this framework, those categories are not independent aspects of a business model.
They complement more traditional perspectives such as provided services, revenues,
organizational arrangements, resources, and technological architecture.
McGann and Lyytinen (2002) also tried to understand the dynamics of adoption and
diffusion that take place in relation to business models. These researchers focused their work on
two topics: technological infrastructure and environmental factors. They claim that technology
provides integration for purposes of business transaction and information sharing. In their opinion,
technological solutions, depending on their cost and maturity, can be key factors in determining
the success of the business models, whose activities they support. Examples of key enabling
solutions are: payment systems and credit card processing technology. When addressing the
impact of environmental factors on business adoption, these researchers split their study into
institutional and external diffusion issues. The former covers features that exercise influence and
regulation over entities (e.g., regulatory frameworks for business taxation, privacy principles, and
online security policies). The latter either serve to push the model towards success by providing
needed catalysts for diffusion (e.g., venture capital and technical competence) or propel the
business model by creating a favorable environment for its adoption (e.g., computer literacy). The
core argument of these researchers is the need to scrutinize not only the business practice, but also
the models it is built upon.
The discussed topics strengthened our decision to study the environment where business
models operate, due to its influence on how business models are perceived, communicated,
developed, adopted, and evaluated. By taking into account the context of the business model when
2.1 Business models theoretical framework
49
specifying the high-level requirements of its underlying technological solutions, we can promote
the adoption of the business model and of its technological support.
2.1.5 Business models evaluation
For the ones responsible for business model decision-making, it is valuable to acquire
indications that could help them in their assessment (e.g., when considering an innovative
business model or alternative ones). The emergence of this domain was impelled by researchers
who developed detailed descriptions of business model taxonomies and components, such as
Hamel (2000), Weill and Vitale (2001), and Afuah and Tucci (2003). By breaking down business
models and separately analyzing its components, these researchers created favorable conditions to
perform evaluations. Next, we will present some of the work developed in this domain.
Hamel (2000) presented an approach grounded in the business models components he had
identified (Figure 4, p. 32). This author proposed four evaluation criteria that address:
1 - Efficiency (the value customers place on the delivered benefits must exceed their production
costs); 2 - Uniqueness (the originality of the business model); 3 - Fit (components’ suitability to
work together; and 4 - Profit boosters (aspects that improve the business model success, for
instance network effects and customer lock-in). Weill and Vitale (2001) also proposed an
evaluation based on their “atomic e-business model” (section 2.1.2, p. 27), in which the identified
components are assessed according to strategic objectives of the business initiative (sources of
revenue or value, critical success factors, and core competences). In addition, these authors
explore areas of potential synergy and conflict among the components.
The solution proposed by Afuah and Tucci (2003) is driven by financial indicators. In their
opinion, the best way to evaluate a business model is to compare its profitability to that of its
competitors. Their evaluation of the business model performance consists of three levels. The first
includes profitability measures (e.g., comparison of a firm’s profitability to that of other players
using measures such as earnings and cash flows). The second concerns profitability prediction,
which confronts a firm’s profit margins, revenue market share, and revenue growth rate with those
of its competitors. The third provides benchmark questions for each of the business model
components defined by these researchers. For instance, “Is customer value distinct from that
competitor?”, “Is the growth rate of market segments high?”, or “Are margins and market shares
in each revenue source high?”.
Gordijn (2002), by including in the e3-value ontology a detailed technique to assign
economic value to the exchanged items between actors, took a step further in the evaluation of
business models. The author’s proposal takes into account incoming and outgoing money flows
and identifies factors that play a role in the creation of their value. Then, it assigns them economic
value using measurable quantities such as the number of occurrences of consumer needs, the size
of a market segment, the valuation of the items transferred between the actors, and investments.
The actors involved are also asked to assign economic value to the value objects they obtain and
to the ones they provide. The sum of the assigned values is analyzed to verify gains acquired and

Chapter 2 – Business models
50
efforts demanded of the business model actors. According to Gordijn (2002), distinct scenarios to
disclose possible inconsistencies or future problems should be evaluated.
As recognized by Gordijn et al. (2009), the e3-value assumes an ideal world, in which all
parties provide a reciprocal object (e.g. money) if they obtain another object (e.g. a good). This
perspective reveals a partial vision of reality, which limits its application, especially in complex
scenarios such as networked business models. However, it underlines the capability to reason
about profitability and to perform a sensitivity analysis. Furthermore, it allows varying critical
factors and contributes to a better understanding of the business idea.
The e3-value evaluation technique follows the assumption that it is possible to assign
economic value to the items exchanged among the actors. However, this raises several problems.
For instance, when Disney World, in Florida, offers admission discounts to locals, its managers
know that, for a reduced price, locals are more likely to come regularly. But tourists will probably
come only once, whether it is cheap or expensive (Harford, 2006). The ticket provides the same
service and it is rated differently, depending on its customers. According to the circumstances,
economic evaluation can change rapidly and can be appraised differently depending on who is
performing it.
The e3-value ontology allows the development of individual evaluations, including the
perspectives of the different actors that constitute the business model. Nevertheless, this solution
does not solve the difficulties in expressing value in monetary terms. For example, doctors at
Ditan Hospital in Beijing claimed that a combination of various Chinese herbs had a 75 percent
cure rate in the 117 patients treated there for swine flu. The recovery period was shorter than in
patients who received Tamiflu and the daily cost of the herbal remedy was approximately 12 yuan
($1.486 EUR), which was lower when compared to Tamiflu treatment at 56 yuan ($6.91 EUR),
(Shlian, 2009). In this particular scenario, we can question what monetary value to assign
knowledge in Traditional Chinese Medicine.
The majority of the proposed criteria are driven by the assignment of financial values to
business model flows and activities, whose precision is in many cases very difficult and in some
cases impossible to establish (Pateli and Giaglis, 2004). However, we can witness an evolutionary
act that comprises a clear expansion of the factors under analysis. There is a shift to models that
consider broader issues, leading the evaluation of business model beyond financial aspects and
towards the assessment of value creation.
Amit and Zott (2001) highlighted the difference between a business model and a revenue
model. While the former mainly refers to value creation, the latter is focused on value
appropriation. According to these authors, value refers to the total value created for all parties
involved in a business model. The analysis of these researchers revealed four interrelated value
drivers: efficiency, complementarities, lock-in, and novelty, which can be used as value creation
sources, but also as value evaluation dimensions (Johansson and Mollstedt, 2006). Amit and
Zott’s (2001) proposal was based on the value chain framework (Porter, 1985), the theory of
creative destruction (Schumpeter, 1942), the resource-based view (Barney, 1991), the strategic
network theory (Gulati et al., 2000), and transaction cost economics (Williamson, 1975).

2.1 Business models theoretical framework
51
In Amit and Zott’s (2001) proposal, efficiency refers to transaction efficiency, which
increases when transactions are cheaper, faster, or of better quality than the average. Business
models can also create value through complementarities, which occurs whenever a bundle of
goods provides more value than the total separate value of each single good. Another source of
value creation is the extent to which a business model is able to lock-in customers and strategic
partners. It can be enhanced through topics like customization, affiliate programs, loyalty
programs, transaction safety, and reputation built on transaction history. In turn, novelty consists
in new ways to structure transactions, connecting parties, diminishing inefficiencies, capturing
needs, and creating new business scenarios.
By focusing on transactions, the value drivers have the necessary flexibility to be applied to
different industries and stages of venture maturity. However, its application in the field is not
detailed by its authors (e.g., it is unclear how to handle financial issues or how to deal with
collaborations among firms). The evaluation performed in the light of Amit and Zott’s (2001)
proposal consists in assigning the identified value propositions to one of the value drivers and
discuss their performance based on information acquired about the business model (e.g., on
interviews, documents, or inquiries). Johansson and Mollstedt (2006) and Lassila (2006) provide
examples.
In their updated version of the Business Model Ontology, the Business Model Canvas,
Osterwalder and Pigneur (2010) propose a tool to evaluate the business model environment, as
well as the business model itself. The environmental analysis considers the context in which the
business models are conceived or modified. It comprises several items grouped in four main
areas: 1 - Market forces (addresses topics like market segments, needs and demands, and revenue
attractiveness; 2 - Industry forces (for example, stakeholders, competitors, and substitute products
and services); 3 - Key trends (such as technology, regulatory, societal, and cultural trends); and
4 - Macro-economic forces (for instance, economical infrastructure and commodities). In turn, the
evaluation of the business model combines the nine components of the Business Model Canvas
with the SWOT analysis (Andrews, 1971) in two types of assessment. The first identifies the
strengths and weaknesses of the business model as a whole to evaluate its overall integrity (uses
all the nine components). The second applies the SWOT analysis to each component in detail. The
Business Model Canvas provides sets of questions to help incite the assessment of strengths,
weaknesses, opportunities, and threats.
The evaluation proposed by Osterwalder and Pigneur (2010) is focused in analyzing
individual components. Furthermore, the two types of assessment of the business model show an
overlap concerning strengths and weaknesses. Even though the authors provide a list of
predetermined questions, these are generic and do not reflect the specificities of each business
model scenario, and how those questions must be formalized and placed.
To conclude, we will present the evaluation dimension of the STOF framework, which
balances the often conflicting strategic interests and requirements over the four STOF components
(Bouwman et al., 2008b). In addition to a descriptive model, the STOF framework also provides a
causal model to address success factors and critical design issues with impact on the balance of
the business model and on its performance (Bouwman et al., 2008a). To detect critical design

Chapter 2 – Business models
52
issues the framework was applied in the study of several cases (e.g., mobile entertainment
services and mobile payment services). The acquired knowledge has been used to build causal
frameworks. These frameworks address relationships among design variables within a particular
component, or among different ones, as well as their implications on critical success factors that
may affect the viability of the business model.
The method consists of four steps (Vos and Haaker, 2008):
Step 1 “Quick Scan” - provides a rough sketch of the business model by answering
questions with respect to the four components of the framework.
Step 2 “Evaluation with critical success factors” - tests the potential success of the
Quick Scan against identified critical success factors. The evaluation on the success
factors determines which parts of the business model need to be elaborated.
Step (3) Specification of critical design issues - refines the business model by
specifying for each component its Critical Design Issues, which follow from the
success factors and feed the design choices.
Step 2 and 3 are conducted in an iterative process that may lead to amendments in
the original business model design or to its cancellation. The first three steps
possess an internal focus, i.e., the design of a service.
Step (4) Robustness check - involves an internal evaluation focused on checking
the relationships among the components and the receptivity towards the changes
carried out. In addition, it also performs an external assessment on the robustness of
the design (the ability to adapt to external occurrences).
A way to evaluate robustness is to ask what-if questions. The answers will provide insights
on problematic relationships and uncertainties. An alternative solution was followed by Reuver et
al. (2008), who decided to do it by testing causal relationships between design issues and success
factors. They analyzed the results of a survey among 120 practitioners and experts in the mobile
Internet service domain. The study allowed them to refine the design issues that should be
addressed in this field and test the impact of organizational and financial design issues on a set of
success factors (e.g., acceptable role division among actors, acceptable risks, and acceptable
profitability) that explain the value captured by the organizations offering the service. These
authors aim to provide companies with a list of design issues to address in order to achieve
particular success factors. Managers and business model developers can use this knowledge to
envision and improve their business models. The same research group (Bouwman et al., 2012)
also proposes the use of scenario analysis to validate the strong and weak parts of business
models. They called the practice business model stress testing.
The evaluation dimension of the STOF framework is mainly useful in early stages of
innovation. It enables actors to explore and contemplate different ideas and options. The
dependencies identified between design issues and business success factors that can affect
business performance supported our decision of exploring this kind of dependencies in networked

2.1 Business models theoretical framework
53
business models. The insights obtained with their identification and implications have potential to
provide valuable hints for the resolution of possible problems or threats.
The discussed proposals underline the importance of performing evaluations that go beyond
financial aspects. Furthermore, they show the relevance of disclosing influences and dependencies
with impact on the business model, and the need to involve stakeholders in this process. Their
perception towards possible decisions helps validate future decisions.
2.1.6 Change methodologies
To take advantage of opportunities, or simply stay in business, firms often have to reinvent
it, before the surrounding conditions do it for them. Business models do not have a static nature.
They depend on diverse factors and are influenced by several conditions. In face of new
circumstances, firms may be forced to change and adapt their business models. The necessity to
adjust them to new conditions is well established, but, unfortunately, the research available does
not provide many clues on how to perform this task (Pateli and Giaglis, 2004).
Linder and Cantrell (2000) detected that besides the usual difficulties in putting changes
into practice, executives had difficulties in classifying the type of required change. To organize
the range of options available and support executives in their decisions, these authors identified
the following four basic types of change models:
Realization model - maximizes the returns from companies existing operating logic. It
exploits the potential of current business models to promote their growth and profit. It
covers, for instance, product line extensions, geographic expansion, and additional
sales or service channels.
Renewal model – is especially common among companies seeking to stay on top of the
price/value curve. It depends on its revitalization to counteract natural competitive
forces that drive down margins. It covers, for example, new service offerings, new
brands, untouched markets, and new retailing formats.
Extension model - expands business to cover new ground. It includes in the operating
model of the companies new markets, products, and services. New business lines do
not replace, but add to the existing operations.
Journey model - takes a company to a new business model, but it moves deliberately
and purposefully and never returns. For example, companies globalize and shift their
value propositions to highlight their global reach and capability.
Following a different approach, Tapscott et al. (2000) explained how business models
propositions can be structured using the concepts of disaggregation and re-aggregation. First, it is
necessary to describe the current value proposition from the customer’s viewpoint (the person
whose needs the business must meet) and disaggregate them with the aim of identifying business
opportunities for improvements. Subsequently, the researchers apply creative design techniques to
envision the business model, define the new value propositions, and re-aggregate them. In the
same line of research, Gordijn and Akkermans (2003) defined a value model deconstruction and
reconstruction process inspired by Timmers (1998), Evans and Wurster (2000), and Tapscott et al.

Chapter 2 – Business models
54
(2000). In this process, Gordijn and Akkermans (2003) de-assign activities from their performing
actors, explore alternatives (different scenarios), and later re-assign the activities to their
executing actors to help organizations adapt to their environment. To clarify the discussion
between stakeholders, these authors split the process into two questions: 1 - Which value adding
activities exist; and 2 - Which actors are willing to perform these activities.
Other proposals have been presented to consider change in business models, but have
serious limitations. For instance, Petrovic, Kittl, and Teksten (2001) introduced a generic business
model change methodology where the concept of mental models is central. According to the
authors, to perform changes in an existing business model it is necessary to modify mental models
of the elements involved in the changes, otherwise the improvements will only be successful in
changing technological aspects or, at best, the processes. However, the proposal is generic and
does not provide guidelines on how to apply it. Papakiriakopoulos et al. (2001) also proposed a
four stage systematic method with the purpose of transforming a business model. However, their
proposal responds to the need for changing its technological infrastructure, neglecting changes
driven by a new market or business opportunities.
In certain contexts, business models can be extremely dynamic. If the business model
already exists, it may be necessary to perform a continuous evaluation to adjust it to possible
changes. Bouwman et al. (2012) proposed a business model roadmap – a plan that, grounded on
intermediary steps, guides the development from an existing business model to a desired one. The
roadmap is carried out at two levels of analysis. The first points out what should be changed to
enable the new business model. The second addresses the activities that need to be carried out to
enable the changes. The business model roadmap shows the relationships among the activities that
must be executed to enable change and can be visualized through a graph that defines the
relationships among the activities. In many cases, when the need of change occurs, managers have
several possible alternative scenarios, which must be analyzed to discover the solution that better
fits their aims (Bouwman et al., 2012). This approach had already been proposed by Gordjin
(2002) and shows a clear connection between this research topic and the evaluation of business
models.
Introducing change in a business model is a delicate task. It is necessary to perceive the
need to change, revisit adopted options, and consider possible alternatives capable of responding
to change (e.g., different goals, arrangements, and particular expectations of the involved people).
2.2 Business models and value networks
The value chain developed by Porter (1985) has been used to understand and analyze
industries, particularly manufacturing (Peppard and Rylander, 2006). It consists in a set of
interrelated generic activities common to a range of firms, which Porter (1985) distinguishes
between primary and support. The former are directly involved in the firm’s offer and
consequently in its value creation. They are grouped in five main domains: inbound logistics,
operations, outbound logistics, marketing and sales, and service. The latter support the primary
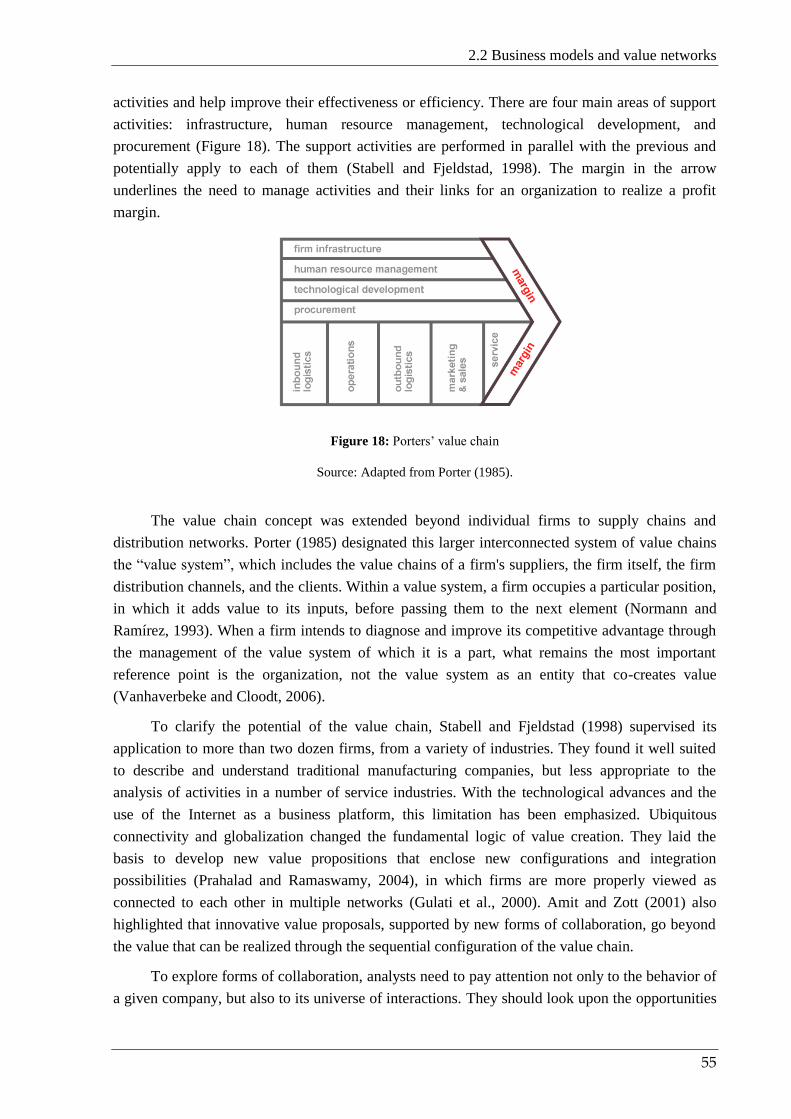
2.2 Business models and value networks
55
activities and help improve their effectiveness or efficiency. There are four main areas of support
activities: infrastructure, human resource management, technological development, and
procurement (Figure 18). The support activities are performed in parallel with the previous and
potentially apply to each of them (Stabell and Fjeldstad, 1998). The margin in the arrow
underlines the need to manage activities and their links for an organization to realize a profit
margin.
Figure 18: Porters’ value chain
Source: Adapted from Porter (1985).
The value chain concept was extended beyond individual firms to supply chains and
distribution networks. Porter (1985) designated this larger interconnected system of value chains
the “value system”, which includes the value chains of a firm's suppliers, the firm itself, the firm
distribution channels, and the clients. Within a value system, a firm occupies a particular position,
in which it adds value to its inputs, before passing them to the next element (Normann and
Ramírez, 1993). When a firm intends to diagnose and improve its competitive advantage through
the management of the value system of which it is a part, what remains the most important
reference point is the organization, not the value system as an entity that co-creates value
(Vanhaverbeke and Cloodt, 2006).
To clarify the potential of the value chain, Stabell and Fjeldstad (1998) supervised its
application to more than two dozen firms, from a variety of industries. They found it well suited
to describe and understand traditional manufacturing companies, but less appropriate to the
analysis of activities in a number of service industries. With the technological advances and the
use of the Internet as a business platform, this limitation has been emphasized. Ubiquitous
connectivity and globalization changed the fundamental logic of value creation. They laid the
basis to develop new value propositions that enclose new configurations and integration
possibilities (Prahalad and Ramaswamy, 2004), in which firms are more properly viewed as
connected to each other in multiple networks (Gulati et al., 2000). Amit and Zott (2001) also
highlighted that innovative value proposals, supported by new forms of collaboration, go beyond
the value that can be realized through the sequential configuration of the value chain.
To explore forms of collaboration, analysts need to pay attention not only to the behavior of
a given company, but also to its universe of interactions. They should look upon the opportunities

Chapter 2 – Business models
56
offered by the network concept and explore the advantages that can be gained by recognizing and
fomenting interrelationships. This idea lies at the foundation of the “value constellations”
introduced by Normann and Ramírez (1993), of “strategic networks” proposed by Gulati et al.
(2000), of “value net model” suggested by Parolini (1999), and of “value networks” (Allee, 2008).
According to these authors, the conduct and performance of firms can be better comprehended by
examining the network of relationships in which firms are embedded. Its elements should look
beyond the legally relevant demarcation of the firm and consider their context to, for example,
enhance value propositions, extract value from the network setting, or disclose new ideas to bring
and tie together different elements into a network. The established collaborations have the
potential to create value that no single firm would be able to create alone. They offer the
opportunity to explore and develop sustainable and innovative value propositions that can
strengthen the network.
Even consumers are increasingly engaged in defining and creating value (Prahalad and
Ramaswamy, 2004). It has been a shift in the role of the consumer “from isolated to connected,
from unaware to informed, from passive to active” (Ibid., , p.4). In some particular situations,
customers can even assume a more active participation, creating value for other customers, for
instance through their contributions in forums (Stähler, 2002).
Value within network configurations is not created in sequential chain, but in complex
constellations (Vanhaverbeke and Cloodt, 2006). Its elements provide services and products
grounded on a complex configuration of relationships and activities. The established connections
diminish the focus on individual organizations and underline the role of the items offered by the
network. However, the joint effort will only be viable if the ones involved in their
accomplishment are able to obtain benefits that can justify their participation. The value created
and appropriated by the different players must be managed. Stand-alone analyses do not work
when the success of a company depends on the collective satisfaction of other elements of the
network (Iansiti and Levin, 2004). Normann and Ramírez (1993) and Parolini (1999) pointed out
the need to resort to bargaining mechanisms to promote eventual adjustments to new
circumstances and balance the network pursuit for joint value creation.
Network configurations also offer innovative ways to explore the firms’ resources. While
the resource-based view has locked resources within a single firm (Barney, 1991), the network
scenarios extends the firms’ frontiers. This allows them to access assets beyond their boundaries
and combine them with their own solutions. When resources are the focus of analysis, the network
structure and the established relationships are by themselves a valuable resource, since its
complexity and value is, in most of the cases, very arduous to imitate or to substitute. A powerful
and influential position in the network is usually associated with assets, resources or core
competences required for the functioning of the network. Brandenburger and Stuart (1996)
underlined the impact that network participants with bargaining power can have on the
distribution of value.
Gulati et al. (2000) detailed the kind of ties established among the network elements to
obtain clues on how these could obstruct movements, lead to possible locks, or encourage
undesirable conducts. Their work revealed three types of relational characteristics that must be

2.2 Business models and value networks
57
looked at to enhance the understanding of effects with impact on business models: network
structure (overall pattern of relationships within which the network is embedded), network
membership (its composition, for instance nodes, status, and resources), and tie modality (rules
and norms that oversee the network). To test the potential of their proposal, the authors applied it
to scenarios of study and used concepts from social network analysis to study the network
proprieties (Gulati and Gargiulo, 1999). The investigation focused on the network structure, but
did not consider aspects that could influence its stability and viability. It did not provide clues
concerning preventive measures that could disclose alternative behaviors, as well as, conditions
that could influence the maintenance or abandonment of the participants in the network.
Neither Normann and Ramírez (1993), nor Gulati et al. (2000) provided a technique to
represent their networked configurations. Allee (2008) uses a representation similar to the value
maps developed by Tapscott et al. (2000), see Figure 8. Parolini (1999), inspired by Porter (1985)
and graph theory, maps value networks as an unbundled set of activities, which are linked by four
possible flows: material, information, financial resources, or influence relationships. The activities
are represented as nodes and the flows among them as arcs. Figure 19 presents a partial example.
Figure 19: Generic value-creating system in the electronic publishing industry
Source: Adapted from Parolini (1999).
The network has a dynamic nature (Recuero, 2004) that results from factors associated with
a large number of parties that must be taken into account, for instance, to satisfy a specific
customer need or to address a temporary market opportunity. It is usually characterized as a
decentralized environment, which includes different companies, often with different (and also
conflicting) requirements, without a single point of authority for decision making (Wieringa et al.,
2005). Even the border between the network and its external partners is not always easy to define,
since networks often try to influence its environment and different stakeholder groups. Similarly,
the social context in which firms are embedded influence the network relationships and its
performance (Gulati et al., 2000, Parolini, 1999).

Chapter 2 – Business models
58
Networked business models are characterized by a large number of interconnected
participants that depend on each other. In these complex configurations, it is imperative to
continuously analyze the network relationships and obtain insights about problematic occurrences.
We must integrate in our approach mechanisms that look for the best way to create, extend, and
leverage value interdependencies among organizations. It is also critical to combine their
individual expectations and the network overarching aims, which must be done by managing
conflicting and cooperative interests.
2.3 Conclusion
To develop an approach to discuss, design, and evaluate business models, we reviewed the
literature on this domain. The obtained insights aid us to perceive how we could use the outcomes
of the business model study to specify the high-level requirements of its supporting information
system. Below, we will present overall remarks on the reviewed literature (e.g., common
denominators and existing limitations) and discuss topics to consider in the development of
BIZ2BIS.
Our starting point was Timmers’ (1998) definition, where he states that a business model is
“an architecture for the product, service and information flows, including a description of the
various actors and their roles; a description of the potential benefits for the various actors; and
description of the sources of revenues”, was our starting point. Afterwards, the literature review
revealed the diversity of available proposals and its fragmentation over different disciplines such
as information systems, strategy, and innovation. We chose the framework proposed by Pateli and
Giaglis (2003, 2004), to organize our literature review. In this framework, a business model is
decomposed into seven sub-domains: definitions, typologies, components, conceptual models,
adoption factors, evaluation models, and change methodologies.
Initially, the research on business models was lacking in consensus. More recently, a
convergence of ideas within the domain is obvious. The framework developed by Osterwalder et
al. (2005) to synthesize past research is a clear example of an initial stage of maturity in the field.
Its three categories: 1 - Business model concept (covers definitions and components); 2 - Types of
business models (typologies); and 3 - Business model instances (descriptions and representations
of real business models) almost directly matches the first four sub domains of Pateli and Giaglis
(2004).
We reviewed business model definitions, typologies, and components to disclose the topics
that we should consider. By analyzing definitions, we verified that most of them included
concepts, such as value propositions, network partnerships, business architecture, business
actors/roles/resources, or revenue sources. Our findings were later confirmed by the research
performed by Al-Debei and Avison (2010), who suggested a unified business model conceptual
model with four dimensions: value proposition, value architecture, value network, and value
finance. This will be one of our working guidelines.

2.3 Conclusion
59
The typologies proposed in the literature showed us a tendency in perceiving different
categories of business models as building blocks that can be combined in multiple ways. Their
higher level of abstraction and descriptive nature make it easy to comprehend and discuss the
business models available to answer an identified need. From the available proposals to visually
represent business models, we identified relevant elements such as actors, value propositions,
business flows (information, services, money, or intangibles), activities, and resources used in
their execution. We share Allee’s (2008) conviction that the benefits obtained through intangible
forms of value can aid in disclosing motivations for people to engage in network’s relationships.
The extra knowledge gathered on intangible flows enhances network comprehension and provides
extra hints to model, discuss, design, and evaluate the network. We also acknowledged the
difficulty in evaluating all kinds of value propositions using an economic unit of measure. For
instance, information and intangible flows have particular characteristics that result from the
emergent proprieties of the network to which they belong and, depending on who assesses them,
can be evaluated very differently.
Our literature review on components covered different perspectives and revealed a wealth
of information. According to Gordijn et al. (2005), this research domain evolved from shopping
lists (sometimes presented as part of definitions) to components as building blocks, reference
models and ontologies. Authors like Shafer et al. (2005) and Osterwalder and Pigneur (2002)
synthesized the literature at that time and identified regularly mentioned components. The ones
identified by the latter researchers formed the basis for the Business Model Canvas (probably the
most popular tool in the field), which allows researchers and practitioners to design business
models. This tool creates a common space of discussion among actors from different domains and
with distinct interests, which promotes discussion, communication, and innovation.
The Business Model Canvas is focused on individual companies, which makes it less usable
in the study of networked business models. We do not intend to reduce the importance of studying
a business model from the viewpoint of a single firm. However, the technological advances
provided the basis to develop new value propositions that enclose new configurations. Therefore,
it becomes critical to examine the network of relationships in which firms are embedded. This
redefinition of value has been attracting the attention of scholars like Gordjin (2002), who
developed the e3-value ontology to model networked value constellations. This ontology models
value flows within a value network, depicts its supporting activities, and allows to model
alternative scenarios. This author underlines the role of business models as the first step to obtain
the high-level requirements of their supporting information systems, smoothing the transition to
their development. In addition, by opening new research directions, it explores how value models
can be linked to business process models.
Faber et al. (2003) also noted that the developed work on business model components
provided a rather limited perspective on cross-company collaboration in complex value networks.
Therefore, they searched for common components that could be used in networked business
models (Faber et al., 2003, Bouwman et al., 2008c). Their work resulted in the development of the
STOF framework, which describes the interdependencies between the four core domains, i.e.
Chapter 2 – Business models
60
service, technology, organization and finance, as well as a detailed description of each domain.
They focused their design on ICTs-enabled services.
The above-mentioned approaches to design business models possessed an unquestionable
relevance to our work. Their study allowed us to detect different perspectives and features to
integrate in our approach to discuss, design, and evaluate business models in network
configurations. They also contributed to stress the importance of establishing a connection point
between the study of the business models and the specification of the high-level requirements of
their information systems. Next, we will detail some of gathered guidelines used as structural
elements in the conceptualization of our approach.
The Business Model Canvas and the e3-value ontology showed us the importance of using
our approach as an effective communication tool to think about, discuss, innovate, and articulate a
business model. Therefore, we decided to develop intuitive, simple to use, and supporting tools
that could guide the promotion of collaborations with all the business model’s participants and
thus make it easier to follow and exploit every source of knowledge. We aim at diminishing the
difficulty in accessing information and obtaining a comprehensive view of the business model,
which is especially critical in early stages of the study, where information is scarce and hard to
understand as a whole. The Business Model Canvas, the e3-value ontology, and the STOF
framework also showed us the importance in defining a standardized outlined plan for the
application of our approach in order to offer additional guarantees that its users do not overlook
critical issues. With a well-defined structure, we also intend to avoid dependencies from their
experience and personal judgments. Similar to these three proposals, we will also make use of
alternative business model scenarios to encourage discussion, explore new opportunities, facilitate
discussion on possible changes, and encourage innovation.
The Business Model Canvas pointed out components used to address “private” business
models, which are also relevant in networked business models. This common denominator can be
used to define links between the business model of a firm and the networks of inter-organizational
business models to which that firm belongs. In turn, the e3-value ontology moved from linear
cross-organizational cooperation to more complex networked value constellations. As in our focus
of research, it explores business model ideas highly supported by information systems. The work
developed in this ontology showed us the importance of understanding the value propositions
exchanged among actors and the use of the performed activities as a link between those value
propositions and the processes that support them. In our approach, we also decided to search and
establish these links to translate the business models (including its social context) into
requirements for the specification of its underlying information system.
The STOF framework details and designs services enabled by ICTs, determining their
technical architecture, describing the structure of the multi-actor value networks used to support
the offered services, and analyzing generated revenues. It takes into account critical design issues
that can influence business model success, per and among different domains (service, technology,
organization, and finance), to balance design choices. We also consider relevant to disclose the
dependencies among these domains. However, we want to take a step forward. We want to
integrate the network context and consequently the expectations of the network elements in this
2.3 Conclusion
61
web of influences and dependencies. In addition, the STOF framework strengthened our choice to
consider the concept of “service” as the connection point between two domains: business models
and information systems.
The relevance that technological issues can possess on networked business models
highlights the need to integrate them in our proposal. The e3-value ontology and the STOF
framework have already contributed to explore the connections between business models study
and their technological support. The former establishes a link between value propositions and
their underlying business processes, while the latter details how the service offering can be carried
out in a technical perspective. Despite the efforts of these approaches, the gap between business
models and the development of their information systems has not yet been overcome. We intend
to bridge the gap by developing an intermediate step that gathers the outcome of the analysis of
the business models and of their contexts. This outcome should be understandable by all
stakeholders and by the teams responsible for the technical development, or deployment. It must
work as a point of contact, a bridge between distinct (but converging) interests, that brings
together aspects as diverse as the technological illiteracy of the business model participants, their
expectations, the business model value propositions, the performed activities, the regulatory
trends, or the provided technological services. The intermediate step details the high-level
requirements of the underlying information system in a business model driven way. It is thus
possible to obtain, in an early stage, a revised and validated specification of its high-level
requirements, strengthening its chances of a successful adoption.
When exploring the remaining sub-domains of the Pateli and Giaglis framework (2004), we
became aware of open lines of research questions in three of them, namely adoption factors,
change methodologies, and business model evaluation. There were no indications on how to
address social factors in the development, adoption, or modification of real-world business
models. Furthermore, the available proposals to evaluate business models were mainly focused on
financial flows that resulted from direct interactions between those who buy and those who sell a
service. These proposals did not consider contextual influences that could affect this evaluation.
The vulnerabilities mentioned above reinforced our research option of integrating social
aspects in the study of business model scenarios. The factors addressed by the literature in
network configurations (e.g., environmental influences, dynamic interactions, or negotiation
mechanisms) also contributed to strengthen the importance that a social outlook could have on a
business model. Its inclusion enhances the knowledge on business models and supports the
understanding of the intertwined web of value propositions in these decentralized environments,
without a single point of authority for decision making. Consequently, it minimizes the extremely
difficult task in leading a negotiation process among actors. The contributions from the literature
review on business models to the conception of our approach are summarized in Table 6.

Chapter 2 – Business models
62
Table 6: Business model guidelines to the development of BIZ2BIS
Author Topics to address in the development of BIZ2BIS
Timmers (1998), Al-Debei and
Avison (2010)
Cover dimensions of the business model concept such as value proposition, value
architecture, value network, and value finance
Osterwalder and Pigneur
(2002), Shafer et al. (2005),
Faber et al. (2003)
Take into account business model components like value proposition, technology, cost
structure, revenue model, target customer, distribution channel, value configuration, and
partner network
Gordijn (2002), Osterwalder
(2004), Bouwman et al. (2008b)
Define a standardized outlined plan for the approach application in order to guarantee
that critical issues are not overlooked and that the dependencies from analysts’
experience and personal judgments are minimized
Gordijn (2002), Osterwalder
(2004)
Use the approach as an effective communication tool to think about, discuss, innovate,
and articulate a business model
Faber et al. (2003), Shafer et al.
(2005), Gordijn et al. (2009)
Address the potential offered by the network concept in the business model domain
Parolini (1999), Weill and
Vitale (2001), Allee (2008)
Detail the kind of ties established among the network elements to obtain clues on how
these could strengthen the business model, obstruct movements, lead to possible locks or
encourage undesirable conducts
Osterwalder and Pigneur
(2010)
Develop intuitive and simple to use supporting tools that can promote collaborations
with all the business model’s participants
Brandenburger and Stuart
(1996), Gulati et al. (2000)
Identify vital dependencies in a the networked business model (e.g., important resources,
indispensable actors, critical value propositions)
Parolini (1999), Normann and
Ramírez (1993), Iansiti and
Levin (2004)
Develop negotiation mechanisms to promote eventual adjustments to new circumstances
and balance the network pursuit for joint value creation
Gordijn (2002), Bouwman et al.
(2012)
Point out the need to change, to reconsider adopted options, revisit past assumptions,
and rebuild taking into account new contexts
Gordijn and Akkermans
(2003), Bouwman et al. (2012)
Make use of alternative business model scenarios to encourage discussion, explore new
opportunities, facilitate discussion on possible changes, consider viable alternatives, and
encourage innovation
Pouloudi et al. (2003), Pateli
and Giaglis (2004), Stanoevska-
Slabeva and Hoegg (2005)
Address social factors in the discussion, design, adoption, and change of business
models
Tapscott et al. (2000), Weil et
al. (2005), Allee (2008)
Consider other influences beyond financial flows in the business model evaluation (e.g.,
prestige, capability to lock-in, and brand recognition, contextual influences)
McGann and Lyytinen (2002),
Gordijn (2002), Bouwman et al.
(2012)
Explore connections points between business models and their technological support
Gordijn (2002) Translate business models (including its social context) into high-level requirements for
the specification of its underlying information system
In the next chapter we will look for insights that can help us consider the social dimension
of networked business models in our approach.
63
Chapter 3
The social dimension of business
models
The literature review in the previous chapter allowed us to identify concepts, viewpoints,
and proposals from the business model domain that stand out frequently. The performed survey
also strengthened our conviction that a business model is not designed in a total vacuum and
stressed the importance of social issues in its conception and development. Although many of the
available proposals did not focus on the study of business models in network configurations and
on the relationships established among its stakeholders, the undeniable technological advances
made them a reality. The complexity of influences and interests that can be found in these
scenarios highlighted even further the relevance that the social dimension may have in the study
of business models. To overcome this shortcoming, we decided to complement the insights
gathered in the previous chapter with contributions from the social domain, endowing our
research with an additional and innovative look towards the business model field. In this
endeavor, our main inspiration was Actor-Network Theory (ANT). To clarify its contributions,
this chapter explains its key ideas, underlines how they influenced our work, and discusses how
its concepts were integrated in our approach to guide the study of networked business models and
provide valuable outcomes to their stakeholders.
ANT, also known as “sociology of translations” (Callon, 1986b), describes socio-technical
ensembles as heterogeneous networks of human and nonhuman actors (e.g., people, organizations,
cultures, ideas, plants, computers, and money). In ANT, neither the social nor the technical are
privileged. Instead, the interrelated character of social and technical actors is stressed. ANT brings
forward a more profound understanding of the networked business model and offers us a
privileged position to explore the relationship between business models and information systems.
Its lens can reveal insights on how business participants’ interests are perceived, and aligned, as
well as on how uncertainty and ambiguity can be managed.
We will start this chapter by explaining why a socio-technical account can contribute to
enhance business model study (section 3.1). Then, in section 3.2, we will present ANT, providing
its historical background and covering its salient features. In section 3.3, we describe ANT’s
vocabulary used in our study. Section 3.4 expands on the main arguments of this chapter,
Chapter 3 – The social dimension of business models
64
addressing the reasons why we used ANT in the business model field. It explains in detail how
and which concepts of ANT have been employed, i.e., integrated in our approach to study
business models in network configurations. It also points out ANT’s contribution to the
specification of the high-level requirements of the information system that will support the
business model. In section 3.5, we explain how it is possible to operationalize the information
gathered using ANT and, in section 3.6, we describe particular aspects of other social theories and
concepts that we used to cover issues not addressed by ANT. In section 3.7, we present the inputs
brought from the social domain to the business model study. Finally, in section 3.8, we present
our conclusions.
At the end of the chapter, the reader should be able to:
Comprehend ANT’s principles and its main concepts;
Understand the advantages of complementing business theories with ANT;
Identify social concepts used to shape our approach and perceive their application to
the business model domain.
3.1 Social and technical intertwine in business models
Jomini, a brilliant general in the French and later in the Russian service in the nineteenth
century (Shimizu et al., 2006), argued that the principles of war were always valid, independently
of the situation or the technology employed. He defended the effectiveness of massive frontal
attacks. In his opinion, this principle was valid regardless of the technology employed. These
ideas of direct attacks had their basis in the era of muskets and became less attractive with the
repeating rifles, but remained valid until the beginning of the 20th century. However, with
machine guns, widely used in the First World War, direct attacks became unreasonable. These
events show how technological developments in war equipment can compromise established
military principles and strategies.
It is also interesting to ponder the ways in which technology can embody specific politics,
forms of power and authority. The bridges over the ark ways on Long Island, New York, are a
good example of this. Robert Moses, who built roads, parks, bridges, and other public works from
the 1920s to the 1970s in New York, designed and built many of those overpasses with as little as
nine feet (2,75 m) of clearance at the curb. Through evidences provided by Moses’s biographer,
Robert Caro, it was possible to discover that this architectonic option intended to achieve a
particular social effect, reflecting Moses social class bias and racial prejudice. Automobile-
owning whites of upper classes would be free to access the parkways. Poor people and blacks,
who normally used public transportation, were kept off that area because the twelve-foot (3,65 m)
tall buses could not clear the overpasses. One consequence was to limit access of racial minorities
and low-income groups to that part of the city (Winner, 1986).
The scenarios described above illustrate how technology is interwoven with aspects so
distinct such as society, science, politics, and economics, as described in Thomas Hughes (1986)
metaphor of the “seamless Web” (it conveys the notion of holism and points to the fading of

3.2 Situating ANT
65
boarders). This ensemble between the social and technical is also evident in the nature and
configuration of the present business models. For instance, the business model developed by
Blizzard to support World of Warcraft, a Massive Multiplayer On-line Role Playing Game, that
exceeded, in October 2010, 12 million players (Blizzard Entertainment Inc., 2011), owes its
network configuration to the astounding advances in ICTs. However, the game options and its
extensions reflect social worries. For instance, it is possible to setup parental control preferences
(to define a time-table, or to establish a maximum time of use) to answer parents worries. The
game also provides opportunities. For example, users with limited time to play their game but
with money to spend encouraged the commercialization of the game features by others (Correia,
2006). Asian companies were able to introduce game items into the market at very low cost and
the original Blizzard business model had to be readjusted.
The World of Warcraft business model is just another example that supports the conviction
that the technical and the social worlds are profoundly intertwined. On the one hand,
technological improvements enable the development of innovative world-wide business models
and play a key role in today’s organization. On the other hand, the technological solution also
embodies social concerns and possesses social implications that affect their environment.
The study of the relationships between the technical and the social provides additional
insights to explore the specificities of the environment where business models operate. For
example, it can provide us with the means to understand what is expected from technology, to
comprehend its implication in the business model activities, to search for new solutions or novel
configurations that can satisfy the business participants’ interests, or to create the necessary
conditions to promote the implementation of the business model. To include in the study of
business models the capacity to regard their social and technical positions, emphasizing their
interrelated character, we complemented business model theories with insights from ANT. Next,
we will explain some of ANT’s used key ideas and describe how they influenced the research
outcome in our study.
3.2 Situating ANT
Before introducing ANT’s tenets, we will present its origins. To detail its roots would
quickly make us overpass the scope of this chapter. However, it is our belief that to map out its
background, even if succinctly, will be helpful to position ANT.
Several research domains proposed a number of factors as determinant of human thinking.
We will concentrate on the proposals with stronger ties to ANT to clarify the course that led to its
appearance. This is the case of the sociology of knowledge (Fine, 1996), shaped by the work of
seminal researchers as Marx, Mannheim and Durkheim, which emphasized the causal role of
social factors in shaping individual belief. These researchers dismissed the viewpoint suggested
by mathematics and the natural sciences from their social analysis (Kukla, 2000). In turn, the
sociology of science was dominated by the institutional approach of Robert Merton (1973) and his
supporters. This designation could be misinterpreted as a sub discipline of sociology of

Chapter 3 – The social dimension of business models
66
knowledge that dealt with scientific knowledge. Instead, it addressed science as an institution and
the study of scientists’ norms, values, career patterns, as well as the reward system that drove
scientific activity. This implies that scientific knowledge continued to be outside the grasp of this
branch of research (Fine, 1996, Kukla, 2000).
With the rise of the movement referred to by its practitioners as sociology of scientific
knowledge (SSK) (Woolgar, 1988), the types of social explanations that figure in the classical
sociology of knowledge were applied to the intellectual content of science. This movement gave
birth to the “Strong Programme” (Barnes, 1974, Barnes, 1977, Bloor, 1976), initiated by the so
called Edinburgh school in the mid-1970s. This school was well-known for its postulates of
symmetry, objectivity, causality, and reflexivity of any explanation of social phenomena (Bloor,
1976, p. 5). It argued that social scientists when tracing the cause of beliefs should be impartial to
its truth or falsity, and that both sides of these dichotomies require explanation (Bloor, 1976).
Barnes, in marked contrast with Bloor, did not accept the possibility of general theories and
restricted his investigation to case-by-case analysis (Manier, 1980).
The Strong Programme is also related to the work done at Bath School, see for instance,
Harry Collins (1975). This line of research promoted, in particular, the Empirical Programme of
Relativism (EPOR) and emphasized micro-social studies of laboratories and experiments. Its
attention was focused on exploring scientific controversies that contributed to exposing the
interpretive flexibility of scientific results (Pinch and Bijker, 1984, Pickering, 1992).
Pinch (a Collin’s student) and Bijker explored an emerging interest in the social study of
technology to extend topics from SSK into the domain of technology (Pinch and Bijker, 1984).
They proposed the Social Construction of Technology (also referred to as SCOT) and took
“relevant social groups” as their starting point. SCOT, like EPOR, emphasizes that scientific
findings are open to more than one interpretation and the closure of debate. However, in SCOT
the interpretive flexibility is linked to the social groups’ capability to construct and interpret
technology according to their needs. This can be contentious, since there is flexibility in the way
the solutions are designed.
The closure in SCOT emerges when the social groups involved in a problem decide that the
problem is solved - an artifact achieves stabilization. From the early history of the bicycle, Pinch
and Bijker (1984) provide examples of closure and stabilization, social shaping, interpretive
flexibility, and the influence of social groups (e.g., the discussion around the use of pneumatic
tires, the size of the wheels according to the interests of particular groups: women, older men, and
young men). These examples support the analysis of the causes for technological failure or
success.
SCOT can be identified under the general label of Science and Technology Studies (STS)
(House, 2004). STS is the study of science and technology in a social context. It follows the
principle that scientific knowledge and technologies do not evolve in a vacuum (Law, 2004). STS
is considered a branch of science studies, a descendant of it, or overlapping with it (House, 2004),
pointing out what was called by Steve Wolgar (1991) as the “turn to technology”.
3.2 Situating ANT
67
In the late 1970s new proposals that had similar concerns with certain aspects of SSK
appeared. However, their intention was to integrate new approaches. For instance, the book
Laboratory Life (Latour and Woolgar, 1979) is considered a landmark that guided the move
towards the study of scientific practices. Its attention was focused on what scientists really do by
looking at science “in the making” (Pickering, 1992).
The study of scientific practices and the idea that social and technical views are considered
on equal footing is central in another proposal that was born out of the interdisciplinary field of
STS: the Actor-Network Theory (ANT). Latour (1992b) noted that the difference in essence
regarding human and non-human is the major contention between ANT and sociological position
of SSK. In the latter, as stated by Cressman (2009), it is necessary to recognize in advance the
essence of humans and to distinguish their actions from the inanimate behavior of technological
and natural objects (e.g., computers, laboratory instruments, research institutes, protocols, and
standards). In ANT, human and nonhumans - from an analytical stance - are treated equally.
Since the mid 1980s, Michel Callon and Bruno Latour worked on ANT (Callon and Latour,
1981) at the Centre de Sociologie de l'Innovation of the École Nationale Supérieure des Mines de
Paris. A variety of intellectual traditions are detected in ANT. For example, Algirdas Greimas’
actant theory (1982), Michel Serres’ notion of translation (Brown, 2002), Foucault’s theory of
power and micro-politics (1980), and Deleuze and Guattari’s conception of the assemblage
(1987). Subsequently, ANT has been enriched by its original actors and others, like John Law
(1992) and Madeleine Akrich (1992). Next, we will initiate its discussion.
ANT accommodates the role of non-humans in the process of knowledge construction and
social change (Toennesen et al., 2006). It considers that both technical and social determinism can
be flawed and proposes a socio-technical account (Latour, 1986a, Law and Callon, 1988) that
denies that purely technical or purely social relations are possible and neither the social nor the
technical positions are privileged. Harbers (2005) highlights this entanglement between the social
and the technical by putting the question: “Where does one draw the line between man and
machine, between human responsibility and technical inevitability, between the subjective world
of politics, culture and morality and the objective world of science, technology and nature?”. This
author (2005, p. 10) argues that “we are confronted here with a hybrid situation in which human
beings and technology are tightly interwoven - a mixture, a muddle of man and machine”. By not
accepting a fundamental distinction between human and nonhuman, which is central to Western
sociology, the actor-network approach is based on a pre-modern footing (Law, 2004).
ANT’s authors consider that the flip side of the claim that technology is socially shaped is
the claim that technologies shape their social contexts (Brey, 2003). For instance, the steam
engine transformed society by providing new forms of production; the Gutemberg printing press
changed it by revolutionizing the access to written information. The impact technology has had on
society has provided new scenarios to explore and has changed behaviors. For this reason, this
movement of transformation considerers that the idea of society as a network of social relations is
false, since society is made up of socio-technical networks (Ibid.).
Chapter 3 – The social dimension of business models
68
In ANT, human interaction relies on material elements, which demands that non-human
actors should also take “their rightful place as fully fledged actors in associations, relations and
networks” (Ashmore et al., 1994 , p. 735). These actors can have an influential role within a
network, depending on their own actions. They should be treated using the same conceptual
apparatus: described through the same language and analyzed according to the same procedures.
The symmetric treatment of human actors and technology has been criticized in the literature
(Collins and Yearley, 1992). However, we do not interpret that assumption literally. To regard
them as equal signifies considering the roles, activities and importance assigned to both as they
are engaged in the network.
ANT approaches science and “technology in the making” as opposed to “ready made”
science and technology (Latour, 1987). Through ANT’s guidelines, it is possible to explore how
networks are forged and how exchanges are conducted. In addition, it also improves the
comprehension about the interests that sustain the actors, the reasons that allow networks to
achieve stability, the competition among networks, and how they are made more durable over
time (Tatnall and Gilding, 1999).
The example presented below, which is considered an emblematic reference in ANT’s
bibliography, was introduced by Callon (1987) and illustrates ANT’s logic through the attempt to
introduce an electric car in France. The associations created in that network context are traced and
analyzed as a fusion of efforts performed by the different actors to convince others, according to
their own interests (Bijker, 1994).
A group of engineers working for EDF (Electricité de France) in the early 1970s proposed the
development of an electric vehicle. In this venture, besides the specification of the vehicle’s precise technical
characteristics, they considered the social universe in which the car would be brought into play. Technological
topics, such as accumulators, fuel cells, electrodes, electrons, catalysts, and electrolytes are regarded as being
entangled with aspects so diverse as environmental factors (e.g., air pollution and noise caused by the motor
vehicle), social issues (e.g., consumer habits in which the private car constituted a primordial element of status),
or financial subjects (e.g., governmental agencies that could hold up the research and economic impact on
public transportations).
EDF’s engineers, in addition to their technical duties, also identified their collaborators on the project,
defined the roles, and attempted to enroll them. The Compagnie Générale d’Electricité would be asked to
develop the electric motor, Renault would assemble the chassis and make the car bodies, and companies that ran
urban transport systems would integrate the electric vehicles in their transport systems. Callon stated that
EDF’s engineers, whether they wanted or not, were transformed into sociologists, or what he calls “engineer-
sociologist” (Callon, 1986a). They permanently combined scientific and technical analysis with sociological
analysis to achieve success.
3.2 Situating ANT
69
Three years later and the support around the electric car and its society began to wane. Besides the
technical issues (the catalysts refused to play their part in the scenario presented by EDF), one of the main
problems of this project was the resistance of actors, like Renault, whose vision of the future was different from
that of EDF. In their opinion, the criticism geared at the traditional motor car was not a sign of a demand for a
new development. It merely expressed temporary worries. These factors, in conjunction with others like the
weakness of the environmental protest movements, led the project to an unsuccessful end. The traditional
motorcar industry maintained its power - during the electric car project Renault developed R5 and reached
excellent results. In spite of the failure of the EDF project, some changes have been introduced in the traditional
construction process (it pollutes less, the cars consume less petrol, and cost less to manufacture).
The project of the electric car, described above, illustrates how sociological and technical
considerations can be inextricably linked. The technological advances created the propitious
conditions to the development of the electric car that could change the French society. In this
venture, in addition to the technological component, the project’s leaders had to consider topics
such as environmental issues, industrial contributions, and governmental agencies that could
create a favorable (or unfavorable) context to the project development (e.g., financial aspects and
application of the technology). The engineers were, simultaneously, designing both a technology
and working with all the restrictions of the social world in which the vehicle would be deployed.
To address the perspectives of analysis brought up by a scenario like the one above, ANT
follows three principles, namely agnosticism, generalized symmetry, and free association (Callon,
1986b). Agnosticism implies coming into the investigation without any a priori assumptions. The
researcher has to abandon preconceptions and be impartial towards all actors in the network,
whether they be human or non-human - “No point of view is privileged and no interpretation is
censured” (Callon, 1986b, p. 200). Symmetry assumes that human and non-human actors have
equally significant roles and their conflicting viewpoints can be explained in the same terms by
employing a single explanatory stance. As Callon (Ibid.) puts it: “The rule which we must respect
is not to change registers when we move from the technical to the social aspects of the problem
studied”. Finally, the tenet of free association requires that there can be no assumed distinctions
between the technical and the social worlds in coming to an understanding of the phenomenon
being researched. These differences are considered contentious, since they should be the result of
analysis, rather than its point of departure (Callon, 1986b).
The actors are described in ANT based on the complex interactions they perform in the
interconnected network of relationships. ANT advocates that the researcher should follow them
around as they go about constructing heterogeneous networks, avoiding pre-established ideas
about the network (Toennesen et al., 2006). As Latour (1987) and Callon (1991) underlined,
actors are essentially defined by the relationships established among them, rather than by their
essential or inherent features.

Chapter 3 – The social dimension of business models
70
ANT’s seminal developers defined a particular vocabulary to identify the participants in a
network and to describe the means by which they are maneuvered, co-ordinated, aligned, and
rendered stable. Its concepts do not overlap the actors’ own vocabularies; on the contrary, it
provides the means to follow the actors respecting their own context (Latour, 2005, p. 29-30). In
the next section, we will start to disclose the way ANT’s lens helped us to look at networked
business models and how it inspired the development of our approach.
3.3 ANT’s vocabulary translated to the business model domain
Before presenting ANT’s key concepts, it is important to tackle the difficulties of
explaining it as a stable approach. ANT has received contributions from several authors, who do
not always share the same opinion and has been adopted by distinct research domains (e.g.,
information systems, biology, and health services). The creative and fertile networks which were
formed around ANT’s description have created the perfect conditions to reshape ANT’s meaning
and content. In fact, and following the notion that nothing is truly stable and is always subject to
change, each time ANT is integrated in a new research, it may suffer adjustments. Due to the
process of ongoing transformation that ANT has been subject to, its definition is no longer in the
hands of its mentors. Therefore, advancing with a single set of principles, the “true version”, is
very complex and contradicts the desire to perceive ANT as a set of practices with transformative
properties (Cloatre, 2005).
In the following sections, we will focus our attention on ANT’s concepts that helped us
describe a business model in a network configuration, disclose tactics performed when searching
for the alignment among its actors, and perceive the role of its underlying information systems. To
illustrate how these concepts can be applied in the business model context, we will provide an
illustrative business idea (FoodAtYourDisposal, described below). This idea was chosen due to its
simplicity, allowing the reader to concentrate on the adoption of ANT and not on the case
specifics.
The company HereForYou created a business (called FoodAtYourDisposal) to manage take-away
orders for several restaurants. The mediation between the customers and the restaurants is supported by a
portal. When an order is received, the request is sent to the selected restaurant that confirms the availability to
satisfy the request. When this happens, a cooking time is presented and the portal sends the information back to
the customers, to reconfirm. If they agree with the presented conditions, a HereForYou’s employee will pick up
the order at the restaurant and deliver it to the customer, from whom payment will be collected. Agreements with
local farmers were negotiated to offer special conditions of acquisition to restaurants doing business via the
portal and encourage their participation.

3.3 ANT’s vocabulary translated to the business model domain
71
FoodAtYourDisposal’s revenues are obtained through a small activation rate to access the portal and a
fee of 5% over each request. By paying extra fees, the restaurants can strengthen their presence in the portal
(e.g., put their menus at the top of the search results list or have special sections to advertise promotions).
3.3.1 Actor and actant
According to Latour (2005, p. 71) an actor is something (e.g., person, group, idea, car,
plant, or animal) that “acts, or to which activity is granted by others. It may not necessarily be the
source of an action, but something that modifies a state of affairs by making a perceptible
difference”. This definition does not account for the distinction between social and technological
elements and focuses its attention on the importance of the actions performed by the actors.
When actors act, they acquire competences. This process provides the necessary support to
distinguish between the concepts of actant and actor. An actant may be any agent, collective or
individual, that can associate or disassociate with other agents (Uden and Francis, 2009). Actants
participate in network associations, which in turn define them, name them and provide them with
substance, action, intention and subjectivity (Callon, 1986b). An actor is further defined as
“Whatever acts or shifts action, action itself being defined by a list of performances through trials;
from these performances are deduced a set of competences with which the actant is endowed (…)
An actor is an actant endowed with a character” (Akrich and Latour, 1992, p. 259). While actant
is the thing itself in its unspecified “nature”, actor comprises the competences which are attached
to it. The competences are negotiated in processes of trial (and error) (Uden and Francis, 2009). In
summary, the main difference between actors and actants is that only actors are able to put actants
in circulation in the system (Uden and Francis, 2009).
Latour (1992b) emphasized that what a network element is is not as important as the action
itself and the competences it performs within the chain. For example, a syringe, as a piece of
plastic and metal, is an actant. Within the context of a health center, a valid syringe acts and it has
an attributed competence (for instance, allowing inoculations) and it becomes an actor. Each actor
has its own goals that gain relevance when shared with additional actors. To achieve a set of
goals, the syringe has to be associated and aligned with surrounding actors such as nurses,
alcohol, cotton, patients, and vaccine cards. The network environment and the relationships
established among the actors influence how they redefine their behavior.
Actors are never located in bodies alone, but rather are patterned networks of heterogeneous
relations. For instance Bruno Latour (1988a) shows that Pasteur was nothing more than a network
of heterogeneous elements: laboratories, domesticated strains of bacteria, notebooks, statistics, a
farm at Pouilly le Fort, sheep, and vaccines. Pasteur was a combination of several elements which
produced “Pasteur-the-great-research network” (Callon and Law, 1997), which was an actor in the
French scientific research network. Each actor is made up of actors and at the same time is also
part of an actor. Thus, an actor (be it a person, a device, or, for instance, a text) may be
regarded as an intricate network in its own right (Latour, 2005, p. 71).

Chapter 3 – The social dimension of business models
72
In the FoodAtYourDisposal scenario, the actor concept in ANT led us to consider human
and non-human actors in the business model. The customers, the restaurants’ employees, and the
local farmers are examples of human actors, while the portal, the distribution scooters, and
governmental laws are non-human.
3.3.2 Network
The notion of network has been quite popular in the Social Sciences since the 1950’s, and
has also been used in a wide range of disciplines such as International Relations, Organizational
Analysis, Health Studies, Biology, Information Systems, and Geography (Cloatre, 2005). This
concept is a key factor in ANT and is defined as a "group of unspecified relationships among
entities of which the nature itself is undetermined" (Callon, 1993, p. 263). This definition
reinforces ANT’s inclusive character (it is not restricted to human actors) and characterizes
networks as a shifting system of relationships, alliances, and exchanges among their elements
(Underwood, 1998).
In ANT, like in geography, the network concept involves a series of transformations, and
translations (how artifacts become a result of negotiations that seek an alignment of the actors’
interests). For instance, the spreading of networks in order to manage natural resources shows
transformations carried out by human intervention in the physical landscape, altering it (McBride,
2003). Another example would be the control of water through canals and dykes in Southern
Mesopotamia, which provided the basis for capitalizing on the economic potential of the southern
plains. This change allowed the emergence of early large-scale communities in which culture
could develop and people could move beyond subsistence living (Leick, 2001). This interpretation
of the network concept emphasizes the understanding of circulations and transformations that
reshape networks through series of transformative practices. Actor and network redefine each
other permanently - actors change networks and networks define actors.
The massive installing of Internet cabling distorted the above connotation assigned to the
network concept. Nowadays, the term network is usually understood as a set of connections
through which information can circulate in an unaffected way. It clearly means “a transport
without deformation, an instantaneous, unmediated access to every piece of information” (Latour,
1999a, p. 15). This “new perception” caused some misinterpretations. However, the network
concept, in ANT context, implies a series of transformations.
ANT is interested in understanding how networks enlist actors and in how translations are
performed to overcome resistances and achieve network stability. It also focuses on how actors
are motivated, as well as on the actions developed to prevent them from abandoning the network.
Furthermore, ANT covers how networks become increasingly transportable (able to be used by
other networks), and how some come to be larger and influential than others. Manifestations of
power (where it comes from and how it is exerted) are also addressed.
Power and network connectivity are intertwined, since each network is the effect, or result,
of the connections that constitute it. In ANT, we should not ask if one network is more powerful
than another; rather, we should ask if an association is stronger than other. As Latour puts it

3.3 ANT’s vocabulary translated to the business model domain
73
(1986a, p. 265), “When you simply have power – in potentia – nothing happens and you are
powerless; when you exert power – in actu – others are performing the action and not you (…)
[power] as an effect, but never as a cause”.
In this section, it is also important to clarify that the ANT’s notion of network needs to be
perceived as more than the agglomeration of actors, more than just an entity above the individual
level. As mentioned in the previous section, each actor is made up of actors and, simultaneously,
can be part of an actor. Or, using the vocabulary of actor-network, each actor is itself a
(simplified) actor-network and is at the same time part of other actor-networks.
Actor-networks are the gathering of relationships that create a particular entity that might
appear as unified, and refers both to the whole and the parts (Cloatre, 2005, p. 94). Everything,
then, is an actor-network, “reducible neither to an actor alone nor to a network (…) An actor-
network is simultaneously an actor whose activity is networking heterogeneous elements and a
network that is able to redefine and transform what it is made of it” (Callon, 1987, p. 93)”. Based
on this perspective, a network element can be considered as both an actor and a network.
The term actor-network “is intentionally oxymoronic, a tension which lies between the
centred ‘actor’ on the one hand and the decentred ‘network’ on the other” (Law, 1999, p. 5). This
tension has generated questions that address the debate between agency and structure. However,
ANT did not intend to occupy a position in this debate and its authors have dismissed the issue.
ANT sidesteps the question since its central tenets are based on the idea that actors and networks
depend on each other and that no clear differentiation between the global and the local must be
performed. Networks are seen as complex arrangements of space, with no clear centre or
dependency on hierarchical relationships (McBride, 2003).
Using the perception described above, is not possible to have a micro or macro level of
analysis, they are “local effects of hooking up to circulating entities” (Latour, 1999a, p. 19). The
connections are mobile along the networks, challenging our notions of far/close, small scale/large
scale and inside/outside (Latour, 1996b). As Latour (1999a, p.18-19) described it, actor and
network “designates two faces of the same phenomena, like waves and particles, the slow
realization that the social is a certain type of circulation that can travel endlessly without ever
encountering either the micro-level – there is never an interaction that is not framed - or the
macro-level - there are only local summing up which produce either local totalities ('oligoptica')
or total localities (agencies)”. Since actors are actor-networks in infinity, it is necessary to choose
how the network under research is “zoomed in and out” and which actors are included to delimit
the phenomena under analysis (Nijland, 2004).
The concept of network in the business model domain provides an innovative look at the
FoodAtYourDisposal spatial configuration and at the associations among the actors. To consider
that a network element can be both an actor and a network makes it possible to explore other
networks with influence on the business model (e.g., the local farmers’ network could provide
clues on how to enhance FoodAtYourDisposal). The ability to consider overlapping dimensions
provides a more comprehensive vision of the network (including its boundaries) and enhances its
understanding.

Chapter 3 – The social dimension of business models
74
3.3.3 Theory
There is an ongoing discussion questioning whether ANT is a theory or a method. For
example, within the same year Callon’s opinion changed from a “method” or “certain instruments
of analysis” (Callon, 1986b, p. 33) to the more encompassing notion of an “analytical framework”
(Callon, 1986b, p. 196). As Latour (1999a, p. 20) put it, “Far from being a theory of the social or
even worse an explanation of what makes society exert pressure on actors, [ANT] always was,
and this from its very inception, a very crude method to learn from the actors without imposing on
them an a priori definition of their world-building capacities”.
As a theory, ANT addresses what to study (Gad and Jensen, 2010). However, it does not
explain why a network takes a particular shape. Instead, it is focused in exploring how networks
are created, how they are maintained, or how they collapse. Its authors believe in the advantages
of learning with actors not only what they do, but how and why they do it (Latour, 1999a). They
argue that explanations should arise out of this type of analysis that can provide insights about
emergent patterns of order and/or disorder. Latour urges that what circulates has to be defined by
what constitutes it. Among other aspects, it is characterized by the competences it is endowed
with, the associations it is made to support, its sanctions, and the background in which it is
circulating (Latour, 1996b)
As a method, ANT traces associations, controversies and uncertainties, not imposing a pre-
established grid of analysis on actors. It gives voice to the actors and learns from them without
prejudging their actions (Gad and Jensen, 2010). It focuses on description, which lies at the
foundation of its principles (not prediction or explanation). ANT’s advice consists in following
actors into translations to understand how these “define and associate the different elements by
which they built and explain their world” (Callon, 1986b, p. 201). In his unique way, Latour
makes the point, writing about the actors: “They, too, compare; they, too, produce typologies;
they, too, design standards; they, too, spread their machines as well as their organizations, their
ideologies, their states of mind. Why would you be the one doing the intelligent stuff while they
would act like a bunch of morons?” (Latour, 2004). In Latour’s opinion it is fundamental to
describe what the actors do to expand, relate, compare, and organize. Interestingly, he says:
“Don’t try to shift from description to explanation: simply go on with the description” (Latour,
2004).
ANT enhanced our understanding on business models based on what is learned with each of
the actors. In the FoodAtYourDisposal example, following all the involved actors and tracing
their associations helps detect the network boundaries, detail interactions, or sense possible
controversies (e.g., concerning revenues) that could compromise the business model.
3.3.4 Translation
Each actor has its own view of the network and its individual agenda and goals. These gain
relevance when they are shared by different actors, creating a common set of interests. Translation
is the process of engaging the different actors and it has been described as pivotal in the analysis

3.3 ANT’s vocabulary translated to the business model domain
75
of the interactions in an actor-network (Somerville, 1997). It approaches two aspects: on the one
hand, translation is assumed as an interpretation which can lead to representations of common
interests (Callon and Latour, 1981). This transformative component of translation is emphasized
in Callon (1991, p. 143), where this author shows that translation operates between actors - an
actor gives definition to another actor, endows him/her/it/them with “interests, projects, desires,
strategies, reflexes, afterthoughts”. On the other hand, translation is a set of methods by which
actors within a network will try to enroll the other actors into positions that can serve their own
purposes. According to Callon (1986a, p. 17) these methods involve: “(a) the definition of roles,
their distribution, and the delineation of a scenario; (b) the strategies in which a [future state actor-
network] renders itself indispensable to others by creating a geography of obligatory passage
points; and (c) the displacement imposed upon others as they are forced to follow the itinerary that
has been imposed”. Callon (1986b), identified four distinct phases in the process of translation:
Problematization: a focal actor (the one driving the creation of the new network or
changes to the existing one) frames the problem and defines the identities and interests
of other actors that are consistent with his/her/their own. Since some actors emerge or
fade away before a stable network is achieved, ANT looks at the focal actor as the one
to be followed in order to interpret the process of network construction.
The focal actor renders himself/herself/themselves irreplaceable by defining a process
under his/her/their control that must occur for all actors to achieve their interests
(Bloomfield et al., 1994, McMaster et al., 1997b). This process, according to Callon
(1986b), is designated as an obligatory passage point (OPP), and when focal actors
define it, they are making themselves indispensable to other actors. An OPP must be
negotiated as part of the solution and should be of common interest for the identified
network participants, in spite of their different goals and agendas. Its purpose is to keep
all other actors in place and offer a vantage point to follow the translation process
(Bakhshaie, 2008).
The actions performed by the focal actor can be viewed as part of a strategy to align the
other interests with his/her/their own (Tilson and Lyytinen, 2005), and can involve
methods so diverse as seduction, violence, and transactions (Callon, 1986b). An OPP
allows the establishment of behaviours that actors need to perform to achieve their
intents: “To pass through the obligatory passage point, the other actors must accept a
set of specific conventions, rules, assumptions and ways of operating laid down by the
first actor” (Tatnall and Davey, 2001 p.3 ).
Interessement: entities enlisted by the problematization can accept being integrated, or,
on the contrary, they can refuse problematization by defining their interests in a
different manner. Interessement encompasses the strategies by which the focal actor
attempts to enroll others according to the entities and roles defined for them in
problematization (includes searching for new allies, isolating actors not yet enrolled,
and encouraging others to overcome obstacles in the way of passing through the
obligatory passage point). It is important to understand that the actors to enroll are
tentatively implicated in other actors’ problematization, influencing their entities in
Chapter 3 – The social dimension of business models
76
other competitive scenarios (Callon, 1986b). It is necessary to implement an actors’
recruitment process – creating an interest and negotiating the terms of their
involvement.
Many times, the focal actor does not need to convince all the actors from a group, but
its representatives. Groups of actors with the same goals can be represented by a single
actor, a spokesperson. When a spokesperson talks in the name of others, he/she is
translating other actors’ will and becomes stronger (Callon and Latour, 1981).
Enrolment: requires more than one set of actors imposing their will on others for
enrolment to be successful (Uden and Francis, 2009). It is only achieved when actors
take on the network’s problematization as their own and accept the roles defined for
them during interessement. This phase is characterized by the group of multilateral
negotiations that can lead to the establishment of a stable network of alliances. Latour
(1987) suggests five strategies for enrolment: 1 - Cater to others interests; 2 - Convince
others that their usual ways are cut off; 3 - Seduce them through a detour; 4 - Reshuffle
interests and goals; and 5 - Become indispensable to others.
Mobilization: occurs when translation is complete, actor interests are stabilized and
controversy is removed. With mobilization, enrolment is transformed into active
support, it assumes a definitive physical reality which can be materialized through a
series of displacements (Callon, 1986b, Law, 1986). Mobilized actors are committed to
a common course of action (Holmström and Robey, 2005), and have the necessary
conditions to create an interest in the network or to develop sub-networks for
themselves.
This phase includes the use of a set of methods to ensure that allied spokespersons act
according to the established and do not betray the network interests (Mähring et al.,
2004). In a scenario with a wide acceptance of the adopted solution, the number of
absent entities represented by spokespersons increases (Uden and Francis, 2009), and
what is true for a few is assumed as true for the whole of the population. However, this
consensus can be contested at any moment, and treasons can emerge. In order for the
spokesperson not to betray the interests of their group, a set of methods are developed
to establish the legitimacy of the representation.
It is worth mentioning that not all translation processes pass through all these phases and
that translation processes may fail and halt at any stage. These four moments are often found to be
more fluid and interrelated than what is suggested by Callon (Mähring et al., 2004). Researchers
like Figueiredo (2004) and Scott and Wagner (2003) state that their order of application depends
on the actors’ strategic efforts to negotiate and maneuver one another into networks of aligned
allies.
The aim of translation “can be seen as to bring together complex entities into a single object
or idea that can be mobilized and circulated like a branded commodity or a taken-for-granted fact”
(Clark, 2001). If an actor was able to develop a successful strategy that has organized others
according to the established purposes, it can be said to have translated them (Masys, 2010).

3.3 ANT’s vocabulary translated to the business model domain
77
During translation, actors negotiate and manipulate others with the aim of enrolling them. This
process has political implications: “The result [of translation] is a situation where certain entities
control others. Understanding power relationships means describing the way in which actors are
defined, associated and simultaneously obliged to remain faithful to their alliances” (Callon,
1986b, p. 224).
In order to achieve stability it is necessary to maintain a continuous process of negotiation
to align actors’ interests and prevent betrayals and desertions that can cause the network to
collapse. This resistance to assaults from competing translations is captured by Callon’s concept
of irreversibility (Callon, 1991). It refers to the degree to which, in a certain situation, it is
impossible to go back to a point where alternatives exist (Callon, 1991).
The concept of translation aids in understanding how the interests involved in a business
model can be aligned. In the particular case of FoodAtYourDisposal, translation helps expose
actors’ expectations and how they are enrolled. For instance, it describes how the restaurants were
convinced to participate. The obtained information (e.g., relationships and roles assigned to the
actors) enhances understanding over the business model and may assist in the creation of
alternative scenarios. For example, a restaurant whose menu is constantly requested by the clients
threatens to abandon the network due to the fees charged over each request. In this case, it is
fundamental to perceive the implications of its abandonment and how the situation can be
handled.
3.3.5 Inscription
In ANT the search for social order rests on the notion of translation. Besides its four phases,
the process of inscription is also fundamental in building and stabilizing actor-networks.
Inscriptions is an act that actors imprint on other actors to shape their attitudes and properties
(Akrich and Latour, 1992). It also refers to the way interests, values, rhetoric, social and economic
relationships, patterns of use, and designer’s beliefs are converted into devices or materials, such
as reports and scientific papers, or incorporated in technological solutions (Akrich and Latour,
1992, Bowker and Star, 1994, Monteiro, 2000). Inscriptions also prescribe a program of action,
which specifies the properties of a setting, sustaining and embedding the social discourses of the
actors into technical artifacts. For instance, information systems developers can formulate and
shape the services of a business model’s underlying information system in order to lead and
control its users. Inscription’s capacity to prescribe actions supports the idea that it can be used to
standardize practices in organizations (e.g., the steps to fill in a form). Human actors are able to
inscribe onto non-human actors, and vice-versa (Lindahl, 2005). Inscription and translation are
interrelated and to a large extent take place simultaneously, as soon as technology starts to be
considered and developed (Latour, 1991).
Realities are constructed in practices conducted by the networks of elements that make up
the inscription device – and the network of elements within which that inscription device resides
(Law, 2004). Since inscriptions can lead the actors to behave in a certain way, many of them
attempt to inscribe their vision and their interests into the artifacts (Faraj et al., 2004). Latour

Chapter 3 – The social dimension of business models
78
underlines that the behavior imposed back onto the human by non-human delegates prescription,
being this the moral and ethical dimension of mechanisms (Latour, 1992a).
Although inscription devices and practices may be adopted as a form to create and transport
knowledge across different communities of practice, the interpretation of such artifacts may be
problematic. According to their own interests, the communities may follow anti-programs
(deviate from the inscribed patterns) and compromise the network stability (Latour, 1991).
Inscriptions can be either strong or weak (Hanseth and Monteiro, 1997). The latter will not change
the actor-network in the desired way and might in fact result in unexpected changes to the
network. The strength of inscriptions depends on the irreversibility of the actor-network into
which they are inscribed (Monteiro, 2000). As inscriptions become stable and regular, they reduce
the possibility of being challenged or questioned at a later date, increasing their irreversibility
(Callon, 1991, Holmström and Robey, 2005). For instance, once a bus network is built, moving its
bus stops becomes very complicated.
It is not possible to know beforehand the success of an inscription, but by studying its
sequence of attempts we learn more about exactly how and which inscriptions were necessary to
achieve a certain goal (Hanseth and Monteiro, 1998b). Latour (1991) gives a clear example that
illustrates this aspect of ANT. A hotel manager wanted the guests to leave their keys at the
reception desk when leaving. Often keys were lost, which was costly for the hotel. Initially, the
manager asked the customers to leave their keys as they left. The desired response was not
achieved. He, therefore, tried to inscribe his aim in the form of a notice behind the counter,
requesting all guests to deposit the keys when leaving, which also failed. The next inscription to
be attempted involved a key with a metal knob with some weight. By stepwise increasing the
weight of the knob, the desired behavior was achieved. Making the key knob heavier strengthened
the inscription. Hotel customers were more than willing to get rid of an unnecessary and
cumbersome weight.
Hanseth and Monteiro (1997) argue that unanticipated events and opportunistic choices are
always happening, creating more complex scenarios than those of Latour’s example of the hotel
keys. These uncontrollable factors make it very complicated to forecast exactly what it takes to
make an inscription strong enough; it is a matter of practical trial and error (Hanseth and
Monteiro, 1997). As Law (1992) illustrates, “Walls may resist the escape attempts of prisoners –
but only while there are also prison guards”. In other words, the strength of an inscription does not
depend exclusively on the inscribed artifact, but on the network to which it belongs.
Another interesting feature of inscriptions is their ability to enable action at a distance by
creating artifacts that can travel across space and time and thereby influence other practices
(Latour, 1987). For instance, laboratory rats might give rise to an inscription device. They “would
be sacrificed to produce extracts which would be placed in small test tubes. Then, those test tubes
would be placed in a machine, for instance a radiation detector, which would convert them into an
array of figures or inscriptions on a sheet of paper. These inscriptions would be said – or assumed
– to have a direct relation to ‘the original substance’” (Law, 2004, p. 20). The developed practices
make it possible to manipulate rat characteristics based on the obtained inscriptions, since they
have a direct relationship with the analyzed material.

3.3 ANT’s vocabulary translated to the business model domain
79
In addition, inscriptions can circulate around the world, as shown in “Pandora’s Hope”
(Latour, 1999b), in the chapter on the “Circulating Reference” that follows the work of scientists
in the Amazonian forest of Brazil, in the area of Boa Vista. The purpose of the expedition was to
determine whether the Boa Vista Forest was advancing into, or retreating from, bordering
savannah regions. The scientists translated the soil on the border between the forest and the
savanna, through a number of intermediate transformations, into diagrams that substituted the
original situation (Latour, 1999b). In other points of the globe these diagrams can continue to
suffer transformations and new inscriptions can be constructed based on the work of scientists
who intend to contribute to the clarification of this issue.
In fact, what is manipulated is neither the rats themselves nor the Amazon soil, but
scientific notations derived from inscription devices that establish a link to them. In this process,
the materiality of the performed transformations gets deleted along the way (Latour and Woolgar,
1979). The intermediary steps (e.g., the actions performed, the materials analyzed) are not taken
into account in discussions about what the inscriptions mean. As argued in (Latour and Woolgar,
1979) the process of producing the traces melts into the environment, the patterned stabilities of
translation are progressively eroded.
One of FoodAtYourDisposal’s goals is to motivate its customers to pay in cash, in order to
avoid back fees. The success of this inscription depends on the achieved network alignment. To
convince its customers, HereForYou decided that it would create a customer loyalty card to
accumulate a point for each euro spent in cash, and 100 points would be equivalent to an offer of
5 euros. Successive attempts to inscribe the desired behavior can be performed until the
inscription is accomplished.
3.3.6 Black Box and Punctualization
In ANT’s world, when an actor-network is stable (has practices that are widely performed)
and starts to behave as one entity independently of its complexity, it is turned into a black box.
When this happens, it renders invisible the complexity that constitutes it (Cressman, 2009). A
black box “contains that which no longer needs to be reconsidered, those things whose content
have become a matter of indifference” (Callon and Latour, 1981, p.284). Black boxing can seal
entities such as social groups, procedures, and materials taken for granted in the process of
heterogeneous networking. In spite of its characteristics, it is worth mentioning that it is possible
to open a black box by moving it in time and space until a controversy that can compromise the
black box is found (Latour, 1987). For instance, poor labor relationships can jeopardize workplace
agreements, or betrayals in previous partnerships can affect the regulations of future cooperation
protocols, imposing the reopening of the black box.
The concept of punctualization was introduced to handle cases when complex actor-
networks that become stronger and stable are black boxed and linked to other networks. This
concept underlines the idea that everything is both an actor and a network and provides a way of
simplifying actor-networks, avoiding endless complexity (Law, 1992). Sometimes it is
advantageous to notice individual entities, while in other situations it is appropriate to consider
Chapter 3 – The social dimension of business models
80
patterned networks. For example, when journalists visited the farm at Pouilly le Fort, they saw
some sheep dying of anthrax, while others, healthy, grazed in infected fields. Pasteur explained
that moribund sheep had not been vaccinated, whereas the others had. Since there were no
dissident voices (the sheep did what he said), Pasteur, in that particular instance, had represented
the network, and punctualized it (Callon and Law, 1997). This is more than can be said about
EDF, since the electric car project lasted only a few weeks before it started to collapse. The
vehicle never reached a steady state of stability due to the controversies among the actors, who
did not agree with the translations performed by EDF.
It is, however, important to stress that punctualization is sensitive to change. As presented
in (Callon and Latour, 1981) all black boxes are leaky, since they are exposed to initiatives that
can compromise their punctualization. This idea is also reinforced by (Law, 1992, p. 5), according
to whom punctualization is always precarious, faces resistance, and may degenerate into a failing
network. In short, black boxes can be open and their content examined.
In the FoodAtYourDisposal business model, people in charge of the deliveries carry GPS-
enabled smartphones that send their positioning to the portal. This can be used in conjunction with
the locations of the clients and the restaurants to assign the closest employee for the delivery. The
inner complexity of the algorithm of this portal’s feature was black boxed and made opaque to its
users. HereForYou, which developed the portal, expects to sell it to others.
3.3.7 Immutable mobile and multiple realities
Latour (1986b) approaches the concept of immutable mobile in a story about La Pérouse’s
travels through the Pacific Ocean. He was assigned, by Lois XVI, the mission of increasing the
French cartographic knowledge in that area. One day, he landed and asked the local natives if the
bit of land they were on was an island or a peninsula. In response, an elderly native man drew a
map of his island on the sand. Another native, who observed that the rising tide would erase the
map, drew it in one of La Pérouse’s notebooks. What was for the natives an insignificant drawing,
for the French was the object of their mission, which many people in Versailles were anxious to
get.
According to Latour (1987), the map is an immutable mobile. It is something that moves
freely around, with the capacity to hold its features. La Pérouse intended to bring the inscriptions
of the landscape, so that the people in France could visualize this distant entity (the real island)
and then travel back if necessary. A variety of elements had to be brought in coordination to
gather the necessary conditions to accumulate those means in what was called a centre of
calculation. Centers of calculation (e.g., laboratories) refer to the sites of transformation, that is,
the location where immutable mobiles are managed: they are drawn together, summarized,
assembled, and calculated.
As Law and Mol (2003, p. 2) put it, “scientific findings and theories are made in specific
locations. They are always made somewhere. In a locality. They are regional, not universal”.
However, immutable mobiles make long distance control a possibility (Law and Singleton, 2005).
This depends on the networks’ relationships ability to secure immutability on the one hand, and

3.3 ANT’s vocabulary translated to the business model domain
81
mobility on the other. In (Law and Mol, 2003) this argument is illustrated with the Portuguese
vessels from the fifteenth and sixteenth century. Except for some unfortunate accidents, in general
the vessels held together as they moved from Portugal to India and returned. They maintained
their physical shape, and their network sustained itself in a stable manner. This network included,
for instance, the Atlantic Ocean, winds, sailors, the Muslims, European enemies, the spice, sails,
navigation devices, and the Portuguese crown’s currency.
Immutable mobiles possess two forms of spatiality: Euclidian space and network space
(Law and Mol, 2003). The former is defined by a set of three-dimensional coordinates (if the
vessel is tied up in a harbor it does not move, if it is navigating it moves). The latter addresses the
relationships between the vessel and the remaining elements of the network. If they do not suffer
modifications, then the vessel is immutable in the network space. As Law and Mol (2003, p. 4)
state: it is the “immutability in network space which affords the mobility in Euclidian space”.
In some situations, other visions of spatiality are demanded. For instance, when a particular
technology is developed its behavior is specified, its aims are defined and expectations are
created. However, the network’s relationships created around the technology may diverge from
what was initially planned, compromising (or transforming) the technology role and the
established expectations. Marianne de Laet and Annemarie Mol (2000) explored this situation
with the case of the Zimbabwe bush pump. This device was widely accepted by the villages that
needed a new water pump. As time went on, the pumps broke down and the villagers tended to
replace their components with whatever could substitute them, due to the scarce resources of the
population. The physical shape of the pump changed in each village where the pumps were
enrolled, as well as its components. It is not an invariant shape either in Euclidian or in network
space (there are reconfigurations to keep the pump working). For the described reasons, the
authors defend that the pump is best understood as a mutable mobile.
A relevant question raised by the previous study addresses the failure (or not) of the original
pump. Its creator happily accepts the “multiple realities” created through the variability of the
artifact, since they reinforce the chances for the pump to work. For this reason, it is plausible to
abandon the idea of failure and to account for technology as fluid objects that can be adapted to
new demands and networks. Nevertheless, the idea of “multiple realities” goes beyond the
continuous transformations in fluid objects. It considers that any object can be enacted in multiple
practices and can be reshaped by each, which can make it difficult to obtain an entire account of
the object (Law and Singleton, 2005).
In FoodAtYourDisposal the reports and graphics that are created based on the activities
inscribed in the business model are examples of immutable mobiles. If an equivalent business
model was implemented in another city, in which the farmers’ production of potatoes, eggplants,
and garden cabbage was enough to satisfy the needs of all the restaurants in that city, different
protocols could be established to promote the cooperation between both. In this case, changes
would be introduced in the business model.

Chapter 3 – The social dimension of business models
82
3.3.8 Intermediary versus mediator
Actors communicate among themselves through intermediaries. These provide the means to
translate the actors will into the others’ and to define their positions in the network. An
intermediary "passes between actors in the course of relatively stable transactions." (Law and
Callon, 1992, p. 25), supporting network connections. It can be, for example, a text, a graph, a
service, a product, a person, or money.
Latour, in a later phase (Latour, 2005), felt the need to make a clear distinction between
what he designated as intermediaries and mediators. An intermediary “transports meaning or force
without transformation: defining its inputs is enough to define its outputs.” (Ibid., p.39). While a
mediator’s input “is never a good predictor of their output; their specificity has to be taken into
account every time. Mediators transform, translate, distort, and modify the meaning or the
elements they are supposed to carry” (Ibid.). Intermediaries, independently of their complexity,
have an expected behavior, while mediators, even if they are apparently simple, can reveal
themselves extremely complex.
It is not easy to establish the nature of a particular entity. For instance, a functioning
software program can be seen as a complicated intermediary while a department meeting may
possess a chain of mediators, where beliefs and feelings can diverge in multiple directions.
However, if one module of the program breaks down, it may turn into a dreadful complex
mediator, while a department meeting can become a perfect intermediary in transmitting, for
instance a CEO’s decision. This uncertainty around the behavior of an entity, that can either be an
intermediary or a mediator, depending on the circumstances, is at the genesis of ANT’s principle
of following the actors and their practices.
The portal used in the FoodAtYourDisposal business model can be seen as an intermediary,
while the actors that negotiate additional agreements of exclusivity with the local farmers can be
regarded as mediators (e.g., farmers, restaurant’s owners, and the company HereForYou). Each
one has interests that may not converge.
3.3.9 Power
ANT provides innovative lenses to understand the nature of power. In ANT, it is assumed
that actors do not have inherent qualities (Law, 1999). Based on this interpretation, the power of
an actor is something that should not be defined a priori, but an emergent characteristic that
should be understood and explained as a result of network relationships. ANT demystifies the
power of the powerful (Law, 1992), since no difference is assumed among the actors (e.g.,
between the powerful and the weaker) - they are treated equally.
The manifestations of power come to light from the network translations and inscriptions.
Being powerful does not automatically confer to an actor the ability to induce change, unless other
actors can be persuaded to perform the activities that can support that occurrence (Latour, 1986a).
As Hernes (2005, p. 117) argues, translation can be regarded as “negotiations, intrigues,

3.4 Why seek inspiration in ANT
83
calculations, acts of persuasion and violence, thanks to which an actor or force takes, or causes to
be conferred on itself, authority to speak or act on behalf of another actor or force”. When
inscriptions result from the translation process, as argued by (Rolland and Aanestad, 2003, p. 20),
these manifestations are “delegated to material structures and thereby made durable”. To identify
power manifestations, it is important to establish how interactions succeed in stabilizing
themselves, how they defeat resistance, and how they give rise to power.
To analyze the power of any type of organization, individual, country, or technological
innovation is to understand their connections in a network of heterogeneous actors. Power, as
mentioned, cannot be defined at an initial stage; it is something that can only be assumed after
explaining how it is performed and made durable (Cressman, 2009). It can be understood as an
effect, rather than a cause. Power has a dynamic condition, as Latour (1986a, p. 268) puts it,
“Power is always the illusion people get when they are obeyed (…) people who are ‘obeyed’
discover what their power is really made of when they start to lose it. They realize, but too late,
that it was ‘made of’ the wills of all the others”. Empires may collapse, politicians may lose their
influence, or a mafia leader may be deposed.
Willcocks (2004, p. 255) argues that power “must be analyzed as something that
circulates”. It should be conceived as a practice that changes according to the network conditions.
Actors can modify their interests and decide to cooperate in innovative ways, enrolling other
actors – both human and non-human in order to strengthen their positions in the network. Power
reflects the capacity of exercising influence on others, which can lead to durable and successful
networks.
In FoodAtYourDisposal, we try to perceive the actors’ ability in manipulating the network
according to their own interests. The gathered intelligence can reveal who is better positioned to
enroll and lead others, as well as shape the business model’s aims.
3.4 Why seek inspiration in ANT
The literature review on business models (Chapter 2) collects the most cited definitions,
components, and representations on the subject, which gave us the necessary background to detect
relevant topics to their study (e.g., available value propositions, involved actors, their interactions
and partnerships, business flows, performed activities and allocated resources). It also underlined
the importance of accounting for the influence of the social context in which a business model is
developed and implemented in its study (Monteiro, 2000, Pateli and Giaglis, 2004, Hoegg et al.,
2006). In addition, we observed that many of the available proposals did not focus on the study of
networked business models, but on the business model of a particular organization. When the
complexity of network configurations is taken into account it becomes even more relevant to
integrate the social dimension of the business model in their study. A comprehensive view can
promote their understanding, discussion, and definition, creating favorable conditions to a more
reliable translation of the business models’ requirements to their underlying information systems.
Chapter 3 – The social dimension of business models
84
When formulating and analyzing business models, uncertainty is present in the majority of
the settings (e.g., it is difficult to fully predict the emergence of groups, or the consequences of
performed actions). ANT can aid to reveal scenarios that are not so obvious or not completely
clear. It can provide the knowledge to explore why some networks are not able to stabilize and
collapse while others flourish and become the starting point for other networks. According to
Latour, ANT is a way of starting inquiries on the basis of uncertainty (Gad and Jensen, 2010). In
spite of the fact that ANT does not aim at forecasting behaviors, the insights obtained through its
use can provide important clues to a business model study. We used its principles in BIZ2BIS to
place all the network elements in their proper context (Peppard and Rylander, 2006) and to go
beyond the study of direct connections between the actors. ANT provided us with an inspiring
background to collect data on the networked business model, to define and organize attempts to
align the interests of the actors, and to include the social context of the network, as well as of its
elements, in the high-level requirements of the underlying information systems.
ANT offers an enlightening vocabulary that describes how the actors come together to
create a network, explores how its relationships are composed, how these emerge and are
maintained, the existing diversity of flows, how the actors compete among themselves, the
established agreements, and how networks are made durable over time. Its aptitude to analyze
actors’ associations reveals tactical insights (such as anti-programs) and clarifies the value
provided by the actors. The obtained data is a wealth of information on networks. Business model
theories already point to the importance of covering business model interactions, but ANT’s
inspiring outlook led us to go beyond that.
Frequently, networked environments need to be subject to an evaluation process (e.g., to
understand if the model is profitable or productive or to verify if investments are being well
applied). As stated in (Rogers et al., 2001) and (Mote et al., 2007), to translate what we know
about networks into a framework for evaluation is not as straightforward as we would like it to be.
For this reason, the analysts usually rely on an evaluative model that is dependent on network
inputs (e.g., human resources or money) and outputs (e.g., products, patents, or documents)
(Cressman, 2009). This appraisal can produce important insights, however shuts its eyes to the
network connections and the specificities, nature, and strength of the established relationships.
Each actor is assessed individually and the network relational space is not contemplated, thus
ignoring the idea that a network, as a whole, is greater than the sum of its parts. We believe that
ANT’s ability to concentrate on each actor and on the network as a whole, while considering
technical and social merits, can help us understand what happens between inputs and outputs of
networked business models and enhance its evaluation mechanisms. To shed more light on the
network complexity, in addition to commercial transaction and information exchange, we also
detailed flows as collaborations, conflicts, brand loyalty, or prestige.
ANT showed us a world of associations and relations, without considering distance or
measurement. We used it to guide our view of networked business models. Therefore, we have
translated its principle of following the actors to the business model domain, zooming in and out
to meet the purposes in question and reducing the fuzziness of the network boundaries. According
to ANT’s main proponents, researchers should “follow the actors” through their connections

3.4 Why seek inspiration in ANT
85
(Callon, 1986a, Latour, 2005) and begin the “travel by the traces left behind by their [actors]
activity of forming and dismantling groups” (Latour, 2005, p. 29). As Masys (2010) states, based
on Latour (2005, p. 81), following the actors’ allows the researcher to investigate those that have
been “silenced or deleted” and “to bring them back to light by using archives, documents,
memoirs, museum collections”. The main tenet is to “let them [actors] set the framework and
limits of the study themselves” (Tatnall and Burgess, 2002, p. 184). This principle inspired us to
iteratively search for new actors and obtain a comprehensive vision of the network in our
approach.
ANT recognizes that “what is acting at the same moment in any place is coming from many
other places, many distant materials, and many faraway actors” (Latour, 2005, p. 200). This
perspective of time and space motivated us to look for the unobvious and reinforced the already
identified importance of comprehending the business model context and its dynamics. It inspired
us in developing mechanisms to detect changes that could potentiate or compromise the network
and point out alternatives to explore the former and diminish the latter.
ANT’s concept of translation was also a major contribution to the development of BIZ2BIS.
We used it as the starting point to the specification of a set of steps to trace and assist the social
process of negotiation among the network actors, redefining and appropriating interests back and
forth between them. Our aim was to discover what could compromise the network and identify
what could promote its actors’ interests - how they could be involved, what could strengthen their
presence in the network, how business model alignment could be achieved, and how it could be
maintained. The ability to disclose clues for future attempts of alignment is grounded in the
detailed information captured on the actors’ relationships, as proposed by ANT. The iterative
nature of the study intends to saturate the description, to bring explanation into view (Latour,
1991), improving visibility over the interplay of interests. The comprehensive vision of the
network integrated in our approach gears it towards a bottom-up negotiation mechanism to tune
the most fragile parts of the networked business model and ensure sustainable interest from all the
actors.
In networked business model settings, what seems at first glance to be social is partly
technical, and what may appear to be only technical also has social influences. ANT deals with
this socio-technical account by denying that purely technical or purely social relationships are
possible and proposes the application of the principle that networks are materially heterogeneous
(Tatnall and Gilding, 1999). Through ANT’s lens, human and non-human actors emerge as a
“hybrid collectif” (Callon and Law, 1995). This concept avoids the distinction between what is
social and what is technical and allows ANT to center its attention on the associations among
actors (Latour, 1988b). Therefore, ANT’s ability to view a network as a collective of human and
non-human actors in a continual evolving entanglement (Grabher, 2006) gave us the background
to take into account in BIZ2BIS the role that non-human actors possess in networked business
models. It allowed us to consider actors like standards, governmental laws, or underlying
information systems, the latter being of particular interest for our research.
There has been an increasing interest in the use social theories in the information systems
domain. In particular, considering ANT’s contribution, since the mid 90s several studies have

Chapter 3 – The social dimension of business models
86
drawn upon it, showing its potential to describe the information systems’ role in several domains.
For instance: information infrastructure standards of patient record systems in hospitals (Hanseth
and Monteiro, 1998a), the evolution of EDI messages to support the definition of the Norwegian
standards for the health sector (Monteiro and Hanseth, 1996), analysis of a geographical
information system in a district-level administration in India (Walsham and Sahay, 1999),
standardization of project activities developed in Ericson (Linde et al., 2003), cooperative use of
IT (Underwood, 1998), implementation of a business-to-business portal for regional SMEs in
Australia (Tatnall and Burgess, 2002), online analytical processing tool in a municipal
organization in Sweden (Holmström and Robey, 2005), development on information technology
project escalation (Mähring et al., 2004), and standardization and integration in the
implementation of industry inter-organizational information systems at the seaport of Barcelona
(Rodon, 2007).
It is essential not to explain information systems based on a fixed set of independent factors
(McMaster et al., 1997a, Lyytinen and Damsgaard, 2001). On the contrary, it is important to take
into account the complex relationships between information systems and the networks on which
they operate and the interplay between different actors (e.g., people, technologies, standards).
According to Doherty and King (1998) and Graham (2008), social factors are, in many cases,
more responsible for information systems failure than technical ones. The interplay between the
social and the technical can stimulate new forms of thinking information systems. ANT’s
language aided us to perceive how information systems influence – and are influenced – by
business network contexts, and inspired us to analyze their connections in an innovative way,
regarding the expectations that the remaining actors put on it.
When the arrangements established in a network result in the alignment of its actors, their
interests are translated in accepted programs of action that can be inscribed in information
systems. The concept of inscription inspired us to include in BIZ2BIS the ability to transfer
knowledge acquired on human actors to the non-humans, revealing how human interests are
materialized in non-humans. These non-human actors can be used as delegates for specific goals,
and they are complex enough to hide decision processes, concealing the way that social interests
are represented (Holmström and Robey, 2005) in business models. ANT’s principles offered us
the potential to reveal technical complexities and contingencies often overlooked. The obtained
knowledge can be used to provide additional clues on the information systems suitability,
increasing its chances of acceptance and success.
BIZ2BIS adopted a socio-technical account mainly inspired by ANT. Its principles guided
us to complement the description of business models in network configurations with their social
context, which aided us to define the data that could be relevant to understand the network. The
concept of translation was used as the starting point to develop sensitive devices able to point out
hints on how to enroll actors, thus increasing the chance to develop successful business models.
The integration of ANT’s outlook in BIZ2BIS and the knowledge acquired under that perspective
created an awareness of how information technologies could be included, and used, in a
networked business model. Moreover, it disclosed valuable clues on how to explore the
information systems’ role in the development of an innovative and viable business model (e.g.,
3.5 From description to action
87
understanding actors’ expectations and reactions). The established symbiosis increased the
chances of developing information systems that can cope with business model demands.
3.5 From description to action
As explained so far, ANT can meticulously describe network relationships and the
continuous search for alignment. To achieve this purpose, ANT is considered to possess a set of
dictums, designated as “Rules of the Method” (Latour, 1987, p. 258), which guides its analysis.
Nevertheless, in what concerns ANT’s practical implications, the available literature is somewhat
disappointing, since most texts do not explain how to go about doing ANT. It does not provide a
narrative that can help identify the network’s problems, nor does it produce an exact rendering of
the state of affairs that can guide analysts throughout future actions to promote the network or
avoid possible drawbacks. For the ones that search for practical guidelines, there is the idea that
an enigmatic ANT method is still at work behind the scenes (Gad and Jensen, 2010).
BIZ2BIS aims to analyze and evaluate business models to create a stable network of
interests able to strengthen its viability. If required, its outcomes can be used to act and change the
setting being study. Although ANT has not been conceived to provide outcomes to plan and
manage an intervention (Lewis, 2007), based on the arguments presented in the previous section
we believe that ANT can have a clear contribution to our search for alignment among the business
model’s actors. By describing in detail the network in which a business model operates, ANT can
help explore the questions of how and why we have the business models that we have. Its
principles can be used to interpret current problem settings, to disclose interventions and to
forecast its possible results. ANT’s philosophy can provide an inspiring background to collect
data on the networked business model, identify its actors, define the network boundaries, organize
attempts to align the interests of the actors, and take into account the social context of the network
in the specification of the high-level requirements of its underlying information systems. The
knowledge offered by ANT can aid to avoid treacherous situations, augmenting the chances to
enhance the stability and performance of networked business models.
The integration of ANT’s concepts in an approach whose outcomes may be used to
intervene in a scenario under study demands to look at it in a new analytic perspective. Note that
ANT’s adoption under the described scope remains open to researcher’s imagination and is not
prescribed by ANT’s proponents. However, according to Law, “Only dead theories and dead
practices celebrate their self-identity. Only dead theories and dead practices hang on their names,
insist upon their perfect reproduction” (Law, 1999). Also Latour describes ANT as a very crude
method (Latour, 1999a). This sustains the idea that ANT cannot be reduced to a standard
approach that can be universally applied (Cressman, 2009). As Latour mentioned, ANT’s
definition, like any other definition, is “in the hand of later users” (Latour, 1987, p. 29). In our
research, we borrowed its ideas and developed efforts to integrate them in our approach, by
molding them to our needs.

Chapter 3 – The social dimension of business models
88
ANT’s insights enabled us to capture the complexity of business scenarios by providing the
means to interpret instances of the network formation and evolution. Its descriptive capabilities
conducted our reading of the business model setting and helped us develop measures to identify
the actors, follow their footsteps, describe their relationships, as well as the attempts to seek an
alignment, and regard the dynamics of the business models. However, our approach does not
intend to produce just a detailed description of a story. We want to provide prescriptive advice for
operational use and outcomes that can be used to act on the business model.
Actors have the power to appropriate, ignore, modify, or betray the network goals, and their
different sensibilities may cause drift tendencies. The need to align stakeholders’ interests or to
make continuous adjustments demands that the business model goals be re-assessed and modified
as the requirements arise. The information obtained from ANT, and ANT itself, can be used to
guide the process of sensitizing the would-be-problems and provide information to reflect on how
to make (or not) an intervention. Regrettably, and in spite of the enlightenment ANT can offer, it
is not able to contribute beyond description (Lewis and Townson, 2004, Cressman, 2009). The
aim of providing outcomes to intervene entailed the establishment of a breaking point with ANT’s
principles at a certain stage in our approach.
To provide outcomes that can be used to act on the networked business model, we applied
ANT’s concepts from a different angle. Instead of using the translation’s concept to describe, we
applied it to discover procedures to follow during the study of the business model. We did not use
its four phases to describe how an actor was attracted and enrolled, but to guide our judgment on
which actors to enroll and on the best way to attract them. The obtained intelligence is supported
by all the data gathered on the network. ANT’s inspiration provided our approach with a
descriptive component that progressively evolves in a proactive way to intervene in the business
model. Despite pointing out interventions through our approach, the actors with power to decide
the business model’s future options always have the final say on what to do about the proposed
suggestions.
As described, we want to assign an active role to ANT that overcomes its descriptive nature.
In our opinion, some researchers have already given the first steps in this direction. For instance,
Callon (1986b) details how three French scientists, who tried to domesticate scallops in St. Brieuc
Bay by applying a technique observed in a trip they made to Japan, are successful in molding an
“actor-network”. In this process, the author provides practical guidelines to distinguish translation
phases. Holmström and Robey (2005) investigated the organizational consequences of the
introduction of an OLOP tool in the Municipal Government of Umeå (a city in northern Sweden).
The outcome of their study had a set of statements with an interventionist nature (adjusting the
application to the specific needs of each department, providing training sessions, and performing
adaptations to serve the actor’s interests). Dunning-Lewis and Townson (2004) used ANT’s
concepts to think about how to organize change in a Corporate Banking working practice. These
authors observed the utility in using ANT’s ideas as a language for discussing and planning
interventions.

3.6 Complementary aspects to ANT
89
3.6 Complementary aspects to ANT
ANT has limitations when accounting for all the relevant aspects that may influence
networked business models. For example, it cannot properly deal with how organizations shape
actions in the network at the same time as the very same actions mold the organizations (Monteiro
and Hanseth, 1996). Latour would probably argue that if certain contextual influences were not
covered by ANT that was due to the fact that the description was incomplete and that extra
enquiries should be done to clarify certain issues. In ANT no assumptions about the actors are
recognized a priori - actors’ properties are seen as network effects, rather than causes. The
descriptions should stem from the case, not from generalized theories (Nijland, 2004, p. 244).
We agree with Brooks and Atkinson (2004) that networks are not maintained solely through
the often Machiavellian stratagems of the focal actors who brought them into being. There are
mechanisms inherent in the routine of the relationships perpetrated in a network. When studying
business models in the field, we were able to notice how aspects such as norms, standards,
politics, and shared interpretations influenced the actors’ behaviors. Our awareness of their
influences enhanced our knowledge on the context under study, aided to perceive the networked
business model, and supported actions over it. For instance, due to the total lack of information
concerning mechanisms behind the development of scallops, a biological theory would have
helped to understand their behavior in the classic ANT study of scallops’ domestication in St.
Brieuc Bay (Callon, 1986b). ANT can explore these effects through new enquiries that have as its
focus the clarification of network particularities, frequently in the form of black boxes (for
instance, a standard). However, this investigation demands a laborious effort, since new black
boxes can arise, disclosing a continuous and endless task - it is very difficult to recognize when to
stop and to identify the black boxes that are really worth opening.
In the early stages of a business model study, we consider it advantageous to obtain a
starting point that addresses the intrinsic structures that bind the actors together and influence their
interactions. To address this need, we inspired ourselves in the tenets of Structuration theory and
integrated its topics in our research. We are not pioneers in using Structuration Theory and ANT
together. Authors like Walsham and Sahay (1996), Brooks and Atkinson (2004), Macome (2002),
and (Naidoo, 2008) also followed this path. For instance, Walsham and Sahay (1996) used both to
investigate problems in developing geographical information systems (GIS) in an Indian
government department. These authors analyzed the social context and the process of
implementing GIS in India, as well as the inter-linkages between both. Similarly to what we will
do, Structuration Theory was used in the early part of their study. It was applied to clarify aspects
of social context related to the government organizational structures and the Indian scientific
tradition. The obtained outcomes were used to support the initiation, operationalization, and
continuation phases of the GIS implementation process (mainly covered through ANT). At a later
stage of our research, we noted that similarly to Structuration Theory, the concept of Social
Capital could also provide additional insights on the network context, in particular in the
characterization of the relationships. Both are succinctly described in the next two sections.

Chapter 3 – The social dimension of business models
90
3.6.1 Structuration Theory
This section provides an overview of Structuration Theory. For this research, it is applied in
order to gain understanding on the social, organizational and personal contexts in which business
models are embedded.
Structuration Theory was proposed by Giddens (1979, 1984). It studies social phenomena at
a high-level of abstraction, offering a descriptive view of the world, rather than an explanation of
its mechanisms (Jones et al., 2004). The theory’s aim is to account for the interplay between
social structures and human action (Monteiro and Hanseth, 1996). People, upon reflection on their
day-to-day activities, are able to draw upon social structures by either reproducing current
practices or by changing them. Simultaneously, action is both constrained and enabled by
structure.
The key concepts of Structuration Theory are agency and structure. Human agency
represents the capacity to make a difference and describes the actors’ actions. According to
Giddens (1984, p.14), it is “the capacity to make a difference”, also known as “transformative
capacity”. On the other hand, structure is defined as rules and resources implicated in social
reproduction (Giddens, 1984), organized as properties of social systems. The notion of “structure”
is to be conceived as an abstract one. Giddens describes it as “memory traces” orienting the
conduct of knowledgeable actors (Giddens, 1984).
Agency and Structure are dependent upon each other and recursively related. All social
activity, including work processes, can be viewed as enabled and constrained by social structures
that are produced and reproduced via human agency (Lyytinen and Ngwenyama, 1992), but
structure is also enacted by human action. Structure is more than an exogenous restraining force,
it is also a resource to be deployed by humans in their day-to-day actions: it is enabling as well as
disabling (Jones and Karsten, 2003). Social structure and human interaction are broken down into
dimensions (presented in Figure 20) and their recursive character is illustrated through the
connecting modalities. Its division into vertical dimensions is an analytical device; in practice, as
exposed in the following section, they are inextricably interlinked (Jones and Karsten, 2003).
Figure 20: Dimensions of the duality of structure
Source: Adapted from Giddens (1984).
Giddens (1984) identified three dimensions of structure, which he termed signification,
domination and legitimation (Figure 20). Signification refers to the rules that constitute meaning,
Structure Signification Domination Legitimation
Modality Scheme Facility Norm
Interaction (Agency) Communication Power Sanction
3.6 Complementary aspects to ANT
91
while legitimation addresses the resources and norms that determine relationships of domination.
These dimensions interact with human actions of communication, power, and sanction.
The mutual interchange between agency and structure is mediated through a linking device
called modalities that considers three types, namely interpretive schemes, facilities and norms.
These modalities are the locus of interaction between the knowledgeable capacities of actors and
the structural features of social systems (Jones and Karsten, 2003). Since this relationship is
mutual, the modalities work both ways. According to Giddens (1984), interpretive schemes
denote the shared stock of knowledge which humans draw upon when interpreting situations (tacit
and explicit); it enables shared meaning and communication (for instance, language can work as
an alignment vehicle, able to contribute to network cohesion). It may also be the reason why
communication processes are inhibited. In applying Structuration Theory to IT, (Orlikowski and
Robey, 1991, p. 155) note that "software technology conditions certain social practices, and
through its use the meanings embodied in the technology are themselves reinforced". In
Structuration Theory, human actors base their communication on interpretive schemes to support
interactions. However, these interactions can simultaneously modify the interpretive schemes that
are embedded in social structures as “signification”. The exercise of power plays an important
role in the exploitation of resources, which produces and reproduces social structures of
domination involving resource authorization and resource allocation. Authoritative resources
derive from the coordination of human agent activity, while allocative resources stem from
control of material items (Orlikowski and Robey, 1991, p. 155).
The sanctions applied in human interactions are supported by norms (e.g., protocols), which
iteratively produce structures of legitimation. Norms conduct social practices through the
mobilization of sanctions. While interpretive schemes are the rules for understanding what to
know, norms can be perceived as the rules for realizing how to act. As a result, they define the
legitimacy of interaction. They are created through continuous use of sanctions. Besides engaging
these rules, the capacity to act also depends on resources. Facilities, in turn, comprise the
resources through which power is exercised over social action and enable to draw on and
reproduce structures of domination.
These concepts may be illustrated by considering the example of a familiar confectionery
that started its activity in the beginning of the twentieth century. Its present owners follow the
same recipes, to the exception of minimal adjustments proposed by some pastry-cooks that
worked in the company. These modifications can only be implemented if approved by the owner
(structures of domination). In terms of structures of legitimation, it may specify restrictions on the
quality of the ingredients – use of natural products only, or transgressions that may invoke
sanctions. Structures of signification may include the shape of the cake and the employers’ dress
code. These structures are sustained or can be altered by the day-to-day actions of those involved
in contemporary confectionery life. For example, a new recipe may be proposed and accepted.
When humans analyze and mobilize existing interpretive schemes, they acquire knowledge
to act. Since humans possess the capacity to reflect on their own actions, they can decide on the
maintenance or change of the existing behavior. These practices highlight the patterns that
constitute society, or try to establish new ones (through schemes, facilities and norms) that will, if

Chapter 3 – The social dimension of business models
92
accepted, institutionalize new characteristics in the social structures (Brooks and Atkinson, 2004,
Ferreira, 2004).
Schultze and Orlikowski (2004) perceived a similar dynamic in the case of network
relationships. According to these authors, regular interactions and actions of organizations draw
on a variety of assumptions, expectations, norms, and protocols of interaction, information
exchange, reciprocity, and governance. We can see business models as a social product of
subjective action influenced by specific structural and cultural contexts, and simultaneously a set
of rules and resources involved in mediating action, hence contributing to the transformation of
those contexts. Several researchers, for instance Orlikowski and Robey (1991) and Schultze and
Orlikowsk (2004) explored how specific elements and functions of information systems relate to
organizational issues (namely, inter-firm relations). On our part, we intend to use the dimensions
of the duality of structure (illustrated in Figure 20) to explore the dependencies between business
models and their contexts.
3.6.2 Social Capital
According to Nahapiet and Ghoshal (1998, p. 243) Social Capital is “the sum of the actual
and potential resources embedded within, available through, and derived from the network of
relationships possessed by an individual or social unit”. It thus comprises both the network and
the assets that may be mobilized through that network. Putnam (2000) popularized the terms
bonding Social Capital and bridging Social Capital. Bonding Social Capital focuses on the
internal structure of a community or an organization. Bridging Social Capital, on the other hand,
tries to explain how the activation of external social relations to individuals or collectives may
promote successful action.
Social Capital can be mobilized to facilitate individual and organizational activities. It can
take the form of mutual trust, goodwill, obligation, and reciprocity in embedded relationships
(Adler and Kwon, 2002). Like human and economic capital, it can be exchanged by other types of
capital and can provide returns if properly managed (Bourdieu, 1986). For instance, a restaurant
may rely on the loyalty of their long-standing customers to provide more affordable menus. This
type of capital is not property of a particular actor but is embedded in the relationships. If the
relationships die out, Social Capital is no longer nurtured and consequently fades away (Adler and
Kwon, 2002). For example, if the chef, who knows the preferences of his/her clients and cooks
based on that awareness, decides to abandon the restaurant for which he/she works, it is likely that
the goodwill and trust created with the clients will leave with the chef.
Nahapiet and Ghoshal (1998) have characterized Social Capital in terms of three
interrelated dimensions: structural, relational, and cognitive. They were taken into account to
ascertain if we were eliciting the necessary and suitable topics in the characterization of the
business model’s relationships in network environments. While the structural dimension is
concerned with the overall pattern of institutionalized connections between actors in a network,
which covers aspects such as network ties and network configuration (Hatzakis et al., 2005), the
cognitive dimension addresses the need for a common context and language. On the one hand, the

3.7 Outcomes from the social domain
93
structural dimension’s focus of attention on network configuration reinforced our understanding
that Social Network Analysis (Wasserman and Faust, 2008) can provide interesting insights to our
framework. We were already alert to this, based on business model literature (section 2.2). On the
other hand, the cognitive dimension supported Structuration Theory’s insights. In turn, the
relational dimension covers the dynamics between network elements. It deals with the levels of
mutual trust and reciprocity (Svendsen and Laberge, 2005) and encompasses norms, social
sanctions, mutual obligations, political views, expectations, and perceptions of social identity
(Hatzakis et al., 2005). This information caught our attention towards the importance of
understanding the nature of the relationships among the actors (e.g., reliance, conflict, or
indifference). It underlined the importance of including in our approach sensitizing devices to
perceive the actors’ interests, cover their individual expectations, and explore forms of
collaboration.
Structuration Theory and the concept of Social Capital can contribute by clarifying business
models issues that are not the focus of an ANT study. Structuration Theory captures the essence
of the structure in which a network exists, which allows a better understanding of its interactions
and activities and the perception of the aspects that may influence actors’ behavior (Phillips et
al.). In turn, Social Capital contributes to take the pulse of network relationships, exposing signs
of trust or conflict that can be used to support the understanding of the future network dynamics.
3.7 Outcomes from the social domain
ANT was our main source of inspiration, but we also gathered helpful contributions from
Structuration Theory and from Social Capital. There are no divergences or contradictions in the
combined use of ANT and Structuration Theory, since they were separately applied in order to
address different, yet complementing issues (Brooks and Atkinson, 2004, Iyamu and Roode,
2010). The same philosophy guided the contribution made by Social Capital. To compare these
influences and contrast their socio-technical stance is not an aim of this research. Instead, we
highlight their individual contribution and complementary usefulness, which aided us in gaining
knowledge on the enabling and restraining influences of human and non-human actors in the
conception, development, and implementation of networked business models. Their combination
also allowed us to integrate alternative perspectives over the same scenario and additional types of
explanations in our approach.
In BIZ2BIS, the inclusion of topics inspired by the mentioned three social influences was
black boxed to the users. Structuration Theory’s and Social Capital’s tenets were mainly included
in the initial phase of our approach with the aim of guiding a broader social analysis of networked
business models. ANT’s influences, in turn, promoted a more fine-grained analysis of the
interactions among the actors, those being individuals or technology. ANT led us to expose how
technological decisions are interwoven with business model issues and enabled us to endow our
approach with the ability to be more specific with respect to the functions that the information
system could play in a given business model scenario.

Chapter 3 – The social dimension of business models
94
Our focus on business models’ underlying information systems is not covered by
Structuration Theory, which does not consider technical components and does not provide
guidelines about its application to information systems (Monteiro and Hanseth, 1996). According
to Giddens, structures only exist in people’s minds. However, modalities can manifest themselves
through artifacts: in documentation, in formalization of actions, as well as in formal and informal
rules of behavior (Brooks and Atkinson, 2004), which makes them the most attractive places to
include technology in Structuration Theory (Orlikowski and Robey 1991). Similarly to
Structuration Theory, Social Capital is not specific about technology, but artifacts can embody
aspects of its dimensions (e.g., norms, sanctions, and common codes). The mentioned artifacts can
be used as a link to the business model domain, underlining the symbiosis between the theoretical
contributions that inspired this research.
The role given to artifacts in a networked business model can be disclosed and detailed by
ANT’s ability to handle non-human actors as just another actor. In many cases, the artifacts must
be used to specify technological solutions, since information technology "codifies" and "conveys"
norms and common interpretations (Monteiro and Hanseth, 1996, Giddens, 1984, Rose and
Scheepers, 2001). Furthermore, ANT’s concept of black box supported our acceptance of these
mediating artifacts as black boxes, for instance a business model’s norm. This perspective was
introduced in our approach by disregarding the steps that led to their emergence, considering them
as networks with a stable behavior.
A black box can be questioned, which may cause it to be opened and lead to the start of a
new translation. Authors like Holmström and Stalder (2001), Law and Callon (1992), and
Williams-Jones and Graham (2003) believe that it is in the cases where translations fail that the
embedded norms and values are often best revealed. The obtained insights can lead to changes in
the business model and on how their actors interact. On the contrary, if a translation succeeds, the
network stabilizes and can be treated as a black box that, in the majority of the cases, must be
successfully implemented in an information system.
ANT, Structuration Theory, and Social Capital provided us tenets to broaden our
understanding of networked business models. Their individual contribution to BIZ2BIS is
depicted in Table 7. The identified items compose a repertoire of network information that we
used to support the development of the artifacts as well as the organization and outcomes of our
approach.

3.8 Conclusion
95
Table 7: Contributions from ANT, Structuration Theory, and Social Capital to BIZ2BIS
Influences Topics to address in the development of BIZ2BIS
Actor-Network Theory Identify the network goals
Define the network borders
Describe the actors in their practice
Detail actors’ relationships
Perceive actors’ common purposes
Understand how actors can be involved in the network
Specify an outline of a negotiation mechanism
Take into account human and non-human actors
Structuration Theory Detail current practices
Identify available resources
Describe common codes, languages, norms and sanctions
Social Capital Address each actor’s interactions
Depict common codes, languages, norms and sanctions
Take into account the nature of the actors’ relationships
3.8 Conclusion
Our review of the literature on business models (Chapter 2) strengthened the importance of
accounting for the influence of the social context in which they are developed and implemented
(Monteiro, 2000, Pateli and Giaglis, 2004, Hoegg et al., 2006). The importance of considering
their social dimension becomes even more acute in network configurations in which several actors
possess their individual interests that must be coordinated across the network. In the literature
review, we noticed that most of the available proposals did not possess indications on how to
address social factors. Moreover, a connection among those factors, the business model, and their
underlying information systems was not established.
We sought inspiration in ANT to complement business model theories. Its insights
influenced three major domains: collecting information on the network, developing negotiation
mechanisms that promote the alignment of the network actors, and establishing a link between the
socio-technical perspective of business models and the elicitation of the high-level requirements
of their information systems. ANT’s concepts were used as a tool to analyze the social and the
technical all at once. It guided us into a world of associations, inspired us to follow the actors and
describe them, improving the visibility over the interplay of interests, and thus enhancing the
understanding of how heterogeneous networks are forged and molded to achieve stability. Its view
of how ideas, values, purposes, and activities become inscribed in technology (Akrich, 1992,
Akrich and Latour, 1992) and how this inscription perpetuates these aspects over time (Mähring et
al., 2004) also offered us an innovative way of looking at the role of information systems in
business models. It allowed us to explore synergies between these two domains.

Chapter 3 – The social dimension of business models
96
Structuration Theory’s and Social Capital’s influences were also integrated in our research
as a starting point from which to analyze networked business models. They address issues not
covered by ANT and promoted a broader social analysis of the networked business models.
Structuration Theory’s concepts captured the essence of the structure in which they exist, which
allowed a better understanding of how their context can influence behaviors, and therefore actors’
interactions and activities. In turn, Social Capital reinforced the relevance of the guidelines
obtained from Structuration Theory and drew our attention to the importance of sensitizing the
nature of the network relationships. It offered insights to expose signs of cooperation or conflict
that can support the understanding of the network dynamics, and thus assist in the search for
network alignment.
The Structuration Theory and the Social Capital’s ability to describe a context and its
influences in human actions, together with ANT’s aptitude to analyze in detail the relationships
between the actors of a network provided a new background to analyze networked business
models. We explored synergies between the intelligence gathered in this chapter and the one
previously obtained on business models and adapted the achieved outcomes to the discussion,
design, and evaluation of networked business models. Our approach provides insights to support
sense-making, as well as the choices of the actor with power to decide. Answering Monteiro’s and
Hanseth’s (1996) call to be more specific about technology, BIZ2BIS also translates the outcomes
of the business model analysis to the specification of its supporting information systems. The next
chapter presents the research strategy we used in our work.

97
Chapter 4
Research strategy
4.1 Introduction
In Chapter 2, we identified key topics to consider when analyzing, designing, and
evaluating business models (e.g., value propositions, actors, or business flows) according to the
reviewed literature. However, throughout that study we noticed that many of the existing
proposals did not address business models in network configurations, and most of them did not
encompass the richness of their context, nor explored the connections between business models
and their technological support. Like Pateli and Giaglis (2004), we believe that the awareness of
social influences may disclose valuable insights on how to develop a sustainable business model,
particularly in network scenarios, which are usually characterized by highly complex relationships
and dynamics. Furthermore, the way business models can shape their information systems led us
to consider the advantages of translating the insights obtained through business model analysis
(including its social perspective) into the high-level requirements of its information system, thus
bridging an existing gap. Acknowledging the social character of the research and of the
phenomenon under study, we sought for guidelines that could help us deal with this social
dimension. Our main source of inspiration was ANT (Chapter 3). The insights obtained with these
chapters led us to the formulation of the following research question:
RQ1. How can the discussion, design, and evaluation of business models in network
configurations benefit from ANT’s contributions?
The research progress clarified and detailed lines of study, providing the
knowledge to refine RQ1 as presented below:
a. How to account for socio-technical aspects in business models?
b. How to identify the stakeholders and represent a networked business model so
that it is clear to all involved?
c. How to create an approach capable of aligning the goals of the various
stakeholders?
d. How can indications about the business model stability be provided to
stakeholders?
e. How to consider the dynamic nature of inter-organizational business models?

Chapter 4 – Research strategy
98
The need to overcome the gap between business models and information systems domain
also gave rise to the additional research question:
RQ2. How can business model requirements (including its social context) be translated
to its underlying information system specification?
This chapter outlines the thesis research approach used to address these questions.
Following this introduction, we open by justifying the adopted epistemology in section 4.2. We
position our investigation according to existing research traditions in business model and
information systems. Then, in section 4.3, we describe how we conducted it (methods used and
techniques applied). For each case study that is presented, in section 4.4 we provide a small
description of its context, as well as our reasons for choosing it. To complement the findings
obtained with case studies we also employed action research, which allowed us to regard the
practitioners’ reaction towards the application of BIZ2BIS and its outcomes (section 4.5). Rigor
and validity in action research, as well as generalization issues, are addressed respectively in
sections 4.5.5 and 4.5.6.
At the end of the chapter, the reader should be able to:
1. Perceive the adopted research strategy;
2. Understand the reasons that supported the choices we made.
4.2 Underlying epistemology
Epistemology covers the relationships between the knower and the known, looks into what
is knowledge, and the kind of knowledge that can be obtained (Guba and Lincoln, 1989). How we
position ourselves in this question profoundly influences the way we uncover knowledge. Burrell
and Morgan (1979) identified two extreme positions: positivist and anti-positivist.
A positivist research assumes an objective reality that exists out there, that can be observed
and accurately measured using scientific methods in a non-biased way (Cecez-Kecmanovic,
2011). It considers that the reality observed is independent from the observer and that both do not
influence each other (Figueiredo and Cunha, 2007). If some influences are detected (threats to
validity) an attempt is made to reduce or eliminate them. It is explained by immutable laws
(Ibid.), and knowledge is summarized as time and context-free generalizations, some of which
take the form of cause-effect laws (Guba and Lincoln, 1994) that can be discovered by structured
observation (Walsham, 1993). Positivists are likely to use existing theories to develop hypothesis
that will be tested and confirmed, or refuted, in a cumulative process (Saunders et al., 2009).
Negative evidence eliminates a hypothesis of a causal relation, whereas supporting evidence
strengthens it. It is also important to note that values are not considered in the construction of
knowledge in a positivist approach. They are seen as “confounding variables that cannot be
allowed a role in a putatively objective inquiry” and that “ethical behavior is formally policed by
external mechanisms” (Guba and Lincoln, 1994, p. 114).

4.2 Underlying epistemology
99
By contrast, anti-positivists, reject the existence of regularities in social reality – they see
knowledge as personal, subjective, and unique (Cohen et al., 2011). Within the anti-positivist
camp, interpretive studies consider that realities are not given as “hard facts” (Scherer, 2003).
Interpretive belief rejects the possibility that every observed action has a cause and that every
cause has an effect. It also claims that there is no objective reality that can be discovered. There
are no predefined dependent or independent variables. As an alternative, there is a focus on the
complexity of human sense-making, as a situation emerges (Kaplan and Maxwell, 1994). Over
time, it is possible to formulate more complete interpretations that increase the awareness of the
research.
Interpretive researchers follow the assumption that any observed action must be understood
in the social context in which it is constructed and interpreted by individuals through interactions
with the world around them (Figueiredo and Cunha, 2007). This entails the need to get “inside”
the examined phenomenon, which inevitably makes it very difficult for the researcher to be totally
objective. They argue that organizations, relationships among people, and technologies are not
static, because, as Permenides observed, “you cannot swim in the same river twice”. In this
immersion, values have an important role to play in the knowledge construction, since the role of
the researcher as orchestrator and facilitator demands a conduct able to promote cooperation and
trustworthiness (Guba and Lincoln, 1994). Since hiding intents can be destructive to the aim of
uncovering and improving constructions, this stance includes the participant values in inquiry
(Guba and Lincoln, 1994).
We acknowledge that the embracing of a particular paradigm has an impact on how
research is conducted - “different ways of viewing the world shape different ways of researching
the world” (Crotty, 1998, p. 66). In order to define the theoretical drive of our research, we
contend that an interpretive approach is the most suitable option to take into account the
exploratory nature of our research questions. It enables us to get “inside” the situation for which a
team is devising a business model and regard the different interpretations and meanings that
people ascribe to decisions and activities (e.g., assuming divergent positions and establishing an
alliance). It allows us to emphasize the importance of understanding the complexity and richness
of business model contexts (e.g., political and cultural constraints), rather than explaining it
through cause-effect relationships. It is naive to think that a decision maker can control all the
variables that affect a system as complex as a networked business model.
Interpretive research also provides an understanding of how information systems are used in
a particular business model, the dependencies between both, and how they influence, and are
influenced, by their context (Walsham, 1993, p. 4-5). In fact, as pointed out by Walsham (2006),
this paradigm has emerged in recent years as an important strand in the information systems
domain, widely embraced within this literature field (Boland, 1991, Myers and Klein, 2011).
Given that there is little interdisciplinary research on exploring the links between business models
and their supporting information systems, we aspire to establish a context-specific connection
between both domains. With BIZ2BIS, we intend to reach an in-depth understanding of the
business model interests, relationships, dynamics, goals, beliefs, experiences, feelings and values,

Chapter 4 – Research strategy
100
in order to translate their restrictions to the specification of high-level requirements of its
information system.
Klein and Myers (1999) proposed a set of principles for conducting, reporting, and
evaluating interpretive studies, derived from anthropology, phenomenology, and hermeneutics.
These authors agree that interpretive research does not subscribe to the idea that a pre-determined
set of principles can be applied in a rigid way. However, they consider that the absence of any
criteria increases the risk that interpretive research will continue to be judged inappropriately. For
this reason, they believe that the explicit articulation of the principles will contribute to the
improvement of interpretive field research.
The set of defined principles are: 1 - Hermeutic circle, achieves understanding by iterating
between considering the interdependent meaning of parts and the whole that they form; 2 -
Contextualization, regards the social and historical background of the research setting; 3 -
Interaction between researchers and subjects, considers how the research materials or “data” are
socially constructed through interaction; 4 - Abstraction and generalization, relates idiographic
details revealed by the application of principles 1 and 2 to theoretical, general concepts that
describe the nature of human understanding and social action; 5 - Dialogical reasoning, searches
for possible contradictions between the theoretical preconceptions guiding the research and actual
findings; 6 - Multiple interpretations, tries to detect possible differences in interpretations among
the participants; 7 – Suspicion, looks for possible “biases” and systematic “distortions” in the
narratives collected from the participants.
We applied the mentioned principles in our research, but not in a mechanistic way. We
assessed our scenario of study and judged the principles that best fitted our specific case. As
claimed in (Klein and Myers, 1999, p. 88), “We do not have absolved authors, reviewers, and
editors of the effort of working out whether, how, and which of the principles should be applied in
any given research project”.
We used the research “onion” (Saunders et al., 2009), presented in Figure 21, to guide our
research and point out available options. We have already addressed the outer layer (blue
background). In the following sections, we will discuss the remaining layers (white background)
having as a starting point the strategies of enquiry.
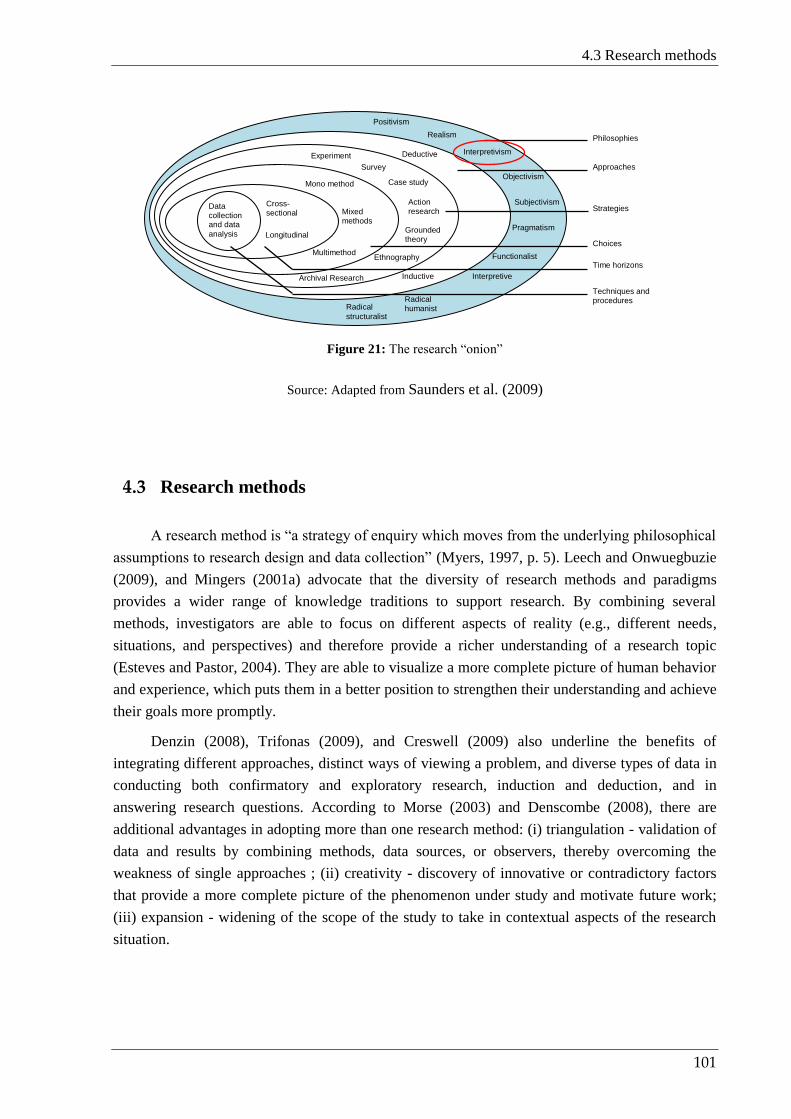
4.3 Research methods
101
Figure 21: The research “onion”
Source: Adapted from Saunders et al. (2009)
4.3 Research methods
A research method is “a strategy of enquiry which moves from the underlying philosophical
assumptions to research design and data collection” (Myers, 1997, p. 5). Leech and Onwuegbuzie
(2009), and Mingers (2001a) advocate that the diversity of research methods and paradigms
provides a wider range of knowledge traditions to support research. By combining several
methods, investigators are able to focus on different aspects of reality (e.g., different needs,
situations, and perspectives) and therefore provide a richer understanding of a research topic
(Esteves and Pastor, 2004). They are able to visualize a more complete picture of human behavior
and experience, which puts them in a better position to strengthen their understanding and achieve
their goals more promptly.
Denzin (2008), Trifonas (2009), and Creswell (2009) also underline the benefits of
integrating different approaches, distinct ways of viewing a problem, and diverse types of data in
conducting both confirmatory and exploratory research, induction and deduction, and in
answering research questions. According to Morse (2003) and Denscombe (2008), there are
additional advantages in adopting more than one research method: (i) triangulation - validation of
data and results by combining methods, data sources, or observers, thereby overcoming the
weakness of single approaches ; (ii) creativity - discovery of innovative or contradictory factors
that provide a more complete picture of the phenomenon under study and motivate future work;
(iii) expansion - widening of the scope of the study to take in contextual aspects of the research
situation.
Data collection and data
analysis
Cross-sectional
Longitudinal
Mono method
Mixed methods
Multimethod
Experiment
Survey
Case study
Action research
Grounded theory
Ethnography
Archival Research
Deductive
Inductive
Positivism
Objectivism
Realism
Interpretivism
Subjectivism
Pragmatism
Functionalist
Interpretive
Radical humanist Radical
structuralist
Philosophies
Approaches
Strategies
Choices
Time horizons
Techniques and procedures
Chapter 4 – Research strategy
102
The use of various research methods can adopt different designs (Morse, 2003, p. 190):
1. Mixed methods – incorporation of various qualitative or quantitative strategies
within a single project, which may have either a qualitative or quantitative
theoretical drive. The “imported” strategies are supplemental and are used to
clarify or provide clues that are used within the core method. The ideas from the
supplemental data inform the main research method and are verified within the
main focus of the project.
2. Multimethod – utilization of two or more research methods, each conducted
rigorously and complete in itself, in one project. It is used in a research program
when a series of studies are interrelated within a broad topic.
We followed Robey’s (1996, p. 406) belief that “theoretical foundations for research and
specific research methods are justified by research aims, or purposes”. In view of our research
questions, we adopted one of Morse’s possible configurations (Morse, 2003): the sequential
combination of two qualitative methods: case study and action research. In our research program
we chose four linked projects, yet self-contained, that fit under the rubric of network business
models and their underlying information systems. The goals of each project were triangulated to
inform the research inquiry. Given our research questions, we worked in “discovery mode” (Ibid.,
p.196). This does not mean that in specific situations we will not be testing ideas, hunches, or
hypothesis. It just means “that in the greater scheme of things, the agenda is one of discovery”
(Ibid., p.196).
In the following two sections we will present case study and action research. Their
contribution to this research will be explained.
4.4 Case study
In this section, we define the concept of case study, present some of its history, and discuss
the arguments that led us to choose this research method. The performed case studies will be
introduced.
4.4.1 Case study definition and history
Yin (1994, p. 13) defines a case study as “an empirical inquiry that investigates a
contemporary phenomenon within its real-life context, especially when the boundaries between
phenomenon and context are not clearly evident; and in which multiple sources of evidence are
used”. This author also highlights that case study facilitates an in-depth analysis, as well as the
retention of an holistic perspective that promotes the understanding of the research context and of
the processes being enacted (Morris and Wood, 1991, Yin, 2003).
This form of research has been used by academics for at least a century and is marked by
periods of height and others of decline. According to Johansson (2003), case studies appeared
around the 1900s, initially within the discipline of anthropology. The earliest use of this research
4.4 Case study
103
form can be related to narrative descriptions of journeys and studies of cultures that used
participant observation as the main method of data collection. Historically, the origin of the case
study concept also received contributions from medicine, social work, and psychology, where it
was often called “case work” or “case history” (Platt, 1992, Johansson, 2003).
In the United States, case studies were most closely associated with The University of
Chicago, Department of Sociology (David, 2007). This school applied the case study strategy on
contemporary society. It studied and reported immigration to the United States in the beginning of
the 20th century, covering aspects like poverty, and unemployment (Hamel et al., 1993). At that
time, a distinguishing feature of the case study was the access to personal meanings (Platt, 1992).
During the period leading up to 1935, there was a movement within sociology to make it
more scientific. In this prewar period “case study methods” were usually contrasted with
“statistical methods” (Platt, 1992), underlying a qualitative versus quantitative distinction. The
impact of the Second World War on society also reinforced the preference towards positivism and
quantitative methods. Around the 1960s, the controversy created around the limitations of
quantitative methods and the development of Grounded Theory by Glaser and Strauss (1967) gave
a new breath to case study research (Afonso, 2009). Another landmark to the field was the
contribution of Robert Yin (1984, 1994). The author “transferred experimental logic into the field
of naturalistic inquiry and combined it with qualitative methods” (Johansson, 2003, p. 7).
The case study has been widely accepted and legitimized in the business model and
information system fields. In the former, it has been used since its inception up to now. Examples
are the work developed by Chesbrough and Rosenbloom (2002), Gordjin (2002), Osterwalder
(2004), Vuorela (2005), and Horsti (2007). Similarly, in the information systems field it has been
applied since the 70s (Orlikowski and Baroudi, 1991, Doolin, 1996, Markus and Lee, 1999). This
tendency has been shown in the literature, for instance Farhoomand (1992) and Mingers (2001b).
More recent case studies confirm its current relevance and its contribution to the information
systems domain, such as: implementation of Inter-Organizational Information Systems (Rodon,
2007), and software development processes and practices (Runeson and Höst, 2009).
4.4.2 Why choose case study?
According to (Yin, 2009, p. 2), case study is the preferred method when (a) “how” and
“why” questions are being posed, (b) the investigator has little control over events, and (c) the
focus is on a contemporary phenomenon within a real-life context. These considerations are in
tune with our research. Based on a thorough literature review, we identified the need to
understand how the discussion, design, and evaluation of business models in network
configurations could benefit from ANT’s contributions. In these scenarios of study, we do not
have control over the events as they unfold. Item (c) also corresponds with our research. The
investigated situations confront a contemporary phenomenon: networked business models and
their underlying information systems, within their real-life contexts. The case study’s features
reveal themselves particularly suited to real situations in which it is difficult to separate a
phenomenon’s variables from its context (Yin, 1994).
Chapter 4 – Research strategy
104
In the light of the described specifications, the case study is an effective way to learn about
business networks and to see how certain theories can be put into practice. It allows their study
within their context to comprehend the dynamics involved in setting and developing a holistic
description of the network (Halinen and Törnroos, 2005) in which contextual conditions gain a
critical relevance. After all, business models can be deeply influenced by aspects as diverse as:
complex and dynamic interrelationships, shared or conflicting interests among the actors
involved, structural aspects, political restrictions, social quarrels, and cultural issues –
characteristics that to be genuinely understood must be investigated in real world settings. In our
investigation, case study research helped us perceive how BIZ2BIS could be used in a real case.
Our research also addresses information systems supporting business models. Like
Davidson (2002), Lee and Xia (2005), and Holmström and Robey (2005), we believe that
information systems development is a socio-technical process. Therefore, it is vital to perceive its
surrounding context and use the gathered data to support its specification and development. The
features that made the case study particularly suited for researching business models are also
relevant for the information systems field. It produces “an understanding of the context of the
information system, and the process whereby the information system influences and is influenced
by the context” (Walsham, 1993, p. 14).
Case study research provides a “thick description” of social interactions and practices (Yin,
1994), which gives researchers access to the subtleties of change and multiple interpretations
(Walsham, 1995a). These thorough descriptions enable the capture of reality in natural settings
and in sufficient detail to react or adapt to the complex and dynamic characteristics of real world
phenomena (Runeson and Höst, 2009). In our research, it aided us to translate the outcomes
obtained with the business model study to the high-level requirements of its information system.
In addition, the case study’s ability to address these fields also supported our aim to enhance our
approach (detecting incoherencies and tuning it).
Business networks pose various challenges when conducting case studies or other research
methods. Halinen and Tornroos (2005) distinguish the following: 1 - Setting the network
boundaries, as the interdependency among actors makes network boundaries arbitrary; 2 -
Handling the complexity formed by the network structure and “embeddedness” (connotes an
actor’s position in a network, relationships, and dependencies on spatial, political, social,
technological, and market structures); 3 - Dealing with the time dimension, as networks are
dynamic and susceptible to change by their very nature, and 4 - Comparing cases, as each case is
unique, as a result of context specificity and historical background. Although we did not solve all
these issues, we discuss solutions to approach them in designing and executing the cases, present
our contributions, and point out their limitations.
Yin (1993) states that three types of case studies are to be distinguished: exploratory,
descriptive, and explanatory. In exploratory case studies, the researcher starts with a preliminary
notion of the object of study and its context. During the research project these notions gradually
obtain precision. They are usually used to investigate a not so well known phenomenon or one
without an established theoretical basis (McLeod et al., 2011), as a pilot to other studies or
research questions. Often, they are also used as an initial exploration to obtain new insights for

4.4 Case study
105
future research (Easterbrook et al., 2008, Runeson and Höst, 2009). Descriptive case studies focus
on phenomena worth portraying and documenting (Yin, 2003), providing narrative accounts. They
require a theory to guide the collection of data and “this theory should be openly stated in advance
and be the subject to review and debate” (Yin, 1993, p. 22). Often researchers wish to go beyond
description. This can be done in explanatory cases, where researchers look for cause-effect
relationships and for explanations of a particular phenomenon. Yin (2009) cautions researchers
that the boundaries between these categories (or the occasions when each is to be used) are not
always sharp.
4.4.3 Research design
The design is the logical sequence that connects the data to the research questions and,
ultimately, to its conclusions (Yin, 2009). It consists in “a logical plan for getting from here to
there, where here may be defined as the initial set of questions to be answered, and there is some
set of conclusions (answers) about these questions” (Yin, 2009, p. 26). Following (Yin, 2009), we
address the case study protocol by discussing the case study questions, the selection of its unit(s)
of analysis, field procedures (i.e., general sources of information and procedures to collect that
information), and the criteria used for interpreting the findings.
4.4.3.1 Case study questions
The conducted literature review helped us to generate the theoretical underpinnings on what
is to be studied and provided indications on new investigation topics. We started by focusing our
attention on the business model field (including business networks) and perceived that, in spite of
the importance assigned to the use of social theories in this domain, there were no indications on
how to address it. We also became aware that the assessment of the business models was usually
confined to financial aspects. It neglected other relevant elements that could also have an
important role to play, such as information flows (e.g., data inserted in a database) and intangible
flows (e.g., brand influence or actors’ prestige). Furthermore, a connection between the business
model and its supporting information system had not been established, namely between the impact
of business model restrictions and social factors in the information system specification and
development. Taking into account the socio-technical nature of networked business models, we
decided to explore this feature using ANT. This choice was based on its ability to reveal network
spaces, their human and non-human actors, existing relationships, and the network complex
dynamics. ANT declares that the world is full of hybrid entities, and opens the “black box” to
perceive, in our case, how information systems influence – and are influenced – by business
network contexts. This puzzle-solving process, in which “we come to understanding piece by
piece, one step at a time” (Morse, 2003, p. 189), assisted us in the formulation of the research
questions RQ1 and RQ2. We based our study in some premises obtained in relevant literature:
A business model is an abstract representation of an organization (or network of
organizations) that expresses the business logic. It describes the involved actors, their
Chapter 4 – Research strategy
106
roles, exchanged flows, and how value is created and shared among the actors that
intend to create customer and network value in order to achieve their goals.
Companies are experiencing the need to create interoperable networks across enterprise
boundaries for reasons of cost, efficiency, and innovation.
Networked business models are characterized as decentralized environments, usually
without a single point of authority for decision making, where companies depend on a
collective project with shared meanings, rules, and interests that in some cases have a
difficult coexistence due to individual expectations.
The complexity of the networked configuration highlights the business model socio-
technical nature.
ANT, through its concepts of translation and inscription, contributes to disclose actors’
relationships and network complex dynamics.
Information systems should not be regarded solely as technical artifacts, but as social
systems enabled by technology.
Therefore, we resorted to ANT’s “lens of investigation” to explore the socio-technical
nature of networked business models, their dynamics and the interactions among their actors. Our
aim was to discuss, design, and evaluate business models in network configurations, which will
equally contribute to disclose its underlying information system’s high-level requirements. In
addition, we wanted to perceive if the actors’ level of satisfaction with their participation was
enough to keep them present. This evaluation enabled us to propose alternatives that could
mitigate existing problems, thus strengthening the business model viability. To do so, we started
by identifying the connection points between business model theory and ANT to create a
combination of contributions able to describe the key phenomena in each case. While doing so,
feedback loops enabled us to refine our proposal, as well as our research sub-questions with
aspects pointed out during the cases. RQ2 was less explored due to the characteristics of the cases.
4.4.3.2 Unit of analysis
The selection of the proper unit of analysis is critical in any case study. In this thesis, since
we are interested in perceiving the suitability of BIZ2BIS to discuss, design, and evaluate real-
world networked business models, we used them as our unit of analysis. We resorted to the
following set of necessary, non-sufficient, criteria to choose the case studies. Firstly, the business
model value propositions should be offered by a network of at least three actors. Secondly, the
business model should involve an information system. Thirdly, at least one of the participating
actors should be interested in evaluating the networked business model (current or future, or
both). Fourthly, the case should be accessible, allowing interviews with (a) key informant(s).
Three case studies were conducted in order to examine the social and organizational
dynamics of business analysis and evaluation in situ. The first one addressed the business model
employed in HowMuchIsIt (fictional name for confidentiality reasons) - a portal-supported
mediation service for the acquisition of technological equipment. The case was focused on

4.4 Case study
107
perceiving the viability of the portal business model, since it was facing financial problems and its
shareholders needed guidelines for future decisions. The second one involved the development of
a Scientific Journal Portal and the assessment of sound business models for the submission,
review, and publication of articles. It enabled us to understand the outputs that a business model
analysis could bring to its information systems development and whether, or not, our approach
could be used as a strong communication tool among the business analysts and the information
system deployment team. The third case, the GreenHomes project, intended to improve
environmental efficiency in an ecological community supported by a platform. It aimed at
recording electricity consumption to monitor its user patterns and adjusting energy usage to prices
or available suppliers. This case study had a strong emphasis on negotiation mechanisms that
could detect the interests of the actors in order to maintain their presence in the business network.
Given that the portal had not yet been developed, it was possible to see if our approach was able
to contribute with insights from the business model study to refine the high-level requirements of
the information system underlying the business model. Furthermore, it allowed us to perceive how
people unfamiliar with the approach were able to apply it (resorting to examples from previous
cases and to short descriptions of its use).
The three cases covered common aspects of the sub research questions (see Table 8). All
were focused on how ANT’s concepts could be properly applied to the study of networked
business models and to its description, creating a common background of knowledge clear to all
the involved actors. They also acquired a formative role. Since they were sequentially performed,
they assisted us to gradually confirm and reveal relevant lines of research. In the three cases, we
repeatedly confirmed that ANT aided the analysis of business models. HowMuchIsIt and the
Online Journal enabled us to perceive the need to use ANT in a subtle and imperceptible form and
the importance of providing negotiation mechanisms to support network alignment. GreenHomes,
in turn, revealed the need to make de approach more flexible to account for the business model
dynamics.
Table 8: Research questions covered by the case studies
AN
T i
n t
he
stu
dy
of
bu
sin
ess
mo
del
s
Des
crip
tio
n o
f th
e n
etw
ork
Neg
oti
ati
on
mec
ha
nis
ms
Ev
alu
ati
on
of
the
bu
sin
ess
mo
del
Bu
sin
ess
mo
del
dyn
am
ics
Ou
tpu
ts t
o t
he
IS f
ield
HowMuchIsIt
Journal
GreenHomes

Chapter 4 – Research strategy
108
As business networks are embedded in social, political, and historical contexts that make
them unique in some way (Halinen and Törnroos, 2005), the contributions of each case can vary
significantly, and comparing them can be a difficult task. To some extent, we were aware of
problems that could compromise the cases. Nevertheless, everyday reality can always surprise us
and change our preconceptions. Although it has not been possible to explore the cases as
expected, we used the unexpected as an alternative look that helped us to take a step forward
towards the enlightenment of our research questions. Our cases took place sequentially and,
whenever a discovery occurred, the disclosed development was translated and integrated in the
case study that followed.
4.4.3.3 Data sources, collection, and analysis
To detail a networked business model, it is necessary to obtain information about its actors,
their interests, their interactions and activities. In our approach, this search for information was
inspired in ANT’s proposal of following the actors. In this ongoing quest to improve the
knowledge about the network, it is fundamental to disclose intangible aspects of its relationships
(e.g., cooperation, competition, incompatibility), as well the actors’ own perceptions about the
network. Since these topics are not usually found in written sources, whenever it was possible we
used interviews with key players as our main source of information.
Interviews are recognized to be the source of information that provides researchers the “best
access [to] the interpretations that participants have regarding the actions and events which have
or are taking place” (Walsham, 1995b, p. 78). They enable the participants to present their
interpretation of the networked business model in which they are involved and to express their
point of view. As noted by Tuckman (1972), an interview, by providing access to what is “inside a
person’s head”, reveals what a person knows (knowledge and information), what a person likes or
dislikes (values and preferences), and what a person thinks (attitudes and beliefs). Interviews were
vital to understand the business model. Their topics addressed the network characterization and
the involved actors, gathering the required background to discover what could incite adherence to
the business model and maintain the participation in the network, thus providing feedback about
the choices made throughout the cases.
The conducted interviews were semi-structured. The job positions of the interviewees
usually included CEOs, CIOs, project managers, and clients (all were chosen for their relevance to
the business model under study). Interviews with experts on the business model topic were also
advantageous due to their capacity to reveal and share restricted knowledge. The respondents
were selected on the basis of their involvement and knowledge about their business model. ANT’s
recommendation to regard non-human and human actors as identical, led us to assemble non-
human perspectives by asking the human to express their views about them and by collecting
documentation that could clarify their role in the network.
The interviews usually lasted from 1 to 2 hours and were previously adapted to the domains
of the respondents, who were invited to present their insights and opinions on occurrences they
felt relevant. In the interviews, follow-up questions were asked to clarify previous answers. All
the interviews were conducted in Portuguese and were immediately transcribed and analyzed. The

4.4 Case study
109
resulting outcomes were used as inputs for clarification in subsequent interviews. The gathered
data was collected and analyzed in an iterative way (Strauss and Corbin, 1998), which enabled us
to gain a deep understanding of different viewpoints, connections, and contradictions within, and
across, interviews. Furthermore, it allowed us to perceive if BIZ2BIS was able to capture the
actors’ feedback and provide an outcome according to their expectations.
The way the data were approached in this research is in line with ANT’s key ideas – avoid
simplification, enter into a social setting, follow the actors, understand the dynamics of their
everyday activities, and consider their practice, as well as their social and material environment.
As suggested in the literature (Yin, 2009, p. 114), we relied on multiple sources of evidence to
promote the access to multiple perspectives of the cases under investigation. This diversity
increased the understanding of the different viewpoints and exposed business model relationships,
as well as the network complex contextual factors. It also helped to detect contradictions in the
positions observed.
The interviews were complemented with available documentation: internal documents of
the organizations participating in the network, established protocols, Internet web pages, reports,
or press articles. This data “triangulation” (Yin, 2009) created converging lines of inquiry that
increased the data depth, as well as internal reliability. The cross-checking mechanisms for the
data have evolved throughout the cases, i.e., the aspects to analyze and the mechanisms to do it
were continuously refined. For each case, we created a database that enables other researchers to
review the collected information and develop their own conclusions (found on the CD enclosed).
We provided supplementary documents in digital format in order to prevent that the core part of
the thesis become unnecessarily longer than it already is.
The process of analyzing data in this research was partly inspired by coding strategies. The
literature pointed out topics to take into account when approaching business networks and their
business models. For example: their actors, relationships, expected interests, value propositions,
performed activities, used resources, business flows, norms, or sanctions. Subsequently, we
followed the trends that emerged in the course of the research. Based on this theoretical
background, we divided data into categories. A repeated reading of the transcripts enabled us to
detect recurrent topics, behaviors, concerns, and practices, which were used as guidelines to refine
the information to obtain in subsequent interviews and the use of the approach. As the research
progressed, its interest was not so focused on issues of network representation. It evolved to
address negotiation mechanisms and viability issues, keeping in mind the need to transpose the
business model requirements to the specification of its information system. In the case studies, the
need to respond to unforeseen circumstances provided clues to enhance our approach to discuss,
design, and evaluate business models.
In this multiple case study design, each case was analyzed in its own right. In Chapter 6,
where we summarize the roadmap to the BIZ2BIS proposal, we will detail their contributions to
the performed research. For each one, we will describe its context, justify the reasons for its study,
point out potential limitations, and discuss improvements to the proposal.

Chapter 4 – Research strategy
110
4.4.4 Reliability and validity in a case study
The validity of interpretive case studies is determined by the reader, based on the evidence
supplied by the study. Case studies do not possess the tools that other forms of research enjoy
when judging its quality. Nevertheless, they should abide by canons of validity (Cohen et al.,
2011). We have applied the following (Yin, 2009):
Construct validity – we have employed accepted definitions, used multiple sources and
forms of confirmation to address research questions (e.g., triangulation of data), and
established a chain of evidence, such that every step of each case study could be
tracked. Whenever it was possible, key informants reviewed draft case study reports.
External validity – we have clarified the context, theory and domain to which the
contributions of our case studies could be helpful.
Reliability – we have used a case study protocol to deal with the documentation and
developed a case study database. Together, these tactics enabled other researchers to
follow our steps and reach the same findings and conclusions.
The three case studies we briefly mentioned helped us refine our data collection plans with
respect to both the content of data and the procedures to be followed when applying the approach.
In spite of the valuable outcomes, we could not apply all the features of the approach and our sub
research questions were not completely addressed. For instance, we did not have yet the chance to
incrementally disclose the business model’s boundaries by following the actors in a complex
network. Nor did we use the updated negotiation mechanisms developed to achieve the network
alignment in collaboration with practitioners. Also they have never employed the artifact
conceived to evaluate business model’s value propositions to assess their participation.
Furthermore, the specification of the high-level requirements of the underlying information
system (based on our translation of the business model analysis’ outcomes) has never been used
as the main source of information to guide the work of a development team.
To advance our research, we have decided to go into the world of practitioners and use the
framework that resulted from the case studies in an action research study. The outcomes enhanced
our approach with a level of maturity that gave us reasonable assurance about its ability to address
and meet the requirements of a rather complex real case, as well as contribute to its business
model enhancement. Therefore, using the criteria established for case studies selection, we have
looked for a complex networked business model in which we could establish a narrow
collaboration with participating organizations. It was crucial for us to understand if the feedback
of our analysis and evaluation was fundamental to solve their problems. We wanted to have some
assurances that they were receptive to introducing changes in their environment according to the
insights obtained with our approach. Moreover, it was important for us to confirm their
availability to reflect on the practical implications of those changes. The InovWine project, which
aimed at exploring the use of technologies to support activities of wine production, offered us
favorable conditions that led us to adopt it as our next scenario. We have decided to choose it for
two main reasons. First, it satisfied the requirements discussed above. Second, the complexity of

4.5 Action research
111
its social dimension and the idealized technological solution enabled us to analyze how BIZ2BIS
considered socio-technical issues when specifying the high-level requirements of supporting
information systems.
4.5 Action research
Action research “aims for an understanding of a complex human process” (Baskerville,
1999). Since it does not resort to a representation of the world, but to the world itself, action
research facilitates detailed inquiry into those processes and promotes the acquisition of insights
into social phenomena. This provides the means to enhance the knowledge about
socio-organizational influence, which can provide rewarding insights for both, business model
and information systems field.
In spite of its promising features, action research is not without its flaws. Those who dispute
some of the assumptions embodied in action research argue that there is a lack of impartiality
from the researcher (Francis, 1991), that it is context-bound and not context free, which makes it
difficult to establish causal relationships (Eden and Huxham, 1996), that it is little more than
consultancy (Avison, 1993), that it lacks methodological rigor (Cohen and Manion, 1980, Davison
et al., 2004), and that it has the tendency to produce either “research with little action or action
with little research” (Dickens and Watkins, 1999, p. 131). We are sensitive to these arguments.
However, we think that the first two should not be seen as a problem but as a philosophical
option, as already explained in section 4.2. We will discuss the remaining two arguments in detail,
after defining action research in section 4.5.1, presenting its historical background in section
4.5.2, and justifying its use in section 4.5.3, when describing action research in section 4.5.4. In
sections 4.5.5 and 4.5.6, we discuss its rigor and generalization.
4.5.1 Action research definition
Action research presents distinctive features. As denoted by its name, it has the ability to
combine theory and practice (and researchers and practitioners). This capacity is pointed out by
(Rapoport, 1970, p. 499), who states that action research “aims to contribute both to the practical
concerns of people in an immediate problematic situation and to the goals of social science by
joint collaboration within a mutually acceptable ethical framework”. This description highlights
the idea that action research branches out in two distinctive paths. On the one hand, it intends to
aid in solving real problems. On the other hand, it contributes to expand scientific knowledge.
Later work continues to acknowledge this. For instance, Kock and Lau (2001) and McKay and
Marshall (2007) follow the preceding assumption and introduce the idea that action research has
“two masters” that must be served: the research client and the research community.
In action research there is an active and deliberate self-involvement of the researchers in the
context of their work (McKay and Marshall, 2001). There is the belief that the study scenario can
be more deeply understood if the researcher is part of the system being studied, and not an
impartial spectator (Kock et al., 1997). As the researcher tries to comprehend what is observed,

Chapter 4 – Research strategy
112
his/her personal values, ideologies, and a priori knowledge will invariably intrude into
observations and resulting findings (Baskerville, 1999). However, this involvement of the
researcher promotes the understanding between the “research-subject” and the “other subjects”,
bridging the gap between scholars and practitioners. It stimulates collaboration between the
researcher and the remaining actors of the problem context, facilitating and supporting the
introduction of change.
Given the particularities of the problem context in action research, the collaboration
between researchers and “problem owners” is fundamental in order to achieve a fruitful outcome
for all participants. Both depend on each other. The researchers bring knowledge to the research
context and have the chance to try out their theories with practitioners in real situations and real
organizations (Avison et al., 1999). The “problem owners” provide access to real situations along
with expert knowledge, thus contributing to solve their practical problem. As (Avison et al., 2001,
p. 44) puts it: “No other research approach has the power to add to the body of knowledge and
deal with the practical concerns of people in such a positive manner”.
What differs in action research when compared to other research approaches is the fact that
it follows a different angle, in which the researchers are focused on creating change. They work
from within a conceptual framework. The actions implemented to improve a problem should form
part of and stem from strategies to develop, test, and tune theories that address the context under
study (Avison, 1993, Baskerville and Wood-Harper, 1996, Checkland, 1991, McKay and
Marshall, 2001).
Action research is used in real situations, rather than in manufactured, experimental studies.
In these scenarios, it is extremely difficult to determine the cause of a particular effect, which
owes its existence to factors as diverse as the cultural influences, political interests, the research
itself or the theoretical principles used (Baskerville, 1999). Because the research is context-bound
and not context-free (Baskerville and Wood-Harper, 1996, Blichfeldt and Andersen, 2006),
researchers need to comprehend the ill-structured, fuzzy world of complex organizations, where
the social component plays an important role (Avison et al., 1999). The action research supporters
sustain that these situations can be better understood by inducing changes into their processes and
observing the effects of those changes (Baskerville, 1999). For this reason, the knowledge
obtained through action research is associated with a specific context, since each situation is
unique, cannot be repeated, and cannot be dissociated from the situational and historical context in
which it acquires meaning (Hult and Lennung, 1980).
Taken into account the features we just described, Hult and Lennung (1980) refined
Rapoport’s definition of action research. These authors state that: “Action research simultaneously
assists in practical problem-solving and expands scientific knowledge, as well as enhances the
competences of the respective actors, being performed collaboratively in an immediate situation
using data feedback in a cyclical process aiming at an increased understanding of a given social
situation, primarily applicable for the understanding of change processes in social systems and
undertaken within a mutually acceptable ethical Framework” (ibid., p.247).

4.5 Action research
113
4.5.2 Action research historical background
Action research has its origins in the social sciences and it possesses two independent
“roots” (Baskerville, 1999). One is the action-based social psychology of Kurt Lewin, who
developed a field theory version of action research at the Research Centre for Group Dynamics
(University of Michigan). Lewin’s work (1951) intended to change the life chances of
disadvantages groups (Cohen et al., 2011). Independently, the Tavistock Clinic (later the
Tavistock Institute) built up a social psychology application of action research to study
psychological and social disorders among war veterans, (e.g., (Trist, 1976)). These disorders were
caused by World War II’s side effects, such as battlefields, displacements, or prison camps. The
two schools converged when Lewin joined the Tavistock Institute and inspired a vast stream of
work in action research.
Before the conflict, scientists were not aware of how to treat war psychological syndromes.
They acknowledged that each case had its particularities and, to enhance their knowledge on the
complex cause of diverse “social illness”, proposed the idea of social action. This proposal
demanded the intervention of scientists in each of the experimental cases by changing some
aspects in the patient’s environment (Baskerville and Myers, 2004). As an outcome, a body of
knowledge on successful therapy indications was obtained. In spite of the achievements, due to a
reduction of public research funding and the natural resolution of social problems in the post-war
era, the priority assigned to social psychology was cut down (Shah et al., 2007). At that time, the
researchers tended to seek projects that relied on “hard” quantitative data and were supported by
computer analysis – embracing the United Kingdom’s vision of science (Clark, 1972). This
configuration caused a decline in qualitative research and, as a result, “action research methods
were seldom applied, and [were] often of marginal scientific quality” (Baskerville, 1999).
The second stage in the historical evolution of action research is associated with the
“resurgence” or “revival” of interest in the United Kingdom, in the early 1970s (Carr, 2006). At
the time, an interpretive perspective was favored, and Lewin’s action research cycle evolved from
a method by which practitioners applied social scientific theories to their practice into another
which enabled practitioners to evaluate the practical adequacy of their own tacit theories “in
action” (Elliott, 1987, 1991, Carr, 2006). This research strategy’s scope has covered fields as
diverse as: cultural aspects of a factory in England (Jaques, 1952), relationships between
organizations and their environment (Miller and Rice, 1967), organizational restricting policies in
the Norwegian shipping industry (Roggema and Smith, 1983), cost and job savings at Xerox
(Pace and Argona, 1991), facilitation of quality circles in the United States and Japan (Cole,
1991), reorganization of the United States Naval construction Forces (Simon, 2000), and
development of inter-organizational information systems (Figueiredo, 2004).
4.5.3 Why choose action research?
Nowadays, business models are characterized by complex environments and innovative,
technology supported, configurations, where several actors with distinct and sometimes
Chapter 4 – Research strategy
114
conflicting interests coexist, usually without a single point of authority. In scenarios with these
characteristics, the capacity of action research to account for contextual influences makes it a
powerful tool to aid decisions and to disclose vital interplays that can influence business models.
The resulting knowledge can be used to ensure sustainable interests in the business models for all
those involved and to offer additional guarantees of their suitability and viability.
Business model research is often justified in terms of its implications for practice. Action
research also provides the means to improve the practical relevance of business models. It allows
researchers to try out a theory in a complex real-life business model with the aim of solving
practical problems. Its ability to work with practitioners and promote the collaboration between
them and researchers enables the latter to learn from a real-life context, gaining feedback from the
experience. This “partnership” enhances the reflection on the adopted solutions, as well as
necessary adjustments, to achieve a satisfactory solution. Here, benefits for the practitioners and
the research community are expected. It is a win-win situation for both.
Similarly to business models, information systems also have a strong relationship with their
contexts and a highly applied nature. Their adoption can radically modify the way organizations
use information and knowledge in a practical sense, causing profound changes in their procedures.
However, through action research the academic community has the chance to regard the impact of
its developments in real scenarios, facilitating the necessary changes and learning from them
(Shah et al., 2007). Action research has the potential to solve practical problems while expanding
information systems theoretical findings and enhancing their practical relevance.
The collaborative and action-oriented nature of action research is flexible enough to meet
the emerging issues of technology-related change, when the research problem requires flexibility
or modifications must be made rapidly or holistically. It enables inquiry into the identified
problem, while offering valuable insights to researchers that intend to disclose the interplay
among technical, economic, organizational, human, cultural, and political aspects of the
intervention. It has the capacity to merge research and praxis, emphasizing the relevance of the
real world and recognizing the importance of all the parts involved to obtain feedback that support
the achievement of a better solution. As Avison (1993) puts it, action research is ideally suited to
obtain understanding of whether technology or methodology is perceived useful and helpful in
practice. There is also a focus on questions that may arise and how improvements can be put in
practice within the value system of the problem owner.
Action research is particularly suited for information systems study (Baskerville and Wood-
Harper, 1996). This viewpoint supported a renewing interest on action research, which coincided
with the convergence between “social science” research and the emerging field of information
systems development (Shah et al., 2007). For instance, Enid Mumford drew on her experience at
the Tavistock Institute to develop an action research style of participatory design called ETHICS
that covered the socio-technical nature of information systems development (Mumford and Weir,
1979, Mumford, 2001). Peter Checkland (1981), in turn, worked in developing the soft systems
methodology, which is another landmark for the use of action research in the information systems
domain. Wood-Harper is another important reference. This author explicitly presented action
research to the information systems community as a research method (Wood-Harper, 1985). Like

4.5 Action research
115
the previous two, he also integrated action research concepts into an action–based information
systems development methodology – Multiview (Wood-Harper et al., 1985). These works all
yield observable effects on practice (Avison et al., 1999). The support and interest around the use
of action research in information systems remains. Clear evidence is the increasing number of
contributions that have been published. In addition to single articles, for instance Baskerville and
Wood-Harper (1996), Avison et al. (1999), Olesen and Myers (1999), Baskerville (1999), Simon
(2000), Braa et al. (2004), Davison et al. (2004), Shah et al. (2007), and Peszynski et al. (2008),
journal special issues like Baskerville and Myers (2004) and Kock and Lau (2001), and books like
the one edited by Kock (2006) have been devoted to action research.
Based on the section arguments, we claim that action research is a significant way to
improve our approach to discuss, design, and evaluate networked business models and to translate
the resulting outcomes to the specification of its information systems’ high-level requirements.
Through its use, we aspire to solve practitioners’ problems while expanding scientific knowledge.
4.5.4 Action research description
The capacity of intervention of action research assigns it a clinical nature that places
researchers in a ‘helping-role’ within the organizations that are being studied (Baskerville and
Wood-Harper, 1996). Most authors consider action research to be an iterative process involving
its actors on a particular cycle of activities (Baskerville and Wood-Harper, 1996). This cyclic
nature helps responsiveness and aids rigor (Dick, 2000). The outcome obtained in a cycle will be
used to support decisions in the following cycle, enabling the test and refinement of
interpretations previously achieved. This organization provides action research with the necessary
flexibility to better deal with the complexity of social systems, since each new cycle permits an
additional and enriched critical reflection.
Avison, Lau, Myers, and Nielsen (1999) and Dick (1992) propose a simplified
representation of the action research cycle that clarifies its underlying philosophy (Figure 22): an
intervention is planned for conducting further research (problem diagnosis); based on the previous
analysis, a number of interventions are taken (action intervention) that will produce changes. A
critical analysis of these changes is carried out (reflective learning), which makes it possible to
identify adjustments that must be taken into account in subsequent cycles. Action research
encourages the researchers to act and to reflect on the outcome of their intervention and the
implication of their theories.

Chapter 4 – Research strategy
116
Problem diagnosis
Action intervention
Reflective learning
Figure 22: Simplified action research cycle
In spite of the consensus gathered around the above cycle, according to authors such as
Baskerville and Wood-Harper (1996), Baskerville (1999), Simon (2000), and Shah et al. (2007),
the most prevalent action research description is the long-established action research cycle
presented by Susman and Evered (1978) (Figure 23). Previously to iterating its five phases, this
proposal establishes a client-system infrastructure, which can be regarded as a separate phase that
regulates the research environment.
Figure 23: Action research cycle
Source: Adapted from Susman and Evered (1978).
Since action research is carried out in real-world circumstances, in some cases the
researcher and the client organization can have different, and even conflicting, interests. For
instance, the organization may intend to solve an additional problem (not specified initially) in
order to improve its business performance, which is not of interest to the researcher. To avoid
possible disagreements, researchers and practitioners need to share a mutually acceptable ethical
framework that can clarify the interactions between researchers and host practitioners in terms of
the research’s goals, mutual responsibilities, required resources, authority aspects and sanctions

4.5 Action research
117
available (Byrne, 2005). This idea is also supported by Checkland and Holwell (1998), who
underline the importance of negotiating the researcher role in the context where the intervention is
taking place. Baskerville and Wood-Harper (1996) also share this notion, since - in their opinion -
the establishment of an ethical client-system infrastructure and research environment can
contribute to achieve scientific rigor.
Baskerville and Wood-Harper (1996), Baskerville (1999), Winter (1996) provide a number
of principles to consider in this endeavor. For example, make agreements in advance among all
entities involved in the research to support intervention, consider how researchers’ admission and
departure must be managed, guarantee that the work developed must remain visible and open to
suggestions, establish conditions for the dissemination of knowledge acquired during the research,
or define confidentiality rules.
After establishing the client-system infrastructure, the five phases are iterated (Susman and
Evered, 1978), as explained below:
1. Diagnosing - Analyzing the nature of the research domain to identify the complex
problem that promotes the desire for change (some causes of the problem are
pointed out). It involves its interpretation, not through reduction and
simplification, but rather in a holistic fashion (Baskerville, 1999). This phase
provides the foundations to develop the initial theoretical assumptions.
2. Action planning - Planning and selection of activities to address the problem.
These activities, established among the researchers and the practitioners, intend to
solve, or at least mitigate, the identified problems. The recognition of the planned
actions is guided by the previously established theoretical framework.
3. Action taking - Executing the planned activities in the problem domain.
4. Evaluating – Assessing the results and reflecting on what has been achieved. This
demands a critical analysis of the obtained results. In the case of a successful
change, it is necessary to understand its reason. Otherwise, some adjustments for
the next cycle should be defined.
5. Specifying learning – Reflecting explicitly on the activities and outcomes of the
research projects.
The sequence presented above serves as an analytical tool, although each phase may not be
consecutively conducted, nor is each step distinct (Byrne, 2005). For instance, the phase
“specifying learning” is formally undertaken last. However, it is indeed an ongoing activity,
where the beliefs are continually refined in the light of the outcomes. Furthermore, the end of an
action research cycle may not imply that an end-point has been reached. New cycles can be
initiated to build up additional knowledge concerning the researchers and the practitioners’
activities, whether the action reveals itself to be successful or not.
There are many models describing action research. The usual representation of the action
research process (as shown in the figures above) is a single cycle, with possible iterations. In turn,

Chapter 4 – Research strategy
118
McKay and Marshall (2001) outlined a model that included two cycles that ran in tandem: one
addressed client problem solving aims and the other dealt with the research interests.
In the problem solving cycle, action researchers must become aware of a real-world
problem. They must develop endeavors to find out more about the nature of the problem and its
context. After gathering the necessary knowledge, the researcher (in some cases in collaboration
with other participants) plans a problem strategy and then proceeds to implement a number of
action steps. These steps can be guided by a particular problem solving approach, which is
monitored and evaluated. At this phase, if satisfactory results have been reached by the
stakeholders, the process ends. Otherwise, the researcher amends the action plan and starts
another cycle.
In the research interest driven cycle, the researcher has a particular objective or research
questions to pursue. To enhance his/her knowledge, the researcher will explore the relevant
literature to acquire the necessary background to plan and design the research project. Based on
that, action is taken, monitored in terms of research interests, and evaluated to perceive the effect
that the intervention has had in terms of research questions. If the researcher has achieved his/her
expectation, the cycle ends. Alternatively, the researcher will change his/her plans and designs to
search for other explanations.
It is important to mention that in reality, due to its inherent complexity, thinking and acting
would rarely follow the neatness implied by the figures. Furthermore, the cycles are not conducted
independently of one another, since points of connection and interaction can be established
(McKay and Marshall, 2001, Cronholm and Goldkuhl, 2004, Peszynski et al., 2008) (Figure 24).
It is McKay and Marshall’s (2001) belief that this new conceptualization facilitates researchers to
be much more explicit about the reflection and learning process inherent to action research.
According to these authors, it allows for better planning, monitoring, and evaluation of the action
research process, contributing to the improvement of action research’s rigor.
Figure 24: Action research dual cycle process
Source: Adapted from McKay and Marshall (2001).
The adoption of this dual cycle dismisses the criticism that action research is “consulting
masquerading as research” (Coughlan and Coghlan, 2002, p. 237). This confusion is partly
Problem solving interest
Research interest

4.5 Action research
119
grounded on historical reasons, since both share a common background that can be traced back to
Kurt Lewin’s work (Baskerville, 1999). However, they emerge as two separate streams that differ
in important factors. According to Baskerville and Wood-Harper (1996) and Baskerville (1999),
action research makes a commitment to the research community and to the practitioners, while in
consulting the commitment is to the client (Shah et al., 2007). Their approach and motivation is
also distinct. On the one hand, action research underlines the importance of establishing
collaborations with the participants in the studied scenarios and supports its achievements on
theoretical frameworks. On the other hand, consulting typically values its "outsider’s" unbiased
viewpoint and the consultants are paid to suggest solutions that, according to their experience,
proved to be reliable in similar circumstances. Finally, the consultation is usually linear – engage,
analyze, action, disengage, while the action research process is cyclical.
The duration of an action research project can vary considerably. It depends on the
characteristics of the problem being studied (e.g., its complexity, the type of relationship
established with the client, or the number of cycles to perform).
4.5.5 Rigor and validity in action research
Based on the available literature, it is possible to detect an increasing emphasis on the call
for greater rigor in the use of action research (Byrne, 2005). The absence of generally agreed
evaluation criteria has been questioned regularly, which complicated action research acceptance
and its credibility in some academic circles (Cohen and Manion, 1980, Lau, 1999, Baskerville,
1999, Avison et al., 2001). Avison, Lau, Myers, and Nielsen (1999) contend that there is a lack of
detailed guidelines in terms of design, process, presentation, and criteria for evaluation.
To promote the rigor in action research, we searched for tactics in the literature to guarantee
the quality of the evidence and therefore of the performed assertions. Using the five principles
presented in (Davison et al., 2004), an extension of this work provided by (Vries, 2007), and
contributions from other authors, we condensed our findings in Table 9.

Chapter 4 – Research strategy
120
Table 9: Principles to enhance action research rigor
Principle of the research-client agreement
Mutual
agreement
Establish a formal research agreement between researchers and practitioners on the
suitability of action research for the organizational situation (Baskerville, 1999, Davison et
al., 2004). It should contain mutual guarantees, support collaboration, mutual trust, and
promote access to the organization (Lau, 1999). In addition, it should cover project’s aims
and evaluation measures (Davison et al., 2004)
Ethics Researchers and practitioners need to share a mutually acceptable ethical framework
(Avison et al., 1999)
Research
focus
Specify the research focus intervention (Davison et al., 2004). It regards intelligence such
as participating organizations, their extent of involvement, research participants’ profiles,
or the research timeline(Lau, 1999)
Roles and
responsibilities
Stipulate the roles and responsibilities for all the involved (Lau, 1999, Davison et al., 2004)
Data collection
methods
Identify the data gathered, as well as the methods used to collect and analyze it (Lau, 1999)
Principle of the cyclical process model
Degree of
openness
Justify changes to the traditional cycle stages (Lau, 1999, Davison et al., 2004, Vries, 2007)
Cycle
description
Describe the stages of the action research cycle(s) (Lau 1998). In each cycle the research
approach and the research questions should be critically analyzed. In the final stage of each
cycle, a decision about the need of an additional one should be reached (Baskerville and
Wood-Harper, 1996, Davison et al., 2004)
Principle of theory
Research
relevance
Perceive the importance of the domain of investigation (including the problem setting) to
the interests of researchers and practitioners (Baskerville and Wood-Harper, 1996, Davison
et al., 2004, Vries, 2007)
Theory Report the theoretical framework role in diagnosing, guiding intervention, and evaluating
the research outcomes, or, as the research progresses, in the emergence of theory
(Baskerville and Wood-Harper, 1996, Davison et al., 2004, Blichfeldt and Andersen, 2006)
Principle of change through action
Cause Diagnose to obtain a clear understanding of the problem and of its cause(s) (Davison et al.,
2004, Vries, 2007)
Intervention Design interventions to address the cause (Vries, 2007). These actions should be previously
approved by the practitioners and described in detail to document aspects like the timing
and nature of each action (Davison et al., 2004)
Assessment Define unambiguous criteria to assess organization before and after the intervention
(Avison et al., 1999, Davison et al., 2004)

4.5 Action research
121
Principle of learning through reflection
Report Provide detailed descriptions that leave room to multiple interpretation (Avison et al.,
1999) and help peers to assess trustworthiness of the obtained results
Reflection Reflect on the outcomes of each intervention to evaluate the project’s success (Davison et
al., 2004)
Practical
outcomes
Disclose the implications of the study for related domains (Davison et al., 2004)
Implications
for the
scientific
community
Evaluate the value of the theoretical base model(s) employed and consider the
transferability and applicability of obtained findings (Hult and Lennung, 1980, Baskerville
and Wood-Harper, 1996, Lau, 1999, Davison et al., 2004)
The above principles guided our research. The InovWine research focus was specified in
detail in the proposal submitted to the NSRF (National Strategic Reference Framework). It
included aims, participating actors, roles and responsibilities, and a plan of action (including
deadlines and resources assigned to tasks). Simultaneously, a protocol of cooperation among the
organizations involved was conceived. It covered topics like guidelines and forms of cooperation
(including access to data), intellectual property rights, and commercial issues.
After project acceptance, we started to study its business model. We supported our research
on the knowledge acquired in the literature review and on the outcomes of the previous three case
studies. In addition, we began to study topics related to the wine sector (e.g., steps of production,
grape diseases, and wine quality) and tried to perceive the interest of the practitioners in the
project, in order to match them up with ours. After that, we initiated a research cycle, in which we
had the opportunity to clarify concepts and ideas, critically analyze research questions, and
understand the capability of BIZ2BIS to discuss, design, and evaluate networked business models
and produce a high-level specification for their supporting information systems. Data collection
and interpretation made part of the research. We used multiple sources of information and
different informants to regard different perspectives that enriched our capacity of evaluation and
reflection. Project documentation, Internet pages, books, and technical reports were analyzed. To
integrate the opinion of the actors in the study of the business model we held meetings, made
phone calls, and conducted semi-structured interviews. We sought divergent data and opinions,
tested apparent agreements and explored apparent disagreements (Cunha and Figueiredo, 2002).
The interventions in the networked business model suggested by BIZ2BIS were previously
approved by the actors with power to decide. The results of those actions were also used as an
additional source of information and enhancement to our research. We developed a report
detailing all our steps and reflections (found on the CD enclosed). This document was shared
among all the business actors.

Chapter 4 – Research strategy
122
4.5.6 Generalization in action research
Action research projects, due to the nature of its intervention can never be repeated
(Baskerville and Wood-Harper, 1996). They work with theories applied to specific real-life
practical problems, intervene into unique organizational settings, and achieve local findings.
These findings are pertinent, at least to the practitioners involved. However, as stated by
(Goldkuhl, 2008) several questions may be put: Does this local relevance also imply a general
relevance? Are the solutions proposed and used relevant outside the local practice?
The particularities of each setting sustain one of action research’s most sharp criticisms: the
difficulty to establish the extent to which the outcomes obtained in a specific project can be
generalized, and how. Byrne (2005), as well as Blichfeldt and Andersen (2006) suggest that action
researchers should look for transferable results. These might be taken and made available in other
situations and settings, whether in terms of adopted methodologies or generated theoretical
insights. In our research project, we intended to identify knowledge that can be acquiesced and
applied in other scenarios to support business models discussion, design, and evaluation.
According to Baskerville and Lee (1999) and Cunha and Figueiredo (2002), when using
action research, authors should find support for the epistemological legitimacy of their research on
the roots of Critical Rationalism, by Karl Popper (1968, p. 29). In Popper’s view, for a theory to
be scientifically valid it must lend itself to verification or confrontation with occurrences that may
refute it. If the predictions are not accomplished, then the theory is false and possesses no
generality. On the contrary, the theory remains valid, until its illegitimacy is not proved - it
maintains the status of being falsifiable. According to Popper, scientific progress comes from the
rejection of less satisfying theories and their replacement by better ones (Popper, 1982).
Barkervile and Lee (1999) advanced guidelines on the appropriate way in which researchers
may lay claim to generality for their research when using action research. The work of these
authors goes along the same line as Popper’s studies. They advise the researchers to detail the
particular empirical conditions that characterize the scenario for which results are obtained.
Following the same line of research, Blichfeldt and Andersen (2006) suggested to enhance the
discussability of action research by: (a) increasing the transparency of their research processes, (b)
declaring the intellectual frameworks brought into action research projects, (c) discussing
transferability of findings, and (d) defining accumulation of results. The detailed information can
be extremely helpful when researchers lay claim to generality in their study, since this claim
would imply that the theory may hold in different settings that “share the same empirical
circumstances”. Future efforts to enhance the generality of a theory would not involve
indiscriminately and randomly collecting more observations, but, rather, would imply the
identification of additional conditions on which the applicability of the theory can be tested.
We recognize the arduousness in reporting all the relevant and pertinent aspects of a
networked business model. In addition to the complexity of the network configuration and of the
business model itself, these environments are rich in covered and exposed dependencies between
the actors (e.g., power influences), and subject to external influences (e.g., governmental laws).

4.6 Conclusion
123
The performed literature revision (Chapter 2 and Chapter 3) and the study of previous cases (with
strong real-life contexts) contributed largely to the identification of the features that characterize
business models. Their integration allowed BIZ2BIS to address business models in a
comprehensive way and contribute to face the action research reporting challenge.
The InovWine case enabled us to describe a specific instantiation of the circumstances in
which our approach was applied. It offered us the necessary conditions to analyze and evaluate a
networked business model and translate the resulting outcomes to the specification of its
information system’s high-level requirements. A critical analysis of the situation gave us
fundamental insights to update the approach and intervene in the scenario under study. The report
of the outcomes obtained and the experience itself can be used by future users of the approach to
guide their steps in other contexts that share the same business circumstances (in the wine sector,
or any other domain). The resulting knowledge revealed the adequacy of our approach to given
situations, described how it should be used, enhanced its reliability, and disclosed conditions in
which future users may trust it. New business scenarios of study can continuously test its
suitability.
4.6 Conclusion
Throughout this chapter we outlined the research strategy conceived to address the research
questions laid down in this thesis. Both social and technical issues were considered to influence
the business model study and the specification of its information systems’ high-level
requirements. We adopted an interpretive stand and applied case study and action research
according to the characteristics of our cases, since both fit the philosophical assumptions
underlying this work. The findings obtained with the case studies presented were used to endow
BIZ2BIS with a level of maturity that enabled us to transmit to practitioners a sense of trust and
security on its capabilities to enhance and promote their business models. In turn, the close
collaboration established with practitioners in InovWine allowed us to enrich the business model’s
study with their own perceptions of the problem and observe their reactions towards the
approach’s application in the field. The approach’s rigor, validity, and generalization of the
research process were also covered.
The last version of our approach is described in Chapter 5. It is the outcome of the
performed research, enriched and molded with the contributions of all the presented cases. Its
application to a concrete networked business model (InovWine) is exemplified in Chapter 6.

125
Chapter 5
BIZ2BIS: Business model and IS design
5.1 Introduction
In on our review of the business model literature in Chapter 2, we identified several aspects
to take into account when discussing, designing, and evaluating inter-organizational business
models. On the one hand, we noticed that many of the available proposals did not focus on
networked business models, and, those that did, did not include techniques to promote the
alignment of the actors or superficially explored the connections between business models and
their supporting information systems. On the other hand, we also became aware that, in spite of
the importance that some authors assigned to social factors in the study of business models, there
were no indications on how to address them.
In Chapter 3, we discussed how ANT could introduce a social outlook in our approach. We
translated its principles and concepts to the networked business models domain and used them as
a source of inspiration in the conception of our proposal. ANT’s ability to address network
configurations showed us the importance of understanding the intertwined web of value
propositions, interests, and dependencies among actors. Its ability to align interests geared us to
capture the perception of the actors towards the networked business model (the ones satisfied and
willing to contribute to the common goal, or the others who are discontent and willing to abandon
it) in order disclose clues on how to entice them to participate. ANT inspired the development of a
negotiation process to manage the interests of the actors in the business model. In addition, ANT’s
socio-technical lens showed us networks as an heterogeneous reality built of multidimensional
and continually evolving entanglements (Grabher, 2006), where human and non-human actors are
treated similarly. This perception was extremely useful, since it provided us with indications on
how to consider the social dimension in the study of networked business model scenarios, as well
as the role that human and non-human actors possess and their impact on the network.
Furthermore, it enabled us to perceive how human interests are materialized in non-human actors
and how the latter influences the former. This outlook gave us clues to understand how business
and social constraints shape information systems requirements, increasing the chances of
developing a technological solution able to satisfy the involved actors.
The insights obtained in Chapter 2 and Chapter 3 inspired us to develop an innovative and
practical approach to discuss, design, and evaluate networked business models, which equally
contributes to disclose its underlying information system requirements. The approach, which we
designated by BIZ2BIS consists of four phases. In Phase I, we characterize the network,

Chapter 5 – BIZ2BIS: Business model and IS design
126
identifying its actors and their relationships, as well as the structural aspects that influence their
behavior. Then, in Phase II, we analyze the network and suggest eventual adjustments to better
align the interests of the actors. In Phase III, we assess the business model stability by verifying if
the value propositions bring benefits to all the involved actors. If this happens, there are strong
indications that the actors were successfully enrolled and that their interests were aligned. In
Phase IV, the gathered information about the network and its actors (e.g., relationships, data, and
constraints) and the arrangements established to align the interests of the actors are used to detail
the high-level requirements of the information system underlying the business model. Each phase
is supported by one or more artifacts in which we also integrated the insights obtained from the
theoretical contributions in a user-friendly way. This materialization in artifact items, diagrams,
and guidelines of application is explained throughout the chapter.
We noticed that, similar to ANT, which is one BIZ2BIS’ pillars, our approach should not be
perceived as an inflexible procedure that can only be applied as a standard format. We expect it
can guide practitioners in their own scenarios of study and that they can translate it according to
the needs and characteristics of their own context. As Latour (1987, p. 29) mentioned, any
definition (in this case BIZ2BIS) is “in the hand of later users”. We will detail BIZ2BIS as
follows: in Section 5.2, we explain the outlined plan for its application. Then, in section 5.3, we
detail the four phases of BIZ2BIS. For each phase, we describe their purpose, field use,
supporting artifacts, and theoretical background. Finally, we present a brief conclusion of the
aspects covered by the approach in Section 5.4.
At the end of the chapter, the reader should be able to:
1. Comprehend the outlined plan for the application of BIZ2BIS;
2. Understand the purpose of BIZ2BIS’ four phases, their steps, supporting artifacts, as
well as the expected insights;
3. Employ the approach to discuss, design, and evaluate networked business models, while
deriving their underlying information systems requirements;
4. Adapt BIZ2BIS to the problems, needs, and expectations of each scenario.
5.2 BIZ2BIS outline
When a set of organizations intends to put a business model in place, those responsible for
the task face several challenges. They need to conciliate the overarching aims of the network with
the individual expectations of its members, obtain their support, and convince them to accept the
roles defined for them. The complex dependencies that exist in these environments make it
complex to specify in detail a business model idea. The involved actors, including the ones with
the power of decision making, usually only have a partial perception of the scenario under
analysis, which makes it difficult to detail the ideas in question, detect inconsistencies or
problems, and propose alternatives. BIZ2BIS works as a shared and common understanding of the
business model that promotes communication, discussion, and collaboration among its

5.2 BIZ2BIS outline
127
participants. The data gathered exposes interactions, influences, aims, activities performed, and
the dynamics of the networked business model, which enables the disclosure of the interplay of
interests. This wealth of information is used to support an iterative negotiation process that seeks
to involve all actors in the search of an alignment for their interests, so that each one can find
attractive value propositions that may encourage them to participate in the networked business
model. The detailed specification of the envisioned solution for the scenario under study
(including its social dimension) and the integration of the actors’ viewpoints are valuable tools of
BIZ2BIS. Our approach compares the information available with the individual perceptions of the
actors in order to disclose threats, solve conflicts, promote collaboration, reinforce the enrolment
of the actors, inscribe programs of action, and strengthen the stability of the networked business
model. It also takes into account alternative business model scenarios to explore opportunities
revealed during the study and to promote discussion of less matured ideas. BIZ2BIS
systematically explores connection points between the insights obtained on business models and
the requirements of their underlying information systems.
The clues and suggestions obtained using BIZ2BIS should be presented to the decision
makers to support their choices. These actors should try to accomplish the network goals and
balance them with the expectations of each of the involved actors. Actor satisfaction is of the
utmost importance for business model stability. Therefore, BIZ2BIS gives them the opportunity to
assess the suitability of the business model based on the proposed solutions. If the reaction is
positive, then the approach allows the elicitation of business model requirements to be met by its
supporting information systems.
BIZ2BIS is organized in four phases: Phase I – “Business model characterization”; Phase II –
“Business model refinement”; Phase III – “Stability assessment”; and Phase IV – “Information system
specification” (Figure 25). By default, the phases follow a sequential order. However, this
configuration does not prevent BIZ2BIS to take into account the dynamic nature of the networks
and their capacity to evolve with time, as suggested by Recuero (2004). The approach is flexible
enough to interrupt, at any moment, the sequential order of its phases and return to previous ones
in order to answer to unexpected network events or to indications ascertained when applying its
steps. For instance, disclosed data can give rise to new translations, innovative behaviors can
change programs of action, and the appearance or disappearance of an actor modifies the network
configuration. Figure 25 expresses this dynamics. The dashed arrows illustrate possible returns to
already visited phases and green arrows the decision to progress in a sequential form. For
instance, if a new actor is identified, independently of the phase in use, it is mandatory to return to
Phase I; if an event uncovers unconsidered aims with implications on the alignment of the actors’
interests, it is necessary to return to Phase II.

Chapter 5 – BIZ2BIS: Business model and IS design
128
Figure 25: Generic outline of BIZ2BIS
Step I. a - Exploration of the business model
Step I. b - Description of the participating actors
Step I. c - Representation of the business model
Phase I - Business model characterization
Step II. a - Detection of dependencies among goals
Step II. b - Identification of actor affinities
Step II. c - Negotiation of actor contributions
Step II. d - Description of critical dependencies
Step II. e - Stabilization of value propositions
Phase II – Business model refinement
Step III. a - Evaluation of actors perceptions
Phase III – Stability assessment
Step IV. a – Consolidation and description of requirements
Phase IV – Information systems specification

5.3 BIZ2BIS step by step
129
Each phase has one or more steps, supported by idealized artifacts. It is not mandatory to
apply all steps in the four phases, use all their supporting artifacts, or follow the sequence
suggested for their application. According to the specificities of each scenario, the need to apply
the steps of a phase in a different arrangement may arise. Figure 25 represents the dynamics by
black ellipses. Analysts should apply the steps in the order that best fits their needs.
5.3 BIZ2BIS step by step
To present BIZ2BIS in detail, we provide a general description of its four phases and of
their steps. For each step, we will explain its purpose, present the artifacts that support it and an
example of their use, describe how the step should be used in the field and by whom, and discuss
its theoretical background. We believe that concrete examples can promote the understandability
of the approach. Therefore, for illustration purposes, we use fragments of one of our cases - the
GreenHomes business model. When we started to study it, the principal investigator for the
project had already established that the aim of the business model was to improve environmental
efficiency. He had also identified some interests of the involved actors, such as monitor electricity
consumption patterns, adjust energy usage to prices or available supplies, and accessing data
provided by the users of the portal. The achievement of these interests, in his opinion, depended
on the users’ insertion of electricity consumption data per household. How this could be promoted
was still an open issue. We used the ideas transmitted by the researcher as the starting point for
our study. In the next section, we will start by detailing the steps of Phase I, which covers this
initial stage. Then, we will cover the following phases, while addressing situations up until the
end of the project that may contribute to BIZ2BIS’ understanding.
5.3.1 Phase I, from Step I.a to Step I.c – Business model characterization
Phase I should be applied when a problem is identified in an existing inter-organizational
business model or a new opportunity. The actors, who detected the required change or conceived
the new idea, frame the problem and identify actors, interests, behaviors, and relationships with
other actors that can contribute to their envisioned proposal. If they, or the actors with power to
decide in the network, recognize the need to discuss their suggestions, and intend to evaluate and
improve them, then the conditions to apply BIZ2BIS are gathered. This phase analyzes the
business model by looking at its network. It comprises the identification and characterization of
the participating actors, as well as their relationships. To assemble a more complete view of the
networked business model, it also covers structural aspects that can constrain it, such as
governmental legislation and cultural issues. Diverse sources can be used to gather relevant
information on the networked business model, such as meetings, interviews, books, reports,
scientific content, magazines, and web pages. To enhance the knowledge on the scenario under
study, this phase can be applied in simultaneous to several alternative business models. It aims to:

Chapter 5 – BIZ2BIS: Business model and IS design
130
Characterize the networked business models (goals, opportunities, threats, mutual
obligations, shared representations and interpretations, existing rules, available
resources/actors, and institutionalized sanctions);
Identify the actors involved in the network and detail the information about them
(network interactions, relationships and flows, roles, and interests);
Represent the networked business model visually.
Phase I addresses the above aims in three steps with complementary perspectives (Table
10): the first characterizes the network, the second details actors, and the third depicts the
interactions among the actors. One or more artifacts support each of the steps. Next, we present
those belonging to Phase I.
Table 10: Phase I - Steps and supporting artifacts
Phase I – Business model characterization
Step I.a Exploration of the business model Artifact I.a1 Networked business model chart
Step I.b Description of the participating actors Artifact I.b1 Actor description chart
Step I.c Representation of the business model Artifact I.c1
Artifact I.c2
Flow diagram
Flow matrix
5.3.1.1 Step I.a: Exploration of the business model
This step initiates the study of the business model when the actors with power to
deliberate its future decide to create a work group to discuss, design, and evaluate it.
Analysts should return to this step whenever they detect the need to carry out changes in the
conceived solution or update the data in the artifact that supports it.
Purpose
Step I.a describes the networked business model. It allows analysts to broadly specify
its main aims, who contributes to its success and how, as well as the provided features. In
this first draft, analysts also address settings and structural aspects that can affect the
business model context.
Description and illustration of the artifacts
The “Networked business model chart” supports the description of the networked
business model. It is composed of the following items:
Network goals: gathers all the information obtained for each actor, analyzes it, and
presents a first draft of the network’s goals;
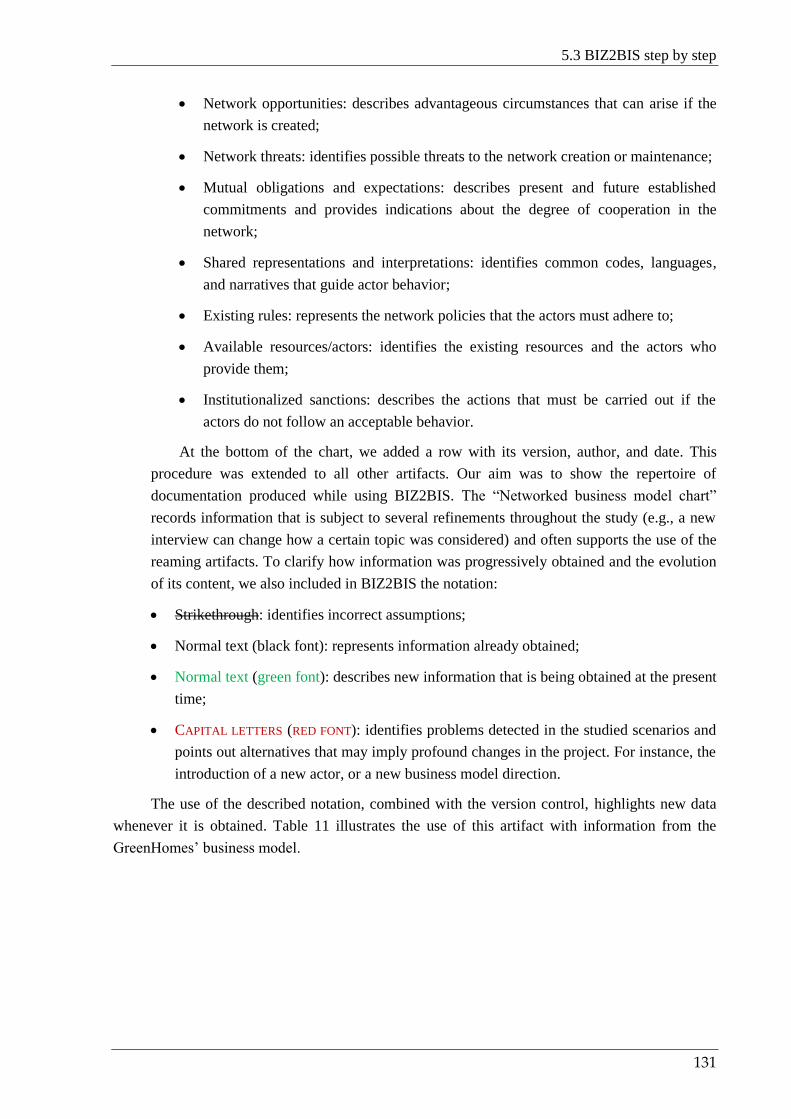
5.3 BIZ2BIS step by step
131
Network opportunities: describes advantageous circumstances that can arise if the
network is created;
Network threats: identifies possible threats to the network creation or maintenance;
Mutual obligations and expectations: describes present and future established
commitments and provides indications about the degree of cooperation in the
network;
Shared representations and interpretations: identifies common codes, languages,
and narratives that guide actor behavior;
Existing rules: represents the network policies that the actors must adhere to;
Available resources/actors: identifies the existing resources and the actors who
provide them;
Institutionalized sanctions: describes the actions that must be carried out if the
actors do not follow an acceptable behavior.
At the bottom of the chart, we added a row with its version, author, and date. This
procedure was extended to all other artifacts. Our aim was to show the repertoire of
documentation produced while using BIZ2BIS. The “Networked business model chart”
records information that is subject to several refinements throughout the study (e.g., a new
interview can change how a certain topic was considered) and often supports the use of the
reaming artifacts. To clarify how information was progressively obtained and the evolution
of its content, we also included in BIZ2BIS the notation:
Strikethrough: identifies incorrect assumptions;
Normal text (black font): represents information already obtained;
Normal text (green font): describes new information that is being obtained at the present
time;
CAPITAL LETTERS (RED FONT): identifies problems detected in the studied scenarios and
points out alternatives that may imply profound changes in the project. For instance, the
introduction of a new actor, or a new business model direction.
The use of the described notation, combined with the version control, highlights new data
whenever it is obtained. Table 11 illustrates the use of this artifact with information from the
GreenHomes’ business model.

Chapter 5 – BIZ2BIS: Business model and IS design
132
Table 11: “Networked business model chart” applied to the GreenHomes case
Business model scenario GreenHomes
Network goals Improve environmental efficiency (individual and global) through
GreenHomes
Network opportunities
New scientific discoveries regarding individual/collective environmental
behavior
Inclusion of new sensors (e.g., to control water and gas consumption , or
indoor air quality)
Connection to other social networks
Create plug-ins (e.g., new data)
Network threats
Lack of motivation to insert data manually
Privacy issues
Lack of interest in environmental issues
Lack of trust in the network (e.g., due to bugs, design glitches, or analysis
errors)
The existence of rival platforms (e.g., Google Power Meter)
Mutual obligations and
expectations
Users periodically input data and receive tips that will improve their energy
consumption
The Portuguese Environmental Organization advertises the platform and
contributes its expertise to the platform development. In return, it has access
to GreenHomes’ data
iTEAM project maintains the platform and gets data for research
Shared interpretations
and representations
Environmentally friendly behavior
Common household typology
Common measures for the analyzed resources
Existing rules
Data should be input manually (weekly) and via sensors every day (only for
a small number of selected users)
The Portuguese Environmental Organization should provide weekly tips
Available
resources/actors
Hardware and technical skills/iTEAM project
Environmental tips/The Portuguese Environmental Organization and Users
Data/Users
Institutional sanctions Banned from the platform
Version: 0.3 Date: 21/07/2010 Author: Cristina Costa
Field use
When analysts meet actors who have decide to analyze a particular networked business
model (a new idea or one already in use) they should explain how BIZ2BIS will be applied
and the insights it will provide. They should also emphasize the importance of fostering
collaborations with all involved parties in order to encourage their participation. Their
feedback is fundamental to understand the business model and provides additional
assurances that their viewpoints are being considered.
5.3 BIZ2BIS step by step
133
Analysts, or any other element of the work group, should contact the actors that are, in
their opinion, involved in the business model to schedule a meeting that may clarify their
availability to collaborate and the roles that they may carry out. If analysts detected
scheduling conflicts, they should appoint individual interviews. If in-person meetings are
unfeasible, other options can be considered such as web conferencing, phone calls, and e-
mails.
Analysts should fill in the “Networked business model chart” during the carried out
meetings or interviews, accordingly. The chart fields should be used to guide and
systematize the questions asked. Recorded conversations follow the same procedures. When
presenting the gathered information to all the involved actors, analysts may have to omit
confidential information previously obtained (e.g., fears an actor might have regarding
another). The content of each field should be continuously refined throughout this step, as
the actors provide new data. The chart provides a succinct view of the main characteristics
of the networked business model and can be used as a first step to promote its
understanding and discussion among actors.
Theoretical background
Our early inspiration to design Step I.a came from ANT’s concepts of problematization
and interessement. They helped us to address the moment in which the actors interested in
considering new networked business model ideas, or changing existing ones, decide to
detail and analyze them using BIZ2BIS. These actors form a group that can include entities
as diverse as the proponents of the idea, funding bodies, and project leaders. In BIZ2BIS,
this group corresponds to ANT’s focal actors. Eventually, the project leaders may require
that the analysts using BIZ2BIS also be included in the group to support discussions on
future decisions. In our approach, following ANT’s problematization, this group should
frame the networked business model under study and identify entities with interests that are
consistent with it. Inspired by the concept of obligatory passage point, the group should also
make itself irreplaceable in the proposed solution for the business model, or at least some of
its elements. Thus, the involved parties should define a course of action under their control
that must be followed by all actors if they want to achieve their interests.
BIZ2BIS uses the “Networked business model chart” to characterize the network. This
chart is where the influence of Structuration Theory and Social Capital’s dimensions is
more noticeable. These inspired us to identify factors with impact on the behavior of the
actors and helped contextualize the information obtained when following the network
interactions (as proposed by ANT). The factors relevant to enhance our understanding were
merged with others from the business model domain and gave rise to the fields that we
explain below:
“Network goals”: corresponds to establishing ANT’s obligatory passage point.
However, the need to define what the networked business model must achieve is
also addressed in business model definitions and components (Hamel, 2000, Alt
and Zimmermann, 2001, Al-Debei et al., 2008).

Chapter 5 – BIZ2BIS: Business model and IS design
134
“Network opportunities” and “Network threats”: were inspired by SWOT analysis
(Andrews, 1971). They have the aim of performing a scan of the network external
environment to perceive possible opportunities or problems. For instance,
emergence of new technology, alternative regulations, or the surfacing of substitute
services.
“Mutual obligations and expectations”: was influenced by the Social Capital’s
relational dimension. It was introduced to clarify mutual relationships in the
network (for instance, trust and reciprocity).
“Shared representations and interpretations”: follows the principles proposed by
Structuration Theory’s interpretive schemes and Social Capital’s cognitive
dimension. It specifies common codes, language, and narratives (shared
knowledge), aiding in the task of interpreting the networked business model.
“Existing rules”: is inspired by Structuration Theory (norms are one of its
modalities) and in Social Capital (the relational dimension integrates network
norms). This information explains why the actors follow certain behaviors in a
particular context and is also addressed in business model studies, for instance
Morris et al. (2005) and Gulati et al. (2000).
“Available resources/actors”: is frequently addressed by authors in the business
model domain (Tapscott et al., 2000, Hamel, 2000, Gulati et al., 2000,
Papakiriakopoulos et al., 2001, Afuah and Tucci, 2003, Osterwalder, 2004, Allee,
2008, Bouwman et al., 2008c), showing its relevance to the field. It is also based on
Structuration Theory (facilities are one of its modalities).
“Institutionalized sanctions”: is inspired by Structuration Theory interaction
sanctions and by the social sanctions from Social Capital. It may clarify what the
network actors regarded as sufficiently dissuasive.
Some of the above items (for instance, “existing rules”, and “institutionalized
sanctions) can be considered black boxes. Until questioned, BIZ2BIS will not “open” them.
5.3.1.2 Step I.b: Description of the participating actors
The information gathered through the “Network business model chart” summarizes the
main guidelines established for the business model by its proponents. It sets out how aims
and plans can be achieved (e.g., commitments of the actors towards the networked business
model, their contribution to achieve the defined aims, and the resources to use). In addition,
it addresses contextual aspects that may influence the outlined aims (e.g., governmental
laws, economic restrictions, and cultural issues). The wealth of information on the
networked business model creates favorable conditions for detailing the actors of the
networked business model, which we addressed in BIZ2BIS Step I.b “Description of the
participating actors”.

5.3 BIZ2BIS step by step
135
Purpose
Step I.b identifies the actors that participate in the networked business model, details
their roles, relationships, and expectations. Knowledge about the actors enhances the
visibility over the interplay of interests and supports analysts to delineate the network
(including its boundaries). It also discloses ways of encouraging actors to strengthen the
business model and reveal indications to increase its chances of acceptance and adoption.
Furthermore, when BIZ2BIS exposes the vision that each actor has for the business model,
it can help others to improve their own perception, as well as the conceived business model.
Since data about actors is vital for the approach, not identifying all the ones with impact on
the aims of the network can be disastrous and undermine its achievement. The data on each
actor should be filled in the “Actor description chart” that we present below.
Description and illustration of the artifacts
For each actor in the “Actor description chart” we take into account the fields:
“Network interactions”: depicts the interactions of the actor in the network.
Disclosing all the established connections enables analysts to perceive the existing
relationships and unveil the actor network configuration.
“Relationships and flows”: details the relationships of the actor and identifies the
business flows (e.g., information and services) associated with each relationship. It
clarifies the network interactions and searches for indications of future alliances or
possible conflicts that can change the network dynamics.
“Roles”: describes the activities carried out by the actor. This field covers aspects
that can be used to detail the business model and the functionalities that its
supporting information system should make available to its users.
“Goals”: identifies the individual interests of the actor. This information is critical
to manage the alignment of interests among the actors and to define the network
goals.
Table 12 illustrates the “Actor description chart” through the description of the
“Monitored user” in GreenHomes.

Chapter 5 – BIZ2BIS: Business model and IS design
136
Table 12: “Actor description chart” applied to the GreenHomes’ Monitored user
Description of the actor Monitored user
Network interactions GreenHomes, other users (Standard and Monitored), sensors, and Portuguese
environmental association
Relationships and flows Introduce consumption data through sensors in GreenHomes
Introduce personal data in GreenHomes
Share consumption data with other GreenHomes users, iTEAM project and
Portuguese environmental organization
Share tips with other users
Receives free sensors iTEAM project
Establish an agreement with iTEAM project to improve environmental
conditions
Use the services provided by GreenHomes
Roles Authorize sensor installation
Introduce personal data
Fill out questionnaires
Monitor sensor operation
Provide authorization for use of data
Goals Receive free sensors
Monitor own behavior in terms of energy consumption
Compare consumption with average consumption of others (e.g., depending
on regions and typologies)
Receive hints to reduce cost and improve energetic behavior
Participate in the social networks with friends
Business model: GreenHomes Version and Date: 0.3, 21/07/2010 Author: Cristina Costa
Field use
For each identified actor, analysts should appoint an interview to address the fields of
the “Actor description chart” and fill it in. If there are scheduling conflicts, they should
choose alternative forms of contact like sending the artifact in writing. The specificities of
actors belonging to a group may lead them to adopt divergent behaviors. In this case, in
order to capture their different point of views, we advise analysts not to consider the group
as a single actor but to individually characterize its distinctive actors.
In interviews and meetings with the actors, analysts should promote their issuing of
opinions and encourage them to express their vision of the business model, detail their
interactions, and point out the aims they intend to achieve. The information obtained about
the actors improves knowledge on the business model, for instance it aids in the discovery
of opportunities and threats that can be explored in advance. Since business models embody
the characteristics of the domains for which they are designed (e.g., an endeavor of organic
food in the Middle East), complementary sources of information aid to clarify the scenario
under study. Thus, analysts should ask actors for additional material about the business
model such as books, reports, laws, Internet pages, and journals to improve their

5.3 BIZ2BIS step by step
137
understanding of the context under study. The role of non-human actors must also be
considered. For this to be possible, human actors should describe what they expect from the
former. As the use of BIZ2BIS gradually provides additional data on the actors, the artifact
content should be continuously refined. Analysts should compare this expressed perception
with the vision of the business model proponents in order to support the aims of the network
and the individual expectations of the actors.
When applying this step, it is important to verify if the actors point out relationships
with others that have not yet been identified. In such cases, each of these revealed actors
must also be interviewed and then be recursively asked to indicate all their connections. The
iterative search continues until analysts do not identify more actors, or consider that they
have a residual influence in the networked business model. At a later stage, business
analysts may decide to discard some of the identified actors, due to their irrelevance for the
business model. In the carried out interviews new data about the topics addressed in Phase I
may arise due to the close relationship between the actors (Step I.b) and the network where
they operate (Step I.a). Whenever this takes place, analysts should return to the step that
addresses the data in question and update the necessary artifact(s). Analysts should apply a
similar procedure when they disclose data on the actors in Step I.a.
Theoretical background
Distinct backgrounds influenced the development of Step I.b. To obtain clues on how to
identify the actors in a networked business model, we started by exploring links between
ANT’s concept of actor and the literature on the definition of stakeholder. For example,
Freeman (1984) defines a stakeholder as any group or individual who can affect or be
affected by the achievement of a firm’s objectives. Bryson (2004) presents variants to this
definition, which differ from how inclusive stakeholders are. These differences are justified
by the different purposes and distinct contexts in which researchers and practitioners apply
this research topic (Pouloudi and Whitley, 1997). For instance, Eden and Ackermann (1998)
state that stakeholders can only be people or groups who have the power to directly affect
the future of the organization. The absence of power removes the stakeholders’ status. In
contrast, others consider a broader scenario, including the nominally powerless (Johnson
and Scholes, 2002). In BIZ2BIS, we use an inclusive stance: each element that can
influence or be influenced by the networked business model - directly or indirectly - should
be regarded as an actor (independently of being a human or non-human actor). In Step I.b,
we were also inspired by ANT and its lens of heterogeneous networks (Chapter 3) that led
us to follow the actors and describe their behavior, as well as by the snowball method
(Hanneman, 2001). This method is associated with the Social Network Analysis (SNA),
which is inherently an interdisciplinary endeavor. SNA developed from a propitious joining
of social theory and application, with formal mathematical, statistical, and computing
methodology (Wasserman and Faust, 2008) and enables the mapping of network
interactions. Similarly to BIZ2BIS, SNA focuses on relationships among social units and
supports its analysis on actor data. One of the available procedures to gather the information

Chapter 5 – BIZ2BIS: Business model and IS design
138
is the snowball method (Hanneman, 2001), which begins with a focal actor (or a set) that is
asked to identify ties to other actors. Each of these actors is then recursively requested to
also provide all its ties. This process continues until no new actors are identified, or until the
analyst decides to stop (usually for reasons of time and resources, or because the new actors
are insignificant to the network). This method has two potential limitations. First, actors
who are isolated are not located. Second, there is no guaranteed way of finding all the
identified actors. To strength the method, we carefully selected the initial set of actors. We
also used a tactic suggested by Pouloudi and Whitley (1997) to conceive this step. Their
proposal accounts for the specificities of inter-organizational environments in the
identification of stakeholders, namely the dynamic nature of these environments and the
complexity of the existing relationships. It is based on four principles:
Principle 1 - Stakeholders depend on the context and time frame: the inter-
organizational domain in which the network operates affects the set of stakeholders
and since the network has a dynamic nature, this set should be regularly reviewed.
Principle 2 - Stakeholders cannot be viewed in isolation: the complexity of the
stakeholders’ interactions (e.g., power, trust, conflict, and cooperation) must be
taken into account. Given that the identification of one stakeholder can lead to
others, this process needs to be iterative.
Principle 3 - The position of each stakeholder may change: stakeholders can
modify their viewpoints as time goes by, which demands that we observe them for
a longer period of time.
Principle 4 - Feasible options may differ from the stakeholders’ wishes: the
stakeholders possess different interests that must be articulated to achieve a
common solution. The feasibility of stakeholders’ wishes is also restricted by
technological, economical, and political factors.
To identify actors that “really matter”, BIZ2BIS follows a tactic inspired by ANT and
led by Pouloudi and Whitley’s principles, which is similar to the snowball method. After
identifying the initial actors, they are recursively asked to identify all their connections and
detail their activities. BIZ2BIS stops this iterative search when it does not identify more
actors or when they have a residual influence in the network business model. During the
search, BIZ2BIS considers the context of the network and its dynamic nature. It integrates
the role of the actors in the context of the networked business model and promotes the
continuous demand for information, while updating the corresponding artifacts. Since
BIZ2BIS uses the “Actor description chart” to characterize each actor, we will now present
what led us to set each of the artifact fields:
“Network interactions” and “Relationships and flows”: both these fields respect
ANT’s recommendation of following and describing the actors. The item “Network
interactions” centers its attention on perceiving the entire network configuration.
This perspective is also suggested by the Social Capital’s structural dimension. In
the last years some proposals in the business model domain also underlined the

5.3 BIZ2BIS step by step
139
importance of considering business models operating in network configurations, for
example the ones presented by Bouwman et al. (2005b) and Gordijn and
Akkermans (2003). In turn, the field “Relationships and flows” details the
identified interactions, providing hints about business flows to address in the
business model. The relevance of detailing each actor’s relationships in BIZ2BIS
was also supported by the Social Capital’s relational dimension. Moreover, the
importance that business model definitions and components (Timmers, 1998, Weill
and Vitale, 2001, Kallio et al., 2006, Stanoevska-Slabeva and Hoegg, 2005)
assigned to tangible and intangible values exchanged among actors played an
important role in our decision to include this field in the artifact. Studies on
networked configurations (Tapscott et al., 2000, Parolini, 1999, Allee, 2000) also
underlined this idea.
“Roles”: corresponds to ANT’s program of action that inscribes the behavior of the
actors in the network, materializing the ANT concept of inscription. The
description of the actor’s roles is also addressed in business model theory
(Timmers, 1998, Alt and Zimmermann, 2001, Gordijn, 2002, Osterwalder, 2004,
Parolini, 1999, Allee, 2008).
“Goals”: was influenced by contributions in the business model domain that
underline the need to perceive the individual goals of each actor (Al-Debei et al.,
2008). It also gathers fundamental information to manage the alignment of interests
among actors and clarifies how the network goals can be refined based on the
actors’ individual expectations.
5.3.1.3 Step I.c: Representation of the business model
The knowledge obtained on the network (Step I.a “Exploration of the business model”)
allied with the one on the actors (Step II.b “Description of the participating actors”) details the
conceived business model, enables its representation, and encourages its discussion.
However, BIZ2BIS dispersed this information by several artifacts in the form of text. To
synthesize and represent it in an expedite way, BIZ2BIS offers two different outlooks for
the business model data in Step I.c. This step is particularly helpful at the end of Phase I, but
it should be used whenever the need to represent the envisioned solution for the networked
business model arises. For instance, if transformations in the business model take place in
Phase II, it can be useful to depict and discuss them. The versions of the artifacts used in this
step reproduce the proposed solutions for the business model, and thus its evolution.
Purpose
It visually assembles and summarizes the business flows ascertained among all the
identified actors in the previous two steps, based on the data collected through the
“Networked business model description chart” and the “Actor description chart”. The
gathered information can be presented in the form of two artifacts: the “Flow diagram” and
the “Flow matrix”. Since these artifacts focus their attention on depicting the business flows

Chapter 5 – BIZ2BIS: Business model and IS design
140
among actors, they provide a compact representation of the ones identified in Step I.a and
Step I.b.
Description and illustration of the artifacts
The “Flow Diagram” depicts the business model inspired in a graph notation, in which
the nodes represent the actors and the arrows the direction of the business model flows. It
can be used to illustrate a conceived business model or to gradually construct it by
introducing the actors and the business flows step-by-step. The latter option helps explain
adopted solutions and discuss alternatives, which suits brainstorming situations.
The business flows represented in the artifact are categorized in four types: material or
service, finance, information, and intangible connection (e.g., reputation, influence,
customer loyalty, and cooperation). To enhance readability, we organized the “Flow
diagram” in layers that can be analyzed in isolation (just one type of flow) or overlaid
(several flows) (see Figure 26). The purpose of this artifact is to supply analysts with
different point of views that should be used according to their subject of study.
Figure 26: Layers of flows
Figure 27 exemplifies a “Flow diagram” for our illustrative example (GreenHomes).
The artifact depicts all the business flows in just one layer (e.g., inserted data, established
cooperation, and data analysis) because the disclosed data does not make the diagram too
complex or dense. Similar to the conceived business model, each involved actor is
considered a network in itself, with its own characteristics and relationships that can be
explored. In the graphical representation of the actors, it is possible to introduce extra
details: for instance images or textual descriptions. To illustrate this feature, we used a
different image for human and the non-human actors. Since the specificities of actors
belonging to a profile may be relevant to the business model, the artifact allows the
possibility to establish relationships of specialization among the actors. We illustrate this
feature in the example below by addressing two types of users: “Standard” and
“Monitored”.
Material or service
Finance
information
Intangible
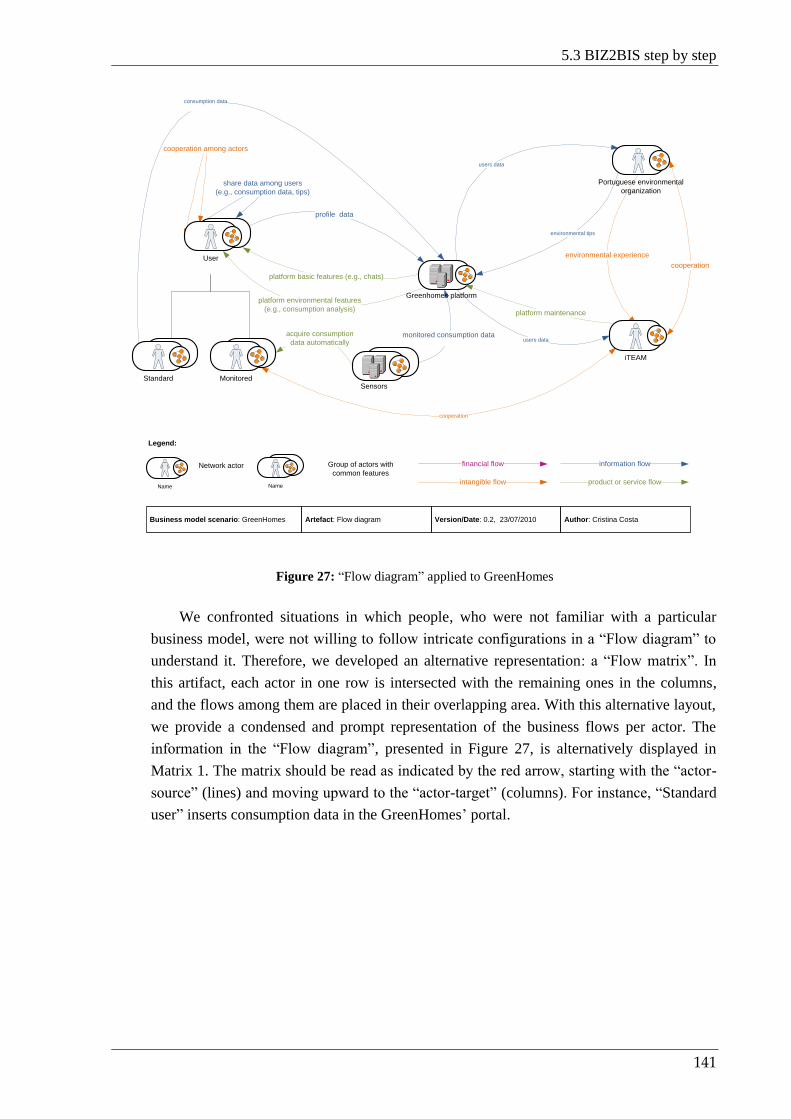
5.3 BIZ2BIS step by step
141
consumption data
profile data
monitored consumption data
users data
platform basic features (e.g., chats)
cooperation among actors
cooperation
share data among users
(e.g., consumption data, tips)
acquire consumption
data automatically users data
cooperation
environmental experience
environmental tips
platform environmental features
(e.g., consumption analysis)
Legend:
Network actor Group of actors with
common features
financial flow
intangible flow
information flow
product or service flow
Business model scenario: GreenHomes Artefact: Flow diagram Version/Date: 0.2, 23/07/2010 Author: Cristina Costa
Standard
Name Name
iTEAM
Portuguese environmental
organization
Greenhomes platform
MonitoredSensors
User
platform maintenance
Figure 27: “Flow diagram” applied to GreenHomes
We confronted situations in which people, who were not familiar with a particular
business model, were not willing to follow intricate configurations in a “Flow diagram” to
understand it. Therefore, we developed an alternative representation: a “Flow matrix”. In
this artifact, each actor in one row is intersected with the remaining ones in the columns,
and the flows among them are placed in their overlapping area. With this alternative layout,
we provide a condensed and prompt representation of the business flows per actor. The
information in the “Flow diagram”, presented in Figure 27, is alternatively displayed in
Matrix 1. The matrix should be read as indicated by the red arrow, starting with the “actor-
source” (lines) and moving upward to the “actor-target” (columns). For instance, “Standard
user” inserts consumption data in the GreenHomes’ portal.
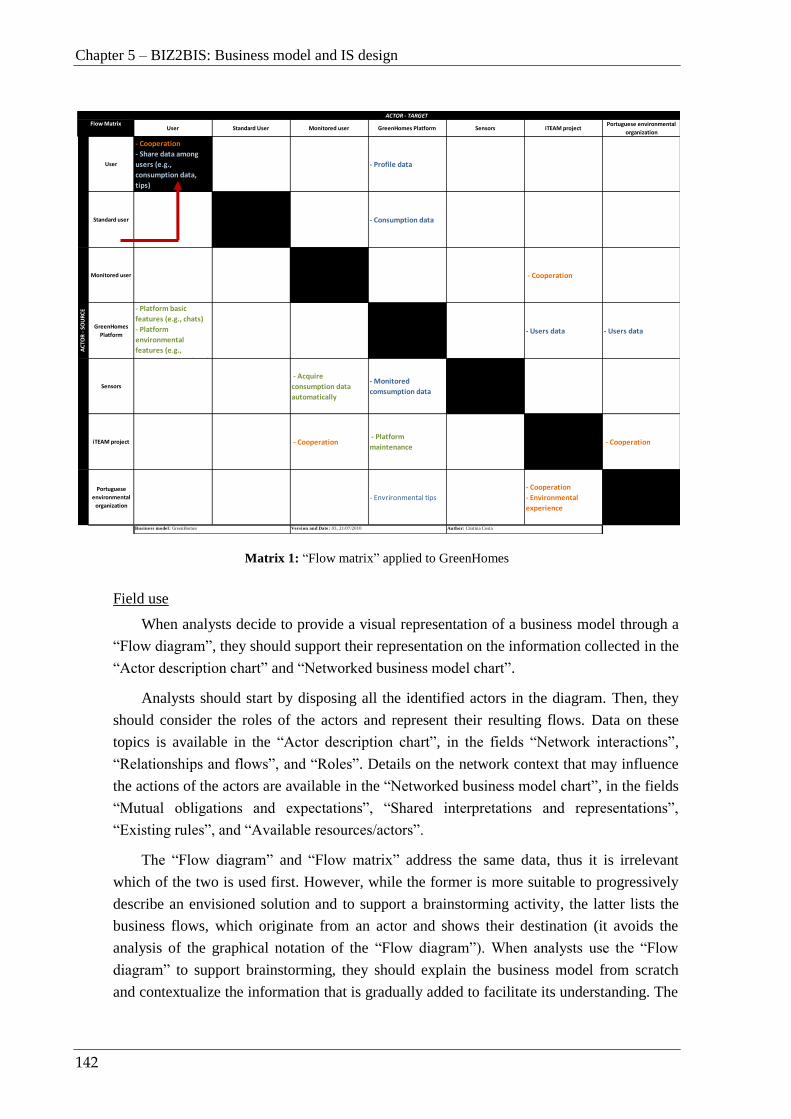
Chapter 5 – BIZ2BIS: Business model and IS design
142
Matrix 1: “Flow matrix” applied to GreenHomes
Field use
When analysts decide to provide a visual representation of a business model through a
“Flow diagram”, they should support their representation on the information collected in the
“Actor description chart” and “Networked business model chart”.
Analysts should start by disposing all the identified actors in the diagram. Then, they
should consider the roles of the actors and represent their resulting flows. Data on these
topics is available in the “Actor description chart”, in the fields “Network interactions”,
“Relationships and flows”, and “Roles”. Details on the network context that may influence
the actions of the actors are available in the “Networked business model chart”, in the fields
“Mutual obligations and expectations”, “Shared interpretations and representations”,
“Existing rules”, and “Available resources/actors”.
The “Flow diagram” and “Flow matrix” address the same data, thus it is irrelevant
which of the two is used first. However, while the former is more suitable to progressively
describe an envisioned solution and to support a brainstorming activity, the latter lists the
business flows, which originate from an actor and shows their destination (it avoids the
analysis of the graphical notation of the “Flow diagram”). When analysts use the “Flow
diagram” to support brainstorming, they should explain the business model from scratch
and contextualize the information that is gradually added to facilitate its understanding. The
User Standard User Monitored user GreenHomes Platform Sensors iTEAM projectPortuguese environmental
organization
User
- Cooperation
- Share data among
users (e.g.,
consumption data,
tips)
- Profile data
Standard user - Consumption data
Monitored user - Cooperation
GreenHomes
Platform
- Platform basic
features (e.g., chats)
- Platform
environmental
features (e.g.,
consumption analysis)
- Users data - Users data
Sensors
- Acquire
consumption data
automatically
- Monitored
comsumption data
iTEAM project - Cooperation - Platform
maintenance - Cooperation
Portuguese
environmental
organization- Envrironmental tips
- Cooperation
- Environmental
experience
Flow Matrix
ACTOR - TARGET
AC
TOR
- S
OU
RC
E
Business model: GreenHomes Version and Date: 03, 21/07/2010 Author: Cristina Costa

5.3 BIZ2BIS step by step
143
exposed knowledge provides actors with the necessary background to participate and
contribute to the business model discussion in a more reasoned way.
The “Flow diagram” and the “Flow matrix” should be used whenever the need to show
a relevant version of the business model arises (e.g., a point of departure, or the outcome of
a carried out negotiation). The consecutive versions of these artifacts reproduce the go-
between steps of the idealized business model, as thus its evolution. Furthermore, the
ultimate version of the business model is an excellent instrument to facilitate the first
contact of the team responsible for the development of the information system with the
adopted business model. Its ability to synthesize the gathered information and represent
adopted options easily provides the main guidelines of the business model.
Theoretical background
We based Step I.c on the information gathered through Step I.a and Step I.b. For this
reason, in a similar way, it encompasses recommendations from ANT, Structuration
Theory, and Social Capital (e.g., following the actors, describing their relationships,
defining a program of action for the network, and considering its context). These
contributions were combined with insights from the business model domain focused on
business flows and activities carried out by the actors.
5.3.2 Phase II, from Step II.a to Step II.e – Business model refinement
Phase I enables analysts to gather a detailed description of what was planned for the
networked business model by its proponents, as well as the expectations of all those involved in
that venture. The knowledge gained is used as a starting point for Phase II, which supports the
search for common aspirations, the discovery of possible collaborations, and the conceptualization
of alternative scenarios that may maximize gains and minimize efforts. This phase helps analysts
understand to what extent the interests of all actors are aligned and how they contribute to the
network overarching goals. It also aids analysts to detect occurrences that may compromise the
business model and propose alternatives. For instance, if actors show some resistance to carrying
out the activities envisioned for them by the business model proponents, it is relevant to perceive
their reasons, minimize their fears or disinterest, and encourage their involvement. Phase II
addresses the need to perform enhancements by providing a negotiation mechanism that looks for
alignments among actors that may contribute in strengthening the idealized business model.
According to Fisher and Ury (1991, p. xi) “Negotiation is a basic means of getting what you
want from others, it is a back-and-forth communication designed to reach an agreement when you
and the other side have some interests that are shared and others that are opposed”. It involves
interdependent actors and attempts to influence and persuade in order to reach a consensus that
respects, as much as possible, the views of the ones involved. This becomes particularly acute in
network scenarios in which the need to solve diversified and conflicting interests demand
sensitive re-assessments and modifications as new insights arise. Occasionally, the information
obtained in Phase II discloses hints that might cause analysts to return to Phase I and reconsider

Chapter 5 – BIZ2BIS: Business model and IS design
144
options already taken. Phase II takes an optimistic view of the negotiation process, searching for a
win-win proposal based on the assumption that the actors are engaged in a positive-sum activity in
which they create value as a result of negotiating. It aims to:
Disclose how the achievements of each actor can be used to support the goals of the
networked business model;
Compare the vision conceived by the proponents of the business model with the
perceptions and interests expressed by each actor;
Identify goals that may be compromised and that may jeopardize the networked
business model;
Detect goals shared among the actors and explore the establishment of
collaborations to support their achievement;
Promote negotiations among the actors in order to explore proposals that might
mitigate detected problems;
Propose adjustments in the network to align the interests of the actors and motivate
their participation in the envisioned solution;
Achieve a stabilized version of the value propositions provided by the business
model.
To address these aims, we conceived the steps and artifacts in Table 13.
Table 13: Phase II – Steps and supporting artifacts
Phase II – Business model refinement
Step II.a Detection of dependencies among goals Artifact II.a1 Common goal diagram
Step II.b Identification of actor affinities Artifact II.b1 Actors/Goals affinity chart
Step II.c Negotiation of actor contribution Artifact II.c1 Negotiation diagram
Step II.d Description of critical dependencies Artifact II.d1 Dependency flow diagram
Step II.e Stabilization of value propositions Artifact II.e1 Business flows/Value propositions chart
To achieve this purpose, we start by concentrating on each actor’s interest and
understanding how they can contribute to the network. Then, we search for possible
scenarios of collaborations that can reinforce the configuration of the idealized network.
Similarly to what was proposed for the preceding phase, it is necessary to continuously
update the content of the artifacts, as extra information is gradually obtained.
5.3.2.1 Step II.a: Detection of dependencies among goals
Step II.a begins by detailing how the proponents of the business model idealized the
participation of the involved actors in the network, and then, based on the information
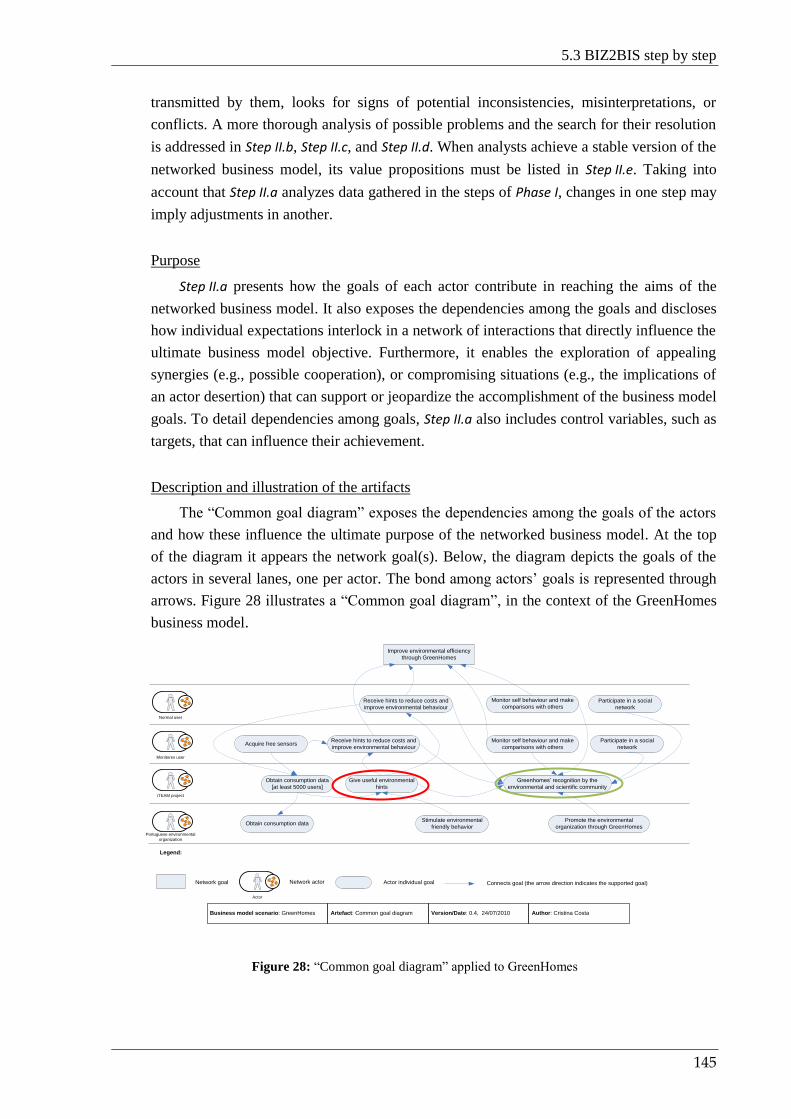
5.3 BIZ2BIS step by step
145
transmitted by them, looks for signs of potential inconsistencies, misinterpretations, or
conflicts. A more thorough analysis of possible problems and the search for their resolution
is addressed in Step II.b, Step II.c, and Step II.d. When analysts achieve a stable version of the
networked business model, its value propositions must be listed in Step II.e. Taking into
account that Step II.a analyzes data gathered in the steps of Phase I, changes in one step may
imply adjustments in another.
Purpose
Step II.a presents how the goals of each actor contribute in reaching the aims of the
networked business model. It also exposes the dependencies among the goals and discloses
how individual expectations interlock in a network of interactions that directly influence the
ultimate business model objective. Furthermore, it enables the exploration of appealing
synergies (e.g., possible cooperation), or compromising situations (e.g., the implications of
an actor desertion) that can support or jeopardize the accomplishment of the business model
goals. To detail dependencies among goals, Step II.a also includes control variables, such as
targets, that can influence their achievement.
Description and illustration of the artifacts
The “Common goal diagram” exposes the dependencies among the goals of the actors
and how these influence the ultimate purpose of the networked business model. At the top
of the diagram it appears the network goal(s). Below, the diagram depicts the goals of the
actors in several lanes, one per actor. The bond among actors’ goals is represented through
arrows. Figure 28 illustrates a “Common goal diagram”, in the context of the GreenHomes
business model.
Improve environmental efficiency
through GreenHomes
Promote the environmental
organization through GreenHomes
Greenhomes’ recognition by the
environmental and scientific community
Receive hints to reduce costs and
improve environmental behaviour
Receive hints to reduce costs and
improve environmental behaviour Acquire free sensors
Obtain consumption data
[at least 5000 users]
Obtain consumption data
Participate in a social
network
Participate in a social
network
Give useful environmental
hints
Stimulate environmental
friendly behavior
Business model scenario: GreenHomes Artefact: Common goal diagram Version/Date: 0.4, 24/07/2010 Author: Cristina Costa
Monitor self behaviour and make
comparisons with others
Monitor self behaviour and make
comparisons with others
Legend:
Network goal Network actor Actor individual goal Connects goal (the arrow direction indicates the supported goal)
Normal user
Monitores user
iTEAM project
Portuguese environmental
organization
Actor
Figure 28: “Common goal diagram” applied to GreenHomes
Chapter 5 – BIZ2BIS: Business model and IS design
146
The goal “Give useful environmental hints” (red ellipse) depends on the goals “Obtain
consumption data” (of the iTEAM project actor) and on “Stimulate environmental friendly
behavior” (of the Portuguese environmental organization actor). Together, these three goals
gather the conditions to satisfy the users’ expectations of reducing costs and improving their
ecological conduct (goal “Receive hints to reduce costs and improve environmental
behavior”). Moreover, they contribute in accomplishing the network aim. It is also possible
to show that the goal “GreenHomes recognition by the environmental and scientific
community” (green ellipse) is extremely dependent from the user’s goals. This is an alert: if
the users do not accomplish their goals, the business model is at risk. Figure 28 also
exemplifies the use of a target. In the “Obtain consumption data” goal, the label “[at least
5000 users]” is a preliminary indication of the number of users required to justify the
interest of the iTEAM project on GreenHomes. If this value is not reached, the goal can be
seriously compromised, consequently affecting the business model.
Field use
Analysts should start Step II.a by consulting the goals that the networked business
model should achieve in the “Networked business model chart” (fields “Network goals” and
“Network opportunities”). They should be placed at the top of the “Common goal diagram”.
Then, analysts should verify from the goals expressed by each actor in its corresponding
“Actor description chart”, the ones that contribute (directly or indirectly) to the achievement
of the networked business model goals. Analysts should also display these individual goals
in the diagram (a lane for each actor) and expose the dependencies among them (including
the ones defined for the network). If possible, they should use this diagram in collaboration
with practitioners. Their knowledge on the domain under study makes it easier to establish
existing relationships and clarify certain issues that still raise doubts. They can provide
additional viewpoints that can aid analysts in realizing the importance and impact of their
participation.
The exposed dependencies among the actors’ goals offer clues on how they should be
engaged in the network. However, infeasible occurrences can be detected (e.g., an actor
with a relevant goal can refuse to enroll, or may not gather the conditions to accomplish it).
Therefore, in the final stage of Step II.a, analyst should use all the gathered information to
disclose in the “Common goal diagram” the goals that are more difficult to achieve and thus
may compromise the network. They should also try to understand the relevance of those
goals. Preferably, actors should make this relevance explicit; if not, analysts should use the
number of identified dependencies as an indicator. The goals that stand out as critical must
be addressed in the following steps of BIZ2BIS.
Theoretical background
The use of the “Common goal diagram” was mainly inspired by ANT’s concepts of
problematization and interessement, since it encompasses attempts to define how actors can
contribute with their own goals for the ultimate purpose of networked business models. Its
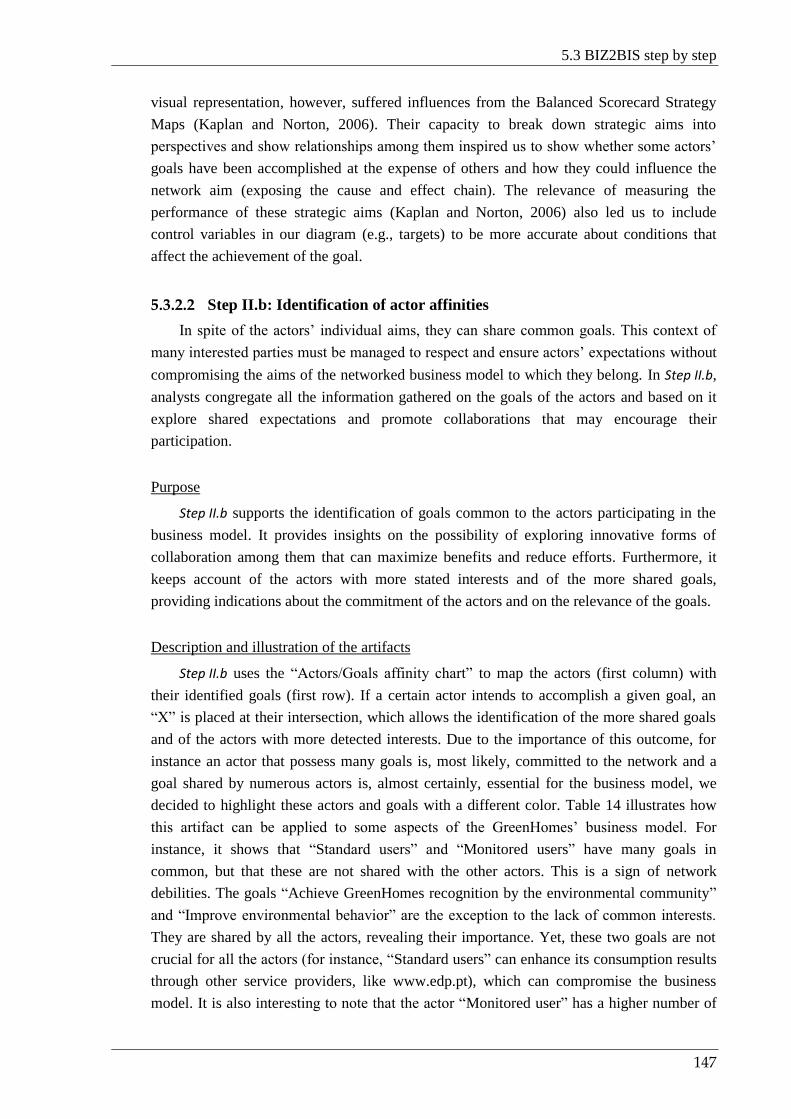
5.3 BIZ2BIS step by step
147
visual representation, however, suffered influences from the Balanced Scorecard Strategy
Maps (Kaplan and Norton, 2006). Their capacity to break down strategic aims into
perspectives and show relationships among them inspired us to show whether some actors’
goals have been accomplished at the expense of others and how they could influence the
network aim (exposing the cause and effect chain). The relevance of measuring the
performance of these strategic aims (Kaplan and Norton, 2006) also led us to include
control variables in our diagram (e.g., targets) to be more accurate about conditions that
affect the achievement of the goal.
5.3.2.2 Step II.b: Identification of actor affinities
In spite of the actors’ individual aims, they can share common goals. This context of
many interested parties must be managed to respect and ensure actors’ expectations without
compromising the aims of the networked business model to which they belong. In Step II.b,
analysts congregate all the information gathered on the goals of the actors and based on it
explore shared expectations and promote collaborations that may encourage their
participation.
Purpose
Step II.b supports the identification of goals common to the actors participating in the
business model. It provides insights on the possibility of exploring innovative forms of
collaboration among them that can maximize benefits and reduce efforts. Furthermore, it
keeps account of the actors with more stated interests and of the more shared goals,
providing indications about the commitment of the actors and on the relevance of the goals.
Description and illustration of the artifacts
Step II.b uses the “Actors/Goals affinity chart” to map the actors (first column) with
their identified goals (first row). If a certain actor intends to accomplish a given goal, an
“X” is placed at their intersection, which allows the identification of the more shared goals
and of the actors with more detected interests. Due to the importance of this outcome, for
instance an actor that possess many goals is, most likely, committed to the network and a
goal shared by numerous actors is, almost certainly, essential for the business model, we
decided to highlight these actors and goals with a different color. Table 14 illustrates how
this artifact can be applied to some aspects of the GreenHomes’ business model. For
instance, it shows that “Standard users” and “Monitored users” have many goals in
common, but that these are not shared with the other actors. This is a sign of network
debilities. The goals “Achieve GreenHomes recognition by the environmental community”
and “Improve environmental behavior” are the exception to the lack of common interests.
They are shared by all the actors, revealing their importance. Yet, these two goals are not
crucial for all the actors (for instance, “Standard users” can enhance its consumption results
through other service providers, like www.edp.pt), which can compromise the business
model. It is also interesting to note that the actor “Monitored user” has a higher number of

Chapter 5 – BIZ2BIS: Business model and IS design
148
goals than the “Standard user”. The former has the advantage of receiving free equipment,
which reinforces the engagement of this user.
Table 14: “Actors/Goals affinity chart” applied to GreenHomes
Field use
In Step II.b analysts should consider all the goals expressed by the actors in Step I.b
“Description of the participating actors” and the influences disclosed in Step II.a “Detection of
dependencies among goals”. They should start by comparing the goals detailed in the “Actor
description chart” of each actor (Step I.b), and identify those that are common. The results
show the goals that each actor possesses and the number of actors that share a common
goal. For readability, analysts can use colored lines and columns to highlight the ones with
higher values. The calculated values provide valuable indications that analysts should use to
explore clusters created around common goals and synergies among actors with common
purposes. Based on the obtained insights, analysts should be able to propose new forms of
collaboration, reinforcing the network relationships and the reasons for the actors to remain
in the network.
In Step II.a, analysts used the “Common goal diagram” to identify dependencies among
goals and disclose possible threats to the networked business model. Therefore, analysts
should also explore how the chances of collaboration raised in this step can be used to
Actors / Goals affinity chart
Ach
ieve
Gre
en
Ho
me
s re
cogn
itio
n b
y th
e e
nvi
ron
me
nta
l
com
mu
nit
y
Imp
rove
en
viro
nm
en
tal
frie
nd
ly b
eh
avio
ur
Mo
nit
or
self
be
hav
iou
r an
d c
om
par
e e
ne
rge
tic
be
hav
iou
rs
Ob
tain
co
nsu
mp
tio
n d
ata
Par
tici
pat
e i
n a
so
cial
ne
two
rk
Re
ceiv
e h
ints
to
re
du
ce c
ost
an
d i
mp
rove
en
erg
eti
c b
eh
avio
ur
Par
tici
pat
e i
n r
ese
arch
exp
eri
me
nt
and
re
ceiv
e f
ree
se
nso
rs
Pro
mo
te t
he
Po
rtu
gue
en
viro
nm
en
tal
org
aniz
atio
n t
ho
ugh
Gre
en
Ho
me
s
Re
sear
ch a
nd
ob
tain
sci
en
tifi
c re
cogn
itio
n
Tota
l am
ou
nt
Monitored user X X X X X X 6
Normal user X X X X X 5
iTEAM project X X X X 4
Portuguese Environmental
Organization X X X X 4
Total amount 4 4 2 2 2 2 1 1 1
B usiness mo del: GreenHomes A utho r: Cristina CostaVersio n and D ate: 0.3, 24/07/2010

5.3 BIZ2BIS step by step
149
mitigate them. Since some of the relationships in the network may have a sensitive nature,
analysts may try to check with the actors to perceive, whether or not, they are interested in
establishing future collaborations.
Theoretical background
Step II.b obtains data from BIZ2BIS’ steps that were inspired in ANT’s guideline of
following the actors. These steps enhance the knowledge on the network and provide
valuable hints to support the search for mutual interests. Step II.b is also influenced by
ANT’s concepts of problematization and interessement, since it aids analysts to understand
if the roles defined for the actors in the networked business model are exploring the
potential of future collaborations. The detection of common concerns and their exploitation
is also suggested in the literature that addresses the creation of value in network
configurations (Normann and Ramírez, 1993, Gulati et al., 2000, Allee, 2008).
5.3.2.3 Step II.c: Negotiation of actor contributions
Phase II is supported by an iterative negotiation mechanism that has as its core Step II.c.
This step uses the information gathered on the network, its actors, and the conceived
arrangements of interests and affinities to analyze critical aims for the networked business
model. If need be, Step II.c details and confirms detected problems, and considers new
proposals for their resolution, which may demand obtaining new data and the readjustment
of the proposed solution. Analysts can advance to Step II.e “Stabilization of value
propositions”, when they obtain indications that the expectations of the actors are met.
Purpose
Step II.c addresses critical aims by detailing the activities that can affect them and the
influences that they exert on other aims. It balances gains and efforts of the actors involved
in the goal (the ones that support it and the ones that gain from it) to clarify their interests
towards that goal. In this step, analysts may have to consider several adjustments to the
proposed business model in order to stimulate and encourage actors’ participation and avoid
betrayals. An iterative search for alternative scenarios should be made until analysts reach a
suitable alignment among the interests of the actors and these have reasons to maintain their
presence in the business model.
Description and illustration of the artifacts
In the “Negotiation diagram”, we placed the goal under analysis (rounded rectangle)
and the actor(s) that own(s) it at the centre of the diagram (Figure 29). Below them are the
actors that carry out the supporting activities that sustain the central goal achievement. We
rated the effort spent on these activities in a scale from (rectangle adjacent to the
activities). Value “1” is the least significant and “5” the most significant. We also used this
scale to indicate the gain obtained with the outcomes of these supporting activities, which
can have two types of beneficiaries: the central actor(s) that own(s) the goal under study and

Chapter 5 – BIZ2BIS: Business model and IS design
150
the set of actors that directly benefit from its achievement (the ones at the top of the
diagram). The gains of the former are placed in the red circles, while the ones of the latter
are specified below each rectangle labeled “gain”, on the right side. To summarize the effort
spent and the gain obtained by each actor for the goal under analysis, as well as the
difference between both, a small chart is provided in the lower right hand corner of the
diagram.
Receive hints to reduce costs and
improve environmental behaviour
iTEAM
5
Gain
Normal User 6
Result
5 +1
EffortGain
iTEAM
5
Gain
iTEAM
3
Gain
Gai
n
Legend:
Goal
Actor with the goal
under analysis Activity
Actor
[1..5]
Effort
Gain that the actor with the goal
under analysis obtains
Identify goals influenced positively
by the goal under analysis
3
PEO
4
PEO
Present tips to improve user
environmental behaviour
iTEAM project 13 5 +8
Portuguese environm.
organization (PEO)7 5 +2
iTEAM
5
Effort
4
Insert dataNormal
User
5
Effort2
Business model scenario: GreenHomes Artefact: Negotiation diagram Version/Date: 0.3, 25/07/2010 Author: Cristina Costa
Normal user
Achieve GreenHomes
recognition
Improve environmental
friendly behaviourObtain consumption data
Name
Actor
[1..5]
Gain
Goal
Effort spent by an actor
to perform an activity Gain that a goal brings to
an actor
PEO
5
Figure 29: “Negotiation diagram” applied to GreenHomes
The “Negotiation diagram” in Figure 29 details the goal “Receive hints to reduce costs
and improve environmental behavior” - a goal owned by the “Standard user” and decisive
for the purposes of the GreenHomes business model (as pointed out in Step II.a). As we can
observe in the upper part of the figure, this goal influences the iTEAM and the Portuguese
environmental organization, since these actors depend on its achievement for their own
purposes. If these actors suspect that the accomplishment of the aim is at risk, and
consequently some of their main interests can be jeopardized, they can abandon the
network. In the lower part of the diagram, we have the activities that support the goal under
analysis: “Present tips to improve user environmental behavior” and “Insert data”. Both
demand a high effort from the actors that carry them out. In addition, the latter strongly
depends on “Standard users”, who have to weekly insert their consumption data. In spite of
this, their gain with the achievement of the aim is not significant, as can be seen in the small
chart in Figure 29. To complicate matters, “Standard users” do not have other significant
benefits in the business model (their gain depends essentially on their effort). Taking into
account that the activity “Insert data” can endanger the accomplishment of the goal under

5.3 BIZ2BIS step by step
151
analysis, it is necessary to promote actions to strengthen “Standard users” presence, or to
minimize collateral damages of their abandonment.
Field use
Analysts should apply Step II.c whenever the insights from the “Common goal
diagram” reveal actors’ goals that may face difficulties in being achieved. Since these goals
contribute to the network aims, their implications in the networked business model must be
considered in detail. In a first stage, for each of these critical goals, analysts should use the
“Negotiation diagram” to represent the scenario that gave rise to suspicions. For each goal
and for all actors related with it, analysts should rate the effort spent in executing the
activities that support it and the benefits obtained from its accomplishment on the scale
. Values can be obtained in two ways: based on the opinions expressed by the
actors during the meeting and the interviews, or by questioning them. However, it is
advantageous for the approach to persuade the actors with the goal under analysis to give
their own assessment of the developed diagram. Their collaboration can promote the earlier
identification of problems that may undermine the networked business model (e. g., lack of
interest of some actors) and expose misunderstandings.
The sum of the gain and effort for each actor gives clues about their motivation to
contribute to the achievement of the goal. If the balance is negative, or residual, and the
addressed actors are not able to obtain other benefits to make their involvement worthwhile,
analysts should conceive alternatives capable of encouraging participation from these
actors. If their balance is clearly positive, they benefit from the goal and analysts can use
this insight to support their future options in the study of the business model. After
obtaining the balance between the gain and the effort for each actor involved in the critical
goal, analysts should compare the obtained results with the suspicions raised in Step II.a in
order to confirm them, or on the contrary, discard them. Furthermore, the results achieved
for each goal cannot be analyzed from a narrow perspective. For instance, a goal may not be
appealing for a particular actor due to the few benefits obtained and the high effort
demanded, but the business model may offer other advantages that can make it worthwhile
for the actor. In situations in which a positive balance is not reached with the business
model (it requires a commitment beyond the obtained counterparts for an actor), analysts
should initiate a negotiation process. They should try to identify areas of improvement (e.g.,
fostering collaborations and promoting the sharing of resources). For this to happen, it may
be necessary to make adjustments that involve concessions, therefore analysts should try to
identify bargaining chips to support their attempt to align the interests of the various actors.
Step II.b “Identification of actor affinities” can be a valuable source of clues for more
collaborative and less penalizing scenarios, which can reduce efforts and maximize benefits
in ways to encourage actors to maintain their presence in the network. Whenever analysts
consider an alternative scenario based on the knowledge acquitted during the negotiations,
they should use a new “Negotiation diagram” to address the goals that may be affected by

Chapter 5 – BIZ2BIS: Business model and IS design
152
the changes under consideration. Each updated version of the artifact must be assessed to
guarantee the interest of the involved actors.
Analysts should base their attempts to align the interests of the actors, and
consequently the stability of the network, on the data gathered in the previous steps of
BIZ2BIS. In particular, they should take into account if the individual expectations of the
actors (expressed in the “Actors description chart”) are being fulfilled. If this is not the case,
analysts should iteratively explore alternatives, negotiate with the actors, and assess the new
proposals until the actors that support critical aims to the business model have reasons to
maintain their presence in the network.
Theoretical background
Step II.c was mainly inspired by ANT. We followed Latour’s (1986a, p. 267) view that
an idea depends on the involved actors, who have the power to appropriate, ignore, modify,
or betray it. ANT’s translation influenced us to address the dynamics in networked business
models. It showed us the importance of continuously considering the needs of each actor in
the network, capturing their interests, convincing them to participate, searching for their
alignment, and establishing a program of action. According to our interpretation, translation
phases influence, revisit, and overlap themselves, in a continuous process of attempts in
which the division in phases sometimes gets lost. Since each translation is triggered by a
problem or an opportunity, depending on the characteristics of the scenarios, it is possible to
have chains of translations that run sequentially or in parallel. This was observed, for
instance, in the implementation of an inter-organizational information system in the port of
Barcelona (Rodon et al., 2008). We also integrated this perspective in BIZ2BIS. In Phase II,
we conceived a negotiation process (with its core in Step II.c) that iteratively searches for a
business model capable of meeting the expectations of its actors. It is supported by the
“Negotiation diagram”, which embraces ANT’s concepts of interessement and enrolment.
Based on the data obtained in the remaining steps of BIZ2BIS (that may imply one or more
translations), it verifies the interest of the actors in participating in the business model. If
situations that jeopardize the network are detected (for instance problematic activities,
where actors have to contribute with demanding effort and do not receive significant
compensation), necessary adjustments must be made. The solution (based on the insights of
the other steps) may require a new translation or involve the return to a previous stage of the
same translation. For instance, identify new opportunities, sense possible collaborations,
convince others to join the network, and perform adjustments to assure the alignment of
interests - a successful negotiation usually requires the accomplishment of mutually
satisfying outcomes. The artifact also includes aspects pointed out by business model
definitions: it shows the gain and effort of each actor involved in a critical aim and how the
actors support its accomplishment (Stähler, 2002).
Kock et al. (1996), inspired among others by Fisher and Ury (1991), propose that the
ones responsible for the process should take into account the following guidelines:

5.3 BIZ2BIS step by step
153
Determine needs, constraints, and resources for all the involved, separating people
from the problem, and focusing on interests, not positions;
Search common needs and desires among the negotiating participants;
Reinterpret scenarios, or alternatively reframing the problem in creative ways, to
benefit all parties.
The symbiosis between BIZ2BIS’ steps and the presented guidelines reinforced our
choice to use the concept of translation as the main source of inspiration of the conceived
negotiation mechanism. The knowledge gathered in Phase I and Step II.a “Detection of
dependencies among goals” allows BIZ2BIS to fulfill the first guideline. The insights
obtained in Step II.b “Identification of actor affinities” support the second one. Step II.c
“Negotiation of actor contributions” and Step II.d “Description of critical dependencies” aid to
expose different sensibilities that may cause drift tendencies. In this case, the approach
supports the attempts to better align the interests of the various actors as suggested in the
third guideline, so that the resulting network is stable and resilient to pursue the goals set in
its business model.
5.3.2.4 Step II.d: Description of critical dependencies
Step II.a “Detection of dependencies among goals” and Step II.c “Negotiation of actor
contributions” support the identification of actors, activities, and flows, whose absence may
put the networked business model at risk. For instance, if some actors do not obtain enough
benefits, or if the activities assigned to them are too demanding, the flows to which they
give rise may be jeopardized. Step II.d details the implications of the lack of these flows.
The obtained perception provides analysts with valuable indications that may help them
conduct negotiations with the involved actors and mitigate possible threats.
Purpose
When there are indications that business flows may be compromised, Step II.d exposes
the involved actors and the factors on which they depend on. It also supports the
identification of the value propositions harmed by the uncertainty related to these flows.
Description and illustration of the artifacts
The impact of the absence of certain flows in the business model is illustrated by the
“Dependency flow diagram” (Figure 30). Similarly to the “Flow diagram”, it represents an
actor by an ellipse with a labeled image and a business flow by an arrow. Moreover, it lists
the factors that can influence the flows under study in a rectangle. In this artifact, labeled
ellipses stand for affected value propositions. Dashed arrows connect each of them and the
flows under analysis. Their points of origin “X” overlap with the flows under analysis and
their destinies point out to the identified value propositions.

Chapter 5 – BIZ2BIS: Business model and IS design
154
The insights obtained in Step II.c “Negotiation of actor contributions” (previous section),
when analyzing the activity “insert data” and the information flow “consumption data” in
the “Negotiation diagram”, led us to detail the impact that this flow may have on the
business model. As depicted in the “Dependency flow diagram” in Figure 30, the flow
“consumption data” can put two important value propositions for the business model at risk:
“Obtain data consumption” and “GreenHomes recognition” and jeopardize actors’
aspirations.
consumption data
Legend:
business flow
It depends on:
- Motivation to insert data
X
Dependency
Direction of the dependency
Existing depencies X Dependency origin
Value
proposition
Dependent value
proposition
Business model scenario: GreenHomes Artefact: Dependence flow diagram Version/Date: 0.2, 25/07/2010 Author: Cristina Costa
Network actor Group of actors with
common features
Name Name
Standard users
Greenhomes platform
GreenHomes recognition
iTEAM
Portguese enviromental
organization
Obtain data consumption
Figure 30: “Dependency flow diagram” applied to GreenHomes
Figure 30 highlights the importance that the consumption data entered by the “Standard
users” has for the business model. If no additional incentives are made, in order to motivate
and convince them to maintain their participation and manually introduce data, the network
will collapse.
Field use
In Step II.a “Detection of dependencies among goals” and Step II.c “Negotiation of actor
contributions”, analysts may detect actors with critical roles, whose participation does not
provide enough benefit to compensate their exertion. In such cases, analysts should detail in
Step II.d the effect of the absence of these actors in the business model. It is critical to
identify activities at risk, flows that will cease to exist if these actors abandon the network,
activities that depend on them, value propositions that they can compromise, and actors that
will see their interests jeopardized. Analysts should use the “Dependency flow diagram” to
address the endangered flows (one per diagram, or several, depending on their complexity).
They should start by confirming in all the filled in “Actor description charts” the actors’
activities that give rise to these flows, as well as their source and target. Then, they should
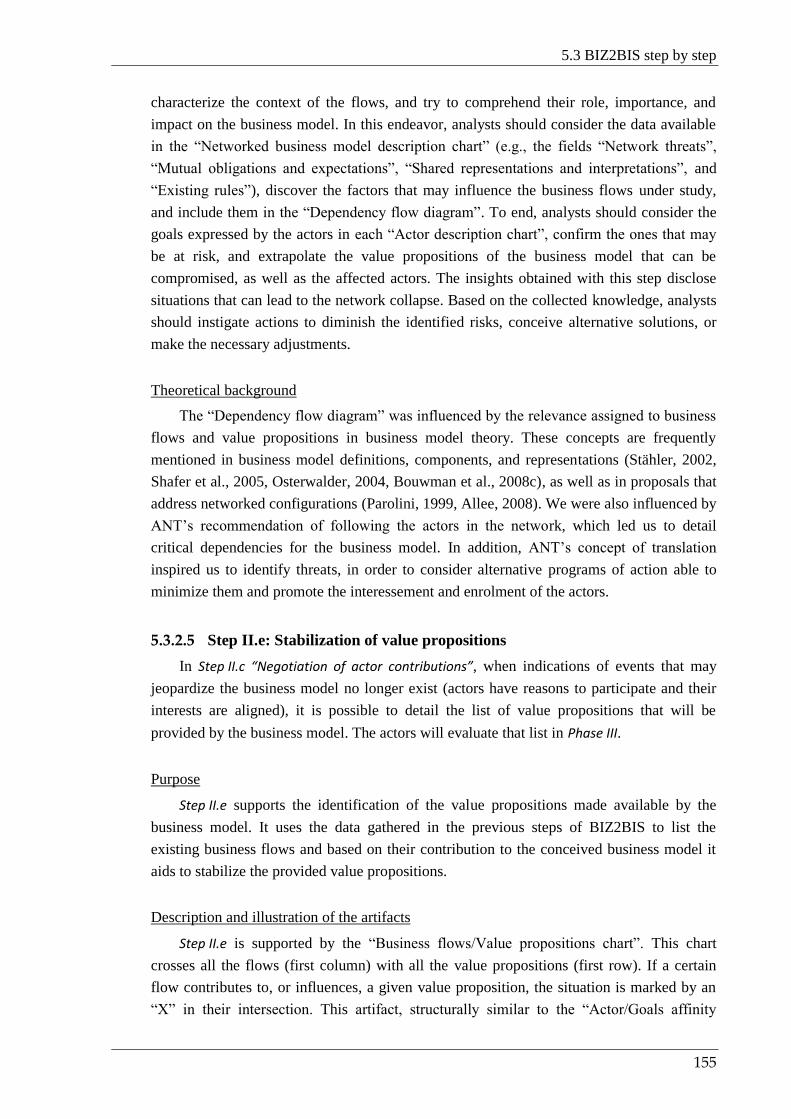
5.3 BIZ2BIS step by step
155
characterize the context of the flows, and try to comprehend their role, importance, and
impact on the business model. In this endeavor, analysts should consider the data available
in the “Networked business model description chart” (e.g., the fields “Network threats”,
“Mutual obligations and expectations”, “Shared representations and interpretations”, and
“Existing rules”), discover the factors that may influence the business flows under study,
and include them in the “Dependency flow diagram”. To end, analysts should consider the
goals expressed by the actors in each “Actor description chart”, confirm the ones that may
be at risk, and extrapolate the value propositions of the business model that can be
compromised, as well as the affected actors. The insights obtained with this step disclose
situations that can lead to the network collapse. Based on the collected knowledge, analysts
should instigate actions to diminish the identified risks, conceive alternative solutions, or
make the necessary adjustments.
Theoretical background
The “Dependency flow diagram” was influenced by the relevance assigned to business
flows and value propositions in business model theory. These concepts are frequently
mentioned in business model definitions, components, and representations (Stähler, 2002,
Shafer et al., 2005, Osterwalder, 2004, Bouwman et al., 2008c), as well as in proposals that
address networked configurations (Parolini, 1999, Allee, 2008). We were also influenced by
ANT’s recommendation of following the actors in the network, which led us to detail
critical dependencies for the business model. In addition, ANT’s concept of translation
inspired us to identify threats, in order to consider alternative programs of action able to
minimize them and promote the interessement and enrolment of the actors.
5.3.2.5 Step II.e: Stabilization of value propositions
In Step II.c “Negotiation of actor contributions”, when indications of events that may
jeopardize the business model no longer exist (actors have reasons to participate and their
interests are aligned), it is possible to detail the list of value propositions that will be
provided by the business model. The actors will evaluate that list in Phase III.
Purpose
Step II.e supports the identification of the value propositions made available by the
business model. It uses the data gathered in the previous steps of BIZ2BIS to list the
existing business flows and based on their contribution to the conceived business model it
aids to stabilize the provided value propositions.
Description and illustration of the artifacts
Step II.e is supported by the “Business flows/Value propositions chart”. This chart
crosses all the flows (first column) with all the value propositions (first row). If a certain
flow contributes to, or influences, a given value proposition, the situation is marked by an
“X” in their intersection. This artifact, structurally similar to the “Actor/Goals affinity

Chapter 5 – BIZ2BIS: Business model and IS design
156
chart”, also reveals additional information about the business model. It is possible to
become aware of the value propositions that depend on a higher number of flows, as well as
on the flows that support more value propositions. For readability, analysts can highlight the
flows that contribute to more value propositions and the value propositions that are
supported by more flows with a different color. Table 15 illustrates a “Business flows/
Value propositions chart”.
Table 15: “Business flows/Value propositions chart” applied to GreenHomes
In Table 15, the listed business flows were not directly copied from Phase I, Step I.c
(“Flow diagram” and “Flow matrix”). Some of them were grouped because their
contributions to the value propositions overlap. For instance, the intangible flows
“Cooperation between iTEAM project and the Portuguese environmental organization” and
the “Portuguese environmental organization experience” were joined and considered just as
one - both address how the association can contribute to GreenHomes. This clustering
facilitates the use and understanding of BIZ2BIS when the roles of several flows can be
considered one. The network context and the contribution of each flow to the business
model support the identification of the provided value propositions. For instance, the value
proposition “Obtain consumption data” is made available through the support of the
following flows: data obtained (manually and automatically), platform services, and
Re
du
ce p
aym
en
ts a
nd
im
pro
ve e
nvi
ron
me
nta
l
frie
nd
ly b
eh
avio
ur
Gre
en
ho
me
s re
cogn
itio
n b
y th
e s
cie
nti
fic
com
mu
nit
y
Ob
tain
co
nsu
mp
tio
n d
ata
Acc
ess
to
use
r p
rofi
les
(e.g
., a
dd
ress
, h
om
e t
ypo
logy
,
ho
me
ap
pli
ance
s)
Ob
tain
co
nsu
mp
tio
n a
nal
ysis
(e
.g.,
ave
rage
s, t
ypo
logy
and
re
gio
n c
om
par
iso
ns)
Acc
ess
to
a s
oci
al n
etw
ork
V1 V2 V3 V4 V5 V6
Platform provided services (e.g., environmental
tips, communication facilities) F1 X X X X X X 6
Consumption data manually inserted F2 X X X X 4
Profile data F3 X X X X 4
Monitored consumption data F4 X X X X 4
Cooperation among actors F6 X X X 3
Cooperation between iTEAM project and the
environmental organization F5 X X 2
Cooperation among monitored users and iTEAM
project
F7 X X 2
6 5 4 4 4 2
Business model: GreenHomes
Business flow/Value proposition chart
Nu
mb
er
of
rela
tio
nsh
ips
Number of relationships
Author: Cristina CostaVersion and Date: 0.3, 25/07/2010

5.3 BIZ2BIS step by step
157
cooperation between the iTEAM project and the “Monitored users”. The number of value
propositions supported by the same business flow is presented in the last column, and the
number of business flows that contribute to each value proposition is shown in the second
last row.
Field use
Analysts should employ Step II.e when there are no compromising situations for the
business model. They should start by considering the list of existing flows based on the data
obtained in Phase I, Step I.c “Representation of the business model” (available in the “Flow
diagram” and the “Flow matrix”). Then, they should follow these flows in all the used
artifacts to establish how the involved actors interact. Phase I, Step I.b “Description of
participating actors” and its “Actor description chart” are a privileged source of information.
It is important that analysts contextualize the flows: activities that support them, network
restrictions, interactions, as well as goals and value propositions that the flows may
jeopardize. Based on the acquired knowledge, analysts should consider how the flows are
brought together and explore their potential by prospecting their assembling possibilities.
The arranged combinations enable analysts to make out a draft of the resulting value
propositions geared by the aims of the networked business model (identified in Phase I,
Step I.a “Exploration of the business model”, in the artifact “Networked business model
description chart”). They should iteratively try to recognize the value propositions that each
flow (or group of flows) can support. Whenever a new one is detected, they should add it to
the “Business flows/Value propositions chart”. A flow that contributes to the
accomplishment of a value proposition is marked with an “X” at their intersection. When
analysts decide to stop, they should check if the identified value propositions cover all the
goals expressed by the network (Phase I, Step I.a) and its actors (Phase I, Step I.b). If some of
them will not see their interests satisfied, analysts should identify the flows and activities
that support the goals not covered and review the proposed solution. Otherwise, they should
present the disclosed value propositions to the actors (Phase III of our approach).
Theoretical background
Step II.e is supported by two concepts: business flows and value propositions. Both, as
mentioned before in this section, are inspired in the business model domain. Furthermore, it
integrates ANT’s concepts of program of action and inscription, since it establishes the
actors’ behavior in the network to make the defined value propositions available.
5.3.3 Phase III, Step III.a – Stability assessment
Phase III assesses the idealized business model based on the list of value propositions
obtained in Step II.e (Phase II). We consider that to be “fair”, the evaluation must be able to
express the actors’ views, concerns, and voices. However, it is not always possible to ensure
their active and continuous participation in all the aspects covered in Phase I and Phase II.
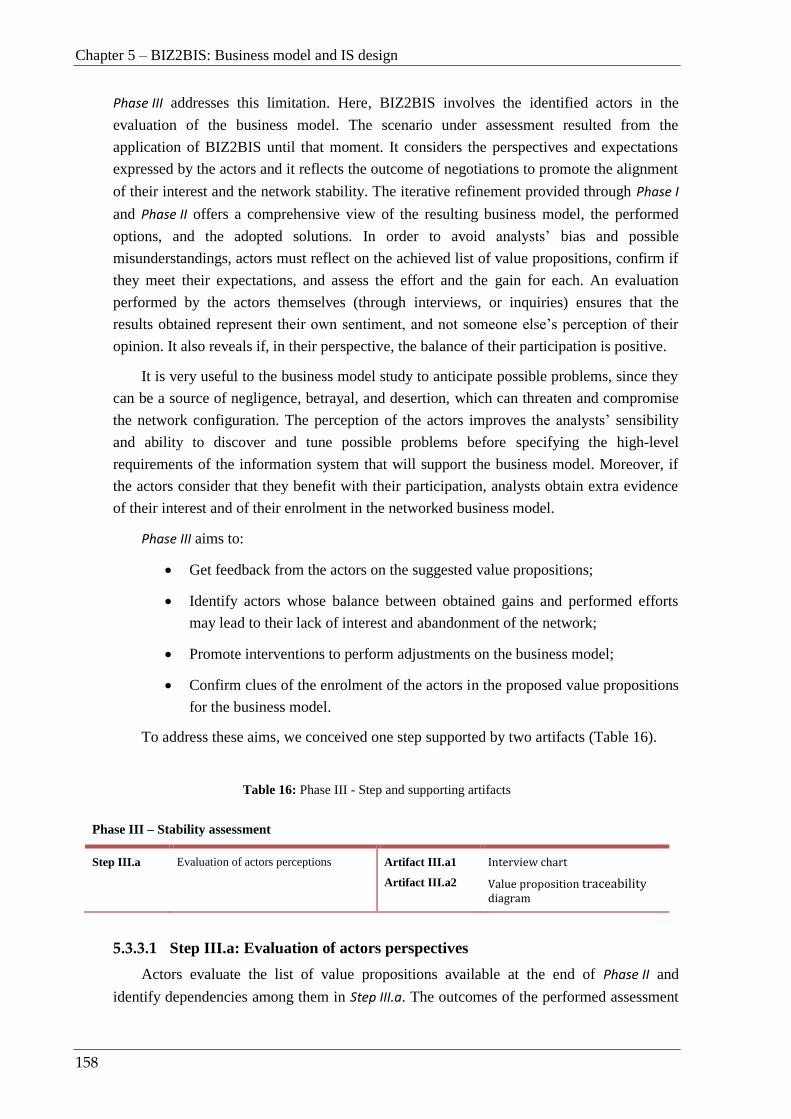
Chapter 5 – BIZ2BIS: Business model and IS design
158
Phase III addresses this limitation. Here, BIZ2BIS involves the identified actors in the
evaluation of the business model. The scenario under assessment resulted from the
application of BIZ2BIS until that moment. It considers the perspectives and expectations
expressed by the actors and it reflects the outcome of negotiations to promote the alignment
of their interest and the network stability. The iterative refinement provided through Phase I
and Phase II offers a comprehensive view of the resulting business model, the performed
options, and the adopted solutions. In order to avoid analysts’ bias and possible
misunderstandings, actors must reflect on the achieved list of value propositions, confirm if
they meet their expectations, and assess the effort and the gain for each. An evaluation
performed by the actors themselves (through interviews, or inquiries) ensures that the
results obtained represent their own sentiment, and not someone else’s perception of their
opinion. It also reveals if, in their perspective, the balance of their participation is positive.
It is very useful to the business model study to anticipate possible problems, since they
can be a source of negligence, betrayal, and desertion, which can threaten and compromise
the network configuration. The perception of the actors improves the analysts’ sensibility
and ability to discover and tune possible problems before specifying the high-level
requirements of the information system that will support the business model. Moreover, if
the actors consider that they benefit with their participation, analysts obtain extra evidence
of their interest and of their enrolment in the networked business model.
Phase III aims to:
Get feedback from the actors on the suggested value propositions;
Identify actors whose balance between obtained gains and performed efforts
may lead to their lack of interest and abandonment of the network;
Promote interventions to perform adjustments on the business model;
Confirm clues of the enrolment of the actors in the proposed value propositions
for the business model.
To address these aims, we conceived one step supported by two artifacts (Table 16).
Table 16: Phase III - Step and supporting artifacts
Phase III – Stability assessment
Step III.a Evaluation of actors perceptions Artifact III.a1
Artifact III.a2
Interview chart
Value proposition traceability diagram
5.3.3.1 Step III.a: Evaluation of actors perspectives
Actors evaluate the list of value propositions available at the end of Phase II and
identify dependencies among them in Step III.a. The outcomes of the performed assessment

5.3 BIZ2BIS step by step
159
may reveal hints that actors are uninterested or not fully committed to the business model.
In this case, analysts must carry out adjustments that may demand the return to BIZ2BIS’
Phase I (e.g., change the roles of the actors) or to Phase II (e.g., initiate a new negotiation).
Otherwise, BIZ2BIS should advance to Phase IV and proceed with the specification of the
high-level requirements of the information system that will support the business model.
Purpose
Step III.a enables actors to evaluate the list of identified value propositions and allows
analysts to use the obtained insights to support their decisions. The performed evaluation
integrates two different perspectives. One shows the actors’ perception of the effort spent to
support a certain value proposition, as well as the obtained gain. It compares the gain and
the effort of each actor, which provides clues on the benefits that they will obtain with their
participation. The other discloses how the actors perceive influences among the value
propositions and may expose dependencies not yet detected.
Description and illustration of the artifacts
The “Interview chart” supports the evaluation of the actors. It maps each business
model actor (first row) with the identified value propositions (first column). We represent
the relationship among actors and value propositions by pairs of integer numbers (g, e),
where “g” represents the gain obtained with a value proposition in the range , and
“e” denotes the effort in the range . The actors only
assign a classification to the value propositions in which they are implicated. If there is no
relationship between the actors and the value propositions, the corresponding cells appear
empty.
The influences that a specific value proposition has on others is available in its own
row, after the pair (g, e), and separated by a “/”, such as (g, e)/ , where “+|-”
further informs whether that same value proposition has a positive (“+”) or negative (“-”)
impact (one must be chosen), towards the value proposition “Vi”. The superscript “+”
denotes iteration, since a value proposition may influence none, one, or more value
propositions. By exposing the pressures/influences among the different value propositions,
we have the chance to identify critical actors and value propositions, anticipating any
“domino effects”. For instance, if an actor that supports several value propositions decides
to abandon the business model, others that rely on them may reconsider their participation
for having their gains compromised.
Table 17 exemplifies the “Interview chart” for the actor “Standard user”. For example,
it shows that this actor assigns an effort of “5” to support V3 “Obtain consumption data”
and then gives an importance of “1” to the benefits obtained from it. The “Standard user”
considers the manual insertion of data highly demanding and does not see many advantages
in maintaining a record of its consumption. This actor only assigns a gain greater than “3”
to V1 “Reduce payments and improve environmental friendly behavior”, which indicates
only a few attractive counterparts. Taking into account all the value propositions, the
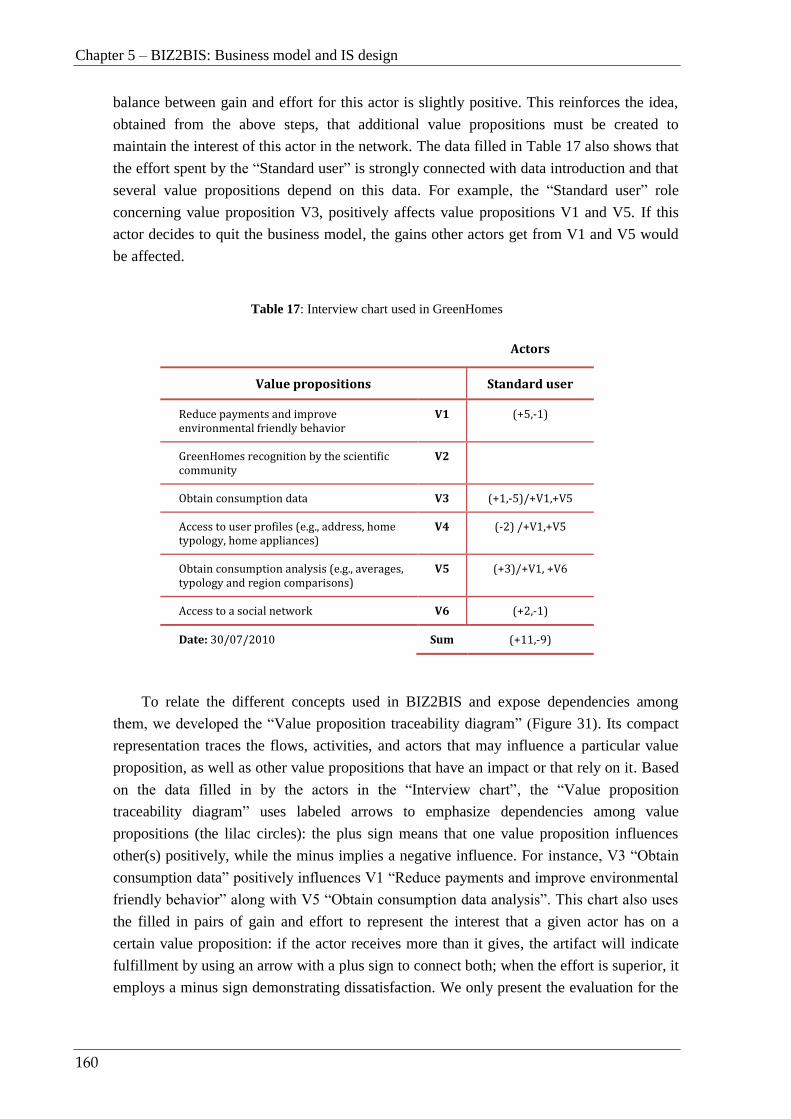
Chapter 5 – BIZ2BIS: Business model and IS design
160
balance between gain and effort for this actor is slightly positive. This reinforces the idea,
obtained from the above steps, that additional value propositions must be created to
maintain the interest of this actor in the network. The data filled in Table 17 also shows that
the effort spent by the “Standard user” is strongly connected with data introduction and that
several value propositions depend on this data. For example, the “Standard user” role
concerning value proposition V3, positively affects value propositions V1 and V5. If this
actor decides to quit the business model, the gains other actors get from V1 and V5 would
be affected.
Table 17: Interview chart used in GreenHomes
Actors
Value propositions Standard user
Reduce payments and improve environmental friendly behavior
V1 (+5,-1)
GreenHomes recognition by the scientific community
V2
Obtain consumption data V3 (+1,-5)/+V1,+V5
Access to user profiles (e.g., address, home typology, home appliances)
V4 (-2) /+V1,+V5
Obtain consumption analysis (e.g., averages, typology and region comparisons)
V5 (+3)/+V1, +V6
Access to a social network V6 (+2,-1)
Date: 30/07/2010 Sum (+11,-9)
To relate the different concepts used in BIZ2BIS and expose dependencies among
them, we developed the “Value proposition traceability diagram” (Figure 31). Its compact
representation traces the flows, activities, and actors that may influence a particular value
proposition, as well as other value propositions that have an impact or that rely on it. Based
on the data filled in by the actors in the “Interview chart”, the “Value proposition
traceability diagram” uses labeled arrows to emphasize dependencies among value
propositions (the lilac circles): the plus sign means that one value proposition influences
other(s) positively, while the minus implies a negative influence. For instance, V3 “Obtain
consumption data” positively influences V1 “Reduce payments and improve environmental
friendly behavior” along with V5 “Obtain consumption data analysis”. This chart also uses
the filled in pairs of gain and effort to represent the interest that a given actor has on a
certain value proposition: if the actor receives more than it gives, the artifact will indicate
fulfillment by using an arrow with a plus sign to connect both; when the effort is superior, it
employs a minus sign demonstrating dissatisfaction. We only present the evaluation for the
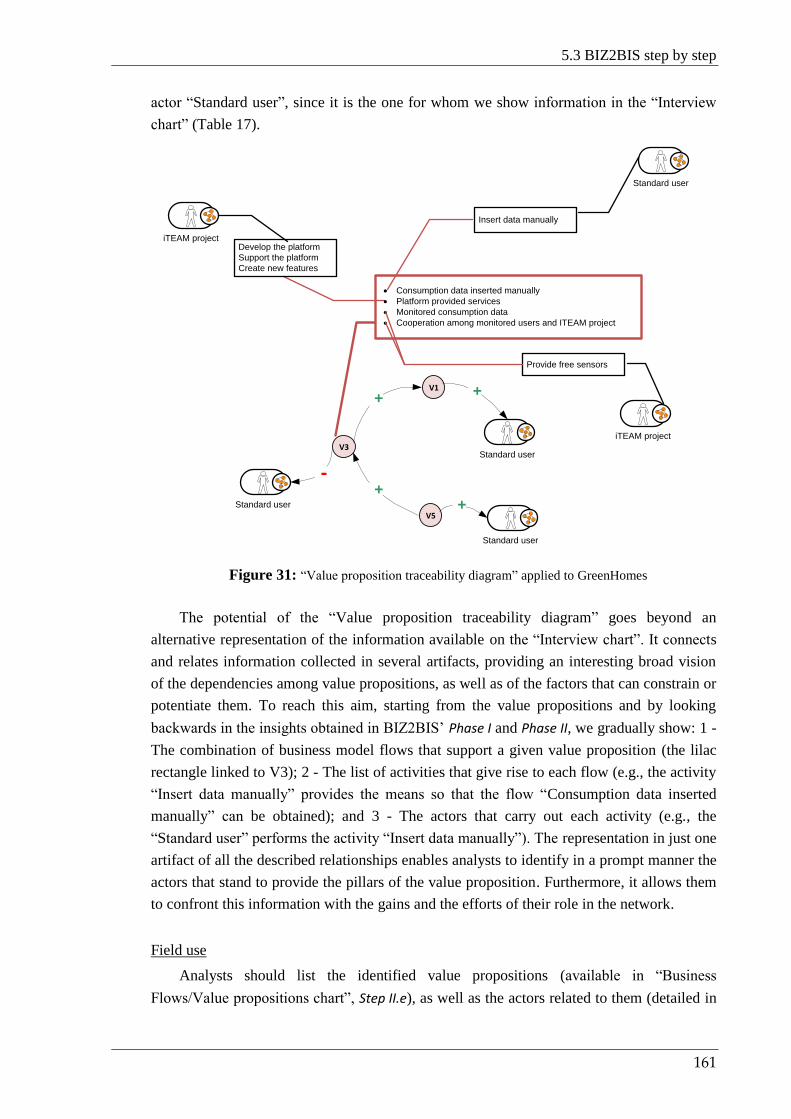
5.3 BIZ2BIS step by step
161
actor “Standard user”, since it is the one for whom we show information in the “Interview
chart” (Table 17).
-
Standard user
Develop the platform
Support the platform
Create new features
iTEAM project
V1
V5
+
V3
+
Standard user
+
+ Standard user
Consumption data inserted manually
Platform provided services
Monitored consumption data
Cooperation among monitored users and ITEAM project
Insert data manually
Standard user
Provide free sensors
iTEAM project
Figure 31: “Value proposition traceability diagram” applied to GreenHomes
The potential of the “Value proposition traceability diagram” goes beyond an
alternative representation of the information available on the “Interview chart”. It connects
and relates information collected in several artifacts, providing an interesting broad vision
of the dependencies among value propositions, as well as of the factors that can constrain or
potentiate them. To reach this aim, starting from the value propositions and by looking
backwards in the insights obtained in BIZ2BIS’ Phase I and Phase II, we gradually show: 1 -
The combination of business model flows that support a given value proposition (the lilac
rectangle linked to V3); 2 - The list of activities that give rise to each flow (e.g., the activity
“Insert data manually” provides the means so that the flow “Consumption data inserted
manually” can be obtained); and 3 - The actors that carry out each activity (e.g., the
“Standard user” performs the activity “Insert data manually”). The representation in just one
artifact of all the described relationships enables analysts to identify in a prompt manner the
actors that stand to provide the pillars of the value proposition. Furthermore, it allows them
to confront this information with the gains and the efforts of their role in the network.
Field use
Analysts should list the identified value propositions (available in “Business
Flows/Value propositions chart”, Step II.e), as well as the actors related to them (detailed in
Chapter 5 – BIZ2BIS: Business model and IS design
162
the “Actor description charts”, Step I.b) in the “Interview chart”. Next, analysts should ask
the actors to fill in the resulting “Interview chart” and explain how they should indicate for
each value proposition the gain obtained with it, the effort to support it, and its
dependencies with other value propositions. Analysts should be available to clarify any
question that may arise. To complement the gathered data, they should also check if the
identified value propositions are in accordance with the view of the actors for the business
model, obtain their opinion about the ones that affect their goals, and verify if any are at
fault. To be able to obtain this less obvious or more delicate information, we recommend
that analysts obtain the responses of the actors in person. Taking into account that most of
them are unavailable to perform assessments regularly and can lose confidence in BIZ2BIS
if they are obliged to perform several evaluations, analysts should carefully manage these
requests.
The “Interview chart” provides clues about potential problems. To detect them, we
suggest three procedures:
1. Verify, for each actor, if the balance between the gains and the efforts is positive.
Actors having negative results are potential candidates in abandoning the
networked business model.
2. Use the information provided by the “Interview chart” to recheck if the value
propositions that each actor addresses are in line with the goals they expressed in
Phase I. The results can confirm, or contradict, the positive indications already
obtained in Step II.e “Stabilization of value propositions”. Not considering vital aims
of the actors can put the network at risk.
3. Ensure that problematic dependencies between value propositions have viable
alternatives. To achieve this, analysts should assess extreme hypothetical events
(e.g., the abandonment of key actors, the existence of irreplaceable value
propositions, or the restrict access to indispensable resources). They should use the
obtained insights in their attempts to foresee possible consequences and avoid
future anti-programs.
To facilitate the application of the three procedures above, analysts can use alternative
representations of the data obtained in the “Interview chart”. For instance, they can use
graphics to improve the readability of the gathered information and support their analysis.
Analysts can show, for example: 1 - The gain obtained and the effort spent in all value
propositions for each actor; 2 - The actors involved in each value proposition; 3 - Actors
with higher/lower gains and efforts; and 4 - Value propositions that require more exertion
from the actors. Analysts can also use the compact visualization of dependencies depicted
in the “Value proposition traceability diagram” (Figure 31) to detect critical value
propositions for the business model. They can visualize factors that can constrain or
potentiate them, such as business flows, activities that gave rise to the flows, and the actors
that performed them. The described relationships help analysts to disclose vital actors for

5.3 BIZ2BIS step by step
163
the business model and confront these insights with the reached gain and the performed
exertion.
When applying the three procedures, analysts should give special attention to actors
with major influence in the network, like those who invest considerable time and money,
those that hold key resources or capabilities, those with a high degree of influence, those
that connect sub-domains (e.g., an actor who works in two distinct networks), or those that
cannot be replaced. It is essential to assure that their demands are satisfied, or that viable
alternatives are discovered.
In cases where it is not easy to perceive the relevance of an actor for the network, we
advise analysts to resort to two concepts borrowed from Social Network Analysis (SNA):
centrality and prestige. SNA uses them to determine the prominence or importance of the
actors in a social network. From the indices available for measuring centrality and prestige,
we chose the degree of a node for its potential to disclose if an actor maintains numerous
contacts with other network actors or if an actor enjoys high popularity. Furthermore, it can
be easily applied, even for users with no mathematical skills. For directional relationships
the degree centrality focuses on the actors as senders, while the degree prestige as recipients
(Wasserman and Faust, 2008):
Degree centrality – covers the actors’ out-degree (number of interactions with origin
in the actors). The actors with higher out-degree are often said to be powerful or
influential in the network, since they are able to interact with many others and
transmit their own perspectives. They have greater opportunities because they have
alternatives and they can place less reliance on specific actors. The limitation of this
concept is that it only takes into account the immediate ties than an actor has, rather
than indirect ones.
Degree prestige – covers the actors’ in-degree (the number of interactions
terminating at the actor). The idea is that actors who are prestigious tend to receive
many nominations or choices.
The two concepts above must be checked, in particular, for actors that are not pleased
with the return that they get. In these cases, it is critical to understand their impact on the
networked business model to perceive if they can compromise it.
Theoretical background
The concept of translation, particularly enrolment, showed us the importance of
understanding the commitment of the actors towards the designed business model. If they
do not accept the roles defined for them, their enrolment is compromised. In the attempt to
understand how to avoid a network collapse, we perceived it was fundamental to get the
actors feedback and understand if their expectations were being met. Therefore, we decided
to encourage their collaboration and involve them in the business model appraisal. We
handed over the “Interview chart” with the list of value propositions to the actors who were

Chapter 5 – BIZ2BIS: Business model and IS design
164
interested parties so that they could perform their own evaluation and avoid the bias of
researchers.
The need to assess the business model gave rise to the development of the “Interview
chart”. This artifact intersects all the participating actors with the available value
propositions and enables the former to evaluate the latter in terms of gain and effort. The
range of the answers was inspired by the Likert scale (Likert, 1932), since its characteristics
contribute in capturing the actors’ interests in the business model.
Likert scale “provides a range of responses to a given question or statement” (Cohen et
al., 2011, p. 386). It is built in a degree of sensitivity and differentiation of response that
renders it a very attractive and widely used instrument (Cohen et al., 2011). Due to its
ability for tapping attitudes, perceptions, and opinions, we used it in BIZ2BIS to capture the
perception of the actors towards the conceived business model. However, when using the
Likert scale problems may arise. For instance, interpretation issues, since numbers in a scale
have different meanings for different respondents (one person “4” may be another’s “5”).
Its use also makes it impossible to know if the respondents wish to add any other comments
about the issue under investigation. When evaluating the business model in BIZ2BIS, the
latter two problems are minimized. Even if what holds true for an actor differs from others,
it is critical for our proposal to get the actors own viewpoints, since false consensus can
compromise the assessment and put the business model at risk. BIZ2BIS highly values
individual perceptions. Therefore, when detailing the benefits of the participation for an
actor, it does not use values assigned by other actors. In addition, its negotiation mechanism
encourages the actors to express their opinion and promotes the iterative refinement
according to their expectations. Although studies are not conclusive on the best scale to use,
we decided to use a three-point scale in one of our cases to fill in the “Interview chart” in an
initial stage of our research to facilitate choices and decisions. However, even for us
(external entities have a lower perception of the business model context) this scale seemed
extremely reductive. Thus, we started to use a five-point scale where the anchors range
from 1 (“strongly disagree”) up to 5 (“strongly agree”) and tested it in other cases. The scale
lived up to the expectations and there were no negative reactions. A five-point is widely
used, people easily recognize and apply it, and there are actually many studies in business
model research that rely on it, for instance (Aziz et al., 2008, Laumer et al., 2008).
Therefore, we decided to adopt it. Since we do not have a real mid-point (a category that
will allow actors not to adopt a stance), we opted in using an odd number scaling in our
research. The scale does not have a negative and a positive pole; it proposes an evaluation
that goes from very little to very great.
In usual circumstances, actors will not abandon the network if their gain for
participating is superior to their effort. On the contrary, a negative balance can encourage
actors to abandon the network, which in some cases lead to its collapse. To prevent
undesirable departures, analysts must iteratively search for alternative business model
scenarios. We consider that a stable business model is reached if the balance between the
gain and the effort of the actors is positive, according to their own evaluation parameters. In

5.3 BIZ2BIS step by step
165
a proposal in which all the actors achieve a positive balance and agree with the proposed
suggestions, analysts have reached a solution that offers good indications on the stability of
the networked business model.
We note that some actors can gain more than others with their participation in the
business model. However, this notion of gain is particularly tricky as it is very subjective.
Usually, in the business model domain, the revenue model is closely related to the obtained
gains and its results have direct implications on the business model viability. In BIZ2BIS,
our assessment goes beyond financial issues. We consider several types of flows (e.g.,
material and services, financial, information, and intangible), as well as their context.
However, when evaluating a business model, something that can be extremely valuable to
an actor, may not appeal to another. For instance, the discovery of a vaccine for malaria is
more cherished in regions of the globe that have to fight this disease. Moreover, the
financial value assigned to a product or service is very volatile (what was established when
conceiving the business model may not be valid a month later). The influence of intangible
flows (e.g., prestige and brand loyalty) on business model is also difficult to quantify
financially. Therefore, we focused BIZ2BIS’ evaluation on each actor and on their
individual perceptions. In such an assessment, we considered crucial to establish the goals
that each actor believes to be essential to participate in the business model and assure their
satisfaction.
In our first attempts to evaluate business models, we started by exploring other
alternatives that could help us detect if we had reached a stable solution. At the time, we did
not focus on the actor, but on the network. Our aim was to apply techniques already
established in other fields in order to analyze network configurations. We intended to use
the information obtained in the previous phases of BIZ2BIS (in particular, actors’ gain and
effort, and their interactions) as input data for those techniques. With this purpose, we
explored how we could use the potential of Game Theory (Myerson, 1997) and SNA
(Wasserman and Faust, 2008) in BIZ2BIS.
Game Theory aims to mathematically model conflict and cooperation between
intelligent and rational decision-makers (Myerson, 1997, Osborne, 2003) that encompass a
set of strategies available to those players (Kelly, 2003). It “provides general mathematical
techniques for analyzing situations in which two or more individuals make decisions that
will influence one another’s welfare” (Myerson, 1997, p. 1). Taken into account Game
Theory scope, we hoped to find some clues that could help us understand if we were in the
presence of stable networks, in which its actors were aligned around the carried out
decisions. Game theorists study quantitative models and hypothetical examples, posing
questions in the context of a simplified model. For any rational decision-maker, researchers
search for some way of assigning utility numbers to different outcomes that they care about,
aiming at maximizing decision-makers’ pay-off. For many decision-makers the expected
utility may be a nonlinear function (Kelly, 2003). Considering that all games are subjected
to some simplifying assumption before they can be modeled – if the theorists use wrong
assumptions, they will create perfect solutions to the wrong problems (Harford, 2006).

Chapter 5 – BIZ2BIS: Business model and IS design
166
When evaluating networked business models this fact gains an extra importance due to the
inherent complexity of their contexts. It is tremendously difficulty to model people’s
interests, indecisions, and fears in an accurate manner, as well as to take into account the
potential choices and pay-offs of others in these scenarios. In addition, Game Theory
considers that players act rationally, in their self-interest, understand the impact of their
actions on others, and consider the reactions of others. In fact, irrational choices can be
made and many players have difficulties in perceiving their scenarios let alone those of
others. The uncertainty involving networked business models, the difficult in representing
realistically the intricacies of their social interactions, and BIZ2BIS’aim in sharing a
common language between analysts and practitioners led us to abandon this research
direction. In alternative, we drew our attention to SNA studies.
SNA and our approach share common features: it addresses actors and their actions,
takes into account relational ties between them (either tangible or not), and views the
network structural environment as providing opportunities for, or constraints on, individual
actions (Wasserman and Faust, 2008). Its concepts of centrality and prestige can be a useful
contribution to identify actors with privileged positions in the network. Furthermore, it
provides the concept of structural balance, which considers balance for graphs and directed
graphs separately. However, to apply it, the network ties must possess a sign or a valence
(expressing either positive and negative attitudes or sentiments). This implies that
relationships, such as “collaborates with” and “interacts with”, which are not signed and
thus have no obvious dual, cannot be studied (Ibid., p. 223). This is a serious limitation
since those interactions are frequent in business model scenarios and can be quite stable in
certain institutional, economical, environmental, and political constraints (e.g., scientific
research groups). Even in signed relations, it is complex to calculate stability indicators of
networked business models by using the SNA concept of structural balance.
Mathematical models are a simplification of an extremely complex reality and of
difficult application to business model scenarios. While Game Theory and SNA ensure that
a result follows logically from a model, they cannot assure that the result itself represents
reality. Furthermore, in BIZ2BIS, all the information obtained on the network and its
relationships is based on the common sense and experience of each actor (whose perception
might change according to their interests and knowledge), compromising the validity of
formal methods based on their data. Therefore, we decided to abandon the idea of using
mathematical models already established in other fields and decided to focus our attention
on capturing the perspective of each actor. For this to happen, it was fundamental to share a
common language with practitioners to understand their viewpoints - it will be them that
will influence and establish patterns of behavior in the network. Therefore, we created an
easy to use artifact (the “Interview chart”) to support the evaluation of the available
proposals and the analysis of its insights. This artifact promotes discussion among analysts
and practitioners, gathers the information already obtained in the previous phases of
BIZ2BIS, encourages the identification of problems, and supports their resolution.
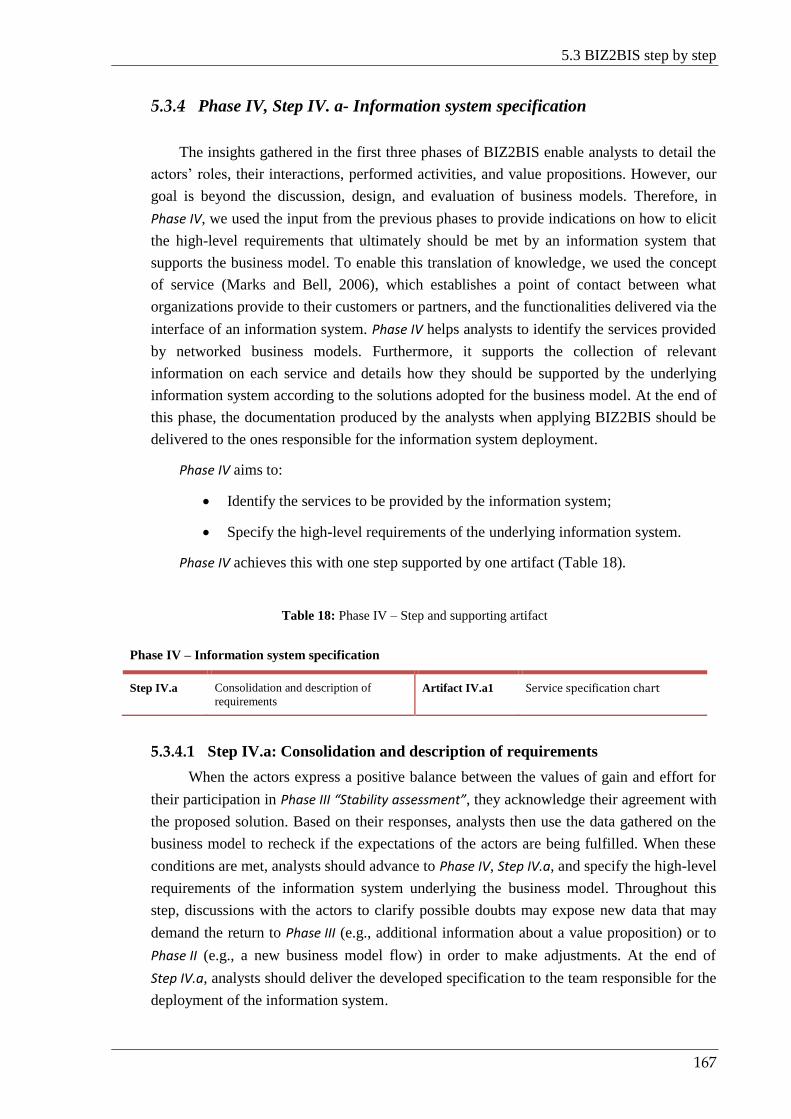
5.3 BIZ2BIS step by step
167
5.3.4 Phase IV, Step IV. a- Information system specification
The insights gathered in the first three phases of BIZ2BIS enable analysts to detail the
actors’ roles, their interactions, performed activities, and value propositions. However, our
goal is beyond the discussion, design, and evaluation of business models. Therefore, in
Phase IV, we used the input from the previous phases to provide indications on how to elicit
the high-level requirements that ultimately should be met by an information system that
supports the business model. To enable this translation of knowledge, we used the concept
of service (Marks and Bell, 2006), which establishes a point of contact between what
organizations provide to their customers or partners, and the functionalities delivered via the
interface of an information system. Phase IV helps analysts to identify the services provided
by networked business models. Furthermore, it supports the collection of relevant
information on each service and details how they should be supported by the underlying
information system according to the solutions adopted for the business model. At the end of
this phase, the documentation produced by the analysts when applying BIZ2BIS should be
delivered to the ones responsible for the information system deployment.
Phase IV aims to:
Identify the services to be provided by the information system;
Specify the high-level requirements of the underlying information system.
Phase IV achieves this with one step supported by one artifact (Table 18).
Table 18: Phase IV – Step and supporting artifact
Phase IV – Information system specification
Step IV.a Consolidation and description of
requirements Artifact IV.a1 Service specification chart
5.3.4.1 Step IV.a: Consolidation and description of requirements
When the actors express a positive balance between the values of gain and effort for
their participation in Phase III “Stability assessment”, they acknowledge their agreement with
the proposed solution. Based on their responses, analysts then use the data gathered on the
business model to recheck if the expectations of the actors are being fulfilled. When these
conditions are met, analysts should advance to Phase IV, Step IV.a, and specify the high-level
requirements of the information system underlying the business model. Throughout this
step, discussions with the actors to clarify possible doubts may expose new data that may
demand the return to Phase III (e.g., additional information about a value proposition) or to
Phase II (e.g., a new business model flow) in order to make adjustments. At the end of
Step IV.a, analysts should deliver the developed specification to the team responsible for the
deployment of the information system.

Chapter 5 – BIZ2BIS: Business model and IS design
168
Purpose
Step IV.a guides analysts in the specification of the high-level requirements of the
information system that supports the business model. It establishes a bridge between the
latter two by using the data obtained in the first three phases of BIZ2BIS to identify and
detail the services to be provided by the information system.
Description and illustration of the artifacts
Analysts use the “Service specification chart” to detail the services to be provided by
the supporting information system. Each artifact consists of a set of fields that should be
filled in for each service based on the information obtained in Phase I, Phase II, and Phase III.
Below, we present the fields used to catalog each identified service:
Name/identifier: presents the service name and its identification number;
Version: identifies the service version, its data, and author;
Goal: succinctly describes the aim of the service;
Description: describes the activities performed when using the service;
Actor that provides the service: identifies the actor(s) that provide(s) the service;
Actor that uses the service: identifies the actor(s) that use(s) the service;
Input data and their source: depicts input information flows, as well as their
source;
Output data and their target: describes output information flows and their target;
Service dependencies: identifies supporting services;
Access control mechanisms: describes the service permissions and access rights;
Business flows leading to the service: identifies the business flow(s) that
contributed to the service detection;
Reasons for its existence: explains the motives behind the service creation;
Service restrictions: presents the rules employed by the service in its activities;
Information system support: describes how the service is supported by the
information system;
Remarks: provides additional comments about the service.
Table 19 exemplifies the “Service specification chart” for the service “User
authentication” that enables GreenHomes’ users to access the platform applications by
providing their credentials (such as login and password). The information gathered in
Phase I, Phase II, and Phase III on the service is summarized in the artifact. Analysts and
development teams (or deployment) can easily perceive the actors that interact with the
service, how they do it, the reasons for the service existence, the involved business flows,

5.3 BIZ2BIS step by step
169
the activities related to the service, rules that govern its operation, and how the information
system should made it available.
Table 19: Service specification chart applied to GreenHomes
GreenHomes Service specification
Name/identifier User authentication Id: 1
Version Number V0.2, date: 30th of July, 2010, author: Cristina Costa
Goal Provide access to GreenHomes applications
Description The user, after signing in, can access the platform applications through this service according to his/her profile
Actor that provides the service
GreenHomes information system
Actor that uses the service Standard user, Monitored user, iTEAM project, and the Portuguese environmental organization
Input data and their source
Login
Password
The Information is inserted by the users
Output data and its target No output data
Service dependencies User registration
Access control mechanisms
Non existent
Business flows leading to the service
Profile data
Consumption data
Platform environmental features
Reasons for its existence Assure that only registered users have access to the platform and provide information (according to the users’ profile)
Service restrictions Monitored users must have a protocol with the iTEAM project
It is mandatory to fill in all the required fields
Information system support
The information system must have a password encryption mechanism
When a user signs in, his/her profile is checked to identify the functionalities assigned to that user
Remarks No remarks
Field use
Analysts should start by identifying the services to be supported by the information
system. To this end, they should consider the ones that must be provided to make the value
propositions acknowledged by the available actors (in Phase II, Step II.e, “Business flows/
Value propositions chart”). We note that each value proposition can give rise to one service,
or influence more than one, depending on its complexity. Conversely, several value
propositions can also be at the origin of just one service. The partition or joining of value
propositions into services must be assessed for each case, based on the dependencies

Chapter 5 – BIZ2BIS: Business model and IS design
170
detected among value propositions, the context of the business model, and the needs of its
actors. To obtain this information, analysts should trace back the factors that conducted the
business model towards the acknowledged value propositions in BIZ2BIS (Phase I, Phase II,
and Phase III) and use the obtained data to detail the identified services.
Analysts should use one “Service specification chart” to detail each service. After
filling in the data that identifies it (“Name/identifier” and “Version”), they should start to
specify the service’s “Goal”, “Description”, “Service dependencies”, and “Business flows
leading to the service” based on the established value propositions (Phase II, Step II.e,
,“Business flows/Value propositions chart”). When filling these fields, they must also
consider the flows that support the value propositions (intersections in “Business
flows/Value propositions chart”), in particular, the information and service flows supported
by technologies. The former type offers clues about the data used in the interaction among
the actors and the information system services that must be available, while the latter supply
indications about the accessed services and upon who uses them. The insights obtained on
business flows (Phase I, Step I.b, “Actor description chart”) also help analysts detail the
fields: “Actor that provides the service”, “Actor that uses the service”, “Input data and their
source”, and “Output data and its target”. To better understand the business flows and their
implications on the service, analysts should also take into account the activities performed
by the actors that support and use it (detailed in each actors “Actor description chart”).
Analysts should also include the topics disclosed about the network (available in Phase I,
Step I.a, “Networked business model description chart”) in the specification of the service,
since they clarify rules that govern the service use (e.g., the fields “Mutual obligations and
expectations”, “Shared interpretations and representations”, and “Existing rules”). Figure 32
illustrates the phases, steps, and artifacts that support the filling in of the fields (the green
vertical straight line represents the scope of each influence). All the information obtained on
each service provides analysts with the necessary background to indicate in the field
“Information system support” how the service should be made available. After specifying
all the services, analysts should deliver the documentation that resulted from the use of
BIZ2BIS to the development (or deployment) team.

5.3 BIZ2BIS step by step
171
Scenario under study Service specification
Name/identifier User authentication Id: 1
Version Number V0.2, date: 30th of July, 2010, author: Cristina Costa
Goal Provide access to GreenHomes applications
Description The user, after signing in, can access the platform applications through this service according to his/her profile
Actor that provides the service
GreenHomes information system
Actor that uses the service Standard user, Monitored user, iTEAM project, and the Portuguese environmental organization
Input data and their source
Login, Password
The Information is inserted by the users
Output data and its target No output data
Service dependencies User registration
Access control mechanisms
Non existent
Business flows leading to the service
Profile data
Consumption data
Platform environmental features
Reasons for its existence Assure that only registered users have access to the platform and provide information (according to the users’ profile)
Service restrictions Monitored users must have a protocol with the iTEAM project
It is mandatory to fill in all the required fields
Information system support
The information system must have a password encryption mechanism
When a user signs in, his/her profile is checked to identify the functionalities assigned to that user
Remarks No remarks
Figure 32: Contributions from Phase I, Phase II, and Phase I to the “Service specification chart”
Theoretical background
Information systems projects often fail (Carbone, 2004). For instance, according to
regular reports between the mid-1990s and the mid 2000s, around two thirds of large
projects in the United States failed to meet budget and schedule goals, or lacked critical
requirements (Graham, 2008). These failures can be caused by poor project management
and technical factors, but also by social and organizational issues (Doherty and King, 1998,
Schmidt et al., 2001). Like others (Mumford, 1983, Holmström and Robey, 2005), we
believe that information systems development is a socio-technical process. Under this
perspective, no project is purely technical or purely social. For this reason, information
systems should not be regarded solely as technical artifacts composed of hardware and
software, but as social systems enabled by technology (Lewis and Townson, 2004).
Phase I, Step I.b, “Actor description chart” Phase I, Step I.c, “Flow diagram” Phase I, Step I.c, “Flow matrix”
Phase I, Step I.a, “Networked business model description chart” Phase I, Step I.b, “Actor description chart
Phase I, Step I.a, “Networked business model description chart”
Phase II, Step II.e, “Business flows/ Value propositions chart” Phase I, Step I.c, “Flow diagram” Phase I, Step I.c, “Flow matrix”
Phase II, Step II.e, “Business flows/ Value propositions chart”
Phase III, Step I.a, “Value proposition traceability diagram”

Chapter 5 – BIZ2BIS: Business model and IS design
172
Several researchers have sustained that information systems, and technology in
general, are not independent from the network where they are applied. For example,
Walsham and Sahay (1999) studied the development and the use of a geographical
information system to improve land management in selected districts in India. Their study
shows that when the technology was transferred to India, the implicit western cultural
assumptions inscribed in the adopted solution (maps, spatially related data, or overlays)
became problematic. An alignment among the Western developers and the locals was never
reached and five years after the start of the project, none of the systems were in real
working use at district level. Social and technical stability resides in the mutual dependency
between technological features and the social context (Holmström and Robey, 2005). This
fact is particularly critical and assumes an extra relevance in the complex interconnected
worlds where networked business models operate. To answer this challenge in BIZ2BIS, we
used ANT’s guidelines to address the role of non-human actors, such as information
systems, and look at their interactions in the networked business model. ANT inspired us to
integrate topics that allow us to complement the requirements of the business model with
the specificities of its context and technical considerations. Together, these perspectives
create a valuable source of knowledge that supports the specification of the high-level
requirements of the information system underlying the business model.
We noticed that BIZ2BIS and the Zachman Framework (Zachman, 1987) share
common viewpoints. This framework consists of a two dimensional classification matrix. It
has six primitive interrogatives as columns: “Data (what)”, “Function (how)”, “Location
(where)”, “Time (when)”, “Stakeholder (who)”, and “Motivation (why)” and an enterprise’s
views as rows. Its first three rows, respectively “Scope (contextual)/planner’s view”,
“Enterprise model (conceptual)/owner’s view”, and “System model (logical)/designer’s
view” when intersected with the columns cover aspects such as business goals, high-level
data, stakeholders’ interactions, policies, standards, roles, responsibilities, performed
activities, or information needs. These topics provide a view of an enterprise that possesses
many aspects in common with our characterization of the business model. The following
two rows (“Technology model/ builder’s view” and “Detailed
representations/subcontractor’s view”) of Zachman Framework describe how the needs
identified can be implemented. This connection strengths BIZ2BIS’ potential to bridge the
gap between business models and their supporting information systems, while specifying
the high-level requirements of the latter.
We resorted to the concept of service to translate the insights obtained in the first
three phases of BIZ2BIS into high-level requirements that ultimately should be met by the
underlying information system (Marks and Bell, 2006). A service is defined as a unit of
functionality that represents available value propositions in a particular environment
(Lankhorst, 2005). The concept is the result of a separation between its “external” and
“internal” behavior: externally, it should be self-contained and have a clear purpose, while
internally it addresses details of its execution. This latter information is irrelevant for the
service consumers (Lankhorst, 2005). Using this concept in BIZ2BIS offered us a decisive
5.4 Conclusions
173
flexibility in business and information technology design and a common language for the
professionals of these areas (Lankhorst, 2005). It enabled us to establish a bridge between
the value propositions of the business model and the internal business processes
implemented by the actors, as well as their underlying information system. The result is a
network of connected services – a blueprint of how a network of organizations creates and
delivers value.
5.4 Conclusions
We described how BIZ2BIS enables the discussion, design, and evaluation of networked
business models, as well as the identification of the high-level requirements of their supporting
information systems. We detailed the four phases of our approach by addressing their purpose,
supporting artifacts, field use, and theoretical background. The first phase identifies and
characterizes the network’s actors, as well as the structural aspects that influence their behavior.
The second suggests eventual adjustments to ensure the alignment of the actors’ interests through
an iterative negotiation. The third evaluates the business model viability. Finally, the fourth
specifies the high-level requirements of the underlying information system. To conceive
BIZ2BIS, we reviewed the literature on business models, which enabled us to disclose topics to
address in their study. Furthermore, it underlined the importance of taking into account their
socio-technical nature. To consider this perspective, we grounded our approach on the tenets of
Actor-Network Theory (ANT), Structuration Theory, and Social Capital. However, BIZ2BIS’
users do not need to be familiar with their concepts, which are embedded in its phases.
BIZ2BIS guides the search towards stable networked business models. It gathers data on the
network, its context, and its actors to clarify and expose their different opinions, preferences, and
instincts. By providing a common language between analysts and practitioners, the approach
encourages the collaboration of the latter and promotes communication and discussion among all
the involved. It contributes by transforming the debate from a battle of wills, into a thorough
analysis that takes into account their perceptions, alternative solutions, and puts the network
stability above individual interests. Its insights support the actors with the power to make
decisions to carry out adjustments, which is particularly advantageous when threats to the
business model are identified. Moreover, BIZ2BIS overcomes the gap between business models
and the development of their information systems. It uses the business model analysis outcome to
systematically specify the high-level requirements of their underlying information system in a
business model driven way.
In the following chapter, we will present the roadmap to the BIZ2BIS proposal, by
discussing the contributions it received from the three case studies: HowMuchIsIt, Online Journal,
and GreenHomes, as well as from the InovWine action research project.

175
Chapter 6
The roadmap to the BIZ2BIS proposal
6.1 Introduction
In the previous chapter, we presented the final version of BIZ2BIS from the perspective of
the user. Its foundations stem from a thorough literature review (detailed in Chapter 2 and Chapter
3), which allowed us to develop an initial draft that has been incrementally improved during our
research. In this chapter, we will discuss how the proposal evolved, namely the contributions it
received from the three case studies (HowMuchIsIt, Online Journal, and GreenHomes) and from
an action research project (InovWine). The first case study enclosed a portal-supported mediation
business for the acquisition of technological equipment. It enabled retailers to advertise their
products online, and acted as a shop-window for customers (whether individuals or companies).
The second addressed the development of an online portal for a Portuguese Scientific Association
that decided to publish its journal online. In addition, it also involved the scrutiny of a suitable
business model for the submission of articles, reviews, and their publication. The third dealt with
the development of a platform to collect data about users’ electricity consumption per household,
every week. In return, the platform would monitor the obtained data and provide advice on how to
enhance the ecological footprint of its users, as well as tips to reduce their electrical bill. These
case studies enabled us to test and improve BIZ2BIS. They allowed us to detect and weed out any
glaring omissions or misfits, before moving on to an action research project where the approach
would be used to intervene and drive decisions affecting multiple stakeholders. This was
InovWine, which aims to use technology to increase the overall competitiveness of the wine
sector through the development of new products and services in the Portuguese region of
Bairrada. The density of its social context, the entanglement of its interactions, and the distinct
interests involved, allowed us to scrutinize the ability of BIZ2BIS to address networked business
models. We had the chance to work in close collaboration with practitioners, intervene to solve a
complex problem, contribute with indications to achieve a more suitable business model, and
specify the high-level requirements of its underlying information system. In fact, InovWine was
our main source of inputs. It contributed to consolidate BIZ2BIS and its valuable insights molded
the final version of the approach.
The remainder of the chapter is organized as follows: in section 6.2, we detail what we
learned from each case study to improve BIZ2BIS. Then, in section 6.3, we discuss the
Chapter 6 – The roadmap to the BIZ2BIS proposal
176
contribution of an action research project to our approach. Next, in section 6.4, we present a
retrospective look towards BIZ2BIS evolution. The last section draws conclusions from the study.
At the end of the chapter, the reader should be able to:
1. Understand how three case studies and an action research project contributed to the
evolution of BIZ2BIS.
6.2 Contribution of three case studies to BIZ2BIS
The three case studies introduced in Chapter 4 enabled us to extract some insights to refine
BIZ2BIS. In this section, we start by presenting each case context. After that, we justify the
reasons for their study, their potential limitations, and describe how we applied the approach to
each of them. We also underline the obtained outcomes according to two perspectives: topics of
interests to the participating actors and issues to consider in the improvement of the approach. Our
summary lets us present a snapshot of BIZ2BIS prior to its application to the InovWine project
and provides the reader with a trace of how the approach evolved. The detail and thoroughness of
the description may be sacrificed (to some extent) to discuss the obtained achievements, compare
and contrast the case studies, and thereby look for emergent topics to refine.
6.2.1 Case one: HowMuchIsIt
A company with its head-office in Portugal developed HowMuchIsIt, a portal-supported
mediation business for the acquisition of technological equipment. It allowed retailers to advertise
their products online, and acted as a shop-window for customers (individuals or companies) to
search and compare products, their specifications, prices, stocks, and delivery times across
vendors. Since the prices presented at the portal were mere estimates, the clients could, if
interested, request a precise quote from the retailers that they considered more appealing. The
portal mediated this procedure, because it kept the identities of the buyer and seller concealed
from each other.
Clients placing orders over 2500 euros were offered free technical consulting in the
selection of products and preparation of their request for proposals. These were sent to the
retailers selected by the customers, who then entered a reverse auction. Each bidder had no
knowledge of their competitors’ conditions. To ensure that the clients did not influence the
retailers through external negotiations, the company that developed the portal would only reveal
the supplier’s identity of the winning proposal after the selection. To complete the transaction the
client had to contact the chosen vendor to close the deal.
When the company started the business, no fees were charged to retailers advertising their
products in the portal. The goal was to get enough content so that customers could discover the
advantages of using it as a mediator in their purchases. Nevertheless, the aim was to charge the
vendors at a later stage. The company board believed that the competitive advantages provided by

6.2 Contribution of three case studies to BIZ2BIS
177
their portal justified the payment of annuities: retailers, who could not afford a standalone e-
business platform, obtained the chance to compete in a global market; the ones which already had
a web site, would benefit from an extra vehicle to promote their products, analyze their direct
competitors, and increase their sales. However, since retailers’ margins in the electronics market
were (and are) usually low, the fees could significantly erode their profits, reducing the
attractiveness of the portal. To counter this threat, the company that created and promoted
HowMuchIsIt negotiated agreements with two major wholesalers, who offered special conditions
to the retailers doing business through the portal.
6.2.1.1 Reasons for the study
In spite of a promising start, the portal began to experience difficulties in attracting the
required number of retailers to ensure the viability of the business model. In view of this scenario,
the company that idealized and developed the portal thought it would be interesting to analyze the
HowMuchIsIt’s business model. It aimed at obtaining guidelines that could help its managers to
face the challenges that had been arising and to support future decisions. The chance to study a
business network supported by an already developed technological platform and the interest of
one of its actors (with the necessary influence to facilitate the access to key information), made it
a suitable case to apply our approach. In this phase, BIZ2BIS was still in an embryonic state and
had been mainly influenced by the gathered theoretical background. A real case was a useful and
necessary opportunity for exploring its suitability to analyze HowMuchIsIt’s networked business
model and to provide insights about its viability.
6.2.1.2 Potential limitations
During our study, the company that developed the portal decided to suspend its activity (one
year and two months after its creation). Although the company had initially agreed to collaborate,
a later meeting was never appointed. Given that, we were not able to explore the networked
business model’s social component or interview most of the relevant participating actors. These
restrictions prevented us from comprehending the details about the protocol established with the
wholesalers and from obtaining feedback on our assessment and proposals.
6.2.1.3 Description
We started by having a first meeting with a board member of the business incubator where
the company that developed the portal was located (18th September 2006). At this meeting, this
actor, who acted as a bridge between our research team and the company, transmitted us his
interest in analyzing HowMuchIsIt’s business model. Taking the conveyed information as a
starting point, we gathered additional sources to complement it: press articles (the company and
its portal had been extremely advertised), internal documents (regarding the platform
specification), and the platform itself.
Using the information obtained through the literature review (Chapter 2 and Chapter 3), we
created a first draft of our approach that included the following steps:
Chapter 6 – The roadmap to the BIZ2BIS proposal
178
1. Identify and characterize the actors;
2. Describe the network context using Structuration Theory and Social Capital;
3. Identify the existing business processes;
4. Describe the network dynamics using ANT’s phases;
5. Detail the business activities of the actors;
6. Identify and classify the business flows according to four types: material,
information, financial, and influence;
7. Ensure an acceptable trade-off between effort and gain for each actor, based on the
available value propositions.
If step 7 failed, the others could be iterated back until condition “7” was fulfilled. After
defining these guidelines, we explored their suitability to study this case. Therefore, we analyzed
the gathered information about HowMuchIsIt and coded it according to the previously identified
seven steps. To clarify open issues, three subsequent interviews were held: two with one of the
business incubator project managers (on 24th November, 2006 and on 12th January, 2007) and
another with one employee of the development team (on 22nd December, 2006). Since a business
model was already in place, we focused on assessing its soundness.
Data on the participating actors (relevance, roles, goals, and their interactions), as well as a
description of the business processes were used to outline the business network. Next, we
annotated important concepts mentioned in the documentation that could be used to address
Structuration Theory’s dimensions and ANT’s phases. These concepts provided a better
knowledge on the network and unveiled clues that were subsequently worked to reach the network
balance. Then, we identified the various activities carried out by the actors and the exchanged
materials, data, and financial items. We also considered the exerted influences to grasp the
program of action inscribed in the network. By detailing the roles of each actor, we were able to
disclose the value propositions made available by the business model. However, when we decided
to present our findings to the actors and discuss the advantages and disadvantages of their
participation in the business model, we were informed that HowMuchIsIt had been suspended.
This happened at a crucial moment. Precisely when we needed the actors’ collaboration to assess
our conclusions – the list of value propositions in terms of gains and efforts – they were no longer
available. Since we had already developed the artifacts that the actors would use to evaluate their
own perceptions towards the value propositions, we put ourselves in their shoes and filled in the
artifacts based on the information gathered during the research. Our goal was not to achieve
conclusions about the actors’ perception of their participation in the business model, but to
explore the suitability of the artifacts. To prevent a premature closure, throughout this study we
kept an open mind to other topics that could help us detail the network description and reinforce
the alignment of its actors towards a balanced and viable business model.

6.2 Contribution of three case studies to BIZ2BIS
179
6.2.1.4 Lessons learned
We analyzed the bonds between the actors of the business model (the company that
developed the portal, the portal, individual customers, corporate customers, retailers and
wholesalers), the existing business flows, and the provided value propositions, which enabled us
to draw some conclusions on HowMuchIsIt. For the development company and its individual and
corporate customers, the obtained gain was noticeably greater than the performed efforts to get the
business model benefits. However, for retailers and wholesalers, the advantages of participating in
this business model were not so straightforward. Retailers could profit if the added income from
the portal would be higher than the fixed fees, which had to be paid whether there was a profit or
not. They also had the chance to benefit from the discounts agreed with the business model
wholesalers, but only if those were greater than the ones they usually got. The wholesalers, in
turn, needed their business volume boosted by the portal retailers to justify making discounts
higher than those usually done. However, if on the one hand the portal could help to reach new
retailers, on the other hand, it could also promote a different type of interaction with old
customers that had decided to join the portal. In the latter case, the wholesalers could incur in
reviewing and amending their already established commercial agreements.
Our analysis of the HowMuchIsIt business model allowed us to perceive that it relied
heavily on the participation of retailers and wholesalers to be attractive, whose gains were the
most fragile of all. We could verify that critical mass and sustainable commitment from these
actors was never secured. The firm needed 120 contracts to break-even, but only managed to get
20. Furthermore, the less the number of retailers, the less relevant the portal was for customers.
The fewer customers, the more unattractive the portal became for retailers.
Since the company might consider a comeback, we offered some suggestions to help
mitigate the identified problems. The key issue in the redesigned business model was to improve
the benefits for retailers and wholesalers, encouraging their enrolment, as well as their alignment
with the network interests. With this goal in mind, we advised the company that developed the
portal to end the retailers’ annual fee, and implement a small activation rate to access the portal,
as well as an additional charge based on the number of clicks in their products. The value to pay
could be increased if the retailers decided to strengthen their presence with extra functionalities,
such as having their products at the top of the search results or using special sections in the portal
to advertise promotions. HowMuchIsIt could also provide free supplementary services to attract
retailers, namely aggregated statistical information on the number of product clicks, sales
volumes, products sold by geographical area, or other custom reports of interest. Both, this
business intelligence platform and the former operational enhancements could be implemented
without considerable changes to the portal or to its running costs.
Applying BIZ2BIS to the HowMuchIsIt business model also contributed to refine our
approach, since it gave us the chance to detect some faults and to find clues to solve them. For
instance, when describing the network we were confronted with a clear limitation: the use of
concepts from ANT, Structuration Theory, and Social Capital. The reliance of BIZ2BIS on jargon
and concepts from theories that are unfamiliar to most business analysts and practitioners was a

Chapter 6 – The roadmap to the BIZ2BIS proposal
180
barrier to its use. To address this issue and make the approach more accessible we have toned
down the visibility of those aspects in normal use. On a positive note, the identification and
characterization of the actors did not raise any problems, as well as the description of the business
processes. The description of the actors’ activities and the representation of the business model
flows also proceeded smoothly. We adopted a visual representation inspired by graph notation,
where actors can be seen as nodes and the flows among them as directed edges. The developed
artifact was our first version of the “Flow diagram” (introduced in section 5.3.1.3). However, we
detected a redundancy between the data addressed in the description of the business processes and
of the activities performed by the actors. Based on literature on business models and on ANT, we
decided that in a first stage it would be enough to identify and detail the activities in which the
actors were involved.
During the case study, we identified the need to know what motivated actors to take part in
the network business model. We expected to find the ones that could be unsatisfied with their
involvement and that could put the network at risk. To avoid these situations, we decided to
endow the approach with the ability to point out alternative scenarios that could promote the
actors participation. To promote this maneuvering, we conceived a negotiation mechanism to
guide the establishment of commitments among actors (inspired by ANT literature). To support its
activities, we developed a diagram that depicted the business flows used as bargaining chips
among actors (again by arrows, similarly to the “Flow diagram”). Nevertheless, this time the
result was not satisfactory. First, because it was complicated to simultaneously analyze the
viewpoints of all the actors placed in one diagram; second, because we did not know the
importance that they assigned to each flow. Ignoring the perspective of the actors made it difficult
to perceive their level of satisfaction, and propose, if required, alternative business model
configurations. Our negotiation mechanism clearly needed improvements. In spite of the
difficulties in assuring that an alignment among the interests of the actors had been achieved, we
used the information gathered on the networked business model (its context, actors, activities,
interactions, and value propositions) to evaluate the trade-off for each actor. We developed a first
draft version of the “Interview chart”, in which we listed all the identified value propositions, their
supporting activities and the involved actors. Next, we identified the activities that supported each
value proposition and then we started to estimate the gain that each actor would obtain with each
value proposition, as well as the effort spent to support it. However, we quickly realized that a
reliable assessment had to be done by the actors themselves in order to integrate their own
perceptions in the approach and engage them in the decisions taken. But we faced an unexpected
difficulty, the HowMuchIsIt business model was suspended and we no longer had access to its
actors. Therefore, as a fallback solution, we filled in the evaluation artifact based on the
information we collected, which enabled us to sum the estimated efforts and gains for each actor
and compare the obtained results. This solution, however, goes against the requirements of
“fairness” as a key element of the “authenticity” desired from a trustworthy, rigorous, qualitative
research project (Lincoln and Guba, 2000). To be “fair”, a project must be able to express the
stakeholders’ views, concerns, and voices, in order to avoid researcher bias. To respect this, our
evaluation was not used to represent the actors’ view of the business model, but to perceive the
6.2 Contribution of three case studies to BIZ2BIS
181
adequacy of our evaluation mechanism as an instrument. Putting this Plan B into practice made us
realize that in a normal circumstance (in which the assessment would be made by the actors), the
information collected on the networked business model could be used as an additional verification
of the data filled in, and vice-versa. For instance, in the “Interview chart”, the activities that
support a value proposition can confirm the actors involved with it. Similarly, its value
propositions can substantiate if the goals pointed out by the actors are being achieved. The
information gathered on the networked business model, as well as the information filled in the
“Interview chart” must be consistent. Our original evaluation was extremely laborious, clearly
showing that a simplification was required.
6.2.2 Case two: Publishing an online journal
Some scientific journals struggle to attract readers and authors, usually suffering from lack
of resources. In addition, the current research habits expect to find any information online,
meaning that a journal without a web presence may lose visibility. In this context, a Portuguese
scientific association decided to publish its journal online. Its aim was to make the journal a
reference in the Portuguese scientific community, provide high quality content, make articles
available quickly, increase the prestige of the association, give visibility to the ones involved in
the journal publication, lower publication costs, provide new publishing opportunities and reach
wider access. In order for it to advance, a member of its board launched a project for a student in
the Informatics Master Course at the University of Coimbra. In addition, to the development of
the online portal, the project intended to scrutinize a suitable business model for the submission of
articles, reviews, and their publication. We and the student who took part in the project belonged
to the same research group and shared a common interest in business models, which promoted our
cooperation and allowed us to explore synergies in our work.
6.2.2.1 Reasons for the study
The journal’s business model became an appealing case study due to its network
configuration, the need to develop a portal to support its value propositions, and the privileged
access to key informants who were committed to the project success. Therefore, based on the
outcomes of the HowMuchIsIt case study, we had the chance to refine BIZ2BIS and explore the
potentialities of its updated version. Additionally, we could investigate the student’s reaction to
our approach and perceive if it could be used as a strong communication tool among those
involved in the business study. Understanding how our study could contribute to the high-level
requirements specification of the information system was also addressed in this case.
6.2.2.2 Potential limitations
When the master project ended, the student left. In spite of there being subsequent contacts
between the student, the university, and the association, the portal was never made available
online. Furthermore, feedback from the association board about the project’s outcomes was
unobtainable, namely the adoption of a free or paid business model. This crucial aspect was never
Chapter 6 – The roadmap to the BIZ2BIS proposal
182
decided or implemented. Due to this uncertainty and the apparent abandonment of the project, we
did not assess the proposed business model.
6.2.2.3 Description
In an initial meeting with the team responsible for the online journal project (on 30th April,
2007), we discussed the business model to adopt, its supporting information system, involved
actors, goals, opportunities, and threats. We also addressed the journal features (e.g., periodicity,
interested parties, and accessibility). To complement the information given and identify possible
alternative business models of publication, we gathered additional material from papers, Internet
pages, press articles, and publishers. The meeting also showed us the difficulties that the student
in charge of the development of the online portal was experiencing when describing and
representing the business model applied to the journal publication. Taking into account the
problems he was facing, the potential of BIZ2BIS to address the scenario under study, and our
interest in testing it in a new case, we decided to join efforts and collaborate with the development
team.
We started our analysis by identifying the actors of the business model (authors, reviewers,
editors, association, the portal, and readers), which were later characterized according to their
relevance, relationships, roles and goals. Then, we described the network (e.g., its goals,
interactions, rules and sanctions). At the same time, and supported on the results obtained in the
HowMuchIsIt project, we moderated the theoretical influences in our approach by introducing the
social dimension of the business models in a more subtle way. Thus, we strengthened its
independency from theoretical contributions and improved its “user-friendliness”. The fact that
we were working with people unfamiliar with ANT, Structuration Theory, and Social Capital
(which is expected when studying business models) reinforced this decision. Not having made this
choice would have implied that all parties become knowledgeable about these theoretical
influences, in addition to their expected work load. This would be difficult to justify, and accept.
All that the student expected from our collaboration was obtaining indications on how to represent
the business model, as well as to get guidelines to develop its information system. For instance, it
was not his aim to learn ANT at a general level.
In collaboration with the student, we examined BIZ2BIS instruments looking for topics that
might cause problems of interpretation to end users. The performed analysis allowed us to rethink
topics inspired by ANT, Structuration Theory, and Social Capital and led us to “black-boxed”
them to end users. For instance, ANT’s translation was one of our greatest influences. Its phases
guided us in designing BIZ2BIS and led us to consider the importance of providing a detailed
description of the network, as well as a set of guidelines to conduct negotiations among actors. As
a first experiment, we described ANT’s phases in text fields, but the dependency on its concepts
was too high. Taken into account our aim of limiting ANT’s explicit use, we began to abolish the
textual description and structured its content in a set of steps better targeted to the business model
analysis. Each step, as well as the artifacts that we developed to support them, followed ANT’s
philosophical principles, yet made them unnoticeable to the users. At this point, we acknowledged
6.2 Contribution of three case studies to BIZ2BIS
183
four steps, whose perspectives complement each other: Step a “Detect dependencies among goals”
– shows how actors can contribute with their own goals to the ultimate goal(s) of the networked
business model and exposes dependencies among the identified goals. The network of
dependencies is depicted in the “Common goal diagram”; Step b “Identify actors affinities” –
detects shared goals among the actors to disclose possible collaborations through the
“Actors/Goals affinity chart”; Step c – “Representation of the business model” – depicts the
identified business flows in the “Flow diagram”; and Step d – “Negotiate actors contributions” –
identifies the activities that support a critical goal to the network and the personal aspirations that
can motivate the actors to carry out needed tasks. It also exposes bargaining chips that may
encourage the actors to carry out the activities that support that critical goal. This data is
summarized in the “Negotiation diagram”.
The information gathered in Step a, Step b, and Step c helped us to perceive the impact of
the actors in the networked business model. For example, it gave us clues about the actors’
potential of becoming a threat and revealed insights on how to maintain their presence in the
network. By understanding the expectations of the actors, or their latent disappointment, BIZ2BIS
pointed out counterproposals to mitigate unfavorable situations based on insights from Step d. The
inclusion of these negotiation features in BIZ2BIS, led us to organize it in three phases: Phase I
“Business model characterization”, which describes the network and its actors; Phase II “Business
model refinement” that comprises the four above mentioned steps; and Phase III “Stability
assessment”, covered in HowMuchIsIt. Phase I and Phase II were assembled in a report and
delivered to the student (on 15th May 2007). Then, he was assigned the task of using “Flow
diagrams” to detail the identified flows and value propositions. An updated version of these
artifacts was provided on 13th June.
Meanwhile, the development team held a meeting with two members of the association
board (on 19th July, 2007). The topics discussed were: the development of the platform, server
requirements, administration aspects, the services that the portal should provide, and a balance of
positive and negative aspects of a free vs. paid access model to the journal articles. The gathered
information was used to aid in the specification of the portal’s high-level requirements.
We had meetings with the student every fortnight between May and July to follow the
portal implementation, receive feedback, and understand how BIZ2BIS contributed to the portal
development. The identified business flows (in particular, information, products, and services)
were used to specify the portal features, detail the interactions of the actors with the available
services, and the exchanged data. The project finished by the end of September.
6.2.2.4 Lessons learned
The value propositions we identified provided strong indications that it could be
advantageous for the journal authors to participate in the business model. They could, for
instance, obtain feedback on their work, promote their research, give it more visibility, and
enhance their curriculum. However, this positive impact could only be achieved if the recognition
of the journal were to become a reality. The same holds true for reviewers and editors - the journal
Chapter 6 – The roadmap to the BIZ2BIS proposal
184
would have a positive impact on their curriculum. The prestige of the journal is also relevant for
the association responsible for its publication, since their elements seek acknowledgment for their
activities. However, the journal merit depends on aspects as diverse as the quality of the articles
submitted by the authors, the excellence of the performed revisions, and the number of references
to the articles. To complicate matters, these issues were not under the control of the association,
which can only promote actions to encourage other actors to collaborate with their initiatives.
One of the aspects that could influence the participation of the actors in the business model
and its success was whether the journal should use a free or a paid model. So, we approached both
possibilities. The adoption of a paid model would increase the association’s income. Nevertheless,
this option presented several risks. Since some online journals provide their articles for free, if any
of those do have higher reputation, a paid service would certainly decrease the number of readers.
A reduction in the amount of accesses would also have implications on the number of authors
interested in publishing (nobody is interested in a journal without readers). Furthermore, a
reduction in the number of authors may lead to a crisis of content. A paid model is advantageous
for the association, but it could keep the remaining actors away from the portal, compromising the
activities that should be carried out to enroll them. On the contrary, a free model attracts readers,
but reduces the association’s revenues. In alternative, a mix of paid and free content could be
explored. For instance, the association would not charge for the more popular content,
encouraging accesses, and simultaneously would develop content compelling to niches that due to
its specificity could justify a paid access. The association depended on others to enhance the
journal prestige and reinforce the networked business model. Therefore, the choice of the business
model to adopt had to be made with great care.
We also underlined that the choice of the business model typology could imply the
appearance of new actors. For example, if a printed copy were to be produced, a design team
would be needed, the printers would be required, and sponsors would be sought. Furthermore, it
was clear that the business model success greatly depended on the journal reputation, which led us
to provide several suggestions to enhance it: invite recognized authors to write for the journal,
select qualified editors and reviewers, provide constructive feedback on the articles, and evaluate
the feedback provided by the reviewers to ensure its high standing.
The information gathered in the initial stage of the project created a common background
that promoted the business model discussion and its clarification. We were able to detail the
network, its actors, their interactions, and debate alternative scenarios. Based on the obtained
information, namely the flows of the business model, we disclosed guiding lines that aid us in
specifying the portal features. We took into account information flows (data exchanged among
actors), material flows (physical materials exchanged among the actors during business
transactions) and influence flows. However, we quickly realized that it was necessary to extend
their scope. Relevant flows were not being considered, namely non-physical services that should
be addressed by the portal, which led us to join them with material flows - both were later named
service flows (physical and non-physical). Furthermore, other intangible flows beyond influence
had to be taken into account (e.g., the scientific prestige of the journal). We did not consider

6.2 Contribution of three case studies to BIZ2BIS
185
financial flows in the specification of portal features, due to the uncertainties about the type of
business model to adopt (free or paid). In collaboration with the master student, the “Flow
diagram” artifact used to represent the business model flows suffered various design refinements
throughout the project, with the aim of making its use easier. We all agreed that our initial
representation was too intricate. In addition, to facilitate the application of BIZ2BIS, we
systematized it in three phases. Specific features of the case, allowed us to give greater emphasis
to Phase II “Business model refinement” and its steps, for which we developed three artifacts: two
of them explored the actors’ goals (our draft versions of the “Common goal diagram” and
“Actors/Goals affinity chart” presented in section 5.3.2) and a third balanced the effort and
benefits for each actor (a new proposal for the “Negotiation diagram” conceived in
HowMuchIsIt). They played an important role in the networked business model’s negotiations,
due to the insights they provided when searching for an alignment among the interests of the
actors. However, in the latter artifact, we noticed that the conveyed indications were not clear to
BIZ2BIS’ users. They had difficulties in understating the impact of the goal under examination on
the actors related to it (obtained gain and spent effort). To solve this shortcoming we decided to
amend it in future applications.
In this case study, we realized that the inclusion of concepts from ANT, Structuration
Theory, and Social Capital in the BIZ2BIS limited its use, since they were alien to the average
user. Therefore, we “back-boxed” them to the users, making BIZ2BIS use independent from its
theoretical influences and avoiding the users’ awareness of their philosophy. As a result of these
adjustments, the master student was able to apply the approach unaware of the theoretical
foundations used in its conception.
6.2.3 Case three: GreenHomes
The iTEAM (Integrated Transports and Energy Activity-Based Model) project under the
scope of the Program MIT-Portugal needed to access electricity consumption data to support
some of its research aims. One of its investigators, which simultaneously worked at the University
of Coimbra, decided to gather the necessary conditions to develop a project that could gather that
information. The project, named GreenHomes, was conducted at the University of Coimbra, and
its aim was to develop a platform that could receive its users’ consumption data per household,
every week. In turn, the platform would monitor the obtained data and provide advice to enhance
the ecological footprint of its users, as well as tips to reduce their electrical bill. It was expected
that a Portuguese environmental association could contribute to make these counseling services
available.
According to the initial plans, two types of users were allowed in the platform: “Standard”
and “Monitored”. While the data of the former had to be inserted manually, the latter were offered
sensors at the beginning of the project that transmitted their data automatically to the platform.
The creation of an ecological social network, with the aim of promoting collaborations and
encouraging the sharing of environmental information was also planned.

Chapter 6 – The roadmap to the BIZ2BIS proposal
186
6.2.3.1 Reasons for the study
The complexity of GreenHomes business model made it an appealing case study. Its
network configuration, with collective and individual goals that could address interests as diverse
as ecological, scientific, and economic - most of the times difficult to conciliate and with
meaningful dependencies among them – gave us the chance to see how BIZ2BIS was able to
capture and study these scenarios. We had the chance to explore the advantages of organizing the
approach in three phases and see how its negotiation mechanism should be applied. Since the
business network was also supported by an information system, we also had the opportunity to
detail the contribution that the business model study could provide to the development of its
underlying information system. Our interest in this case study was also encouraged by its project
manager’s concern and commitment in evaluating the GreenHomes business model soundness. It
gave us strong assurances that we would have access to the case data and that key actors in the
business model would be available to provide feedback for our analysis.
6.2.3.2 Potential limitations
With the suspension of the project due to difficulties in maintaining established
collaborations and the emergence of financial issues, we lost contact with key actors, as well as
the opportunity to receive their feedback and confront our interpretations. This caused several
setbacks in our research. For instance, it was not possible to explore the GreenHomes researchers’
difficulties in analyzing the trade-off of the actors, only a partial evaluation of our analysis was
received, and the business actors did not assess the identified value propositions. In addition, we
were not able to use the business model analysis to contribute to the specification of the
platform’s high-level requirements.
6.2.3.3 Description
On the 17th of December 2008, we had a meeting with a researcher from the University of
Coimbra that was working in collaboration with the iTEAM project. He presented us
GreenHomes and another project under the scope of the partnership established among these two
entities. In both cases, he would be the principal investigator and there were some doubts about
the proper business model to adopt. However, as GreenHomes would begin first, the researcher
had a preference for its study. Given that we needed a new case to enhance the maturity of our
approach, and the fact that both met our selection criteria, we respected the needs and
expectations of the researcher and elected GreenHomes as our option. This selection was
confirmed in a meeting held on 4th March, 2009, at which we scheduled the future steps of our
research.
We systematized Phase I in steps to provide an outline of the topics to address when
characterizing the networked business model. We supported our decision with the positive
feedback obtained in the adoption of this same structure in the Online case study, when we were
applying Phase II. Then, we created two artifacts to support Phase I’ steps, which were used to
guide the conducted interviews: “Networked business model description chart” and “Actor
6.2 Contribution of three case studies to BIZ2BIS
187
description chart” (the fisrt versions of the ones presented in BIZ2BIS proposal, section 5.3.1).
Meanwhile, the researcher went abroad. Since we could not appoint an interview, we decided to
send him the artifacts by e-mail. This was done on the 27th of March, along with a small
description of the artifacts’ fields. On the 29th of March we received a detailed answer, with
excellent feedback. According to the researcher, the artifacts were easy to use and provided a
valuable starting point for the project business model understanding. Furthermore, he informed us
that his vision of the project had become more comprehensive, beyond the scope of technology
and users. In spite of the positive reaction to BIZ2BIS, there were still some lingering questions
and doubts about the case itself. As the principal investigator was overseas, a substitute was
nominated. However, only on the 4th of June we were able to schedule a new meeting. Here, we
conducted another interview with the substitute leader and with the development team (assigned
in the meantime), in which we revisited all the topics of the already filled in artifacts. During the
interview, we noticed that it would be advantageous to address the network characteristics firstly
and detail its actors secondly, contrary to what we had done so far. Having acquired a
comprehensive knowledge of the network context first, promoted and enabled the identification of
the actors, as well as their characterization. We also perceived that the scope of the artifacts was
sufficiently comprehensive to cover and capture the discussed content of the network and its
actors. On the 3rd of July it was possible to hold a meeting with the two research leaders and the
development team. In order to detect dependencies among the goals of the actors participating in
the network, as well as possible affinities among them, our working group initiated Phase II.
Together, we applied the two artifacts that support these activities: “Common goal diagram” and
“Actors/Goals affinity chart”. After explaining how to use the former (it took approximately 5
minutes), we had an insightful discussion about the actors’ goals, their dependencies, and how
these would support the ultimate goals of the networked business model. The addressed topics
were always centered on business model issues and not on the diagram characteristics and use.
However, the same did not happen with the second artifact, which depicted the individual goals of
each actor in a “pie chart”. Each slice represented one goal of the actors in the business model.
The ones who aspired to reach a certain goal where placed inside the corresponding slice,
disclosing shared interests. We discussed the chart configuration for 20 minutes. The project
elements considered its representation unfeasible due to problems of lack of space, even for a
medium number of actors and goals. Therefore, we adopted a tabular format.
Based on the feedback obtained in the meetings, over a span of three weeks, we worked on
a report that covered BIZ2BIS’ Phase I and Phase II. In Phase I, we characterized the network and
its actors through the artifacts filled in by the researchers and complemented it with the feedback
obtained in the meanwhile. In Phase II, we considered how the actors could contribute to the
network goals by refining the already developed “Common goal diagram”, detected possible
collaborations using the new “Actors/Goals affinity chart”, and analyzed the trade-off for each
actor through the development of several “Negotiation diagrams”. We remodeled the latter artifact
according to the outcomes of the Online Journal case study. We maintained in this diagram the
initial idea of analyzing the aims whose failure could jeopardize the network by identifying their
supporting activities and the benefits of the actors responsible for their execution. However, we
Chapter 6 – The roadmap to the BIZ2BIS proposal
188
started to classify the effort spent by the actors in carrying out these activities, as well their
relevance for the accomplishment of the critical aims under study. We also considered the
influence of these goals on other actors. As a whole, the artifact represents who contributes to a
goal achievement and who wins with it, disclosing negotiation targets. After analyzing the
dependencies among the several goals in the networked business model, we took into account the
performed activities and the exchanged flows, which allowed us to identify the value propositions
provided by the business model. The artifacts made it evident that most of the goals could be
clustered in two groups: obtain environmental and consumption feedback (the platform users) and
achieve research interests (the majority of the remaining actors). As a unifying factor, both groups
had ecological awareness. As a point of concern in the business model, we noticed that the
success of the research interests strongly depended on the number of users of the platform.
Furthermore, the users could obtain environmental tips from alternative, competitive, sources, so
this was not an exclusive benefit of GreenHomes. The free energy sensors provided by the
iTEAM project was GreenHomes’ main advantage, yet only a small number of users had access to
this benefit. Given this scenario, and in order to avoid the collapse of the network, we advised the
project leaders to improve the attractiveness of the value propositions available for the platform
users. The project leaders commented on some of our proposals on the 5th of August 2009. They
agreed with our suggestion to diversify and enhance value propositions, and decided to increase
the types of provided services. For instance, they proposed the inclusion of automobile fuel and
water consumption analysis. Nevertheless, to make this possible, it would be necessary to
strengthen ties with the Portuguese Environmental Association, since these new services would
largely depend on know-how held by it. We supported this closer collaboration due to the critical
need to attract users to the platform. However, and in spite of the indisputable advantages, we
alerted the leaders to possible conflicts between these new services and others provided by the
association on other platforms. A more active participation of the association could threaten its
influence in other networks, and consequently reduce its will to enlarge its collaboration. We tried
to establish further contact to receive feedback about other aspects raised in the report, namely
alarming trade-offs concerning certain actors or the suitability of the identified value propositions.
The project leaders answered by approving our list of value propositions, but asked us to appoint a
meeting to clarify those alarming situations. In the next contact (beginning of September), we
were informed that the project had been temporarily suspended.
6.2.3.4 Lesson learned
The GreenHomes privileged access to environmental data would have benefited the actors
with research interests. The “Monitored users” (those supplied with free energy sensors) would
also have the advantage of receiving feedback on their electricity consumption without having to
insert data manually in the platform. However, for “Standard users” the gains would not have
been so evident. Their effort in manually introducing data, on a weekly basis, would have been
very demanding. Furthermore, taken into account that consumption patterns are relatively stable,
the need to access to environmental tips on a regular basis is not very engaging. Additional
measures to attract these users would have to be considered (e.g., create a strong sense of
6.2 Contribution of three case studies to BIZ2BIS
189
belonging to the platform ecological social network). To complicate matters, the goals of the
researchers depended mostly on these actors, since the budget assigned by the project to equip
“Monitored users” was restricted (only 100 to 150 free sensors were available). Moreover, the
services supported by the Portuguese Environmental Association overlapped with other services
provided by this association on other platforms, which could jeopardize its presence in the
business model. It was fundamental for the viability of the platform to perceive the real interest of
the association in participating.
In the GreenHomes case study, we observed the potential of BIZ2BIS as a communication
tool. Its capacity to integrate the social component in the analysis of the scenario under study
brought about a more comprehensive view. We were able to consider key aspects of the business
model and of its context, and introduce them into the discussion about the platform development
(e.g., actors’ expectations, new features to address the interests of the actors, and possible
collaborations to enhance the platform potentialities). When conducting interviews to characterize
the network and its actors, we also perceived the aptitude of the artifacts developed in Phase I to
guide the sequence of questions and expose the topics to cover. Their fields were able to account
for relevant issues in the networked business model and capture all the data gathered during the
interviews. The artifacts usability were also stressed when we, the research leaders, and the
development team worked together to identify the actors, their influence and goals, as well as
their shared interests. The project leaders contributed to enrich our business model analysis with
their comments and also provided input on the usability of the artifacts. We used their suggestions
to change the “Actors/Goals affinity chart”, and after the amendments the project elements were
able to promptly interpret its results. In fact, we used the clues obtained with this artifact to
support the discussion of alternative business model configurations. In the delivered report, the
only artifact that caused doubts was the “Negotiation diagram” (additional explanations were
needed to clarify its outcomes). Misinterpretations of the information conveyed by this diagram
can be critical, since its contribution is fundamental in disclosing benefits and disadvantages of
the participation of the actors in the business model. Given the relevance of the data in question,
we decided to simplify the interpretation of the “Negotiation diagram” results. The GreenHomes
team pointed out the need to improve another aspect. In Phase III, when assessing the business
mode stability, it became overwhelming for them to describe all the activities that had to be
carried out to support the identified value propositions in the “Interview chart”. At this point, we
perceived that this task had already been partially fulfilled in Phase I, in the artifact “Actor
description chart”, when identifying the actors roles in the business model. Thus, to streamline
BIZ2BIS and encourage its use, we opted to describe the actors’ role in Phase I with greater detail,
which allowed us to omit an additional description of the activities in Phase III (most of the
information obtained in the two steps was redundant). When discussing the list of value
propositions identified in the report delivered to the researchers, we noticed their interest in
understanding how we had reached that list. In order to clarify, we created a procedure to identify
the value propositions. Previously, we had always used BIZ2BIS’ insights in a non-systematic
manner.
Chapter 6 – The roadmap to the BIZ2BIS proposal
190
With the contributions we gathered in the above three case studies, we fine tuned BIZ2BIS
and endowed it with a greater ability to address a rather complex scenario as the InovWine
project. We will discuss how action research guided our work throughout this project in the next
section.
6.3 Contribution of action research to BIZ2BIS
InovWine is a joint project between entities belonging to the wine industry and to the
scientific community. It aims to explore precision agriculture features to achieve significant
improvements in the wine production activities in the Portuguese Region of Bairrada. The project
explores the knowledge transfer among its business associates, which is expected to contribute to
a better utilization of natural resources in the region, leading to its economic and social
development. In this section, we chronicle how action research conducted the use of BIZ2BIS in
the InovWine project in order to conceive a resilient business model and derive the high-level
requirements of its underlying information system.
6.3.1 InovWine research context
Wine production is one of the most traditional Portuguese industries. It has captivated
foreign interests, has developed the social and economic conditions of vine growing regions (e.g.,
creating jobs), and has increased the volume of exportations. Portugal annually exports
approximately 600 million euros in wine (Diário Digital / Lusa, 2010), which is particularly
relevant in this moment of economic crisis. As mentioned by the Portuguese President, wine is the
most important product of our primary sector. Annually it generates almost 900 million euros,
which represents roughly 17% of the agricultural industry total production (Diário Digital / Lusa,
2010). Due to its relevance in the national scene, it is fundamental to implement strategies and
solutions that can respond to its difficulties and needs, increasing the Portuguese wine
competitiveness.
The wine production depends on diverse unmanageable factors (e.g., climate conditions and
plagues) and in thorough monitoring. The use of precision agriculture gives leeway to develop
new tools to aid in the activities of wine production. In the Portuguese Region of Bairrada, four
actors are interested in exploring this field: a wine making cooperative, two technological
institutes (one focused on biotechnology and the other on information, communication, and
robotic technologies), and a grapevine nursery. The four pondered potential areas that could
benefit from technological contributions. These actors possess know-how and experience in
different domains, which allowed them to complement their individual perspectives and conceive
a project that addresses the wine industry improvement through technological support - it was
called InovWine. The project was submitted to NSRF (National Strategic Reference Framework)
that constitutes the framing for the application of the Community’s policy for economic and social

6.3 Contribution of action research to BIZ2BIS
191
cohesion in Portugal for the period between 2007-2013, with the support of the Structural Funds
and the Cohesion Fund. The InovWine project aims to:
Create a genotyping system based on molecular methods to obtain the exact
identification of the grapevine genetics and aid in its certification. The grapevine
credentials will be recorded in RFIDs (Radio Frequency IDentification) that will be
implanted in the plants at the grapevine nurseries. This procedure ensures the grapevine
variety and allows producers to trace each grapevine history.
Develop a monitoring and alarm system for the vineyard. This helps producers in their
decisions about the vineyard treatments and is based on several sources of information:
relevant data on the vineyard characteristics and evolution, as well as biotic and abiotic
factors. Biotic factors are produced or caused by living organism, like virus, while
abiotic are associated with non-living chemical and physical factors in the environment
such as light, temperature, water, and soil. The system would be supported by wireless
sensor networks owned by the producers and coupled to a portable interface, so it can
be used in loco, and in real-time, in vineyards.
Identify specific wine yeasts that can potentiate the regional grapevine varieties,
stressing characteristics demanded by the market. A device for monitoring their
dynamics during fermentation should also be developed.
To facilitate reader understanding of the actor interests on the project and of their
contribution to accomplish the network goals, we will present a brief description of each:
Adega Cooperativa de Cantanhede (ACC) – it owns the main wine production area of
the Bairrada Demarcated Region. Currently, it counts with around 800 associates and is
the largest producer in the region: around 25 to 30% of the total production. The
contacts it holds in the Portuguese wine market, its number of associated members, its
expertise, and the availability to implement the InovWine project on the ground makes
it a priceless partner in the project. Due to its influence over its members, the
cooperative will also manage the communication with the producers during the project,
mainly with the one that owns the vineyard where the pilot study will be performed.
The Adega is the project’s main promoter.
Instituto Pedro Nunes (IPN) – it is a technology transfer organization created by the
University of Coimbra. It aims to generate synergies with the business community,
promoting a culture of innovation, quality, accuracy and entrepreneurship. This
organization has its own technological infrastructure and six laboratories of
technological development. The two listed below are involved in InovWine:
- Laboratório de Informática e Sistemas (LIS) – it provides audit services and
consulting, and develops innovative software. In InovWine, it is responsible for
developing a database of biotic and abiotic data for the cooperative vineyards. This
information will be automatically obtained through devices placed at the vineyard,
and manually inserted by the producers. The access to the database can be made

Chapter 6 – The roadmap to the BIZ2BIS proposal
192
through a mobile system or a computer terminal. At a later stage, LIS will also
develop learning algorithms to help producers in their vineyard activities.
- Laboratório de Automação e Sistemas (LAS) – in the scope of an Industrial
Instrument Unit, it provides hardware technological solutions and consulting
services. In the InovWine project, LAS will deploy a wireless sensor network in the
field to monitor and obtain abiotic factors relevant to the vineyard production. This
laboratory will also research the best way to implant RFIDs in the grapevines.
Biocant – situated in Cantanhede, it is the first Portuguese venue entirely devoted to
biotechnology. Its main activity is to generate innovative services and products to create
value in business initiatives. Under the scope of this project, Biocant proposes the
creation of a genotyping system based on molecular methods. This centre is also
responsible for developing techniques for the detection of microorganisms in grapevines
and wine, and for the identification of new yeasts adapted to Bairrada regional
conditions (e.g., climate, soil type).
Viveiros Vitivinícolas Pierre Boyer (VVPB) – located in Estremoz, it provides certified
grapevines that will be used by Biocant in its research. The nursery also contributes
with suggestions on how best to embed RFIDs in grapevines. The insertion of RFIDs
will be made during the grafting, and will be carried out by the VVPB itself.
6.3.2 Reasons for InovWine study
In addition to the already mentioned chance to collaborate with practitioners, receive their
feedback, intervene to solve a complex problem of the wine sector, and contribute with guidelines
about the most suitable business model to adopt, InovWine offered us a particularly plentiful and
rich scenario. The several networks with influence on the cooperative’s business model (e.g., the
vineyards and wine certification, or producers’ associations) enabled us to observe how the
approach incrementally draws the networked business model boundaries. The common interests,
the conflicting aspirations, and the undeniable social influences allowed us to assess BIZ2BIS’
ability to capture social constraints. The project dynamics was also an opportunity. It gave us
access to a scenario that underwent several changes, with close interaction with the particularities
and pressures of a real case, and where deadlines had to be accomplished according to the
contingencies of its actors. InovWine also gave us the chance to understand if the information
gathered through the approach was able to support its negotiation mechanisms in the search for
the alignment among the actors’ interests, as well the usefulness of the insights obtained in that
search. Furthermore, the team responsible by the information system development based their
work on our study, providing an independent and accurate feedback of our outcomes. No less
important, all these research directions were implicitly exploring our interpretation and integration
of ANT’s concepts in BIZ2BIS. The InovWine project was funded by European funds, thus the
actors are obliged to fulfill the tasks assigned to them in accordance with the project plan. The
possibility of incurring penalties (e.g., to return money) gave us extra safety that the project would
be conducted until its end, and that we would be able to explore all our research questions.
6.3 Contribution of action research to BIZ2BIS
193
6.3.3 Potential limitations of the InovWine study
We found three main limitations. First, we had a personal interest in the adoption of our
proposals for the InovWine business model and for its supporting information system by the
InovWine actors (related with our aims for this dissertation). It was important to our research that
the indications obtained using BIZ2BIS were able to guide us to conceive a proposal capable of
meeting the expectations of the actors, promoting their participation, streamlining the activities to
perform, and contributing to accomplish a viable business model. In these circumstances, our bias
could interfere with our ability to assess the suitability of the guidelines provided by BIZ2BIS. To
make the appraisal as much as possible independent from our point of view, we minimized
possible unconscious influences through the adoption of a research strategy that actively involved
all the actors in the analysis and decisions concerning the InovWine business model (group
consensus was searched and most of the times achieved). Furthermore, we strengthened our
research credibility through several actions: get through a prolonged involvement, carry out a
continuous search for wine industry details, follow the interactions of all the actors involved in the
business model (who supported us in reviewing the emerging case material), search for new actors
able to influence and introduce new perspectives, and use of multiple data sources. Through the
provided documentation, the reader can also judge if the story rings true (Klein and Myers, 1999).
Second, we were studying a phenomenon that is still very much on-going. When we stopped our
collaboration in the project and consequently the contacts with the actors (September 2011) the
information system was still in a test phase (e.g., mainly the sensor and the RFIDs), as well as the
research and development of biological devices. Thus, no definitive conclusions could be drawn
about the success of the proposed business model. Third, given the nature of this research, we
cannot draw general predictive statements for all networked business model scenarios, not even
for business models related to the wine industry. However, this dissertation provides rich insights,
from which we have extracted specific implications for researchers and practitioners (Walsham,
1995b) that desire to discuss, design, and evaluate networked business models supported by
information systems.
6.3.4 Chronology of the project
After the acceptance of the InovWine proposal submitted to NSRF, the project leaders
considered it important to evaluate the viability of its business model. Since the project had been
funded for a period of 3 years, we did not address its development activities. Instead, with the
project leaders consent, we focused on the business model that would be in place at the end of the
project (after funding was over). To accomplish this purpose, they gave us access to the InovWine
proposal, so that we could assess its interest to our research. Given the reasons discussed in
section 6.3.2, we agreed to participate. Simultaneously, with the aim of disclosing threats to the
InovWine business model, we started to study the supplied documentation about the wine sector.
Our research was guided by a protocol established among the participating actors, which

Chapter 6 – The roadmap to the BIZ2BIS proposal
194
addressed the roles to be played, collaboration agreements, deadlines, rights of intellectual
property, and how the InovWine results could be exploited commercially.
Our analysis and evaluation of the business model proposed in the NSRF submission
enabled us to stress test BIZ2BIS. We started by applying Phase I to detail the business model
under study, which showed us the need to establish contacts with the participating actors. To
make ourselves known to them, we attended a first meeting with representatives of the involved
organizations (with exception of the vine nurseries), which broadened our understanding of the
project. After an opening statement where InovWine goals were presented, the cooperative and
one of its members described the business model in use prior to InovWine Project, provided
details of the wine production process, and clarified how the project outcomes could address their
main needs and concerns. Taking into account the complexity of the provided information, we
decided to follow the actors in the network and capture their own perception of the proposed
business model to detail the information available on it. We aimed at gathering data that could
help us perceive the soundness of the solution idealized in the proposal submitted to NSRF. To
promote and foster our aim, we asked to all parties present at the meeting to collaborate with us.
We underlined the idea that their perceptions and expertise were essential to disclose possible
problems and conceive a successful business model. The data gathered enabled us to move on to
Phase II and draw some conclusions about the InovWine business model. We briefly present them
below:
Most cooperative members possess very limited financial resources. They do not have
the monetary means to acquire technological devices to deploy in their small parcels of
land.
Producers are not willing to pay an extra cost to ensure the grapevines genetic origin.
Cooperative’s producers lack technological skills and work in the vineyard on a part-
time basis.
The vineyard treatment notifications send by the cooperative, or by the local
meteorological station, sometimes do not reach the producers on time.
The implantation of the current certification process and its legal support prevents the
development of an alternative certification system based on RFIDs.
Applying Phase I and Phase II also provided us relevant feedback on the suitability of
BIZ2BIS. We detail the outcomes below:
The first two steps of Phase I allowed us to gather all the information obtained on the
network and on its actors’ relationships. Still, the contribution of these steps went
beyond recording activities. We used the fields of their supporting artifacts as a
guideline for the topics to address when studying a networked business model
(including the pre-set agenda of the interviews). The detailed description we gathered
underlines the aptness of these steps to meet the targets for which we devised them.

6.3 Contribution of action research to BIZ2BIS
195
Step I.c “Representation of the business model” became part of Phase I. At first, it was
under Phase II, since we conceived it to visually represent the final version of the
business model reached at the end of Phase II. However, when applying Phase I to the
InovWine business model, we also felt the need to visually represent other business
models relevant to understand the one under study. Furthermore, the ability of Step I.c to
visually represent the information already covered in the remaining steps of Phase I
revealed itself extremely useful in promoting discussion and clarifying open issues.
The awareness that various flows in the business model submitted to NSRF were at risk
and could compromise the business model, led us to develop a further step in Phase II:
Step II.d “Description of critical dependencies”. This step introduces a new perspective in
our analysis: it identifies the value propositions that depend on a certain flow and the
actors who may be affected by the absence of that flow.
The feedback obtained with the use of the “Negotiation diagram” made us notice that
we had miscalculated the ratio between the gain and the effort for the actor that owned a
goal under analysis. In addition to consider only the effort that this actor had to undergo
to support the goal addressed by the diagram, we also acknowledged the contribution of
this actor to other goals directly influenced by the one under analysis. Since this
additional exertion corrupted the outcomes of the diagram, we discarded it.
The InovWine project revealed drawbacks of the approach in coping with the
momentum of the project (e.g., the need to obtain information on an ongoing basis and
deal with unexpected events). To represent the continuous acquisition of data, display
its progression, and capture its intrinsic dynamics, we developed a notation to apply on
the “Networked business model description chart” and “Actor description chart”
(Phase I, Step I.a and Step I.b).
BIZ2BIS’outlined plan allows changes between phases and steps. To make it easier to
deal with these shifts, we perceived that the granularity of the switching point should be
the steps, and not the phases. Whenever BIZ2BIS’ users detect that the contribution of a
step can be helpful to solve the problem at hand, they should apply it, even if in some
cases this can mean a phase shift. Thus, the sequence of the phases, and of its steps, is
essentially indicative. It must be adjusted according to the needs of the networked
business model under study.
The complexity of the case urged us to lighten our approach. In Phase I, we excluded the
extra diagrams developed to show the interactions among the actors (we only kept the
“Flow diagram”, which was able to cover the main issues addressed by the remaining).
In Phase II, we also removed the artifact that detailed the activities performed by each
actor. We considered that the “Actor description chart” already covered” this topic.
In several meetings throughout the project, we presented our vision of the business
model. In these presentations, we occasionally resorted to concepts such as actor,
interaction, network, enrolment, and alignment. Interestingly, we noticed that these

Chapter 6 – The roadmap to the BIZ2BIS proposal
196
terms began to be part of the remaining actors’ vocabulary. The adoption of these
concepts, even without being aware of ANT, gave rise to a common verbal backing that
promoted the networked business model discussion.
As mentioned in the above conclusions about the InovWine business model, the obtained
insights on the proposal submitted to NSRF prompted us to identify possible adjustments and start
a second iteration of BIZ2BIS. The economic difficulties of the producers led us to propose the
development of a network with a larger mesh, able to cover the productive lands of the
cooperative members, instead of considering that each producer would install its own network in
his parcel. The shared wireless sensor network would not address the specificities of each
vineyard, but the ones of the cooperative fields. Furthermore, the lack of technological skills made
us establish the need to promote training actions to fight technological illiteracy. We presented
these proposals to the actors with the power to decide the future of the business model (ACC, the
producers, Biocant, and IPN). They considered our warnings and followed our suggestions.
Hence, we started a new iteration of BIZ2BIS to study this updated version of the business model,
while also enhancing BIZ2BIS with the feedback obtained in the first. Then, we performed
several contacts (e.g., large producers, meteorological stations, ACC, research units) that helped
us to understand how to promote the participation of the actors and identify the data that should be
used to generate the InovWine treatment warnings. Simultaneously, we initiated negotiations with
the participating actors to align their interests, considered alternative solutions to the proposed
business model, and developed a report detailing possible future directions (Phase I and Phase II).
The produced documentation was delivered to the actors with decision power. Next, we started to
evaluate the actors’ perception of the business model (Phase III). When the actors agreed with the
proposed solution, we specified the high-level requirements of its supporting information system
and delivered them to the development team (Phase IV). The mentioned activities made us reach
the findings briefly described below:
The identification of business model’s problems and the disclosure of alternative
solutions pointed out by BIZ2BIS provided valuable outcomes to the actors with the
power to decide the future of the InovWine business model.
All actors considered that their participation would have a positive outcome. Their
evaluation was based on the provided value propositions. This feedback gave us
additional assurances about the alignment of the actors’ interests.
BIZ2BIS was able to integrate the actors’ aspirations in the business model, giving rise
to a high-level specification of the information system requirements that respected the
network context.
The development team successfully used the high-level requirements obtained for the
information system supporting the networked business model. We were able to define
an intermediate step that encompassed a comprehensible outcome of the business model
analysis and of its context for practitioners and for the teams responsible for the
technical development, bridging both worlds.
6.3 Contribution of action research to BIZ2BIS
197
The developed information system’s prototypes were presented in several meetings and
did not suffer significant changes.
The second iteration of BIZ2BIS in the InovWine project underlined its potential to discuss,
design, and evaluate networked business models. We witnessed how it articulates its phases,
steps, and artifacts and how they complement each other. How each one depends on those that
precede it, supports the following, and reinforces and checks issues pointed out by others,
increasing the coherency of the obtained insights. For instance, the development team based
themselves on the data detailed in the specification of the services to track in BIZ2BIS’ artifacts
the value propositions that had led to the identification of these services, their supporting business
flows, as well as the activities and the actors that sustain them. In this iteration of BIZ2BIS, we
also obtained interesting feedback that enabled the introduction of minor changes in its
application. For example, two people with background in production engineering and lean
management when looking at the artifacts showed some unwillingness in analyzing all their
details. They were expecting to find a quick summary of some artifacts’ insights to make it easier
to interpret. To meet this requirement, we developed the “Flow matrix” artifact as an alternative
representation of the information covered in the “Flow diagram”. Besides that, we introduced
highlights in other artifacts (e.g., “Negotiation diagram”, “Actors/Goals affinity chart”, and
“Business flows/Value propositions chart”) that promptly reveal some of their main indications.
The changes introduced and the simplifications carried out in BIZ2BIS’ application made it more
attractive.
6.3.5 Lessons learned
Applying BIZ2BIS in a case as complex, rich, and challenging as the InovWine project
allowed us to confirm its aptitude to conduct analysts in discussing, designing, and evaluating
networked business models. Based on its guidelines, we were able to detail the networked
business model, identify the actors involved, and create a common background of knowledge to
promote the business model discussion between analysts and practitioners. BIZ2BIS’ ability to
capture the perceptions of the actors and take into account the interplay of interests among them
enabled us to detect problems in the business model initially proposed, mediate interests, and
suggest alternative solutions.
Moreover, the approach socio-technical view allowed us to consider the context in which
InovWine was embedded and enhanced our business model understanding. The acquired
knowledge was decisive to scrutinize solutions proposed for the business model and allowed us to
support decision makers. Moreover, it enabled us to translate the outcomes of the business model
analysis into the high-level requirements of the InovWine information system. The
communication of the obtained outcomes to the development team was carried out when the
receptiveness of the actors to the provided value propositions was sufficiently positive to justify
their participation. The specified high-level requirements disclosed the business model to the
members of the development team and guided their work according to the actors’ interests and the
specificities of the conceived business model, which allowed them to construct a widely accepted

Chapter 6 – The roadmap to the BIZ2BIS proposal
198
prototype. The undisputable consensus around the deployed solution encouraged our belief that
the contextual analysis of a given business model can contribute to reduce fails in the
development of its underlying information system.
Throughout the project, when practitioners were asked to use BIZ2BIS artifacts, they were
able to understand and apply them without difficulties. The close collaboration we established
with practitioners enabled us to eliminate detected incoherencies in BIZ2BIS and tune its phases,
steps, and artifacts, as well as the sequence of their application. In chapter 7, we selected this
project due to its complexity and contributions to our research to illustrate the use of BIZ2BIS.
6.4 Retrospective look over the artifacts of BIZ2BIS
In the previous sections, we detailed how the insights gradually obtained throughout the
four cases allowed us to steadily improve BIZ2BIS. We described how its structure evolved,
discussed the establishment of its phases and steps, and defined procedures for its use. However,
we did not detail the evolution of the artifacts during the research (in particular the changes
carried out in their visual representation). We based this decision on two reasons. First, the
evolution of the artifacts is best perceived when these are comparatively shown along all cases
and not confined to details pertaining to each of them. Second, a detailed description of all the
adjustments and advances would be unfeasible due to the lack of space. To reveal the progress of
the artifacts, we succinctly present their initial, intermediate, and current versions. First, we will
focus on the ones that support Phase I.
We started by conceiving an artifact able to support the characterization of networked
business models. To define its scope, we searched for inspiration on the performed literature
review and tried to understand how the gathered knowledge could help us address the features of
the HowMuchIsIt business model. The adopted theoretical influences aided us to identify the
fields of the devised artifact, which we called “Networked business model description chart”. Its
draft version (on the left side of Figure 33) allowed us to describe the networked business model
in detail. However, we neglected the need to frame the adopted influences according to the level
of expertise of the analysts and practitioners that will use BIZ2BIS. For instance, we assigned to
some fields the name of the theoretical concepts that inspired them (e.g. from Structuration
Theory or ANT). To avoid this barrier, in the Online Journal case study, we established
connections between these concepts and the topics from the business model scenario that these
influences led us to address, which allowed us to show just the latter perspective to BIZ2BIS
users. The version of the artifact achieved in GreenHomes revealed itself suitable to our purposes
and to the needs and background of its users. Therefore, in InovWine it only underwent minor
adjustments. This project’s major contribution for the artifact was the creation of a basic version
control system for the data filled in, which covers the following fields: version number, author,
and the date of the last update. To document the evolution of the business model study, we
decided to extend the use of the version control system to all BIZ2BIS’ artifacts. Moreover, we
conceived a notation for textual charts that complements the version control. It visually

6.4 Retrospective look over the artifacts of BIZ2BIS
199
distinguishes old and new data, incorrect assumptions, and situations that may imply
modifications. We present the current version of the developed “Networked business model
description chart” on the right side of Figure 33. Our purpose with this figure is to show the
evolution of the topics addressed in the several versions of the developed artifacts.
HowMuchIsIt 2007
Online journal 2007
GreenHomes 2009
InovWine 2011
Figure 33: Evolution of the “Networked business model description chart”
The initial version of the “Actor description chart” was also mainly inspired by the
literature review (left side of Figure 34). However, our findings from its use in the HowMuchIsIt
case study led us to eliminate fields that proved to be dispensable (e.g., relevance of the actor) and
introduce others to improve the description of the actors’ involvement (e.g., relationships and
flows). The Online journal case study also provided analogous developments. The layout of the
“Actor description chart” is similar to the one of “Networked business model description chart”
and also achieved a stable version in the GreenHomes case. Both use the filling in notation
developed in the InovWine (right side of Figure 34). In the visual representation of this artifact,
we also assigned a higher relevance to the topics addressed than to their content.

Chapter 6 – The roadmap to the BIZ2BIS proposal
200
HowMuchIsIt 2007
Online journal 2007
GreenHomes 2009
InovWine 2011
Figure 34: Evolution of the “Actor description chart”
Knowing the importance of representing the existing business flows, we investigated
contributions that could aid us to characterize and depict the interactions among the actors. We
noticed that researchers tended to rely on diagrams inspired on graph notation and identified five
types of flows pointed out as relevant: material, information, financial, influence, and value
propositions. In HowMuchIsIt, we used this knowledge to develop our first “Flow diagram”, the
figure to the left in Figure 35 (upper part). Later, in the Online Journal case study, we decided to
add services that provide non-physical and material items in a type of flow that we called
“service”. We also realized the importance of taking into account other types of flows like
prestige and customer loyalty that, as well as influence, go beyond the benefits that are accounted
in traditional financial measures. We designated them by “intangible” flows. The “Flow diagram”
represents distinctly the different types of flows. Still in the Online Journal case study, we
changed the visual aspect of the actors in the “Flow diagram” (same strip, lower part) in an
attempt to show the gain and the effort associated with each business flow. However, the adoption
of this more complex notation hindered the reading and use of the diagram, which made us
abandon its use. During GreenHomes case study, we performed several attempts to develop more
comprehensive representations of the network interactions. We conceived a set of new artifacts to
depict flows among sub-networks, hierarchical dependencies, and actors involved in several
networks (second strip to the left in Figure 35). In InovWine, we perceived that these additional
diagrams did not bring additional benefits. Thus, we withdrew them and decided to explore
additional features of the already conceived artifacts to consider the mentioned topics. For
instance, we used the “Flow diagram” to depict sub-networks. In order to introduce in the diagram

6.4 Retrospective look over the artifacts of BIZ2BIS
201
the idea that each actor is a network, with its own context, we placed the actor inside an oval, and
within the same oval a circle that represents the internal network of that same actor. The oval
symbolizes the context of the actor (second strip to the right in Figure 35). It is also possible to
enrich this notation with extras. For instance, instead of placing a generic symbol of the actors in
the centre of the oval (we used a stick figure), BIZ2BIS’ users can insert pictures (e.g., an
organization chart) or textual descriptions concerning their relevant characteristics. To easily and
quickly expose the interactions and the exchanged values among the actors, avoiding the effort of
following the arrows in the “Flow diagram”, we also decided to provide an alternative
representation of this diagram: the “Flow matrix” (first figure to the right in Figure 35). It
condenses in the intersection space between one actor (in one row) and the remaining ones (in the
columns) the business flows that result from their relationships.

Chapter 6 – The roadmap to the BIZ2BIS proposal
202
HowMuchIsIt 2007
Online journal 2007
GreenHomes 2009
InovWine 2011
Figure 35: Evolution of the “Flow diagram”

6.4 Retrospective look over the artifacts of BIZ2BIS
203
We will now discuss the artifacts developed to support Phase II. In HowMuchIsIt case study,
we used ANT’s four phases as a guideline to understand how the actors could contribute to the
aims of the networked business model. Then, based on the obtained knowledge, they also inspired
us to conceive a negotiation mechanism that could encourage the participation of the ones
involved. At the time, we used a textual description to cover relevant features suggested by ANT,
as we show on the left side of Figure 36. However, when adapting ANT’s concepts to the context
of a business model study, we realized the difficulties that the future users of BIZ2BIS would face
if our approach would require them to apply the same procedure. Most of them are not familiar
with these concepts, do not know how they should be employed, and are not available for
acquiring this type of knowledge. Furthermore, it would be extremely difficult to assure that they
will be able to correctly translate ANT’s concepts to their own business model context. To make
BIZ2BIS independent from the adopted theoretical contributions and the analysts’ capacities, we
have toned down the visibility of these aspects. We embedded them in the artifacts that support
the negotiations among the actors and in the outlined plan developed for the approach. The first
artifact we envisioned with this purpose was the “Common goal diagram”. Its appearance did not
undergo many changes from the Online Journal case study onwards. On the right side of Figure
36, we present the one developed for the InovWine case. It shows how the proponents of the
business model idealized the participation of the involved actors taking into account their
individual interests, but it does not reveal details on ANT’ problematization, interessement, and
enrolment.
HowMuchIsIt 2007
Online journal 2007
GreenHomes 2009
InovWine 2011
Figure 36: Evolution of the “Common goal diagram”

Chapter 6 – The roadmap to the BIZ2BIS proposal
204
To identify actors with common interests and explore future collaborations, we began to
sketch the “Actors/Goals affinity chart” in the Online Journal case study. Initially, the chart was
similar to a “pie chart”. Each slice stood for one goal of the actors in the business model along
with the ones that aspired to accomplish it, in order to disclose mutual expectations (left side of
Figure 37). In GreenHomes, due to the amount of involved data, it became unmanageable to
represent the chart in that format, thus we started to adopt a tabular representation (middle strip in
Figure 37). In InovWine we only retouched minor elements of the chart. We decided to count both
the number of goals per actor, and the number of actors who shared each goal. For readability,
analysts can highlight actors with more goals and the most shared goals (right side of Figure 37).
HowMuchIsIt 2007
Online journal 2007
GreenHomes 2009
InovWine 2011
Figure 37: Evolution of the “Actors/Goals affinity chart”
The “Negotiation diagram”, was the one that underwent the most significant amendments
from the conceived artifacts. In HowMuchIsIt, we realized that we were not obtaining indications
on how the actors could be encouraged to participate or maintain their presence in the business
model. To meet this requirement and discover how the interactions of the actors could articulate in
the best way, in the Online Journal case study, we created our first version of the diagram (left
side, in Figure 38). We used it to analyze the goals specified in the “Common goal diagram”. For
each of them, we identified the involved actors, their motivations (M), the activities that
contributed to their accomplishment (A), and the objective(s) supported by the goal under
observation (O). However, we realized that this procedure was too extensive, laborious, and that it
was complex to devise concrete implications for the achieved results. It was necessary to simplify.
Therefore, we started to apply the diagram only to goals that could compromise the business

6.4 Retrospective look over the artifacts of BIZ2BIS
205
model. Moreover, we realized it was unnecessary to point out the motivation of each actor, since
this topic was already addressed in the “Actor description chart”. We also noted that we were not
developing mechanisms to detect if the balance between the gain and the effort for the goals under
analysis (the critical ones) was positive for the involved actors. To meet this requirement, in
GreenHomes, we introduced several changes in the “Negotiation diagram” (in the middle of
Figure 38). At the bottom, we placed the actors and the activities that support the goal under
study, while in its upper part we depicted the gain that this goal provides to the benefits of others.
Gains and efforts were rated on a scale of {1,…, 5}. In the InovWine case (right side in Figure
38), we detected that the effort of the actor that owned the goal under study was being considered
two times. In addition to the effort that this actor had to carry out to contribute to the goal in
analysis, we were also considering this actor effort to support the goals positively influenced by
the one under analysis. To exclude this erroneous perception and solve this miscalculation, we
disregarded these values and removed the captions concerning that value from the upper part of
the diagram. To make it more readable, we introduced a small chart to summarize the efforts spent
and the gains obtained by each actor for the goal under study.

Chapter 6 – The roadmap to the BIZ2BIS proposal
206
HowMuchIsIt 2007
Online journal 2007
GreenHomes 2009
InovWine 2011
Figure 38: Evolution of the “Negotiation diagram”

6.4 Retrospective look over the artifacts of BIZ2BIS
207
We had already noticed in HowMuchIsIt, Online Journal, and GreenHomes case studies
that certain business model flows could compromise certain value propositions and cause the
collapse of the network. The same happened in the InovWine project. However, the availability of
the involved actors to discuss the flows in question and look for alternative solutions showed us
the importance of illustrating and transmitting dangerous dependencies caused by the flows at
risk. We exposed these threats in the “Dependency flow diagram” (right side of Figure 39), which
depicts problematic business flows, value propositions in jeopardy, as well as affected actors. The
artifact also details restrictions that influence the business model flows at risk in order to clarify
their context. They are inserted in a rectangle linked to each flow. The red “X” on the left side of
Figure 39 (as well as in the following figures) symbolizes the absence of this artifact in the cases
previous to InovWine.
HowMuchIsIt 2007
Online journal 2007
GreenHomes 2009
InovWine 2011
Figure 39: Evolution of the “Dependency diagram”
In the GreenHomes case study, we started to face some difficulties in depicting value
propositions using the “Flow diagram”, which led us to question the suitability of this
representation for this purpose. The InovWine case reinforced this idea, since it became clear that
some value propositions did not have an apparent origin or destiny (e.g., “Get prestige in the wine
industry”, and “Safeguard the Bairrada genetic heritage”). To address this problem and provide a
more reliable mechanism to support the identification of the value propositions, we introduced the
“Business Flows/Value propositions chart” (right side of Figure 40). The chart uses the
information gathered by BIZ2BIS to list the existing business flows (first column) and based on
their contribution to the business model (individually or arranged) aids analysts to identify the

Chapter 6 – The roadmap to the BIZ2BIS proposal
208
provided value propositions in a systematized way (first row). To enable the tracking of the flows
that contribute to, or influence, a given value proposition, we decided to place an “X” where they
intersect. To emphasize value propositions that depend on a higher number of flows, as well as on
the flows that support more value propositions, we also introduced fields to show these values in
the artifact. For readability, analysts can highlight relevant flows and value propositions. The
facility with which practitioners and the contacted experts related business flows and value
propositions also strengthened our decision. In addition, knowing the flows, it is easy to backtrack
and identify the activities that are behind it, which is fundamental to specify the high-level
requirement of the information system.
HowMuchIsIt 2007
Online journal 2007
GreenHomes 2009
InovWine 2011
Figure 40: Evolution of the “Business Flows/Value propositions chart”
To confirm if the solution reached for a networked business model meets the expectations
of the participating actors, we conceived the “Interview chart” in Phase III. When we developed its
first version in the HowMuchIsIt case study (illustrated on the left side of Figure 41), we had three
main aims: 1 - Identify the activities that contributed to each value proposition according to each
actor; 2 - Give them the chance to express their opinion about the gain obtained with the provided
value proposition and the effort spent to support it; and 3 - Point out the dependencies among
value propositions. However, when filling in the activities that contributed to the value
propositions, we perceived that this task was very laborious. Moreover, it was somewhat
redundant: the information on the performed activities had already been addressed in each actor’s

6.4 Retrospective look over the artifacts of BIZ2BIS
209
respective “Actor description chart”. It is undeniable that the actors have to take into account their
activities to be able to express their gains and efforts concerning each value proposition. However,
for this to happen, it is not necessary to require them to list all the activities related to each value
proposition. Actors can use the data in other artifacts to support their judgment, avoiding
unnecessary effort. In GreenHomes, the practitioners’ negative reaction towards the need to list
the activities reinforced our decision to disregard this component. In InovWine, the chart
underwent minor changes in order to maintain its appearance consistent with the remaining ones
and its use more expeditious. The middle strip in Figure 41 shows its current visual
representation. Throughout the case, we noticed that we were not giving due prominence to the
dependencies among value propositions pointed out by the actors. Therefore, we developed the
“Value proposition traceability diagram”, which visually represents the identified dependencies
based on the data filled in the “Interview chart”. If required, it can also show the balance between
the obtained gains and the performed efforts for each actor related to a certain critical value
proposition. However, the chart is more than an alternative representation of the data filled in the
“Interview chart”. Its broad scope details factors identified during the application of BIZ2BIS that
can constrain or potentiate each value proposition. We provide an example of this artifact on the
right side of Figure 41.

Chapter 6 – The roadmap to the BIZ2BIS proposal
210
HowMuchIsIt 2007
Online journal 2007
GreenHomes 2009
InovWine 2011
Figure 41: Evolution of the “Interview chart”
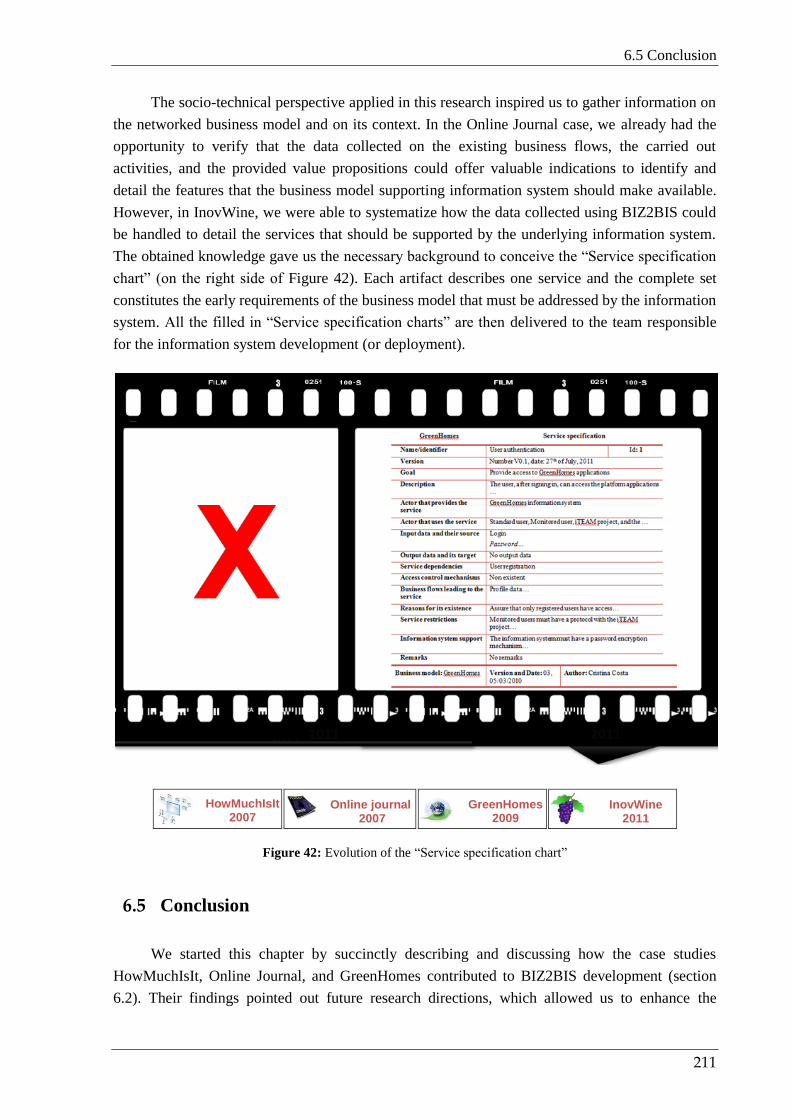
6.5 Conclusion
211
The socio-technical perspective applied in this research inspired us to gather information on
the networked business model and on its context. In the Online Journal case, we already had the
opportunity to verify that the data collected on the existing business flows, the carried out
activities, and the provided value propositions could offer valuable indications to identify and
detail the features that the business model supporting information system should make available.
However, in InovWine, we were able to systematize how the data collected using BIZ2BIS could
be handled to detail the services that should be supported by the underlying information system.
The obtained knowledge gave us the necessary background to conceive the “Service specification
chart” (on the right side of Figure 42). Each artifact describes one service and the complete set
constitutes the early requirements of the business model that must be addressed by the information
system. All the filled in “Service specification charts” are then delivered to the team responsible
for the information system development (or deployment).
HowMuchIsIt 2007
Online journal 2007
GreenHomes 2009
InovWine 2011
Figure 42: Evolution of the “Service specification chart”
6.5 Conclusion
We started this chapter by succinctly describing and discussing how the case studies
HowMuchIsIt, Online Journal, and GreenHomes contributed to BIZ2BIS development (section
6.2). Their findings pointed out future research directions, which allowed us to enhance the

Chapter 6 – The roadmap to the BIZ2BIS proposal
212
maturity of our proposal and tune its consecutive versions. Then, we had the opportunity to apply
our approach to the InovWine project. We resorted to action research, which allowed us to reflect
on relevant outcomes for the scientific domain and for the practitioners of the wine sector. The
complexity of InovWine (e.g., actors with conflicting interests, dependencies among actors, their
financial difficulties, and technological illiteracy) gave us the chance to fully explore the
BIZ2BIS’ features.
In the following chapter, we will exemplify how BIZ2BIS’ users can apply it in an intricate
real world scenario, underlying its major contributions in two fields: the business model domain
and the practitioners’ context of the situation in study. We selected InovWine to perform this
illustration, due to its completeness, complexity, and the close collaboration established with
practitioners.

213
Chapter 7
InovWine: an example of using
BIZ2BIS
7.1 Introduction
In Chapter 5, we described in detail how BIZ2BIS enables the discussion, design, and
evaluation of networked business models, as well as the specification of the high-level
requirements of their underlying information systems. In Chapter 6, we presented the roadmap to
BIZ2BIS, which lays out the contributions it received from HowMuchIsIt, Online journal, and
GreenHomes case studies, as well as from the InovWine action research project. In this chapter,
we will illustrate with the InovWine example how the future users of BIZ2BIS can apply its
general guidelines to a concrete scenario.
InovWine is a joint project between Portuguese actors from the wine industry and from the
scientific community. It aims to improve the wine quality and production in the Bairrada Region
through the development of new products and services. It is also expected that the project will
take full advantage of the natural resources of the Bairrada region, contribute to the protection of
the genetic heritage of its wine varieties, and support its economic and social development. We
dedicate the core of this chapter to show how we used BIZ2BIS to grasp the project context and
how its insights supported us in conceiving a resilient business model and specifying the high-
level requirements of its supporting information system. The outline seen in this chapter is just
one of the several possible arrangements, since one of BIZ2BIS’ characteristics is its capacity to
portray business models with different granularities and perspectives, according to its users’
preferences, needs, and practices. This particular viewpoint aims at giving a condensed and
understandable overview of the business model that will be implemented in the post-InovWine
project and how we achieved it. All the details about the conducted study and the resulting
documentation (e.g., hypothetic scenarios) can be found on the CD made available with this
dissertation. We also expect that this chapter can assist future users in the application of BIZ2BIS
to their own contexts.
We organized the chapter as follows: in section 7.2, we describe how we addressed the
InovWine project building upon BIZ2BIS’ guidelines. We present the initially proposed post-

Chapter 7 – InovWine: an example of using BIZ2BIS
214
project InovWine business model, compare it with the one in use prior to InovWine project, and
take into account the interests of the actors (section 7.2.1). Based on the gathered information, we
show how we searched for possible problems and pointed out alternative solutions (section 7.2.2).
Next, we present the updated version of the conceived business model and list the value
propositions made available (from section 7.2.3 to 7.2.10). After evaluating it according to the
actors’ perspectives (section 7.2.11), we described how we used the acquired knowledge on the
business model and its context to specify the high-level requirements of its underlying
information system (section 7.2.12). The last section draws conclusions from the study.
At the end of the chapter, the reader should be able to:
1. Verify how BIZ2BIS answered the needs of the InovWine project, promoted the
collaboration with practitioners, and supported interventions carried out in the field;
2. Realize how we applied BIZ2BIS’ general guidelines to the specific characteristics
of a concrete project and how the actors involved in InovWine used insights
provided by the approach to guide their decisions;
3. Ascertain how we used the outcomes obtained from the business model discussion,
design, and evaluation to specify the high-level requirements of the information
system supporting InovWine.
7.2 An action research study: using BIZ2BIS in the InovWine project
The InovWine project aims to develop a system able to monitor the vineyards and generate
actionable advice that can assist producers on activities as diverse as pruning, harvesting, and
picking. The system is feed with data entered by the producers via smartphones or a web
application, concerning the vineyards care or detected occurrences (e.g., plagues). It also uses data
from previous campaigns and data captured by wireless nodes of sensors placed in the vineyards,
as well as RFIDS. Together, the obtained mix of historical, real-time, abiotc, and biotic data has
the potential to trigger a customized guidance that can support producers in their decision of
anticipating, postponing, or cancelling certain actions (e.g., phytosanitary treatments or watering).
Our task was to evaluate the business model envisioned in the proposal submitted to NSRF
and, if necessary, make it evolve to create favorable conditions to the success of the post-
InovWine project. Moreover, we were responsible for deriving the high-level requirements of the
information system to be deployed during the 3 years in which the project was funded. The
assignment we were given showed itself suitable for using BIZ2BIS. We noticed the difficulties
the actors involved in the project had been facing in representing the project business model. The
textual description of the InovWine proposal submitted to NSRF had been the main tool of
analysis at their disposal. However, this document was not able to capture the complexity of the
business model envisioned for the post-InovWine project. It did not detail the role of each actor,
their contribution and exertion, as well as the entanglement of relationships. In addition, it did not
provide indications to explore the actors’ shared aims and the alignment of their interests.

7.2 An action research study: using BIZ2BIS in the InovWine project
215
BIZ2BIS met these needs. We used it to promote the collaboration with practitioners, encourage
the business model discussion, facilitate the detection of possible flaws, and endorse the proposal
and evaluation of alternative solutions. In addition, BIZ2BIS’ socio-technical view enabled us to
consider the specific characteristics and needs of the Bairrada region and of the wine sector in
Portugal (e.g., lack of financial resources, the resistance of some producers to change, their
technological illiteracy, their view of the vineyard activities as a hobby). Below, we will detail
how we used BIZ2BIS to appraise the InovWine business model.
7.2.1 Phase I, Step I.a, I.b, I.c - Characterization of the submitted proposal
We initiated our participation in this venture by applying Phase I, Step I.a “Exploration of the
business model” to the proposal submitted to NSRF. We sought in the available documentation
aspects that we could use to clarify the fields covered in the “Networked business model
description chart” that we present in Table 20. To complement it, we developed efforts to enhance
our knowledge on the wine sector, in particular in the Bairrada Region. We attended colloquia and
consulted several sources such as magazines, Internet resources, books, and technical reports. Our
improved sensitivity of the sector helped us to understand factors pertinent to the wine production
such as vineyard treatments, plagues, diseases, grapevine varieties, and yeasts. We used the
collected information (in collaboration with practitioners) to progressively detail the “Networked
business model description chart” (Table 20).
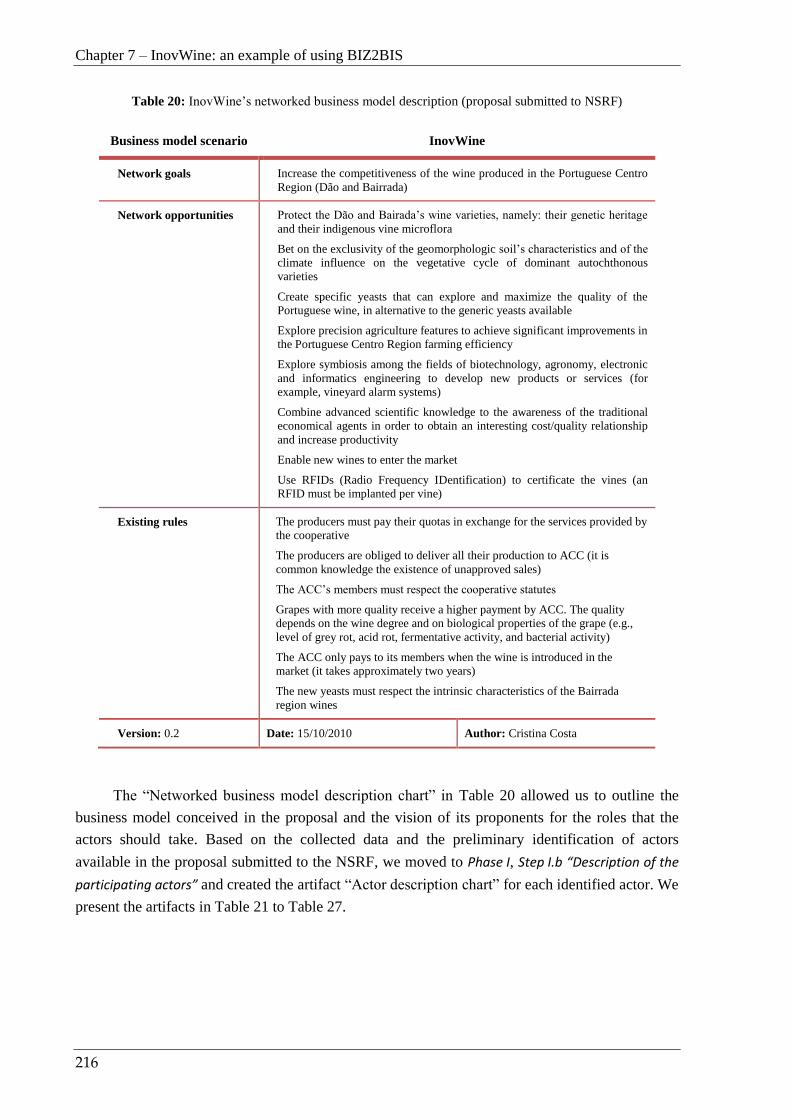
Chapter 7 – InovWine: an example of using BIZ2BIS
216
Table 20: InovWine’s networked business model description (proposal submitted to NSRF)
Business model scenario InovWine
Network goals Increase the competitiveness of the wine produced in the Portuguese Centro
Region (Dão and Bairrada)
Network opportunities
Protect the Dão and Bairada’s wine varieties, namely: their genetic heritage
and their indigenous vine microflora
Bet on the exclusivity of the geomorphologic soil’s characteristics and of the
climate influence on the vegetative cycle of dominant autochthonous
varieties
Create specific yeasts that can explore and maximize the quality of the
Portuguese wine, in alternative to the generic yeasts available
Explore precision agriculture features to achieve significant improvements in
the Portuguese Centro Region farming efficiency
Explore symbiosis among the fields of biotechnology, agronomy, electronic
and informatics engineering to develop new products or services (for
example, vineyard alarm systems)
Combine advanced scientific knowledge to the awareness of the traditional
economical agents in order to obtain an interesting cost/quality relationship
and increase productivity
Enable new wines to enter the market
Use RFIDs (Radio Frequency IDentification) to certificate the vines (an
RFID must be implanted per vine)
Existing rules
The producers must pay their quotas in exchange for the services provided by
the cooperative
The producers are obliged to deliver all their production to ACC (it is
common knowledge the existence of unapproved sales)
The ACC’s members must respect the cooperative statutes
Grapes with more quality receive a higher payment by ACC. The quality
depends on the wine degree and on biological properties of the grape (e.g.,
level of grey rot, acid rot, fermentative activity, and bacterial activity)
The ACC only pays to its members when the wine is introduced in the
market (it takes approximately two years)
The new yeasts must respect the intrinsic characteristics of the Bairrada
region wines
Version: 0.2 Date: 15/10/2010 Author: Cristina Costa
The “Networked business model description chart” in Table 20 allowed us to outline the
business model conceived in the proposal and the vision of its proponents for the roles that the
actors should take. Based on the collected data and the preliminary identification of actors
available in the proposal submitted to the NSRF, we moved to Phase I, Step I.b “Description of the
participating actors” and created the artifact “Actor description chart” for each identified actor. We
present the artifacts in Table 21 to Table 27.

7.2 An action research study: using BIZ2BIS in the InovWine project
217
Table 21: Associação Cooperativa de Cantanhede description (proposal submitted to NSRF)
Actor’s description Associação cooperativa de Cantanhede (ACC)
Network interactions Producers, Biocant, IPN
Relationships and flows Receive grapes from the producers
Pay grapes to producers
Place the wine in the market
Receive clients’ payments
Receive services from the InovWine information system (monitoring and
automatic alarms)
Receive services from Biocant (molecular characterization kit,
microorganism identification test kit, identification of new yeasts)
Business model: InovWine Version and Date: 0.2, 15/10/2010 Author: Cristina Costa
Table 22: Producers description (proposal submitted to NSRF)
Actor’s description Producers
Network interactions ACC, Biocant, IPN, Viveiros Vitivinícolas Pierre Boyer (VVPB)
Relationships and flows Insert information about each grapevine in the InovWine system to create a
historical vine data set that can be used by the ACC and other producers
Insert information about the vineyard in the InovWine system to create a
historical data set that can be used by the ACC and other producers
Receive information and services from the ACC
Deliver grapes to ACC
Make use of services from the InovWine system
Buy services from IPN and Biocant
Purchase vines implanted with RFID technology to VVPB
Business model: InovWine Version and Date: 0.3, 15/10/2010 Author: Cristina Costa
Table 23: Biocant description (proposal submitted to NSRF)
Actor’s description Biocant
Network interactions Producers, ACC
Relationships and flows Sell molecular characterization kits (producers, ACC, and nurseries)
Sell microorganism identification test kits (producers, ACC, and nurseries)
Business model: InovWine Version and Date: 0.2, 15/10/2010 Author: Cristina Costa

Chapter 7 – InovWine: an example of using BIZ2BIS
218
Table 24: IPN - LIS description (proposal submitted to NSRF)
Actor’s description IPN – LIS
Network interactions Producers, ACC
Relationships and flows Sell add-ons to the InovWine information system (producers and ACC)
Business model: InovWine Version and Date: 0.2, 15/10/2010 Author: Cristina Costa
Table 25: IPN - LAS description (proposal submitted to NSRF)
Actor’s description IPN – LAS
Network interactions Producers, ACC
Relationships and flows Sell wireless sensor networks and RFID technology (producers, and the
ACC)
Business model: InovWine Version and Date: 0.2, 15/10/2010 Author: Cristina Costa
Table 26: VVPB description (proposal submitted to NSRF)
Actor’s description Viveiros Vitivinícolas Pierre Boyer (VVPB)
Network interactions Producers
Relationships and flows Sell grapevines to producers
Provide services to aid producers in the selection of suitable grape varieties
Offer after sale support to clarify how the grapevines should be treated
Business model: InovWine Version and Date: 0.2, 15/10/2010 Author: Cristina Costa
Table 27: IPN – InovWine application description (proposal submitted to NSRF)
Actor’s description Inovwine system
Network interactions ACC , Producers, IPN, Biocant
Relationships and flows Receive the data of each grapevine from the producer
Receive vineyard data from the producer
Receive data from the wireless sensor networks and from the RFIDs
Provide a service of monitoring and automatic alarms for the vineyard
(producers, and the ACC)
Provide access to the grapevines and vineyards historical data set (producers,
and the ACC)
Receive data from the molecular characterization kits (producers, and the
nurseries)
Receive data from microorganism identification test kits (ACC, producers,
and nurseries)
Business model: InovWine Version and Date: 0.2, 15/10/2010 Author: Cristina Costa
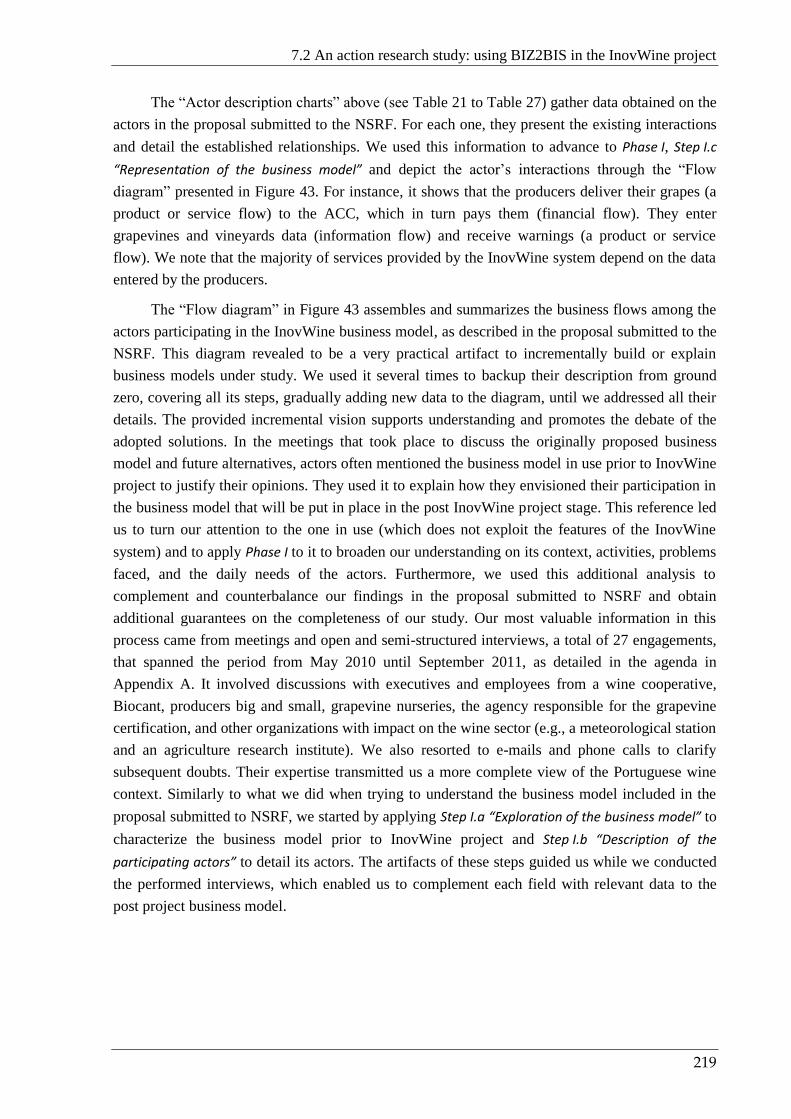
7.2 An action research study: using BIZ2BIS in the InovWine project
219
The “Actor description charts” above (see Table 21 to Table 27) gather data obtained on the
actors in the proposal submitted to the NSRF. For each one, they present the existing interactions
and detail the established relationships. We used this information to advance to Phase I, Step I.c
“Representation of the business model” and depict the actor’s interactions through the “Flow
diagram” presented in Figure 43. For instance, it shows that the producers deliver their grapes (a
product or service flow) to the ACC, which in turn pays them (financial flow). They enter
grapevines and vineyards data (information flow) and receive warnings (a product or service
flow). We note that the majority of services provided by the InovWine system depend on the data
entered by the producers.
The “Flow diagram” in Figure 43 assembles and summarizes the business flows among the
actors participating in the InovWine business model, as described in the proposal submitted to the
NSRF. This diagram revealed to be a very practical artifact to incrementally build or explain
business models under study. We used it several times to backup their description from ground
zero, covering all its steps, gradually adding new data to the diagram, until we addressed all their
details. The provided incremental vision supports understanding and promotes the debate of the
adopted solutions. In the meetings that took place to discuss the originally proposed business
model and future alternatives, actors often mentioned the business model in use prior to InovWine
project to justify their opinions. They used it to explain how they envisioned their participation in
the business model that will be put in place in the post InovWine project stage. This reference led
us to turn our attention to the one in use (which does not exploit the features of the InovWine
system) and to apply Phase I to it to broaden our understanding on its context, activities, problems
faced, and the daily needs of the actors. Furthermore, we used this additional analysis to
complement and counterbalance our findings in the proposal submitted to NSRF and obtain
additional guarantees on the completeness of our study. Our most valuable information in this
process came from meetings and open and semi-structured interviews, a total of 27 engagements,
that spanned the period from May 2010 until September 2011, as detailed in the agenda in
Appendix A. It involved discussions with executives and employees from a wine cooperative,
Biocant, producers big and small, grapevine nurseries, the agency responsible for the grapevine
certification, and other organizations with impact on the wine sector (e.g., a meteorological station
and an agriculture research institute). We also resorted to e-mails and phone calls to clarify
subsequent doubts. Their expertise transmitted us a more complete view of the Portuguese wine
context. Similarly to what we did when trying to understand the business model included in the
proposal submitted to NSRF, we started by applying Step I.a “Exploration of the business model” to
characterize the business model prior to InovWine project and Step I.b “Description of the
participating actors” to detail its actors. The artifacts of these steps guided us while we conducted
the performed interviews, which enabled us to complement each field with relevant data to the
post project business model.

Chapter 7 – InovWine: an example of using BIZ2BIS
220
vineyards and grapevines
historical data
(biotic and abiotic factors)
grapes
grapes payment
fee payment
grapevines and vineyards data
(treatments,
annual production, plagues,..)
warning services (e.g., irrigation, treatments)
ensure the material certification
vineyard statistical analysis
(e.g., per grapevine, by variety)
warning services (e.g., irrigation, treatments)
ensure the material certification
vineyard statistical analysis
(e.g., per grapevine, by variety)
vineyards and grapevines
historical data
(biotic and abiotic factors)
data about the plants genetics
data about harmful microorganisms
(e.g., sensitivity to fungicides)
vineyards and grapevines
historical data
(biotic and abiotic factors)
vineyards and grapevines
historical data
(biotic and abiotic factors)
wine microorganism identification kit
new yeasts
molecular characterization kit
microorgabism identification kit
certification process based
on molecular characterization
sale of certified
grapevines with RFIDs
grapevine
payment
ACC
InovWine application
sensor data
wireless sensor network
IPN
Producers
VVPB
Biocant
RFID system
RFID data
supply and maintenance of the
InovWine system
Legend:
Network actor Group of actors with
common features
financial flow
intangible flow
information flow
product or service flow
Business model scenario: InovWine Artefact: Flow diagram Version/Date: 0.2, 07/01/2011 Author: Cristina Costa
Name Name
Figure 43: Flow diagram of the InovWine business model proposed in the NSRF submission
7.2 An action research study: using BIZ2BIS in the InovWine project
221
We began by interviewing the actors identified in the NSRF proposal. Since actors cannot
be viewed in isolation, we asked them to disclose their ties and tracked them (following the
guidelines presented in Chapter 5). When new actors were pointed out, we also questioned them
about their own connections. We recursively followed them, which enabled us to perceive their
context and time frame, as well as how their interests could be articulated to achieve a common
solution. We stopped following the actor links when the new identified actors had a residual
influence on the business model context. We will mention the exposed actors, whenever they are
relevant to the analysis of the post project business model. Next, we will briefly describe the
information obtained in meetings and interviews that proved to be extremely important to broaden
our understanding.
In our first meeting with the majority of the actors involved in the project (on the 26th of
May 2010 - Appendix A), we were informed that the actors representing the interests of Dão
Region had abandoned the project. From this moment on, we focused the business model goals
exclusively on the Bairrada Region. Then, on the 2nd of July 2010, we held an interview with the
cooperative representatives (Appendix A). This allowed us to detect a new actor who had not been
previously identified: the Meteorological Station of Bairrada. This actor possesses a significant
impact in the business model prior to InovWine project, since it provides a paid warning service
to the ACC and to its members. The service is based on the weather and on the vineyard
conditions, describes the activities that must be carried out by the producers in the treatments of
their lands, and its warnings are printed and published on the Internet approximately every three
months. However, we noticed that they were not specific to the vineyards, and were relatively
superficial – only having two to three pages. Given that not all producers have adhered to the
service, the cooperative tries to broadcast the warnings as much as possible among its members
(around 800 growers), in person or by phone. However, this task is not always easy, due to the
number of people involved, the costs implicated, and the lack of technological skills of the
producers. According to the ACC, the difficulty in reaching them is one of the handicaps that
must be overcome with InovWine.
In conjunction with the cooperative, we also discussed the importance of identifying the
environmental factors with influence on the vineyard productivity, in order to select and acquire
the appropriate sensors for their measurement. Furthermore, we underlined the importance of
detecting the critical points as to where the sensor nodes should be installed in the pilot study
vineyard. We requested to the cooperative, in collaboration with the producers, to reach a first
draft of relevant environmental factors and of the critical points. Due to regular occurrence of
thefts in the region, we were advised to install the electronic devices discretely in the vineyards. In
that same meeting, we simultaneously examined how the cooperative estimates the amount to pay
to the producers for their grapes. The cooperative representatives present in the interview
explained to us that the value depends on the grape quality and that the cooperative calculates it
based on a set of pre-established parameters, such as the wine alcoholic degree and biological
properties of the grape (e.g. grey rot, acid rot, fermentative activity, and bacterial activity). The
cooperative uses a machine called wine scan (set up according to their parameters) to perform the
accurate calculation. This value materializes the quality assigned to the grapes by the ACC and is
Chapter 7 – InovWine: an example of using BIZ2BIS
222
usually paid two years after its delivery. According to the cooperative statutes, its members must
deliver to it all their production. It also became clear at this meeting that one of the Cooperative’s
greatest interests in InovWine is to discover new yeasts able to potentiate the characteristics of the
Bairrada wine. On the 7th of September 2010, we visited the cooperative during the harvest period.
One of its employees explained us the steps carried out by the producers to deliver their grapes
and we observed all the circuit they performed, including how the wine scan collects a sample
from each producer and assigns it a value. It was evident the importance that the grape quality has
to the producers. The value calculated by the wine scan is the culmination of a year’s work and
allows them to perceive the gross profit obtained with their vineyards.
The interview with Viveiros Vitivinícolas Pierre Boyer (VVPB), on the 13th of September
(Appendix A) enlightened us on the procedures in the grapevine nurseries. One member of the
nursery staff described how they treated the grapevines since their acquisition (when they are
merely sticks) up until they are sold to the producers, covering issues like their grafting, their time
in stratification chambers, and their plantation. They also told us that the price of grapevines in the
nurseries were around 0.80 euros. Taking this value into account, the implant of the RFID system
in the nurseries would increase the cost of the grapevines in roughly 50%. This discovery has
become even more relevant when they told us that 50% of the nursery production is usually lost.
In this interview, we also became aware that the nurseries only plant certified grapevines to assure
the origin of their variety and their phytosanitary conditions. According to VVPB, there are two
types of certification: certified and standard. In the former, the plant material comes from the
grapevines’ original material maintained by the Estação Vitivinícola Nacional in its fields. The
propagative material is homologated at the Instituto Superior de Agronomia, in order to be sold to
producers that own initial vineyards. In these vineyards, the producers are obliged to use
production techniques that assure the quality of the approved material. In Portugal, they are the
nurseries’ largest source of supply. In the latter type of certification, the plant material has its
origin in producers that have obtained high quality grapevines, and that decided to certify them to
obtain authorization to their commercialization (also at Instituto Superior de Agronomia). The
cost of certification is equal in both cases.
The VVPB interview is a perfect example of how BIZ2BIS’ users can enhance their
perception of the network by following the actors and the indications that emerge during
discussions. For instance, we used the gathered data to identify new actors. We already mentioned
two of them in the previous paragraph: the Instituto Superior de Agronomia (approves the
vegetative material that will be used to plant certified vineyards of initial material) and the
producer of initial material (uses the approved material to plant their own vineyards to produce
plants that will be sold to the grapevine nurseries). Others were: Viticert, which certifies the
material produced in the grapevine nurseries (its work covers around 90% of existing grapevine
nurseries - the majority situated in the Portuguese Western region), and the Direcção Regional de
Agricultura e Pescas that controls 5% of the work developed by Viticert (based on a random
sample). It is also worth mentioning that the Portuguese Government, supported by European
funds, has provided grants, for the time being, to plant certified grapevines, fostering this sector.
Viticert also revealed itself a valuable contribution to the project and opened new perspectives to
7.2 An action research study: using BIZ2BIS in the InovWine project
223
the InovWine business model study. In a meeting with this certification agency, on the 25th of
November 2010, one of its members shed light on the certification mechanisms, on its
bureaucratic and legal components, and on how InovWine solution could complement traditional
certification activities. Furthermore, by following the activities of this actor and with its
collaboration, we were able to establish contacts with influent researchers in the wine domain,
large producers, and nurseries (meetings that took place between December 2010 and January
2011).
We used the information gathered in the interviews above to complement the fields of
Step I.a and Step I.b supporting artifacts with data relevant to the post-project. Since it was not our
aim to characterize all the details of the business model in use prior to InovWine Project, we did
not apply Step I.a and Step I.b to it. However, to give the chance to discuss this business model
whenever necessary in an expeditious way, we used the gathered knowledge to apply BIZ2BIS’
Phase I, Step I.c “Representation of the business model” and used the “Flow diagram” presented in
Figure 44 to depict it. Since this version of the business model is independent from the InovWine
application and will not change much throughout this study, we also created Step I.c “Flow
matrix” (Matrix 2) to enhance the readability of the information available.

Chapter 7 – InovWine: an example of using BIZ2BIS
224
grapes
influence
vineyard current treatment warnings
(based on Estação de Avisos da Bairrada)
grapes payment (after selling the wine)
fee payment
wine
wine payment
sale of certified
vegetative materialvegetative material
payment
certification of the
vegetative material
certification payment
vineyard treatment warnings
vineyard treatment warnings
initial material initial material payment
certification of the
produced initial material
certification of the initial material
payment of the
certification process
influence
influence
subsidies for acquisition
of certified grapevines
quality assurance of the
grapevine variety
certification payment
influence
Meteorological Station of Bairrada
Instituto Superior de Agronomia
Viticert
ACC
Producers of initial material
State
Nurseries
Producers
Customers
influence
warnings payment
warnings paymentadvise on the choice
of the variety
Legend:
Network actor Group of actors with
common features
financial flow
intangible flow
information flow
product or service flow
Business model scenario: InovWine Artefact: Flow diagram Version/Date: 0.3, 06/01/2011 Author: Cristina Costa
Name Name
Figure 44: Flow diagram of the cooperative business model prior to InovWine Project

7.2 An action research study: using BIZ2BIS in the InovWine project
225
Matrix 2: Flow matrix of the cooperative business model prior to InovWine Project
ACC NurseriesProducers of
initial material
Meteorological
Station of
Bairrada
Viticert Producers Customers State / QREN
Instituto
Superior de
Agronomia
ACC- warnings
payment
- influence
- grapes payment
(after selling the
wine)
- vineyard
-wine
Nurseries- initial material
payment
- certification
payment
- sale of certified
vegetative
material
Producers of
initial material- initial material
- certification
payment
- payment of the
certification
process
Meteorological
Station of
Bairrada
- vineyard
treatment
warnings
- advise the
producers
on the choice of
the variety
Viticert
- influence
- certification of
the vegetative
material
- influence
- certification of
the produced
initial material
Producers- fee payment
- grapes
- vegetative
material
payment
- warnings
payment
- quality
assurance of the
grapevine variety
Customers - wine payment
State / QREN
- influence
- subsidies for
acquisition of
certified
grapevinesInstituto
Superior de
Agronomia
- Influence
- certification of
the initial
material
Value
propositions
ACTOR - TARGET
AC
TOR
- S
OU
RC
E
Business model: InovWine Author: Cristina CostaVersion and Date: 0.1, 08/01/2011
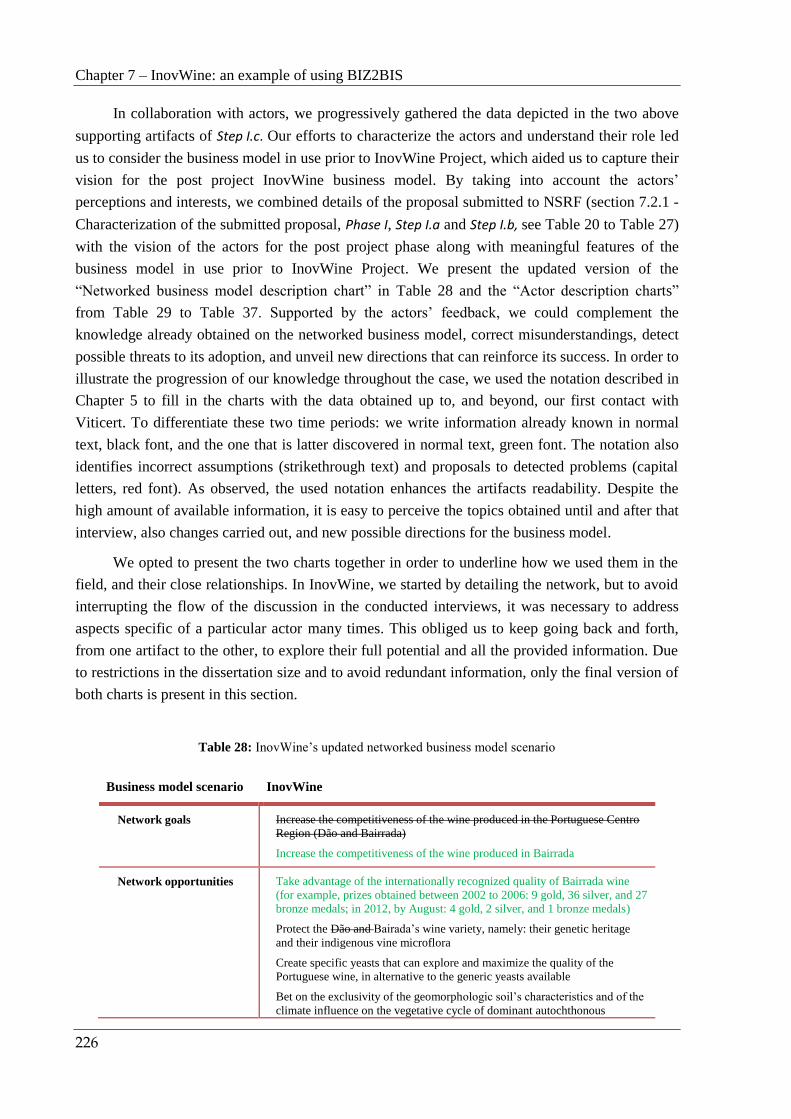
Chapter 7 – InovWine: an example of using BIZ2BIS
226
In collaboration with actors, we progressively gathered the data depicted in the two above
supporting artifacts of Step I.c. Our efforts to characterize the actors and understand their role led
us to consider the business model in use prior to InovWine Project, which aided us to capture their
vision for the post project InovWine business model. By taking into account the actors’
perceptions and interests, we combined details of the proposal submitted to NSRF (section 7.2.1 -
Characterization of the submitted proposal, Phase I, Step I.a and Step I.b, see Table 20 to Table 27)
with the vision of the actors for the post project phase along with meaningful features of the
business model in use prior to InovWine Project. We present the updated version of the
“Networked business model description chart” in Table 28 and the “Actor description charts”
from Table 29 to Table 37. Supported by the actors’ feedback, we could complement the
knowledge already obtained on the networked business model, correct misunderstandings, detect
possible threats to its adoption, and unveil new directions that can reinforce its success. In order to
illustrate the progression of our knowledge throughout the case, we used the notation described in
Chapter 5 to fill in the charts with the data obtained up to, and beyond, our first contact with
Viticert. To differentiate these two time periods: we write information already known in normal
text, black font, and the one that is latter discovered in normal text, green font. The notation also
identifies incorrect assumptions (strikethrough text) and proposals to detected problems (capital
letters, red font). As observed, the used notation enhances the artifacts readability. Despite the
high amount of available information, it is easy to perceive the topics obtained until and after that
interview, also changes carried out, and new possible directions for the business model.
We opted to present the two charts together in order to underline how we used them in the
field, and their close relationships. In InovWine, we started by detailing the network, but to avoid
interrupting the flow of the discussion in the conducted interviews, it was necessary to address
aspects specific of a particular actor many times. This obliged us to keep going back and forth,
from one artifact to the other, to explore their full potential and all the provided information. Due
to restrictions in the dissertation size and to avoid redundant information, only the final version of
both charts is present in this section.
Table 28: InovWine’s updated networked business model scenario
Business model scenario InovWine
Network goals Increase the competitiveness of the wine produced in the Portuguese Centro
Region (Dão and Bairrada)
Increase the competitiveness of the wine produced in Bairrada
Network opportunities
Take advantage of the internationally recognized quality of Bairrada wine
(for example, prizes obtained between 2002 to 2006: 9 gold, 36 silver, and 27
bronze medals; in 2012, by August: 4 gold, 2 silver, and 1 bronze medals)
Protect the Dão and Bairada’s wine variety, namely: their genetic heritage
and their indigenous vine microflora
Create specific yeasts that can explore and maximize the quality of the
Portuguese wine, in alternative to the generic yeasts available
Bet on the exclusivity of the geomorphologic soil’s characteristics and of the
climate influence on the vegetative cycle of dominant autochthonous
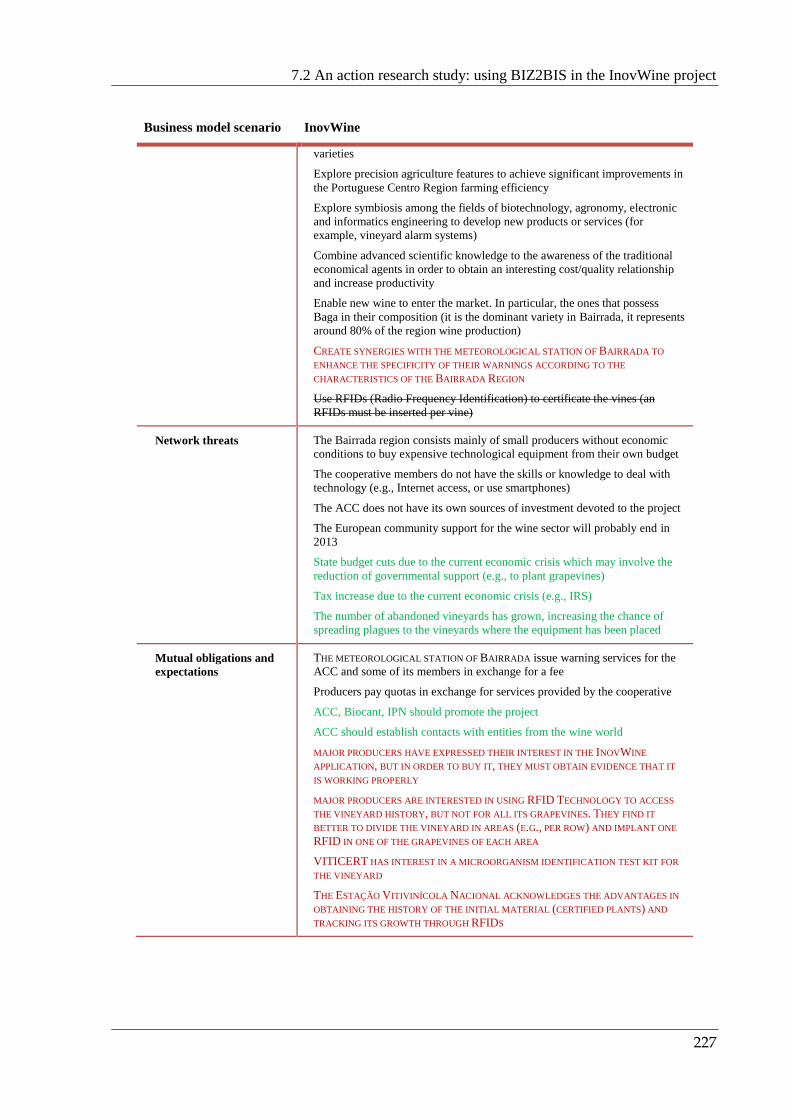
7.2 An action research study: using BIZ2BIS in the InovWine project
227
Business model scenario InovWine
varieties
Explore precision agriculture features to achieve significant improvements in
the Portuguese Centro Region farming efficiency
Explore symbiosis among the fields of biotechnology, agronomy, electronic
and informatics engineering to develop new products or services (for
example, vineyard alarm systems)
Combine advanced scientific knowledge to the awareness of the traditional
economical agents in order to obtain an interesting cost/quality relationship
and increase productivity
Enable new wine to enter the market. In particular, the ones that possess
Baga in their composition (it is the dominant variety in Bairrada, it represents
around 80% of the region wine production)
CREATE SYNERGIES WITH THE METEOROLOGICAL STATION OF BAIRRADA TO
ENHANCE THE SPECIFICITY OF THEIR WARNINGS ACCORDING TO THE
CHARACTERISTICS OF THE BAIRRADA REGION
Use RFIDs (Radio Frequency Identification) to certificate the vines (an
RFIDs must be inserted per vine)
Network threats
The Bairrada region consists mainly of small producers without economic
conditions to buy expensive technological equipment from their own budget
The cooperative members do not have the skills or knowledge to deal with
technology (e.g., Internet access, or use smartphones)
The ACC does not have its own sources of investment devoted to the project
The European community support for the wine sector will probably end in
2013
State budget cuts due to the current economic crisis which may involve the
reduction of governmental support (e.g., to plant grapevines)
Tax increase due to the current economic crisis (e.g., IRS)
The number of abandoned vineyards has grown, increasing the chance of
spreading plagues to the vineyards where the equipment has been placed
Mutual obligations and
expectations
THE METEOROLOGICAL STATION OF BAIRRADA issue warning services for the
ACC and some of its members in exchange for a fee
Producers pay quotas in exchange for services provided by the cooperative
ACC, Biocant, IPN should promote the project
ACC should establish contacts with entities from the wine world
MAJOR PRODUCERS HAVE EXPRESSED THEIR INTEREST IN THE INOVWINE
APPLICATION, BUT IN ORDER TO BUY IT, THEY MUST OBTAIN EVIDENCE THAT IT
IS WORKING PROPERLY
MAJOR PRODUCERS ARE INTERESTED IN USING RFID TECHNOLOGY TO ACCESS
THE VINEYARD HISTORY, BUT NOT FOR ALL ITS GRAPEVINES. THEY FIND IT
BETTER TO DIVIDE THE VINEYARD IN AREAS (E.G., PER ROW) AND IMPLANT ONE
RFID IN ONE OF THE GRAPEVINES OF EACH AREA
VITICERT HAS INTEREST IN A MICROORGANISM IDENTIFICATION TEST KIT FOR
THE VINEYARD
THE ESTAÇÃO VITIVINÍCOLA NACIONAL ACKNOWLEDGES THE ADVANTAGES IN
OBTAINING THE HISTORY OF THE INITIAL MATERIAL (CERTIFIED PLANTS) AND
TRACKING ITS GROWTH THROUGH RFIDS

Chapter 7 – InovWine: an example of using BIZ2BIS
228
Business model scenario InovWine
Shared interpretations
and representations
The process of cultivation and treatment of the vineyards takes place over
several months (e.g., pruning is done in October, November; treatments
begin in April, the harvest is done in August and September)
The vineyard treatments are costly: from 700 to 1200 euros per hectare
The cooperative has approximately 800 members
The fields of the cooperative members are in its majority small
The wine certification processes: Denominação de Origem Controlada
(DOC) and Regional Beiras are carried out by the Comissão Vitivinícola da
Bairrada (it sells guarantee seals for the approved wines)
Small farmers have a very low investment capacity. It consists essentially in
state subsidies
The warning services provided by the Meteorological Station of Bairrada do
not always arrive in time to producers
METEOROLOGICAL STATION OF BAIRRADA HIRED COLLABORATORS THAT ON A
DAILY BASIS REPORT BY POST COMPLEMENTARY METEOROLOGICAL DATA FROM
SMALL STATIONS INSTALLED ON THEIR FIELDS
The cooperative has some difficulties in broadcasting the warnings to its
members that did not subscribe to the service provided by the meteorological
station. FOR INSTANCE, THE MAJORITY OF THE PRODUCERS DO NOT USE
INTERNET AND HAVE DIFFICULTY READING SMS (SHORT MESSAGE SERVICE)
The ACC has no way of ensuring that the vineyards of its associates are
certified
The yeasts presently used in wine production do not take into account the
intrinsic characteristics of the Bairrada Region. They are the result of a study
conducted in France
To identify the representative clone of a variety, 200 plants are marked in
Portugal. These plants are placed in an experimental field where aspects such
as degree, aroma and color are analyzed. Of these 200, one is selected and
three are homologated. From the latter 10 plants are obtained, which
constitute the initial grapevine plant-material collection
The initial collection is used for the establishment of new initial planting
vineyards (10 initial plants can give rise to 100 plants), which in turn produce
thousands of certified plants
The value of an initial vineyard plant is around 2 euros
The producer will be able to introduce data on the vineyard in the field
The initial grapevine collection and the initial planting vineyards are called
mother vineyards. From the moment the producers register these vineyards,
their sticks can be commercialized
The grapevine sticks are composed by several bud sticks (or scion) that once
united with the rootstock are called grafts
In November/December scions and rootstocks are chosen for the grapevine
nursery. The grafts are made in February/March and covered with paraffin.
After this, they go to a germination chamber (for 2 to 3 weeks, at a
temperature of 35 degrees, and 80% of humidity). The grafts go to the field
in May and remain there until November. They are planted in December
50% of the grapevine nursery production is lost
There are abiotic factors (e.g., type of soil and geographical location of the
vineyard) that influence the choice of the grapevine variety
The grapevine certification process assures the variety of the grapevines and
their phytosanitary conditions
There are two basic types of grapevine certification programs: certified and
standard. In the former the plant material comes from the grapevine’s
original material, which is analyzed by the INSTITUTO SUPERIOR DE

7.2 An action research study: using BIZ2BIS in the InovWine project
229
Business model scenario InovWine
AGRONOMIA in order to homologate them and validate their propagative
material. In the latter, the plant material has its origin in producers that have
obtained high quality grapevines and that decided to submit them for
evaluation (also at the INSTITUTO SUPERIOR DE AGRONOMIA) to obtain
authorization for its commercialization
The cost of both certifications is identical
The Baga variety has only standard certification (it has never been proposed
to homologation)
The activities of the grapevine nurseries are controlled by the DIRECÇÃO
GERAL DA AGRICULTURA. In Portugal’s West Region this task was assigned
to VITICERT
Certification costs are equal for all the nurseries
The price of a grapevine from the nursery is around 0.8 euros
The price of an RFID is approximately 0,4 euros
Wine producers only receive GOVERNMENT’s grants to plant certified
grapevines
In some old vineyards the grapevine variety is unknown
The grapevines identification is traditionally based on morphological
descriptors (ampelography). It compares shape and color of the grapevine
leaves, buds, and grapes
Expertise in grapevine ampelography is confined to a restricted number of
specialists. This number has suffered reductions due to the number of skilled
people who have reached retirement age
Within the same variety there are clones that behave distinctly, which makes
genotyping more difficult
Young plants are almost impossible to classify, because they still do not
exhibit the typical morphological features of adult plants
Simple sequence repeats (SSRs) or micro-satellites are DNA markers that
allow the creation of DNA profiles. These can be used in grapevine
identification, to determine parent–progeny relationships in grapes, trace
grapevines, and evaluate their genetic variability
SSRs do not explore mutations. They do not distinguish variants of the same
clone
SSRs have already been identified for all varieties, providing a common
platform of knowledge. The same is not true for Single Nucleotide
Polymorphism (SNPs)
SSRs are much more expensive and slower than SNPs
The high density of SNPs makes them valuable for genome mapping, in
particular, for the generation of ultrahigh-density genetic maps (3 SNPs for a
microsatellite)

Chapter 7 – InovWine: an example of using BIZ2BIS
230
Business model scenario InovWine
Existing rules
The electronic equipment must be discretely installed in the vineyards, in
order to avoid theft
The producers must pay their quotas in exchange for the services provided by
the cooperative
The producers are obliged to deliver all their production to ACC (it is
common knowledge the existence of unapproved sales)
The ACC’s members must respect the cooperative statutes
Grapes with more quality receive a higher payment by ACC. The quality
depends on the wine degree and on biological properties of the grape (e.g.,
level of grey rot, acid rot, fermentative activity, and bacterial activity)
The ACC only pays to its members when the wine is introduced in the
market (it takes approximately two years)
The new yeasts must respect the intrinsic characteristics of the Bairrada
region wines
The certified vineyards that were financed by the Portuguese State are
obliged to produce for at least 5 years
The inspection of base planting vineyards is made every 3 years
The inspection of the grapevine nursery plantations is made every 6 months
The grapevine nursery material is inspected in two phases: stick and plant
The grapevine certification process assigns a label to a group of plants. This
label follows a European standard and will not be replaced by other solution,
at least in the near future
A lost label cannot be replaced
The DIRECÇÃO REGIONAL THE AGRICULTURA E PESCAS controls 5% of the
work developed by VITICERT (based on a random choice)
The grapevine certification follows the decree 194/2006
Each set of grapevines in the nurseries has a five digit code that identifies the
material origin (the number of plants can vary by set)
Available
resources/actors
Certification process – Viticert
Knowledge about the wine industry – ACC
Resources to develop and commercialize new yeasts - ACC and Biocant
Technological systems or products developed during the project –
ACC/Biocant/IPN
DATABASE OF GRAPEVINE GENETIC INFORMATION AND INITIAL GRAPEVINE
PLANT COLLECTION – ESTAÇÃO VITIVINÍCOLA DA BAIRRADA
WARNINGS ABOUT THE TREATMENTS THAT SHOULD BE APPLIED IN THE
VINEYARD – METEOROLOGICAL STATION OF BAIRRADA
Institutional sanctions Impose the penalties specified in the ACC statutes upon members that have
deviated from the expected behavior
Version: 0.3 Date: 29/12/2010 Author: Cristina Costa
Our interaction and close collaboration with the actors allowed us to draw their points of
view, presented in Table 29 to Table 37, through the artifact “Actor description chart”. Capturing
their expectations is extremely important, since it provides us with further precision to check if
they will achieve their aims through the InovWine business model envisioned in the proposal

7.2 An action research study: using BIZ2BIS in the InovWine project
231
submitted to NSRF. All of the presented artifacts maintain the notation used above to fill in the
data. We will start by describing ACC (Table 29).
Table 29: Adega Cooperativa de Cantanhede updated description
Actor’s description Adega Cooperativa de Cantanhede
Network interactions Producers, Biocant, IPN, Meteorological Station of Bairrada
Relationships and flows Receive grapes from the producers
Pay grapes to producers
Place the wine in the market
Receive the payments of the clients
Receive services from the InovWine information services (monitoring and
automatic alarms)
Receive services from Biocant (molecular characterization kit,
microorganism identification test kit, identification of new yeasts)
Receive warnings from the Meteorological Station of Bairrada
Provide information (e.g., treatments to perform) and services to the
producers (e.g., produces the wine)
Roles Collect the producers grapes (the number of Kg delivered is estimated by
weighing the transport vehicle loaded and empty, and obtaining the
difference)
Assess the grape quality through the wine scan (an electronic device that
from a sample of the grape unveils its characteristics)
Assign the value to the grape (based on their quality) payable to the
producer. This is done at delivery
Select the vessel (1, 2, or 3) where the grapes should be treated
Advise the producers about the grapevines that suit each type of field
Analyze the vineyard behavior through sporadic visits
Provide information to producers (in person, by phone, by e-mail) to help
them in their decision making on vineyard treatments (e.g., pruning,
harvesting, fertilization)
Provide formation sessions to its members
Analyze historical data obtained through InovWine (e.g., the relationships
among grape variety/ type of soil/climate/sanitary factors)
Use the information obtained through InovWine to help producers in their
decisions (e.g., choice of proper varieties based on the vineyard and climate
characteristics, selection of more suitable treatments)
Create new wines based on InovWine findings (ways to improve grape
quality and identification of new yeasts)
Explore the viability of new yeasts
Promote the Bairrada wine and the Baga variety

Chapter 7 – InovWine: an example of using BIZ2BIS
232
Actor’s description Adega Cooperativa de Cantanhede
Goals Increase ACC’s competitiveness and market reputation (presently, it has a
quota of 2%)
Contribute to the image of Portugal as an exporting country
Contribute to Bairrada’s social and economic development (e.g., creation of
jobs)
Identify and market new yeasts
Promote the ACC’s wines through the InovWine project
Preserve the genetic heritage of the Bairrada’s vineyards
Modernize an industry that relies on traditional processes
Improve the final quality of the existing wines and promote the development
of new ones. There is a huge demand in the market for young wines.
However, the baga variety is not widely appreciated when used in young
wines. This variety needs to be made more attractive to the consumers of
younger wines
Identify the best grapevines to produce Bairrada wine
Improve the detection of microorganisms (vineyards and wine) in due time
Keep a monitoring and automatic alarm system for the vineyard that can be
used by its members. It regards biotoc and abiotic factors
Have a system for monitoring the grapevine life cycle. The insights obtained
can reveal new ways to explore Portuguese Centro Region’s conditions for
wine production
Business model: InovWine Version and Date: 0.3, 29/12/2010 Author: Cristina Costa

7.2 An action research study: using BIZ2BIS in the InovWine project
233
Table 30: Producers updated description
Actor’s description Producers
Network interactions ACC, Biocant, IPN, Vitivinícolas Pierre Boyer (VVPB), grapevine nurseries,
Meteorological Station of Bairrada
Relationships and flows Insert information about each grapevine in the InovWine system to create a
historical vine data set that can be used by the ACC and other producers
Insert information about areas of the vineyard in the InovWine system to
create a historical data set that can be used by the ACC and other producers
Receive information and services from the ACC
Deliver grapes to the ACC
Make use of services from InovWine
Buy services from IPN and Biocant
Purchase garpevines implanted with RFID technology to VVPB
Buy grapevines from nurseryman (material and financial)
Receive notifications from the Meteorological Station of Bairrada or from
the ACC that must be followed in the vineyard treatment
Roles Buy grapevines
Treat the vineyard (pruning, treatments, vintage)
Insert data obtained from the vineyard’s grapevines
Use InovWine services (e.g., alarms, genetic identification)
Purchase products developed by InovWine (e.g., kits, sensor networks)
Goals
Increase the grape/wine quality through InovWine
Increase the profit obtained with the vineyard
Reduce the number of treatments applied to the vineyard
Get guarantees on the genetic origin of the acquired grapevines
Identify the best grape varieties that can potentiate their wine
Keep a monitoring and warning system for the vineyard that supervises its
evolution in real-time (e.g., react to pest situations, notice that a field is in
water stress)
Have a solution to access the grapevines history that can aid in the vineyard
planning
Receive support from the cooperative to use InovWine’s devices and in
interpreting their insights
Enter data on the vineyard in the field
Business model: InovWine Version and Date: 0.3, 29/12/2010 Author: Cristina Costa

Chapter 7 – InovWine: an example of using BIZ2BIS
234
Table 31: Biocant updated description
Actor’s description Biocant
Network interactions Producers, ACC
Relationships and flows Sell molecular characterization kits (producers, ACC, and nurseries)
Sell microorganism identification test kits (producers, ACC, and nurseries)
BOTH SERVICES MAY INVOLVE CONTRACTUAL ISSUES THAT SHOULD BE
FURTHER DEVELOPED
Provide after sale support to producers and grapevines nurseries using
molecular characterization kits
Provide after sale support to wine producers, and grapevines nurseries using
microorganism identification test kits
Roles Sell molecular characterization kits
Sell microorganism identification test kits (for the vineyard and the wine)
Provide after sale support (SUBJECTED TO DISCUSSION)
Promote kit development
Goals Sell kits and services developed during the project or get royalties through
spin-offs
Business model: InovWine Version and Date: 0.3, 29/12/2010 Author: Cristina Costa
Table 32: IPN-LIS updated description
Actor’s description IPN – LIS
Network interactions Producers, ACC
Relationships and flows Sell add-ons to the InovWine information system (producers and ACC)
Provide maintenance of the InovWine application installed in the cooperative
and of the client applications used by the producers. THIS SERVICE MAY
INVOLVE CONTRACTUAL ISSUES THAT SHOULD BE FURTHER DEVELOPED
Roles Sell the client applications to producers that want to install InovWine in their
vineyards
Provide maintenance to InovWine applications
Provide after sale support (SUBJECTED TO DISCUSSION)
Goals Sell the application developed during the project or get royalties through
spin-offs
Business model: InovWine Version and Date: 03, 29/12/2010 Author: Cristina Costa

7.2 An action research study: using BIZ2BIS in the InovWine project
235
Table 33: IPN-LAS updated description
Actor’s description IPN - LAS
Network interactions Producers, ACC
Relationships and flows Sell wireless sensor networks and RFID technology (producers, and the
ACC)
Provide the maintenance of the wireless sensor networks and of the
RFIDs in the producers’ fields. THIS SERVICE MAY INVOLVE
CONTRACTUAL ISSUES THAT SHOULD BE FURTHER DEVELOPED
Roles Sell wireless sensor networks and RFID solutions to producers that want
to install InovWine solutions in their vineyards
Maintain wireless sensor network and RFIDs technology in the
producers’ fields
Provide after sale support (SUBJECTED TO DISCUSSION)
Goals Sell the wireless sensor network and RFIDs solutions developed during
the project or get royalties through spin-offs
Business model: InovWine Version and Date: 0.3, 29/12/2010 Author: Cristina Costa
Table 34: Grapevine nursery updated description
Actor’s description Viveiros vitivinícolas Pierre Boyer (VVPB) Grapevine nursery
Network interactions Producers, Viticert
Relationships and flows Sell grapevines to producers
Provide services to aid producers in the selection of suitable grape varieties
Offer after sale support to clarify how the grapevines should be treated
Roles Obtain the grapevines certification (if the nurseries belong to the Portuguese
Western zone, this process is carried out by Viticert)
Manage requests of grapevine varieties (in some cases, there is the need to
acquire material for grafting from abroad)
Advise the producers to make the best choice according to the characteristics
of their vineyards (e.g., geographic location, type of soil)
Make the grafts and put them in a germination chamber
Produce the grapevine according to certified processes
Assign a certification label to a set of grapevines
Sell the grapevines
Monitor the producers work in the field, to guarantee that the plants are
properly treated
Goals Give credibility to the nurseries and to their products
Create a record of the plants sold by the nurseries
Ensure that the variety planted by the producer corresponds to the one
requested in the nurseries
Increase profits by selling grapevines
Business model: InovWine Version and Date: 0.3, 29/12/2010 Author: Cristina Costa
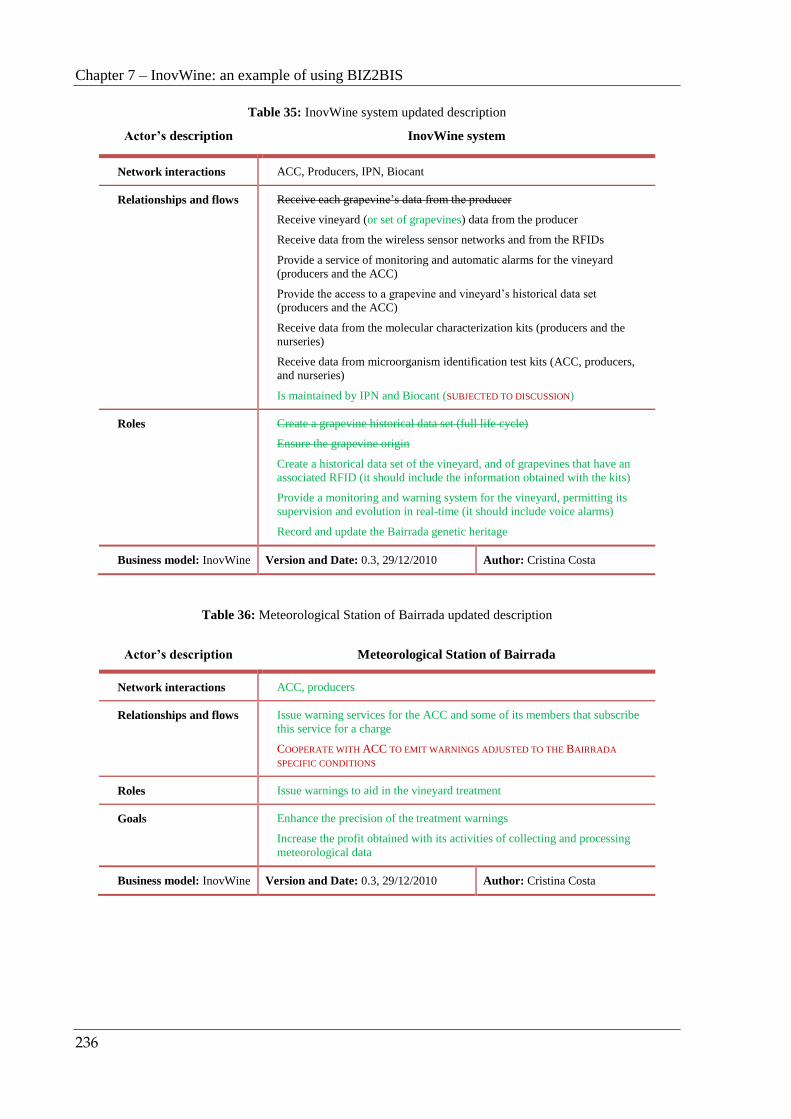
Chapter 7 – InovWine: an example of using BIZ2BIS
236
Table 35: InovWine system updated description
Actor’s description InovWine system
Network interactions ACC, Producers, IPN, Biocant
Relationships and flows Receive each grapevine’s data from the producer
Receive vineyard (or set of grapevines) data from the producer
Receive data from the wireless sensor networks and from the RFIDs
Provide a service of monitoring and automatic alarms for the vineyard
(producers and the ACC)
Provide the access to a grapevine and vineyard’s historical data set
(producers and the ACC)
Receive data from the molecular characterization kits (producers and the
nurseries)
Receive data from microorganism identification test kits (ACC, producers,
and nurseries)
Is maintained by IPN and Biocant (SUBJECTED TO DISCUSSION)
Roles Create a grapevine historical data set (full life cycle)
Ensure the grapevine origin
Create a historical data set of the vineyard, and of grapevines that have an
associated RFID (it should include the information obtained with the kits)
Provide a monitoring and warning system for the vineyard, permitting its
supervision and evolution in real-time (it should include voice alarms)
Record and update the Bairrada genetic heritage
Business model: InovWine Version and Date: 0.3, 29/12/2010 Author: Cristina Costa
Table 36: Meteorological Station of Bairrada updated description
Actor’s description Meteorological Station of Bairrada
Network interactions ACC, producers
Relationships and flows Issue warning services for the ACC and some of its members that subscribe
this service for a charge
COOPERATE WITH ACC TO EMIT WARNINGS ADJUSTED TO THE BAIRRADA
SPECIFIC CONDITIONS
Roles Issue warnings to aid in the vineyard treatment
Goals Enhance the precision of the treatment warnings
Increase the profit obtained with its activities of collecting and processing
meteorological data
Business model: InovWine Version and Date: 0.3, 29/12/2010 Author: Cristina Costa
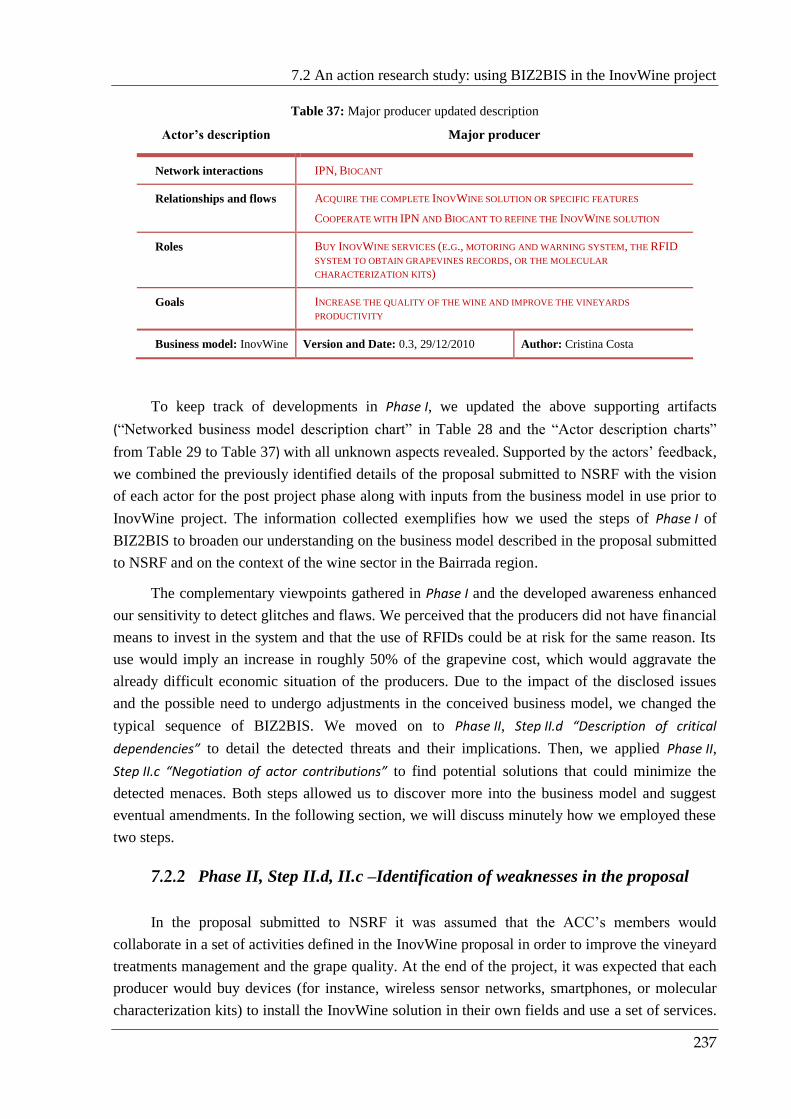
7.2 An action research study: using BIZ2BIS in the InovWine project
237
Table 37: Major producer updated description
Actor’s description Major producer
Network interactions IPN, BIOCANT
Relationships and flows ACQUIRE THE COMPLETE INOVWINE SOLUTION OR SPECIFIC FEATURES
COOPERATE WITH IPN AND BIOCANT TO REFINE THE INOVWINE SOLUTION
Roles BUY INOVWINE SERVICES (E.G., MOTORING AND WARNING SYSTEM, THE RFID
SYSTEM TO OBTAIN GRAPEVINES RECORDS, OR THE MOLECULAR
CHARACTERIZATION KITS)
Goals INCREASE THE QUALITY OF THE WINE AND IMPROVE THE VINEYARDS
PRODUCTIVITY
Business model: InovWine Version and Date: 0.3, 29/12/2010 Author: Cristina Costa
To keep track of developments in Phase I, we updated the above supporting artifacts
(“Networked business model description chart” in Table 28 and the “Actor description charts”
from Table 29 to Table 37) with all unknown aspects revealed. Supported by the actors’ feedback,
we combined the previously identified details of the proposal submitted to NSRF with the vision
of each actor for the post project phase along with inputs from the business model in use prior to
InovWine project. The information collected exemplifies how we used the steps of Phase I of
BIZ2BIS to broaden our understanding on the business model described in the proposal submitted
to NSRF and on the context of the wine sector in the Bairrada region.
The complementary viewpoints gathered in Phase I and the developed awareness enhanced
our sensitivity to detect glitches and flaws. We perceived that the producers did not have financial
means to invest in the system and that the use of RFIDs could be at risk for the same reason. Its
use would imply an increase in roughly 50% of the grapevine cost, which would aggravate the
already difficult economic situation of the producers. Due to the impact of the disclosed issues
and the possible need to undergo adjustments in the conceived business model, we changed the
typical sequence of BIZ2BIS. We moved on to Phase II, Step II.d “Description of critical
dependencies” to detail the detected threats and their implications. Then, we applied Phase II,
Step II.c “Negotiation of actor contributions” to find potential solutions that could minimize the
detected menaces. Both steps allowed us to discover more into the business model and suggest
eventual amendments. In the following section, we will discuss minutely how we employed these
two steps.
7.2.2 Phase II, Step II.d, II.c –Identification of weaknesses in the proposal
In the proposal submitted to NSRF it was assumed that the ACC’s members would
collaborate in a set of activities defined in the InovWine proposal in order to improve the vineyard
treatments management and the grape quality. At the end of the project, it was expected that each
producer would buy devices (for instance, wireless sensor networks, smartphones, or molecular
characterization kits) to install the InovWine solution in their own fields and use a set of services.

Chapter 7 – InovWine: an example of using BIZ2BIS
238
Some of the identified services were: access to historical data, guarantee of grapevine origin, as
well as a monitoring system to issue automatic warnings and assist vineyard treatment decisions.
Producers clearly recognized the advantages of enhancing their grape quality, since the
payment of their products is based on this factor. However, despite that interest, there are
limitations that can put their participation at risk. As described in Table 28 (field “Shared
interpretations and representations”), contrary to what was initially foreseen in the proposal
submitted to NSRF, the majority of the ACC’s members do not possess the required financial
conditions to install InovWine devices in their vineyards. The sentence “We do not have enough
money for regular expenses, let alone additional ones” is frequently heard among the producers,
which illustrates their unwillingness towards extra spending. Everything becomes even more
complicated when these acquisitions encompass technological equipment, since the majority of
the cooperative producers lack related skills, and have a low awareness of its potential (Table 28,
field “Shared interpretations and representations”). The financial effort demanded on producers
plus their technological illiteracy can seriously undermine their participation in the InovWine
business model and, consequently, the stability of its network of actors.
By applying Phase II, Step II.d “Description of critical dependencies”, we exposed the
difficulties that the Bairrada context imposes on the adoption of the InovWine business model in
the “Dependency diagram” (Figure 45). Through this diagram, it is possible to observe that the
activity of inserting grapevine and vineyard data depends on: the financial capacity of the
producers to acquire technological devices, their technological skills, and their personal
motivation to enter data (insights obtained in the steps of Phase I). However, if the information
that depends on the producers does not exist (situation marked by the red “X”), it will not be
possible to create records of the vineyards behavior (jeopardizing the opportunities identified in
Step I.a “Exploration of the business model” in the “Networked business model description chart”,
Table 28). This lack of data from each producer hinders their ability to receive personalized
warnings and statistics. As a consequence, two InovWine value propositions that are of extreme
interest to the majority of actors (ACC, producers, Biocant, and IPN) were threatened. These are:
“Improve the quality of the ACC wine through InovWine” and “Improve the productivity of the
ACC wine through InovWine”. We perceived these value propositions when analyzing the goals
identified for each actor in the artifacts “Actor description chart” (field “goals” from Table 29 to
Table 37). Without the producers’ data, their goals can be seriously at stake, the actors will
unlikely achieve an alignment of their interests, they will not be enrolled, and they will
demobilize, reinforcing the suspicion that the networked business model may collapse.
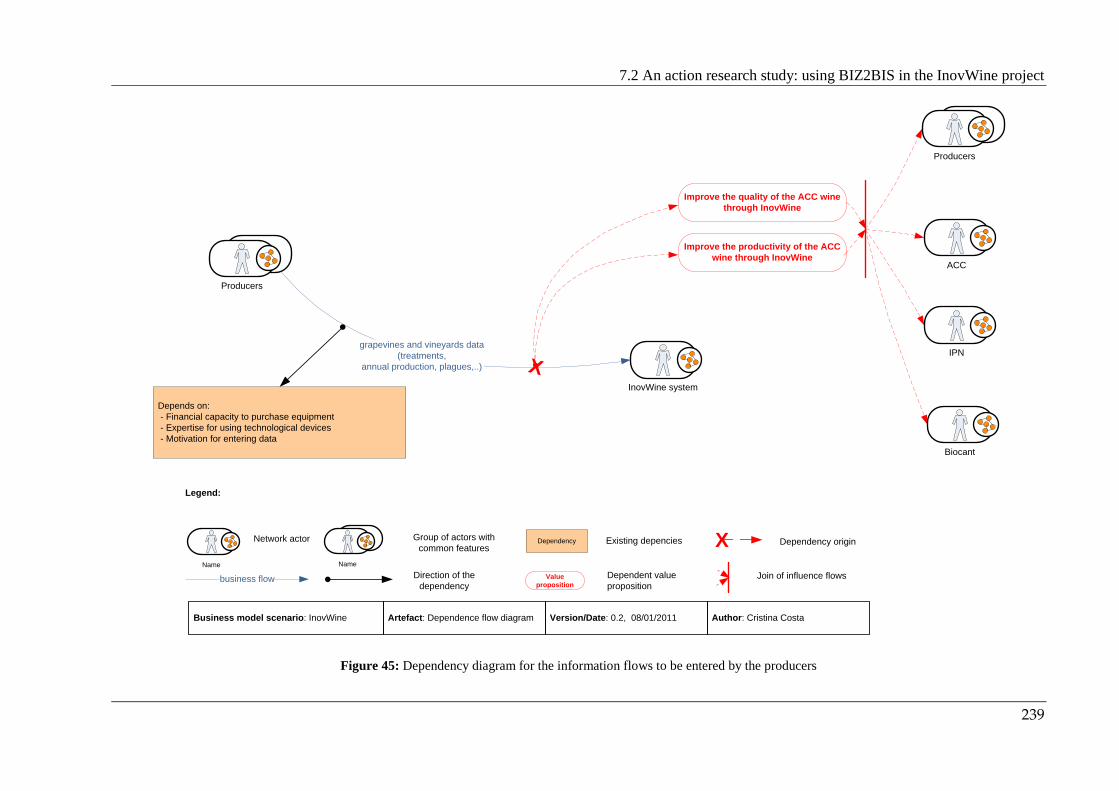
7.2 An action research study: using BIZ2BIS in the InovWine project
239
grapevines and vineyards data
(treatments,
annual production, plagues,..)
Depends on:
- Financial capacity to purchase equipment
- Expertise for using technological devices
- Motivation for entering data
X
Improve the quality of the ACC wine
through InovWine
Producers
InovWine system
Producers
ACC
IPN
Biocant
Legend:
business flow
Dependency
Direction of the
dependency
Existing depencies X Dependency origin
Value
proposition
Dependent value
proposition
Business model scenario: InovWine Artefact: Dependence flow diagram Version/Date: 0.2, 08/01/2011 Author: Cristina Costa
Network actor Group of actors with
common features
Name Name
Improve the productivity of the ACC
wine through InovWine
Join of influence flows
Figure 45: Dependency diagram for the information flows to be entered by the producers

Chapter 7 – InovWine: an example of using BIZ2BIS
240
Taking into account the unstable nature of the aforementioned scenario and the negative
impact that the unachieved expectations would have on the actors, we decided to employ Phase II,
Step II.c “Negotiation of actor contributions” to analyze potential critical goals. We sought clues for
their identification in Phase I supporting artifacts (“Networked business model description chart”,
Table 28, and “Actor description charts” from Table 29 to Table 37). A strong goal that attracted
us was “Improve the vineyards treatment through InovWine system”. We supported our option by
its direct exposure to failure when the producers do not enter data. In addition, the majority of the
actors considered it crucial. Moreover, it is supported by activities that can also be at risk (e.g., the
acquisition of devices) and it is related to several other goals with influence on the network
overarching aims (e.g., quality and production issues). To better understand the goal and its
impact on all involved actors, we detailed it in Step II.c’ “Negotiation diagram” (Figure 46), which
balances aims in terms of gain and effort.
To estimate the values placed in the diagram, we relied on the actors’ perspectives with
impact on, or influenced by, this goal (information mainly gathered in Phase I). First, we
considered what the ACC’s producers get without resorting to the InovWine system services and
then what they gain as an extra when they use it - this extra gain is the InovWine contribution to
the goal. The effort, in turn, is the additional exertion that the producers must carry out to support
the goal. Furthermore, we also considered in our assessment the specificities of the business
model context. For instance, as the producers own small parcels of land, they have huge space
restrictions that hinder the implementation of experiments to promote the quality of the
grapevines. Even if the InovWine system would be able to identify the best grapevines in a
vineyard, this insight would hardly be used because the majority of producers lack space to plant a
new vineyard with grafts from these singular grapevines. In addition, the producers are always
able to sell their grape production to the cooperative, independently of owning, or not, certified
grapevines, or of using, or not, InovWine services (“Networked business model description chart”
in Table 28, field “Shared interpretations”).
Now we will look in detail at the diagram to disclose and perceive the values assigned. On
the one hand, we can see that the acquisition of electronic equipment demands huge efforts
(rectangles adjacent to the activities and to the actors that carry them out in the lower part of the
diagram). This is also apparent for activities of data insertion and technological training. On the
other hand, gains are achieved with this goal at two levels: the ones that the producers get from
the actors that perform the supporting activities of the goal (in the red circles) and the ones
obtained from actors that directly benefit from the goal achievement (in the rectangles adjacent to
the actors, mainly producers and the ACC, in the upper part of the diagram). We can see in the
diagram a deep imbalance between, on the one hand the acquisition of equipment, data entry, and
technological training, and on the other hand the benefits obtained with the quality and
productivity enhancement. We present the summary of this assessment at the bottom right hand
corner of the diagram. They allowed us to note that the effort exerted by the producers and by the
cooperative is greater than the gains obtained. Further loss is evident for the producers. In fact, the
effort required from them is so demanding that clearly puts their participation in question.

7.2 An action research study: using BIZ2BIS in the InovWine project
241
Improve the vineyards
treatment through InovWine
Training actions
Producers
5
1
Raise awareness of the
technological benefitsACC
5
1
ACC
5
Producers
4
3
Gain
Effort
Effort
Producers
ACC
IPN
Biocant
16
7
3
Result
0
26
13
0
+3
- 10
- 6
+3
EffortGain
Acquire RFIDs and
SmartphonesProducers
3
Effort
Identify the most critical points to
be analyzed by the InovWine
system Producers
3
Effort
ACC
3
Acquire the InovWine
applications and the sensors5
Effort
Producers
3
1
1
ACC
5
ACC
2
Producers
1
Gain
IPN
3
Biocant
3
Enter data in the system
Producers
5
Effort
1
Purchase kits to identify
harmful microorganisms or to
detect grapevine varieties Producers
5
Esforço
3
Producers
Gai
n
Legend:
Goal
Actor with the goal
under analysis Activity
Actor
[1..5]
Effort
Gain that the actor with the goal
under analysis obtains
Identify goals influenced positively
by the goal under analysis
Business model scenario: InovWine Artefact: Negotiation diagram Version/Date: 0.4, 08/01/2011 Author: Cristina Costa
Name
Actor
[1..5]
Gain
Goal
Effort spent by an actor
to perform an activity Gain that a goal brings
to an actor
Improve grape quality and
enhance wine production
Access to the InovWine
database
Figure 46: “Improve the vineyards treatment through InovWine” negotiation diagram

Chapter 7 – InovWine: an example of using BIZ2BIS
242
The results in the “Negotiation diagram” (Figure 46) gave us clear indications that the goal
“Improve the vineyards treatment using the InovWine system” would be unfeasible if each actor
would have to buy his/her own solution (client application, smartphones, RFIDs, wireless sensor
networks, molecular characterization kits, and microorganism identification test kits). In addition,
due to the social, cultural, and economic context of the cooperative, it would be very hard for its
members to implement and exploit all the possibilities that this technology can provide. To
complicate matters further, funds that have been assigned to the wine industry in the recent years
(by state funds or European programs) will probably end due to the current financial crisis,
emphasizing the existing economic problems. As the producers have no other substantial gains
from the business model beyond those identified, it becomes very difficult for them to adhere to it.
Nevertheless, as shown in the “Actor description charts” from Table 29 to Table 37 (Phase I,
Step I.b “Description of participating actors”) the InovWine system is able to meet the producers
and the ACC expectations.
To minimize the exertion made by the producers and fight the pointed out difficulties, we
identified a set of proposals that can be put in action. For instance, at a financial level, the
cooperative can try to organize collective and larger scale purchases of equipment, in order to
obtain reduced prices. At a pedagogic level, to decrease the difficulty of the producers in resorting
to technology, the cooperative can promote training actions to decrease technological illiteracy
and initiatives to raise awareness of the benefits achieved through technology, as well as organize
meetings to facilitate the use of the InovWine system. However, when analyzing the Bairrada
context, it is possible to perceive that these actions will be extremely laborious and exhausting,
greatly increasing the effort expanded by the cooperative: many of the producers see the vineyard
as a hobby, are not prepared to make additional endeavors, and their older age imposes some
resistance to change. The InovWine technological team can also contribute to minimize this
resistance and motivate the commitment of the producers. By giving special attention to their
needs in the user interface design, it is possible to enhance the system usability that, hopefully,
will incite their participation.
To convince the actors to adopt the InovWine business model, we also decided to show
them its added value, when compared to the already existing systems of warnings. Through the
study of the business model prior to InovWine Project (Phase I), we noticed that the
Meteorological Station of Bairrada releases guidelines concerning the vineyards treatments on the
Internet, for free, approximately every three months. This organization also provides urgent
warnings online, but with very short notice and without the precision aimed by the InovWine
system, since its equipment is dispersed and does not regard the particular characteristics of each
field. Alternatively, the meteorological station also offers an additional service where, for a fee, its
subscribers receive the warnings in advance. However, the producers neither access the Internet
nor subscribe to the service. Since the cooperative is one of the meteorological station subscribers,
they prefer to wait and be warned by the cooperative technicians, who may not always be
available. Not only does this behavior underline the restricted technological skills and the limited
financial capacity of the producers, but also the fact that most of the times they do not receive the
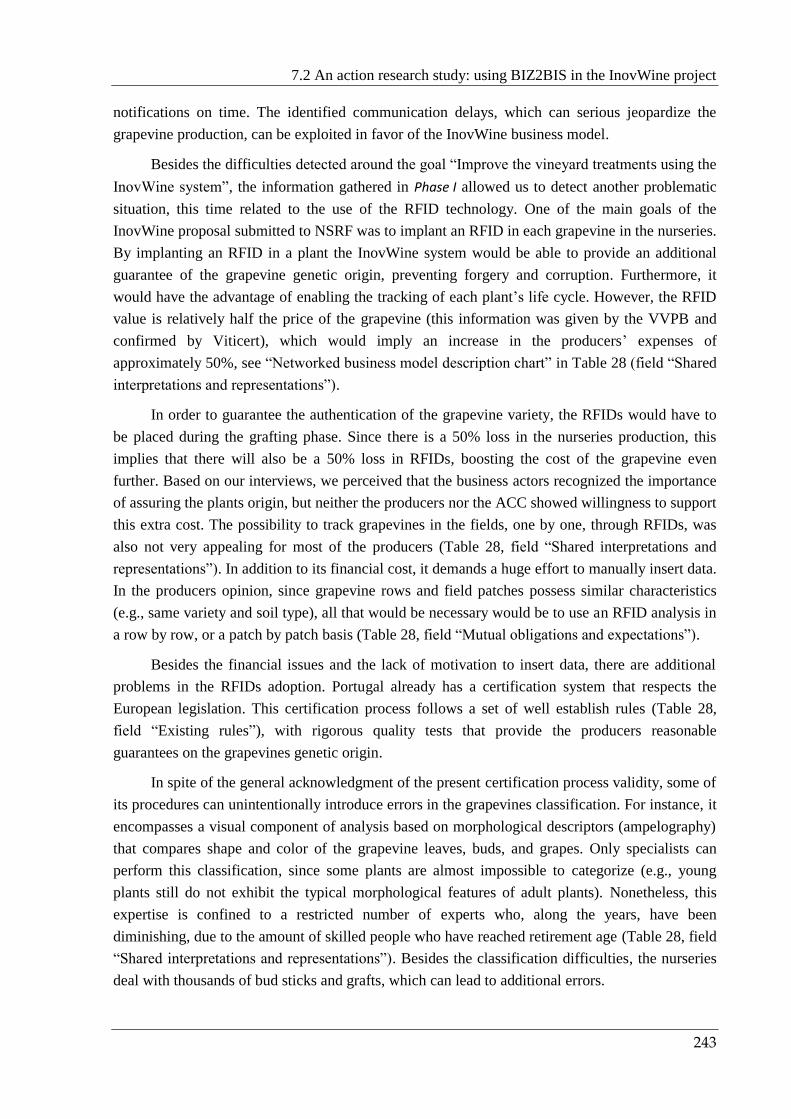
7.2 An action research study: using BIZ2BIS in the InovWine project
243
notifications on time. The identified communication delays, which can serious jeopardize the
grapevine production, can be exploited in favor of the InovWine business model.
Besides the difficulties detected around the goal “Improve the vineyard treatments using the
InovWine system”, the information gathered in Phase I allowed us to detect another problematic
situation, this time related to the use of the RFID technology. One of the main goals of the
InovWine proposal submitted to NSRF was to implant an RFID in each grapevine in the nurseries.
By implanting an RFID in a plant the InovWine system would be able to provide an additional
guarantee of the grapevine genetic origin, preventing forgery and corruption. Furthermore, it
would have the advantage of enabling the tracking of each plant’s life cycle. However, the RFID
value is relatively half the price of the grapevine (this information was given by the VVPB and
confirmed by Viticert), which would imply an increase in the producers’ expenses of
approximately 50%, see “Networked business model description chart” in Table 28 (field “Shared
interpretations and representations”).
In order to guarantee the authentication of the grapevine variety, the RFIDs would have to
be placed during the grafting phase. Since there is a 50% loss in the nurseries production, this
implies that there will also be a 50% loss in RFIDs, boosting the cost of the grapevine even
further. Based on our interviews, we perceived that the business actors recognized the importance
of assuring the plants origin, but neither the producers nor the ACC showed willingness to support
this extra cost. The possibility to track grapevines in the fields, one by one, through RFIDs, was
also not very appealing for most of the producers (Table 28, field “Shared interpretations and
representations”). In addition to its financial cost, it demands a huge effort to manually insert data.
In the producers opinion, since grapevine rows and field patches possess similar characteristics
(e.g., same variety and soil type), all that would be necessary would be to use an RFID analysis in
a row by row, or a patch by patch basis (Table 28, field “Mutual obligations and expectations”).
Besides the financial issues and the lack of motivation to insert data, there are additional
problems in the RFIDs adoption. Portugal already has a certification system that respects the
European legislation. This certification process follows a set of well establish rules (Table 28,
field “Existing rules”), with rigorous quality tests that provide the producers reasonable
guarantees on the grapevines genetic origin.
In spite of the general acknowledgment of the present certification process validity, some of
its procedures can unintentionally introduce errors in the grapevines classification. For instance, it
encompasses a visual component of analysis based on morphological descriptors (ampelography)
that compares shape and color of the grapevine leaves, buds, and grapes. Only specialists can
perform this classification, since some plants are almost impossible to categorize (e.g., young
plants still do not exhibit the typical morphological features of adult plants). Nonetheless, this
expertise is confined to a restricted number of experts who, along the years, have been
diminishing, due to the amount of skilled people who have reached retirement age (Table 28, field
“Shared interpretations and representations”). Besides the classification difficulties, the nurseries
deal with thousands of bud sticks and grafts, which can lead to additional errors.

Chapter 7 – InovWine: an example of using BIZ2BIS
244
The molecular characterization kit under development by Biocant (based on DNA markers)
will provide a reliable classification of the grapevines. Its results could be recorded in RFIDs and
implanted in the corresponding grapevine. However, despite the benefits RFIDs could bring to the
certification process, the current legislation does not account for the use of these devices.
It is worth pointing out that is not viable to expect that the certification process will be
changed in a short term, since it is widely implemented in the wine sector and it has a strong legal
background. At best, it can only be complemented with additional features. Given this restriction,
the combination of the RFIDs with the kits can only be used as an additional method to strengthen
the existing certification process. For this reason, the goal “Develop a genotyping system based on
molecular methods to aid in the grapevine certification” presented in the proposal submitted to
NSRF, should be changed to “Develop a genotyping system based on molecular methods to
complement grapevine certification”.
The use of RFIDs as initially described in the proposal submitted to NSRF might be an
interesting opportunity to explore in the near future, especially if the liable parties decide that
alternative classification mechanisms are needed. They may decide, for instance, that the labels
currently used to identify the variety classification of a set of grapevines do not answer to all the
necessary security requirements (they are made of paper, and easily destroyed or falsified), see
Table 28 (field “Shared interpretations and representations”). As an alternative, they may promote
the use of an RFID per grapevine, or, similarly to the existing labels, they may assent in assigning
an RFID to a set of grapevines (e.g., an RFID would be associated with a set of fifty grapevines,
reducing the cost of its application).
We did not use a “Negotiation diagram” to analyze the viability of using RFIDs to
individually characterize each grapevine because of legal impediments and lack of interest from
actors. In general, most producers prefer to negotiate with nurseries that they have come to
depend on, and in whom they trust. Due to their own knowledge in the field, the majority can also
complement this trust with their capacity to perform a visual analysis of the grapevines, obtaining
an additional assurance regarding their purchase.
7.2.3 Findings after the first BIZ2BIS iteration
The information collected about the business model described in the proposal submitted to
NSRF allowed us to perform a thorough reflection that took into account the context of the
cooperative and the expectations of its producers. The findings gave us the chance to draw some
conclusions on topics that could endanger the interessement and enrolment of the network actors
in the idealized business model. The actors with the power to make decisions should use our
outcome, presented below, as a basis for future adjustments:
Most cooperative members have very limited financial resources. They do not possess
monetary capacity to acquire their own wireless sensor network. Even less expensive
devices that support InovWine features like smartphones, will only be acquired if the
producers strongly believe that they can bring them indisputable benefits.

7.2 An action research study: using BIZ2BIS in the InovWine project
245
Producers are not willing to pay more to obtain an additional assurance about the
grapevines’ genetic origin. The majority of them usually trust the nurseries that they
have come to depend on.
Producers’ lack of technological skills limits their interest, motivation, and ability to
adopt the InovWine business model.
The notifications issued by the Meteorological Station of Bairrada frequently do not
reach the producers on time. Since this information is critical to these actors, the
detected inefficiencies can be exploited by the InovWine information system to
encourage their participation and transform the InovWine alarms in a fundamental
resource in their activities.
Producers do not consider it to be worthwhile to have individual records per grapevine.
According to the obtained opinions, the return of the introduction of an RFID per
grapevine does not counterbalance the financial costs involved and the effort to insert
data per grapevine. In the producers’ opinion, it is more appealing to identify areas (e.g.,
rows or patches) with similar characteristics and analogous behaviors and to assign it a
common RFID. Their lack of interest led us to reconsider how RFIDs should be used.
The implantation of the current certification process and its legal support (it follows
European rules), as well as the increased costs associated with the use of RFIDs,
prevents the development of an alternative certification system based on this
technology. However, when combined with biological research (e.g., DNA markers),
RFIDs can bring apparent advantages to the classification process. For this reason, it
would be advisable to explore it, since its restrictive factors can change drastically in the
near future (e.g., new laws, or lower prices), opening up new windows of opportunity.
Some actors identified in Phase I are not relevant to the new version of the InovWine
business model. With the inability to integrate the RFID and the Biocant’s kit in the
current certification process, the relationships with grapevine nurseries, Viticert, and the
Instituto Superior de Agronomia became out of scope of our study. These relationships
will remain unchanged, before and after the adoption of the envisaged business model.
Furthermore, since the RFIDs will not be introduced in the VVPB nurseries (as initially
planned) there is no longer the need to associate the business model with that particular
nursery. The producers can purchase their grapevines from whoever they want and the
business model will no longer cover such activities.
The InovWine business model does not consider the role of wine consumers. Although
it intends to provide high quality wines and increase the ACC income, it does not have
as its aim to analyze the relationship between ACC and its customers.
We presented the above findings to the actors responsible for the InovWine project (ACC,
the producers, Biocant, and IPN). They took into account our warnings and were receptive to our
proposals to minimize the identified issues. The detected financial problems revealed to be one of
the greatest drawbacks of the business model: producers had no disposal income to buy the
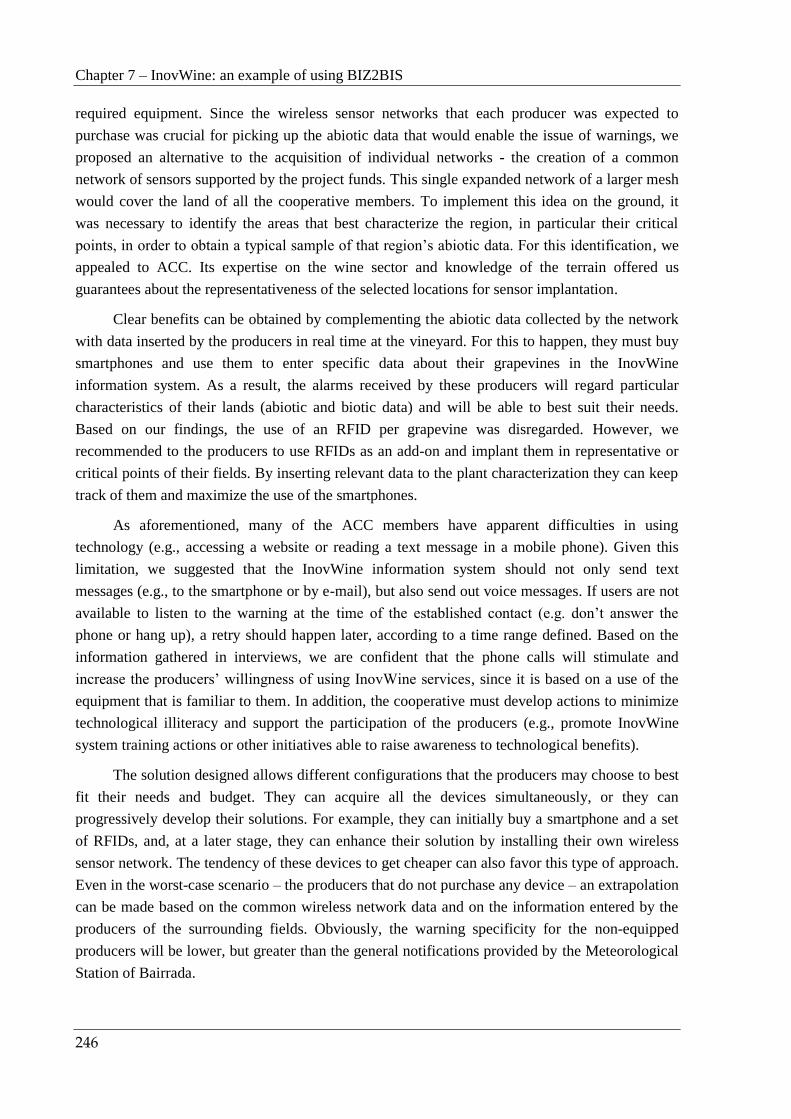
Chapter 7 – InovWine: an example of using BIZ2BIS
246
required equipment. Since the wireless sensor networks that each producer was expected to
purchase was crucial for picking up the abiotic data that would enable the issue of warnings, we
proposed an alternative to the acquisition of individual networks - the creation of a common
network of sensors supported by the project funds. This single expanded network of a larger mesh
would cover the land of all the cooperative members. To implement this idea on the ground, it
was necessary to identify the areas that best characterize the region, in particular their critical
points, in order to obtain a typical sample of that region’s abiotic data. For this identification, we
appealed to ACC. Its expertise on the wine sector and knowledge of the terrain offered us
guarantees about the representativeness of the selected locations for sensor implantation.
Clear benefits can be obtained by complementing the abiotic data collected by the network
with data inserted by the producers in real time at the vineyard. For this to happen, they must buy
smartphones and use them to enter specific data about their grapevines in the InovWine
information system. As a result, the alarms received by these producers will regard particular
characteristics of their lands (abiotic and biotic data) and will be able to best suit their needs.
Based on our findings, the use of an RFID per grapevine was disregarded. However, we
recommended to the producers to use RFIDs as an add-on and implant them in representative or
critical points of their fields. By inserting relevant data to the plant characterization they can keep
track of them and maximize the use of the smartphones.
As aforementioned, many of the ACC members have apparent difficulties in using
technology (e.g., accessing a website or reading a text message in a mobile phone). Given this
limitation, we suggested that the InovWine information system should not only send text
messages (e.g., to the smartphone or by e-mail), but also send out voice messages. If users are not
available to listen to the warning at the time of the established contact (e.g. don’t answer the
phone or hang up), a retry should happen later, according to a time range defined. Based on the
information gathered in interviews, we are confident that the phone calls will stimulate and
increase the producers’ willingness of using InovWine services, since it is based on a use of the
equipment that is familiar to them. In addition, the cooperative must develop actions to minimize
technological illiteracy and support the participation of the producers (e.g., promote InovWine
system training actions or other initiatives able to raise awareness to technological benefits).
The solution designed allows different configurations that the producers may choose to best
fit their needs and budget. They can acquire all the devices simultaneously, or they can
progressively develop their solutions. For example, they can initially buy a smartphone and a set
of RFIDs, and, at a later stage, they can enhance their solution by installing their own wireless
sensor network. The tendency of these devices to get cheaper can also favor this type of approach.
Even in the worst-case scenario – the producers that do not purchase any device – an extrapolation
can be made based on the common wireless network data and on the information entered by the
producers of the surrounding fields. Obviously, the warning specificity for the non-equipped
producers will be lower, but greater than the general notifications provided by the Meteorological
Station of Bairrada.
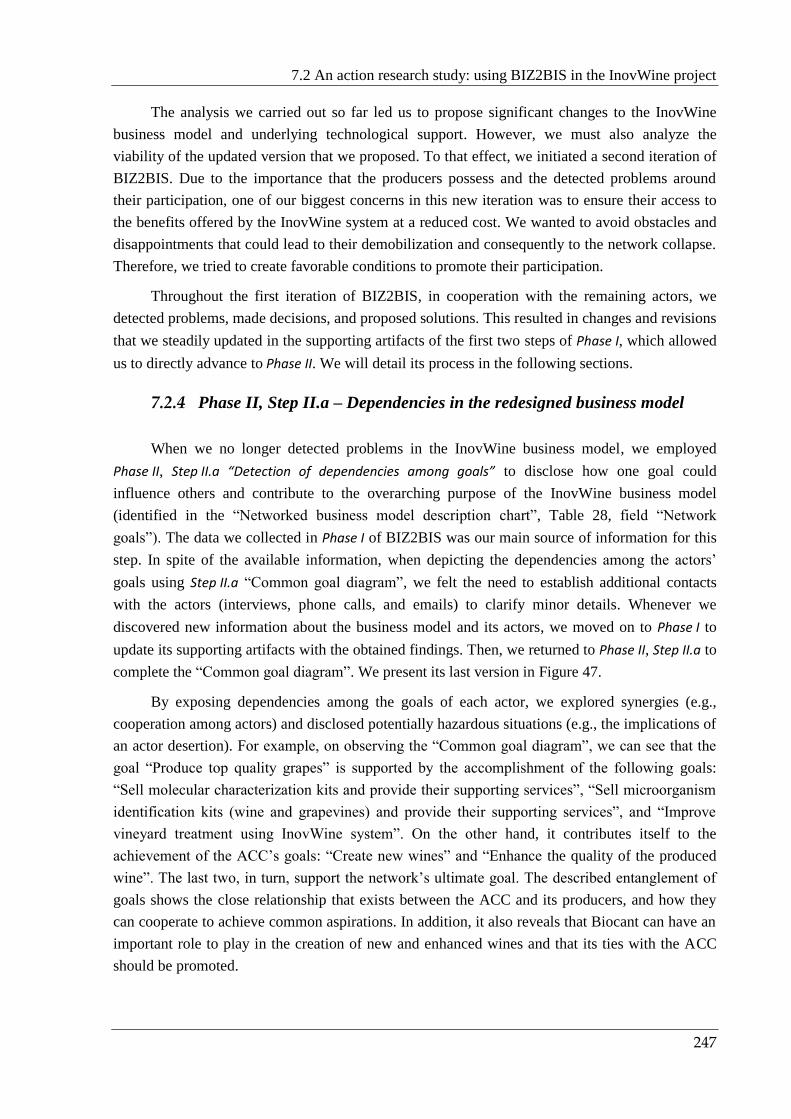
7.2 An action research study: using BIZ2BIS in the InovWine project
247
The analysis we carried out so far led us to propose significant changes to the InovWine
business model and underlying technological support. However, we must also analyze the
viability of the updated version that we proposed. To that effect, we initiated a second iteration of
BIZ2BIS. Due to the importance that the producers possess and the detected problems around
their participation, one of our biggest concerns in this new iteration was to ensure their access to
the benefits offered by the InovWine system at a reduced cost. We wanted to avoid obstacles and
disappointments that could lead to their demobilization and consequently to the network collapse.
Therefore, we tried to create favorable conditions to promote their participation.
Throughout the first iteration of BIZ2BIS, in cooperation with the remaining actors, we
detected problems, made decisions, and proposed solutions. This resulted in changes and revisions
that we steadily updated in the supporting artifacts of the first two steps of Phase I, which allowed
us to directly advance to Phase II. We will detail its process in the following sections.
7.2.4 Phase II, Step II.a – Dependencies in the redesigned business model
When we no longer detected problems in the InovWine business model, we employed
Phase II, Step II.a “Detection of dependencies among goals” to disclose how one goal could
influence others and contribute to the overarching purpose of the InovWine business model
(identified in the “Networked business model description chart”, Table 28, field “Network
goals”). The data we collected in Phase I of BIZ2BIS was our main source of information for this
step. In spite of the available information, when depicting the dependencies among the actors’
goals using Step II.a “Common goal diagram”, we felt the need to establish additional contacts
with the actors (interviews, phone calls, and emails) to clarify minor details. Whenever we
discovered new information about the business model and its actors, we moved on to Phase I to
update its supporting artifacts with the obtained findings. Then, we returned to Phase II, Step II.a to
complete the “Common goal diagram”. We present its last version in Figure 47.
By exposing dependencies among the goals of each actor, we explored synergies (e.g.,
cooperation among actors) and disclosed potentially hazardous situations (e.g., the implications of
an actor desertion). For example, on observing the “Common goal diagram”, we can see that the
goal “Produce top quality grapes” is supported by the accomplishment of the following goals:
“Sell molecular characterization kits and provide their supporting services”, “Sell microorganism
identification kits (wine and grapevines) and provide their supporting services”, and “Improve
vineyard treatment using InovWine system”. On the other hand, it contributes itself to the
achievement of the ACC’s goals: “Create new wines” and “Enhance the quality of the produced
wine”. The last two, in turn, support the network’s ultimate goal. The described entanglement of
goals shows the close relationship that exists between the ACC and its producers, and how they
can cooperate to achieve common aspirations. In addition, it also reveals that Biocant can have an
important role to play in the creation of new and enhanced wines and that its ties with the ACC
should be promoted.

Chapter 7 – InovWine: an example of using BIZ2BIS
248
Create new wines
INCREASE THE COMPETITIVENESS OF THE WINE PRODUCED IN BAIRRADA
Promote Bairrada winesRaise awareness about the precision
agriculture technologies
Provide information to support
producers decision making
Enhance the quality of the
produced wines
Provide subsidies for the wine
industry
Produce top quality grapes Improve vineyards treatment
using InovWine system
Purchase quality
grapevines
Sell certified grapevines
Sell microorganism identification kits
(wine and grapevines) and provide their
supporting services
Sell molecular characterization kits
and provide their supporting
services
Suply and maintenance of the InovWine alarm
system based on the wireless sensor network Suply and maintenance of the RFIDs
Issue warnings about
vineyard treatments
Improve the vineyards
treatment with the already
existing resourcesProducers
ACC
Meteorological Station of Bairrada
State
Biocant
IPN
Nurseries
Business model scenario: InovWine Artefact: Common goal diagram Version/Date: 0.6, 12/01/2011 Author: Cristina Costa
Legend:
Network goal Network actor Actor individual goal Connects goal (the arrow direction indicates the supported goal)
Actor
Provide new yeasts
Figure 47: InovWine Common goal diagram

7.2 An action research study: using BIZ2BIS in the InovWine project
249
We also used the “Common goal diagram” to disclose challenging objectives. To
exemplify, we will focus on the goal “Improve vineyards treatment using InovWine system”. The
number of dependencies established around it is far superior to those of others (it implicates
various goals and its accomplishment relies on several actors), denoting its key role in the
business model. This emphasis is entirely justified by the importance assigned to goals addressing
the enhancement of the vineyard treatment. However, the complexity inherent to its supporting
activities may endanger its achievement and consequently jeopardize the networked business
model. As can be seen, this goal is critical to achieve relevant purposes for the actors (“Actor
description charts”, from Table 29 to Table 37). It contributes towards the improvement of the
grape quality and, thus, to the wine excellence, as well as to the creation of new products.
Together, these dependencies form a network of interactions that supports the ultimate business
model objective: “Increasing the competitiveness of the Bairrada wine”. Besides the implications
of the goal under study on other goals, its accomplishment relies on the contributions of several
actors (e.g., Biocant, IPN, and the ACC), and requires their close collaboration. All these
dependencies and implications made of it a prime target of assessment.
The goal “Enhance the quality of the produced wine” is also decisive to the business model.
As a matter of fact, it assembles many of the expectations of the actors that are more involved in
the business model. Improving the wine quality will enable the creation of new and enhanced
wines that will strengthen the current position of the ACC in the market and increase its
competitiveness. An external recognition of its products will augment its prestige, adding value to
the producers’ grapes. A success at this level would increase the producers’ negotiation power.
Contrary to the achievement of the goal “Improve vineyards treatment using InovWine system”,
which technologically depends essentially on the InovWine information system (and thus from
IPN outcomes), this one also depends on the research results of Biocant. By its described impact
on the business model, we will also evaluate the goal "Enhance the quality of the produced wine".
According to the information gathered in the previous steps, BIZ2BIS did not provide indications
that justified a more detailed analysis of the remaining goals. They did not have many
dependencies, the activities that support them had no know threat, and they did not raise issues or
problems that made them crucial for the business model. Next, we will advance to Step II.b
“Identification of actor affinities” to take a closer look into the goals of each actor, identify shared
interests, and explore prospects to strengthen the network.
7.2.5 Phase II, Step II.b – Identification of actor affinities
Step II.b helped us to perceive how actors could be involved in partnerships, and aided us to
position them in the business model (for instance, it showed us the number of objectives that each
actor possessed and the number of actors that shared a same goal). We used the “Actors/Goals
affinity chart” (Table 38) to list the goals of each actor and identify the shared ones. To fill in this
chart we used the information available in the “Networked business model description chart”
(Table 28) and the “Actor description charts” (from Table 29 to Table 37).

Chapter 7 – InovWine: an example of using BIZ2BIS
250
Table 38: InovWine Actors/Goals affinity chart
Actors / Goals
Use
a v
ine
yard
mo
nit
ori
ng
syst
em
ab
le t
o g
en
era
te
auto
mat
ic t
reat
me
nt
ale
rts
Imp
rove
th
e w
ine
qu
alit
y an
d p
rod
uct
ivit
y th
rou
gh
Ino
vWin
e
Acc
ess
th
e v
ine
yard
s/gr
ape
vin
es
his
tory
De
tect
fu
ngi
in
vin
eya
rds
in d
ue
tim
e
Incr
eas
e t
he
co
mp
eti
tive
ne
ss o
f th
e A
CC
win
e
Sell
pro
du
cts
and
se
rvic
es
de
velo
pe
d d
uri
ng
the
pro
ject
or
get
roya
ltie
s th
rou
gh s
pin
-off
s
Pro
mo
te t
he
AC
C w
ine
s th
rou
gh t
he
In
ovW
ine
Enh
ance
th
e p
reci
sio
n o
f cu
rre
nt
tre
atm
en
t w
arn
ings
Incr
eas
e t
he
pro
fit
on
th
e v
ine
yard
Incr
eas
e P
ort
uga
l e
xpo
rtin
g ra
te
Ide
nti
fy a
nd
pro
tect
th
e B
airr
ada
gen
eti
c h
eri
tage
Ide
nti
fy t
he
be
st g
rap
evi
ne
s to
pro
du
ce w
ine
in
th
e
Bai
rrad
a
Cre
ate
ne
w w
ine
s u
sin
g th
e b
est
qu
alit
y gr
ape
s an
d n
ew
yeas
ts
Incr
eas
e p
rofi
ts b
y se
llin
g ve
geta
tive
mat
eri
al
Imp
rove
th
e d
ete
ctio
n o
f h
arm
ful
mic
roo
rgan
ism
s in
th
e
win
e t
hat
can
de
teri
ora
te i
t
Tota
l am
ou
nt
ACC X X X X X X X X X X X X X X 14
Producers X X X X X X X X X X X 11
Biocant X X X X 4
IPN X X X X 4
State X X X 3
Nurseries X X 2
Meteorological Station of Bairrada X 1
Total amount 4 4 4 3 3 3 3 3 2 2 2 2 2 1 1
Business model: InovWine Author: Cristina CostaVersion and Date: 0.4, 15/01/2011

7.2 An action research study: using BIZ2BIS in the InovWine project
251
We can see through the “Actors/Goals affinity chart” that the ACC and the producers aspire
to accomplish more goals than the remaining actors (respectively 13 and 9). These results are
consistent with our expectations. On the one hand, the ACC, in its role of main promoter of the
project, had the chance to shape the InovWine business model according to its own interests in the
wine industry. On the other hand, since the producers are ACC members and have interests in
common with the cooperative, we were already predicting that they also intended to achieve a
large number of goals under the scope of the InovWine business model. In fact, in most cases, the
goals of the producers are shared with ACC. For instance, “Use a vineyard monitoring system
able to generate automatic treatment alerts”, “Access the vineyards/grapevines history”, and
“Detect fungi in vineyards in due time”. Exposing and detailing the affinities between ACC and
its members reinforced our idea that these actors have been working in collaboration (or at least
have depending on each other), even before InovWine. Both actors clearly will benefit from
keeping and extending this cooperation: if producers grow quality grapes, the ACC has higher
chances in improving its wine, gets better profit, and obtains assets that could allow it to reinforce
their activities in favor of the producers. The InovWine business model articulates interrelated
activities and foments new opportunities and goals that can be extremely advantageous to exploit.
After the InovWine project ends, IPN and Biocant can remain in the InovWine business
model as entities that provide services or products (e.g., maintenance of software and equipment,
as well as supply of laboratory tests). Alternatively, these actors can promote the creation of spin-
offs that will replace them. In both cases, their presence in the business model will be mainly
driven by commercial purposes, and they will no longer be involved in grape production and
wine-making activities. Furthermore, we would like to note that the products and services
developed by these two technological centers, as well as the acquired knowledge, can be sold or
applied on other scenarios, beyond the cooperative. The share of royalties will be decided
according to the project agreement on intellectual property. The mentioned common research
interests and commercial purposes show another cluster of affinity in the “Actors/Goals affinity
chart”, this time between IPN and Biocant.
It is also interesting to notice the role of the Portuguese State in the chart. This actor has
been sponsoring, in cooperation with the European Community, several programs to stimulate the
Portuguese wine industry. In return, it expects to enhance its competitiveness (in this particular
case of the Bairrada Demarcated Region) and increase the exporting rate of the country. This
investment shows the importance of the wine sector and reflects the concerns of the Portuguese
State to achieve a goal that goes beyond the cooperative range: stimulating the Portuguese
economy.
Grapevine nurseries and the Meteorological Station of Bairrada are also addressed in the
“Actors/Goals affinity chart”. We can observe that the first has two goals while the second has
one. Nurseries intend to “Detect fungi in vineyards in due time” and “Increase profits by selling
vegetative material”, while the station aims at “Enhance the precision of current treatment
warnings”. These numbers are not surprising, since these two actors possess a restricted scope in
the InovWine business model. They provide specific services to the ACC and to its members, and
although these services influence the wine production, they are not directly related to the main

Chapter 7 – InovWine: an example of using BIZ2BIS
252
purposes of the InovWine business model. Despite the reduced expectations of the grapevine
nurseries and the Meteorological Station of Bairrada, BIZ2BIS pointed out the existence of
synergies that the cooperative can explore with these two actors. For instance, since the station
has interest in accessing weather data (to the point of actually paying for it, “Networked business
model description chart”, Table 28), the data acquired by the shared wireless sensor network that
will be installed in fields of the cooperative’s members can be used to encourage its participation
in the InovWine project. In addition, it can be useful for the meteorological station to integrate the
results obtained through InovWine biological analysis in its studies, as well as data obtained by
InovWine sensors that the station does not have at its disposal. This would allow the station to
enhance its warnings and contribute to improve the productivity in the region, which would be
particularly useful until the warning system would be fully tuned. With respect to nurseries, they
can establish collaborations with Biocant and IPN if changes in the grapevines’ certification
process take place. For example, if the European governments start to consider the use of the
RFID technology, the two technological centers and the nurseries could be partners in developing
a new certification system. They could adopt a solution similar to the one initially submitted to
NSRF. They could use molecular methods to provide the exact identification of the genetics of the
vegetative material, which could subsequently be recorded in RFIDs and implanted in each
grapevine (or in a group, for economical reasons). Furthermore, the kit that Biocant will develop
to early detect fungi in grapevines can also be extremely useful in nurseries, which have to fight
these types of threats on a daily basis, with a huge economic effort.
Besides the goals discussed above, the “Actors/Goals affinity chart” also allowed us the
identification of the most widely shared goals among the actors. These were:
Use a vineyard monitoring system able to generate automatic treatment alerts;
Improve the wine quality and productivity through InovWine;
Access the vineyard/grapevine history;
Detect fungi in vineyards in due time;
Increase the competitiveness of the ACC wine;
Sell products and services developed during the project or get royalties through spin-
offs;
Promote the ACC wines through InovWine;
Enhance the precision of current treatment warnings (provided by the Bairrada station).
We grouped the identified goals into three clusters:
The ones focused on boosting the ACC in the wine market (improve the wine quality
and productivity, increase its competitiveness and promote it through InovWine), which
are shared by the ACC and the producers. For the latter, it is very important to
strengthen and promote the ACC, in order to render their products lucrative. These aims

7.2 An action research study: using BIZ2BIS in the InovWine project
253
are also shared by the Portuguese State that intends to increase exports and promote a
qualified domestic industry.
The ones that explore the commercialization of products and services developed during
the InovWine project. These goals are mainly shared by IPN and Biocant (or future
spin-offs), but also by the ACC in the case of the new yeasts.
The ones that address the vineyard treatment (detection of fungi, vineyard history,
current warnings, the monitoring system that generates alarms, and enhancement of the
wine quality and productivity). These goals receive a wider range of attention from all
the actors. They involve data or services relevant to the ACC business model, but they
can also be applicable in scenarios beyond the ACC, increasing its sphere of action. For
instance, IPN and Biocant share the purpose of accessing the InovWine database - even
after the end of the project. Vineyard and meteorological data from multiple years can
be an important source of information for the future scientific activities of these
organizations. There are also indications that the meteorological data gathered by the
wireless sensor network can be of interest to the meteorological station (“Networked
business model description chart”, Table 28).
To maintain the networked business model cohesion it is crucial to assure that its actors can
accomplish their individual goals. This restriction becomes even more important when the actors
play crucial roles. If they do not feel committed, they may abandon it, causing its collapse. With
the expectation of avoiding this scenario, in Step II.a “Detection of dependencies among goals”
(previous section) we used the “Common goal diagram” (Figure 47) to identify critical goals to
the accomplishment of the business model’s overarching goal. Then, in this section, with Step II.b
“Identification of actor affinities”, and its “Actors/Goals affinity chart”, we acknowledged each
actors expectations and disclosed possible collaborations that can strengthen the network
connections. This outcome served as further evidence on the relevance of evaluating the goals
identified in Step II.a as critical, this time based on their impact on the individual goals identified
in the “Actors/Goals affinity chart”, especially the ones most shared. Furthermore, Step II.b
pointed out clues about the actors’ expectations for the business model and offered hints on how
many actors are really interested in keeping their participation.
The insights we obtained in Step II.a and Step II.b provided us with the basis to advance to
Step II.c “Negotiation of actor contributions”. This step consists in an estimation of the critical goals
viability to perceive the need to make adjustments on the envisioned networked business model.
7.2.6 Phase II, Step II.c – Negotiation of actor contributions
In Step II.c, we used “Negotiation diagrams” to appraise the two critical goals identified in
Step II.a (section 7.2.4): “Improve vineyards treatment using InovWine system” and "Enhance the
quality of the produced wine". The data gathered in the previous steps of BIZ2BIS aided us to
understand the context of these goals in a comprehensive and detailed way by covering aspects as
distinct as performed activities, exchanged flows, expectations of the actors, existing interactions,
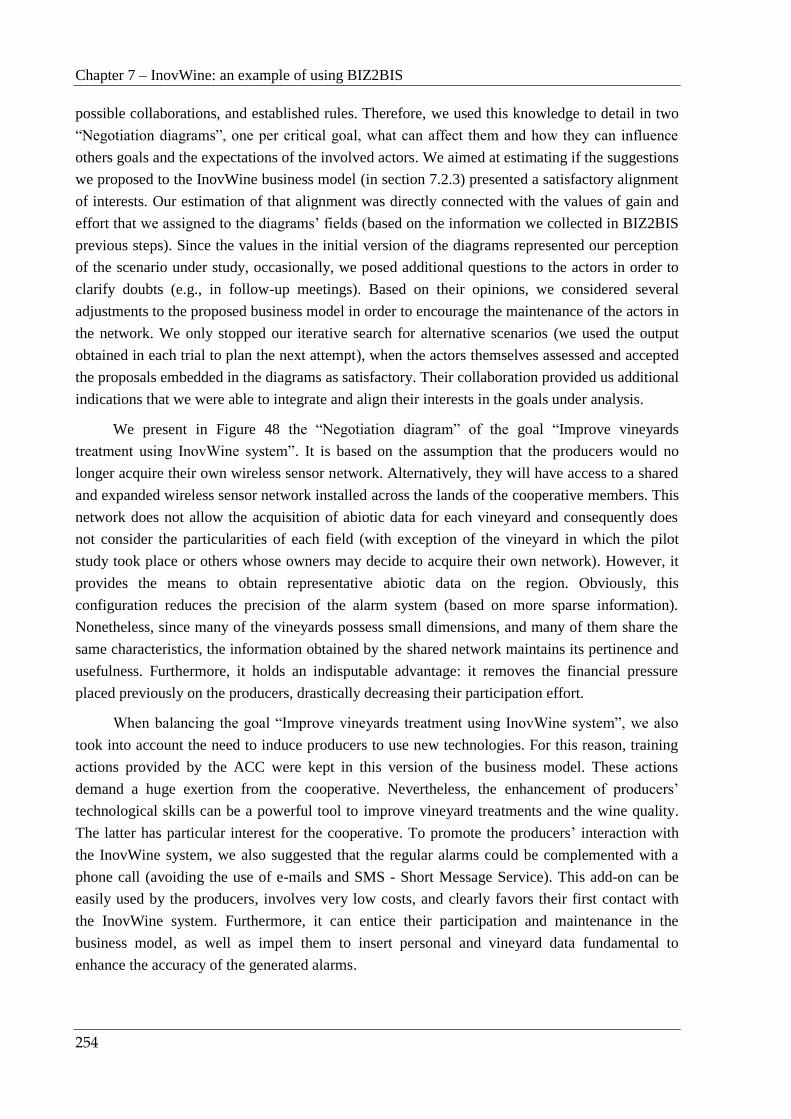
Chapter 7 – InovWine: an example of using BIZ2BIS
254
possible collaborations, and established rules. Therefore, we used this knowledge to detail in two
“Negotiation diagrams”, one per critical goal, what can affect them and how they can influence
others goals and the expectations of the involved actors. We aimed at estimating if the suggestions
we proposed to the InovWine business model (in section 7.2.3) presented a satisfactory alignment
of interests. Our estimation of that alignment was directly connected with the values of gain and
effort that we assigned to the diagrams’ fields (based on the information we collected in BIZ2BIS
previous steps). Since the values in the initial version of the diagrams represented our perception
of the scenario under study, occasionally, we posed additional questions to the actors in order to
clarify doubts (e.g., in follow-up meetings). Based on their opinions, we considered several
adjustments to the proposed business model in order to encourage the maintenance of the actors in
the network. We only stopped our iterative search for alternative scenarios (we used the output
obtained in each trial to plan the next attempt), when the actors themselves assessed and accepted
the proposals embedded in the diagrams as satisfactory. Their collaboration provided us additional
indications that we were able to integrate and align their interests in the goals under analysis.
We present in Figure 48 the “Negotiation diagram” of the goal “Improve vineyards
treatment using InovWine system”. It is based on the assumption that the producers would no
longer acquire their own wireless sensor network. Alternatively, they will have access to a shared
and expanded wireless sensor network installed across the lands of the cooperative members. This
network does not allow the acquisition of abiotic data for each vineyard and consequently does
not consider the particularities of each field (with exception of the vineyard in which the pilot
study took place or others whose owners may decide to acquire their own network). However, it
provides the means to obtain representative abiotic data on the region. Obviously, this
configuration reduces the precision of the alarm system (based on more sparse information).
Nonetheless, since many of the vineyards possess small dimensions, and many of them share the
same characteristics, the information obtained by the shared network maintains its pertinence and
usefulness. Furthermore, it holds an indisputable advantage: it removes the financial pressure
placed previously on the producers, drastically decreasing their participation effort.
When balancing the goal “Improve vineyards treatment using InovWine system”, we also
took into account the need to induce producers to use new technologies. For this reason, training
actions provided by the ACC were kept in this version of the business model. These actions
demand a huge exertion from the cooperative. Nevertheless, the enhancement of producers’
technological skills can be a powerful tool to improve vineyard treatments and the wine quality.
The latter has particular interest for the cooperative. To promote the producers’ interaction with
the InovWine system, we also suggested that the regular alarms could be complemented with a
phone call (avoiding the use of e-mails and SMS - Short Message Service). This add-on can be
easily used by the producers, involves very low costs, and clearly favors their first contact with
the InovWine system. Furthermore, it can entice their participation and maintenance in the
business model, as well as impel them to insert personal and vineyard data fundamental to
enhance the accuracy of the generated alarms.

7.2 An action research study: using BIZ2BIS in the InovWine project
255
Improve the vineyards treatment
using InovWine system
Raise awareness of the
technological benefitsACC
5
1
ACC
4
Producers
3
Gain
Effort
Producers
ACC
14
6
Result
6
5
+ 8
+ 1
EffortGain
Make phone calls to get information
about treatmentsProducers
1
Effort
Provide warnings to support
the vineyard treatment
Effort
InovWine
3
3
ACC
2
Producers
1
Gain
Purchase kits (molecular
characterization and harmful
microorganisms identification) Producers
5
Effort
3
IPN
3
Biocant
3
3
IPN
Biocant
3
0
0
+3
+3
Producers
Gai
n
Legend:
Goal
Actor with the goal
under analysis Activity
Actor
[1..5]
Effort
Gain that the actor with the goal
under analysis obtains
Identify goals influenced positively
by the goal under analysis
Business model scenario: InovWine Artefact: Negotiation diagram Version/Date: 0.2, 19/01/2011 Author: Cristina Costa
Name
Actor
[1..5]
Gain
Goal
Effort spent by an actor
to perform an activity Gain that a goal brings
to an actor
Improve grape quality wine
productionAccess to the InovWine
database
Figure 48: “Improve vineyards treatment using InovWine system” negotiation diagram
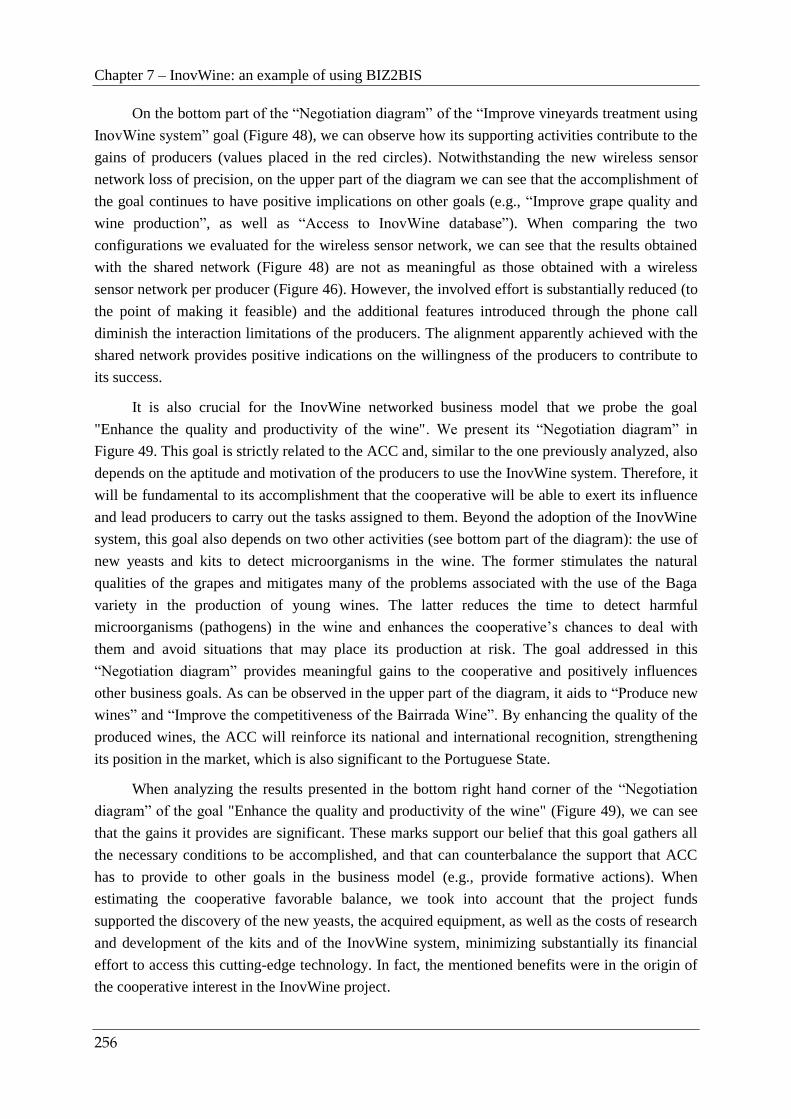
Chapter 7 – InovWine: an example of using BIZ2BIS
256
On the bottom part of the “Negotiation diagram” of the “Improve vineyards treatment using
InovWine system” goal (Figure 48), we can observe how its supporting activities contribute to the
gains of producers (values placed in the red circles). Notwithstanding the new wireless sensor
network loss of precision, on the upper part of the diagram we can see that the accomplishment of
the goal continues to have positive implications on other goals (e.g., “Improve grape quality and
wine production”, as well as “Access to InovWine database”). When comparing the two
configurations we evaluated for the wireless sensor network, we can see that the results obtained
with the shared network (Figure 48) are not as meaningful as those obtained with a wireless
sensor network per producer (Figure 46). However, the involved effort is substantially reduced (to
the point of making it feasible) and the additional features introduced through the phone call
diminish the interaction limitations of the producers. The alignment apparently achieved with the
shared network provides positive indications on the willingness of the producers to contribute to
its success.
It is also crucial for the InovWine networked business model that we probe the goal
"Enhance the quality and productivity of the wine". We present its “Negotiation diagram” in
Figure 49. This goal is strictly related to the ACC and, similar to the one previously analyzed, also
depends on the aptitude and motivation of the producers to use the InovWine system. Therefore, it
will be fundamental to its accomplishment that the cooperative will be able to exert its influence
and lead producers to carry out the tasks assigned to them. Beyond the adoption of the InovWine
system, this goal also depends on two other activities (see bottom part of the diagram): the use of
new yeasts and kits to detect microorganisms in the wine. The former stimulates the natural
qualities of the grapes and mitigates many of the problems associated with the use of the Baga
variety in the production of young wines. The latter reduces the time to detect harmful
microorganisms (pathogens) in the wine and enhances the cooperative’s chances to deal with
them and avoid situations that may place its production at risk. The goal addressed in this
“Negotiation diagram” provides meaningful gains to the cooperative and positively influences
other business goals. As can be observed in the upper part of the diagram, it aids to “Produce new
wines” and “Improve the competitiveness of the Bairrada Wine”. By enhancing the quality of the
produced wines, the ACC will reinforce its national and international recognition, strengthening
its position in the market, which is also significant to the Portuguese State.
When analyzing the results presented in the bottom right hand corner of the “Negotiation
diagram” of the goal "Enhance the quality and productivity of the wine" (Figure 49), we can see
that the gains it provides are significant. These marks support our belief that this goal gathers all
the necessary conditions to be accomplished, and that can counterbalance the support that ACC
has to provide to other goals in the business model (e.g., provide formative actions). When
estimating the cooperative favorable balance, we took into account that the project funds
supported the discovery of the new yeasts, the acquired equipment, as well as the costs of research
and development of the kits and of the InovWine system, minimizing substantially its financial
effort to access this cutting-edge technology. In fact, the mentioned benefits were in the origin of
the cooperative interest in the InovWine project.
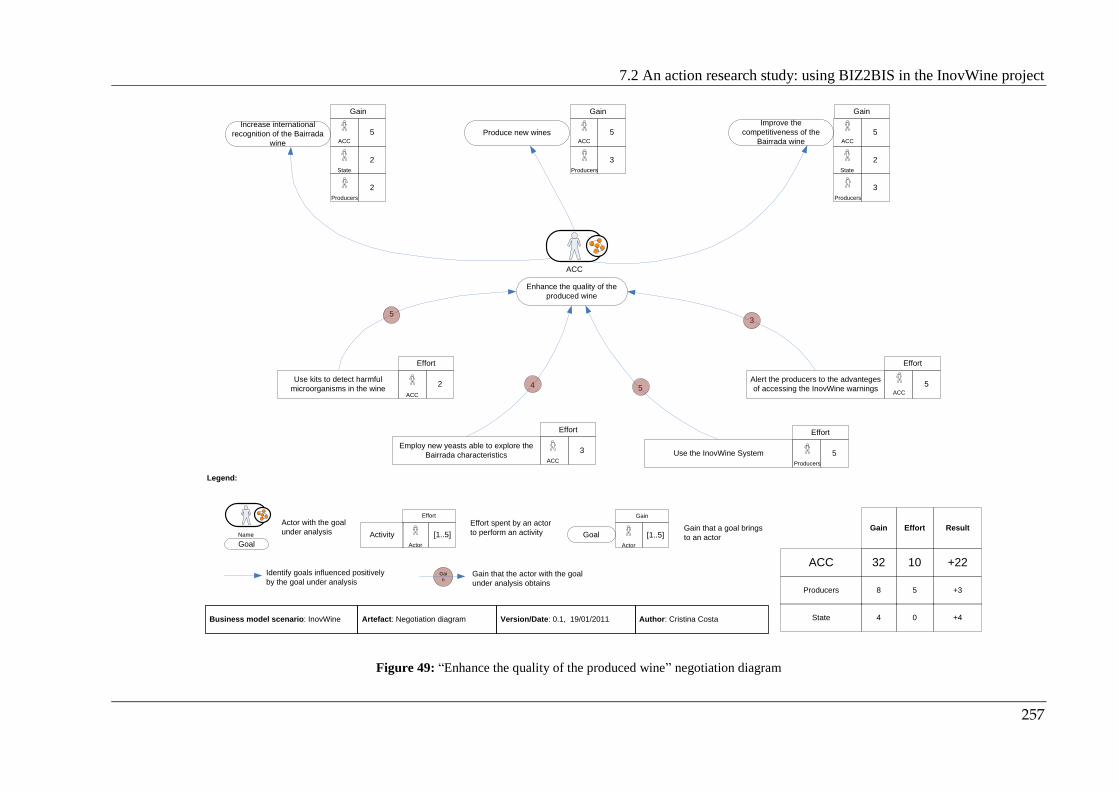
7.2 An action research study: using BIZ2BIS in the InovWine project
257
Enhance the quality of the
produced wine
Alert the producers to the advanteges
of accessing the InovWine warnings ACC
5
3
ACC
5
Gain
Effort
ACC 32
Result
10 +22
EffortGain
Employ new yeasts able to explore the
Bairrada characteristicsACC
3
Effort
Use kits to detect harmful
microorganisms in the wine2
Effort
ACC
5
4
ACC
5
Gain
ACC
5
Gain
2
State
2
State
State 4 0 +4
ACC
Gai
n
Legend:
Goal
Actor with the goal
under analysis Activity
Actor
[1..5]
Effort
Gain that the actor with the goal
under analysis obtains
Identify goals influenced positively
by the goal under analysis
Business model scenario: InovWine Artefact: Negotiation diagram Version/Date: 0.1, 19/01/2011 Author: Cristina Costa
Name
Actor
[1..5]
Gain
Goal
Effort spent by an actor
to perform an activity Gain that a goal brings
to an actor
Increase international
recognition of the Bairrada
wine
Produce new wines
Improve the
competitiveness of the
Bairrada wine
Use the InovWine System
Producers
5
Effort
5
3
Producers
3
Producers
2
Producers
Producers 8 5 +3
Figure 49: “Enhance the quality of the produced wine” negotiation diagram

Chapter 7 – InovWine: an example of using BIZ2BIS
258
The presented “Negotiation diagrams” show clear advantages for the ACC and its members
in using the InovWine system with the adjustments that we proposed. Of course, these actors have
to support the achievement of other goals not analyzed. However, these are less vital to the
business model, or are not as expensive, or involve activities that would have to be performed,
regardless of the existence, or not, of the InovWine system.
7.2.7 Phase I, Step I.c – Representation of the redesigned business model
BIZ2BIS pointed out a set of adjustments to the business model submitted to NSRF in order
to strengthen the presence of the actors in the network and ensure that the solution we envisioned
was able to respond to their expectations. Since this new vision presents significant differences
when compared with that described in the initial NSRF proposal, we considered it wise and
pertinent to promote discussion. To foster communication between all actors, we decided to return
to BIZ2BIS’ Phase I, Step I.c “Representation of the business model” and use the information
gathered in Phase I, Step I.a and Step I.b to create a “Flow diagram” that depicted the latest version.
We present the developed diagram in Figure 50. It describes how the interactions among the
actors embed the outcomes of the InovWine project. Four relevant examples of developed
products and services are: a monitoring and alarm system supported by a wireless sensor network,
RFIDs systems, molecular characterization kits, and microorganism identification test kits. The
first two require maintenance services, while the last two are supported by laboratory tests. In the
“Flow diagram” of Figure 50, we did not consider how these outcomes would be placed at the
disposal of the actors and commercialized. For readability sake, we decided to detail financial
flows in a new “Flow diagram” (Figure 51). An additional reason to separate them from the more
stable configuration of network flows in Figure 50 was also the uncertainty on how these flows
will be managed. The inherent component of indecision and unpredictability in a project like
InovWine makes it difficult to clarify its commercial transaction outline in an early stage. As
questions relevant to its exploration begin to be answered (e.g., costs of the solution, maintenance
periods, access to the database, and the producers’ level of acceptance towards the products and
services) financial details will be adjusted, as well as the corresponding “Flow diagram” in Figure
51. Actors with the power to settle on the future directions will have to consider how maintenance
services and laboratory support will be managed at the end of the project, when no more public
funds will be available. In an attempt to identify critical dependencies in these activities, we
decided to move on to BIZ2BIS’ Phase II, Step I.d “Description of critical dependencies”.
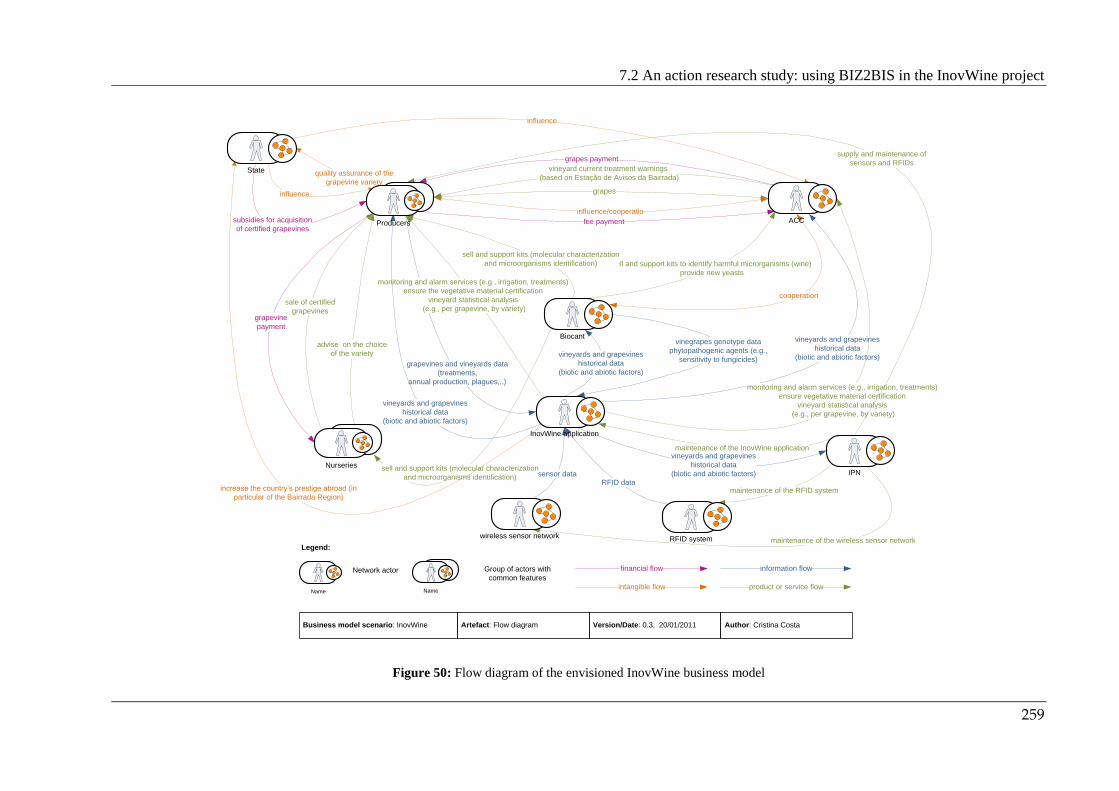
7.2 An action research study: using BIZ2BIS in the InovWine project
259
subsidies for acquisition
of certified grapevines
vineyards and grapevines
historical data
(biotic and abiotic factors)
grapes
influence/cooperatio
vineyard current treatment warnings
(based on Estação de Avisos da Bairrada)
grapes payment
fee payment
grapevines and vineyards data
(treatments,
annual production, plagues,..)monitoring and alarm services (e.g., irrigation, treatments)
ensure vegetative material certification
vineyard statistical analysis
(e.g., per grapevine, by variety)
monitoring and alarm services (e.g., irrigation, treatments)
ensure the vegetative material certification
vineyard statistical analysis
(e.g., per grapevine, by variety)
vineyards and grapevines
historical data
(biotic and abiotic factors)
vinegrapes genotype data
phytopathogenic agents (e.g.,
sensitivity to fungicides)
vineyards and grapevines
historical data
(biotic and abiotic factors)
vineyards and grapevines
historical data
(biotic and abiotic factors)
sell and support kits to identify harmful microrganisms (wine)
provide new yeasts
sell and support kits (molecular characterization
and microorganisms identification)
sell and support kits (molecular characterization
and microorganisms identification)
sale of certified
grapevinesgrapevine
payment
increase the country’s prestige abroad (in
particular of the Bairrada Region)
advise on the choice
of the variety
maintenance of the InovWine application
quality assurance of the
grapevine variety
influence
influence
sensor data
maintenance of the RFID system
maintenance of the wireless sensor network
RFID data
supply and maintenance of
sensors and RFIDs
cooperation
Biocant
ACC
State
IPN
RFID systemwireless sensor network
InovWine application
Producers
Nurseries
Legend:
Network actor Group of actors with
common features
financial flow
intangible flow
information flow
product or service flow
Business model scenario: InovWine Artefact: Flow diagram Version/Date: 0.3, 20/01/2011 Author: Cristina Costa
Name Name
Figure 50: Flow diagram of the envisioned InovWine business model
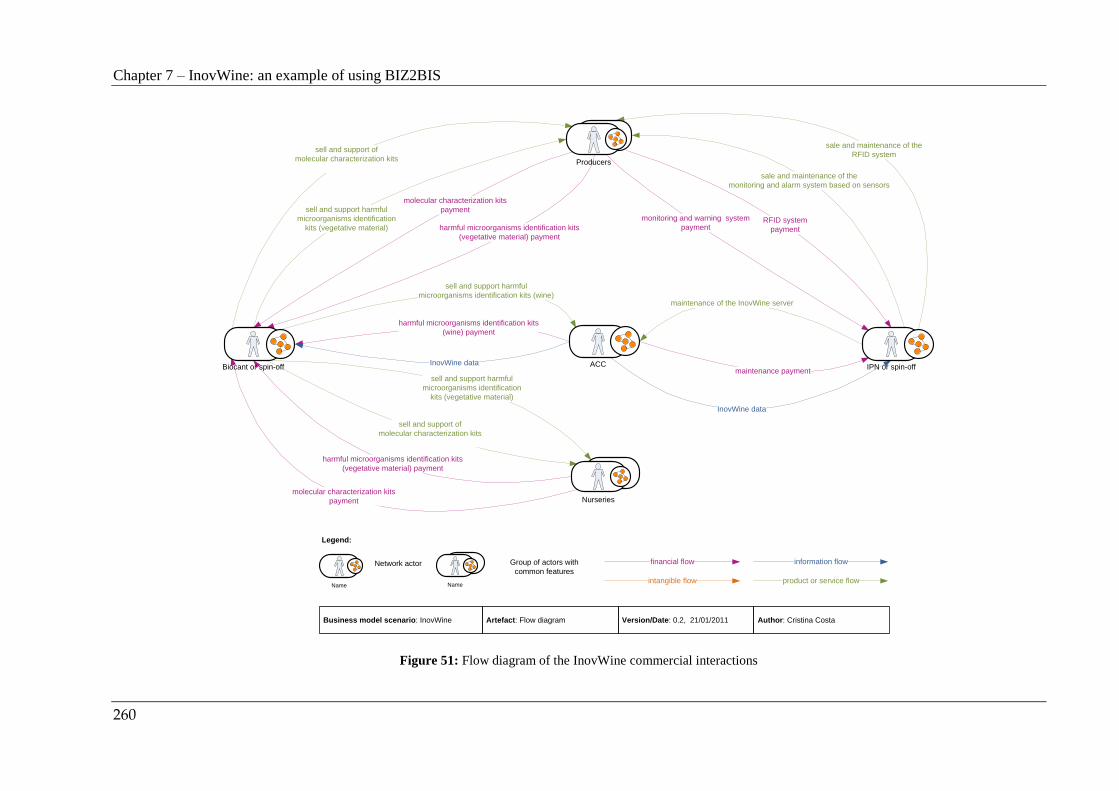
Chapter 7 – InovWine: an example of using BIZ2BIS
260
sell and support harmful
microorganisms identification
kits (vegetative material)
molecular characterization kits
payment
sell and support of
molecular characterization kits
harmful microorganisms identification kits
(vegetative material) payment
sell and support harmful
microorganisms identification kits (wine)
harmful microorganisms identification kits
(wine) payment
sell and support of
molecular characterization kits
sell and support harmful
microorganisms identification
kits (vegetative material)
harmful microorganisms identification kits
(vegetative material) payment
molecular characterization kits
payment
sale and maintenance of the
RFID system
sale and maintenance of the
monitoring and alarm system based on sensors
RFID system
payment
monitoring and warning system
payment
maintenance of the InovWine server
maintenance payment
InovWine data
Producers
Nurseries
ACC IPN or spin-offBiocant or spin-offInovWine data
Legend:
Network actor Group of actors with
common features
financial flow
intangible flow
information flow
product or service flow
Business model scenario: InovWine Artefact: Flow diagram Version/Date: 0.2, 21/01/2011 Author: Cristina Costa
Name Name
Figure 51: Flow diagram of the InovWine commercial interactions
7.2 An action research study: using BIZ2BIS in the InovWine project
261
7.2.8 Phase II, step II.d –Discussion of threats to the redesigned business
model
To support and promote discussion on how the services provided by IPN and Biocant could
be integrated into the business model, we developed the “Dependency diagram” presented in
Figure 52. By detailing its business model flows, it became clear that, to detail the actor
interactions with these services, the two technological centers would have to clarify if they would
treat ACC and its members as regular clients. This choice must be well pondered. In spite of the
profits that supporting activities (like the maintenance of the equipment) can bring, high prices
can lead actors to abandon the network (red “X” in the diagram), thus undermining and putting at
risk already developed work, and consequently the chances of getting royalties or profit from the
sale of products or services. To minimize this scenario, we proposed the establishment of
partnerships, for example: maintenance fees could be reduced, in exchange for a privileged access
to the InovWine database; or collective purchases could be organized in order to reduce cost
acquisitions, thus promoting InovWine adherence (orange rectangle). These purchases must be
done in agreement with ACC, since the cooperative will hold and manage the InovWine
information system (including the registration of its users and of acquired equipment).
In the proposals presented so far, we only addressed acquisitions of services carried out by
actors involved in the InovWine business model. However, these services can be of interest to
external actors. In this case, the transaction will be guided by the contract already established
among the actors responsible for the InovWine project, whose clauses specify how the project
achievements must be explored. These external relationships give rise to new business models,
which go beyond the scope of the InovWine business model. Therefore, we do not consider them
in our study.
The identification of the goals that each actor expected to achieve with the network (section
7.2.1) complemented with the detection of possible collaborations (section 7.2.5), led us to
explore affinities beyond the ones we already covered (between ACC, producers, Biocant, and
IPN). For instance, the activities currently developed by the Meteorological Station of Bairrada, as
well as its perceived interests and problems, made us believe that synergies can be exploited
around this actor. Taking into account its present role, we looked at how its participation could be
more active in the InovWine business model (see Table 28, field “Network opportunities” and
Table 36). To present and discuss this hypothetical scenario, we returned again to Phase I, Step I.c
“Representation of the business model”. We used the “Flow diagram” to present our proposals as
we detail in the next section.

Chapter 7 – InovWine: an example of using BIZ2BIS
262
vineyards and grapevines
historical data
(biotic and abiotic factors)
cooperation
cooperation
manage synergies that allow the acquisition
of equipment by groups of producers
Inovwine data
cooperation
ACC
Producers
InovWine system
Estação de Avisos da Bairrada
vineyard treatment warnings
vineyard treatment warnings
cooperation
meteorological and biological data
monitoring and warning services
monitoring and warning services
vineyards and grapevines
historical data
(biotic and abiotic factors)
Legend:
Network actor Group of actors with
common features
financial flow
intangible flow
information flow
product or service flow
Business model scenario: InovWine Artefact: Flow diagram Version/Date: 0.1, 22/01/2011 Author: Cristina Costa
Name Name
Figure 52: Dependency diagram of the InovWine maintenance protocol/contract
7.2 An action research study: using BIZ2BIS in the InovWine project
263
7.2.9 Phase I, step II.c –Representation of complementing scenarios
At present, the Meteorological Station of Bairrada receives meteorological data from a
network of stations installed between Estarreja (northern boundary) and Soure (Southern limit)
that measures the maximum and minimum temperature of the air, relative humidity and
precipitation. Given the distances that separate the stations, the meteorological station hired
collaborators that, on a daily basis, report by land mail complementary meteorological data from
small stations installed on their fields. In addition to the meteorological component, its warnings
are also corroborated by biological data and phenological observations. The ACC subscribes this
service provided by the meteorological station. On the contrary, the majority of its producers
prefer not to pay for it. As a consequence, in many cases they do not have access to the warnings
in due time. As seen during the interviews, the cooperative has some difficulties in transmitting
warnings to the producers, since most of these have problems is using e-mail systems or reading
mobile text messages. The information dissemination is usually made in person (usually by ACC
technicians), which inhibits an expeditious transmission and jeopardizes the pertinence of
warnings. The meteorological station also has to deal with this communication difficulty.
Although it can issue alerts by email and SMS, usually it has to post them, which can be critical to
the responsiveness of the producers in urgent cases, and thus affect the prestige of the
meteorological station (Phase I, Step I.a, “Networked business model description chart”, Table 28).
The difficulties of the meteorological station in issuing the warnings in a timely manner can
be minimized by the InovWine information system (through its phone calls). Furthermore, its
shared wireless network can complement the station database with specific climate data on the
region. In turn, the meteorological station expertise and data can be used to “tune” the InovWine
algorithms used for generating the alarms. We depicted this complementing scenario in Figure 53
and the project managers took it under consideration. We want to notice that this cooperation can
be performed with another meteorological station. We took the initiative to indicate Bairrada due
to its proximity and the already established relationships with ACC. To provide a broader
understanding of our suggestions and make their appraisal easier, we provided a condensed and
comprehensive overview of the proposals we discussed in the three developed “Flow diagrams”
(the updated version of the business model, its commercial transactions, and the hypothetical
cooperation with the station) in the form of a matrix (see Matrix 3). The obtained knowledge on
the wine industry, also led us to consider another completing scenario able to explore the insights
gained during the project to better meet the needs of large producers. The actor with the power to
make decisions found the scenarios we proposed appealing. To better realize their potential, we
established contacts and initiated negotiations that lasted several months, as detailed in the agenda
in Appendix A. The scenario that considered the participation of the meteorological station in the
business model became unviable due to financial difficulties. A large producer considered the
InovWine project promising and applied the insights acquired to improve its business with good
results. However, since its study goes beyond the scope of the InovWine business model, the
outcomes obtained will not be presented in this dissertation.

Chapter 7 – InovWine: an example of using BIZ2BIS
264
vineyards and grapevines
historical data
(biotic and abiotic factors)
cooperation
cooperation
manage synergies that allow the acquisition
of equipment by groups of producers
Inovwine data
cooperation
ACC
Producers
InovWine system
Estação de Avisos da Bairrada
vineyard treatment warnings
vineyard treatment warnings
cooperation
meteorological and biological data
monitoring and warning services
monitoring and warning services
vineyards and grapevines
historical data
(biotic and abiotic factors)
Legend:
Network actor Group of actors with
common features
financial flow
intangible flow
information flow
product or service flow
Business model scenario: InovWine Artefact: Flow diagram Version/Date: 0.1, 22/01/2010 Author: Cristina Costa
Name Name
Figure 53: Flow diagram of synergies with a meteorological station

7.2 An action research study: using BIZ2BIS in the InovWine project
265
Matrix 3: Flow matrix of the updated version of the InovWine business model (includes complementing scenarios)
Meteorological Station ACC Producers InovWine system State/QREN Biocant IPN Nurseries
Meteorologica
l Station
- vineyard treatment
warnings -
cooperation
- vineyard treatment
warnings
- cooperation
- cooperation
ACC - cooperation
- manage synergies that
allow the acquisition of
equipment by groups of
producers
- Influence/cooperation
- grapes payment
- cooperation
- harmful microorganisms
identification kits (wine)
payment -
InovWine data
- system maintenance
payment
- InovWine data
Producers - cooperaton
- grapes
- fee payment
- influence/cooperation
- grapevines and vineyard
data (e.g, treatments,
annual production, plagues)
- quality assurance of the
grapevine variety
- kits payment (molecular
characterization and
harmful microorganisms
identification)
- monitoring and warning
system
payment
- grapevine payment
InovWine
system
- InovWine data
- cooperation
- vineyards and grapevines
historical data (biotic and
abiotic factors)
- monitoring and alarm
services
-ensure the vegetative
- monitoring and alarm
services -
ensure the vegetative
material certification
- vineyard statistical
analysis
- increase the country’s
prestige abroad (in
particular of the Bairrada
Region)
- vineyards and grapevines
historical data (biotic and
abiotic factors)
- vineyards and grapevines
historical data (biotic and
abiotic factors)
State/QREN - Influence
- Influence
- subsidies for acquisition of
certified grapevines
Biocant
- Cooperation
- sell and support kits to
identify harmful
microrganisms (wine)
- provide new yeasts
- sell and support kits
(molecular characterization
and microorganisms
identification)
- vinegrapes genotype data
phytopathogenic agents
(e.g., sensitivity to
fungicides)
- sell and support kits
(molecular characterization
and microorganisms
identification)
IPN- supply and maintenance
of sensors and RFIDs
- maintenance of the
InovWine system
Nurseries
- sale of certified grapevines
- advise on the choice of the
variety
- kits payment (molecular
characterization and
harmful microorganisms
identification)
Value
propositions
ACTOR - TARGET
AC
TOR
- S
OU
RC
E
Version and Date: 0.1, 23/01/2011 Author: Cristina CostaBusiness model: InovWine

Chapter 7 – InovWine: an example of using BIZ2BIS
266
Next, we will advance to Phase II, Step I.e “Stabilization of the envisioned value
propositions” to identify the value propositions made available by the InovWine business model,
excluding for the above reasons the two complementing scenarios discussed in this section.
7.2.10 Phase II, Step II.e – Stabilization of the envisioned value propositions
Supported on BIZ2BIS’ insights, we gathered the proper conditions to stabilize the
envisioned value propositions for the InovWine business model, according to the guidelines
established in Step II.e. On the one hand, Step I.c “Representation of the business model” and its
“Flow diagrams” (Figure 50 and Figure 51) provided us with a detailed list of the existing
business flows. On the other hand, Step I.b “Description of participating actors” and the developed
“Actor description charts” (from Table 29 to Table 37) detailed the activities carried out by the
actors. By knowing who performs the activities, what they comprise, and the resulting flows, we
could prospect their assembling possibilities. The arranged combinations allowed us to make out
the resulting value propositions and gear them towards the aims of the participating actors. First,
we listed the identified flows based on the developed “Flow diagrams”. Next, based on the
information gathered on the network and its actors (in Step I.a and Step I.b), we created our draft
version of the value propositions. We placed the identified flows in the first column of the
“Business Flows/Value propositions chart” (artifact developed for Step II.e) and inserted the value
propositions in its first row. Then, for each flow, we iteratively tried to recognize the value
propositions it could support. If these had not yet been identified, we added them. A similar
approach was applied to groups of flows. It was important to perceive how flows could be brought
together, and identify the value proposition(s) they could give rise to. For instance, the flows from
F1 to F5, and F13 allowed us to identify V4 “Improve the support to the ACC producers”. As an
outcome of the “Business Flows/Value propositions chart”, we can visualize the resulting value
propositions and their related flows.
We note that the obtained list of value propositions must be able to address the goals
identified in Step II.b “Description of participating actors”, in the “Actors/Goals affinity chart”
(Table 38, which provides a compacted vision of the actors’ goals in the business model).
Otherwise, the business model will have strong chances of failure, given that some of the actors
will not see their interests satisfied. In the InovWine business model, when confronting value
propositions and expected goals, we checked that the updated version of the business model was
able to respond to the interests of the actors. To make the scope of some value propositions
identified in the chart clearer and to facilitate its correspondence with the actors’ goals, we
performed minor adjustments in our initial list. For instance, we subdivided some of them into
two and slightly changed their early designations.

7.2 An action research study: using BIZ2BIS in the InovWine project
267
Table 39: InovWine Business flows/Value propositions chart
Chapter 7 – InovWine: an example of using BIZ2BIS
268
The analysis of the “Business Flows/Value propositions chart” (Table 39) allowed us to
disclose the flows that support more value propositions. These were:
Monitoring and alarm system service;
Grapevines and vineyard data entered by the producers (e.g., treatments and
plagues);
Grapevines genotyping kit service (includes the sell, support, and data);
InovWine vineyards historical data (biotic and abiotic factors);
Kit to detect harmful microorganisms in the grapevines (includes the sell, support,
and data);
InovWine grapevines historical data (biotic and abiotic factors);
ACC influence in the region.
We paid special attention to the above flows, since the identified value propositions depend
mainly on them for their achievement. For example, the first two are closely related to value
propositions supported by a larger number of flows and that gather a significant interest from
actors. If these flows are placed at risk, the value propositions will be put into question, as well as
the effort spent by the actors to perform the activities that support them.
Through Table 39 we could also identify the value propositions that depended on a higher
number of flows. These were:
Increase the quality of the ACC wine through the InovWine information system;
Increase the ACC members' productivity through the InovWine information system;
Safeguard the Bairrada genetic heritage;
Improve the support to the ACC producers;
Detect harmful microorganisms in the vineyards;
Obtain scientific prestige through the dissemination of new technological products for
the wine industry;
Get royalties through project spin-offs, or profit from the sale of products or services.
The list above can be used as an indicator of the importance of the value propositions in the
networked business model. It points out the ones supported by many flows, which may imply the
involvement of more actors and a bigger effort from the network (exceptions to this logic are
always possible). Furthermore, the list was useful to validate options performed during the
application of BIZ2BIS. For instance, it ratified our decision of scrutinizing (in Phase II) two goals
we considered critical to the business model: one that addressed the improvement of the vineyards
treatment through InovWine and other that focused on the wine quality enhancement. The
achieved list also reflects the outcomes of the negotiations carried out by encompassing the
proposals that we, in collaboration with the remaining actors, articulated to promote the

7.2 An action research study: using BIZ2BIS in the InovWine project
269
accomplishment of the networked business model’s aims and meet the expectations of the actors.
For instance, it confirms that contextual issues influenced choices made (e.g., specific actions
were envisaged to minimize and motivate the participation of the producers, as well as to preserve
the genetic heritage of the Bairrada’s grapevines). Furthermore, several value propositions
underline the effort to include in the InovWine system features with positive impact on crucial
aspects of the wine production activity, such as the enhancement of the grapevine quality and
productivity. They also emphasize the attempt to provide financial income to the participating
actors and point out issues to explore when applying the outcomes of the InovWine project
beyond the Bairrada Region. For instance, some actors (namely, Biocant and IPN) can use the
obtained knowledge to develop similar services and systems and get dividends from other
business models. ACC has a similar aspiration, shared with Biocant, but concerning yeasts.
The insights we obtained with BIZ2BIS’ Phase II made us believe that the updated version
of the business model reached a sustainable alignment. However, this is our perception. To avoid
our bias and assure that the InovWine business model was able to express the actors’ voices,
views, and concerns, as well as to respond to their interests, we advanced to BIZ2BIS’ Phase III.
7.2.11 Phase III, Step III.a – Evaluation of the actors perceptions
Step III.a enables the actors own assessment of the reached InovWine business model
through the “Interview chart” (Table 40). In this artifact, we asked the actors that will continue in
the business model after the end of the InovWine project to classify the value propositions with
which they will be involved (from the ones identified in the “Business Flows/Value propositions
chart”, Table 39). They expressed their judgment of the effort spent to support a certain value
proposition, as well as the gain obtained from it.
Beyond the evaluation that each actor makes of the value propositions, the “Interview
chart” also encloses an extra perspective. It discloses how value propositions influence each other
according to the perspective of each actor. We also encouraged the respondent actors to criticize
the list of value propositions we presented to them. Only ACC suggested we change the
designation assigned to V15 from “Receive quotas from the cooperative members” to “Increase
the number of cooperative members”. This amendment underlined, once again, that, in some
situations, financial parameters are not the only factor, or the most suitable, to perceive the
interest of the actors in a business model.
In Table 40 we can observe the values and the dependencies filled in by the actors. The
provided data enabled us to perform three tests. First, we verified, for each actor, if the balance
between the gain and the effort was positive. Then, we checked if the value propositions
addressed by each actor were in accordance with their goals. Finally, we developed efforts to
assure that problematic dependencies between value propositions had viable alternatives.

Chapter 7 – InovWine: an example of using BIZ2BIS
270
Table 40: Interview chart
Actors
Value propositions ACC Producer IPN Biocant
Increase the quality of the Bairrada wine V1 (+5,-3)/ +V11,+V15
(+5,-5)/ +V11
Increase the productivity of the Bairrada wine
V2 (+3,-2) (+5,-5)
Safeguard the Bairrada genetic heritage V3 (+4,-2)/+V11 (+5,-5)/ +V1,+V2
Improve the support to the ACC members
V4 (+5,-4)/+V15 (+5)/ +V1,+V2
Detect harmful microorganisms in the vineyards
V5 (+4,-2)/ +V1,+V4,+V9
(+4,-3)/ +V1,+V2
(+4/-2)/ +V6,+V7
Obtain scientific prestige through the dissemination of new technological products for the wine industry
V6 (+3,-2)/+V11 (+5,-1)/ +V7
(+5,-1)
Get royalties through project spin-offs, or profit from the sale of products or services
V7 (+5,-2) (+4/-2) (+5,-1)
Use InovWine monitoring and alarm services
V8 (+4,-4)/+V1, +V2,+V4
(+5,-5)/ +V1,+V2
(+2/-1) /+V6,+V7
Improve warnings specificity and accuracy
V9 (+4,-3)/+V4 (+5,-4)/ +V1,+V2
/+V6,+V7
Access to the grapevines history V10 (+4,-3)/ +V4,+V8,+V9
(+3,-5)
Get prestige in the wine industry V11 (+5,-3) (+5) (+3/-1)
Access to the vineyard history V12 (+4,-4)/+V4, +V8,+V9
(+5,-3)/ +V1,+V2
Detect harmful microorganisms in wine V13 (+5,-3)/ +V1,+V11
(+4,-1)/ +V1
(+4/-2)/ +V6,+V7
Create new wines based on the discovery of new yeasts
V14 (+5,-4)/ +V1,+V11
(+5,-1)/ +V11
Increase de number of cooperative members
V15 (+4,-3)/+V11 (-1)
Date: 11/03/2011 Sum (+64/-44) (+56/-38) (+14/-5) (+18,-6)
In the first test, we verified that all the actors considered their presence in the business
model advantageous. In the field “Sum”, of the “Interview Chart”, everyone was able to obtain a
positive difference between the obtained gain and the effort spent. The achieved results reinforced
the indicators already provided by BIZ2BIS in Phase II, which pointed to a successful enrolment
and commitment of the actors towards the networked business model. As we can see from the
data, ACC and the producer expect to obtain significant gains through the available value
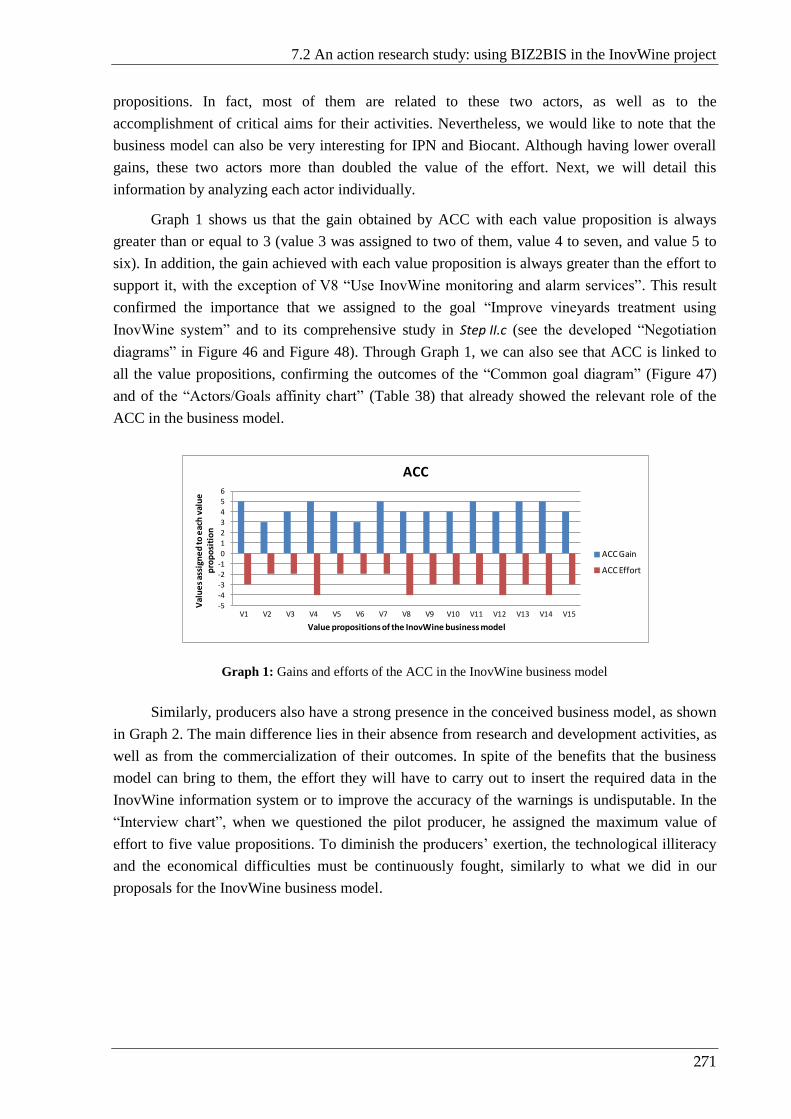
7.2 An action research study: using BIZ2BIS in the InovWine project
271
propositions. In fact, most of them are related to these two actors, as well as to the
accomplishment of critical aims for their activities. Nevertheless, we would like to note that the
business model can also be very interesting for IPN and Biocant. Although having lower overall
gains, these two actors more than doubled the value of the effort. Next, we will detail this
information by analyzing each actor individually.
Graph 1 shows us that the gain obtained by ACC with each value proposition is always
greater than or equal to 3 (value 3 was assigned to two of them, value 4 to seven, and value 5 to
six). In addition, the gain achieved with each value proposition is always greater than the effort to
support it, with the exception of V8 “Use InovWine monitoring and alarm services”. This result
confirmed the importance that we assigned to the goal “Improve vineyards treatment using
InovWine system” and to its comprehensive study in Step II.c (see the developed “Negotiation
diagrams” in Figure 46 and Figure 48). Through Graph 1, we can also see that ACC is linked to
all the value propositions, confirming the outcomes of the “Common goal diagram” (Figure 47)
and of the “Actors/Goals affinity chart” (Table 38) that already showed the relevant role of the
ACC in the business model.
Graph 1: Gains and efforts of the ACC in the InovWine business model
Similarly, producers also have a strong presence in the conceived business model, as shown
in Graph 2. The main difference lies in their absence from research and development activities, as
well as from the commercialization of their outcomes. In spite of the benefits that the business
model can bring to them, the effort they will have to carry out to insert the required data in the
InovWine information system or to improve the accuracy of the warnings is undisputable. In the
“Interview chart”, when we questioned the pilot producer, he assigned the maximum value of
effort to five value propositions. To diminish the producers’ exertion, the technological illiteracy
and the economical difficulties must be continuously fought, similarly to what we did in our
proposals for the InovWine business model.
-5
-4
-3
-2
-1
0
1
2
3
4
5
6
V1 V2 V3 V4 V5 V6 V7 V8 V9 V10 V11 V12 V13 V14 V15
Val
ue
s as
sign
ed
to e
ach
val
ue
p
rop
osi
tio
n
Value propositions of the InovWine business model
ACC
ACC Gain
ACC Effort

Chapter 7 – InovWine: an example of using BIZ2BIS
272
Graph 2: Gains and efforts of producers in the InovWine business model
Graph 3 and Graph 4 show that IPN and Biocant have similar interests in the InovWine
business model (convergence already detected in the “Actors/Goals affinity chart”, Table 38). The
two organizations expect to benefit from the supporting services that must be provided to the
InovWine systems (e.g., the application, the wireless network, and the kits). Besides that, the
knowledge developed during the project will provide insights to their research activities and might
as well contribute to enhance the prestige of these organizations or open up new business
opportunities. Taking into account the benefits these organizations intend to achieve and that their
activities of research and development have significantly been supported by the InovWine project
funds (none of them filled in an effort that exceeds “-2”), their participation in the business model
will undoubtedly be positive.
Graph 3: Gains and efforts of the IPN in the InovWine business model
-5-4-3-2-10123456
V1 V2 V3 V4 V5 V6 V7 V8 V9 V10 V11 V12 V13 V14 V15
Val
ue
s as
sign
ed
to e
ach
val
ue
p
rop
osi
tio
n
Value propositions of the InovWine Business model
Producer
Producer Gain
Producer Effort
-5-4-3-2-10123456
V1 V2 V3 V4 V5 V6 V7 V8 V9 V10 V11 V12 V13 V14 V15
Val
ue
s as
sign
ed
to e
ach
val
ue
p
rop
osi
tio
n
Value propositions of the InovWine business model
IPN
IPN Gain
IPN Effort
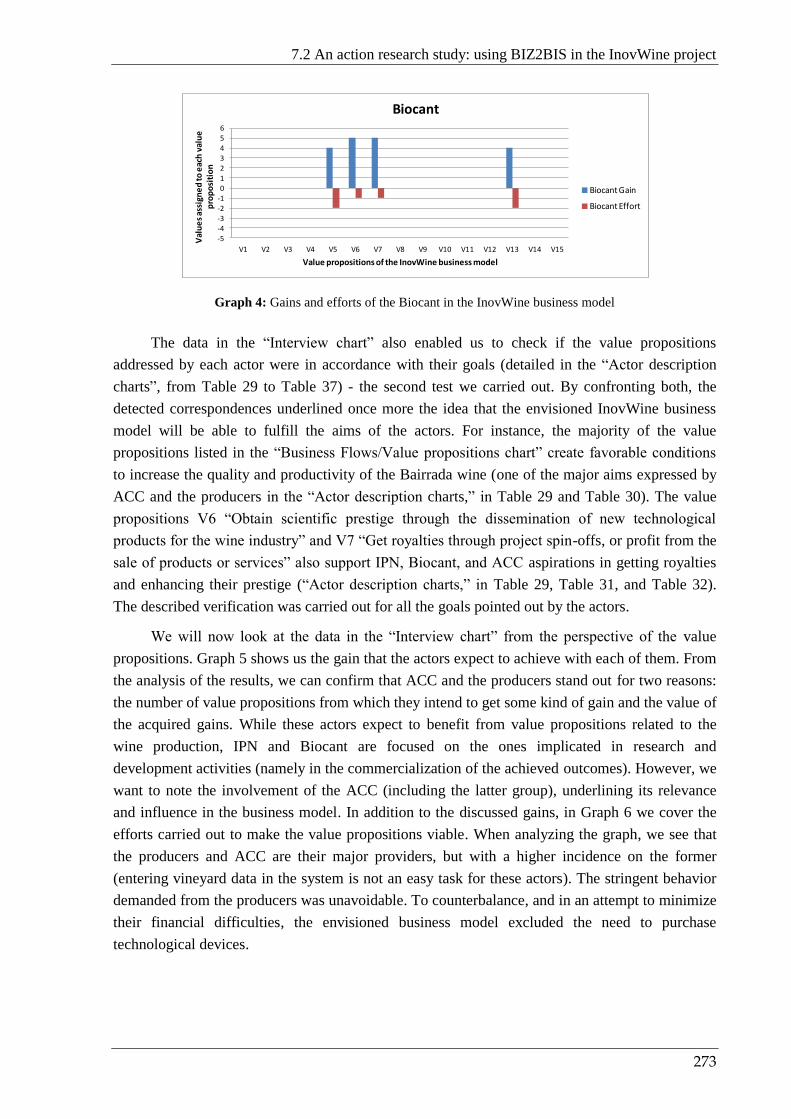
7.2 An action research study: using BIZ2BIS in the InovWine project
273
Graph 4: Gains and efforts of the Biocant in the InovWine business model
The data in the “Interview chart” also enabled us to check if the value propositions
addressed by each actor were in accordance with their goals (detailed in the “Actor description
charts”, from Table 29 to Table 37) - the second test we carried out. By confronting both, the
detected correspondences underlined once more the idea that the envisioned InovWine business
model will be able to fulfill the aims of the actors. For instance, the majority of the value
propositions listed in the “Business Flows/Value propositions chart” create favorable conditions
to increase the quality and productivity of the Bairrada wine (one of the major aims expressed by
ACC and the producers in the “Actor description charts,” in Table 29 and Table 30). The value
propositions V6 “Obtain scientific prestige through the dissemination of new technological
products for the wine industry” and V7 “Get royalties through project spin-offs, or profit from the
sale of products or services” also support IPN, Biocant, and ACC aspirations in getting royalties
and enhancing their prestige (“Actor description charts,” in Table 29, Table 31, and Table 32).
The described verification was carried out for all the goals pointed out by the actors.
We will now look at the data in the “Interview chart” from the perspective of the value
propositions. Graph 5 shows us the gain that the actors expect to achieve with each of them. From
the analysis of the results, we can confirm that ACC and the producers stand out for two reasons:
the number of value propositions from which they intend to get some kind of gain and the value of
the acquired gains. While these actors expect to benefit from value propositions related to the
wine production, IPN and Biocant are focused on the ones implicated in research and
development activities (namely in the commercialization of the achieved outcomes). However, we
want to note the involvement of the ACC (including the latter group), underlining its relevance
and influence in the business model. In addition to the discussed gains, in Graph 6 we cover the
efforts carried out to make the value propositions viable. When analyzing the graph, we see that
the producers and ACC are their major providers, but with a higher incidence on the former
(entering vineyard data in the system is not an easy task for these actors). The stringent behavior
demanded from the producers was unavoidable. To counterbalance, and in an attempt to minimize
their financial difficulties, the envisioned business model excluded the need to purchase
technological devices.
-5-4-3-2-10123456
V1 V2 V3 V4 V5 V6 V7 V8 V9 V10 V11 V12 V13 V14 V15
Val
ue
s as
sign
ed
to e
ach
val
ue
p
rop
osi
tio
n
Value propositions of the InovWine business model
Biocant
Biocant Gain
Biocant Effort

Chapter 7 – InovWine: an example of using BIZ2BIS
274
Graph 5: Gain that the actors of the InovWine business model obtain per value proposition
Graph 6: Effort that the actors of the InovWine business model spend per value proposition
Based on the data in the “Interview chart”, we created a list of the value propositions to
which the actors assigned more gains. It essentially addresses the ones able to support the
achievement of the goals that motivated their participation in the business model. Below, we
present the top of the list (topics in the same item were assigned with an equal gain):
1. V7 “Get royalties through project spin-offs, or profit from the sale of products or
services”;
2. V6 “Obtain scientific prestige through the dissemination of new technological products
for the wine industry”, V11 “Get prestige in the wine industry”, and V13 “Detect
harmful microorganisms in wine”;
3. V5 “Detect harmful microorganisms in the vineyards”;
4. V8 “Use InovWine monitoring and alarm services”.
The list of value propositions pointed out as more demanding to the actors are related to
entering of data into the information system and the acquisition of devices to enhance the
accuracy of the warnings (e.g., RFIDs, wireless sensor networks, or biological kits). At the top of
the list we have:
1. V8 “Use InovWine monitoring and alarm services”;
2. V1 “Increase the quality of the Bairrada wine” and V10 “Access to the grapevines
history”
0
1
2
3
4
5
6
V1 V2 V3 V4 V5 V6 V7 V8 V9 V10 V11 V12 V13 V14 V15
Gai
n a
ssig
ne
d to
eac
h v
alu
e
pro
po
siti
on
Value propositions of the InovWine business model
Gain per value proposition
ACC Gain
Producer Gain
IPN Gain
Biocant Gain
-6
-5
-4
-3
-2
-1
0
V1 V2 V3 V4 V5 V6 V7 V8 V9 V10 V11 V12 V13 V14 V15
Effo
rt a
ssig
ne
d to
eac
h v
alu
e
pro
po
siti
on
Value propositions od the InovWine business model
Effort per value proposition
ACC Effort
Producer Effort
IPN Effort
Biocant Effort
7.2 An action research study: using BIZ2BIS in the InovWine project
275
3. V2 “Increase the productivity of the Bairrada wine”, V3 “Safeguard the Bairrada
genetic heritage”, V5 “Detect harmful microorganisms in the vineyards”, V9 “Improve
warnings specificity and accuracy”, and V12 “Access to the vineyard history”.
When using BIZ2BIS in the InovWine project, we looked for all types of situations that
could jeopardize value propositions, and developed efforts to find promising alternatives, avoid
anti-programs, and reduce the negative impact that required exertions could have on the
participating actors. The majority of our proposals to minimize dangerous dependencies were
conceived in BIZ2BIS’ Phase II. We perceived that the involvement of the producers could be
compromised and developed substitute scenarios that could encourage their participation. For
instance, we changed the wireless sensor network configuration, suggested alternatives for the use
of RFIDs, and promoted training activities. We aimed at providing additional guarantees that the
producers would enter the vineyard data into the system, while motivating them to adopt the
conceived business model and its information system. The “Interview chart” in Table 40 also
shows the dependencies among value propositions identified by the actors, exposing their
personal interests and their different perceptions towards the business model. The ones indicated
by Biocant and IPN expose their commercial and research interests. While the ones mentioned by
ACC and the producers address the wine sector, but each in a different stance. The relationships
identified by ACC were focused on obtaining prestige in the wine industry, increasing the number
of members, and enhancing the Bairrada wine (quality and productivity). In turn, the producers
concentrated their attention on the latter. To end the analysis of the data obtained in Phase III, we
will explore the dependencies among the value propositions through “Value proposition
traceability diagrams” - the third test.
When considering all the dependencies identified by the four actors, we noticed that the
value propositions that depended more on others were V1 “Increase the quality of the Bairrada
wine”, V2 “Increase the productivity of the Bairrada wine”, and V11 “Get prestige in the wine
industry”. While the ones with more influence on others were: V5 “Detect harmful
microorganisms in the vineyards”, V8 “Use InovWine monitoring and alarm services”, V9
“Improve warnings specificity and accuracy”, and V12 “Access to the vineyard history”. The
value propositions of the first group depend on the ones of the second group. These dependencies
disclosed by the actors reinforce some of the decisions we took when applying BIZ2BIS. The
insights obtained through its steps and artifacts alerted us to the importance of strengthening the
viability of goals related to value propositions that can now be found in the first group. This
awareness led us to scrutinize the ones in the second group in order to strength the ones in the first
and make the business model more resistant against possible threats.
Below, we illustrate two of the four used “Value proposition traceability diagrams”: one
that depicts the dependencies identified by ACC (Figure 54) and another that covers the ones
pointed out by the producers (Figure 55). We selected these two over the ones that address the
perception of Biocant and IPN, since the former provide a more comprehensive vision of the
business model.

Chapter 7 – InovWine: an example of using BIZ2BIS
276
V3
+
+
V1
V11
V14
V15
V6
V5
V9
V4
V10
V15 V12
V8
V2
+
+
+
+
+
+
+
+
+
+
+ +
+ +
+
+
Figure 54: Dependencies among value propositions identified by ACC
V1
V11
V9
V8
V2
+ V14
+
+
+
+
V14
+
V4
+
+
V12
V5
+
+
+
+
V3
+ V14 V13
+
Normal user
Payment,invoice
Payment, invoice, results obtained with the kits
Enrollment in training activities
Maintenance service
Description of the leaf, description of the grape, detected disease, identified
plagues,...
Phytosanitary treatment, pruning, fertilization, harvest , grape ripening,…
Insert data on the carried out treatments
Producer
Insert data on the vineyard caracteristics
Buy the smartphone
Buy the kits
Learn how to use the devices
Maintain the system working
Producer, ACC
IPN, Biocant, spin-offs
Producer, Biocant
Producer,
technology store
+
Figure 55: Dependencies among value propositions identified by the producer

7.2 An action research study: using BIZ2BIS in the InovWine project
277
Figure 54 shows a complex network of dependencies that only an actor with a broader
perspective of the business model, like ACC, could detect. Nevertheless, the outcome is clearly
shaped by its commercial concerns. In turn, Figure 55 underlines the importance that the producer
assigns to the vineyard activities. It shows that increasing the quality and the productivity of the
grapevines (V1 and V2) depends on the use of InovWine system and consequently on the data to
be inserted by the producers (e.g., V8, V9, and V12). Since V8 “Use InovWine monitoring and
alarm services” is a decisive value proposition for the business model, we decided to detail it in
the “Value proposition traceability diagram” in Figure 55. We connected and related the
information collected in several BIZ2BIS’ artifacts to provide a broad vision of the factors that
can constrain or potentiate it, and its dependencies. We can see the flows associated with the value
proposition in the rectangle with burgundy border (e.g., payments and vineyard’s data) and the
activities they rely on, in the rectangles with black borders (e.g., acquisition of equipment and the
introduction of data on the vineyards). The actors involved are also depicted. We can verify that
all the points raised were targeted in our analysis. To expand and conduct this study for all value
propositions would add unnecessary complexity to the diagram. Therefore, we only considered
the most critical ones.
Through the interviews with the actors, in particular ACC, we were able to identify
financial checks that will also contribute to decide if the conceived InovWine business model will
be a success. These are:
The treatments that the actors have to apply in the vineyard are costly: from 700 to
1200 euros per hectare. If the InovWine system can help to reduce at least one per year,
it would become very appealing to the producers.
The main source of income of the producers depends on the value that ACC assigns to
their grapes. If the InovWine system aids to increase their quality and productivity,
then the producers would be motivated to participate and enter the data about the
vineyards in the information system.
The yeasts used in Portugal were the result of a study conducted in France and do not
take into account the intrinsic characteristics of the national grapes. To discover one
that could potentiate its specificities would enhance the wine quality and the prestige of
the cooperative. Furthermore, those yeasts would a have a huge marketing potential.
The commercialization of the InovWine project’s outcomes can aid the ACC to support
the activities of its members (e.g., obtaining funds to buy equipment). The importance
of showing the InovWine system in use to prove its reliability may also encourage IPN
and Biocant to charge affordable prices for the supporting and maintenance of the
InovWine services.
The prestige that ACC could gather by having the InovWine business model in use
may lead to an increased number of members.
The mentioned points will only be achieved if the outcomes of InovWine project: the
information system, the wireless sensor network, the RFIDs, and the kits will provide accurate
results. Their research and development are outside the scope of this work. Supposing that these
devices will work as expected, the goals that the actors look forward to achieve with the

Chapter 7 – InovWine: an example of using BIZ2BIS
278
InovWine business model will continue to be dependent on the data introduced by the producers.
We note that the mentioned checks can only be analyzed after having the business model in use
for some time. Knowing that the vineyard cycle takes a year, several may be need for us to draw
conclusive results. The work developed in InovWine project suggests that the employment of
approaches to discuss, design, and evaluate business models may be a long-term process, for
which definite conclusions may be very difficult to draw. Longitudinal studies could add to
reinforce the indications already given by BIZ2BIS.
7.2.12 Phase IV, Step IV.a – Specification of information system requirements
The information gathered about the InovWine networked business model allowed us to
identify two main goals for its underlying information system:
Built a solution that manages data automatically collected by the wireless sensor
network, as well as information introduced by the producers about the vineyards (e.g.,
grapevines, treatments, interventions, plagues, and installed equipments). Search tools
will be used to explore the available data and provide the producers with access to
records and statistics on their assets.
Develop an accurate diagnostic algorithm in order to aid producers improve the
management of their vineyards, and consequently increase the productivity and quality
of their grapes.
At this point of BIZ2BIS, it was necessary to translate the insights obtained from Phase I,
Phase II, and Phase III into concrete high-level requirements to be met by the underlying
information system. The concept of “service” helped us to perform this translation and provided a
point of contact between the study of the business model and the internal business processes
implemented by its supporting information system.
The identification of the services that the InovWine information system should provide
were mainly based on the acknowledged value propositions (Step II.e, “Business flows/ Value
propositions chart”, Table 39). However, we complemented this information with the viewpoints
of the actors on how the information system should support their needs. To provide these
additional details on the service context, we resorted to items obtained in the course of our
analysis. For example, we considered business flows that contributed to the identification and
existence of a value proposition (Step II.e, the intersections in “Business flows/Value propositions
chart”, Table 39); the description of the activities performed by the actors that give rise to the
flows and support the service features (Step I.b, “Actor description chart” artifact, from Table 29
to Table 37); and network topics that rule their operations (Step I.a, “Networked business model
description chart”, for instance fields “Mutual obligations and expectations”, “Shared
interpretations and representations”, and “Existing rules”, Table 28). In Table 41, we list all the
identified services to be supported by the information system.

7.2 An action research study: using BIZ2BIS in the InovWine project
279
Table 41: InovWine information system services
Business scenario: InovWine – List of the identified services
Id: 1 Authentication of user credentials
Id: 2 Registration of phytosanitary treatment
Id: 3 Registration of pruning
Id: 4 Registration of fertilization
Id: 5 Registration of harvest
Id: 6 Registration of grape ripening
Id: 7 Registration of disease
Id: 8 Registration of plague
Id: 9 Registration of the sensor node information
Id: 10 Registration of the RFID information
Id: 11 Registration of the data captured by the sensor
Id: 12 Registration of the data obtained with the RFID
Id: 13 Registration of detected phytopathogenic
Id: 14 Registration of the variety genotype
Id: 15 Registration of user
Id: 16 Registration of vineyard
Id: 17 Search for information about the producer
Id: 18 Search for information about the vineyard
Id: 19 Search for information about a set of grapevines
Id: 20 Search for devices in a vineyard
Id: 21 Generate warnings
In Phase IV, Step I.a “Consolidation and description of requirements”, we used the “Service
specification chart” to describe in detail the services that the InovWine information system should
provide. Below, we opted to present just some of those descriptions, since it would be too
exhaustive to provide all them in this thesis. We chose the ones with high importance to the
business model, unique characteristics, or the capacity to illustrate similar services. To show that
Chapter 7 – InovWine: an example of using BIZ2BIS
280
the development team followed the guidelines provided by BIZ2BIS and make evident the
successful transfer of knowledge, we present some of the user interfaces created for those
services. We decided to show the ones related to the producers’ activities and that reflect our user
interaction concerns with these actors.
We would like to highlight that the development team did not participate in the conducted
interviews. In spite of this, they were able to obtain the necessary information from our
documents to implement the information system. We had a meeting with them, on the 20th of
April 2011, to discuss our report on the business model and the elicited high-level requirements
for its information system. The questions raised by them on the document addressed minor details
(e.g., if some fields in the interfaces should be mandatory or not, if Biocant should have access to
the system, or if an administrator should be appointed). No suggestion to change the artifact’s
fields or include extra information about the services was made. Furthermore, when we presented
the application to Biocant and to ACC on the 30th of June, as well as to the producer of the pilot
vineyard on the 4th of July, they did not suggest any changes; on the contrary, the actors were very
pleased with the solution we presented.
From the identified services, we start by describing the “Authentication of user credentials”
(Table 42), which enables the access to the InovWine information system. We gathered in Table
49 the interfaces developed to support the services. We placed the one that corresponds to this
service in cell a.

7.2 An action research study: using BIZ2BIS in the InovWine project
281
Table 42: Specification of the service “Authentication of user credentials”
InovWine Service specification
Name/identifier Authentication of user credentials Id: 1
Version Number V0.1, date: 16th of March, 2011, author: Cristina Costa
Goal Provide access to InovWine features
Description The user, after signing in, can access the InovWine information system features
through this service according to his/her profile
Actor that provides the
service
InovWine information system
Actor that uses the
service
Producers, ACC, Biocant, IPN, InovWine information system
Input data and their
source
Login
Password
This information is inserted by the users
Output data and its
target
The user profile that will be used by the InovWine information system
Service dependencies Registration of user
Access control
mechanisms
Non existent
Business flows leading to the service
“Grapevines and vineyard data (treatments, annual reports, plagues…)” entered
by the producers. It is relevant to know who inserts the data
Reasons for its existence Assure that only registered users have access to InovWine and provide
information according to the users’ profile
Service restrictions The producers must be ACC members
It is mandatory to fill in all the required fields
Information system
support
The information system must have a password encryption mechanism. When a
user signs in, his/her profile is checked to identify the functionalities assigned to
that user
A smartphone or a browser can be used to access the service
Remarks No remarks
After a successful login, the users can choose between two options: “Search” or “Insert
data” (interface can be seen in Table 49, cell b). If the latter option is selected, then three other
options will be made available to users: “Interventions”, “Events”, and “Field characteristics”.
There are four types of possible “Interventions” (interface in Table 49, cell c): “Phytosanitary”,
“Fertilization”, “Pruning”, and “Harvesting”. In Table 43 we specified the fourth, using the
service “Registration of harvest”. We present the interface to enter harvesting data in Table 49,
cell d.

Chapter 7 – InovWine: an example of using BIZ2BIS
282
Table 43: Specification of the service “Registration of harvest”
InovWine Service specification
Name/identifier Registration of harvest Id: 5
Version Number V0.1, date: 16th of March, 2011, author: Cristina Costa
Goal Record data about the harvest operation
Description After a successful login, the users can search or insert data. In the latter option,
they will have access to two options: “Interventions” and “Events”. “Harvest” is
one of the available “Interventions”. The entered data will contribute to monitor
the vineyard, to increase the knowledge about it, and support or tune the alarm
generating mechanisms
Actor that provides the
service
InovWine information system
Actor that uses the
service
Producers, ACC, InovWine information system
Input data and their
source
Data about the vineyard being harvested
Sensor(s) installed in the vineyard (this information is optional, depends on the
vineyard alarm system)
RFID(s) installed in the vineyard (this information is optional, depends on the
vineyard alarm system)
Vineyard area where the harvest took place
Harvest time (start and end time)
The total amount of grapes produced (kg)
Alcohol degree achieved on the grapes
Payment obtained by the grapes
Notes of interest
This data will be inserted by the producers
Output data and its
target
Non existent
Service dependencies Authentication of user credentials
Registration of vineyard
Registration of the sensor information (depends on the producer's acquisitions)
Registration of the RFID information (depends on the producer's acquisitions)
Access control
mechanisms
The producers need to be identified through a login and password
Business flows leading to the service
“Grapevines and vineyard data (treatments, annual reports, plagues…)”
“Vineyard historic/historical data (biotic and abiotic factors)”
“Grapevines historic/historical data (biotic and abiotic factors)”
Reasons for its existence Collect data to monitor the vineyard production. This will allow to tune the
warnings, providing more reliable and useful alarms
Service restrictions The producers must be ACC members
After the harvest being finished all the fields must be filled in. A possible
exception is the field “Notes of interest” that depends on the need to record a
particular situation

7.2 An action research study: using BIZ2BIS in the InovWine project
283
InovWine Service specification
Information system
support
All the information concerning the vineyard’s harvest must be included in the
InovWine database
Data on harvest contribute to enhance the monitoring of the vineyard. The
combination of this information with other interventions on the vineyard (e.g.,
pruning, phytosanitary treatments, and fertilization) allows disclosing relationships
between the vineyards’ interventions and its evolution. All this contributes to
improve knowledge extraction algorithms and therefore tune the warnings
generation
The data on the harvest should be editable
A smartphone or a browser can be used to access the service
Remarks The data obtained about the harvest can either be linked to one vineyard (if the
owners did not acquire a wireless sensor network and RFIDs to monitor their
vineyards), or to specific electronic devices (sensors or RFIDs) associated with a
vineyard area
Three types of events are available in this application (Table 49, Cell e): “Disease”,
“Plague”, and “Ripening state”. We detail the services “Registration of disease” and “Registration
of plague” in Table 44 and Table 45, respectively. Both services are presented, since they are
complex, encompass a huge amount of information, and allow us to show the detail of the insights
transmitted to the development team. The event data insertion is illustrated through the interface
to enter plague data in Table 49, cell f.
Table 44: Specification of the service “Registration of disease”
InovWine Service specification
Name/identifier Registration of disease Id: 7
Version Number V0.1, date: 18th of March, 2011, author: Cristina Costa
Goal Record diseases found in the vineyards
Description After a successful login, the users can search or insert data. In the latter option,
they will have access to two options: “Interventions” and “Events”. “Diseases” is
one of the available “Events”. The entered data will contribute to monitor the
vineyard, to increase the knowledge about it, and support/tune the alarm
generating mechanisms
Actor that provides the
service
InovWine information system
Actor that uses the service Producers, ACC, InovWine information system

Chapter 7 – InovWine: an example of using BIZ2BIS
284
InovWine Service specification
Input data and their
source
Data about the vineyard where the disease was found
Sensor(s) installed in the vineyard (this information is optional, depends on the
vineyard alarm system)
RFID(s) installed in the vineyard (this information is optional, depends on the
vineyard alarm system)
Disease identification (see the field “Remarks”)
Vineyard position where the disease was detected
Disease time limits (the date when the symptoms were seen, and the date when
they disappear)
Photograph
Notes of interest
This data will be inserted by the producers or ACC
Output data and its target Non existent
Service dependencies Authentication of user credentials
Registration of vineyard
Registration of the sensor information (depends on the producer's acquisitions)
Registration of the RFID information (depends on the producer's acquisitions)
Access control
mechanisms
The producers need to be identified through a login and password
Business flows leading to the service
“Grapevines and vineyard data (treatments, annual reports, plagues…)”
“Vineyard historic/historical data (biotic and abiotic factors)”
“Grapevines historic/historical data (biotic and abiotic factors)”
Reasons for its existence Collect data to develop disease monitoring services. This will allow to tune the
warnings, providing more reliable and useful alarms
Service restrictions The producers must be ACC members
When the phyto-sanitary state of the vineyard achieves a safe condition all the
fields must be filled in. Possible exceptions are the field “Photograph and “Notes
of interest”. The latter depends on the need to record a particular situation
Information system
support
All the information concerning the vineyard diseases must be included in the
InovWine database
Data on diseases contribute to enhance the monitoring of the vineyard. The
combination of this information with other events on the vineyard (e.g., plagues,
and ripening state) and interventions (e.g., harvest, pruning, phytosanitary
treatments, and fertilization) allows disclosing relationships between the
vineyards’ events and its evolution. All this contributes to improve knowledge
extraction algorithms and therefore tune the warnings generation
The data on the diseases should be editable
A smartphone or a browser can be used to access the service

7.2 An action research study: using BIZ2BIS in the InovWine project
285
InovWine Service specification
Remarks The data obtained about diseases can either be linked to one vineyard (if the
owners did not acquire a wireless sensor network and RFIDs to monitor their
vineyards), or to specific electronic devices (sensors or RFIDs) associated with a
vineyard area
List of fruit and foliar diseases:
Black rot
Black spot
Mildew
Oidium
White rot
List of Wood and Root Diseases
Armillaria root rot
Esca
Eutypa dieback
Corky bark
Rupestris stem pitting
Table 45: Specification of the service “Registration of plague”
InovWine Service specification
Name/identifier Registration of plague Id: 8
Version Number V0.1, date: 18th of March, 2011, author: Cristina Costa
Goal Record plagues found in the vineyards
Description After a successful login, the users can search or insert data. In the latter option,
they will have access to two options: “Interventions” and “Events”.“Plagues” is
one the available “Events”. The entered data will contribute to monitor the
vineyard, to increase the knowledge about it, and support/tune the alarm
generating mechanisms
Actor that provides the
service
InovWine information system
Actor that uses the service Producers, ACC, InovWine information system
Input data and their
source
Data about the vineyard where the plague was found
Sensor(s) installed in the vineyard (this information is optional, depends on the
vineyard alarm system)
RFID(s) installed in the vineyard (this information is optional, depends on the
vineyard alarm system)
Identification of the plague (see the field “Remarks”)
Vineyard position where the plague was discovered
The plague occupation time (start and end time)
Photograph
Notes of interest
This data will be inserted by the producers

Chapter 7 – InovWine: an example of using BIZ2BIS
286
InovWine Service specification
Output data and its target Non existent
Service dependencies Authentication of user credentials
Registration of vineyard
Registration of the sensor information (depends on the producer's acquisitions)
Registration of the RFID information (depends on the producer's acquisitions)
Access control
mechanisms
The producers need to be identified through a login and password
Business flows leading to the service
“Grapevines and vineyard data (treatments, annual reports, plagues…)”
“Vineyard historic/historical data (biotic and abiotic factors)”
“Grapevines historic/historical data (biotic and abiotic factors)”
Reasons for its existence Collect data to develop disease monitoring services. This will allow to tune the
warnings, providing more reliable and useful alarms
Service restrictions The producers must be ACC members
When the vineyard is free of plagues all the fields must be filled in. Possible
exceptions are the field “Photograph and “Notes of interest”. The latter depends
on the need to record a particular situation
Information system
support
All the information concerning the vineyard plagues must be included in the
InovWine database
Data on plagues contribute to enhance the monitoring of the vineyard. The
combination of this information with other events on the vineyard (e.g., diseases,
and ripening state) and interventions (e.g., pruning, phytosanitary treatments, and
fertilization) allows disclosing relationships between the vineyards interventions
and its evolution. All this contributes to improve knowledge extraction
algorithms and therefore tune the warnings generation
The data on the diseases should be editable
A smartphone or a browser can be used to access the service
Remarks The data obtained about plagues can either be linked to one vineyard (if the
owners did not acquire a wireless sensor network and RFIDs to monitor their
vineyards), or to specific electronic devices (sensors or RFIDs) associated with a
vineyard area
List of vineyards plagues:
Grape erineum mites
Grape moths (e.g., Pyrale, Cochylis, and Eudemis)
Margarodes vitis
Phylloxera
Spider mites (e.g., red mite and the yellow mite)
Snails
In addition to the data captured by the sensor nodes and entered by the producers on their
vineyards, it is also fundamental for the system to record information on: InovWine users, the
characteristics of the vineyards, as well as sensor nodes and RFIDs features. As an example, we
detail the service “Registration of the sensor node information” in Table 46. The position of the
sensors in a vineyard is illustrated through the interface in Table 49, cell g.
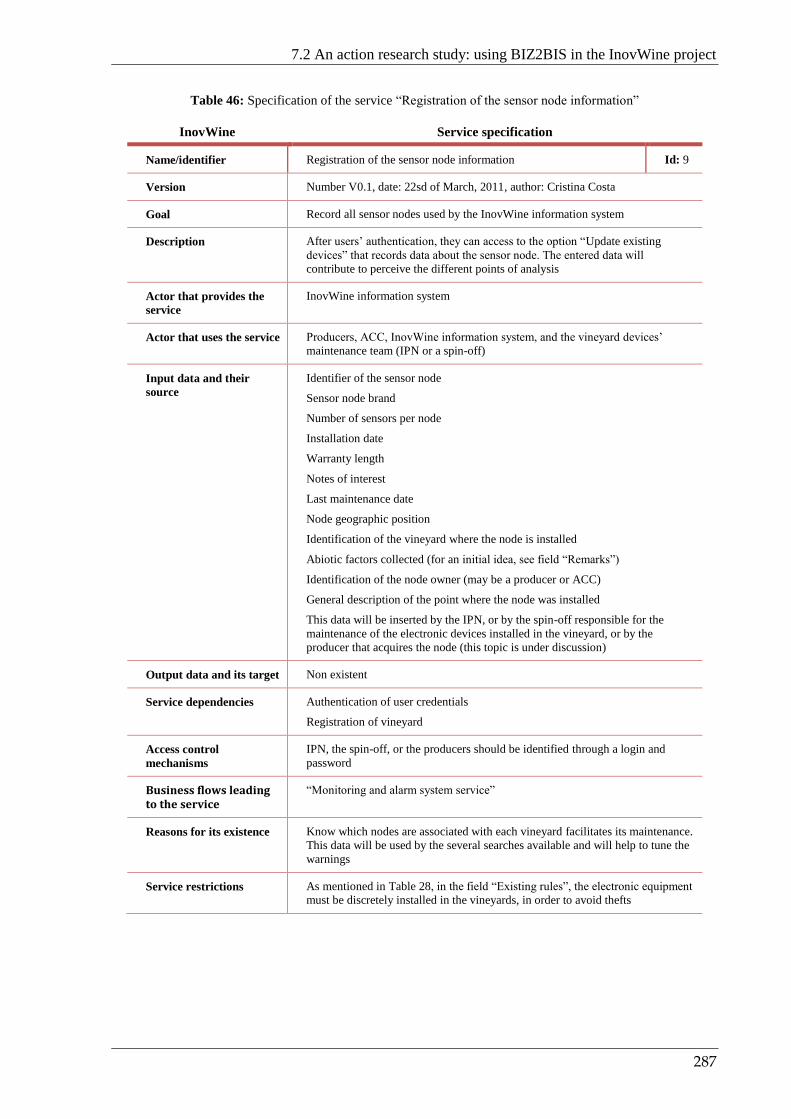
7.2 An action research study: using BIZ2BIS in the InovWine project
287
Table 46: Specification of the service “Registration of the sensor node information”
InovWine Service specification
Name/identifier Registration of the sensor node information Id: 9
Version Number V0.1, date: 22sd of March, 2011, author: Cristina Costa
Goal Record all sensor nodes used by the InovWine information system
Description After users’ authentication, they can access to the option “Update existing
devices” that records data about the sensor node. The entered data will
contribute to perceive the different points of analysis
Actor that provides the
service
InovWine information system
Actor that uses the service Producers, ACC, InovWine information system, and the vineyard devices’
maintenance team (IPN or a spin-off)
Input data and their
source
Identifier of the sensor node
Sensor node brand
Number of sensors per node
Installation date
Warranty length
Notes of interest
Last maintenance date
Node geographic position
Identification of the vineyard where the node is installed
Abiotic factors collected (for an initial idea, see field “Remarks”)
Identification of the node owner (may be a producer or ACC)
General description of the point where the node was installed
This data will be inserted by the IPN, or by the spin-off responsible for the
maintenance of the electronic devices installed in the vineyard, or by the
producer that acquires the node (this topic is under discussion)
Output data and its target Non existent
Service dependencies Authentication of user credentials
Registration of vineyard
Access control
mechanisms
IPN, the spin-off, or the producers should be identified through a login and
password
Business flows leading to the service
“Monitoring and alarm system service”
Reasons for its existence Know which nodes are associated with each vineyard facilitates its maintenance.
This data will be used by the several searches available and will help to tune the
warnings
Service restrictions As mentioned in Table 28, in the field “Existing rules”, the electronic equipment
must be discretely installed in the vineyards, in order to avoid thefts

Chapter 7 – InovWine: an example of using BIZ2BIS
288
InovWine Service specification
Information system
support
All the information concerning the node sensors must be included in the
InovWine database
The InovWine information system should be developed to allow an easy
maintenance of the devices in the vineyard, during and after the project
The data on the node sensors should be editable
A smartphone or a browser can be used to access the service
Remarks List of sensor relevant to monitor the vineyard (according to the ACC and the
Meteorological Station of Bairrada):
Temperature (maximum/minimum)
Humidity (air, soil, and leaf))
Precipitation
Wind speed
Radiation
They were already installed in the vineyard
Due to its wealth of information (it gathers climate, biological, and logistic information on
the producers, as well as on the vineyards), the InovWine system promotes data cross-checking
and enables relevant searches. For instance, InovWine users can look for data on the producers, on
the installed devices, on a set of grapevines, or on the vineyards. All this information is
intertwined (e.g., when searching for producers the information on their vineyards must be
accessible; when consulting data on the vineyards it is important to know about the devices
installed in the properties). To exemplify possible searches, we detailed the service “Search for
information about the vineyard” in Table 47. When a user decides to search data on his/her
vineyard three options will be available: “Alarms”, “RFIDs”, and “History” (the interface that
corresponds to this choice is shown is Table 49, cell h). For a particular vineyard, the first option
presents the alarms issued, the second the data associated with each RFIDs, and the third the
history. The vineyard history can include information so diverse as events, interventions, or
climate statistics (a graphic on the air temperature in a particular time period is shown in Table 49,
cell i).
Table 47: Specification of the service “Search for information about the vineyard”
InovWine Service specification
Name/identifier Search for information about the vineyard Id: 18
Version Number V0.1, date: 22sd of March, 2011, author: Cristina Costa
Goal Find relevant information about the vineyard
Description After users’ authentication, they should go to the “Search” menu and access the
option “Vineyards”
Actor that provides the
service
InovWine information system
Actor that uses the service Producers, ACC
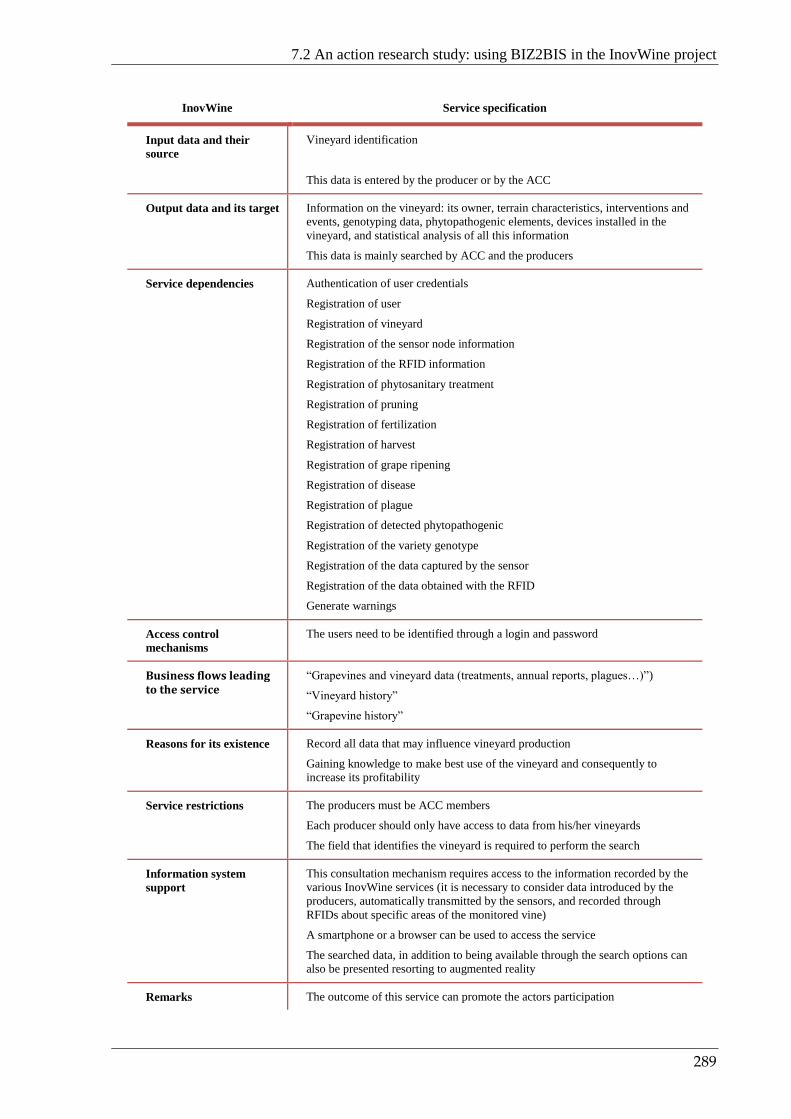
7.2 An action research study: using BIZ2BIS in the InovWine project
289
InovWine Service specification
Input data and their
source
Vineyard identification
This data is entered by the producer or by the ACC
Output data and its target Information on the vineyard: its owner, terrain characteristics, interventions and
events, genotyping data, phytopathogenic elements, devices installed in the
vineyard, and statistical analysis of all this information
This data is mainly searched by ACC and the producers
Service dependencies Authentication of user credentials
Registration of user
Registration of vineyard
Registration of the sensor node information
Registration of the RFID information
Registration of phytosanitary treatment
Registration of pruning
Registration of fertilization
Registration of harvest
Registration of grape ripening
Registration of disease
Registration of plague
Registration of detected phytopathogenic
Registration of the variety genotype
Registration of the data captured by the sensor
Registration of the data obtained with the RFID
Generate warnings
Access control
mechanisms
The users need to be identified through a login and password
Business flows leading to the service
“Grapevines and vineyard data (treatments, annual reports, plagues…)”)
“Vineyard history”
“Grapevine history”
Reasons for its existence Record all data that may influence vineyard production
Gaining knowledge to make best use of the vineyard and consequently to
increase its profitability
Service restrictions The producers must be ACC members
Each producer should only have access to data from his/her vineyards
The field that identifies the vineyard is required to perform the search
Information system
support
This consultation mechanism requires access to the information recorded by the
various InovWine services (it is necessary to consider data introduced by the
producers, automatically transmitted by the sensors, and recorded through
RFIDs about specific areas of the monitored vine)
A smartphone or a browser can be used to access the service
The searched data, in addition to being available through the search options can
also be presented resorting to augmented reality
Remarks The outcome of this service can promote the actors participation

Chapter 7 – InovWine: an example of using BIZ2BIS
290
Due to its relevance to the InovWine business model, as a last example we also present the
“Generate warnings” service (Table 48). This service highly depends on the remaining services
and is available in two scenarios: a set of grapevines or the entire vineyard. If this service will be
able to reduce the treatment expenses and increase the grape quality, it will strongly contribute to
the success of this venture.
Table 48: Specification of the service “Generate warnings”
InovWine Service specification
Name/identifier Generate warnings Id: 21
Version Number V0.1, date: 27th of March, 2011, author: Cristina Costa
Goal Give treatment advices to producers
Description After users’ authentication, they should go to the “Search” menu and select if
they want to verify alarms for a vineyard or for a set of grapevines. The
warnings generated about those areas will be made available
Due to the lack of technological skills, the warning generated by the InovWine
information system should also be transmitted by voice. If the producer does not
pick up the call, another one should be made according to a defined timetable
Actor that provides the
service
InovWine information system
Actor that uses the service Producers, ACC
Input data and their
source
Producer identification, or ACC
This data is entered by the producer or by the ACC. The latter for reasons of
control
Output data and its target Warning messages relevant to the vineyard treatment
This data is mainly important to the producers and to ACC

7.2 An action research study: using BIZ2BIS in the InovWine project
291
InovWine Service specification
Service dependencies
Authentication of user credentials
Registration of user
Registration of vineyard
Registration of the sensor node information
Registration of the RFID information
Registration of phytosanitary treatment
Registration of pruning
Registration of fertilization
Registration of harvest
Registration of grape ripening
Registration of disease
Registration of plague
Registration of detected phytopathogenic
Registration of the variety genotype
Registration of the data captured by the sensors
Registration of the data obtained with the RFIDs
Access control
mechanisms
The users need to be identified through a login and a password
Business flows leading to
the service
“Monitoring and alarm system service”
Reasons for its existence Optimize the vineyard production and improve wine quality
Service restrictions The producers that enter the data must be ACC members
Each producer should only have access to data from his/her vineyards
Information system
support
This consultation mechanism requires access to the information recorded by the
various InovWine services (it is necessary to consider data introduced by the
producers, automatically transmitted by the sensors, and recorded through
RFIDs about specific areas of the monitored vine)
A smartphone or a browser can be used to access the service
The searched data, in addition to being available through the search options can
also be presented resorting to augmented reality
Remarks This service is essential for producers to join the InovWine project
Below, in Table 49, we present some of the created interfaces. They illustrate how the
InovWine information system presents some of the specified services to its users. The selected
design attempted to answer the actors’ difficulties in dealing with technological devices (e.g., a
reduced number of options per display, large fonts, and space between options).

Chapter 7 – InovWine: an example of using BIZ2BIS
292
Table 49: InovWine information system interfaces
Interfaces
a – Authentication of user credentials b – Pathway decision c – Type of interventions
d - Harvesting data e – Type of events f – Plague data
g- Sensors position h – Vineyard search i – Historical graphics

7.2 An action research study: using BIZ2BIS in the InovWine project
293
A web version of the above services was also developed. To illustrate some of the work
carried out we present in Figure 56 two interfaces: on the left side of the figure we can observe
details on the vineyard and on the right side analysis on the sensors’ data.
Figure 56: Web interfaces developed
7.2.13 Findings after the second BIZ2BIS iteration
After several changes made in response to problems highlighted by BIZ2BIS, we achieved
a version of the business model, as well as its underlying information system, endorsed by the
actors. Below, we discuss the contributions of this iteration of BIZ2BIS:
The economic difficulties of the producers led us to propose the development of a
network with a larger mesh, able to cover all producers’ lands, and shared by them,
instead of considering that each would acquire its own network. The development team
designed this network according to critical points of analysis identified in the
cooperative vineyards. To minimize the problems associated with the financial
constraints and obtain more attractive prices, we suggested the management of
collective and larger scale purchases of equipment to the cooperative. In addition, we
highlight the possibility of financially exploiting the InovWine database. The collected
data can be an interesting source for research on precision agriculture for some entities
(e.g., IPN and Biocant).
The lack of technological skills made us establish the need to promote training actions to
fight technological illiteracy. The cooperative showed interest and determination in
supporting these initiatives. To minimize potential usability problems, we advised the
development team to include the producers in the test phase of the InovWine
information system. We also recommended that the warnings provided could be
transmitted through phone calls instead of the originally considered text messages.
BIZ2BIS supported the choices of the actors with power of decision with a thorough
knowledge of the networked business model. We described the network, identified its
actors, their context, interactions, vested interests, expectations and difficulties, carried

Chapter 7 – InovWine: an example of using BIZ2BIS
294
out activities, established collaborations, and factors that could encourage the alignment
of interests among the actors. We also took into account alternative scenarios to increase
the responsiveness of the business model for future opportunities and threats.
BIZ2BIS enabled us to pay special attention to actors and value propositions critical to
the business model. In order to identify activities whose accomplishments were not
assured and value propositions at risk, we traced the flows whose absence could
jeopardize the business model. Then, we looked for alternative scenarios that could
minimize the detected threats and avoid the network collapse. For instance, the business
model underwent several adjustments to mitigate the financial burden of the producers
and encourage their participation. Furthermore, we pointed out solutions to make the
task of entering data easier and less laborious (e.g., training and usability requirements).
The indications we got from BIZ2BIS allowed us to iteratively refine the InovWine
business model. When we stopped to detect aspects that could be improved, we assessed
whether the objectives of the actors were being met. Since, in our view, the value
propositions made available were in line with the expressed interests, we put this version
of the business model forth for the approval of the actors. According to their own
perception, the balance between the gain obtained and the effort expended was positive
for all involved. The results confirmed the previous findings, strengthened the idea that
we reached a satisfactory alignment between the various coexisting interests and gave us
additional assurances about the willingness of the actors to maintain their presence in
the network.
BIZ2BIS also supported the identification of the list of the services that the InovWine
information system should make available. This contribution revealed itself extremely
helpful to the development team. Its members neither participated in the meetings to
discuss the business model, nor in the negotiations that gave rise to adjustments in the
business model. However, supported by our BIZ2BIS report, they were able to develop
the information system underlying the business model. The content of the document was
clear and informative. We only needed one meeting to clarify less obvious aspects. In
this encounter, it was also possible to obtain feedback about the suitability of the
developed artifacts. No major suggestion was made to us. They considered the
information and the provided artifacts self-explanatory, with precise guidelines,
therefore easy to follow.
The development team presented the user interfaces created for the InovWine
information system in several meetings with the cooperative and the producers. They
were pleased with the work done and only suggested minor aesthetic changes. Noticing
the potential of the system, they made requests to introduce new features. However,
these solicitations were impracticable due the need to purchase very expensive sensors,
not covered by the project funds. The positive reaction highlighted the idea that
BIZ2BIS was able to integrate the actors’ aspirations and the cooperative context in the
business model study. Furthermore, it strengthened BIZ2BIS’ ability to translate the

7.3 Conclusion
295
business model, including its social factors, into the high-level requirements of its
information system.
The prospection of future scenarios in collaboration with practitioners (e.g., use of
RFIDs in the grapevine certification process and increase the density of sensors in
vineyards with high quality grapes) enhanced our understanding of the wine field. The
gained knowledge led us beyond the scope of the business model under study, which
gave us the chance to show how InovWine could open new opportunities to its actors.
7.3 Conclusion
This chapter illustrates how our proposal – BIZ2BIS – can be applied to a concrete
networked business model, using the InovWine project as an example. Action research guide our
work, which allowed us to chronicle actions carried out and reflect on relevant outcomes for the
business model scientific domain and to practitioners of the wine sector.
We started by applying Phase I of BIZ2BIS to the InovWine business model described in
the proposal submitted to NSRF in order to characterize its network and detail its actors. To
complement it, we developed efforts to enhance our knowledge on the wine sector, in particular in
the Bairrada Region: we studied the business model in use prior to InovWine Project, compared it
with the one in the proposal, established contacts to understand the expectations of the actors, and
consulted several sources of information (magazines, Internet resources, books, and technical
reports). The acquired knowledge enhanced our ability to detect situations that could jeopardize
the wine production and compromise the business model adoption. Therefore, we moved on to
Phase II and, in collaboration with practitioners, detailed the identified problems and sought
indications for their resolution. Then, we presented our proposals to the actors with the power to
decide the future of the networked business model. They supported our ideas and, with their
consent, we started to detail the new envisioned solution. We described how the goals of each
actor could support the aims of the networked business model and disclosed possible
collaborations among the actors. Then, we carried out a continuous process of negotiation and
ongoing capture of information that provided clues on how to enroll the actors based on the roles
defined for them. By carrying out the required adjustments, and accessing new data, we updated
the artifacts of Phase I and Phase II several times, and considered alternative scenarios for the
business model. When we obtained indications that a possible alignment had been achieved
among the interests of the actors in Phase II, we advanced to Phase III and asked the actors to
evaluate our proposal. Since their feedback was clearly positive, we advanced to Phase IV and
used the outcomes gathered up to that point to specify the high-level requirements of the services
that the underlying information system of the business model should provide. They have been
used to guide the subsequent development of the InovWine information system by an independent
team. In the meetings held to evaluate the application prototype, we obtained extremely positive
feedback from the ACC, its producers, and Biocant.

Chapter 7 – InovWine: an example of using BIZ2BIS
296
The InovWine project underlined BIZ2BIS’ potential to discuss, design, and evaluate
networked business models from a socio-technical perspective. It guided us in understanding the
business model originally proposed, discussing it, discovering its weaknesses, proposing
alternative solutions, always in collaboration with practitioners. It put us at the service of the
context of study, integrating the views and expectations of those involved, and assigning them a
relevant role in the assessment of the solutions to adopt. In turn, their involvement commits them
with the decisions taken and gives us additional indicators of their interest in maintaining their
participation in the networked business model. The insights obtained with the detailed study of the
business model and of its context also aided us in successfully translating the obtained outcomes
into the high-level requirements for its supporting information system.
Last, but not least, we will conclude this thesis by analyzing the developed work and
discussing the research contributions for the proposed research questions. At this time,
implications will be drawn for future research.

297
Chapter 8
Conclusions
We start by providing an overview of the problem space of this thesis. Then, we revisit the
research questions and discuss how and to which extent these have been addressed. Subsequently,
we describe our research contributions. We end by discussing the main limitations of our work
and directions for further research.
8.1 Overview of the problem statement
Technological advances and the generalized use of the Internet have changed the playing
field for companies. Several actors can now come together in network configurations to create
innovative business models that would be unfeasible in the physical world. However, the more
radical the departure from the established models of value creation, the bigger the complexity in
analyzing those environments. Participants in the same network can be allies in the pursuit of a set
of goals, and, simultaneously, be competitors in the pursuit of others (Gulati et al., 2000). Their
relationships in the network are supported by a sensitive balance of interests, which raises
difficulties in ensuring the sustained involvement of the parties and the stability of the forged
bonds.
Based on the literature review, we noticed that most of the proposals in the business model
domain did not focus on the study of business networks, but rather on individual organizations.
There were no indications on how to introduce the specificities of the network in the business
model study (e.g., collaborations, dependencies, conflicts, or joint value propositions). We
recognize the importance of avoiding a myopic look that ignores the multiple interrelations and
entanglement that characterizes a network space. Therefore, we translated the lenses of analysis
proposed by Law to our study in order to improve our knowledge of networked business models
and open new possibilities of analysis. This option led us to complement business model theories
with influences from the social domain, in particular ANT (presented in Chapter 3).
ANT inspired us to perceive and conceptualize business models as a heterogeneous reality
built of multidimensional and continually evolving entanglements, in which a collective of human

Chapter 8 – Conclusions
298
and non-human actors interact. This alternative outlook gave us the chance to consider the
socio-technical nature of business models potentiated by ICTs. By denying that purely social or
technical relationships are possible, ANT created distinctive and promising conditions for
exploring the interdependency between information systems and the networked business models
in which they operate. It aided us to conceive new forms of thinking information systems and
perceive how they are influenced by, and how they influence, business contexts.
Based on the ideas laid out above, we formulated the following research purpose:
The purpose of the thesis is to develop an approach to discuss, design, and evaluate
business models in network configurations, which will equally contribute to disclose its
underlying information system requirements. By exploring the socio-technical nature of
networked business models, the approach aims to be used as an effective means to guide
the search towards beneficial arrangements of value propositions that can lead to stable
networks.
To meet this overall purpose, two research questions were introduced in Chapter 1. In the
next subsection, they are revisited in the light of the obtained results.
8.2 Reviewing the research issue
The business model literature review (Chapter 2) allowed us to identify the topics usually
addressed by this domain. We noticed that the concept of value proposition acquired a prominent
role in the available definitions, and that others like business architecture, revenue sources,
network partnerships, business actors, roles, and resources were also common. In the topic of
business components, the organization value propositions, financial aspects, target customers,
distribution channels, customers’ relationships, network of cooperative agreements were common
denominators. The available business representations confirmed the relevance of the mentioned
elements. Most of the contributions we analyzed address the business model of a company. They
may consider the partnerships established by a given company, but the organization remains the
most important reference point, not the networked business model as an entity that co-creates
value.
We used the acquired background as a starting point to move our analysis beyond a
company’s boundaries. In alternative to a viewpoint centered in one organization, we decided to
focus our attention on business models operating in network configurations, on their innovative
possibilities to co-create value, and on the challenges that these configurations pose (e.g., align the
distinct interests involved). This research direction was supported by the literature on business
models in network configurations. The available contributions underlined the need to address
issues not yet covered, such as the dependencies among network actors, negotiation mechanisms
able to align their individual interests, joint efforts to create value, or transaction of items of
unequal value. The inherent complexity of network settings strengthened the importance of
obtaining a comprehensive view of the business model context. Despite the significance assigned
to the social dimension by some authors, no indications on how to address it were apparent.

8.2 Reviewing the research issue
299
The identified open issues in the business model domain coupled with our interest in
exploring ANT’s potential in this field led us to formulate two main research questions: RQ1 and
RQ2.
RQ1. How can the discussion, design, and evaluation of business models in network
configurations benefit from ANT’s contributions?
As research progressed, we clarified and detailed lines of study, which allowed us to refine
RQ1 in five sub-questions.
a. How to account for socio-technical aspects in business models?
We claim that if we wish to understand business models, then we need to explore the
relationships that reside in their networks. ANT aided us to see space as networked-oriented and
pointed out the importance of exploring it. Its insights encouraged us to follow the actors and to
describe their actions and attitudes, even the irrational ones, based on the traces they leave in their
interactions. Influences to those actions are also exposed (e.g., personal interests or conflicting
positions). ANT’s vocabulary, rather than describing the network translations in sanitized
accounts, gathers all their glorious messiness and irrationality (McMaster et al., 1997c). Its
insights inspired us to improve the networked business model understanding, and thus address the
emergence of controversies among actors, reveal scenarios that are not so obvious or clear, start
inquiries on the basis of uncertainty, and disclose what can compromise or consolidate networked
business models.
Neither networks, nor actors, nor their connections can be considered stable over time. ANT
showed us that actors change, reshaped by the network(s) in which they have become enrolled.
Even if the actors initially appear stable, it is important to consider the benefits that can be
obtained by challenging some punctualizations. The concepts of translation and inscription
acquired a relevant role in this endeavor. They inspired and guided us to perceive the aims of each
actor, detect interests that could attract them, conduct negotiations to align their aims, inscribe
programs of action, and strengthen their presence in the network. Their insights resulted in the
development of sensitizing devices introduced in the approach.
Along the studied business scenarios, this research sub-question underwent a sequential
evolution with strong implications on the modus operandi of the approach. In our first case study,
HowMuchIsIt, we tried to find connection points with ANT. Its concepts of network, actors, and
interactions fitted perfectly with the business model analysis and enhanced the knowledge on the
network, capturing its social dimension. Encouraged by the established connections, similarly to
what is done in the regular applications of ANT, we also tried to describe HowMuchIsIt’s
translation phases textually. A clear drawback was detected. The approach’s dependency on
notions from ANT, unfamiliar to most business analysts, would restrict its use. The Online
Journal case study also highlighted this limitation. Resistance was still evident, even though there
were efforts to introduce ANT in a more subtle way. Thus, we adopted a more defensive position.
We maintained ANT’s influences but in understated form. Our solution to this challenge was the

Chapter 8 – Conclusions
300
development of artifacts with the capacity to integrate ANT’s concepts in an enclosed form,
which made the application of BIZ2BIS independent from their knowledge.
In GreenHomes, we applied the developed artifacts in collaboration with the project team.
The provided feedback and the detected problems led us to the version of the approach initially
used in InovWine. In this scenario, the already existing artifacts did not undergo significant
changes. In most of the cases, the performed adjustments aimed at facilitating their analysis. To
enhance the representation of dependencies in the business model we created a new artifact and
made additional features available. The complexity of the case and the actors’ expertise showed
us that following each actor’s translations and attempts of inscription can be extremely rewarding
to the business model understanding. We had the opportunity to challenge black boxes (e.g.,
grapevines certification process), disclose network boundaries, foster negotiation mechanisms
towards the alignment of the involved interests, and propose alternatives that were actually put
into practice.
b. How to identify the stakeholders and represent a networked business model so that it
is clear to all involved?
We paid particular attention to this sub-question in InovWine. Our concept of actor was
inspired by ANT heterogeneous networks and by the literature on stakeholder’s definition
(Freeman, 1984, Johnson and Scholes, 2002, Bryson, 2004). We used an inclusive outlook: each
element that can influence, or be influenced, by the networked business model - directly or
indirectly - should be regarded as an actor. To identify these actors in a networked business
model, we applied one of the principles suggested by Pouloudi and Whitley (1997) to characterize
the behavior of stakeholders and the snowball method (Hanneman, 2001). After identifying the
initial actors, they are recursively asked (or observed) to identify all their connections. The
business analysts should stop this iterative process when they are not able to identify new
stakeholders or consider that they have a residual influence. The traces left in the iterative process
of finding actors helped us to reduce the fuzziness of the network boundaries.
InovWine enabled us to experience the advantages of this procedure. We started with an
initial set of actors. As these actors detected aspects that required data, or intervention from
others, the network was expanded. Not all identified actors were included in the business model
study, however, some (e.g., Viticert) provided relevant and pertinent data that enabled us to detect
false initial assumptions, detail business model’s activities, identify new actors, and disclose
future opportunities. We constantly encouraged the actors to share their personal views, and, in
doing so, they contributed to the business model enlightenment.
The capacity of our approach to incorporate the social component of the business models
while also revealing the involved actors brought about a more comprehensive view of the
networks. The chance to integrate the actors and their connections in the business model context
created a background of knowledge that enabled a more accurate definition of the business model
and the development of a common understanding. The shared perception built throughout the
approach promoted the comparison and discussion of ideas and solutions among the actors.

8.2 Reviewing the research issue
301
The use of BIZ2BIS as a communication tool in GreenHomes and InovWine (where
collaboration was best achieved) enhanced a common, more accurate understanding of the
business model idea among actors. The gathered information and the performed analysis captured
each actor’s perception, enabling a multi-viewpoint that aided BIZ2BIS in dealing with the
different interests involved. The approach used the obtained outcomes to explore the potential of
the actors to the network, while simultaneously pointing out proposals able to create favorable
conditions for their participation. In the search for an alignment among the interests of the actors,
BIZ2BIS introduced into the business model discussion factors such as the actors’ expectations,
alternative features to address the actors’ interests, or possible collaborations to enhance the
attractiveness of the value propositions.
c. How to create an approach capable of aligning the goals of the various
stakeholders?
In the Online Journal case study, the need to include a negotiation phase in the approach
became evident. We felt it was necessary to understand how actors could be enrolled in the
network, ensure that all ended up with attractive value propositions, all interests were aligned, and
the stability of the bonds were strengthened. To meet these needs, we developed a negotiation
mechanism that explores the possibility to assign new roles to the actors (modifying duties, work
processes, and prerogatives) - placing them in a new position in the network state of affairs. The
concepts of translation and inscription inspired us in this endeavor. Their definition helped us to
develop a set of guidelines to disclose the actors’ position towards the networked business model
and detect possible threats. Furthermore, these concepts inspired us to seek alternatives that could
mitigate problematic situations and lead to stable networks.
The guidelines defined for the business model negotiation were embedded in the approach’s
artifacts, which were progressively enhanced throughout its application. They address different
particularities of the translation that were materialized in a flexible sequence of steps. On the one
hand, the “Common goal diagram” and the “Actors/Goals affinity chart” identify the network’s
objectives, the aims of its actors, as well as forms of collaboration (topics influenced by the
problematization and interessement). On the other hand, the “Negotiation diagram” searches
iteratively for alignments among the actors, embracing the concept of enrolment. In GreeHomes,
the artifacts allowed us to detect imbalances in the value propositions made available to one of the
actors. We exposed our findings to the project leaders, who were receptive to our arguments. In
InovWine, due to the possibility of intervening in the project, the impact of our outcomes was
even more significant. When applying BIZ2BIS, we detected problems and proposed alternatives,
some of which were later adopted by the actors with power to decide. The applied negotiation
increased our awareness of the actors’ fears and expectations and implemented a bottom-up
mobilization of the actors. Major business model rearrangements were undertaken.
When actors’ interests are stabilized, controversy is removed, and the programs of action
are inscribed. However, the actors do not always act in the best interest of the group, nor in
accordance with what is agreed. If an actor deviates, the alignment of the business model can be at

Chapter 8 – Conclusions
302
risk, which should trigger an additional network analysis (and possibly supplementary
negotiations). The network dynamics demands a constant monitoring.
d. How can indications about the business model stability be provided to stakeholders?
We believe that the business model evaluation cannot be confined to the traditional
financial aspects most commonly addressed. We are convinced that non-monetized flows can also
influence the organizations’ interest towards the business model, as well as its viability. It would
not be surprising to see companies providing services to prestigious organizations like NASA or
Ferrari at a low cost, just to have them in their client portfolio. The evaluation component of
BIZ2BIS was essentially explored in InovWine, which showed us that the value propositions
provided to the several actors went beyond revenue streams. The two technological institutes
provided their expertise and technology at very affordable prices to the wine making cooperative
with the purpose of obtaining rights to the improvements carried out during the R&D project. The
data owned by the cooperative on vineyards, its experience in the wine industry, and its
availability and motivation to enhance its production made it a perfect candidate to implement the
cutting edge technological solutions, otherwise financially unbearable. Other flows beyond the
financial steams must be taken into account, as well their context. To restrict an evaluation to
financial aspects can be a mistake, since they may imply the omission of relevant information for
the business model sustainability.
Our analysis goes further and enriches the networked business model assessment with the
notion that all parties value things differently, and often in an unequal way (Diamond, 2010).
Several reasons support this kind of evaluation. The financial value assigned to a product or
service is very volatile (what was established when conceiving the business model may not be
valid after a month). The influence of intangible flows in the business model is also extremely
difficult to quantify financially. The actors possess their own perception that must be taken into
account. Something that can be extremely valuable for an actor, may not appeal to another. It is
vital to respect the individuality of the actors and their own assessments to find out what each one
values more (be it data, money, prestige, safety, or other type of flow), as well as the ones that can
provide it.
Taking into account that the desertion of a relevant actor can lead to network collapse, we
defined that the business model is stable and viable if the balance between the benefit and the
exertion is positive for the participating actors. In BIZ2BIS, this validation is performed by the
actors themselves and according to their own parameters. They use the artifact “Interview chart”,
which lists the business model value propositions available. For each one, the actors specify the
effort they spend to support it, as well as their obtained gain. This assessment points out clues on
the benefits that the actors will achieve with their participation and can expose situations of lack
of interest. Indeed, their views, concerns, and voices improve our sensibility to understand how
the idealized value propositions can be tuned to strengthen the business model chances of success.
We also used the goals stated by each actor in the “Actor description chart” as a double check to
establish if the value propositions provided by the business model were able to reach their goals
and assure their satisfaction.

8.2 Reviewing the research issue
303
e. How to consider the dynamic nature of inter-organizational business models?
This thesis fully recognizes the dynamic and interconnected nature of networked business
models and how it affects actions, inactions, and decision-making. ANT’s perspective of time and
space reinforced the notion that actors cannot be viewed in isolation and independent of their
context and time frame, which instigated us to regularly review the business model dynamics
when performing its analysis. ANT guided us into a world of associations and relations that
brought together overlapping dimensions with influence in a particular action. By following the
actors we integrated an omnipresent mechanism of exposing change and its causes in our
approach. Moreover, as suggested by ANT, we regard each actor as a network in order to capture
a broader perception of each ones individual scope. In this way, we endow the approach with an
extra sensitivity to change.
ANT’s concepts of translation and inscription also contributed to disclose the network
complex relationships and detect changes in actors’ positions over time. Both provided general
indications that inspired us to perceive how actors in a networked business model are engaged
into a dynamic negotiation, mutually translating each other in a black boxing attempt. We
translated these indications and inscribed them in the approach’s artifacts. They expose the actors
will to capitalize on the weaknesses of the existing inscriptions, follow anti-programs and battle to
achieve an alignment favorable to the interests of the actors, providing clues for future events and
indications on proper ways to address them.
The business model dynamics was particularly felt in GreenHomes and InovWine. In the
former, BIZ2BIS allowed us to detect problematic occurrences (e.g., the progressive lack of
motivation of some actors) that could lead to the business model collapse. The setbacks were
analyzed and different solutions based on identified opportunities were proposed with the aim of
reorganizing the actors’ participation. In the latter, we were confronted with an extremely
dynamic scenario. Due to the constant changes, alternative business models were contemplated,
and some of the initial aims were adjusted. The InovWine dynamics motivated us to reinforce the
flexibility of the approach in order to take into account new actors, different value propositions,
additional services, or amendments to the business model. The evolution of our knowledge during
InovWine, as well as the unexpected changes, alerted us to the need of tracing the information in
its successive versions. To illustrate this incremental development, we specified a notation to fill
the artifacts “Networked business model scenario” and “Actor description chart”, in which
previous versions of the obtained information, incorrect assumptions, and new data are distinctly
described.
Overall, RQ1 was addressed by emphasizing the nature of business models as multi-
dimensional actor-networks. The application of ANT has been instrumental in opening the black
box of business models in network configurations. The combination of business model theories
and ANT (as well as other social influences) offered us a new look with potential to disclose what
drives stakeholders to participate and get involved in the network. Using insights from these fields
sharpened BIZ2BIS’ ability to recognize problematic occurrences dangerous to the network
stability and seek viable alternatives that may avoid an eventual disintegration.
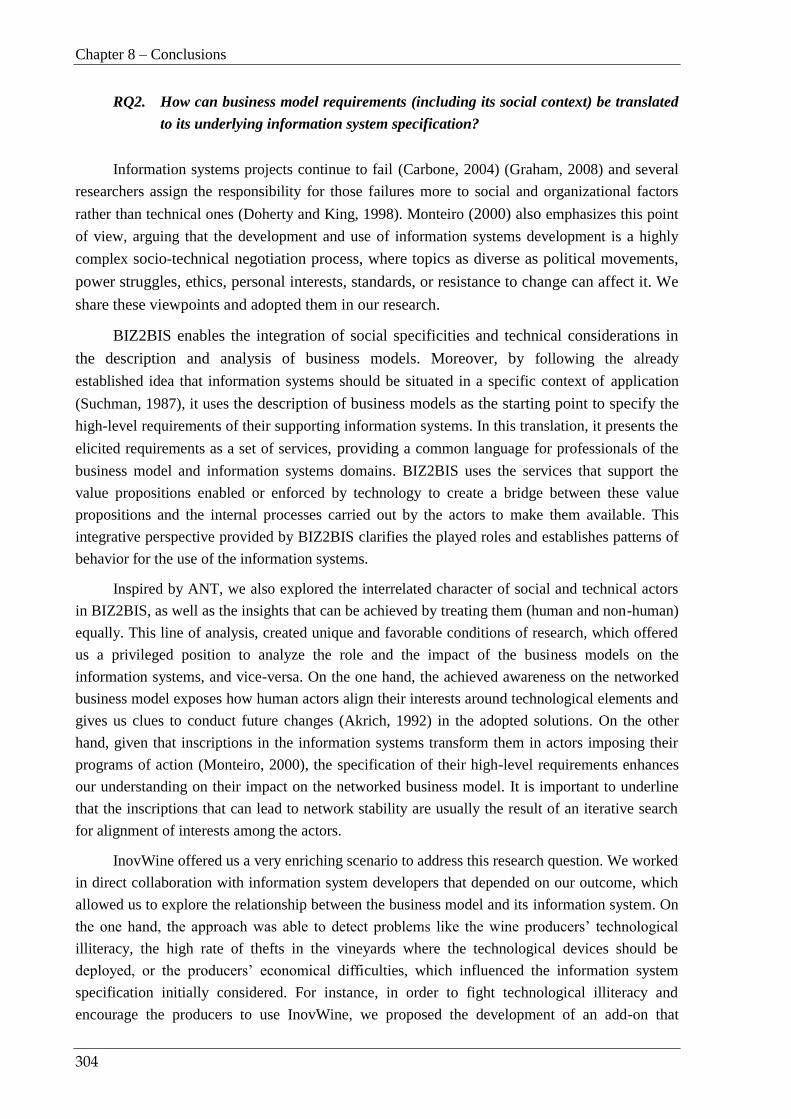
Chapter 8 – Conclusions
304
RQ2. How can business model requirements (including its social context) be translated
to its underlying information system specification?
Information systems projects continue to fail (Carbone, 2004) (Graham, 2008) and several
researchers assign the responsibility for those failures more to social and organizational factors
rather than technical ones (Doherty and King, 1998). Monteiro (2000) also emphasizes this point
of view, arguing that the development and use of information systems development is a highly
complex socio-technical negotiation process, where topics as diverse as political movements,
power struggles, ethics, personal interests, standards, or resistance to change can affect it. We
share these viewpoints and adopted them in our research.
BIZ2BIS enables the integration of social specificities and technical considerations in
the description and analysis of business models. Moreover, by following the already
established idea that information systems should be situated in a specific context of application
(Suchman, 1987), it uses the description of business models as the starting point to specify the
high-level requirements of their supporting information systems. In this translation, it presents the
elicited requirements as a set of services, providing a common language for professionals of the
business model and information systems domains. BIZ2BIS uses the services that support the
value propositions enabled or enforced by technology to create a bridge between these value
propositions and the internal processes carried out by the actors to make them available. This
integrative perspective provided by BIZ2BIS clarifies the played roles and establishes patterns of
behavior for the use of the information systems.
Inspired by ANT, we also explored the interrelated character of social and technical actors
in BIZ2BIS, as well as the insights that can be achieved by treating them (human and non-human)
equally. This line of analysis, created unique and favorable conditions of research, which offered
us a privileged position to analyze the role and the impact of the business models on the
information systems, and vice-versa. On the one hand, the achieved awareness on the networked
business model exposes how human actors align their interests around technological elements and
gives us clues to conduct future changes (Akrich, 1992) in the adopted solutions. On the other
hand, given that inscriptions in the information systems transform them in actors imposing their
programs of action (Monteiro, 2000), the specification of their high-level requirements enhances
our understanding on their impact on the networked business model. It is important to underline
that the inscriptions that can lead to network stability are usually the result of an iterative search
for alignment of interests among the actors.
InovWine offered us a very enriching scenario to address this research question. We worked
in direct collaboration with information system developers that depended on our outcome, which
allowed us to explore the relationship between the business model and its information system. On
the one hand, the approach was able to detect problems like the wine producers’ technological
illiteracy, the high rate of thefts in the vineyards where the technological devices should be
deployed, or the producers’ economical difficulties, which influenced the information system
specification initially considered. For instance, in order to fight technological illiteracy and
encourage the producers to use InovWine, we proposed the development of an add-on that

8.3 Research contributions
305
whenever a new warning was available, the information system would make a phone call to
producers alerting them to that fact, as opposed to forcing them to learn how to use the often not
obvious SMS interface on their smartphones. On the other hand, the high-level requirements of
the information system were also carried out with the purpose of inscribing a particular behavior
in the network and in its actors. For instance, the insights of the monitoring and alarm system are
only accessible for producers that entered their data.
8.3 Research contributions
The major contribution of this research is BIZ2BIS, an approach to discuss, design, and
evaluate inter-organizational business models, while deriving the high-level requirements for their
underlying information systems. It systematically helps scrutinize and tune the contributions and
gains of the various actors to ensure that all of them will end up with attractive value propositions
able to reinforce their continued commitment.
The approach is organized in four phases: the first identifies and characterizes the network’s
actors, as well as the structural aspects that influence their behavior. The second studies the
network and, through an iterative negotiation, suggests eventual adjustments to ensure the
alignment of the actors’ interests. In the third phase, the stability of the resulting scenario is
evaluated. The fourth uses the obtained insights to derive the high-level requirements for its
underlying information system. The outcome is an aligned network of interests that documents all
the business model interactions among the actors, their contributions, their gains, and that
provides guidelines to the specification of the services that the information system underlying the
business model must provide. In this section, we present our major theoretical and practical
contributions.
8.3.1 Theoretical contributions
We contributed to the existing literature on business models by moving beyond the usual
accounts of individual scenarios and focusing our attention on networked business model
configurations. When analyzing a business model, we take into account the value propositions of
each organization, but we do not limit ourselves to a compartmentalized view. We look at the
network and how each actor can be valuable to others, and what others possess that may be
considered valuable by the former. Moreover, we consider that actors can assess value differently
and that the revenue streams are not the only measure of value creation. Most of the time, it
results from a combination of efforts in which, for instance, financial aspects can be related to
topics as diverse as prestige and brand recognition. The fertile combination of business model
flows and contributions, which give rise to multifaceted interpretations by the actors, had two
main implications in BIZ2BIS: understanding how these flows could be arranged to capture and
co-create value and the importance of developing an evaluation mechanism with the capacity to
integrate each actor’s perception.

Chapter 8 – Conclusions
306
The complexity of network configurations strengthened the importance of integrating social
aspects in the study of business model scenarios. As others, (Morgan, 1986, Lyytinen and
Damsgaard, 2001), we argue that social reality cannot be reduced to a small set of discrete
variables (such as power, influence, technical know-how, available funds, values, beliefs, norms,
or rituals), and that complex systems are historically situated and depend on context and time. To
integrate this perspective in BIZ2BIS, we complemented insights from the business model domain
with social influences. This choice introduced in our research the social context of the network
and of its actors, which allowed us to look at a business model as a multiplicity of overlapping
dimensions and brought into play a broader view. Our main influence, ANT, also took us further
in understanding how business models can shape their supporting networks. Its guidelines to
follow and identify the business actors aided us to unveil connections and helped us to clarify the
network boundaries. Using the definitions, taxonomies, components and representations in the
business model literature as a starting point, we integrated ANT’s ability to disclose and detail
relationships in the specification of the business model dimensions. Furthermore, ANT’s concepts
of translation and inscription showed us how actors form alliances or come into conflict, which
inspired us to innovate and create a negotiation mechanism to manage the different interests that
co-exist in a networked business model.
The developed negotiation mechanism supports the search for network stability. It endows
BIZ2BIS with sensitizing devices that try to enroll actors in the business model, tune less
satisfactory solutions, reach network alignment, and anticipate and cope with emergent
problems. When this happens, we present the adopted solution to all the involved actors and
ask for their assessment. Due to the impact that the actors’ abandonment might cause in the
network, our evaluation attributes a high importance to their own perceptions and takes into
account their individual expectations. Furthermore, we consider it fundamental to involve the
actors in the business model conceptualization, as well as in the specification of its supporting
information systems.
The relationship between business models and information systems is underrepresented in
the literature (Bouwman et al., 2012). Clear advantages can be obtained by establishing
connection points and detecting influences between both (Chan and Reich, 2007). Taking into
account the wealth of information collected by BIZ2BIS, we gathered promising conditions to
expose the connections between these two domains and explore their combined efforts. We used
the concept of service to translate the data obtained about the business model into high-level
requirements that should be met by its information system. The concept of service helped us to
perform this translation. It allowed us to establish a point of contact between the value
propositions made available and the internal business processes supported by the information
system. ANT’s ability to regard non-human actors and observe how they affect and are affected
by humans, as well as its concept of inscription also inspired us to detail the relationships between
the two domains and investigate their dependencies.
“Theory is both a way of seeing and a way of not-seeing” (Walsham, 1993). It leads our
way in certain directions, but at the same blinds us to others. Our research combines several
theories. As mentioned, we complemented business model theories mainly with ANT, but

8.3 Research contributions
307
Structuration Theory also influenced us. The main difference between both is their socio-technical
stance (in Structuration Theory technology’s ability to make a difference is unacknowledged).
Their combination is not a novelty and can be consulted for instance in (Walsham, 2001,
Macome, 2002, Brooks and Atkinson, 2004, Naidoo, 2008). However, our contribution is related
to how they can be applied in an innovative way to the business model domain. In networked
business model scenarios, Structuration Theory was used to guide a broader social analysis and
ANT to detail socio-technical connections. Structuration Theory’s capacity to describe a context
and regard how it influences the actions of humans, together with the ANT’s aptitude to analyze
relationships among actors, provided a new background of analysis.
The experience of adopting an interpretive approach and the sequential combination of two
research methods (Morse, 2003): case study and action research, is another contribution of this
research. The actions carried out and the choices made can be used for others who wish to apply
this strategy. The diversity of the scenarios under study was also enhanced by the study of past
and ongoing projects.
When looking at Pateli and Giaglis work (2004), we propose the inclusion of two extra
dimensions to their framework (discussed in section 2.1) to encompass the requirements of a
network configuration. The first should cover the negotiations that must be carried out among the
actors involved in these environments, while the second should cover the dependencies between
business models and their information systems. Furthermore, in contrast to what is often assumed
in literature, the evaluation should go beyond financial streams.
The work we developed has as its outcome the list of publications presented below:
Costa, C. C. and Cunha, P. R. d. 2010, Who are the players? Finding and characterizing
stakeholders in social networks, 43 Hawaii International Conference on System
Sciences, Kauai, Hawaii, 4-7 January.
Costa, C. C. and Cunha, P. R. d. 2009, Business Model Design from an ANT
Perspective: contributions and insights of an open and living theory, In Value creation
in e-business management, 15th Americas Conference on Information Systems
(selected papers) (Eds, Nelson, M. L., Shaw, M. J. and Strader, T. J.) Springer, San
Francisco, USA, pp. 56-67.
Costa, C. C. and Cunha, P. R. d. 2009, Happy actors, lasting Relations: how to design a
sustainable inter-organizational business model, Pacific Asia Conference on
Information Systems, Hyderabad, India, 10-12 July.
Costa, C. C. and Cunha, P. R. 2008, Reducing uncertainty in business model design: a
method to craft the value proposal and its supporting system, 16th European Conference
on Information Systems, Galway, Ireland, 9-11 June.
Costa, C. C. and Cunha, P. R. d. 2007, Towards an approach to assist business model
and supporting information system design, European and Mediterranean Conference on
Information Systems, Valencia, Spain, 24-26 June.

Chapter 8 – Conclusions
308
Costa, C. C. and Cunha, P. R. d. 2007, Business model design for complex value
networks using inputs from management, IS, and social theories, 15th European
Conference on Information Systems - Doctoral Consortium, St. Gallen, Switzerland, 7-9
June.
Costa, C. C. and Cunha, P. R. d. 2006, Specification of business models using social
theories: actor-network and Structuration Theory, 1st Mediterranean Conference on
Information Systems - Doctoral Consortium, Venice, Italy, 4-8 October.
8.3.2 Practical contributions
The contact with business practitioners showed us their difficulties in representing,
analyzing, and evaluating business models operating in network configurations. These
professionals were eager for practical guidelines capable of creating a common background of
knowledge that could help them to improve communication and understanding among the actors
of the business model. Above all, they wanted to perceive the complexity of the existing
relationships, the phenomena of cooperation and competition, and obtain clues about the viability
of their ideas. Furthermore, there was a tendency not to regard the social and organizational
dimension of information systems and to remove them from their context. The resulting partial
view hinders the correct specification of their high-level requirements.
BIZ2BIS, throughout its four phases sought to answer the identified expectations. In the
previous section, we already discussed its theoretical influences and contributions. Now, we will
underline how its standardized outlined plan can guide its future users in their activities of
discussion, design, and evaluation. Our aim was to make the business model study as independent
as possible from the intrinsic capabilities of the analysts. Furthermore, we conceptualized the
approach to be used by others than analysts. By not demanding to its users the acquisition of
knowledge outside their area of expertise (the theoretical influences used in BIZ2BIS were
integrated in an understated form) we made it accessible to them and promoted their
collaboration.
The application of BIZ2BIS is well documented and exemplified in this thesis, gleaning
knowledge for others who wish to employ it. Through its application practitioners have the chance
to:
Describe in detail the network and its actors, defining the networked business model
boundaries with some assurance. It provides the necessary tools to bring the
business model’s context to its study, enriching its vision and the gathered
knowledge.
Include the actors’ individual perceptions in the network analysis to deal efficiently
with the different interests of the involved actors.
Apply an iterative negotiation mechanism that seeks the alignment of the actors’
interests, so that each can find an attractive and sustainable value proposition able to
ensure that all the involved have an enticing reason to participate.

8.3 Research contributions
309
Point out incompatibilities, inconsistencies, problems, and threats that may
compromise the network and lead to its collapse. The obtained insights provide
clues on alternative business model configurations that can be used to tune the
present solutions and explore future options.
Involve the actors in the conceptualization of the business model and in the
assessment of the provided value propositions. To integrate a broader view of the
interests that motivate the actors (e.g., prestige, scientific knowledge, and data), the
evaluation of each one goes beyond the usual financial issues.
Provide a comprehensive outlook of the networked business model to the actors
with power to change it, supporting their assessments and choices.
Enable the description of the business analysts’ knowledge throughout the case, as
well as of the proposed solutions.
Document in detail the business model. Its actors’ roles, their interactions,
performed activities, and value propositions, to specify high-level requirements that
ultimately should be met by the information system.
Establish a link between business models and information systems. BIZ2BIS
translates the outcomes of the devised business model description into the high-
level requirements of its information system. It presents for each identified service
the reasons for its existence, how it should be used, its scope in the network, and
technical considerations. The obtained outcomes allow information system
practitioners to obtain an inclusive view of the solutions to implement in the
business context. The enriched view conveyed to practitioners provides additional
guarantees about the possibilities of implementing solutions that in fact answer the
needs of the network and of its actors.
The above points were addressed in the scenarios we studied (in whole or in part). In
InovWine, the interest of the actors in creating favorable conditions to the success of the post-
InovWine project and the collaboration established with the practitioners allowed us to explore
the full potential of BIZ2BIS. Taking into account the actors demands and needs, we found
problems in the business model initially proposed. Therefore, we presented alternative solutions,
intervened to minimize them, and made the business model evolve, enhancing its viability. We
also used the gathered knowledge for deriving the high-level requirements of the information
system to be deployed, boosting its chances of adoption.
At the end of this thesis, BIZ2BIS can be viewed as an actor and its employment as an
emergent attempt of black boxing a networked business model. However, like any other actor it is
subject to the translation of others, who, will certainly find weaknesses in the performed
inscriptions and, hopefully, will use them to enhance “our” proposal.

Chapter 8 – Conclusions
310
8.4 Limitations
We now reflect on the limitations of our work. Firstly, we were in an initial stage of the
research when we started studying the HowMuchIsIt and the Online Journal business models,
which limited our capacity to fully exploit these scenarios. These two, as well as GreenHomes,
were interrupted due to circumstances beyond our control and restricted our access to
practitioners’ feedback. Despite the impossibility to address all the ideas, proposals, and actions
initially planned, the three case studies clearly contributed to the gradual evolution of BIZ2BIS.
Secondly, in InovWine, we had the chance, and freedom, to follow the actors, create close
relationships, open black boxes, influence decisions, and act in the networked business model.
Our study made it clear that the original business model was unviable and provided indications of
possible alternatives. Our suggestions were validated and accepted by the involved actors, which
gave rise to a common feeling that a better solution was achieved. However, business models are
themselves an on-going “ecosystems”, and in spite of the positive feedback the updated version of
InovWine is still being implemented, which makes the assessment of its success unfeasible.
Furthermore, the presentation of our report does not imply that the actors involved have stopped
modifying or introducing new programs of action - changes posterior to our study can influence
the business model accomplishments. InovWine would benefit from a longitudinal analysis, but
within the relatively short time period of a PhD thesis it is not always possible to find the perfect
case or return to it whenever, and however, the researchers intend to. Practical feasibility will
most of the times remain an issue in any research design.
Thirdly, it is impossible to assure that the obtained business model outcomes are absolutely
unbiased. As the researchers try to comprehend what is observed, their personal values, ideologies
and a priori knowledge will invariably intrude the observations and the achieved findings
(Baskerville, 1999). However, to understand the business model, it is necessary to acknowledge
the complex realities that can influence it. It is fundamental to dig “inside” it, regard the different
interpretations, and disclose vital interplays that can influence it. In an attempt to minimize
possible glitches, the actors validated all the proposed value propositions to the business model.
Their involvement encourages collaboration between business model analysts and practitioners of
a specific domain, facilitating and supporting necessary adjustments.
8.5 Directions for future research
On the basis of what we presented, it is important to discuss how the work we undertook
can be useful for future research on networked business models. The recognized limitations
provide a starting point for further studies.
First, we think it would be interesting to revisit InovWine and study its developments after
2011. To perceive how its business model has been actually applied would enhance our
knowledge about the suitability of the approach and of the proposed solutions to address the
detected problems. Furthermore, towards the end of writing this thesis, we knew that our

8.5 Directions for future research
311
suggestion to foster cooperation with big producers was followed and was taking its first steps.
The parallel application of a similar version of InovWine by one of the major Portuguese wine
producers offers the chance to observe the impact of the actors’ characteristics (e.g., their
influence in the wine sector, financial means, and technological background) in the business
model success.
The increasing importance assigned to the co-creation of value propositions and service
innovation makes it reasonable to expect that the practical potential of BIZ2BIS will be
recognized. For example, we presented it to an African company responsible for the ATM
transactions in its country. Its managers intend to reduce the maintenance cost of their information
system and introduce innovative services through the implementation of a new, networked,
business model supported by collaborations with European and African companies.
Documentation on BIZ2BIS was provided and a meeting has already been scheduled.
Furthermore, the application of the approach to other scenarios can aid to develop patterns to
address a particular business model aspect (e.g., the development of services relevant to critical
actors or conflicting negotiations).
Second, it would be interesting to compare the outcomes obtained with our interpretation
and use of ANT with those achieved by other theoretical influences. In our opinion, the
comparison can be specially challenging if these influences stem from a different paradigm.
Under these restrictions, diffusion theory captured our attention. In this theory, the social system
and technology are regarded as separate, and the latter is transferred and adopted in its original
form (or reinvented in its implementation) (Nijland, 2004). Typical applications of this theory
focus on finding adoption-diffusion factors for already black-boxed innovations. On such a
different perspective, Latour claims that “after many recruitments, displacements and
transformations, the project, having become real, then manifests, perhaps, the characteristics of
perfection, profitability, beauty, and efficiency that the diffusion model located in the starting
point” (Latour, 1996a). In spite of the apparent incompatibilities with ANT, we believe
diffusion theory can aid in the identification of factors that can sharpen our business model
understanding and for that reason should be carefully addressed.
Third, the implementation of an application to support the use of BIZ2BIS in the field
would be helpful. The solution should allow the introduction of data by several users, while
attending meetings or performing interviews, according to the fields presented in the “Networked
business model chart” and “Actor description chart”. The information they gather supports the
development of other instruments. Therefore, the obtained data can be used as a starting point to
automatically create their draft versions. Furthermore, the knowledge acquired through BIZ2BIS
can be used in combination with other domains. For instance, fields such as business intelligence
and simulation can provide the necessary background to boost the capacity of the approach to
predict and simulate future scenarios, enhancing its ability to address the network dynamics.
Fourth, the development of synergies between BIZ2BIS and the Business Model Canvas
would increase their applicability and streamline their outcomes. During our research, we were
invited to provide some assistance in the analyses and design of two networked business models

Chapter 8 – Conclusions
312
not addressed in this thesis. In these two scenarios, artifacts from our proposal were used to
perceive the network’s interactions, the interchanged flows, the negotiations carried out, the
achieved alignment, and indications about the supporting information systems of the business
models. Simultaneously, the Business Model Canvas was also employed to cover the “private”
business model of a common actor to both business models. Through the developed work, it was
possible to witness the interesting bridges that were established between these different views. On
the one hand, the data gathered through our approach when studying the networked business
models was used to define (or redefine) the “private” business models of the actors that compose
the network. On the other hand, when discussing issues from the “private” business models of
each actor, Business Model Canvas provided useful insights for the network. This situation is not
a surprise, since Osterwalder’s work was used as one of the sources of inspiration to develop
BIZ2BIS (e.g., components to address, or the use of the business model as a communication tool),
which promotes points of contact.
Fifth, due to the characteristics of the studied cases we were never able to fully explore the
insights that SNA could bring to our approach. Nevertheless, in situations where the number of
actors is higher and there is access to data on the exchanged flows, it will be interesting to
consider SNA (e.g., the centrality concept) and combine its outcome with the ones provided by
BIZ2BIS. This can be particularly relevant in situations in which, for some reason, will not be
possible to capture the actors’ perceptions on the business model.
Sixth, the nature of ANT and action research makes them outstandingly suitable for a
critical information systems research project (for instance, in the public sector). The specific
purpose of this type of project ranges from creating knowledge as a catalyst for change, to aiding
and giving voice to various marginalized groups and stakeholders in information systems
development (Cecez-Kecmanovic, 2007). In light of the economic turmoil at the beginning of the
second decade of the present century, the use of humanistic principles in information systems, see
for instance (Mumford and Sackman, 1974), lost relevance. The mainstream information systems
research adopted the purpose of assisting managers in achieving business success through the
attainment of knowledge that informs and sustains their decisions and activities. To question this
state of affairs, critical information system researchers propose an alternative vision. They believe
in the power of knowledge to transform consciousness and are convinced that one of their
obligations is to contribute to more democratic and balanced organizations (Klein and Myers,
1999, Myers and Klein, 2011). We trust that BIZ2BIS can contribute with its insights to a more
equitable society through the development of sustainable business models in which all the actors’
interests are respected (or at least considered as much as possible) and inscribed in the
information systems. Researchers can also have their own expectations (viable or not).

313
References
Adler, P. S. and Kwon, S. W. 2002, 'Social capital: prospects for a new concept', Academy of
Management Review, vol. 27, no. 1, p. 17-40.
Afonso, A. P. 2009. A gestão das comunidades de aprendizagem enquanto geradoras de contextos de
aprendizagem (um estudo de caso).Faculdade de Psicologia e de Ciências da Educação,
Universidade de Coimbra.
Afuah, A. and Tucci, C. 2003, Internet business models and strategies, McGraw-Hill, Boston.
Afuah, A. and Tucci, C. L. 2001, Internet business models and strategies: text and cases, McGraw-
Hill, New York.
Akrich, M. 1992, 'The de-scription of technical objects', Shaping Technology, Building Society:
Studies in Sociotechnical Change, (Eds, Bijker, W. and Law, J.), MIT Press, Cambridge, p. 205
– 224.
Akrich, M. and Latour, B. 1992, 'A summary of a convenient vocabulary for the semiotics of human
and nonhuman assemblies', Shaping technology/ building society: Studies in Sociotechnical
Change, (Eds, Bijker, W. and Law, J.), MIT Press, Cambridge, p. 259 – 264.
Al-Debei, M., El-Haddadeh, R. and Avison, D. 2008, Defining the business model in the new world of
digital business. Paper presented at the 14th Americas Conference on Information Systems,
Toronto, Canada, 14-17 August.
Al-Debei, M. M. and Avison, D. 2010, 'Developing a unified framework of the business model
concept', European Journal of Information Systems, vol. 19, no. 3, p. 359–376.
Allee, V. 2000, 'Reconfiguring the value network', Journal of Business Strategy, vol. 21, no. 4, p. 36-
39.
Allee, V. 2008, 'Value network analysis and value conversion of tangible and intangible assets',
Journal of Intellectual Capital, vol. 9, no. 1, p. 5-24.
Alt, R. and Zimmermann, H. D. 2001, 'Introduction to special section on business models', Electronic
Markets vol. 11, no. 1, p. 3-9.
Amit, R. and Zott, C. 2001, 'Value creation in e-business', Strategic Management Journal, vol. 22, no.
6-7, p. 493-520.
Andersson, B., Bergholtz, M., Edirisuriya, A., Ilayperuma, T., Johannesson, P., Grégoire, B., Schmitt,
M., Dubois, E., Abels, S., Hahn, A., Gordijn, J., Weigand, H. and Wangler, B. 2006, 'Towards a
reference ontology for business models', Proceedings of the 25th international conference on
Conceptual Modeling (ER'06), (Eds, Embley, D. W., Olivé, A. and Ram, S.), Springer-Verlag,
Berlin, p. 482-496.
Andrews, K. R. 1971, The concept of corporate strategy, Dow Jones-Irwin, Homewood.
Ashmore, R., Woolfitt, R. and Harding, S. 1994 'Humans and others, agents and things', American
Behavioral Scientist vol. 37, no. 6, p. 733-740.

References
314
Avison, D. 1993, Research in information systems development and the discipline of information
systems. Paper presented at the 4th Australasian Conference on Information Systems,
Queensland, Australia, 28-30 September.
Avison, D., Baskerville, R. and Myers, M. 2001, 'Controlling action research projects', Information
Technology and People, vol. 14, no. 1, p. 28-45.
Avison, D., Lau, F., Myers, M. and Nielsen, P. 1999, 'Action research', Communications of the ACM,
vol. 42, no. 1, p. 94-97.
Aziz, S. A., Fitzsimmons, J. and Douglas, E. 2008, Clarifying the business model construct. Paper
presented at the 5th AGSE International Entrepreneurship Research Exchange, Melbourne,
Australia, 5-8 February.
Bakhshaie, A. 2008. Testing an Actor-Network Theory Model of Innovation Adoption with
Econometric Methods. Master of Science,Science and Technology Studies, Faculty of the
Virginia Polytechnic Institute and State University.
Ballejos, L. C. and Montagna, J. M. 2008, 'Method for stakeholder identification in interorganizational
environments ', Requirements Engineering, vol. 13, no. 4, p. 281-297.
Bambury, P. 1998, 'A taxonomy of Internet commerce', First Monday, vol. 3, no. 10.
Barab, S., Hay, K. and Yamagata-Lynch, L. 2001, 'Constructing Networks of Action-Relevant
Episodes: An In situ Research Methodology', The Journal of the Learning Sciences vol. 10 no.
1&2, p. 63-112.
Barnes, B. 1974, Scientific Knowledge and Sociological Theory, Routledge and Kegan Paul, Boston.
Barnes, B. 1977, Interests and the growth of knowledge, Routledge and Kegan Paul, London.
Barney, J. 1991, 'Firm Resources and Sustained Competitive Advantage', Journal of Management, vol.
17, no. 1, p. 99-120.
Baskerville, R. 1999, 'Investigating Information Systems with Action Research', Communications of
the Association for Information Systems, vol. 2, no. 19, p. 1-32.
Baskerville, R. and Myers, M. 2004, 'Special issue on action research in information systems: making
IS research relevant to practice-foreword', MIS Quarterly vol. 28, no. 3, p. 329-335.
Baskerville, R. and Wood-Harper, A. 1996, 'A critical perspective on action research as a method for
information systems research', Journal of Information Technology, vol. 3, no. 11, p. 235-246.
Baskerville, R. L. and Lee, A. S. 1999, 'Distinctions among different types of generalizing in
information systems research', New Information Technologies in Organizational Processes:
Field Studies and Theoretical Reflections on the Future of Work, (Eds, Introna, N. L., Myers,
M. and Degross, J. I.), Kluwer, New York, p. 49-65.
Bellman, R., Clark, C. E., Malcolm, D. G., Craft, C. J. and Ricciardi, F. M. 1957, 'On the construction
of a multi-stage, multi-person business game', Operations Research, vol. 5, no. 4, p. 469- 503.
Bijker, W. E. 1994, 'Sociohistorical technology studies', Handbook of Science and Technology
Studies, (Eds, Jasanoff, S., Markle, G., Petersen, J. and Pinch, T.), Sage, London, p. 229-256.
Blichfeldt, B. and Andersen, J. 2006, 'Creating a wider audience for action research: Learning from
case-study research', Journal of Research Practice, vol. 2, no. 1, p. 1-15.
Blizzard Entertainment Inc. 2011. World Of Warcraft ® Subscriver base reaches 12 million worldwide
[Online]. Available: http://us.blizzard.com/en-us/company/press/pressreleases.html?101007
[Accessed October 2011]
Bloomfield, B. P., Coombs, R. and Owen, J. 1994, 'The social construction of information systems: the
implications for management control', The Management of Information and Communication
Technologies: Emerging Patterns of Control, (Ed, Mansell, R.), Aslib, London, p. 143-157.
References
315
Bloor, D. 1976, Knowledge and social imagery, Routledge and Kegan Paul, London.
Boland, R. J. 1991, 'Information system use as a hermeneutic process', Information Systems Research:
Contemporary Approaches and Emergent Traditions, (Eds, Nissen, H.-E., Klein, H. K. and
Hirschheim, R. A.), NorthHolland, Amsterdam, p. 439-464.
Bourdieu, P. 1986, 'The forms of capital', Handbook of Theory and Research for the Sociology of
Education, (Ed, Richards, J. G.), Greenwood Press, New York, p. 241–258.
Bouwman, H., Faber, E., Fielt, E., Haaker, T. and Reuver, M. D. 2008a, 'STOF model: critical design
issues and critical success factors', Mobile Service Innovation and Business Models (Ed, H.
Bouwman, H. D. V. T. H.), Springer, Heidelberg, p. 71-88.
Bouwman, H., Faber, E., Haaker, T., Kijl, B. and Reuver, M. D. 2008b, 'Conceptualizing the STOF
model', Mobile Service Innovation and Business Models, (Ed, H. Bouwman, H. D. V. T. H.),
Springer, Heidelberg, p. 31-70.
Bouwman, H., Haaker, T. and Faber, E. 2005a, Developing mobile services: balancing customer and
network value. Paper presented at the IEEE International Workshop on Mobile Commerce and
Services, WMCS’05, Munich, Germany, 18-19 July.
Bouwman, H., Hooff, B., Wijngaert, L. and Dijk, J. 2005b, Information and Communication
Technology in organizations, Sage Publications, London.
Bouwman, H., Reuver, M. D., Solaimani, S., Daas, D., Haaker, T., Janssen, W., Iske, P. and
Walenkamp, B. 2012, Business models tooling and a research agenda. Paper presented at the
25th Bled eConference, Bled, Slovenia, 17-20 June.
Bouwman, H., Vos, H. D. and Haaker, T. 2008c, Mobile service innovation and business models,
Springer, Verlag Berlin Heidelberg.
Bowker, G. and Star, S. L. 1994, 'Knowledge and infrastructure in international information
management: problems of classification and coding', Information acumen: the understanding
and use of knowledge in modern business, (Ed, Bud-Frierman, L.), Routledge, London, p. 187-
216.
Braa, J., Monteiro, E. and Sahay, S. 2004, 'Networks of action: sustainable health information systems
across developing countries', MIS Quarterly, vol. 28, no. 3, p. 337-362.
Brandenburger, A. and Stuart, H. 1996, 'Value-based business strategy', Journal of Economics and
Management Strategy, vol. 5, no. 1, p. 5-24.
Brey, P. 2003, 'Theorizing technology and modernity', Modernity and Technology, (Eds, Misa, T.,
Brey, P. and Feenberg, A.), MIT Press, Cambridge, p. 33-71.
Brooks, L. and Atkinson, C. 2004, 'StructurANTion in Research and Practice: Representing Actor
Networks, their Structurated Orders and Translations', Information Systems Research: Relevant
Theory and Informed Practice, (Eds, Kaplan, B., Iii, D. T., Wastell, D., Wood-Harper, T. and
Degross, J.), Proceedings of IFIP 8.2 Conference, Kluwer Academic Publishers, Manchester, p.
389-409.
Brown, S. 2002, 'Michel Serres. Science, translation and the logic of the parasite', Theory, Culture &
Society, vol. 19, no. 3, p. 1-28.
Bryson, J. 2004, 'What to do when stakeholders matter: stakeholder identification and analysis
techniques', Public Management Review, vol. 6, no. 1.
Burrell, G. and Morgan, G. 1979, Sociological paradigms and organizational analysis, Heinemann
Educational, London.
Byrne, E. 2005, 'Using action research in Information systems design to address change: a South
African health information systems case study', Proceedings of the 2005 annual research
conference of the South African Institute of Computer Scientists and Information Technologists

References
316
on IT Research in Developing Countries, SAICSIT '05, South African Institute for Computer
Scientists and Information Technologists, White River, p. 131-141.
Callon, M. 1986a, 'The sociology of an Actor-Network: the case of the Electric Vehicle', Mapping the
Dynamics of Science and Technology: Sociology of Science in the Real World, (Eds, Callon,
M., Law, J. and Rip, A.), Macmillan, London, p. 19-34.
Callon, M. 1986b, 'Some elements of a sociology of translation: domestication of the scallops and the
fishermen of St Brieuc Bay', Power, Action and Belief: a New Sociology of Knowledge?, (Ed,
Law, J.), Routledge, London, p. 196-233.
Callon, M. 1987, 'Society in the making: the study of technology as a tool for sociological analysis',
The Social Construction of Technical Systems: New Directions in the Sociology and History of
Technology, (Eds, Bijker, W. E., Hughes, T. P. and Pinch, T. J.), MIT Press, Cambridge, p. 83-
103.
Callon, M. 1991, 'Techno-economic networks and irreversibility', A Sociology of Monsters? Essays on
Power, Technology and Domination, Sociological Review Monograph, (Ed, Law, J.), 38,
Routledge, London, p. 132-161.
Callon, M. 1993, 'Variety and irreversibility in networks of technique conception and adoption',
Technology and the Wealth of Nations: The Dynamics of Constructed Advantage, (Eds, Foray,
D. and Freeman, C.), Pinter Publishers, London, p. 232-268.
Callon, M. and Latour, B. 1981, 'Unscrewing the big Leviathan: how actors macro-structure reality
and how sociologists help them to do so', Advances in Social Theory and Methodology: Toward
an Integration of Micro-and-Macro Sociologies, (Eds, Knorr-Cetina, K. D. and Cicourel, A. V.),
Routledge & Kegan Paul, Boston, p. 277-303.
Callon, M. and Law, J. 1995, 'Agency and the Hybrid Collectif', South Atlantic Quarterly vol. 94, p.
481-507.
Callon, M. and Law, J. 1997, 'After the individual in society: lessons on collectivity from science,
technology and society', Canadian Journal of Sociology, vol. 22, no. 2, p. 165-182.
Canzer, B. 2006, E-business: strategic thinking and practice (2nd ed), Houghton Mifflin Company,
Boston.
Carbone, J. 2004, IT architecture toolkit, Prentice Hall, Upper Saddle River.
Carr, W. 2006, 'Philosophy, methodology and action research', Journal of Philosophy of Education,
vol. 40, no. 4, p. 421-435.
Cecez-Kecmanovic, D. 2007, Critical research in information systems: the question of methodology.
Paper presented at the 15 th European Conference on Information Systems St. Gallen,
Switzerland, 7-9 June.
Cecez-Kecmanovic, D. 2011, On methods, methodologies and how they matter. Paper presented at the
19th European Conference on Information Systems Helsinki, Finland, 9-11 June.
Chan, Y. and Reich, H. 2007, 'IT alignment: what have we learned?' Journal of information
technology, vol. 22, no. 4, p. 297 – 315.
Checkland, P. 1981, Systems thinking, systems practice John Wiley & Sons Chichester.
Checkland, P. 1991, 'From framework through experience to learning: the essential nature of action
research', Information Systems Research: Contemporary Approaches and Emergent Traditions,
(Eds, Nissen, H., Klein, H. and Hirschheim, R.), Elsevier Science Publishers, North-Holland, p.
397-403.
Checkland, P. and Holwell, S. 1998, Information, systems and information systems: making sense of
the field, John Wiley & Sons, Chichester.

References
317
Chesbrough, H. 2010, 'Business model innovation: opportunities and barriers', Long Range Planning,
vol. 43, no. 2-3, p. 354-363.
Chesbrough, H. and Rosenbloom, R. 2002, 'The role of the business model in capturing value from
innovation: evidence from Xerox Corporation’s technology spin-off companies', Industrial and
Corporate Change vol. 11, no. 3, p. 529–555.
Clark, A. 1972, Action research and organizational change Harper and Row, London.
Clark, J. 2001, Using actor-network theories for the study of literacy events and practices in global and
local settings. Paper presented at the International Literacy Conference, Cape Town, South
Africa, 13-17 November.
Cloatre, E. 2005. Actor-Network Theory and Socio-Legal Objects: Analysing TRIPS and
Pharmaceutical Patents in the Republic of Djibouti. PhD Thesis,Faculty of Social Sciences, Law
and Education University of Nottingham.
Cohen, L. and Manion, L. 1980, Research methods in education (3rd ed), Croom Helm, London.
Cohen, L., Manion, L. and Morrison, K. 2011, Research methods in education, Routledge, London.
Cole, R. 1991, 'Participant observer research: an activist Role', Participatory Action Research, (Ed,
Whyte, W.), Sage Publications, Inc, Newbury Park, p. 159-166.
Collins, H. 1975, 'The seven sexes: A study in the sociology of a phenomenon, or the replication of
experiments in physics ', Sociology, vol. 9, p. 205-224.
Collins, H. M. and Yearley, S. 1992, 'Journey into space', Science as Practice and Culture, (Ed,
Pickering, A.), University of Chicago Press, Chicago, p. 369-389.
Correia, G. 2006, 'Mundo virtual, dinheiro real', Exame, vol. Abril, p. 74-75.
Coughlan, P. and Coghlan, D. 2002, 'Action research for operations management', International
Journal of Operations & Production Management, vol. 22, no. 2, p. 220-240.
Cressman, D. 2009. A brief overview of Actor-Network Theory: punctualization, heterogeneous
engineering & translation [Online]. Available:
http://www.sfu.ca/cprost/docs/A%20Brief%20Overview%20of%20ANT.pdf [Accessed January
2011]
Creswell, J. W. 2009, 'Mapping the field of mixed methods research', Journal of Mixed Methods
Research, vol. 3, no. 2, p. 95-108.
Cronholm, S. and Goldkuhl, G. 2004, 'Conceptualising participatory action research – three different
practices', Electronic Journal of Business Research Methods, vol. 2, no. 2, p. 47-58.
Crotty, M. 1998, The foundations of social research: meaning and perspective in the research process,
Allen & Unwin, St Leonards.
Cunha, P. R. and Figueiredo, A. D. 2002, Action research and critical rationalism: a virtuous marriage.
Paper presented at the Xth European Conference on Information Systems (ECIS), Gdansk,
Poland, 6-8 June.
David, D. 2007, 'Case study methodology: fundamentals and critical analysis', Cognitie Creier
Comportament, vol. 11, no. 2, p. 299-317.
Davidson, E. J. 2002, 'Technology frames and framing: a socio-cognitive investigation of
requirements determination', MIS Quarterly, vol. 26, no. 4, p. 329-358.
Davison, R., Martinsons, M. and Kock, N. 2004, 'Principles of canonical action research ', Information
Systems Journal, vol. 14, no. 1, p. 65-86.
Deleuze, G. and Guattari, F. 1987, A thousand plateaus: capitalism & schizophrenia, University of
Minnesota Press, Minneapolis.

References
318
Denscombe, M. 2008, 'Communities of practice: a research paradigm for the mixed methods
approach', Journal of Mixed Methods Research, vol. 2, no. 3, p. 270-283.
Denzin, N. K. 2008, 'The new paradigm dialog and qualitative inquiry', International Journal of
Qualitative Studies in Education vol. 21, no. 4, p. 315-325.
Diamond, S. 2010, Getting more: how to negotiate to achieve your goals in the real world, Crown
Business, New York.
Diário Digital / Lusa 2010 In, Vol., p.
Dick, B. 1992. You want to do an action research thesis? [Online]. Available:
http://www.scu.edu.au/schools/gcm/ar/art/arthesis.html [Accessed June 2011]
Dick, B. 2000. A beginner's guide to action research [Online]. Available:
http://www.scu.edu.au/schools/gcm/ar/arp/guide.html [Accessed March 2011]
Dickens, L. and Watkins, K. 1999, 'Action research: rethinking Lewin', Management Learning, vol.
30, p. 127–140.
Doherty, N. F. and King, M. 1998, 'The consideration of organizational issues during the systems
development process: an empirical analysis ', Behaviour & information technology, vol. 17, no.
1, p. 41-51.
Doolin, B. 1996, 'Alternative views of case research in information systems', Australasian Journal of
Information Systems, vol. 3, no. 2, p. 21–29.
Dunning-Lewis, P. and Townson, C. 2004 In, Vol. Department of Management Science, Lancaster
University Management School p. 1-8.
Dyer, J. and Singh, H. 1998, 'The relational view: cooperative strategy and sources of
interorganizational competitive advantage', Academy of Management Review vol. 23, no. 4, p.
660– 679.
Easterbrook, S. M., Singer, J., Storey, M. and Damian, D. 2008, 'Selecting empirical methods for
software engineering research', Guide to Advanced Empirical Software Engineering, (Eds,
Shull, F., Singer, J. and Sjøberg, D. I.), Springer, London, p. 285–311.
Eden, C. and Ackermann, F. 1998, Making strategy: the journey of strategic management, Sage
Publications, London.
Eden, C. and Huxham, C. 1996, 'Action research for management research', British Journal of
Management Learning, vol. 7, no. 1, p. 75-86.
Elliot, J. 1991, Action research for educational, Open University Press, Milton Keynes.
Elliott, J. 1987, 'Educational theory, practical philosophy and action research', British Journal of
Educational Studies, vol. 35, no. 2, p. 149–169.
Esteves, J. and Pastor, J. 2004, 'Using a Multimethod Research Approach to Research Enterprise
Systems Implementations', Electronic Journal of Business Research Methods vol. 2, no. 2, p.
69-82.
Evans, P. and Wurster, T. S. 2000, Blown to bits - how the new economics of information transforms
strategy, Harvard Business School Press, Boston.
Faber, E., Ballon, P., Bouwman, H., Haaker, T., Rietkerk, O. and Steen, M. 2003, Designing business
models for mobile ICT services. Paper presented at the 16th Bled Electronic Commerce
Conference eTransformation, Bled, Slovenia, 9-11 June.
Faber, E., Haaker, T. and Bouwman, H. 2004, Balancing requirements for customer value of mobile
services. Paper presented at the 17th Bled eCommerce Conference, Bled, Slovenia, 21-23 June.

References
319
Faraj, S., Kwon, D. and Watts, S. 2004, 'Contested artifact: technology sensemaking, actor networks,
and the shaping of the Web browser', Information Technology & People, vol. 17, no. 2, p. 186-
209.
Farhoomand, A. F. 1992, 'Scientific progress of management information systems', Information
Systems Research: Issues, Methods and Practical Guidelines, (Ed, Galliers, R. D.), Blackwell
Scientific Publications Ltd, London, p. 92-111.
Ferreira, S. 2004. A estruturação díptica da gramática de regras do agrupamento de escolas como
organização. MsC,Instituto de Educação e Psicologia, Universidade do Minho.
Figueiredo, A. D. and Cunha, P. R. 2007, 'Action research and design in information systems: two
faces of a single coin', Information Systems Action Research: An Applied View of Emerging
Concepts and Methods. , (Ed, Kock, N.), Springer, New York, p. 61-97.
Figueiredo, J. M. D. d. 2004. Abordagem sócio-técnica ao desenvolvimento de sistemas de informação
inter-institucionais. PhD,Departamento de Engenharia e Gestão, Instituto Superior Técnico.
Fine, A. 1996, 'Science made up: constructivist sociology of scientific knowledge', The Disunity of
Science: Boundaries, Contexts, and Power, (Eds, Galison, P. and Stump, D.), Stanford
University Press, Stanford, p. 231-254.
Fisher, R. and Ury, W. 1991, Getting to yes: negotiating agreement without giving in, Penguin, New
York.
Foucault, M. 1980, Power/knowledge: selected interviews & other writings 1972-1977, Pantheon
Books, New York.
Fox, C. 2000. E-commerce business models: business models that have succeeded and business
models that have failed, international case studies [Online]. Available:
http://www.chriscfox.com/eCommerceBusinessModels.pdf [Accessed October 2010]
Francis, D. 1991, 'Moving from non-interventionist research to participatory action', Proceedings of
The First World Congress on Action Research, (Eds, Collins, C. and Chippendale, P.), 2, Acorn,
Sunnybank Hills, p. 31-42.
Freeman, R. 1984, Strategic management: a stakeholder approach, Pitman, Boston.
Gad, C. and Jensen, C. B. 2010, 'On the consequences of post-ANT', Science, Technology, & Human
Values, vol. 35, no. 1, p. 55-80.
Ghaziani, A. and Ventresca, M. 2005, 'Keywords and cultural change: frame analysis of business
model public talk, 1975–2000', Sociological Forum, vol. 20, no. 4, p. 523-559.
Giddens, A. 1979, Central problems in social theory, Macmillan, London.
Giddens, A. 1984, The constitution of society, University of California Press, Berkeley.
Glaser, B. and Strauss, A. 1967, The discovery of grounded theories: strategies for qualitative
research Aldine Publishing Company, Chicago.
Goldkuhl, G. 2008, Practical inquiry as action research and beyond. Paper presented at the 16th
European Conference on Information Systems, Galway, Ireland 9-11 June.
Gordijn, J. 2002. Value-based requirements engineering: exploring innovative e-commerce ideas.
PhD Thesis,School for Information and Knowledge Systems., Free University Amsterdam
http://www.cs.vu.nl/~gordijn/thesis.htm.
Gordijn, J. and Akkermans, H. 2001a, 'Designing and evaluating e-business models ', IEEE Intelligent
Systems, vol. 16, no. 4, p. 11-17.
Gordijn, J. and Akkermans, H. 2001b, 'Designing and evaluating e-business models', Intelligent
Systems, IEEE vol. 16, no. 4, p. 11-17.
References
320
Gordijn, J. and Akkermans, H. 2003, 'Value based requirements engineering: exploring innovative e-
commerce idea', Requirements Engineering Journal, vol. 8, no. 2, p. 114–134.
Gordijn, J., Akkermans, J. and Vliet, H. V. 2000, 'Business modeling is not process modeling', 1st
International Workshop on Conceptual Modeling Approaches for e-Business, (Eds, Liddle, S.
W., Mayr, H. C. and Thalheim, B.), 1921 of LNCS, Springer Verlag, Berlin, p. 40–51.
Gordijn, J., Kinderen, S. d., Pijpers, V. and Akkermans, H. 2009, 'e-services in a networked world:
from semantics to pragmatics', Future Internet – FIS 2008, (Eds, Domingue, J., Fensel, D. and
Traverso, P.), Springer Berlin, Heidelberg, p. 44-57.
Gordijn, J., Osterwalder, A. and Pigneur, Y. 2005, Comparing two business model ontologies for
designing e-business models and value constellations. Paper presented at the 18th Bled
Electronic Commerce Conference, Bled, Slovenija, 4-7 June.
Gordjin, J. 2002. Value-Based Requirements Engineering: Exploring Innovative e-Commerce Ideas.
PhD Thesis,School for Information and Knowledge Systems., Free University Amsterdam
http://www.cs.vu.nl/~gordijn/thesis.htm.
Grabher, G. 2006, 'Trading routes, bypasses and risky intersections: mapping the travels of ‘networks’
between economic sociology and economic geography', Progress in Human Geography vol. 30,
no. 2, p. 163-184.
Graham, I. 2008, Requirements modelling and specification for service oriented architecture, John
Wiley & Sons, Chichester.
Gray, K., Frieder, L. and Clark, G. 2007, 'Financial bubbles and business scandals in history ',
International Journal of Public Administration, vol. 30, no. 8-9, p. 859-888.
Greimas, A. and Courtés, J. 1982, Semiotics and language: an analytical dictionary, Indiana
University Press, Bloomington.
Guba, E. G. and Lincoln, Y. S. 1989, Fourth generation evaluation, Sage, Beverly Hills.
Guba, E. G. and Lincoln, Y. S. 1994, 'Competing paradigms in qualitative research', Handbook of
Qualitative Research (Eds, Denzin, N. K. and Lincoln, Y. S.), Sage, London, p. 105-117.
Gulati, R. and Gargiulo, M. 1999, 'Where do interorganizational networks come from?' American
Journal of Sociology, vol. 104, no. 5, p. 1439- 1493.
Gulati, R., Nohria, N. and Zaheer, A. 2000, 'Strategic networks', Strategic Management Journal, vol.
21, no. 3, p. 203-215.
Haaker, T., Bouwman, H. and Faber, E. 2004, Customer and network value of mobile services:
balancing requirements and strategic interests. Paper presented at the 25th International
Conference on Information Systems, Washington, District of Columbia, 12-15 December.
Haaker, T., Faber, E. and Bouwman, H. 2006, 'Balancing customer and network value in business
models for mobile services', International Journal of Mobile Communications, vol. 4, no. 6, p.
645-661.
Hales, K. R. 2005. Value creation in a virtual world.School of Information Technology, Bond
University.
Halinen, A. and Törnroos, J.-Å. 2005, 'Using case methods in the study of contemporary business
networks', Journal of Business Research, vol. 58, no. 9, p. 1285–1297.
Hamel, G. 2000, Leading the revolution, Harvard Business School Press, Boston.
Hamel, J., Dufour, S. and Fortin, D. 1993, Case study methods, Sage, Newbury Park.
Hanneman, R. 2001. Introduction to Social Network Methods [Online]. Available:
http://www.faculty.ucr.edu/~hanneman/ [Accessed May 2010]
References
321
Hanseth, O. and Monteiro, E. 1997, 'Inscribing behaviour in information infrastructure standards ',
Accounting, Management and Information Technologies, vol. 7, no. 4, p. 183-211.
Hanseth, O. and Monteiro, E. 1998a, Changing irreversible networks. Institutionalation and
infrastructure. Paper presented at the 6th European Conference on Information Systems, Aix-en-
Provence, France, 4-6 June.
Hanseth, O. and Monteiro, E. 1998b. Understanding information infrastructure [Online]. Available:
http://heim.ifi.uio.no/~oleha/Publications/bok.html [Accessed March 2011]
Harbers, H. 2005, Inside the politics of technology: agency and normativity in the co-production of
technology and society, Amsterdam University Press, Amsterdam.
Harford, T. 2006, The undercover economist Little Brown, London.
Harrigan, K. R. 1987, 'Strategic alliances: their new role in global competition', Columbia Journal of
World Business, vol. 22, no. 2, p. 67-69.
Hatzakis, T., Lycett, M., Macredie, R. and Martin, V. A. 2005, 'Towards the development of a social
capital approach to evaluating change management interventions', European Journal of
Information Systems vol. 14, no. 1, p. 60-74.
Hawkins, R. 2001 The “business model” as a research problem in electronic commerce.
Heck, E. v. and Vervest, P. H. 2007, 'Smart business networks: how the network wins',
Communications of the ACM, vol. 50, no. 6, p. 28-37.
Henderson, H. and Sethi, S. 2006, Ethical markets: growing the green economy, Chelsea Green
Publishing, White River Junction.
Hernes, T. 2005, 'The organization as a nexus of institutional macro actors: the story of a lopsided
recruitment case', Actor-Network Theory and Organizing, (Eds, Czarniawska, B. and Hernes,
T.), Elanders Berlings, Malmo, p. 112-128.
Hoegg, R., Martignoni, R., Meckel, M. and Stanoevska-Slabeva, K. 2006, 'Overview of business
models for Web 2.0 communities', Workshop Gemeinschaften in Neuen Medien (GeNeMe)
(Eds, Meißner, K. and Engelien, M.), TUDPress, Dresden, p. 33-49.
Holbrook, M. B. 1999, Consumer value: a framework for analysis and research, Routledge, New
York.
Holmström, J. and Robey, D. 2005, 'Inscribing organizational change with information technology',
Actor-network theory and organizing, (Ed, Hernes, B. C. A. T.), Liber and Copenhagen
Business School Press, Malmo, p. 165-187.
Holmström, J. and Stalder, F. 2001, 'Drifting technologies and multi-purpose network: the case of the
Swedish cashcard', Information and Organization, vol. 11, p. 187-206.
Horsti, A. 2007. Essays on electronic business models and their evaluation. Helsinki School of
Economics.
House, N. V. 2004, 'Science and technology studies and information studies', Annual Review of
Information Science and Technology, vol. 38, no. 1, p. 1-86.
Hughes, T. 1986, 'The seamless web: technology, science, etcetera, etcetera', Social Studies of Science,
vol. 16, no. 2, p. 281-292.
Hult, M. and Lennung, S. 1980, 'Toward a Definition of Action Research: a Note and Bibliography',
Journal of Management Studies, vol. 17, no. 2, p. 241-250.
Iansiti, M. and Levin, R. 2004, 'Strategy as ecology', Harvard Business Review, vol. 82, no. 3, p. 68-
78.

References
322
Iyamu, T. and Roode, D. 2010, 'The use of Structuration Theory and Actor Network Theory for
analysis: case study of a financial institution in South africa', International Journal of Actor-
Network Theory, vol. 2, no. 1, p. 1-26.
Jaques, E. 1952, The changing culture of a factory, Dryden Press, New York.
Jarillo, J. C. 1993, Strategic networks: creating the borderless organization Butterworth-Heinemann,
Oxford.
Johansson, N. and Mollstedt, U. 2006, 'Revisiting Amit and Zott's model of value creation sources: the
SymBelt customer center case', Journal of Theoretical and Applied Electronic Commerce
Research, vol. 1, no. 3, p. 16-27.
Johansson, R. 2003, Case study methodology. Paper presented at the International Conference on
Methodologies in Housing Research, Stockholm, Sweden, 22-24 September.
Johnson, G. and Scholes, K. 2002, Exploring corporate strategy (6th ed), Pearson Education, Harlow.
Johnson, M. W. 2010, Seizing the white space: business model innovation for growth and renewal,
Harvard Business Press, Boston.
Jones, G. M. 1960, 'Educators, electrons, and business models: a problem in synthesis', Accounting
Review, vol. 35, no. 4, p. 619-626.
Jones, M. and Karsten, H. 2003 Review: structuration theory and information systems research.
Jones, M., Orlikowski, W. and Munir, K. 2004, 'Structuration theory and information systems: A
critical reappraisal', Social theory and philosophy for information systems, (Ed, Mingers, W.
J.), Wiley, Chichester, p. 297-328.
Kallio, J., Tinnilä, M. and Tseng, A. 2006, 'An international comparison of operator-driven business
models', Business Process Management Journal, vol. 12, no. 3, p. 281–298.
Kaplan, B. and Maxwell, J. A. 1994, 'Qualitative research methods for evaluating computer
information systems', Evaluating Health Care Information Systems: Methods and Applications,
(Eds, Anderson, J. G., Aydin, C. E. and Jay, S. J.), Sage, Thousand Oaks, p. 45-68.
Kaplan, R. and Norton, D. P. 2006, Alignment: using the balanced scorecard to create corporate
synergies, Harvard Business School Press, Boston.
Kartseva, V. 2008. Designing controls for network organization: a value-based approach. PhD Thesis
PhD thesis, Vrije Universiteit.
Keen, P. and Qureshi, S. 2006, Organizational transformation through business models: a framework
for business model design. Paper presented at the 39th Hawaii International Conference on
Systems Sciences, Kauai, Hawaii, 4-7 January 2006.
Kelly, A. 2003, Decision making using game theory: an introduction for managers Cambridge
University Press, New York.
Klein, H. and Myers, M. 1999, 'A set of principles for conducting and evaluating interpretive field
studies in information systems', MISQ Quarterly vol. 23, no. 1, p. 67-93.
Kock, N. F., Baker, M., McQueen, R. and Rouse, A. 1996, Topic negotiation in information systems
action research. Paper presented at the 1st Information Systems Conference of New Zealand,
Palmerston North , New Zealand, 30-31 October.
Kock, N. F. and Lau, F. 2001, 'Information systems action research: serving two demanding masters',
Information Technology and People, vol. 14, no. 1, p. 6-11.
Kock, N. F., McQueen, R. J. and Scott, J. L. 1997, 'Can action research be made more rigorous in a
positivist sense? The contribution of an iterative approach', Journal of Systems and Information
Technology, vol. 1, no. 1, p. 1 - 23.

References
323
Kort, C. and Gordijn, J. 2008, 'Modeling strategic partnerships using the e3value ontology: a field
study in the banking industry', Handbook of Ontologies for Business Interaction, (Ed, Rittgen,
P.), IGI Global, p. 310-325.
Kukla, A. 2000, Social constructivism and the philosophy of science, Routledge, London.
Laet, M. d. and Mol, A. 2000, 'The Zimbabwe bush pump: mechanics of a fluid technology', Social
Studies of Science, vol. 30, no. 2, p. 225-263.
Lambert, S. 2003 A review of the electronic commerce literature to determine the meaning of the term
‘business model’.
Lambert, S. 2006, A business model research schema. Paper presented at the 19th Bled eConference
on eValues, Bled, Slovenia, 5-7 June.
Lankhorst, M., et al., 2005, Enterprise architecture at work: modelling, communication and analysis,
Springer, Berlin.
Lassila, A. 2006, 'Taking a service-oriented perspective on software business: how to move from
product business to online service business', IADIS International Journal on WWW/Internet,
vol. 4, no. 1, p. 70-82.
Latour, B. 1986a, 'The powers of association', Power, Action and Belief. A new sociology of
knowledge? Sociological Review monograph (Ed, Law, J.), 32, Routledge & Kegan Paul,
London, p. 264-280.
Latour, B. 1986b, 'Visualization and cognition: thinking with eyes and hands', Knowledge and Society:
Studies in the Sociology of Culture vol. 6, p. 1-40.
Latour, B. 1987, Science in action: how to follow scientists and engineers through society, Open
University Press, Milton Keynes.
Latour, B. 1988a, The pasteurization of France, Harvard University Press, Cambridge.
Latour, B. 1988b, 'The Prince for Machine as well as Machinations', Technology and Social Process,
(Ed, Elliott, B.), Edinburgh University Press, Edinburgh, p. 20-43.
Latour, B. 1991, 'Technology is society made durable', A Sociology of Monsters? Essays on Power,
Technology and Domination, Sociological Review Monograph, (Ed, Law, J.), 38, Routledge,
London, p. 103-131.
Latour, B. 1992a, 'Where Are the Missing Masses? The Sociology of a Few Mundane Artifacts ',
Shaping Technology/Building Society: Studies in Sociotechnical Change, (Eds, Bijker, W. and
Law, J.), MIT Press, Cambridge Mass, p. 225-258.
Latour, B. 1992b, 'Where are the missing masses? The sociology of a few mundane artifacts', Shaping
Technology/Building Society: Studies in Sociotechnical Change, (Eds, Bijker, W. and Law, J.),
MIT Press, Cambridge, p. 225-258.
Latour, B. 1996a, Aramis, or the love of technology, Harvard University Press, Cambridge.
Latour, B. 1996b, 'On actor-network theory: a few clarifications', Soziale Welt, vol. 47, no. 4, p. 369-
381.
Latour, B. 1999a, 'On recalling ANT', Actor-Network Theory and After (Eds, Law, J. and Hassard, J.),
Blackwell Publishers, Oxford, p. 15-25.
Latour, B. 1999b, Pandora's hope: essays on the reality of science studies Harvard University Press,
Cambridge.
Latour, B. 2004, 'A dialog on Actor-Network Theory with a (somewhat) socratic professor', The Social
Study of Information and Communication Study, (Eds, Avgerou, C., Ciborra, C. and Land, F.),
Oxford University Press, Oxford, p. 62-76.

References
324
Latour, B. 2005, Reassembling the social: an introduction to Actor-Network Theory, Oxford
University Press, Oxford.
Latour, B. and Woolgar, S. 1979, Laboratory life: the social construction of scientific facts, Sage,
Beverly Hills.
Lau, F. 1999, 'Toward a framework for action research in information systems studies', Information
Technology& People, vol. 12, no. 2, p. pp. 148-176.
Laumer, S., Eckhardt, A. and Weitzel, T. 2008, Do as your competitors do? Analyzing competitors'
influence on the non-adoption of information systems in organizations. Paper presented at the
16th European Conference on Information Systems, Galway, Ireland, 9-11 June.
Law, J. 1986, 'On the methods of long distance control: vessels, navigation and the portuguese route
to india', Power, Action and Belief: a new Sociology of Knowledge? Sociological Review
Monograph, (Ed, Law, J.), 32, Routledge and Kegan Paul, London, p. 234-263.
Law, J. 1992, 'Notes on the Theory of the Actor-Network: ordering, strategy and heterogeneity',
Systems Practice vol. 5, no. 4, p. 379-393.
Law, J. 1999, 'After ANT: complexity, naming and topology', Actor-Network Theory and After (Eds,
Law, J. and Hassard, J.), Blackwell Publishers, Oxford, p. 1-14.
Law, J. 2004, After method: mess in social science research, Routledge, London.
Law, J. and Callon, M. 1988, 'Engineering and sociology in a military aircraft project: a network
analysis of technological change', Social Problems vol. 35, no. 3, p. 284-297.
Law, J. and Callon, M. 1992, 'The life and death of an aircraft: a network analysis of technical
change', Shaping technology / building society: studies in sociotechnical change, (Eds, Bijker,
W. E. and Law, J.), The MIT Press, Cambridge, p. 21-52.
Law, J. and Mol, A. 2003. Situating technoscience: an inquiry into spatialities [Online]. Centre for
Science Studies, Lancaster University. Available:
http://www.lancs.ac.uk/fass/sociology/papers/law-mol-situating-technoscience.pdf [Accessed
February 2011]
Law, J. and Singleton, V. 2005, 'Object lessons', Organization, vol. 12, no. 3, p. 331-355.
Lee, G. and Xia, W. 2005, 'The ability of information systems development project teams to respond
to business and technology changes: a study of flexibility measures', European Journal of
Information Systems, vol. 14, no. 1, p. 75-92.
Leech, N. and Onwuegbuzie, A. 2009, 'A typology of mixed methods research designs', Quality &
Quantity International Journal of Methodology vol. 43, no. 2, p. 265-275.
Leick, G. 2001, Mesopotamia: the invention of the city, Penguin Books, London.
Lewin, K. 1951, Field theory in social science Harper and Bros, New York.
Lewis, P. 2007, 'Using actor network theory ideas in the managing of systemic action research',
Systems Research and Behavioural Science, vol. 24, no. 6, p. 589-598.
Lewis, P. and Townson, C. 2004 Using actor network theory ideas in information systems research: a
case study of action research, Lancaster,
http://www.lums.lancs.ac.uk/publications/viewpdf/000270/.
Likert, R. 1932, A technique for the measurement of attitudes, Columbia University Press, New York.
Lincoln, Y. S. and Guba, E. G. 2000, 'Paradigmatic controversies, contradictions, and emerging
confluences', Handbook of Qualitative Research (Ed, Lincoln, N. D. A. Y.) 2nd ed, SAGE
Publications Inc, Thousand Oaks, p. 163-213.

References
325
Lindahl, M. 2005, 'The little engine that could: on the managing qualities of technology', Actor-
Network Theory and Organizing, (Ed, Hernes, B. C. A. T.), Liber and Copenhagen Business
School Press, Malmo, p. 50-66.
Linde, A., Linderoth, H. and Räisänen, C. 2003, An Actor Network Theory perspective on IT-projects:
a battle of wills. Paper presented at the Action in Language, Organizations and Information
Systems: An International Workshop on Scandiavian Business, Linköping, Sweden, 12-13
March.
Linder, J. and Cantrell, S. 2000 Changing business models: surveying the landscape.
Lyytinen, K. and Damsgaard, J. 2001, 'What's wrong with the diffusion of innovation theory',
Diffusing Software Products and Process Innovations, (Eds, Ardis, M. A. and Marolin, B. L.),
Proceeding IFIP TC8 WG8.6, Kluwer Academic Publisher, Boston, p. 173-190.
Lyytinen, K. and Ngwenyama, O. 1992, 'What does computer support for cooperative work mean?
Structurational analysis of computer supported cooperations work', Accounting Management
and Information Technology, vol. 2, no. 1, p. 19-38.
Macome, E. 2002. The dynamics of the development and use of ICT-based initiatives for
development: results of a field study. Phd, University of Pretoria.
Magreta, J. 2002, 'Why Business Models Matter', Harvard Business Review, vol. 80, no. 5, p. 86-92.
Magretta, J. 2002, 'Why business models matter', Harvard Business Review, vol. 80, no. 5, p. 86-92.
Mahadevan, B. 2000, 'Business models for Internet-based e-commerce: an anatomy', California
Management Review, vol. 42, no. 4, p. 55-69.
Mähring, M., Holmström, J., Keil, M. and Montealegre, R. 2004, 'Trojan actor-networks and swift
translation: Bringing actor-network theory to IT project escalation studies', Information
Technology & People, vol. 17, no. 2, p. 210-238.
Manier, E. 1980, 'Levels of reflexivity: unnoted differences within the 'Strong Programme' in the
sociology of knowledge', Biennial Meeting of the Philosophy of Science Association, (Eds,
Asquith, P. D. and Giere, R. N.), Philosophy of Science Association, East Lansing, p. 197-207.
Marks, E. and Bell, M. 2006, Service-oriented architecture: a planning and implementation guide for
business and technology, John Wiley & Sons, New Jersey.
Markus, M. L. and Lee, A. S. 1999, 'Special issue on intensive research in information systems: using
qualitative, interpretive, and case methods to study information technology – foreword', MIS
Quarterly, vol. 23, no. 1, p. 35–38.
Masys, A. 2010. Fratricide in air operations. Opening the black-box: revealing the 'social'. PhD
Thesis,Department of Criminology, University of Leicester.
McBride, N. 2003, 'Actor-network theory and the adoption of mobile communications', Geography,
vol. 88, no. 4, p. 266-276.
McGann, S. T. and Lyytinen, K. 2002, Capturing the dynamics of ebusiness models: the ebusiness
analysis framework and the electronic trading infrastructure. Paper presented at the 15th Bled
Electronic Commerce Conference, Bled, Slovenia, 17-19 June.
McKay, J. and Marshall, P. 2001, 'The dual imperatives of action research', Information Technology
and People, vol. 14, no. 1, p. 46-59.
McKay, J. and Marshall, P. 2007, 'Driven by two masters, serving both: the interplay of problem
solving and research in information systems action research projects', Information Systems
Action Research: An Applied View of Emerging Concepts and Methods, (Ed, Kock, N.),
Springer Science and Business Media, LLC, New York, p. 131-160.

References
326
McLeod, L., MacDonell, S. and Doolin, B. 2011, 'Qualitative research on software development: a
longitudinal case study methodology', Empirical Software Engineering, vol. 16, no. 4, p. 430-
459.
McMaster, T., Vidgen, R. and Wastell, D. 1997a, 'Technology transfer -- diffusion or translation?'
Facilitating technology transfer through partnership: Learning from practice and research, (Eds,
Mcmaster, T., Mumford, E., Swanson, E., Warboys, B. and Wastell, D.), Chapman and Hall,
London, p. 64-75.
McMaster, T., Vidgen, R. and Wastell, D. 1997b, Towards an understanding of technology in
transition. Two conflicting theories. Paper presented at the 20th Information systems research
seminar in Scandinavia - Social informatic, Oslo, Norway, 9-12 August.
McMaster, T., Vidgen, R. T. and Wastell, D. G. 1997c, Towards an understanding of technology in
transition. Two conflicting theories. Paper presented at the 20th Information Systems Research
in Scandinavia Hanko, Norway, 9-12 August.
Merton, R. 1973, The sociology of science, University of Chicago Press, Chicago.
Miller, A. and Dess, G. 1993, 'Assessing Porter's (1980) model in terms of its generalizability,
accuracy and simplicity', Journal of Management Studies, vol. 30, no. 4, p. 553-585.
Miller, E. and Rice, A. 1967, Systems of organization: task and sentiment systems and their boundary
control, Tavistock Publications, London.
Mingers, J. 2001a, 'Combining IS research methods: towards a pluralist methodology', Information
Systems Research, vol. 12, no. 3, p. 240-259.
Mingers, J. 2001b, Combining IS research methods: variety is (not) the spice of life Paper presented at
the 7th Americas Conference on Information Systems, Boston, Massachusetts, 3-5 August.
Monteiro, E. 2000, 'Actor-Network Theory and information infrastructure', From Control to Drift. The
Dynamics of Corportate Information Infrastructure, (Ed, Ciborra, C.), Oxford University Press,
Oxford, p. 71 - 83.
Monteiro, E. and Hanseth, O. 1996, 'Social shaping of information infrastructure: on being specific
about the technology', Information technology and changes in organisational work, (Ed, Wanda
Orlikowski, G. W., Matthew R. Jones, and Janice I. Degross), Chapman & Hall, London, p.
325 - 343.
Morgan, G. 1986, Images of organization, Sage Publications, London.
Morris, I. and Wood, S. 1991, 'Testing the survey method: continuity and change in British industrual
relations', Work Employment and Society, vol. 5, no. 2, p. 259-282.
Morris, M., Schindehutteb, M. and Allenc, J. 2005, 'The entrepreneur's business model: toward a
unified perspective ', Journal of Business Research, vol. 58, no. 6, p. 726-735.
Morse, J. 2003, 'Principles of mixed methods and multimethod research design', Handbook of Mixed
Methods in Social and Behavioral Research, (Eds, Tashakkori, A. and Teddie, C.), Sage,
Thousand Oaks, p. 189-208.
Mote, J., Jordan, G., Hage, J. and Whitestone, Y. 2007, 'New directions in the use of network analysis
in research and product development evaluation', Research Evaluation, vol. 16, no. 3, p. 191–
203.
Mumford, E. 1983, Designing human systems, Manchester Business School, Manchester.
Mumford, E. 2001, 'Action research: helping organizations to change', Qualitative Research in IS:
Issues and Trends, (Ed, Trauth, E.), Idea Group Publishing, Hershey, p. 46 - 77.
Mumford, E. and Sackman, H. (ed)^(eds), 1974, Human choice and computers, North-Holland,
Amsterdam.

References
327
Mumford, E. and Weir, M. 1979, Computer systems in work design - the ETHICS method Wiley, New
York.
Myers, M. 1997, 'Qualitative research in information systems', MIS Quarterly, vol. 21, no. 2, p. 241-
242.
Myers, M. D. and Klein, H. K. 2011, 'A set of principles for conducting critical research in
information systems', MIS Quarterly, vol. 35, no. 1, p. 17-36.
Myerson, R. 1997, Game Theory: analysis of conflict Harvard University Press, Cambridge.
N. Kock (Ed) 2006, Information Systems Action Research: An Applied View of Emerging Concepts
and Methods, Integrated Series in Information Systems Springer, New York.
Nagle, T. and Golden, W. 2007, The examination of a business model framework within the e-learning
industry. Paper presented at the 21st European Conference on Information systems, St Gallen,
Switzerland, 7-9 June.
Nahapiet, J. and Ghoshal, S. 1998, 'Social capital, intellectual capital, and the organizational
advantage', Academy of Management Review, vol. 23, no. 2, p. 242-266.
Naidoo, R. 2008. Towards a conceptual framework for understanding the implementation of Internet-
based self-service technology. PhD thesis,Faculty of Engineering, Built Environment and
Information Technology, University of Pretoria.
Nijland, M. 2004. Understanding the use of IT evaluation methods in organisations.Department of
Information Systems and the London School of Economics and Political Science, University of
London.
Normann, R. and Ramírez, R. 1993, ' From value chain to value constellation: designing interactive
strategy', Harvard Business Review, vol. 71, no. 4, p. 65-77.
OECD 2001 The new economy: beyond the hype, Paris.
Olesen, K. and Myers, M. 1999, 'Trying to improve communication and collaboration with
information technology: an action research project which failed', Information Technology and
People, vol. 12, no. 4, p. 317–332.
Orlikowski, W. and Robey, D. 1991, 'Information Technology and the Structuring of Organizations',
Information Systems Research, vol. 2, no. 2, p. 143-169.
Orlikowski, W. J. and Baroudi, J. J. 1991, 'Studying information technology in organizations: research
approaches and assumptions', Information Systems Research vol. 2, no. 1, p. 1-28.
Ortutay, B. 2012, 'Facebook's stock sinks, so who should buy it?' Associated Press, viewed Yahoo!
Inc.
Osborne, M. 2003, An Introduction to Game Theory, Oxford University Press, New York.
Osterwalder, A. 2004. The business model ontology - a proposition in a design science
approach.l'Ecole des Hautes Etudes Commerciales, Universite de Lausanne.
Osterwalder, A. and Pigneur, Y. 2002, An e-business model ontology for modeling e-business. Paper
presented at the 15th Bled Electronic Commerce Conference – eReality: Constructing the
eEconomy, Bled, Slovenia, 17-19 June.
Osterwalder, A. and Pigneur, Y. 2010, Business model generation: a handbook for visionaries, game
changers, and challengers, John Wiley & Sons, New York.
Osterwalder, A., Pigneur, Y. and Tucci, C. 2005, 'Clarifying business models: origins, present, and
future of the concept', Communications of the Association for Information Systems vol. 16, p. 1-
25.
Pace, L. and Argona, D. 1991, 'Participatory action research: a view from Xerox', Participatory
Action Research (Ed, Whyte, W.), Sage Publications, Inc, Newbury Park, p. 56-69.

References
328
Papakiriakopoulos, D. A., Poylumenakou, A. K. and Doukidis, G. J. 2001, Building e-business
models: an analytical framework and development guidlines. Paper presented at the 14th Bled
Electronic Commerce Conference, Bled, Slovenia, June 25-26.
Parolini, C. 1999, The Value Net – a tool for competitive strategy, John Wiley & Sons, Chichester.
Pateli, A. and Giaglis, G. 2003, A Framework for Understanding and Analyzing ebusiness models.
Paper presented at the 16th Bled eCommerce Conference, Bled, Slovenia, 9-11 June.
Pateli, A. and Giaglis, G. 2004, 'A research framework for analyzing eBusiness models', European
Journal of Information Sciences, vol. 13, no. 4, p. 302-314.
Peppard, J. and Rylander, A. 2006, 'From value chain to value network: insights for mobile operators',
European Management Journal, vol. 24, no. 2-3, p. 128-141.
Peszynski, K., Cooper, V. and Molla, A. 2008, Developing a knowledge management strategy:
Reflections from an action research project. Paper presented at the 16th European Conference
on Information Systems Galway, Ireland, June 9 -11.
Petrovic, O., Kittl, C. and Teksten, R. 2001, Developing business models for eBusiness Paper
presented at the International Conference on Electronic Commerce Vienna, Austria, 31 October
- 4 November.
Phillips, N., Lawrence, T. and Hardy, C. 2000, 'Inter-organizational collaboration and the dynamics of
institutional fields', Journal of Management Studies, vol. 37, no. 1, p. 23-43.
Pickering, A. 1992, 'From science as knowledge to science as practice', Science as practice and
culture, (Ed, Pickering, A.), University of Chicago Press, Chicago, p. 1-26.
Pinch, T. and Bijker, W. 1984, 'The social construction of facts and artefacts: or how the sociology of
science and the sociology of technology might benefit each other', Social Studies of Science vol.
14, no. 3, p. 399-441.
Platt, J. 1992, '‘Case study’ in American methodological thought', Current Sociology, vol. 1, no. 40, p.
17-48.
Popper, K. 1968, The logic of scientific discovery, Harper Torchbooks, New York.
Porter, M. 1985, Competitive advantage: creating and sustaining superior performance, Free Press,
New York.
Porter, M. 1996, 'What is strategy?' Harvard Business Review, vol. November-December, p. 61 –78.
Pouloudi, A. and Whitley, E. 1997, 'Stakeholder identification in inter organisational systems: gaining
insights for drug use management systems', European Journal of Information Systems, vol. 6,
no. 1, p. 1-14.
Pouloudi, A., Ziouvelou, X. and Vassilopoulou, K. 2003, 'A societral perspective on e-business
adoption', Journal of Information, Communication and Ethics in Society, vol. 1, no. 3, p. 149 -
166.
Prahalad, C. K. and Ramaswamy, V. 2004, The future of competition: co-creating unique value with
customers, Harvard Business School Press, Boston.
Putnam, R. 2000, Bowling alone: the collapse and revival of american community, Simon & Schuster,
New York.
Rapoport, R. 1970, 'Three dilemmas in action research', Human Relations, vol. 23, no. 6, p. 499-513.
Rappa, M. 2000. Business models on the web: managing the digital enterprise [Online]. Available:
http://digitalenterprise.org/index.html [Accessed September 2009]
Rayport, J. F. 1999, 'The truth about Internet business models', Strategy & Business, vol. Third
Quarter no. 16, p. 5–7.
Rayport, J. F. and Jaworski, B. J. 2004, Introduction to e-commerce, McGraw Hill, New York.
References
329
Recuero, R. C. 2004, Teoria das redes e redes sociais na internet: Considerações sobre o Orkut, os
Weblogs e os Fotologs. Paper presented at the XXVII Intercom Porto Alegre, Brasil.
Reuver, M. d., Bouwman, H. and Haaker, T. 2008, Capturing value from mobile business models:
design issues that matter. Paper presented at the 21st Bled eConference "eCollaboration:
Overcoming Boundaries Through Multi-Channel Interaction" Bled, Slovenia.
Robey, D. 1996, 'Diversity in information systems research: threat, promise, and responsibility',
Information Systems Research, vol. 7, no. 4, p. 400-408.
Rodon, J. 2007. Exploring Standardization and Integration in the Implementation of Industry Inter-
Organizational Information Systems:A Case Study in the Seaport of Barcelona. PhD
Thesis,Information Systems Department, Universitat Ramón Llull.
Rodon, J., Pastor, J., Sesé, F. and Christiaanse, E. 2008, 'Unravelling the dynamics of IOIS
implementation: an actor-network study of an IOIS in the seaport of Barcelona', Journal of
Information Technology, vol. 23, no. 2, p. 97-108.
Rogers, J., Bozeman, B. and Chompalov, I. 2001, 'Obstacles and opportunities in the application of
network analysis to the evaluation of R&D', Research Policy, vol. 10, no. 3, p. 161-172.
Roggema, J. and Smith, M. 1983, 'Organizational Change in the Shipping Industry: Issues in the
Transformation of Basic Assumptions', Human Relations, vol. 36 no. 8 p. 765-790.
Rolland, K. H. and Aanestad, M. 2003, The techno-political dynamics of information infrastructure
development: interpreting two cases of puzzling evidence. Paper presented at the 26th
Information Systems Research Seminar in Scandinavia (IRIS) Porvoo, Finland, August 9-12.
Rose, J. and Scheepers, R. 2001, Structuration Theory and Information System Development -
Frameworks for practice. Paper presented at the 9th European Conference on Information
Systems, Bled, Slovenia, 27-29 June.
Runeson, P. and Höst, M. 2009, 'Guidelines for conducting and reporting case study research in
software engineering', Empirical Software Engineering, vol. 14, no. 2, p. 131–164.
Saunders, M., Lewis, P. and Thornhill, A. 2009, Research methods for business students (5th ed),
Financial Times Prentice Hall, Harlow.
Scherer, A. G. 2003, 'Modes of explanation in organization theory', The Oxford Handbook of
Organizational Theory, (Eds, Tsoukas, H. and Knudsen, C.), Oxford University Press, Oxford,
p. 310-344.
Schmidt, R., Lyytinen, K., Keil, M. and Cule, P. 2001, 'Identifying software project risks: an
international Delphi study', Journal of Management Information Systems, vol. 17, no. 4, p. 5-36.
Schultze, U. and Orlikowski, W. J. 2004, 'A practice perspective on technology-mediated network
relations: the use of Internet-based self-serve technologies', Information Systems Research, vol.
15, no. 1, p. 87–106.
Schumpeter, J. 1942, Capitalism, socialism and democracy, Harper, New York.
Schumpeter, J. A. 1934, The theory of economic development: an inquiry into profits, capital, interest,
and the business cycle, Harvard University Press, Cambridge.
Scott, S. V. and Wagner, E. L. 2003, 'Networks, negotiations and new times: the implementation of
enterprise resource planning into an academic administration', Information and Organization,
vol. 13, no. 4, p. 285-313.
Seddon, P., Lewis, G., Freeman, P. and Shanks, G. 2004, 'Business models and their relationship to
strategy', Value Creation from E-Business Models, (Ed, Currie, W.), Butterworth-Heinemann,
Oxford, p. 11-34.
Shafer, S., Smith, H. and Linder, J. 2005, 'The power of business models', Business Horizons, vol. 48,
no. 3, p. 199-207.

References
330
Shah, H., Eardley, A. and Wood-Harper, T. 2007, 'ALTAR: achieving learning through action
research', European Journal of Information Systems, vol. 6, no. 16, p. 761–770.
Shama, A. 2001, 'Dot-coms Coma', The journal of Systems and Software, vol. 56, no. 1, p. 101-104.
Shimizu, T., Carvalho, M. and Laurindo, F. 2006, 'Concepts and history of strategy in organizations',
Strategic Alignment Process and Decision Support Systems - Theory and Case Studies, Idea
Group Inc., Hershey, p. 1-31.
Shlian, D. 2009, 'Can Chinese herbs treat swine flu?' examiner.com, viewed 2010, Clarity Digital
Group.
Simon, S. 2000, 'The reorganization of the information systems of the US naval construction',
European Journal of Information Systems, vol. 9, no. 3, p. 148-162.
Somerville, I. 1997, Actor network theory: a useful paradigm for the analysis of the UK cable/on-line
socio-technical ensemble? Paper presented at the 3rd Americas Conference on Information
Systems, Indianapolis, Indiana, 15-17 August.
Stabell, C. B. and Fjeldstad, Ø. D. 1998, 'Configuring value for competitive advantage: on chains,
shops, and networks', Strategic Management Journal, vol. 19, no. 5, p. 413-437.
Stähler, P. 2002. Business models as a unit of analysis for strategizing [Online]. Lausanne,
Switzerland. Available: http://www.business-model-innovation.com/english/definitions.html
Stanoevska-Slabeva, K. and Hoegg, R. 2005, Towards guidelines for design of mobile services. Paper
presented at the 13th European Conference on Information Systems, Regensburg, Germany,
May 26-28.
Strauss, A. L. and Corbin, J. 1998, Basics of qualitative research : techniques and procedures for
developing grounded theory (2nd ed), Sage Publications, Thousand Oaks.
Suchman, L. 1987, Plans and situated actions : the problem of human-machine communication,
Cambridge University Press, New York.
Susman, G. and Evered, R. 1978, 'An assessment of the scientific merits of action research',
Administrative Science Quarterly, vol. 23, no. 4, p. 582-603.
Svendsen, A. and Laberge, M. 2005, 'Convening Stakeholder Network', Journal of Corporate
Citizenship, vol. Fall2005, no. 19, p. 91-104.
Tapscott, D., Ticoll, D. and Lowy, A. 2000, Digital capital: harnessing the power of business webs
Harvard Business School Press, Boston.
Tatnall, A. and Burgess, S. 2002, Using Actor-Network Theory to research the implementation of a B-
B portal for regional SMEs in Melbourne, Australia. Paper presented at the 15th Bled Electronic
Commerce Conference, Bled, Slovenia, 17-19 June.
Tatnall, A. and Davey, B. 2001, How visual basic entered the curriculum at an australian university:
an account informed by innovation translation. Paper presented at the Challenges to Informing
Clients: A Transdisciplinary Approach, Krakow, Poland.
Tatnall, A. and Gilding, A. 1999, Actor-Network Theory and information systems research. Paper
presented at the 10th Australasian Conference on Information Systems, Wellington, New
Zealand, 1-3 December.
Tilson, D. and Lyytinen, K. 2005, 'Making broadband wireless services: an Actor-Network study of
the US wireless industry standard adoption', Sprouts: Working Papers on Information
Environments, Systems and Organizations, vol. 5, no. 3, p. 137-154.
Timmers, P. 1998, 'Business models for electronic markets', Electronic Markets, vol. 8, no. 2, p. 3-8.
Toennesen, C., Molloy, E. and Jacobs, C. D. 2006, Lost in translation: Actor- Network Theory in
organization studies. Paper presented at the 22nd European Group of Organizational Studies
Colloquium, Bergen, Norway, 6-8 July.

References
331
Trifonas, P. P. 2009, 'Deconstructing research: paradigms lost', International Journal of Research and
Method in Education, vol. 32, no. 3, p. 297-308.
Trist, E. 1976, 'Engaging with large-scale systems', Experimenting with Organizational Life: The
Action Research Approach, (Ed, Clark, A.), Plenum Press, New York, p. 43-75.
Tuckman, B. W. 1972, Conducting educational research, Harcourt Brace Javanovich, New York.
Turban, E., King, D., Lee, J., Warkentin, M. and Chung, H. 2002, Electronic commerce 2002 – A
managerial perspective (2nd ed), Prentice Hall, Upper Saddle River, New Jersey.
Uden, L. and Francis, J. 2009 In International Journal of Actor-Network Theory and Technological
Innovation, Vol. 1 IGI Global, p. 23-44.
Underwood, J. 1998, Not another methodology: What ant tells us about systems development. Paper
presented at the 6th International Conference on Information Systems Methodologies, Salford,
UK, 3-4 September.
Vanhaverbeke, W. and Cloodt, M. 2006, 'Open innovation in value networks', Open Innovation:
Researching a New Paradigm, (Eds, Chesbrough, H. W., Vanhaverbeke, W. and West, J.),
Oxford University Press, Oxford, p. 258-281.
Vickers, M. 2000, 'Models from mars', Business Week, vol. 4, no. September, p. 58-59.
Vos, H. D. and Haaker, T. 2008, 'The STOF method', Mobile Service Innovation and Business Models,
(Eds, Bouwman, H., Vos, H. D. and Haaker, T.), Springer-Verlag, Berlin Heidelberg, p. 115-
136.
Vries, E. d. 2007, 'Rigorously relevant action research in information systems ', Sprouts: Working
Papers on Information Systems, vol. 7, no. 4.
Vuorela, T. 2005, 'Laughing matters: a case study of humor in multicultural business negotiations ',
Negotiation Journal, vol. 21, no. 1, p. 105-130.
Walsham, G. 1993, Interpreting information systems in organizations, Wiley, Chichester.
Walsham, G. 1995a, 'The emergence of interpretivism in IS research', Information Systems Research,
vol. 6, no. 4, p. 376–394.
Walsham, G. 1995b, 'Interpretive case studies in IS research: Nature and Method', European Journal
of Information Systems vol. 4, no. 2, p. 74-81.
Walsham, G. 2001, Making a world of difference: IT in a global context, John Wiley &Sons, New
York.
Walsham, G. 2006, 'Doing interpretive research', European Journal of Information Systems, vol. 15,
no. 3, p. 320–330.
Walsham, G. and Sahay, S. 1999, 'GIS for district-level administration in India: problems and
opportunities ', MIS Quarterly, vol. 23, no. 1, p. 39-65.
Wasserman, S. and Faust, K. 2008, Social Networks Analysis: methods and applications, Cambridge
University Press, New York.
Weill, P., Malone, T. W., D’Urso, V. T., Herman, G. and Woerner, S. 2005 Do some business models
perform better than others? A study of the 1000 largest US firms.
Weill, P. and Vitale, M. R. 2001, Place to space: migrating to e-business models, Harvard Business
School Press, Boston.
Wieringa, R. J., Gordijn, J. and Eck, P. A. T. v. 2005, 'Value-based business-IT alignment in
networked constellations of enterprises', 1st International Workshop on Requirements
Engineering for Business Need and IT Alignment (REBNITA 2005), (Eds, Cox, K., Dubois, E.,
Pigneur, Y., Bleistein, S. J., Verner, J., Davis, A. M. and Wieringa, R. J.), University of New
South Wales Press, Paris, p. 38-43.
References
332
Willcocks, L. P. 2004, 'Foucault, power/knowledge and information systems: reconstructing the
present', Social Theory and Philosophy for Information Systems, (Ed, Willcocks, J. M. A. L.
P.), John Wiley & Sons, Ltd, Chichester, p. 238-296.
Williams-Jones, B. and Graham, J. E. 2003, 'Actor-network theory: a tool to support ethical analysis of
commercial genetic testing', New Genetics and Society, vol. 22, no. 3, p. 271-296.
Williamson, O. 1975, Markets and hierarchies, analysis and antitrust Implications: a study in the
economics of international organization, Free Press, New York.
Winner, L. 1986, 'Do artifacts have politics?' In The Whale and the Reactor: A Search for Limits in an
Age of High Technology, University of Chicago Press, Chicago, p. 19-39.
Winter, R. 1996, 'Some principles and procedures for the conduct of action research', New Directions
in Action Research, (Ed, Zuber-Skerritt, O.), Falmer Press, London, p. 13-27.
Wood-Harper, A. T. 1985, 'Research methods in information systems: using action research',
Research Methods in Information Systems, (Eds, Mumford, E., Hirschheim, R., Fitzgerald, G.
and Wood-Harper, T.), North-Holland Publishing Co, Amsterdam, p. 169-191.
Wood-Harper, A. T., Antill, L. and Avison, D. E. 1985, Information systems definition: the Multiview
approach, Blackwell Scientific Publications, Ltd. , Oxford.
Wood, G. 2000, 'Do we need new economics for the new economy?' Bank Accounting & Finance, vol.
14, no. 1, p. 76-80.
Woolgar, S. 1988, Science, the very idea, Tavistock Publications, London.
Woolgar, S. 1991, 'The turn to technology in social studies of science ', Science, Technology & Human
Values vol. 16, no. 1, p. 20-50.
Yahoo! Finance. 2012. Available: http://finance.yahoo.com/q?s=AMZN.MX&ql=0 [Accessed April
2012]
Yin, R. 1984, Case study research: design and methods, Sage Publishing, Beverly Hills.
Yin, R. 1993, Applications of case study research, Sage Publishing, Thousand Oaks.
Yin, R. 1994, Case study research: design and methods (2nd ed), Sage Publications, Thousand Oaks.
Yin, R. 2003, Case study research, design and methods, Sage Publications, Newbury Park.
Yin, R. 2009, Case study research: design and methods (4th ed), Sage Publications Thousand Oaks.
Zachman, J. 1987, 'A framework for information systems architecture ', IBM Systems Journal, vol. 26,
no. 3, p. 276-292.
Zott, C., Amit, R. and Massa, L. 2011, 'The business model: recent developments and future research',
Journal of Management vol. 37, no. 4, p. 1019-1042

333
APPENDIX A

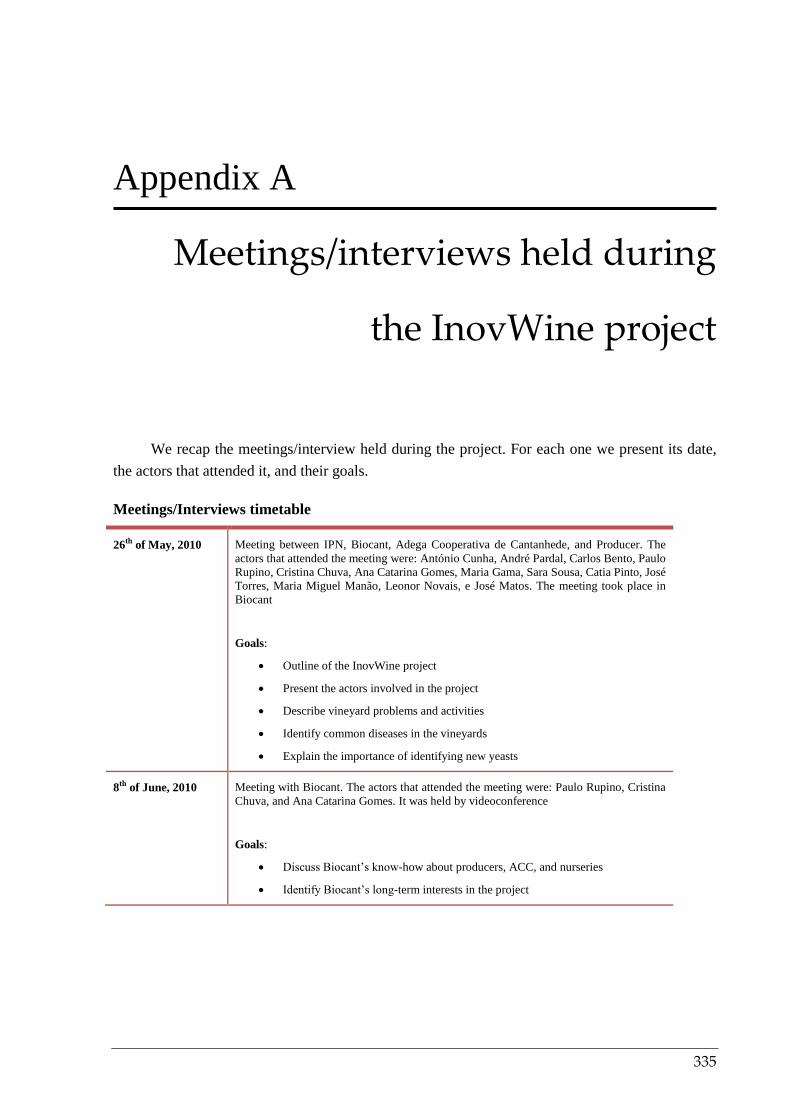
335
Appendix A
Meetings/interviews held during
the InovWine project
We recap the meetings/interview held during the project. For each one we present its date,
the actors that attended it, and their goals.
Meetings/Interviews timetable
26th of May, 2010 Meeting between IPN, Biocant, Adega Cooperativa de Cantanhede, and Producer. The
actors that attended the meeting were: António Cunha, André Pardal, Carlos Bento, Paulo
Rupino, Cristina Chuva, Ana Catarina Gomes, Maria Gama, Sara Sousa, Catia Pinto, José
Torres, Maria Miguel Manão, Leonor Novais, e José Matos. The meeting took place in
Biocant
Goals:
Outline of the InovWine project
Present the actors involved in the project
Describe vineyard problems and activities
Identify common diseases in the vineyards
Explain the importance of identifying new yeasts
8th of June, 2010 Meeting with Biocant. The actors that attended the meeting were: Paulo Rupino, Cristina
Chuva, and Ana Catarina Gomes. It was held by videoconference
Goals:
Discuss Biocant’s know-how about producers, ACC, and nurseries
Identify Biocant’s long-term interests in the project

Appendix A – Meetings/interviews held during the InovWine project
336
Meetings/Interviews timetable
17th of June, 2010 Meeting with LAS. The actors that attended the meeting were: António Cunha, André
Pardal, Paulo Rupino, and Cristina Chuva. The meeting took place in IPN.
Goals:
Identify the wireless sensor network requirements to discuss with the remaining
actors of the project
Understand the cost involved in deploying wireless sensor network and RFIDs
Identify the relevant abiotic data for the project
Perceive the long-term interest for LAS
2nd of July, 2010
Meeting with ACC and producers. The actors that attended the meeting were: André
Pardal, Cristina Chuva, José Torres, Vitor Damião, Maria Miguel Manão, Leonor Novais,
Ricardo Botelheiro, and Rosa Silva. The meeting took place in ACC
Goals:
Understand the cooperative strategy in order to take advantage of the project
Perceive how the grapes are treated in the cooperative: reception process,
grapes payment, wine production
Identify topics that characterize a quality wine
Spot conditions that can lead to the wine quality improvement
Indentify the most important abiotic data for the vineyard treatment
Perceive how the electronic devices must be arranged in the vineyards
Identify the information provided by the cooperative to the producers to assist
in the vineyard treatment
Analyse the current grapevine certification process and its limitations
13th of September,
2010
Meeting with Viveiro Vitivinícola Pierre Boyer. The actors that attended the meeting
were: André Pardal, Cristina Chuva, e Cláudia Miguel. The meeting took place in IPN
Goals:
Clarify the activities carried out by the nurserymen
Understand the grapevines certification process
Identify possible problems on the insertion of RFIDs in the grapevines
Set the proper timetable to implant the RFIDs in the grapevines and identify the
best way to introduce them (several test must be performed to assure the plant,
and the material, safety)
24th of September,
2010
Meeting with ACC. João Vitorino, Paulo Rupino, Cristina Chuva attended the meeting
that took place in ACC
Goals:
Perceive how the grapes are delivered at ACC
Observe the various stages of ACC wine production
Understand how the value to pay for the grapes is assigned
Comprehend how the DOC designation is assigned to the cooperative wines
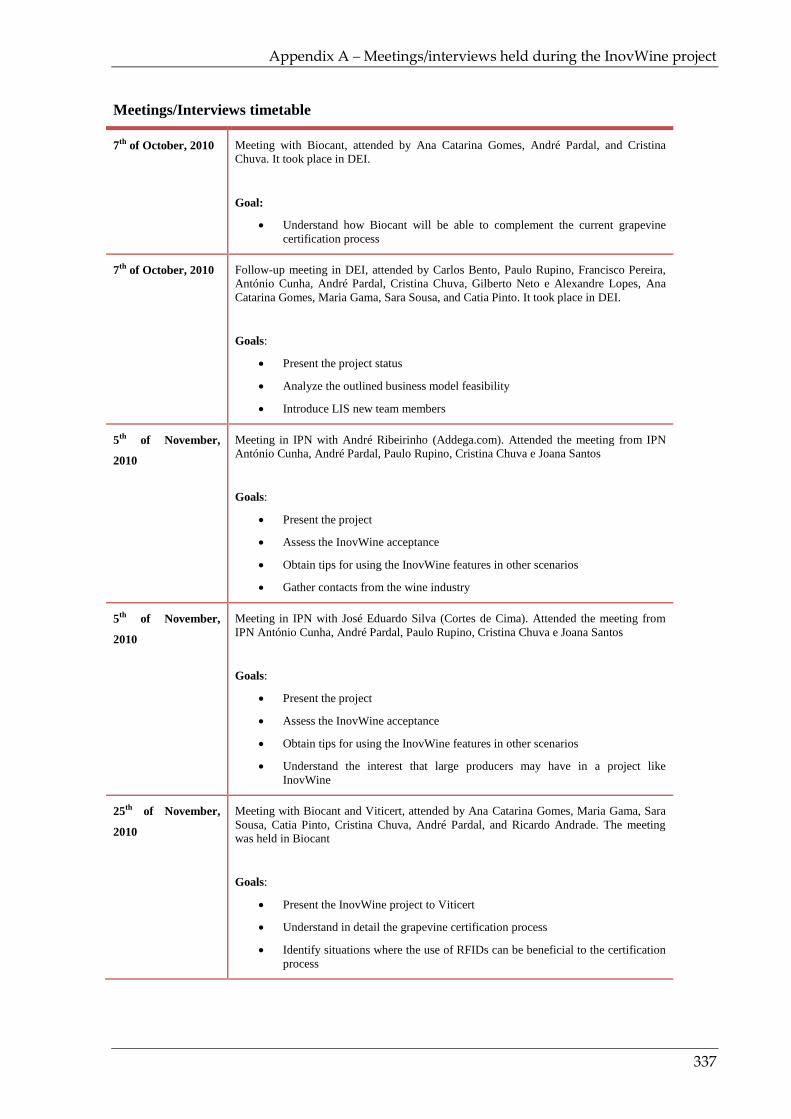
Appendix A – Meetings/interviews held during the InovWine project
337
Meetings/Interviews timetable
7th of October, 2010 Meeting with Biocant, attended by Ana Catarina Gomes, André Pardal, and Cristina
Chuva. It took place in DEI.
Goal:
Understand how Biocant will be able to complement the current grapevine
certification process
7th of October, 2010 Follow-up meeting in DEI, attended by Carlos Bento, Paulo Rupino, Francisco Pereira,
António Cunha, André Pardal, Cristina Chuva, Gilberto Neto e Alexandre Lopes, Ana
Catarina Gomes, Maria Gama, Sara Sousa, and Catia Pinto. It took place in DEI.
Goals:
Present the project status
Analyze the outlined business model feasibility
Introduce LIS new team members
5th of November,
2010
Meeting in IPN with André Ribeirinho (Addega.com). Attended the meeting from IPN
António Cunha, André Pardal, Paulo Rupino, Cristina Chuva e Joana Santos
Goals:
Present the project
Assess the InovWine acceptance
Obtain tips for using the InovWine features in other scenarios
Gather contacts from the wine industry
5th of November,
2010
Meeting in IPN with José Eduardo Silva (Cortes de Cima). Attended the meeting from
IPN António Cunha, André Pardal, Paulo Rupino, Cristina Chuva e Joana Santos
Goals:
Present the project
Assess the InovWine acceptance
Obtain tips for using the InovWine features in other scenarios
Understand the interest that large producers may have in a project like
InovWine
25th of November,
2010
Meeting with Biocant and Viticert, attended by Ana Catarina Gomes, Maria Gama, Sara
Sousa, Catia Pinto, Cristina Chuva, André Pardal, and Ricardo Andrade. The meeting
was held in Biocant
Goals:
Present the InovWine project to Viticert
Understand in detail the grapevine certification process
Identify situations where the use of RFIDs can be beneficial to the certification
process

Appendix A – Meetings/interviews held during the InovWine project
338
Meetings/Interviews timetable
15th of December,
2010
Meeting with Biocant and Viticert, attended by Ana Catarina Gomes, Maria Gama,
Cristina Chuva, André Pardal, Ricardo Andrade, e Cláudia Miguel. The meeting was held
in Viticert head-office
Goals:
Identify different ways to insert RFIDs in the grapevines
Set the date to perform the tests
15th of December,
2010
Meeting with Biocant Viticert, and Estação Vitivinícola Nacional, attended by Ana
Catarina Gomes, Maria Gama, Cristina Chuva, André Pardal, Ricardo Andrade, and
Eiras-Dias. It took place in Estação Vitivinícola Nacional
Goals:
Present the InovWine project to Estação Vitivinícola Nacional
Assess the Estação Vitivinícola Nacional interest in taking part in a project like
InovWine
21st of December,
2010
Follow-up meeting in DEI, attended by António Cunha, André Pardal, João Lucas, Carlos
Bento, Paulo Rupino, Cristina Chuva, Ana Catarina Gomes, Maria Gama, Sara Sousa,
Catia Pinto, Maria Miguel Manão, Leonor Novais, Ricardo Botelheiro, Vitor Damião, e
José Matos. The meeting was held in Biocant.
Goals:
Present the project status
Discuss the results expected for the year 2011
Schedule future activities
Schedule the next meetings
10th of January,
2011
Meeting in IPN, attended by Carlos Bento, Paulo Rupino, and Cristina Chuva
Goals:
Clarify the rights of access to data after the project is over
Perceive the project intellectual property rights
19th of January,
2011
Meeting with Biocant, IPN, and Estação Vitivinícola Nacional. It was attended by Ana
Catarina Gomes, Eiras-Dias, Margarida Santos, José Silvestre, Clímaco Pereira, Eugénia,
Cristina Chuva, André Pardal, and Hugo Neto. It was held in Biocant.
Goals:
Obtain access to the national collection of grapevines
Access to data from the meteorological station of Dois Portos
Discuss biotic and abiotic data that could be relevant to the InovWine project
Perceive how Estação Vitivinícola Nacional could contribute to the InovWine
project
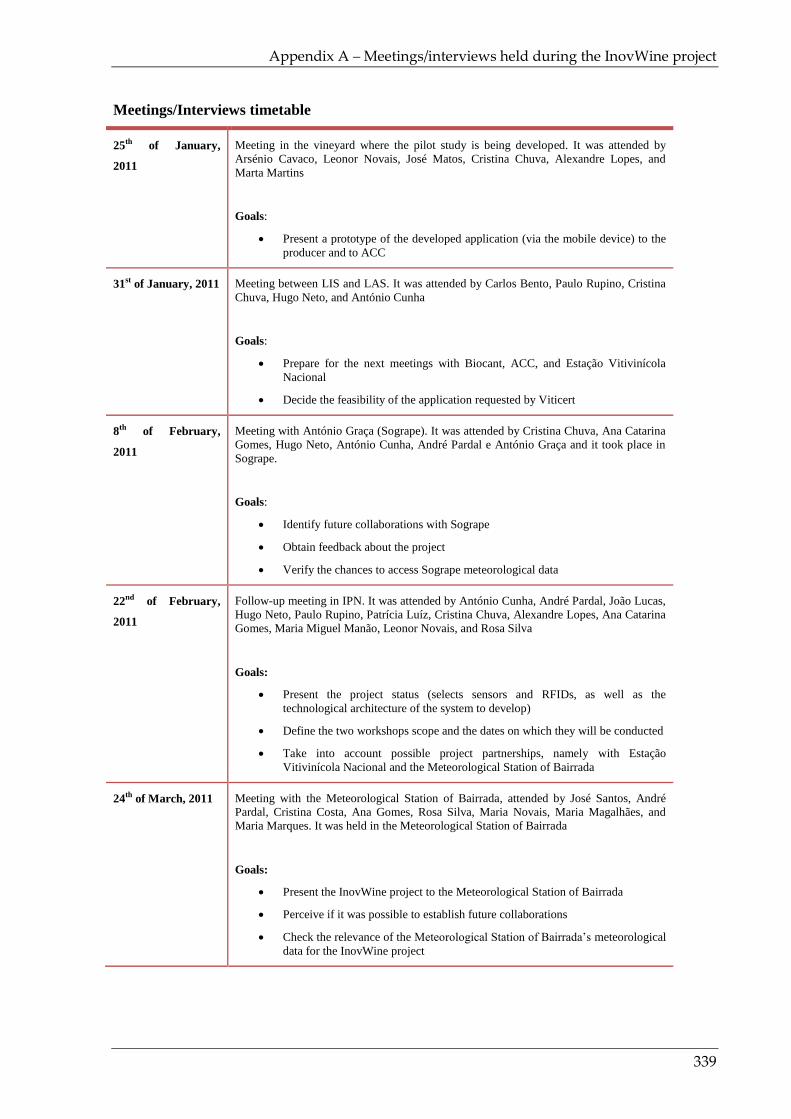
Appendix A – Meetings/interviews held during the InovWine project
339
Meetings/Interviews timetable
25th of January,
2011
Meeting in the vineyard where the pilot study is being developed. It was attended by
Arsénio Cavaco, Leonor Novais, José Matos, Cristina Chuva, Alexandre Lopes, and
Marta Martins
Goals:
Present a prototype of the developed application (via the mobile device) to the
producer and to ACC
31st of January, 2011 Meeting between LIS and LAS. It was attended by Carlos Bento, Paulo Rupino, Cristina
Chuva, Hugo Neto, and António Cunha
Goals:
Prepare for the next meetings with Biocant, ACC, and Estação Vitivinícola
Nacional
Decide the feasibility of the application requested by Viticert
8th of February,
2011
Meeting with António Graça (Sogrape). It was attended by Cristina Chuva, Ana Catarina
Gomes, Hugo Neto, António Cunha, André Pardal e António Graça and it took place in
Sogrape.
Goals:
Identify future collaborations with Sogrape
Obtain feedback about the project
Verify the chances to access Sogrape meteorological data
22nd of February,
2011
Follow-up meeting in IPN. It was attended by António Cunha, André Pardal, João Lucas,
Hugo Neto, Paulo Rupino, Patrícia Luíz, Cristina Chuva, Alexandre Lopes, Ana Catarina
Gomes, Maria Miguel Manão, Leonor Novais, and Rosa Silva
Goals:
Present the project status (selects sensors and RFIDs, as well as the
technological architecture of the system to develop)
Define the two workshops scope and the dates on which they will be conducted
Take into account possible project partnerships, namely with Estação
Vitivinícola Nacional and the Meteorological Station of Bairrada
24th of March, 2011 Meeting with the Meteorological Station of Bairrada, attended by José Santos, André
Pardal, Cristina Costa, Ana Gomes, Rosa Silva, Maria Novais, Maria Magalhães, and
Maria Marques. It was held in the Meteorological Station of Bairrada
Goals:
Present the InovWine project to the Meteorological Station of Bairrada
Perceive if it was possible to establish future collaborations
Check the relevance of the Meteorological Station of Bairrada’s meteorological
data for the InovWine project

Appendix A – Meetings/interviews held during the InovWine project
340
Meetings/Interviews timetable
20th of April, 2011 Meeting with the development team in IPN. It was attended by Cristina Chuva, Paulo
Rupino, Carlos Lopes, Alexandre Lopes, and Bruno Almeida
Goals:
Clarify any doubts that the development team had with business model
document analysis
Perceive if the document was able to respond to the needs of the development
team
Receive feedback about the document
28th of April, 2011 Meeting with Carlos Bento, Paulo Rupino, António Cunha, André Pardal, and Cristina
Chuva. It took place in IPN
Goals:
Obtain meteorological data
Establish procedures to install equipment in the vineyards and collect data
Define how the data will be transmitted to the database by the wireless network
30th of June, 2011 Follow-up meeting in Biocant. It was attended by André Pardal, João Lucas, Cristina
Chuva, Carlos Lopes, Bruno Almeida, Ana Catarina Gomes, Maria Miguel Manão,
Leonor Novais, and Rosa Silva
Goals:
Present the project status
Organize the workshops
Schedule meetings to discuss the inquiry
4th of July, 2011 Meeting in the vineyard where the pilot study is being developed. It was attended by
Leonor Novais, José Matos, Cristina Chuva, Alexandre Lopes, Carlos Lopes, and Marta
Martins
Goals:
Present a prototype of the developed application (via the mobile device) to the
producer and to ACC
Discuss the inquiry to validate the viability of the business model
6th of July, 2011 Meeting in Biocant, with Ana Catarina Gomes
Goals:
Discuss the inquiry to validate the viability of the business model
21st of July, 2011 Meeting in ACC, with Maria Miguel Manão
Goals:
Discuss the inquiry to validate the viability of the business model