blackrock (2014) core values in us real estate
DESCRIPTION
real estate blackrock investments valuationTRANSCRIPT

CORE VALUES IN US REAL ESTATE Accessing Opportunities in a Divergent Cycle
As in many other asset classes, valuations in US core commercial real estate have been affected by years of ultra-low interest rates. Strong inflows have generated some eye-catching sale prices on trophy properties and pushed cap rates close to their 2008 lows.1 Investors looking to real estate for its traditional benefits of income, diversification and growth naturally wonder whether financial conditions have eclipsed fundamentals and taken the core market from underappreciated to overvalued in just a few years.
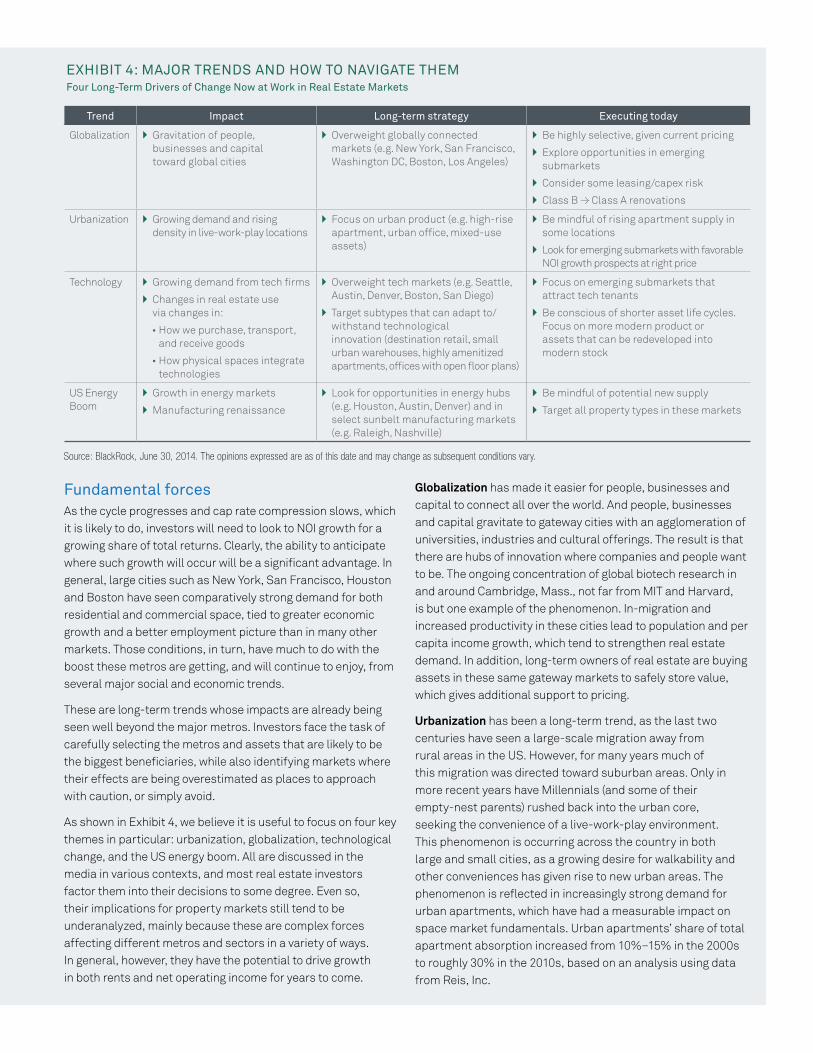
In fact, the picture is more complex, and richer in opportunities, than a quick summary suggests. For one thing, while cap rates in gateway cities like San Francisco and New York are at or near record lows, in second-tier metros such as Denver and Austin they have not returned to prerecession levels. Even in gateway cities, valuations in prime locations may vary greatly from those in up-and-coming areas. In most markets and sectors, moreover, rents and net operating income (NOI) are likely to rise, as an expanding economy strengthens demand while new supply remains scarce.
A historical comparison of cap rates to yields on other assets adds further perspective. At the end of the first quarter, the spread between cap rates and Treasury yields was close to its 20-year average of 270 basis points, and nearly 220 basis points above its mid-2007 low. (See Exhibit 1.) The spread between cap rates and Baa corporate bond yields, meanwhile, was somewhat wider than the 20-year average, and the spread above high yield bonds was close to a 20-year high. Given these spreads—and the fact that real estate has historically performed well during times of rising interest rates and economic growth2—we believe that prices can withstand the normalization of interest rates now under way.
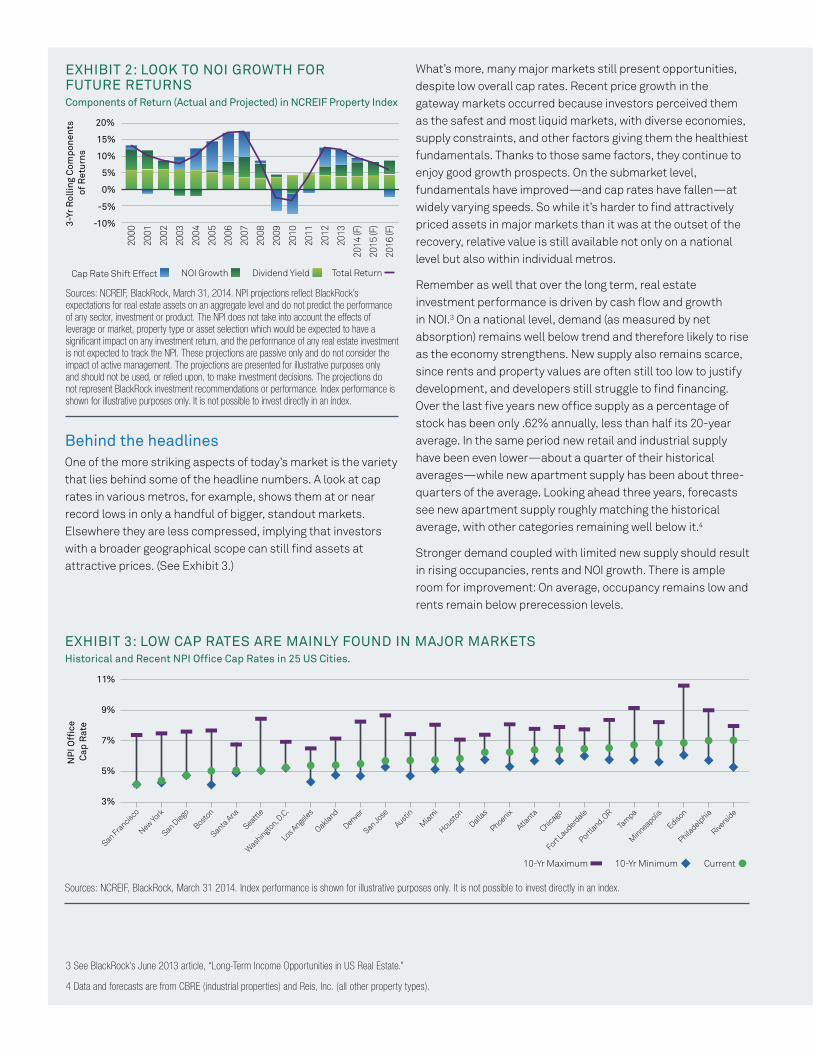
As the benefit from cap rate compression plays out, we expect NOI growth to drive unlevered returns in the 6% to 7% range over the next three years—attractive relative returns in the current environment. Furthermore, we believe investors attuned to the forces at work both during this cycle and over the long term can still find properties capable of providing even stronger returns. Locating them is a matter of, first, considering a broader set of metros, submarkets and assets to seek out relative value. Second, it means increasing the focus on a given investment’s potential for growth in net operating income. (See Exhibit 2.) Finally, it means anticipating how key long-term social and economic trends—notably urbanization, globalization, technological change, and the US energy boom—may affect both cap rates and NOI growth prospects in different markets, submarkets and property types.
Steven Cornet Head of US Research and Strategy for BlackRock Real Estate
1 As of 3/31/14 the NCREIF appraisal cap rate was 5.39%, not far from its 2008 low of 5.15%.
2 In three of the last four periods of sustained rising interest rates, total returns were at or above the long term average and cap rates declined, NCREIF data show. The periods were 1Q88-1Q89, 3Q93-4Q94, 3Q98-2Q00 and 1Q04-3Q06. In the 3Q93-4Q94 period, total returns were below average but still positive, and cap rates were flat.
Sources: NCREIF, Bloomberg, Barclays, March 31, 2014. Cap rate is the NCREIF appraisal cap rate. Baa corp bond yield is that of the Barclays Capital U.S. Credit Baa Index. HY corp bond yield is that of the Barclays Capital U.S. Corporate High-Yield Bond Index. Index performance is shown for illustrative purposes only. It is not possible to invest directly in an index.
EXHIBIT 1: CAP RATES IN CONTEXTHistorical Spreads vs. Treasuries and Corporate Bonds
Spr
ead
to N
PI C
ap R
ate
10-Yr Treasury Yield Baa Corp Bond Yield HY Corp Bond Yield
Current20-Yr Minimum20-Yr Maximum20-Yr Average
-15%
-10%
-5%
0%
5%
J U L Y 2 0 1 4
What’s more, many major markets still present opportunities, despite low overall cap rates. Recent price growth in the gateway markets occurred because investors perceived them as the safest and most liquid markets, with diverse economies, supply constraints, and other factors giving them the healthiest fundamentals. Thanks to those same factors, they continue to enjoy good growth prospects. On the submarket level, fundamentals have improved—and cap rates have fallen—at widely varying speeds. So while it’s harder to find attractively priced assets in major markets than it was at the outset of the recovery, relative value is still available not only on a national level but also within individual metros.
Remember as well that over the long term, real estate investment performance is driven by cash flow and growth in NOI.3 On a national level, demand (as measured by net absorption) remains well below trend and therefore likely to rise as the economy strengthens. New supply also remains scarce, since rents and property values are often still too low to justify development, and developers still struggle to find financing. Over the last five years new office supply as a percentage of stock has been only .62% annually, less than half its 20-year average. In the same period new retail and industrial supply have been even lower—about a quarter of their historical averages—while new apartment supply has been about three-quarters of the average. Looking ahead three years, forecasts see new apartment supply roughly matching the historical average, with other categories remaining well below it.4
Stronger demand coupled with limited new supply should result in rising occupancies, rents and NOI growth. There is ample room for improvement: On average, occupancy remains low and rents remain below prerecession levels.
Behind the headlinesOne of the more striking aspects of today’s market is the variety that lies behind some of the headline numbers. A look at cap rates in various metros, for example, shows them at or near record lows in only a handful of bigger, standout markets. Elsewhere they are less compressed, implying that investors with a broader geographical scope can still find assets at attractive prices. (See Exhibit 3.)
Sources: NCREIF, BlackRock, March 31, 2014. NPI projections reflect BlackRock’s expectations for real estate assets on an aggregate level and do not predict the performance of any sector, investment or product. The NPI does not take into account the effects of leverage or market, property type or asset selection which would be expected to have a significant impact on any investment return, and the performance of any real estate investment is not expected to track the NPI. These projections are passive only and do not consider the impact of active management. The projections are presented for illustrative purposes only and should not be used, or relied upon, to make investment decisions. The projections do not represent BlackRock investment recommendations or performance. Index performance is shown for illustrative purposes only. It is not possible to invest directly in an index.
EXHIBIT 2: LOOK TO NOI GROWTH FOR FUTURE RETURNS Components of Return (Actual and Projected) in NCREIF Property Index
EXHIBIT 3: LOW CAP RATES ARE MAINLY FOUND IN MAJOR MARKETS Historical and Recent NPI Office Cap Rates in 25 US Cities.
3-Yr
Rol
ling
Com
pone
nts
of R
etur
ns
2000
2001
2002
2003
2004
2005
2006
2007
2008
2009
2010
2011
2012
2013
2014
(F)
2015
(F)
2016
(F)
-5%
-10%
5%
0%
10%
15%
20%
Cap Rate Shift Effect Dividend YieldNOI Growth Total Return
NP
I Offi
ce
Cap
Rat
e
7%
5%
3%
9%
11%
Current10-Yr Minimum10-Yr Maximum
San Francisco
New York
San Diego
Boston
Santa Ana
Seattle
Washington, D.C.
Los Angeles
Oakland
Denver
San Jose
AustinMiami
HoustonDalla
s
Phoenix
Atlanta
Chicago
Fort Lauderd
ale
Portland, O
R
Tampa
Minneapolis
Edison
Philadelphia
Riverside
Sources: NCREIF, BlackRock, March 31 2014. Index performance is shown for illustrative purposes only. It is not possible to invest directly in an index.
3 See BlackRock’s June 2013 article, “Long-Term Income Opportunities in US Real Estate.”
4 Data and forecasts are from CBRE (industrial properties) and Reis, Inc. (all other property types).
Fundamental forces As the cycle progresses and cap rate compression slows, which it is likely to do, investors will need to look to NOI growth for a growing share of total returns. Clearly, the ability to anticipate where such growth will occur will be a significant advantage. In general, large cities such as New York, San Francisco, Houston and Boston have seen comparatively strong demand for both residential and commercial space, tied to greater economic growth and a better employment picture than in many other markets. Those conditions, in turn, have much to do with the boost these metros are getting, and will continue to enjoy, from several major social and economic trends.
These are long-term trends whose impacts are already being seen well beyond the major metros. Investors face the task of carefully selecting the metros and assets that are likely to be the biggest beneficiaries, while also identifying markets where their effects are being overestimated as places to approach with caution, or simply avoid.
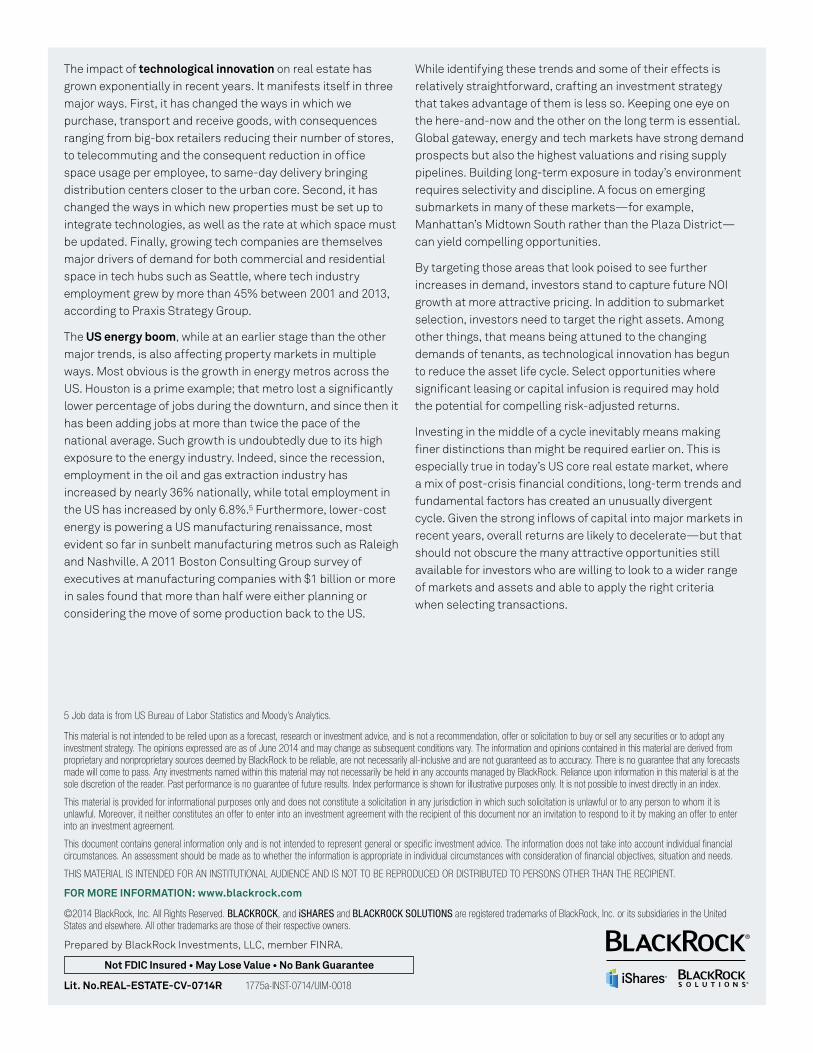
As shown in Exhibit 4, we believe it is useful to focus on four key themes in particular: urbanization, globalization, technological change, and the US energy boom. All are discussed in the media in various contexts, and most real estate investors factor them into their decisions to some degree. Even so, their implications for property markets still tend to be underanalyzed, mainly because these are complex forces affecting different metros and sectors in a variety of ways. In general, however, they have the potential to drive growth in both rents and net operating income for years to come.
Globalization has made it easier for people, businesses and capital to connect all over the world. And people, businesses and capital gravitate to gateway cities with an agglomeration of universities, industries and cultural offerings. The result is that there are hubs of innovation where companies and people want to be. The ongoing concentration of global biotech research in and around Cambridge, Mass., not far from MIT and Harvard, is but one example of the phenomenon. In-migration and increased productivity in these cities lead to population and per capita income growth, which tend to strengthen real estate demand. In addition, long-term owners of real estate are buying assets in these same gateway markets to safely store value, which gives additional support to pricing.
Urbanization has been a long-term trend, as the last two centuries have seen a large-scale migration away from rural areas in the US. However, for many years much of this migration was directed toward suburban areas. Only in more recent years have Millennials (and some of their empty-nest parents) rushed back into the urban core, seeking the convenience of a live-work-play environment. This phenomenon is occurring across the country in both large and small cities, as a growing desire for walkability and other conveniences has given rise to new urban areas. The phenomenon is reflected in increasingly strong demand for urban apartments, which have had a measurable impact on space market fundamentals. Urban apartments’ share of total apartment absorption increased from 10%–15% in the 2000s to roughly 30% in the 2010s, based on an analysis using data from Reis, Inc.
EXHIBIT 4: MAJOR TRENDS AND HOW TO NAVIGATE THEMFour Long-Term Drivers of Change Now at Work in Real Estate Markets
Trend Impact Long-term strategy Executing today
Globalization } Gravitation of people, businesses and capital toward global cities
} Overweight globally connected markets (e.g. New York, San Francisco, Washington DC, Boston, Los Angeles)
} Be highly selective, given current pricing
} Explore opportunities in emerging submarkets
} Consider some leasing/capex risk
} Class B → Class A renovations
Urbanization } Growing demand and rising density in live-work-play locations
} Focus on urban product (e.g. high-rise apartment, urban office, mixed-use assets)
} Be mindful of rising apartment supply in some locations
} Look for emerging submarkets with favorable NOI growth prospects at right price
Technology } Growing demand from tech firms
} Changes in real estate use via changes in:
• How we purchase, transport, and receive goods
• How physical spaces integrate technologies
} Overweight tech markets (e.g. Seattle, Austin, Denver, Boston, San Diego)
} Target subtypes that can adapt to/withstand technological innovation (destination retail, small urban warehouses, highly amenitized apartments, offices with open floor plans)
} Focus on emerging submarkets that attract tech tenants
} Be conscious of shorter asset life cycles. Focus on more modern product or assets that can be redeveloped into modern stock
US Energy Boom
} Growth in energy markets
} Manufacturing renaissance
} Look for opportunities in energy hubs (e.g. Houston, Austin, Denver) and in select sunbelt manufacturing markets (e.g. Raleigh, Nashville)
} Be mindful of potential new supply
} Target all property types in these markets
Source: BlackRock, June 30, 2014. The opinions expressed are as of this date and may change as subsequent conditions vary.
5 Job data is from US Bureau of Labor Statistics and Moody’s Analytics.
This material is not intended to be relied upon as a forecast, research or investment advice, and is not a recommendation, offer or solicitation to buy or sell any securities or to adopt any investment strategy. The opinions expressed are as of June 2014 and may change as subsequent conditions vary. The information and opinions contained in this material are derived from proprietary and nonproprietary sources deemed by BlackRock to be reliable, are not necessarily all-inclusive and are not guaranteed as to accuracy. There is no guarantee that any forecasts made will come to pass. Any investments named within this material may not necessarily be held in any accounts managed by BlackRock. Reliance upon information in this material is at the sole discretion of the reader. Past performance is no guarantee of future results. Index performance is shown for illustrative purposes only. It is not possible to invest directly in an index.
This material is provided for informational purposes only and does not constitute a solicitation in any jurisdiction in which such solicitation is unlawful or to any person to whom it is unlawful. Moreover, it neither constitutes an offer to enter into an investment agreement with the recipient of this document nor an invitation to respond to it by making an offer to enter into an investment agreement.
This document contains general information only and is not intended to represent general or specific investment advice. The information does not take into account individual financial circumstances. An assessment should be made as to whether the information is appropriate in individual circumstances with consideration of financial objectives, situation and needs.
THIS MATERIAL IS INTENDED FOR AN INSTITUTIONAL AUDIENCE AND IS NOT TO BE REPRODUCED OR DISTRIBUTED TO PERSONS OTHER THAN THE RECIPIENT.
FOR MORE INFORMATION: www.blackrock.com
©2014 BlackRock, Inc. All Rights Reserved. BLACKROCK, and iSHARES and BLACKROCK SOLUTIONS are registered trademarks of BlackRock, Inc. or its subsidiaries in the United States and elsewhere. All other trademarks are those of their respective owners.
Prepared by BlackRock Investments, LLC, member FINRA.
Lit. No.REAL-ESTATE-CV-0714R 1775a-INST-0714/UIM-0018
Not FDIC Insured • May Lose Value • No Bank Guarantee
The impact of technological innovation on real estate has grown exponentially in recent years. It manifests itself in three major ways. First, it has changed the ways in which we purchase, transport and receive goods, with consequences ranging from big-box retailers reducing their number of stores, to telecommuting and the consequent reduction in office space usage per employee, to same-day delivery bringing distribution centers closer to the urban core. Second, it has changed the ways in which new properties must be set up to integrate technologies, as well as the rate at which space must be updated. Finally, growing tech companies are themselves major drivers of demand for both commercial and residential space in tech hubs such as Seattle, where tech industry employment grew by more than 45% between 2001 and 2013, according to Praxis Strategy Group.
The US energy boom, while at an earlier stage than the other major trends, is also affecting property markets in multiple ways. Most obvious is the growth in energy metros across the US. Houston is a prime example; that metro lost a significantly lower percentage of jobs during the downturn, and since then it has been adding jobs at more than twice the pace of the national average. Such growth is undoubtedly due to its high exposure to the energy industry. Indeed, since the recession, employment in the oil and gas extraction industry has increased by nearly 36% nationally, while total employment in the US has increased by only 6.8%.5 Furthermore, lower-cost energy is powering a US manufacturing renaissance, most evident so far in sunbelt manufacturing metros such as Raleigh and Nashville. A 2011 Boston Consulting Group survey of executives at manufacturing companies with $1 billion or more in sales found that more than half were either planning or considering the move of some production back to the US.
While identifying these trends and some of their effects is relatively straightforward, crafting an investment strategy that takes advantage of them is less so. Keeping one eye on the here-and-now and the other on the long term is essential. Global gateway, energy and tech markets have strong demand prospects but also the highest valuations and rising supply pipelines. Building long-term exposure in today’s environment requires selectivity and discipline. A focus on emerging submarkets in many of these markets—for example, Manhattan’s Midtown South rather than the Plaza District—can yield compelling opportunities.
By targeting those areas that look poised to see further increases in demand, investors stand to capture future NOI growth at more attractive pricing. In addition to submarket selection, investors need to target the right assets. Among other things, that means being attuned to the changing demands of tenants, as technological innovation has begun to reduce the asset life cycle. Select opportunities where significant leasing or capital infusion is required may hold the potential for compelling risk-adjusted returns.
Investing in the middle of a cycle inevitably means making finer distinctions than might be required earlier on. This is especially true in today’s US core real estate market, where a mix of post-crisis financial conditions, long-term trends and fundamental factors has created an unusually divergent cycle. Given the strong inflows of capital into major markets in recent years, overall returns are likely to decelerate—but that should not obscure the many attractive opportunities still available for investors who are willing to look to a wider range of markets and assets and able to apply the right criteria when selecting transactions.