blackrock asset management canada limited · blackrock canadian equity index fund statement of net...
TRANSCRIPT

BlackRock Asset ManagementCanada Limited
Annual Audited Financial Statements
As at December 31, 2012

Table of Contents
Statement of Net Assets as at December 31
Statement of Operations for the periods ended December 31
Statement of Changes in Net Assets for the periods ended December 31
Statement of Cash Flow for the periods ended December 31*
Statement of Investment Portfolio as at December 31, 2012
Canadian Equity Index Funds
BlackRock Canadian Equity Index Fund 3BlackRock Canadian Equity Ex-Trusts Index Fund 10BlackRock CDN MSCI Canada IMI Index Fund 12
U.S. Equity Funds
BlackRock CDN US Equity Index Non-Taxable Fund 19BlackRock CDN US Equity Index Plus Non-Taxable Fund 28BlackRock CDN US Equity Index Hedged Non-Taxable Fund 37BlackRock CDN US Equity Index Fund 40BlackRock CDN US Alpha Tilts Non-Taxable Fund 49BlackRock CDN US Alpha Tilts Hedged Non-Taxable Fund 54BlackRock CDN Russell 3000 Index Non-Taxable Fund 57
Active Canadian Equity Funds
BlackRock Active Canadian Equity Fund 89BlackRock Active Canadian Equity Ex-IncomeTrusts Fund 94BlackRock Active Canadian Equity DC Fund 99BlackRock Active Canadian Equity Small Cap Fund 104BlackRock Canada Alpha Advantage Fund 108
Canadian Bond Funds
BlackRock Canada Universe Bond Index Fund 115BlackRock Canada ex-BBB Universe Bond Index Fund 129BlackRock Canada Real Return Bond Index Fund 138BlackRock Canada Long Bond Index Fund 142BlackRock Canada Long Government Bond Index Fund 150BlackRock Canada All Government Bond Index Fund 155BlackRock Canada Credit-Screened Bond Index Fund 161BlackRock Canada CoreActive Universe Bond Fund 170BlackRock Canada CorePlus Long Bond Fund 178BlackRock Canada CorePlus Universe Bond Fund 186BlackRock Canada Levered Long Bond Index Fund 197BlackRock Canada Levered Real Return Bond Index Fund 200
Balanced Index Funds
BlackRock Balanced Moderate Index DC Fund 203BlackRock Balanced Conservative Index DC Fund 206BlackRock Balanced Aggressive Index DC Fund 209
BlackRock Canada LifePath® Funds
BlackRock CDN LifePath Retirement Index Fund I 212BlackRock CDN LifePath Index 2010 Retirement Fund 215BlackRock CDN LifePath 2015 Index Fund 218BlackRock CDN LifePath 2020 Index Fund 221BlackRock CDN LifePath 2025 Index Fund 224BlackRock CDN LifePath 2030 Index Fund 227BlackRock CDN LifePath 2035 Index Fund 230BlackRock CDN LifePath 2040 Index Fund 233BlackRock CDN LifePath 2045 Index Fund 236BlackRock CDN LifePath 2050 Index Fund 239
Active Balanced Funds
BlackRock Balanced Active Fund 242
Active Alternative Funds
BlackRock CDN Global Market Selection Fund 245
Short Term Investment Funds
BlackRock CDN Short Term Index Fund 249
International Equity Funds
BlackRock CDN MSCI EAFE Equity Index Fund 253BlackRock CDN MSCI EAFE Index Hedged Fund 267BlackRock CDN MSCI ACWI ex-Canada Index Fund 270BlackRock CDN MSCI Emerging Markets Index Fund 273BlackRock CDN MSCI EAFE Index Plus Fund 286BlackRock CDN Global Equity Focus Fund 299BlackRock CDN Global Developed Real Estate Index Fund 302BlackRock CDN Global Infrastructure Equity Index Fund 308BlackRock CDN Emerging Markets Fundamental Index Fund 312
Notes to Financial Statements 319
Auditor’s Report 357
* Applicable to BlackRock Canada Alpha Advantage Fund, BlackRock Canada CorePlus Long Bond Fund, and BlackRock Canada CorePlus Universe Bond Fund only.
2

BlackRock Canadian Equity Index Fund
Statement of Net Assets — As at December 31
2012 2011
Assets
Investments - at fair value (Note 2) $ 4,096,874,281 $ 3,194,066,633Cash 50,660,175 20,082,763Margin due from brokers 7,384,419 4,827,610Securities lending income receivable 79,487 17,538Dividends and distributions from underlying trust units receivable 13,293,647 9,018,851Accounts receivable from issue of units 80,392,330 6,171,372Accounts receivable for investment sales - 4,840,920
4,248,684,339 3,239,025,687
Liabilities
Operating expenses payable 137,818 96,247Payables for redemption of units 19,042,571 4,007,665Payables for investment purchases 74,707,796 15,687,455
93,888,185 19,791,367
Net Assets $ 4,154,796,154 $ 3,219,234,320
Net Assets per Class
Class A $ 1,463,008,980 $ 1,063,323,780Class D 2,691,787,174 2,155,910,540
$ 4,154,796,154 $ 3,219,234,320
Number of Units Issued and Outstanding (Note 8)
Class A 25,654,009 19,991,357Class D 113,019,328 97,045,007
Net Assets per Unit
Class A $ 57.03 $ 53.19Class D $ 23.82 $ 22.22
Investments at Cost $ 3,798,006,654 $ 3,047,137,735
Approved by BlackRock Asset Management Canada Limited,Manager of the Funds
Eric Léveillé, Director Noel Archard, Director
The accompanying notes are an integral part of the financial statements. 3

BlackRock Canadian Equity Index Fund
Statement of Operations — For the Years Ended December 31
2012 2011
Revenue
Dividend income and distributions from underlying trust units $ 108,488,070 $ 80,180,612Interest income 168,545 135,700Securities lending income 1,091,379 254,114Net gain (loss) from futures contracts 1,521,206 (1,775,427)
111,269,200 78,794,999
Expenses
Custodian fees 220,936 190,486Fund accounting expenses 115,959 106,913Unitholder communication costs 2,114 601Audit fees 23,138 25,171Securities filing fees 62,820 49,139Independent review committee fees 1,500 3,624Other operating expenses 32,188 30,747
458,655 406,681
Net Investment Income for the Year 110,810,545 78,388,318
Gain (Loss) on Investments
Net realized gain (loss) on sale of investments (9,002,456) 41,433,378Transaction costs (Note 2,13) (414,924) (410,973)Net change in unrealized appreciation (depreciation) in value of investments 151,938,729 (389,287,299)
Net Gain (Loss) on Investments 142,521,349 (348,264,894)
Increase (Decrease) in Net Assets from Operations $ 253,331,894 $ (269,876,576)
Increase (Decrease) in Net Assets from Operations per Class
Class A $ 83,769,101 $ (86,605,717)Class D 169,562,793 (183,270,859)
$ 253,331,894 $ (269,876,576)
Increase (Decrease) in Net Assets from Operations per Unit
Class A $ 3.43 $ (4.71)Class D $ 1.64 $ (2.09)
The accompanying notes are an integral part of the financial statements. 4

BlackRock Canadian Equity Index Fund
Statement of Changes in Net Assets — For the Years Ended December 31
2012 2011 2012 2011 2012 2011
Fund Class A Class D
Net Assets - Beginning of Year $ 3,219,234,320 $ 2,850,758,577 $ 1,063,323,780 $ 844,710,443 $ 2,155,910,540 $ 2,006,048,134
Increase (Decrease) in Net Assets from Operations 253,331,894 (269,876,576) 83,769,101 (86,605,717) 169,562,793 (183,270,859)
Capital Transactions
Proceeds from issue of units 1,383,460,449 1,215,967,534 768,620,577 598,222,120 614,839,872 617,745,414Reinvestment of distributions 106,847,634 109,787,217 38,466,085 35,142,860 68,381,549 74,644,357Redemption of units (701,230,509) (577,615,215) (452,704,478) (293,003,066) (248,526,031) (284,612,149)
Net capital transactions 789,077,574 748,139,536 354,382,184 340,361,914 434,695,390 407,777,622
Distributions
From net investment income (106,847,634) (74,947,371) (38,466,085) (25,290,516) (68,381,549) (49,656,855)From capital gains redemption in kind (Note 9) - (34,839,846) - (9,852,344) - (24,987,502)
Total distributions (106,847,634) (109,787,217) (38,466,085) (35,142,860) (68,381,549) (74,644,357)
Increase in Net Assets for the Year 935,561,834 368,475,743 399,685,200 218,613,337 535,876,634 149,862,406
Net Assets - End of Year $ 4,154,796,154 $ 3,219,234,320 $ 1,463,008,980 $ 1,063,323,780 $ 2,691,787,174 $ 2,155,910,540
The accompanying notes are an integral part of the financial statements. 5
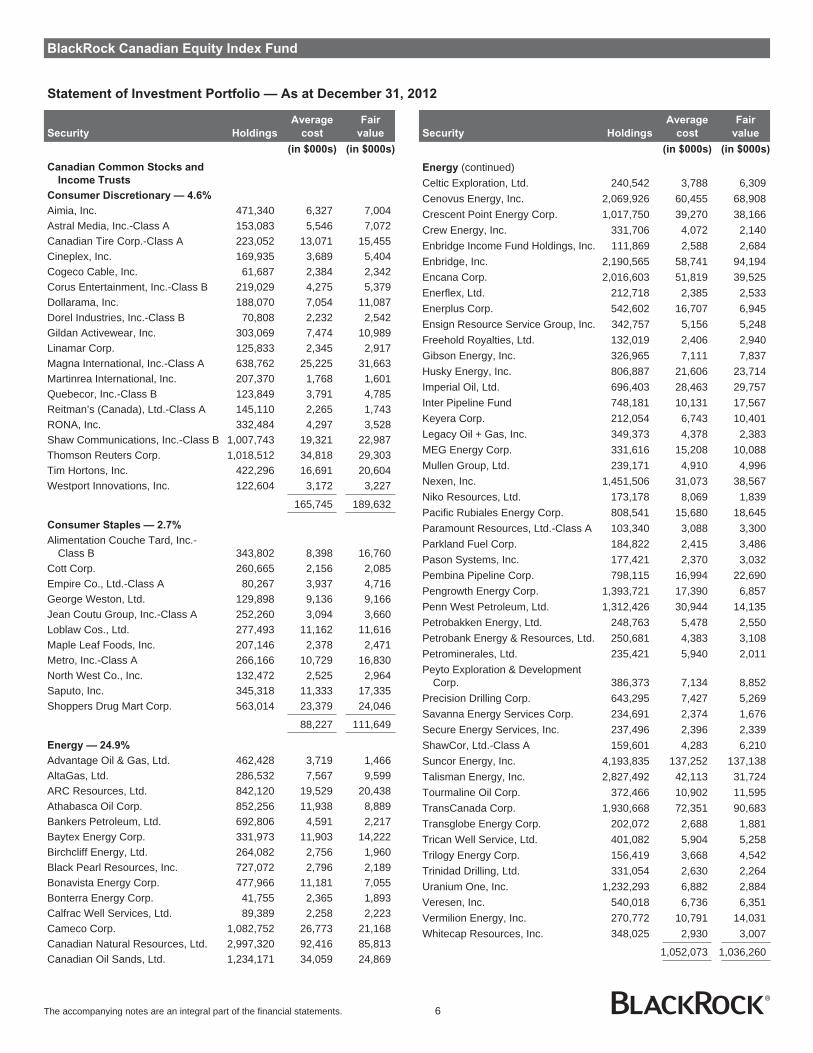
BlackRock Canadian Equity Index Fund
Statement of Investment Portfolio — As at December 31, 2012
Security Holdings
Average
cost
Fair
value
(in $000s) (in $000s)
Canadian Common Stocks and
Income Trusts
Consumer Discretionary — 4.6%
Aimia, Inc. 471,340 6,327 7,004Astral Media, Inc.-Class A 153,083 5,546 7,072Canadian Tire Corp.-Class A 223,052 13,071 15,455Cineplex, Inc. 169,935 3,689 5,404Cogeco Cable, Inc. 61,687 2,384 2,342Corus Entertainment, Inc.-Class B 219,029 4,275 5,379Dollarama, Inc. 188,070 7,054 11,087Dorel Industries, Inc.-Class B 70,808 2,232 2,542Gildan Activewear, Inc. 303,069 7,474 10,989Linamar Corp. 125,833 2,345 2,917Magna International, Inc.-Class A 638,762 25,225 31,663Martinrea International, Inc. 207,370 1,768 1,601Quebecor, Inc.-Class B 123,849 3,791 4,785Reitman’s (Canada), Ltd.-Class A 145,110 2,265 1,743RONA, Inc. 332,484 4,297 3,528Shaw Communications, Inc.-Class B 1,007,743 19,321 22,987Thomson Reuters Corp. 1,018,512 34,818 29,303Tim Hortons, Inc. 422,296 16,691 20,604Westport Innovations, Inc. 122,604 3,172 3,227
165,745 189,632
Consumer Staples — 2.7%
Alimentation Couche Tard, Inc.-Class B 343,802 8,398 16,760
Cott Corp. 260,665 2,156 2,085Empire Co., Ltd.-Class A 80,267 3,937 4,716George Weston, Ltd. 129,898 9,136 9,166Jean Coutu Group, Inc.-Class A 252,260 3,094 3,660Loblaw Cos., Ltd. 277,493 11,162 11,616Maple Leaf Foods, Inc. 207,146 2,378 2,471Metro, Inc.-Class A 266,166 10,729 16,830North West Co., Inc. 132,472 2,525 2,964Saputo, Inc. 345,318 11,333 17,335Shoppers Drug Mart Corp. 563,014 23,379 24,046
88,227 111,649
Energy — 24.9%
Advantage Oil & Gas, Ltd. 462,428 3,719 1,466AltaGas, Ltd. 286,532 7,567 9,599ARC Resources, Ltd. 842,120 19,529 20,438Athabasca Oil Corp. 852,256 11,938 8,889Bankers Petroleum, Ltd. 692,806 4,591 2,217Baytex Energy Corp. 331,973 11,903 14,222Birchcliff Energy, Ltd. 264,082 2,756 1,960Black Pearl Resources, Inc. 727,072 2,796 2,189Bonavista Energy Corp. 477,966 11,181 7,055Bonterra Energy Corp. 41,755 2,365 1,893Calfrac Well Services, Ltd. 89,389 2,258 2,223Cameco Corp. 1,082,752 26,773 21,168Canadian Natural Resources, Ltd. 2,997,320 92,416 85,813Canadian Oil Sands, Ltd. 1,234,171 34,059 24,869
Security Holdings
Average
cost
Fair
value
(in $000s) (in $000s)
Energy (continued)Celtic Exploration, Ltd. 240,542 3,788 6,309Cenovus Energy, Inc. 2,069,926 60,455 68,908Crescent Point Energy Corp. 1,017,750 39,270 38,166Crew Energy, Inc. 331,706 4,072 2,140Enbridge Income Fund Holdings, Inc. 111,869 2,588 2,684Enbridge, Inc. 2,190,565 58,741 94,194Encana Corp. 2,016,603 51,819 39,525Enerflex, Ltd. 212,718 2,385 2,533Enerplus Corp. 542,602 16,707 6,945Ensign Resource Service Group, Inc. 342,757 5,156 5,248Freehold Royalties, Ltd. 132,019 2,406 2,940Gibson Energy, Inc. 326,965 7,111 7,837Husky Energy, Inc. 806,887 21,606 23,714Imperial Oil, Ltd. 696,403 28,463 29,757Inter Pipeline Fund 748,181 10,131 17,567Keyera Corp. 212,054 6,743 10,401Legacy Oil + Gas, Inc. 349,373 4,378 2,383MEG Energy Corp. 331,616 15,208 10,088Mullen Group, Ltd. 239,171 4,910 4,996Nexen, Inc. 1,451,506 31,073 38,567Niko Resources, Ltd. 173,178 8,069 1,839Pacific Rubiales Energy Corp. 808,541 15,680 18,645Paramount Resources, Ltd.-Class A 103,340 3,088 3,300Parkland Fuel Corp. 184,822 2,415 3,486Pason Systems, Inc. 177,421 2,370 3,032Pembina Pipeline Corp. 798,115 16,994 22,690Pengrowth Energy Corp. 1,393,721 17,390 6,857Penn West Petroleum, Ltd. 1,312,426 30,944 14,135Petrobakken Energy, Ltd. 248,763 5,478 2,550Petrobank Energy & Resources, Ltd. 250,681 4,383 3,108Petrominerales, Ltd. 235,421 5,940 2,011Peyto Exploration & Development
Corp. 386,373 7,134 8,852Precision Drilling Corp. 643,295 7,427 5,269Savanna Energy Services Corp. 234,691 2,374 1,676Secure Energy Services, Inc. 237,496 2,396 2,339ShawCor, Ltd.-Class A 159,601 4,283 6,210Suncor Energy, Inc. 4,193,835 137,252 137,138Talisman Energy, Inc. 2,827,492 42,113 31,724Tourmaline Oil Corp. 372,466 10,902 11,595TransCanada Corp. 1,930,668 72,351 90,683Transglobe Energy Corp. 202,072 2,688 1,881Trican Well Service, Ltd. 401,082 5,904 5,258Trilogy Energy Corp. 156,419 3,668 4,542Trinidad Drilling, Ltd. 331,054 2,630 2,264Uranium One, Inc. 1,232,293 6,882 2,884Veresen, Inc. 540,018 6,736 6,351Vermilion Energy, Inc. 270,772 10,791 14,031Whitecap Resources, Inc. 348,025 2,930 3,007
1,052,073 1,036,260
The accompanying notes are an integral part of the financial statements. 6

BlackRock Canadian Equity Index Fund
Statement of Investment Portfolio — As at December 31, 2012
Security Holdings
Average
cost
Fair
value
(in $000s) (in $000s)
Financials — 32.1%
AGF Management, Ltd.-Class B 190,058 3,268 1,882Allied Properties Real Estate
Investment Trust-REIT 175,012 4,186 5,767Artis Real Estate Investment Trust-
REIT 301,959 3,982 4,723Bank of Montreal 1,782,260 97,248 108,379Bank of Nova Scotia 3,244,212 156,482 186,283Boardwalk REIT 107,417 4,129 6,908Brookfield Asset Management, Inc.-
Class A 1,539,102 42,578 55,869Brookfield Properties Co. 690,311 11,227 11,652Calloway REIT 266,466 5,862 7,701Canadian Apartment Properties REIT 275,338 4,818 6,823Canadian Imperial Bank of
Commerce 1,107,819 78,473 88,581Canadian REIT 186,499 5,653 8,064Canadian Western Bank 214,491 5,021 6,092Chartwell Seniors Housing REIT 468,552 3,717 5,088CI Financial Corp. 402,870 8,822 10,019Cominar REIT 312,270 6,558 7,042Crombie Real Estate Investment
Trust-REIT 139,204 2,067 2,053Davis & Henderson Income Corp. 162,221 2,937 3,486Dundee Corp.-Class A 107,741 1,971 3,299Dundee REIT 265,856 8,214 9,948Extendicare Inc. 234,543 1,891 1,794Fairfax Financial Holdings, Ltd. 54,407 18,656 19,315First Capital Realty, Inc. 231,584 3,778 4,351FirstService Corp. 69,978 1,650 1,959Genworth MI Canada, Inc. 113,541 2,721 2,563Granite Real Estate, Inc. 128,260 4,577 4,838Great-West Lifeco, Inc. 702,853 17,154 17,065H&R REIT 531,000 10,536 12,797Home Capital Group, Inc. 86,402 3,466 5,099IGM Financial, Inc. 262,836 10,819 10,931Industrial Alliance Insurance and
Financial Services, Inc. 248,183 7,239 7,776Intact Financial Corp. 365,165 17,313 23,612Itemus, Inc. 14,900 1 -Laurentian Bank of Canada 77,006 3,167 3,404Manulife Financial Corp. 4,987,880 99,408 67,237National Bank of Canada 443,367 27,064 34,184Northern Property Real Estate
Investment Trust-REIT 87,512 2,838 2,700Onex Corp. 241,860 7,020 10,122Power Corp. of Canada 945,849 25,339 23,920Power Financial Corp. 640,033 18,254 17,409Primaris Retail REIT 267,823 4,932 7,194RioCan REIT 812,528 17,201 22,344Royal Bank of Canada 3,958,382 190,029 236,751Sun Life Financial, Inc. 1,634,712 50,085 43,058
Security Holdings
Average
cost
Fair
value
(in $000s) (in $000s)
Financials (continued)TMX Group, Ltd. 63,269 3,002 3,208Toronto-Dominion Bank 2,514,784 168,441 210,362
1,173,794 1,333,652
Health Care — 1.8%
Catamaran Corp. 561,822 18,156 26,198CML HealthCare, Inc. 246,760 2,970 1,639Nordion, Inc. 170,177 2,001 1,087Valeant Pharmaceuticals
International, Inc. 781,185 27,147 46,277
50,274 75,201
Industrials — 5.9%
Black Diamond Group, Ltd. 95,847 2,123 1,917Bombardier, Inc.-Class B 4,085,227 20,703 15,320CAE, Inc. 709,725 6,817 7,140Canadian National Railway Co. 1,181,762 70,901 106,701Canadian Pacific Railway, Ltd. 407,384 23,993 41,052Chorus Aviation, Inc. 303,068 1,478 1,155Finning International, Inc. 470,801 10,231 11,563Genivar, Inc. 95,044 2,168 1,873Progressive Waste Solutions, Ltd. 315,391 6,232 6,762Russel Metals, Inc. 164,747 3,567 4,539SNC-Lavalin Group, Inc. 413,643 16,687 16,657Stantec, Inc. 125,638 3,446 4,973Superior Plus, Inc. 306,692 3,727 3,131Toromont Industries, Ltd. 209,055 3,502 4,397Transcontinental, Inc.-Class A 182,071 2,623 2,021TransForce, Inc. 220,381 2,557 4,372Wajax Corp. 45,871 2,153 1,862Westjet Airlines, Ltd. 344,511 4,836 6,773Westshore Terminals
Investment Corp. 174,880 3,240 4,802
190,984 247,010
Information Technology — 1.5%
Celestica, Inc. 448,582 4,818 3,616CGI Group, Inc.-Class A 750,308 12,935 17,197Constellation Software, Inc. 31,922 3,339 3,807MacDonald Dettwiler & Associates,
Ltd. 87,213 3,522 4,879Open Text Corp. 160,154 7,220 8,869Otsuka Corp. 1,066,672 10,967 8,480Research In Motion, Ltd. 1,134,068 51,348 13,359Wi-Lan, Inc. 333,150 2,156 1,506
96,305 61,713
Materials — 18.2%
Aecon Group, Inc. 153,290 2,027 1,625Agnico-Eagle Mines, Ltd. 469,902 23,510 24,444Agrium, Inc. 408,925 27,119 40,541Alacer Gold Corp. 623,186 5,097 3,228
The accompanying notes are an integral part of the financial statements. 7
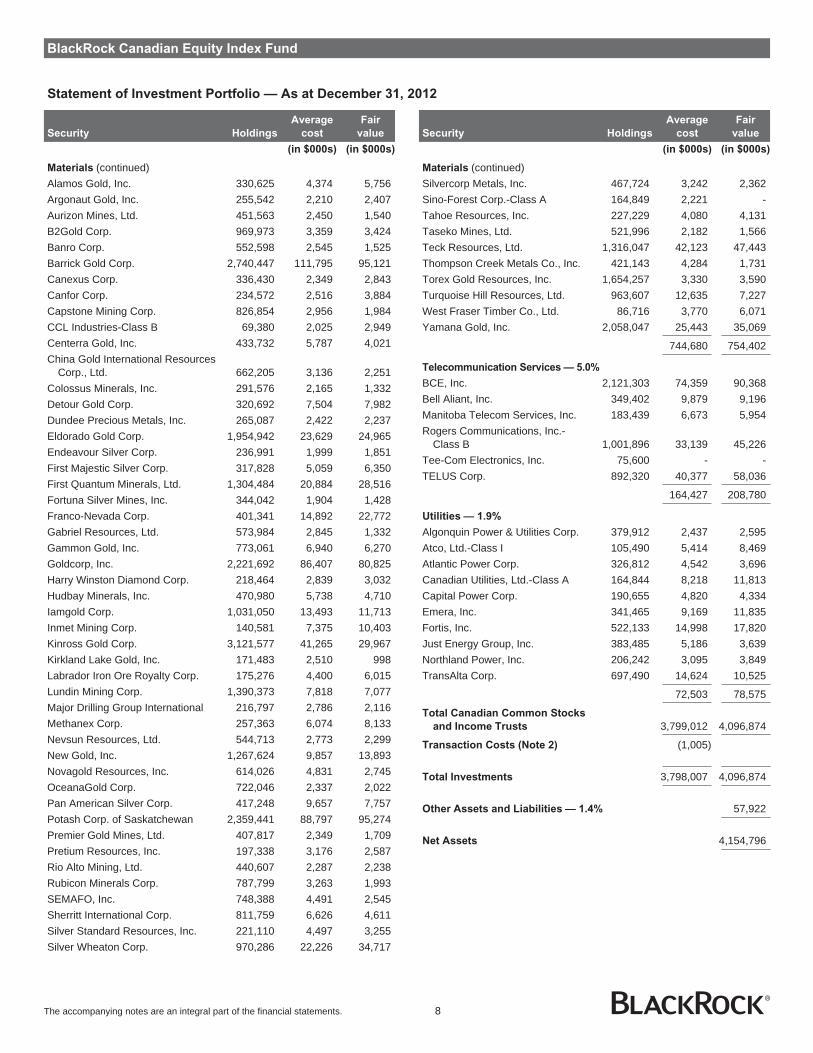
BlackRock Canadian Equity Index Fund
Statement of Investment Portfolio — As at December 31, 2012
Security Holdings
Average
cost
Fair
value
(in $000s) (in $000s)
Materials (continued)Alamos Gold, Inc. 330,625 4,374 5,756Argonaut Gold, Inc. 255,542 2,210 2,407Aurizon Mines, Ltd. 451,563 2,450 1,540B2Gold Corp. 969,973 3,359 3,424Banro Corp. 552,598 2,545 1,525Barrick Gold Corp. 2,740,447 111,795 95,121Canexus Corp. 336,430 2,349 2,843Canfor Corp. 234,572 2,516 3,884Capstone Mining Corp. 826,854 2,956 1,984CCL Industries-Class B 69,380 2,025 2,949Centerra Gold, Inc. 433,732 5,787 4,021China Gold International Resources
Corp., Ltd. 662,205 3,136 2,251Colossus Minerals, Inc. 291,576 2,165 1,332Detour Gold Corp. 320,692 7,504 7,982Dundee Precious Metals, Inc. 265,087 2,422 2,237Eldorado Gold Corp. 1,954,942 23,629 24,965Endeavour Silver Corp. 236,991 1,999 1,851First Majestic Silver Corp. 317,828 5,059 6,350First Quantum Minerals, Ltd. 1,304,484 20,884 28,516Fortuna Silver Mines, Inc. 344,042 1,904 1,428Franco-Nevada Corp. 401,341 14,892 22,772Gabriel Resources, Ltd. 573,984 2,845 1,332Gammon Gold, Inc. 773,061 6,940 6,270Goldcorp, Inc. 2,221,692 86,407 80,825Harry Winston Diamond Corp. 218,464 2,839 3,032Hudbay Minerals, Inc. 470,980 5,738 4,710Iamgold Corp. 1,031,050 13,493 11,713Inmet Mining Corp. 140,581 7,375 10,403Kinross Gold Corp. 3,121,577 41,265 29,967Kirkland Lake Gold, Inc. 171,483 2,510 998Labrador Iron Ore Royalty Corp. 175,276 4,400 6,015Lundin Mining Corp. 1,390,373 7,818 7,077Major Drilling Group International 216,797 2,786 2,116Methanex Corp. 257,363 6,074 8,133Nevsun Resources, Ltd. 544,713 2,773 2,299New Gold, Inc. 1,267,624 9,857 13,893Novagold Resources, Inc. 614,026 4,831 2,745OceanaGold Corp. 722,046 2,337 2,022Pan American Silver Corp. 417,248 9,657 7,757Potash Corp. of Saskatchewan 2,359,441 88,797 95,274Premier Gold Mines, Ltd. 407,817 2,349 1,709Pretium Resources, Inc. 197,338 3,176 2,587Rio Alto Mining, Ltd. 440,607 2,287 2,238Rubicon Minerals Corp. 787,799 3,263 1,993SEMAFO, Inc. 748,388 4,491 2,545Sherritt International Corp. 811,759 6,626 4,611Silver Standard Resources, Inc. 221,110 4,497 3,255Silver Wheaton Corp. 970,286 22,226 34,717
Security Holdings
Average
cost
Fair
value
(in $000s) (in $000s)
Materials (continued)Silvercorp Metals, Inc. 467,724 3,242 2,362Sino-Forest Corp.-Class A 164,849 2,221 -Tahoe Resources, Inc. 227,229 4,080 4,131Taseko Mines, Ltd. 521,996 2,182 1,566Teck Resources, Ltd. 1,316,047 42,123 47,443Thompson Creek Metals Co., Inc. 421,143 4,284 1,731Torex Gold Resources, Inc. 1,654,257 3,330 3,590Turquoise Hill Resources, Ltd. 963,607 12,635 7,227West Fraser Timber Co., Ltd. 86,716 3,770 6,071Yamana Gold, Inc. 2,058,047 25,443 35,069
744,680 754,402
Telecommunication Services — 5.0%
BCE, Inc. 2,121,303 74,359 90,368Bell Aliant, Inc. 349,402 9,879 9,196Manitoba Telecom Services, Inc. 183,439 6,673 5,954Rogers Communications, Inc.-
Class B 1,001,896 33,139 45,226Tee-Com Electronics, Inc. 75,600 - -TELUS Corp. 892,320 40,377 58,036
164,427 208,780
Utilities — 1.9%
Algonquin Power & Utilities Corp. 379,912 2,437 2,595Atco, Ltd.-Class I 105,490 5,414 8,469Atlantic Power Corp. 326,812 4,542 3,696Canadian Utilities, Ltd.-Class A 164,844 8,218 11,813Capital Power Corp. 190,655 4,820 4,334Emera, Inc. 341,465 9,169 11,835Fortis, Inc. 522,133 14,998 17,820Just Energy Group, Inc. 383,485 5,186 3,639Northland Power, Inc. 206,242 3,095 3,849TransAlta Corp. 697,490 14,624 10,525
72,503 78,575
Total Canadian Common Stocks
and Income Trusts 3,799,012 4,096,874
Transaction Costs (Note 2) (1,005)
Total Investments 3,798,007 4,096,874
Other Assets and Liabilities — 1.4% 57,922
Net Assets 4,154,796
The accompanying notes are an integral part of the financial statements. 8
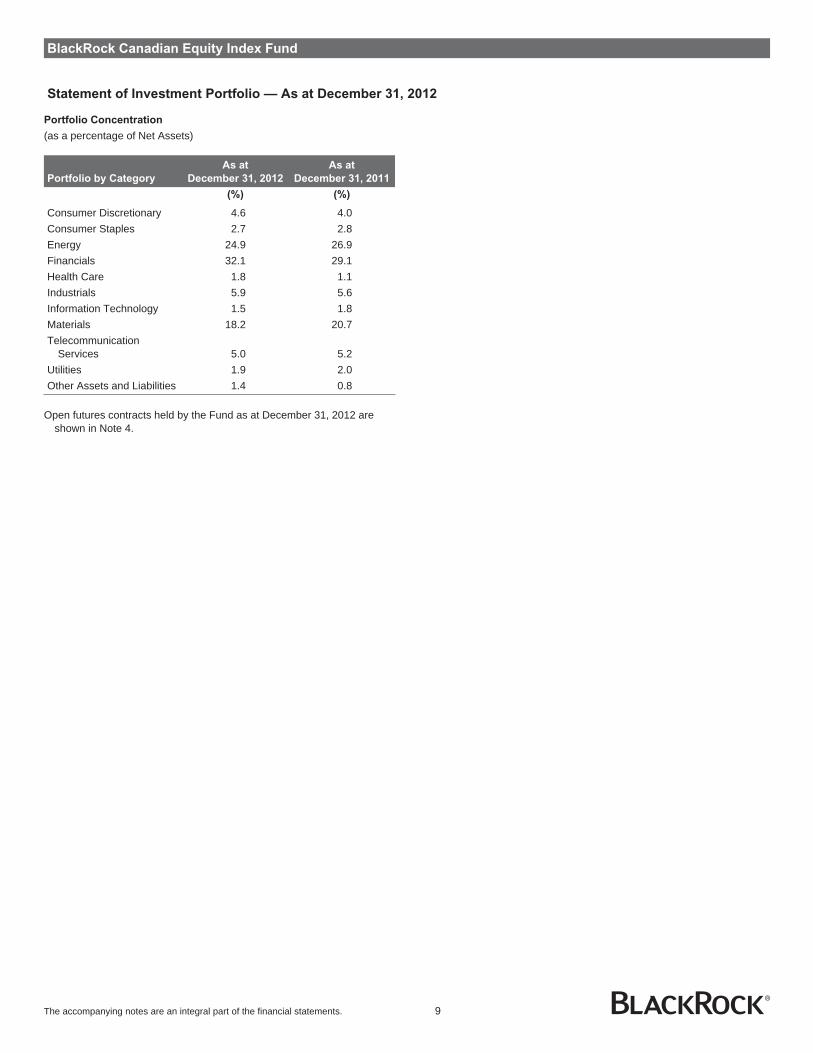
BlackRock Canadian Equity Index Fund
Statement of Investment Portfolio — As at December 31, 2012
Portfolio Concentration
(as a percentage of Net Assets)
Portfolio by Category
As at
December 31, 2012
As at
December 31, 2011
(%) (%)
Consumer Discretionary 4.6 4.0Consumer Staples 2.7 2.8Energy 24.9 26.9Financials 32.1 29.1Health Care 1.8 1.1Industrials 5.9 5.6Information Technology 1.5 1.8Materials 18.2 20.7Telecommunication
Services 5.0 5.2Utilities 1.9 2.0Other Assets and Liabilities 1.4 0.8
Open futures contracts held by the Fund as at December 31, 2012 areshown in Note 4.
The accompanying notes are an integral part of the financial statements. 9
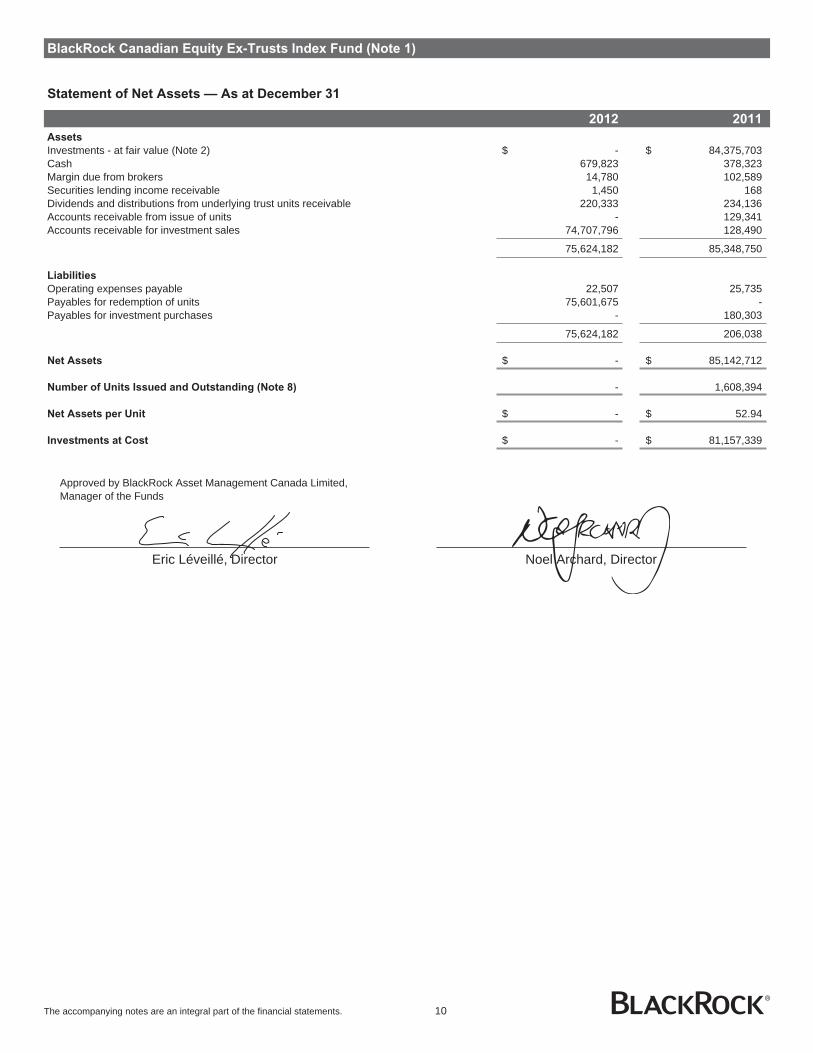
BlackRock Canadian Equity Ex-Trusts Index Fund (Note 1)
Statement of Net Assets — As at December 31
2012 2011
Assets
Investments - at fair value (Note 2) $ - $ 84,375,703Cash 679,823 378,323Margin due from brokers 14,780 102,589Securities lending income receivable 1,450 168Dividends and distributions from underlying trust units receivable 220,333 234,136Accounts receivable from issue of units - 129,341Accounts receivable for investment sales 74,707,796 128,490
75,624,182 85,348,750
Liabilities
Operating expenses payable 22,507 25,735Payables for redemption of units 75,601,675 -Payables for investment purchases - 180,303
75,624,182 206,038
Net Assets $ - $ 85,142,712
Number of Units Issued and Outstanding (Note 8) - 1,608,394
Net Assets per Unit $ - $ 52.94
Investments at Cost $ - $ 81,157,339
Approved by BlackRock Asset Management Canada Limited,Manager of the Funds
Eric Léveillé, Director Noel Archard, Director
The accompanying notes are an integral part of the financial statements. 10
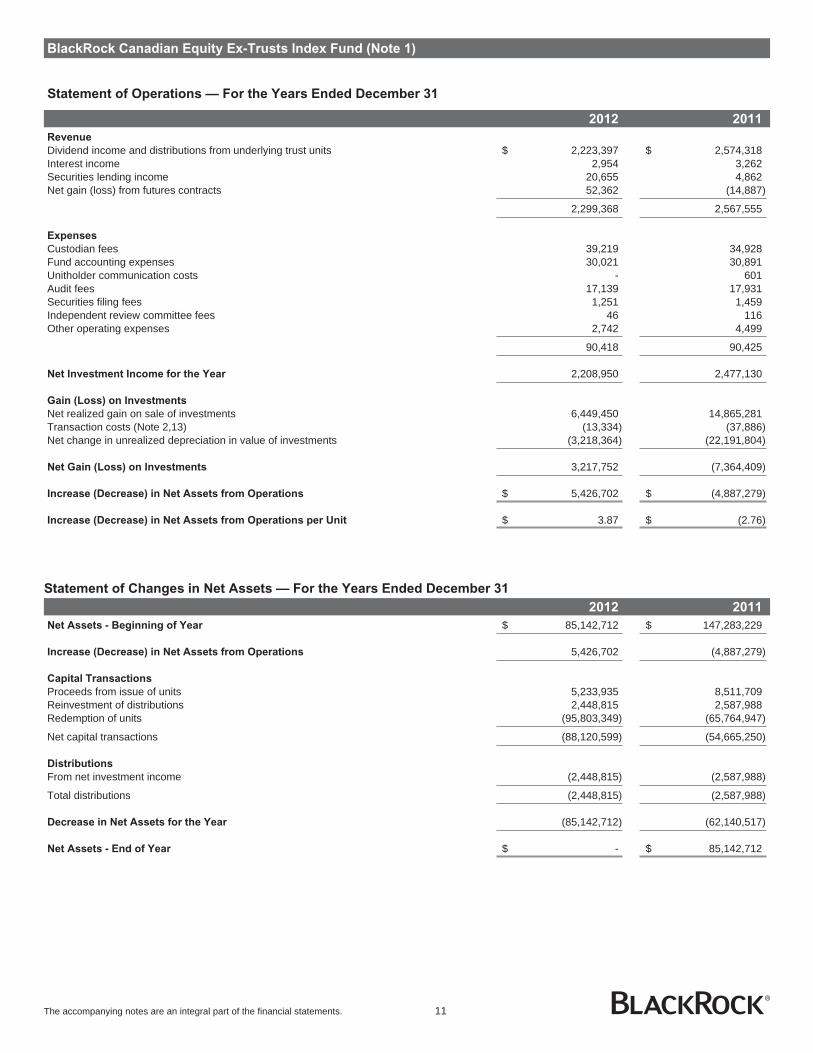
BlackRock Canadian Equity Ex-Trusts Index Fund (Note 1)
Statement of Operations — For the Years Ended December 31
2012 2011
Revenue
Dividend income and distributions from underlying trust units $ 2,223,397 $ 2,574,318Interest income 2,954 3,262Securities lending income 20,655 4,862Net gain (loss) from futures contracts 52,362 (14,887)
2,299,368 2,567,555
Expenses
Custodian fees 39,219 34,928Fund accounting expenses 30,021 30,891Unitholder communication costs - 601Audit fees 17,139 17,931Securities filing fees 1,251 1,459Independent review committee fees 46 116Other operating expenses 2,742 4,499
90,418 90,425
Net Investment Income for the Year 2,208,950 2,477,130
Gain (Loss) on Investments
Net realized gain on sale of investments 6,449,450 14,865,281Transaction costs (Note 2,13) (13,334) (37,886)Net change in unrealized depreciation in value of investments (3,218,364) (22,191,804)
Net Gain (Loss) on Investments 3,217,752 (7,364,409)
Increase (Decrease) in Net Assets from Operations $ 5,426,702 $ (4,887,279)
Increase (Decrease) in Net Assets from Operations per Unit $ 3.87 $ (2.76)
Statement of Changes in Net Assets — For the Years Ended December 31
2012 2011
Net Assets - Beginning of Year $ 85,142,712 $ 147,283,229
Increase (Decrease) in Net Assets from Operations 5,426,702 (4,887,279)
Capital Transactions
Proceeds from issue of units 5,233,935 8,511,709Reinvestment of distributions 2,448,815 2,587,988Redemption of units (95,803,349) (65,764,947)
Net capital transactions (88,120,599) (54,665,250)
Distributions
From net investment income (2,448,815) (2,587,988)
Total distributions (2,448,815) (2,587,988)
Decrease in Net Assets for the Year (85,142,712) (62,140,517)
Net Assets - End of Year $ - $ 85,142,712
The accompanying notes are an integral part of the financial statements. 11

BlackRock CDN MSCI Canada IMI Index Fund
Statement of Net Assets — As at December 31
2012 2011
Assets
Investments - at fair value (Note 2) $ 1,126,581,432 $ 955,247,430Cash 11,723,603 2,383,994Margin due from brokers 932,117 868,223Securities lending income receivable 23,892 4,804Dividends and distributions from underlying trust units receivable 3,394,365 2,517,979Accounts receivable from issue of units 7,610 8,002,050Accounts receivable for investment sales 22,104,693 17,861,974
1,164,767,712 986,886,454
Liabilities
Operating expenses payable 31,551 28,416Payables for redemption of units 26,666,000 23,991,000Payables for investment purchases 413,100 145,994
27,110,651 24,165,410
Net Assets $ 1,137,657,061 $ 962,721,044
Number of Units Issued and Outstanding (Note 8) 101,453,485 91,420,665
Net Assets per Unit $ 11.21 $ 10.53
Investments at Cost $ 1,093,597,521 $ 962,105,221
Approved by BlackRock Asset Management Canada Limited,Manager of the Funds
Eric Léveillé, Director Noel Archard, Director
The accompanying notes are an integral part of the financial statements. 12

BlackRock CDN MSCI Canada IMI Index Fund
Statement of Operations — For the Years Ended December 31
2012 2011
Revenue
Dividend income and distributions from underlying trust units $ 30,286,481 $ 28,438,219Interest income 50,132 26,087Securities lending income 271,028 73,588Net gain (loss) from futures contracts 626,263 (74,342)Foreign exchange gain 7,201 17,342
31,241,105 28,480,894
Expenses
Custodian fees 63,307 75,272Fund accounting expenses 53,031 57,808Unitholder communication costs - 601Audit fees 14,121 15,291Securities filing fees 18,075 21,541Independent review committee fees 504 1,200Other operating expenses 5,623 7,599
154,661 179,312
Net Investment Income for the Year 31,086,444 28,301,582
Gain (Loss) on Investments
Net realized gain on sale of investments 2,502,278 43,299,051Transaction costs (Note 2,13) (48,264) (115,906)Net change in unrealized appreciation (depreciation) in value of investments 39,841,702 (184,957,888)
Net Gain (Loss) on Investments 42,295,716 (141,774,743)
Increase (Decrease) in Net Assets from Operations $ 73,382,160 $ (113,473,161)
Increase (Decrease) in Net Assets from Operations per Unit $ 0.74 $ (1.11)
Statement of Changes in Net Assets — For the Years Ended December 31
2012 2011
Net Assets - Beginning of Year $ 962,721,044 $ 1,338,597,379
Increase (Decrease) in Net Assets from Operations 73,382,160 (113,473,161)
Capital Transactions
Proceeds from issue of units 198,501,422 178,385,476Reinvestment of distributions 40,773,535 73,415,163Redemption of units (96,947,565) (440,788,650)
Net capital transactions 142,327,392 (188,988,011)
Distributions
From net investment income (30,209,951) (28,298,605)From capital gains (10,563,584) (45,116,558)
Total distributions (40,773,535) (73,415,163)
Increase (Decrease) in Net Assets for the Year 174,936,017 (375,876,335)
Net Assets - End of Year $ 1,137,657,061 $ 962,721,044
The accompanying notes are an integral part of the financial statements. 13
BlackRock CDN MSCI Canada IMI Index Fund
Statement of Investment Portfolio — As at December 31, 2012
Security Holdings
Average
cost
Fair
value
(in $000s) (in $000s)
Canadian Common Stocks and
Income Trusts
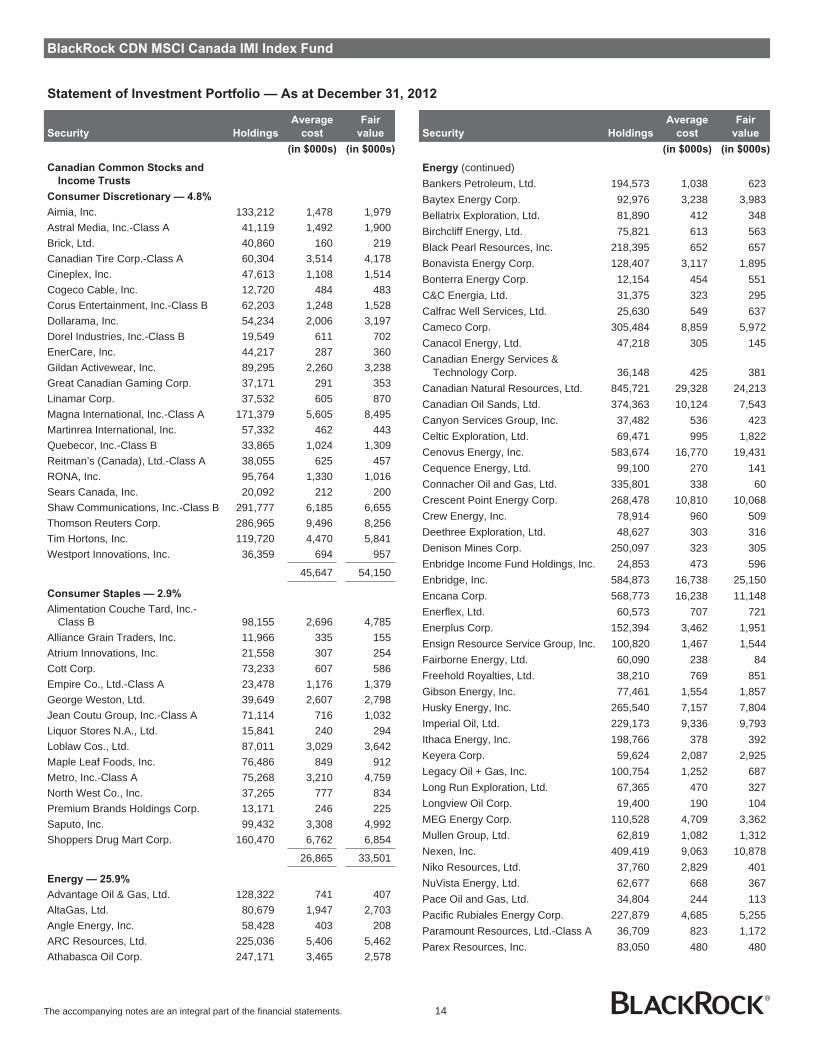
Consumer Discretionary — 4.8%
Aimia, Inc. 133,212 1,478 1,979Astral Media, Inc.-Class A 41,119 1,492 1,900Brick, Ltd. 40,860 160 219Canadian Tire Corp.-Class A 60,304 3,514 4,178Cineplex, Inc. 47,613 1,108 1,514Cogeco Cable, Inc. 12,720 484 483Corus Entertainment, Inc.-Class B 62,203 1,248 1,528Dollarama, Inc. 54,234 2,006 3,197Dorel Industries, Inc.-Class B 19,549 611 702EnerCare, Inc. 44,217 287 360Gildan Activewear, Inc. 89,295 2,260 3,238Great Canadian Gaming Corp. 37,171 291 353Linamar Corp. 37,532 605 870Magna International, Inc.-Class A 171,379 5,605 8,495Martinrea International, Inc. 57,332 462 443Quebecor, Inc.-Class B 33,865 1,024 1,309Reitman’s (Canada), Ltd.-Class A 38,055 625 457RONA, Inc. 95,764 1,330 1,016Sears Canada, Inc. 20,092 212 200Shaw Communications, Inc.-Class B 291,777 6,185 6,655Thomson Reuters Corp. 286,965 9,496 8,256Tim Hortons, Inc. 119,720 4,470 5,841Westport Innovations, Inc. 36,359 694 957
45,647 54,150
Consumer Staples — 2.9%
Alimentation Couche Tard, Inc.-Class B 98,155 2,696 4,785
Alliance Grain Traders, Inc. 11,966 335 155Atrium Innovations, Inc. 21,558 307 254Cott Corp. 73,233 607 586Empire Co., Ltd.-Class A 23,478 1,176 1,379George Weston, Ltd. 39,649 2,607 2,798Jean Coutu Group, Inc.-Class A 71,114 716 1,032Liquor Stores N.A., Ltd. 15,841 240 294Loblaw Cos., Ltd. 87,011 3,029 3,642Maple Leaf Foods, Inc. 76,486 849 912Metro, Inc.-Class A 75,268 3,210 4,759North West Co., Inc. 37,265 777 834Premium Brands Holdings Corp. 13,171 246 225Saputo, Inc. 99,432 3,308 4,992Shoppers Drug Mart Corp. 160,470 6,762 6,854
26,865 33,501
Energy — 25.9%
Advantage Oil & Gas, Ltd. 128,322 741 407AltaGas, Ltd. 80,679 1,947 2,703Angle Energy, Inc. 58,428 403 208ARC Resources, Ltd. 225,036 5,406 5,462Athabasca Oil Corp. 247,171 3,465 2,578
Security Holdings
Average
cost
Fair
value
(in $000s) (in $000s)
Energy (continued)Bankers Petroleum, Ltd. 194,573 1,038 623Baytex Energy Corp. 92,976 3,238 3,983Bellatrix Exploration, Ltd. 81,890 412 348Birchcliff Energy, Ltd. 75,821 613 563Black Pearl Resources, Inc. 218,395 652 657Bonavista Energy Corp. 128,407 3,117 1,895Bonterra Energy Corp. 12,154 454 551C&C Energia, Ltd. 31,375 323 295Calfrac Well Services, Ltd. 25,630 549 637Cameco Corp. 305,484 8,859 5,972Canacol Energy, Ltd. 47,218 305 145Canadian Energy Services &
Technology Corp. 36,148 425 381Canadian Natural Resources, Ltd. 845,721 29,328 24,213Canadian Oil Sands, Ltd. 374,363 10,124 7,543Canyon Services Group, Inc. 37,482 536 423Celtic Exploration, Ltd. 69,471 995 1,822Cenovus Energy, Inc. 583,674 16,770 19,431Cequence Energy, Ltd. 99,100 270 141Connacher Oil and Gas, Ltd. 335,801 338 60Crescent Point Energy Corp. 268,478 10,810 10,068Crew Energy, Inc. 78,914 960 509Deethree Exploration, Ltd. 48,627 303 316Denison Mines Corp. 250,097 323 305Enbridge Income Fund Holdings, Inc. 24,853 473 596Enbridge, Inc. 584,873 16,738 25,150Encana Corp. 568,773 16,238 11,148Enerflex, Ltd. 60,573 707 721Enerplus Corp. 152,394 3,462 1,951Ensign Resource Service Group, Inc. 100,820 1,467 1,544Fairborne Energy, Ltd. 60,090 238 84Freehold Royalties, Ltd. 38,210 769 851Gibson Energy, Inc. 77,461 1,554 1,857Husky Energy, Inc. 265,540 7,157 7,804Imperial Oil, Ltd. 229,173 9,336 9,793Ithaca Energy, Inc. 198,766 378 392Keyera Corp. 59,624 2,087 2,925Legacy Oil + Gas, Inc. 100,754 1,252 687Long Run Exploration, Ltd. 67,365 470 327Longview Oil Corp. 19,400 190 104MEG Energy Corp. 110,528 4,709 3,362Mullen Group, Ltd. 62,819 1,082 1,312Nexen, Inc. 409,419 9,063 10,878Niko Resources, Ltd. 37,760 2,829 401NuVista Energy, Ltd. 62,677 668 367Pace Oil and Gas, Ltd. 34,804 244 113Pacific Rubiales Energy Corp. 227,879 4,685 5,255Paramount Resources, Ltd.-Class A 36,709 823 1,172Parex Resources, Inc. 83,050 480 480
The accompanying notes are an integral part of the financial statements. 14
BlackRock CDN MSCI Canada IMI Index Fund
Statement of Investment Portfolio — As at December 31, 2012
Security Holdings
Average
cost
Fair
value
(in $000s) (in $000s)
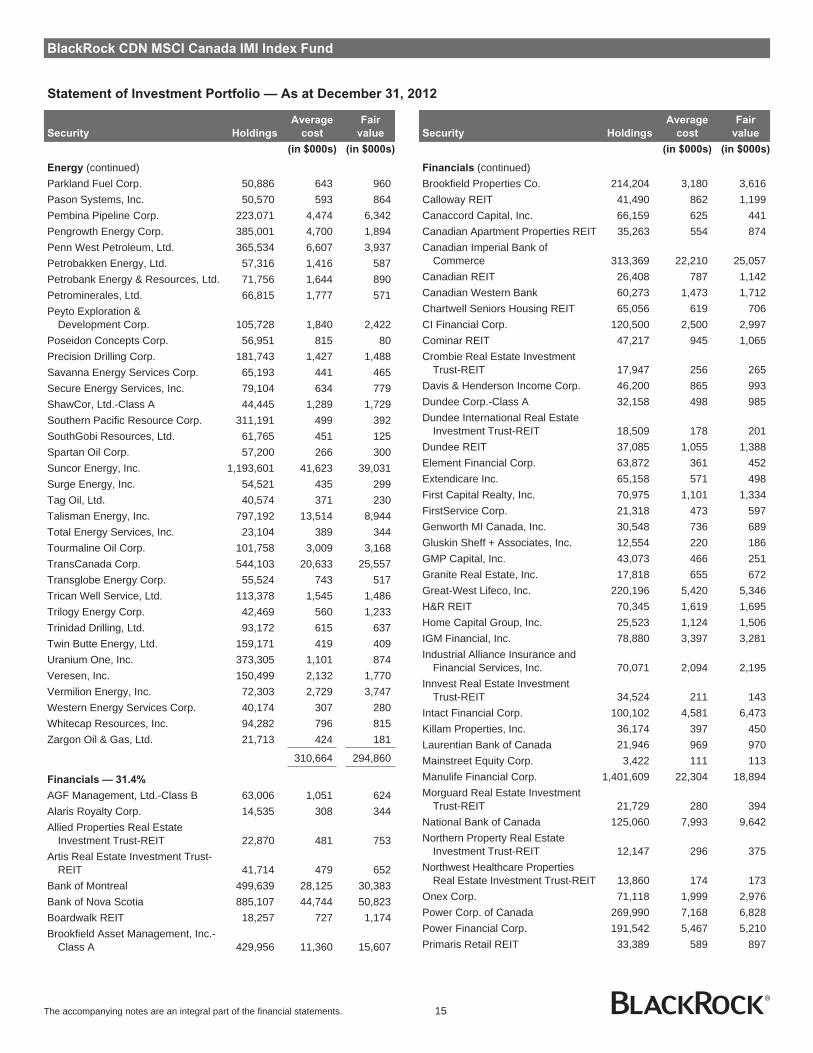
Energy (continued)Parkland Fuel Corp. 50,886 643 960Pason Systems, Inc. 50,570 593 864Pembina Pipeline Corp. 223,071 4,474 6,342Pengrowth Energy Corp. 385,001 4,700 1,894Penn West Petroleum, Ltd. 365,534 6,607 3,937Petrobakken Energy, Ltd. 57,316 1,416 587Petrobank Energy & Resources, Ltd. 71,756 1,644 890Petrominerales, Ltd. 66,815 1,777 571Peyto Exploration &
Development Corp. 105,728 1,840 2,422Poseidon Concepts Corp. 56,951 815 80Precision Drilling Corp. 181,743 1,427 1,488Savanna Energy Services Corp. 65,193 441 465Secure Energy Services, Inc. 79,104 634 779ShawCor, Ltd.-Class A 44,445 1,289 1,729Southern Pacific Resource Corp. 311,191 499 392SouthGobi Resources, Ltd. 61,765 451 125Spartan Oil Corp. 57,200 266 300Suncor Energy, Inc. 1,193,601 41,623 39,031Surge Energy, Inc. 54,521 435 299Tag Oil, Ltd. 40,574 371 230Talisman Energy, Inc. 797,192 13,514 8,944Total Energy Services, Inc. 23,104 389 344Tourmaline Oil Corp. 101,758 3,009 3,168TransCanada Corp. 544,103 20,633 25,557Transglobe Energy Corp. 55,524 743 517Trican Well Service, Ltd. 113,378 1,545 1,486Trilogy Energy Corp. 42,469 560 1,233Trinidad Drilling, Ltd. 93,172 615 637Twin Butte Energy, Ltd. 159,171 419 409Uranium One, Inc. 373,305 1,101 874Veresen, Inc. 150,499 2,132 1,770Vermilion Energy, Inc. 72,303 2,729 3,747Western Energy Services Corp. 40,174 307 280Whitecap Resources, Inc. 94,282 796 815Zargon Oil & Gas, Ltd. 21,713 424 181
310,664 294,860
Financials — 31.4%
AGF Management, Ltd.-Class B 63,006 1,051 624Alaris Royalty Corp. 14,535 308 344Allied Properties Real Estate
Investment Trust-REIT 22,870 481 753Artis Real Estate Investment Trust-
REIT 41,714 479 652Bank of Montreal 499,639 28,125 30,383Bank of Nova Scotia 885,107 44,744 50,823Boardwalk REIT 18,257 727 1,174Brookfield Asset Management, Inc.-
Class A 429,956 11,360 15,607
Security Holdings
Average
cost
Fair
value
(in $000s) (in $000s)
Financials (continued)Brookfield Properties Co. 214,204 3,180 3,616Calloway REIT 41,490 862 1,199Canaccord Capital, Inc. 66,159 625 441Canadian Apartment Properties REIT 35,263 554 874Canadian Imperial Bank of
Commerce 313,369 22,210 25,057Canadian REIT 26,408 787 1,142Canadian Western Bank 60,273 1,473 1,712Chartwell Seniors Housing REIT 65,056 619 706CI Financial Corp. 120,500 2,500 2,997Cominar REIT 47,217 945 1,065Crombie Real Estate Investment
Trust-REIT 17,947 256 265Davis & Henderson Income Corp. 46,200 865 993Dundee Corp.-Class A 32,158 498 985Dundee International Real Estate
Investment Trust-REIT 18,509 178 201Dundee REIT 37,085 1,055 1,388Element Financial Corp. 63,872 361 452Extendicare Inc. 65,158 571 498First Capital Realty, Inc. 70,975 1,101 1,334FirstService Corp. 21,318 473 597Genworth MI Canada, Inc. 30,548 736 689Gluskin Sheff + Associates, Inc. 12,554 220 186GMP Capital, Inc. 43,073 466 251Granite Real Estate, Inc. 17,818 655 672Great-West Lifeco, Inc. 220,196 5,420 5,346H&R REIT 70,345 1,619 1,695Home Capital Group, Inc. 25,523 1,124 1,506IGM Financial, Inc. 78,880 3,397 3,281Industrial Alliance Insurance and
Financial Services, Inc. 70,071 2,094 2,195Innvest Real Estate Investment
Trust-REIT 34,524 211 143Intact Financial Corp. 100,102 4,581 6,473Killam Properties, Inc. 36,174 397 450Laurentian Bank of Canada 21,946 969 970Mainstreet Equity Corp. 3,422 111 113Manulife Financial Corp. 1,401,609 22,304 18,894Morguard Real Estate Investment
Trust-REIT 21,729 280 394National Bank of Canada 125,060 7,993 9,642Northern Property Real Estate
Investment Trust-REIT 12,147 296 375Northwest Healthcare Properties
Real Estate Investment Trust-REIT 13,860 174 173Onex Corp. 71,118 1,999 2,976Power Corp. of Canada 269,990 7,168 6,828Power Financial Corp. 191,542 5,467 5,210Primaris Retail REIT 33,389 589 897
The accompanying notes are an integral part of the financial statements. 15

BlackRock CDN MSCI Canada IMI Index Fund
Statement of Investment Portfolio — As at December 31, 2012
Security Holdings
Average
cost
Fair
value
(in $000s) (in $000s)
Financials (continued)RioCan REIT 109,347 2,145 3,007Royal Bank of Canada 1,115,364 60,562 66,710Sprott, Inc. 40,270 196 158Sun Life Financial, Inc. 458,877 12,264 12,087TMX Group, Ltd. 14,814 664 751Toronto-Dominion Bank 705,759 49,960 59,037Uranium Participation Corp. 81,626 504 440
320,953 357,431
Health Care — 1.9%
Catamaran Corp. 158,243 5,180 7,379CML HealthCare, Inc. 69,170 810 459Leisureworld Senior Care Corp. 22,316 274 279Medical Facilities Corp. 21,615 301 298Paladin Labs, Inc. 10,140 284 421Valeant Pharmaceuticals
International, Inc. 222,964 6,733 13,208
13,582 22,044
Industrials — 6.4%
AG Growth International, Inc. 9,580 334 299Alexco Resource Corp. 44,877 349 159ATS Automation Tooling Systems,
Inc. 67,326 488 589Bird Construction, Inc. 30,714 368 405Black Diamond Group, Ltd. 28,237 645 565Bombardier, Inc.-Class B 1,113,276 4,964 4,175CAE, Inc. 200,157 1,837 2,014Canadian National Railway Co. 335,799 21,904 30,319Canadian Pacific Railway, Ltd. 132,612 8,259 13,363Churchill Corp. 16,408 278 143Exchange Income Corp. 2,883 82 74Finning International, Inc. 132,889 2,517 3,264Genivar, Inc. 27,542 772 543Morneau Shepell, Inc. 34,807 367 441Newalta, Inc. 38,191 405 591Progressive Waste Solutions, Ltd. 88,953 1,720 1,907Ritchie Bros. Auctioneers, Inc. 70,086 1,626 1,449Russel Metals, Inc. 46,573 915 1,283SNC-Lavalin Group, Inc. 116,730 5,552 4,701Stantec, Inc. 35,425 1,035 1,402Student Transportation, Inc. 52,915 354 323Superior Plus, Inc. 87,054 1,013 889Toromont Industries, Ltd. 59,078 996 1,242Transcontinental, Inc.-Class A 50,713 613 563TransForce, Inc. 59,629 615 1,183Wajax Corp. 13,039 463 529Westshore Terminals Investment
Corp. 28,341 839 778
59,310 73,193
Security Holdings
Average
cost
Fair
value
(in $000s) (in $000s)
Information Technology — 1.4%
5N Plus, Inc. 44,397 234 117Celestica, Inc. 126,964 1,093 1,023CGI Group, Inc.-Class A 157,660 2,506 3,613EXFO, Inc. 19,137 89 100MacDonald Dettwiler & Associates,
Ltd. 24,656 1,093 1,379Open Text Corp. 45,171 2,036 2,502Otsuka Corp. 299,778 2,910 2,383Research In Motion, Ltd. 364,614 18,474 4,295Sandvine Corp. 110,443 164 145Sierra Wireless, Inc. 20,992 199 165Wi-Lan, Inc. 93,326 452 422
29,250 16,144
Materials — 19.6%
Aecon Group, Inc. 42,925 569 455Agnico-Eagle Mines, Ltd. 132,254 7,809 6,880Agrium, Inc. 115,344 8,240 11,435Alacer Gold Corp. 175,527 1,220 909Alamos Gold, Inc. 92,777 1,360 1,615Argonaut Gold, Inc. 97,672 766 920Augusta Resource Corp. 70,710 260 169Aurizon Mines, Ltd. 126,292 686 431Avalon Rare Metals, Inc. 77,177 386 105B2Gold Corp. 270,308 633 954Banro Corp. 156,609 589 432Barrick Gold Corp. 772,778 33,956 26,823Belo Sun Mining Corp. 203,641 350 324Canexus Corp. 97,370 831 823Canfor Corp. 72,373 637 1,199Canfor Pulp Products, Inc. 27,205 474 276Capstone Mining Corp. 233,516 648 560Cascades, Inc. 52,166 391 213Centerra Gold, Inc. 128,195 1,580 1,188China Gold International Resources
Corp., Ltd. 119,486 510 406Colossus Minerals, Inc. 81,161 556 371Continental Gold, Ltd. 70,190 621 615Copper Mountain Mining Corp. 74,483 527 291Detour Gold Corp. 87,149 2,024 2,169Dundee Precious Metals, Inc. 76,750 694 648Eastern Platinum, Ltd. 735,128 700 118Eldorado Gold Corp. 523,357 7,478 6,683Endeavour Mining Corp. 300,535 751 613Endeavour Silver Corp. 77,026 749 602First Majestic Silver Corp. 89,281 1,218 1,784First Quantum Minerals, Ltd. 367,990 6,273 8,044Fortress Paper, Ltd. 9,721 325 78Fortuna Silver Mines, Inc. 93,633 481 389Franco-Nevada Corp. 112,005 3,849 6,355
The accompanying notes are an integral part of the financial statements. 16

BlackRock CDN MSCI Canada IMI Index Fund
Statement of Investment Portfolio — As at December 31, 2012
Security Holdings
Average
cost
Fair
value
(in $000s) (in $000s)
Materials (continued)Gabriel Resources, Ltd. 218,121 831 506Gammon Gold, Inc. 218,179 2,166 1,769Goldcorp, Inc. 626,069 27,498 22,776Golden Star Resources, Ltd. 204,245 684 362Great Basin Gold, Ltd. 452,439 699 -Guyana Goldfields, Inc. 72,276 467 225Harry Winston Diamond Corp. 58,698 691 815Hudbay Minerals, Inc. 133,179 1,714 1,332Iamgold Corp. 290,792 5,079 3,303Imperial Metals Corp. 34,138 327 411Inmet Mining Corp. 40,227 2,378 2,977International Tower Hill Mines, Ltd. 62,521 388 134Katanga Mining, Ltd. 432,675 406 251Keegan Resources, Inc. 59,861 460 235Kinross Gold Corp. 880,165 13,017 8,450Kirkland Lake Gold, Inc. 48,645 516 283Lake Shore Gold Corp. 305,430 895 226Lundin Mining Corp. 405,872 1,845 2,066MAG Silver Corp. 34,056 256 346Major Drilling Group International 60,998 649 595Methanex Corp. 72,577 1,697 2,293Midas Gold Corp. 55,617 168 122Nevsun Resources, Ltd. 153,067 615 646New Gold, Inc. 357,129 2,319 3,914NGEx Resources, Inc. 107,476 314 358Norbord, Inc. 17,254 239 520North American Palladium, Ltd. 121,589 408 157Northern Dynasty Minerals, Ltd. 53,610 396 167Novagold Resources, Inc. 170,824 1,248 764OceanaGold Corp. 212,079 607 594Orbite Aluminae, Inc. 138,242 390 339Pan American Silver Corp. 117,697 2,763 2,188Potash Corp. of Saskatchewan 663,634 28,618 26,798Premier Gold Mines, Ltd. 116,862 755 490Pretium Resources, Inc. 56,385 716 739Primero Mining Corp. 51,938 338 331Queenston Mining, Inc. 54,129 262 262Rainy River Resources, Ltd. 69,213 310 343Romarco Minerals, Inc. 447,463 759 331Rubicon Minerals Corp. 216,625 867 548Sabina Gold & Silver Corp. 113,670 575 299San Gold Corp. 243,950 650 185Seabridge Gold, Inc. 24,986 664 444SEMAFO, Inc. 208,227 1,140 708Sherritt International Corp. 231,312 1,382 1,314Silver Standard Resources, Inc. 62,988 1,308 927Silver Wheaton Corp. 273,374 5,940 9,781Silvercorp Metals, Inc. 130,397 943 659Sino-Forest Corp.-Class A 184,987 3,360 -
Security Holdings
Average
cost
Fair
value
(in $000s) (in $000s)
Materials (continued)Sprott Resource Corp. 69,740 295 302Tahoe Resources, Inc. 66,793 1,079 1,214Tanzanian Royalty Exploration Corp. 72,741 293 314Taseko Mines, Ltd. 148,011 585 444Teck Resources, Ltd. 445,383 17,202 16,056Thompson Creek Metals Co., Inc. 128,433 1,185 528Timmins Gold Corp. 98,493 317 294Torex Gold Resources, Inc. 458,889 830 996Turquoise Hill Resources, Ltd. 309,808 4,155 2,324Veris Gold Corp. 50,360 387 86West Fraser Timber Co., Ltd. 26,359 1,031 1,845Yamana Gold, Inc. 580,003 7,829 9,883
244,046 222,446
Telecommunication Services — 2.9%
BCE, Inc. 197,293 6,214 8,405Bell Aliant, Inc. 58,200 1,653 1,532Manitoba Telecom Services, Inc. 51,208 1,689 1,662Rogers Communications, Inc.-
Class B 295,566 9,822 13,342TELUS Corp. 116,508 4,643 7,525
24,021 32,466
Utilities — 1.8%
Algonquin Power & Utilities Corp. 115,576 557 789Alterra Power Corp. 242,532 248 102Atco, Ltd.-Class I 29,435 1,545 2,363Atlantic Power Corp. 93,155 1,227 1,054Boralex, Inc. 15,473 127 140Canadian Utilities, Ltd.-Class A 43,886 2,155 3,145Capital Power Corp. 53,617 1,243 1,219Capstone Infrastructure Corp. 55,675 362 224Fortis, Inc. 146,812 4,378 5,011Innergex Renewable Energy, Inc. 72,641 669 749Just Energy Group, Inc. 108,593 1,497 1,030Northland Power, Inc. 61,807 933 1,153TransAlta Corp. 192,654 3,957 2,907Valener, Inc. 28,784 457 460
19,355 20,346
Total Canadian Common Stocks
and Income Trusts 1,093,693 1,126,581
Transaction Costs (Note 2) (95)
Total Investments 1,093,598 1,126,581
Other Assets and Liabilities — 1.0% 11,076
Net Assets 1,137,657
The accompanying notes are an integral part of the financial statements. 17

BlackRock CDN MSCI Canada IMI Index Fund
Statement of Investment Portfolio — As at December 31, 2012
Portfolio Concentration
(as a percentage of Net Assets)
Portfolio by Category
As at
December 31, 2012
As at
December 31, 2011
(%) (%)
Consumer Discretionary 4.8 4.1Consumer Staples 2.9 3.0Energy 25.9 27.6Financials 31.4 28.9Health Care 1.9 1.1Industrials 6.4 6.0Information Technology 1.4 1.8Materials 19.6 21.9Telecommunication
Services 2.9 2.9Utilities 1.8 1.9Other Assets and Liabilities 1.0 0.8
Open futures contracts held by the Fund as at December 31, 2012 areshown in Note 4.
The accompanying notes are an integral part of the financial statements. 18

BlackRock CDN US Equity Index Non-Taxable Fund
Statement of Net Assets — As at December 31
2012 2011
Assets
Investments - at fair value* (Note 2) $ 4,244,818,475 $ 3,592,084,972Cash 44,300,178 76,784,504Margin due from brokers 1,600,964 -Securities lending income receivable 8,725 897Dividends receivable 4,981,513 5,428,233Tax reclaim on dividends receivable 224,991 72,836Accounts receivable from issue of units 23,853,860 23,796,644Accounts receivable for investment sales 628,146 575,901
4,320,416,852 3,698,743,987
Liabilities
Margin due to brokers - 313,471Operating expenses payable 80,592 64,224Payables for redemption of units 3,860,223 12,353,838
3,940,815 12,731,533
Net Assets $ 4,316,476,037 $ 3,686,012,454
Net Assets per Class
Class A $ 3,510,671,630 $ 3,193,175,920Class D 805,804,407 492,836,534
$ 4,316,476,037 $ 3,686,012,454
Number of Units Issued and Outstanding (Note 8)
Class A 349,733,290 360,962,356Class D 46,073,247 31,974,733
Net Assets per Unit
Class A $ 10.04 $ 8.85Class D $ 17.49 $ 15.41
Investments at Cost* $ 3,820,184,551 $ 3,542,311,735
* Includes short-term investments
Approved by BlackRock Asset Management Canada Limited,Manager of the Funds
Eric Léveillé, Director Noel Archard, Director
The accompanying notes are an integral part of the financial statements. 19

BlackRock CDN US Equity Index Non-Taxable Fund
Statement of Operations — For the Years Ended December 31
2012 2011
Revenue
Dividend income $ 98,435,908 $ 83,032,459Interest income* 111,810 17,268Securities lending income 53,222 127,964Net gain from futures contracts 11,992,253 1,088,797Foreign exchange gain (loss) (56,514) 3,099,768Withholding taxes (52,312) -
110,484,367 87,366,256
Expenses
Custodian fees 193,543 197,125Fund accounting expenses 122,097 116,300Unitholder communication costs 2,316 601Audit fees 23,307 25,363Securities filing fees 68,256 86,788Independent review committee fees 1,738 4,107Other operating expenses 11,985 8,775
423,242 439,059
Net Investment Income for the Year 110,061,125 86,927,197
Gain on Investments
Net realized gain on sale of investments 15,939,543 2,892,351Transaction costs (Note 2,13) (92,950) (85,433)Net change in unrealized appreciation in value of investments 374,767,568 89,208,217
Net Gain on Investments 390,614,161 92,015,135
Increase in Net Assets from Operations $ 500,675,286 $ 178,942,332
Increase in Net Assets from Operations per Class
Class A $ 425,113,511 $ 156,934,996Class D 75,561,775 22,007,336
$ 500,675,286 $ 178,942,332
Increase in Net Assets from Operations per Unit
Class A $ 1.20 $ 0.43Class D $ 1.94 $ 0.77
* Interest Income, net of foreign exchange loss
The accompanying notes are an integral part of the financial statements. 20
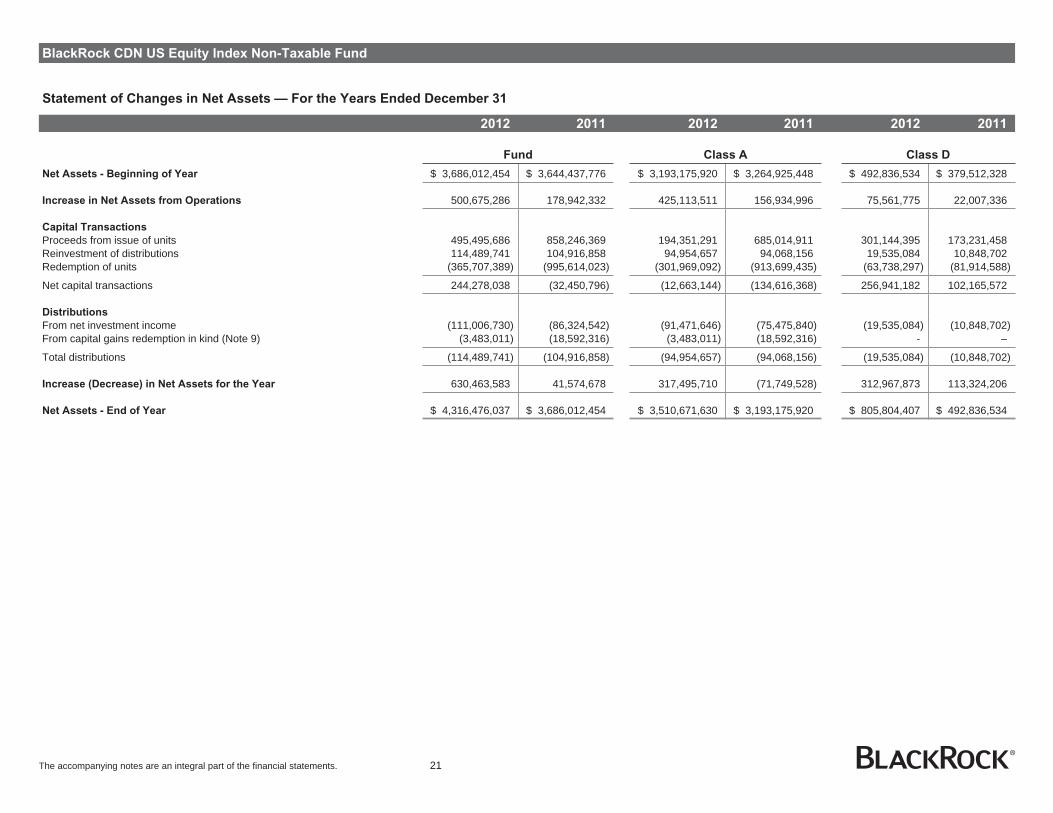
BlackRock CDN US Equity Index Non-Taxable Fund
Statement of Changes in Net Assets — For the Years Ended December 31
2012 2011 2012 2011 2012 2011
Fund Class A Class D
Net Assets - Beginning of Year $ 3,686,012,454 $ 3,644,437,776 $ 3,193,175,920 $ 3,264,925,448 $ 492,836,534 $ 379,512,328
Increase in Net Assets from Operations 500,675,286 178,942,332 425,113,511 156,934,996 75,561,775 22,007,336
Capital Transactions
Proceeds from issue of units 495,495,686 858,246,369 194,351,291 685,014,911 301,144,395 173,231,458Reinvestment of distributions 114,489,741 104,916,858 94,954,657 94,068,156 19,535,084 10,848,702Redemption of units (365,707,389) (995,614,023) (301,969,092) (913,699,435) (63,738,297) (81,914,588)
Net capital transactions 244,278,038 (32,450,796) (12,663,144) (134,616,368) 256,941,182 102,165,572
Distributions
From net investment income (111,006,730) (86,324,542) (91,471,646) (75,475,840) (19,535,084) (10,848,702)From capital gains redemption in kind (Note 9) (3,483,011) (18,592,316) (3,483,011) (18,592,316) - –
Total distributions (114,489,741) (104,916,858) (94,954,657) (94,068,156) (19,535,084) (10,848,702)
Increase (Decrease) in Net Assets for the Year 630,463,583 41,574,678 317,495,710 (71,749,528) 312,967,873 113,324,206
Net Assets - End of Year $ 4,316,476,037 $ 3,686,012,454 $ 3,510,671,630 $ 3,193,175,920 $ 805,804,407 $ 492,836,534
The accompanying notes are an integral part of the financial statements. 21

BlackRock CDN US Equity Index Non-Taxable Fund
Statement of Investment Portfolio — As at December 31, 2012
Security
Par value
(000s)/
Holdings
Average
cost
Fair
value
(in $000s) (in $000s)
Short Term Investments
Government Guaranteed — 0.2%
U.S. Treasury Bill1.00% March 21, 2013 8,665 8,558 8,627
8,558 8,627
Total Short Term Investments 8,558 8,627
Common Stocks
Consumer Discretionary — 11.5%
Abercrombie & Fitch Co.-Class A 26,951 1,522 1,287Amazon.Com, Inc. 120,995 14,196 30,272Apollo Group, Inc.-Class A 33,686 2,112 702AutoNation, Inc. 13,063 295 516AutoZone, Inc. 12,329 2,958 4,352Beam, Inc. 53,110 3,206 3,230Bed Bath & Beyond, Inc. 76,510 3,225 4,257Best Buy Co., Inc. 89,081 3,547 1,050Big Lots, Inc. 19,529 503 553BorgWarner, Inc. 39,063 2,561 2,786Cablevision Systems-NY Group A 71,969 2,358 1,071CarMax, Inc. 76,371 1,920 2,855Carnival Corp. 148,847 5,811 5,448CBS Corp.-Class B 197,280 4,034 7,474Chipotle Mexican Grill, Inc. 10,513 2,758 3,109Coach, Inc. 94,707 3,721 5,236Comcast Corp.-Class A 887,264 19,441 33,023D.R. Horton, Inc. 93,180 1,774 1,833Darden Restaurants, Inc. 42,917 1,682 1,926Delphi Automotive PLC 98,579 3,544 3,753DIRECTV 204,276 6,988 10,205Discovery Communications-Class A 80,354 2,841 5,079Dollar General Corp. 87,655 4,345 3,850Dollar Tree, Inc. 75,836 3,263 3,063Electrolux AB-Class B 103,259 3,354 1,493Expedia, Inc. 31,054 1,515 1,900Family Dollar Stores, Inc. 31,965 1,180 2,018Ford Motor Co. 1,272,994 13,404 16,414Fossil, Inc. 18,025 2,330 1,671GameStop Corp.-Class A 40,337 1,510 1,007Gannett Co., Inc. 76,664 2,487 1,374Gap (The), Inc. 99,214 2,121 3,064Garmin, Ltd. 36,428 1,522 1,480Genuine Parts Co. 51,782 2,466 3,277Goodyear Tire & Rubber Co. (The) 81,702 1,400 1,123H&R Block, Inc. 90,523 1,937 1,673Harley-Davidson, Inc. 75,526 2,988 3,674Harman International Industries, Inc. 22,622 1,230 1,005Hasbro, Inc. 38,578 1,328 1,378Home Depot, Inc. 499,241 18,449 30,745International Game Technology 88,767 2,069 1,252
Security
Par value
(000s)/
Holdings
Average
cost
Fair
value
(in $000s) (in $000s)
Consumer Discretionary (continued)Interpublic Group of Cos., Inc. 143,937 1,621 1,581JC Penney Co., Inc. 47,524 1,830 933Johnson Controls, Inc. 228,288 6,645 6,972Kohl’s Corp. 70,631 3,914 3,023Leggett & Platt, Inc. 47,130 1,070 1,278Lennar Corp.-Class A 54,784 1,609 2,109Lowe’s Cos., Inc. 375,510 10,087 13,281Ltd. Brands 79,897 1,981 3,744Macy’s, Inc. 131,956 3,347 5,127Marriott International, Inc.-Class A 82,295 2,661 3,054Mattel, Inc. 114,544 2,643 4,175McDonald’s Corp. 335,228 21,356 29,453McGraw-Hill Cos. (The), Inc. 92,706 3,872 5,046NetFlix, Inc. 18,535 3,128 1,711Newell Rubbermaid, Inc. 95,977 1,959 2,128News Corp.-Class A 673,220 10,741 17,113Nike, Inc.-Class B 243,698 8,028 12,521Nordstrom, Inc. 50,755 1,776 2,704O’Reilly Automotive, Inc. 38,676 1,851 3,444Omnicom Group 88,190 3,878 4,388PetSmart, Inc. 35,870 2,381 2,441Priceline.Com, Inc. 16,649 4,787 10,297Pulte Homes, Inc. 113,450 2,318 2,051Ralph Lauren Corp. 20,459 1,934 3,054Ross Stores, Inc. 74,233 2,030 4,002Scripps Networks Interactive-
Class A 29,001 1,242 1,673Sherwin-Williams Co. (The) 28,568 1,969 4,375Staples, Inc. 224,912 4,985 2,551Starbucks Corp. 248,276 6,724 13,260Starwood Hotels & Resorts
Worldwide, Inc. 65,418 3,142 3,736Target Corp. 217,289 11,499 12,800Tiffany & Co. 39,771 1,845 2,271Time Warner Cable 100,754 5,857 9,753Time Warner, Inc. 316,143 12,971 15,056TJX Cos., Inc. 243,478 4,666 10,291Tripadvisor, Inc. 36,570 1,161 1,526Urban Outfitters, Inc. 36,511 1,192 1,431VF Corp. 29,419 2,454 4,422Viacom, Inc.-Class B 154,111 7,407 8,094Walt Disney Co. (The) 591,712 20,047 29,329Washington Post Co. (The)-Class B 1,511 863 548Whirlpool Corp. 25,985 2,015 2,634Wyndham Worldwide Corp. 46,814 1,200 2,480Wynn Resorts, Ltd. 26,522 2,086 2,968Yum! Brands, Inc. 150,847 5,876 9,976
366,543 496,282
The accompanying notes are an integral part of the financial statements. 22

BlackRock CDN US Equity Index Non-Taxable Fund
Statement of Investment Portfolio — As at December 31, 2012
Security
Par value
(000s)/
Holdings
Average
cost
Fair
value
(in $000s) (in $000s)
Consumer Staples — 10.3%
Altria Group, Inc. 676,172 14,678 21,161Archer-Daniels-Midland Co. 219,860 7,000 5,994Avon Products, Inc. 144,220 4,426 2,064Brown-Forman Corp.-Class B 50,590 2,061 3,184Campbell Soup Co. 59,809 2,157 2,077Clorox Co. 43,549 2,872 3,175Coca-Cola Co. (The) 1,287,951 38,404 46,513Coca-Cola Ent., Inc. 90,080 2,112 2,847Colgate-Palmolive Co. 148,291 11,532 15,439ConAgra Foods, Inc. 136,040 3,331 3,996Constellation Brands, Inc.-Class A 50,535 1,156 1,781Costco Wholesale Corp. 144,380 9,401 14,205CVS Caremark Corp. 416,263 14,740 20,048Dean Foods Co. 61,778 1,342 1,015Dr Pepper Snapple Group, Inc. 69,464 2,072 3,055Estee Lauder Cos. (The), Inc.-Class A 80,139 2,493 4,776General Mills, Inc. 215,419 7,378 8,668Hershey Co. (The) 49,919 2,527 3,590HJ Heinz Co. 107,052 5,094 6,149Hormel Foods Corp. 44,728 972 1,389JM Smucker Co. (The) 36,204 2,072 3,109Kellogg Co. 82,558 4,321 4,591Kimberly-Clark Corp. 130,641 8,898 10,979Kraft Foods Group, Inc. 197,786 6,496 8,951Kroger Co. (The) 177,115 4,580 4,589Lorillard, Inc. 43,213 3,587 5,019McCormick & Co., Inc. 44,230 1,825 2,796Mead Johnson Nutrition Co.-Class A 67,774 3,440 4,446Molson Coors Brewing Co.-Class B 52,010 2,502 2,215Mondelez International, Inc. 593,346 12,407 15,053Monster Beverage Corp. 49,812 3,518 2,623PepsiCo, Inc. 516,498 34,201 35,197Philip Morris International, Inc. 557,806 29,457 46,460Procter & Gamble Co. (The) 912,979 59,300 61,734Reynolds American, Inc. 108,222 3,103 4,463Safeway, Inc. 79,937 2,266 1,439Sysco Corp. 196,237 6,071 6,186Tyson Foods, Inc.-Class A 95,775 1,560 1,850Wal-Mart Stores, Inc. 558,493 32,586 37,959Walgreen Co. 286,829 11,428 10,576Whole Foods Market, Inc. 57,600 3,144 5,237
372,510 446,598
Energy — 10.8%
Anadarko Petroleum Corp. 166,860 9,904 12,348Apache Corp. 130,640 12,293 10,208Baker Hughes, Inc. 146,774 8,116 5,970Cabot Oil & Gas Corp. 70,044 1,826 3,470
Security
Par value
(000s)/
Holdings
Average
cost
Fair
value
(in $000s) (in $000s)
Energy (continued)Cameron International Corp. 82,360 3,532 4,629Chesapeake Energy Corp. 173,041 5,093 2,862Chevron Corp. 653,518 55,233 70,420ConocoPhillips 405,315 20,184 23,411Consol Energy, Inc. 76,023 3,494 2,430Denbury Resources, Inc. 129,147 2,315 2,083Devon Energy Corp. 125,746 9,146 6,516Diamond Offshore Drilling, Inc. 23,195 1,837 1,570Ensco PLC-Class A 77,543 4,391 4,575EOG Resources, Inc. 90,441 8,230 10,876Exxon Mobil Corp. 1,522,413 117,166 131,274FMC Technologies, Inc. 79,352 2,393 3,382Halliburton Co. 309,832 10,271 10,705Helmerich & Payne, Inc. 35,283 1,646 1,968Hess Corp. 99,198 6,393 5,229Kinder Morgan, Inc. 211,130 7,034 7,427Marathon Oil Corp. 235,843 8,880 7,197Marathon Petroleum Corp. 113,238 4,535 7,102Murphy Oil Corp. 61,628 3,912 3,654Nabors Industries, Ltd. 96,880 2,487 1,394National Oilwell Varco, Inc. 142,532 7,400 9,703Newfield Exploration Company 45,108 3,021 1,203Noble Corp. 84,353 3,168 2,924Noble Energy, Inc. 59,389 4,539 6,016NRG Energy, Inc. 107,562 2,527 2,461Occidental Petroleum Corp. 270,516 19,673 20,635Peabody Energy Corp. 89,571 4,155 2,374Phillips 66 208,942 6,691 11,045Pioneer Natural Resources Co. 41,138 2,540 4,367QEP Resources, Inc. 59,435 1,969 1,791Range Resources Corp. 54,285 2,791 3,396Rowan Cos. PLC 41,432 1,328 1,290Schlumberger, Ltd. 443,277 29,677 30,583Southwestern Energy Co. 116,644 4,866 3,879Spectra Energy Corp. 222,282 5,537 6,058Tesoro Corp. 46,865 1,336 2,055Valero Energy Corp. 184,799 6,141 6,274Williams Cos., Inc. 224,962 5,950 7,331WPX Energy, Inc. 66,432 1,194 984
424,814 465,069
Financials — 16.6%
Aflac, Inc. 156,552 7,752 8,279Allstate Corp. (The) 160,842 6,669 6,433American Express Co. 325,072 14,613 18,605American International Group, Inc. 492,924 37,339 17,325American Tower Corp. REIT 131,998 5,976 10,152Ameriprise Financial, Inc. 68,768 2,935 4,288AON PLC 106,386 4,771 5,890
The accompanying notes are an integral part of the financial statements. 23

BlackRock CDN US Equity Index Non-Taxable Fund
Statement of Investment Portfolio — As at December 31, 2012
Security
Par value
(000s)/
Holdings
Average
cost
Fair
value
(in $000s) (in $000s)
Financials (continued)Apartment Investment &
Management Co. REIT-Class A 48,553 1,226 1,308Assurant, Inc. 26,486 1,186 915Australia & New Zealand Banking
Group, Ltd. 74,996 2,483 2,638AvalonBay Communities, Inc. REIT 38,185 4,363 5,154Bank of America Corp. 3,598,838 74,128 41,603Bank of New York Mellon Corp. 390,167 13,549 9,988BB&T Corp. 233,578 7,488 6,770Berkshire Hathaway, Inc.-Class B 609,064 49,331 54,447BlackRock, Inc. 41,626 7,820 8,568Boston Properties, Inc. REIT 50,364 4,325 5,306Capital One Financial Corp. 194,212 9,908 11,204CBRE Group, Inc. 100,680 1,887 1,996Charles Schwab Corp. (The) 366,078 6,649 5,234Chubb Corp. 87,451 4,867 6,558Cincinnati Financial Corp. 48,860 1,810 1,904Citigroup, Inc. 979,178 67,297 38,589CME Group, Inc. 102,393 7,627 5,168Comerica, Inc. 63,530 2,534 1,918Discover Financial Services 168,520 3,133 6,469E*Trade Financial Corp. 85,826 1,989 764Equity Residential REIT 107,411 4,770 6,058Fifth Third Bancorp 299,238 5,437 4,529First Horizon National Corp. 82,805 1,238 817Franklin Resources, Inc. 46,068 4,601 5,766Genworth Financial, Inc.-Class A 164,060 2,967 1,227Goldman Sachs Group, Inc. 147,496 21,974 18,742Hartford Financial Services
Group, Inc. 145,635 5,617 3,254HCP, Inc. 150,924 5,121 6,786Health Care, Inc. REIT 86,691 4,118 5,290Host Hotels & Resorts, Inc. REIT 241,926 4,051 3,775Hudson City Bancorp, Inc. 158,583 2,218 1,281Huntington Bancshares, Inc. 285,463 2,442 1,816IntercontinentalExchange, Inc. 24,273 3,016 2,991Invesco, Ltd. 148,225 3,348 3,849JPMorgan Chase & Co. 1,269,312 54,190 55,597Keycorp 311,612 3,761 2,612Kimco Realty Corp. REIT 136,048 2,852 2,617Legg Mason, Inc. 39,259 2,142 1,005Leucadia National Corp. 66,101 2,169 1,565Lincoln National Corp. 91,785 3,253 2,366Loews Corp. 103,799 3,888 4,212M&T Bank Corp. 40,594 3,529 3,979Marsh & McLennan Cos., Inc. 181,743 5,696 6,236Merck & Co., Inc. 1,015,092 39,511 41,389Metlife, Inc. 364,278 15,613 11,944Moody’s Corp. 64,730 2,396 3,243
Security
Par value
(000s)/
Holdings
Average
cost
Fair
value
(in $000s) (in $000s)
Financials (continued)Morgan Stanley 461,412 15,564 8,784NASDAQ OMX Group, Inc. 39,298 1,187 979Northern Trust Corp. 72,841 4,402 3,637NYSE Euronext 81,103 4,026 2,546People’s United Financial, Inc. 115,977 2,069 1,396Plum Creek Timber Co., Inc. REIT 53,925 2,095 2,381PNC Financial Services Group, Inc. 172,235 12,721 10,000Principal Financial Group 92,107 3,153 2,616Progressive Corp. (The) 185,722 3,950 3,902ProLogis, Inc. REIT 153,870 5,962 5,591Prudential Financial, Inc. 154,913 9,012 8,224Public Storage, Inc. REIT 48,137 4,622 6,948Regions Financial Corp. 471,647 5,226 3,344Simon Property Group, Inc. REIT 103,288 9,328 16,259SLM Corp. 154,247 3,346 2,632State Street Corp. 155,712 8,306 7,289SunTrust Banks, Inc. 179,880 6,719 5,076T Rowe Price Group, Inc. 85,085 4,264 5,517Torchmark Corp. 31,675 1,189 1,629Travelers Cos. (The), Inc. 127,355 6,822 9,107U.S. Bancorp 627,843 17,753 19,967Unum Group 91,809 2,125 1,902Ventas, Inc. REIT 98,671 4,500 6,357Visa, Inc.-Class A 174,068 16,170 26,253Vornado Realty Trust-REIT 56,547 4,608 4,508Wells Fargo & Co. 1,634,730 60,278 55,684XL Group PLC 100,326 2,804 2,502Zions Bancorporation 61,444 2,030 1,310
787,804 716,759
Health Care — 11.0%
Abbott Laboratories 527,788 29,304 34,427Accenture PLC-Class A 213,194 12,690 14,116Aetna, Inc. 111,698 4,042 5,150Alexion Pharmaceuticals 64,862 6,210 6,053Allergan, Inc. 102,677 6,497 9,374AmerisourceBergen Corp. 82,049 2,212 3,528Amgen, Inc. 256,217 16,929 22,029Baxter International, Inc. 183,427 10,217 12,175Becton Dickinson & Co. 65,752 4,956 5,120Biogen Idec, Inc. 78,995 5,180 11,531Boston Scientific Corp. 460,472 5,711 2,623Bristol-Myers Squibb Co. 551,150 16,214 17,896Cardinal Health, Inc. 113,427 4,638 4,651CareFusion Corp. 74,058 2,166 2,107Celgene Corp. 141,226 8,354 11,060Cerner Corp. 48,679 2,343 3,763Cigna Corp. 95,440 3,616 5,078Coventry Health Care, Inc. 44,885 1,634 2,003
The accompanying notes are an integral part of the financial statements. 24

BlackRock CDN US Equity Index Non-Taxable Fund
Statement of Investment Portfolio — As at December 31, 2012
Security
Par value
(000s)/
Holdings
Average
cost
Fair
value
(in $000s) (in $000s)
Health Care (continued)Covidien PLC 158,050 7,984 9,085CR Bard, Inc. 25,549 2,184 2,486DaVita, Inc. 27,979 1,804 3,078DENTSPLY International, Inc. 47,362 1,678 1,867Edwards Lifesciences Corp. 38,524 3,242 3,457Eli Lilly & Co. 340,967 16,732 16,744Express Scripts Holding Co. 272,585 15,281 14,651Forest Laboratories, Inc. 78,133 2,924 2,748Gilead Sciences, Inc. 252,972 11,104 18,511Hospira, Inc. 55,131 2,505 1,714Humana, Inc. 52,921 2,732 3,616Intuitive Surgical, Inc. 13,275 3,925 6,477Johnson & Johnson 925,345 62,401 64,588Laboratory Corp. of America
Holdings 31,574 2,382 2,722Life Technologies Corp. 57,428 2,296 2,808McKesson Corp. 78,805 4,921 7,609Medtronic, Inc. 337,677 15,719 13,792Mylan, Inc. 136,035 2,706 3,721Patterson Cos., Inc. 27,758 907 946PerkinElmer, Inc. 38,288 937 1,210Perrigo Co. 29,456 2,999 3,050Pfizer, Inc. 2,458,415 56,134 61,416Quest Diagnostics, Inc. 53,061 2,976 3,077St. Jude Medical, Inc. 102,871 4,391 3,703Stryker Corp. 96,464 5,102 5,264Tenet Healthcare Corp. 35,517 1,115 1,148Thermo Fisher Scientific, Inc. 120,262 5,723 7,640UnitedHealth Group, Inc. 341,068 14,024 18,420Varian Medical Systems, Inc. 36,514 1,972 2,553Waters Corp. 29,022 1,815 2,518Watson Pharmaceuticals, Inc. 42,646 1,981 3,651WellPoint, Inc. 101,375 6,439 6,150Zimmer Holdings, Inc. 57,917 3,586 3,842
415,534 476,946
Industrials — 10.0%
3M Co. 212,549 17,451 19,650ACE Aviation Holdings, Inc. 113,452 6,789 9,013ADT Corp. 77,597 2,771 3,593Avery Dennison Corp. 33,302 1,516 1,158Boeing Co. 226,601 15,504 17,010C.H. Robinson Worldwide, Inc. 53,805 3,397 3,387Caterpillar, Inc. 218,344 15,360 19,484Cintas Corp. 35,579 1,279 1,448CSX Corp. 344,329 5,513 6,761Cummins, Inc. 59,012 3,345 6,366Danaher Corp. 194,269 7,794 10,817Deere & Co. 130,769 7,697 11,252Dover Corp. 59,815 2,943 3,917
Security
Par value
(000s)/
Holdings
Average
cost
Fair
value
(in $000s) (in $000s)
Industrials (continued)Dun & Bradstreet Corp. 14,866 1,314 1,164Eaton Corp. PLC 154,168 7,895 8,320Emerson Electric Co. 241,777 11,382 12,754Equifax, Inc. 39,913 1,458 2,151Expeditors International of
Washington, Inc. 69,751 3,131 2,746Fastenal Co. 90,014 2,477 4,184FedEx Corp. 97,524 8,549 8,908Flowserve Corp. 16,648 1,578 2,433Fluor Corp. 55,579 3,053 3,253General Dynamics Corp. 110,804 7,682 7,642General Electric Co. 3,501,459 89,496 73,145Honeywell International, Inc. 261,560 12,474 16,532Illinois Tool Works, Inc. 142,352 6,920 8,621Ingersoll-Rand PLC 93,523 3,983 4,466Iron Mountain, Inc. 55,660 1,619 1,720Jacobs Engineering Group, Inc. 43,406 2,538 1,840Joy Global, Inc. 35,335 3,160 2,244L-3 Communications Holdings, Inc. 31,409 2,664 2,395Lockheed Martin Corp. 89,669 7,551 8,243Masco Corp. 119,166 2,297 1,978Norfolk Southern Corp. 105,512 5,743 6,495Northrop Grumman Corp. 81,939 5,127 5,514Paccar, Inc. 117,855 4,850 5,303Pall Corp. 37,707 1,496 2,262Parker Hannifin Corp. 49,800 3,182 4,218Pentair, Ltd. 70,194 3,058 3,435Pitney Bowes, Inc. 66,922 2,231 709Precision Castparts Corp. 48,591 5,900 9,161Quanta Services, Inc. 71,132 1,736 1,932Raytheon Co. 110,126 5,746 6,312Republic Services, Inc. 99,818 2,859 2,916Robert Half International, Inc. 46,955 1,448 1,487Rockwell Automation, Inc. 46,503 2,748 3,889Rockwell Collins, Inc. 46,798 2,542 2,710Roper Industries, Inc. 32,843 2,174 3,644Ryder System, Inc. 17,066 775 848Snap-On, Inc. 19,429 937 1,528Southwest Airlines Co. 246,303 3,184 2,511Stanley Black & Decker, Inc. 56,344 3,190 4,150Stericycle, Inc. 28,667 2,091 2,661Textron, Inc. 94,055 2,658 2,320Union Pacific Corp. 157,063 10,756 19,661United Parcel Service, Inc.-Class B 238,902 17,322 17,541United Technologies Corp. 281,549 19,199 22,991W.W. Grainger, Inc. 19,951 2,180 4,020Waste Management, Inc. 145,572 5,220 4,889Xylem, Inc. 61,993 1,641 1,672
392,573 433,374
The accompanying notes are an integral part of the financial statements. 25

BlackRock CDN US Equity Index Non-Taxable Fund
Statement of Investment Portfolio — As at December 31, 2012
Security
Par value
(000s)/
Holdings
Average
cost
Fair
value
(in $000s) (in $000s)
Information Technology — 17.8%
Adobe Systems, Inc. 165,273 5,592 6,199Advanced Micro Devices, Inc. 201,547 2,214 482Agilent Technologies, Inc. 116,320 4,130 4,743Akamai Technologies, Inc. 59,230 2,246 2,412Altera Corp. 107,008 3,030 3,671Amphenol Corp.-Class A 53,522 2,275 3,448Analog Devices, Inc. 100,599 3,592 4,212Apple, Inc. 314,108 68,791 166,706Applied Materials, Inc. 402,354 6,708 4,579Automatic Data Processing, Inc. 162,085 7,823 9,199BMC Software, Inc. 47,776 1,733 1,886Broadcom Corp.-Class A 173,224 6,059 5,726CA, Inc. 112,066 2,895 2,451Cisco Systems, Inc. 1,772,769 41,110 34,685Citrix Systems, Inc. 62,328 2,892 4,080Cognizant Technology Solutions
Corp.-Class A 100,222 4,859 7,388Computer Sciences Corp. 51,849 2,617 2,068Corning, Inc. 493,374 9,702 6,195Dell, Inc. 487,164 10,430 4,914eBay, Inc. 388,848 11,774 19,758EMC Corp. Massachusetts 703,393 14,460 17,726F5 Networks, Inc. 26,384 3,393 2,550Fidelity National Information
Services, Inc. 83,183 2,257 2,884First Solar, Inc. 20,067 2,616 617Fiserv, Inc. 44,553 2,353 3,506Flir Systems, Inc. 50,321 1,624 1,118Google, Inc.-Class A 88,874 46,608 62,764Harris Corp. 37,895 1,750 1,847Hewlett-Packard Co. 656,442 26,614 9,308Intel Corp. 1,661,495 39,171 34,129International Business Machines Corp. 354,656 45,409 67,649Intuit, Inc. 92,905 3,557 5,503Jabil Circuit, Inc. 62,399 1,206 1,198JDS Uniphase Corp. 78,026 2,345 1,050Juniper Networks, Inc. 171,723 4,482 3,365KLA-Tencor Corp. 55,577 2,393 2,643Lam Research Corp. 59,378 1,978 2,135Linear Technology Corp. 77,229 2,697 2,636LSI Corp. 184,719 1,425 1,302MasterCard, Inc.-Class A 35,681 9,732 17,467Microchip Technology, Inc. 64,943 2,172 2,107Micron Technology, Inc. 339,594 3,398 2,140Microsoft Corp. 2,529,289 72,841 67,292Molex, Inc. 46,090 1,226 1,253Motorola Solutions, Inc. 93,640 4,847 5,191NetApp, Inc. 119,600 4,159 3,995NVIDIA Corp. 208,548 3,300 2,552
Security
Par value
(000s)/
Holdings
Average
cost
Fair
value
(in $000s) (in $000s)
Information Technology (continued)Oracle Corp. 1,255,099 30,059 41,640Paychex, Inc. 107,975 3,779 3,347QUALCOMM, Inc. 568,979 27,441 35,136Red Hat, Inc. 64,531 2,069 3,402SAIC, Inc. 94,642 1,723 1,066Salesforce.Com, Inc. 43,616 3,955 7,296SanDisk Corp. 80,709 3,253 3,499Seagate Technology PLC 115,007 2,901 3,490Symantec Corp. 231,637 4,748 4,341TE Connectivity, Ltd. 141,070 4,870 5,214Teradata Corp. 56,445 1,898 3,477Teradyne, Inc. 62,653 986 1,054Texas Instruments, Inc. 374,212 11,504 11,532Total System Services, Inc. 53,597 1,125 1,143VeriSign, Inc. 51,810 1,518 2,003Western Digital Corp. 73,179 2,407 3,096Western Union Co. 199,115 3,896 2,698Xerox Corp. 425,227 4,702 2,888Xilinx, Inc. 87,092 2,626 3,112Yahoo!, Inc. 347,463 7,471 6,881
631,416 767,044
Materials — 3.7%
Air Products & Chemicals, Inc. 71,059 5,578 5,946Airgas, Inc. 23,458 1,360 2,132Alcoa, Inc. 356,210 6,709 3,075Allegheny Technologies, Inc. 35,793 1,804 1,082Ball Corp. 51,346 1,381 2,287Bemis Co. 34,453 1,053 1,148CF Industries Holdings, Inc. 20,988 2,487 4,244Cliffs Natural Resources, Inc. 47,547 2,705 1,826Dow Chemical Co. (The) 400,402 12,952 12,889Eastman Chemical Co. 51,193 1,819 3,470Ecolab, Inc. 88,009 4,408 6,300EI Du Pont de Nemours & Co. 311,338 13,964 13,944FMC Corp. 45,857 1,484 2,671Freeport-McMoran Copper & Gold,
Inc. 316,954 11,585 10,793International Flavors & Fragrances,
Inc. 27,218 1,274 1,803International Paper Co. 146,605 4,249 5,816LyondellBasell Industries-Class A 126,738 6,012 7,207MeadWestvaco Corp. 58,329 1,576 1,851Monsanto Co. 178,497 12,648 16,822Mosaic Co. 92,364 5,399 5,208Newmont Mining Corp. 165,738 8,546 7,664Nucor Corp. 106,036 4,944 4,557Owens-Illinois, Inc. 54,881 1,699 1,161PPG Industries, Inc. 51,197 3,686 6,899
The accompanying notes are an integral part of the financial statements. 26

BlackRock CDN US Equity Index Non-Taxable Fund
Statement of Investment Portfolio — As at December 31, 2012
Security
Par value
(000s)/
Holdings
Average
cost
Fair
value
(in $000s) (in $000s)
Materials (continued)Praxair, Inc. 99,203 7,982 10,805Sealed Air Corp. 64,879 1,456 1,131Sigma-Aldrich Corp. 40,162 2,123 2,942Tyco International, Ltd. 155,467 6,271 4,525United States Steel Corp. 48,127 2,551 1,143Vulcan Materials Co. 43,251 2,641 2,241Weyerhaeuser Co. 180,782 5,217 5,010
147,563 158,592
Telecommunication Services — 3.0%
AT&T, Inc. 1,896,593 62,436 63,678CenturyTel, Inc. 208,419 8,649 8,118Crown Castle International Corp. 97,873 5,426 7,031Frontier Communications Corp. 333,113 3,247 1,423MetroPCS Communications, Inc. 105,649 1,429 1,046Sprint Nextel Corp. 1,003,054 10,560 5,653Verizon Communications, Inc. 952,935 35,801 41,047Windstream Corp. 196,244 2,347 1,622
129,895 129,618
Utilities — 3.4%
AES Corp. (The) 206,075 3,252 2,196AGL Resources, Inc. 39,299 1,602 1,563Ameren Corp. 80,980 3,105 2,478American Electric Power Co., Inc. 162,003 6,270 6,883Centerpoint Energy, Inc. 142,666 2,445 2,733CMS Energy Corp. 88,072 1,546 2,137Consolidated Edison, Inc. 97,773 4,860 5,405Dominion Resources, Inc. 191,847 8,349 9,895DTE Energy Co. 57,438 2,735 3,434Duke Energy Corp. 235,138 13,086 14,935Edison International 108,766 4,437 4,893Entergy Corp. 59,329 4,928 3,765EQT Corp. 49,937 2,095 2,932Exelon Corp. 285,215 15,079 8,443FirstEnergy Corp. 139,618 7,194 5,803FPL Group, Inc. 141,297 8,033 9,732Integrys Energy Group, Inc. 25,992 1,319 1,351NiSource, Inc. 103,382 2,089 2,561Northeast Utilities 104,799 3,349 4,077ONEOK, Inc. 68,295 1,808 2,906Pepco Holdings, Inc. 76,561 1,551 1,495PG&E Corp. 143,548 6,262 5,743Pinnacle West Capital Corp. 36,607 1,557 1,857
Security
Par value
(000s)/
Holdings
Average
cost
Fair
value
(in $000s) (in $000s)
Utilities (continued)PPL Corp. 194,197 6,082 5,534Public Service Enterprise Group, Inc. 168,892 5,924 5,144Scana Corp. 43,981 1,852 1,999Sempra Energy 75,088 4,048 5,302Southern Co. (The) 291,848 11,355 12,437TECO Energy, Inc. 67,908 1,234 1,133Wisconsin Energy Corp. 76,791 2,104 2,817Xcel Energy, Inc. 162,778 3,820 4,326
143,370 145,909
Total Common Stocks 3,812,022 4,236,191
Transaction Costs (Note 2) (395)
Total Investments 3,820,185 4,244,818
Other Assets and Liabilities — 1.7% 71,658
Net Assets 4,316,476
Portfolio Concentration
(as a percentage of Net Assets)
Portfolio by Category
As at
December 31, 2012
As at
December 31, 2011
(%) (%)
Government Guaranteed 0.2 0.2Consumer Discretionary 11.5 10.6Consumer Staples 10.3 11.2Energy 10.8 11.9Financials 16.6 14.3Health Care 11.0 10.7Industrials 10.0 10.4Information Technology 17.8 17.7Materials 3.7 3.6Telecommunication Services 3.0 3.1Utilities 3.4 3.8Other Assets and Liabilities 1.7 2.5
Open futures contracts held by the Fund as at December 31, 2012 areshown in Note 4.
The accompanying notes are an integral part of the financial statements. 27

BlackRock CDN US Equity Index Plus Non-Taxable Fund
Statement of Net Assets — As at December 31
2012 2011
Assets
Investments - at fair value* (Note 2) $ 263,530,267 $ 182,882,718Cash 1,906,875 2,793,417Margin due from brokers 65,338 -Dividends receivable 284,361 275,415Tax reclaim on dividends receivable 12,217 3,921Accounts receivable for investment sales 2,934,285 28,798
268,733,343 185,984,269
Liabilities
Margin due to brokers - 12,301Operating expenses payable 26,647 16,599Payables for investment purchases 2,958,277 28,471
2,984,924 57,371
Net Assets $ 265,748,419 $ 185,926,898
Number of Units Issued and Outstanding (Note 8) 20,276,150 16,082,557
Net Assets per Unit $ 13.11 $ 11.56
Investments at Cost* $ 232,486,041 $ 167,600,596
* Includes short-term investments
Approved by BlackRock Asset Management Canada Limited,Manager of the Funds
Eric Léveillé, Director Noel Archard, Director
The accompanying notes are an integral part of the financial statements. 28

BlackRock CDN US Equity Index Plus Non-Taxable Fund
Statement of Operations — For the Years Ended December 31
2012 2011
Revenue
Dividend income $ 5,247,437 $ 4,392,833Interest income* 2,206 (5,450)Net gain from futures contracts 587,891 284,779Foreign exchange gain (loss) (143,755) 114,384Withholding taxes (5,258) -
5,688,521 4,786,546
Expenses
Custodian fees 45,064 36,015Fund accounting expenses 36,136 33,018Unitholder communication costs - 601Audit fees 9,262 9,656Securities filing fees 3,674 2,727Independent review committee fees 106 217Other operating expenses 3,956 5,655
98,198 87,889
Net Investment Income for the Year 5,590,323 4,698,657
Gain on Investments
Net realized gain on sale of investments 4,349,458 14,376,295Transaction costs (Note 2,13) (29,613) (47,249)Net change in unrealized appreciation (depreciation) in value of investments 15,758,335 (6,869,404)
Net Gain on Investments 20,078,180 7,459,642
Increase in Net Assets from Operations $ 25,668,503 $ 12,158,299
Increase in Net Assets from Operations per Unit $ 1.52 $ 0.71
* Interest Income, net of foreign exchange loss
Statement of Changes in Net Assets — For the Years Ended December 31
2012 2011
Net Assets - Beginning of Year $ 185,926,898 $ 285,018,902
Increase in Net Assets from Operations 25,668,503 12,158,299
Capital Transactions
Proceeds from issue of units 54,153,018 16,000,000Reinvestment of distributions 11,941,285 20,385,981Redemption of units - (127,250,303)
Net capital transactions 66,094,303 (90,864,322)
Distributions
From net investment income (5,537,480) (4,773,049)From capital gains (6,403,805) (15,612,932)
Total distributions (11,941,285) (20,385,981)
Increase (Decrease) in Net Assets for the Year 79,821,521 (99,092,004)
Net Assets - End of Year $ 265,748,419 $ 185,926,898
The accompanying notes are an integral part of the financial statements. 29

BlackRock CDN US Equity Index Plus Non-Taxable Fund
Statement of Investment Portfolio — As at December 31, 2012
Security
Par value
(000s)/
Holdings
Average
cost
Fair
value
(in $000s) (in $000s)
Short Term Investments
Government Guaranteed — 0.1%
U.S. Treasury Bill1.00% March 21, 2013 300 296 298
296 298
Total Short Term Investments 296 298
Common Stocks
Consumer Discretionary — 11.8%
Abercrombie & Fitch Co.-Class A 1,690 67 81Amazon.Com, Inc. 7,471 1,351 1,869Apollo Group, Inc.-Class A 6 - -AutoNation, Inc. 820 22 32AutoZone, Inc. 766 269 270Beam, Inc. 3,318 181 202Bed Bath & Beyond, Inc. 4,744 244 264Best Buy Co., Inc. 62 2 1Big Lots, Inc. 7 - -BorgWarner, Inc. 2,413 158 172Brookdale Senior Living, Inc. 1,310 33 33Cablevision Systems-NY Group A 200 6 3CarMax, Inc. 5,525 159 207Carnival Corp. 9,137 329 334CBS Corp.-Class B 12,111 266 459Chipotle Mexican Grill, Inc. 648 171 192Cinemark Holdings, Inc. 1,270 33 33Coach, Inc. 5,828 269 322Comcast Corp.-Class A 29,069 813 1,082Comcast Corp.-Special Class A 26,484 891 948D.R. Horton, Inc. 5,674 77 112Darden Restaurants, Inc. 2,620 121 118Delphi Automotive PLC 6,089 219 232Dick’s Sporting Goods, Inc. 1,070 48 48Dillard’s, Inc.-Class A 400 33 33DIRECTV 12,455 594 622Discovery Communications-Class A 4,966 231 314Dollar General Corp. 5,432 267 239Dollar Tree, Inc. 4,706 211 190Electrolux AB-Class B 6,108 89 88Expedia, Inc. 3,623 193 222Family Dollar Stores, Inc. 1,981 116 125Ford Motor Co. 78,434 1,020 1,011Fossil, Inc. 1,118 135 104GameStop Corp.-Class A 2,535 57 63Gannett Co., Inc. 4,726 74 85Gap (The), Inc. 6,092 159 188Garmin, Ltd. 2,242 94 91Genuine Parts Co. 3,169 159 201Goodyear Tire & Rubber Co. (The) 4,996 62 69H&R Block, Inc. 5,553 91 103
Security
Par value
(000s)/
Holdings
Average
cost
Fair
value
(in $000s) (in $000s)
Consumer Discretionary (continued)Hanesbrands, Inc. 910 32 32Harley-Davidson, Inc. 4,656 157 226Harman International Industries, Inc. 1,445 52 64Hasbro, Inc. 2,367 97 85Home Depot, Inc. 31,398 1,305 1,934International Game Technology 5,514 98 78Interpublic Group of Cos., Inc. 8,927 82 98JC Penney Co., Inc. 7 - -Johnson Controls, Inc. 14,157 428 432Kohl’s Corp. 2,931 147 125Leggett & Platt, Inc. 2,871 69 78Lennar Corp.-Class A 3,331 89 128Liberty Media Corp. 280 32 32LKQ Corp. 1,530 32 32Lowe’s Cos., Inc. 24,172 657 855Ltd. Brands 7,058 284 331Macy’s, Inc. 8,082 206 314Marriott International, Inc.-Class A 5,144 186 191Mattel, Inc. 7,100 186 259McDonald’s Corp. 20,670 1,592 1,816McGraw-Hill Cos. (The), Inc. 8,225 405 448Mohawk Industries, Inc. 360 32 32NetFlix, Inc. 1,134 150 105Newell Rubbermaid, Inc. 7,381 139 164News Corp.-Class A 41,465 786 1,054Nike, Inc.-Class B 14,994 656 770Nordstrom, Inc. 3,120 132 166O’Reilly Automotive, Inc. 2,335 152 208Omnicom Group 5,427 230 270Penn National Gaming, Inc. 660 32 32PetSmart, Inc. 2,210 148 150Priceline.Com, Inc. 1,027 400 635Pulte Homes, Inc. 6,898 91 125PVH Corp. 290 32 32Ralph Lauren Corp. 1,248 139 186Ross Stores, Inc. 4,575 168 247Royal Caribbean Cruises, Ltd. 960 32 32Scripps Networks Interactive-Class A 1,765 87 102Service Corp. International 2,330 32 32Sherwin-Williams Co. (The) 1,775 188 272Staples, Inc. 13,940 282 158Starbucks Corp. 15,331 587 819Starwood Hotels & Resorts
Worldwide, Inc. 4,014 203 229Target Corp. 13,375 761 788Thor Industries, Inc. 670 25 25Tiffany & Co. 2,432 121 139Time Warner Cable 6,579 453 637
The accompanying notes are an integral part of the financial statements. 30

BlackRock CDN US Equity Index Plus Non-Taxable Fund
Statement of Investment Portfolio — As at December 31, 2012
Security
Par value
(000s)/
Holdings
Average
cost
Fair
value
(in $000s) (in $000s)
Consumer Discretionary (continued)Time Warner, Inc. 20,194 744 962TJX Cos., Inc. 14,974 457 633Tripadvisor, Inc. 2,238 85 93Urban Outfitters, Inc. 2,288 86 90VF Corp. 1,831 236 275Viacom, Inc.-Class B 9,574 413 503Virgin Media, Inc. 880 32 32Walt Disney Co. (The) 36,536 1,461 1,811Washington Post Co. (The)-Class B 91 41 33Whirlpool Corp. 1,904 186 193Wyndham Worldwide Corp. 2,905 121 154Wynn Resorts, Ltd. 1,623 176 182Yum! Brands, Inc. 9,276 454 613
26,000 31,303
Consumer Staples — 10.4%
Altria Group, Inc. 41,799 1,050 1,308Archer-Daniels-Midland Co. 13,645 391 372Avon Products, Inc. 4,393 101 63Brown-Forman Corp.-Class B 3,604 179 227Campbell Soup Co. 3,679 137 128Clorox Co. 2,715 188 198Coca-Cola Co. (The) 79,452 2,481 2,869Coca-Cola Ent., Inc. 5,480 134 173Colgate-Palmolive Co. 9,167 810 954ConAgra Foods, Inc. 8,463 217 249Constellation Brands, Inc.-Class A 3,076 62 109Costco Wholesale Corp. 9,222 654 907CVS Caremark Corp. 25,703 1,010 1,238Dean Foods Co. 3,842 49 63Dr Pepper Snapple Group, Inc. 4,302 173 189Estee Lauder Cos. (The), Inc.-Class A 4,988 223 297General Mills, Inc. 13,239 514 533Green Mountain Coffee Roasters, Inc. 780 32 32Hershey Co. (The) 3,098 175 223HJ Heinz Co. 6,629 328 381Hormel Foods Corp. 2,738 70 85Ingredion, Inc. 500 32 32JM Smucker Co. (The) 2,236 147 192Kellogg Co. 5,133 284 286Kimberly-Clark Corp. 8,036 564 675Kraft Foods Group, Inc. 12,198 438 552Kroger Co. (The) 10,692 236 277Lorillard, Inc. 2,668 233 310McCormick & Co., Inc. 3,220 161 204Mead Johnson Nutrition Co.-Class A 4,164 244 273Molson Coors Brewing Co.-Class B 3,178 140 135Mondelez International, Inc. 34,186 770 867Monster Beverage Corp. 3,024 202 159
Security
Par value
(000s)/
Holdings
Average
cost
Fair
value
(in $000s) (in $000s)
Consumer Staples (continued)PepsiCo, Inc. 31,854 2,131 2,171Philip Morris International, Inc. 34,822 2,344 2,900Procter & Gamble Co. (The) 56,371 3,683 3,812Reynolds American, Inc. 6,700 213 276Safeway, Inc. 4,890 98 88Sysco Corp. 12,144 377 383Tyson Foods, Inc.-Class A 5,962 110 115Wal-Mart Stores, Inc. 34,916 2,051 2,373Walgreen Co. 17,655 625 651Whole Foods Market, Inc. 3,564 295 324
24,356 27,653
Energy — 10.8%
Anadarko Petroleum Corp. 10,278 573 761Apache Corp. 7,252 667 567Baker Hughes, Inc. 9,102 405 370Cabot Oil & Gas Corp. 4,290 122 213Cameron International Corp. 5,121 213 288Chesapeake Energy Corp. 6,840 163 113Chevron Corp. 40,339 3,559 4,347ConocoPhillips 25,059 1,294 1,447Consol Energy, Inc. 4,649 177 149Denbury Resources, Inc. 8,019 137 129Devon Energy Corp. 6,562 428 340Diamond Offshore Drilling, Inc. 1,420 94 96Ensco PLC-Class A 4,826 274 285EOG Resources, Inc. 5,602 606 674Exxon Mobil Corp. 93,969 6,876 8,103FMC Technologies, Inc. 4,870 161 208Halliburton Co. 19,108 551 660Helmerich & Payne, Inc. 2,158 98 120Hess Corp. 6,165 342 325HollyFrontier Corp. 700 32 32Kinder Morgan, Inc. 13,076 442 460Marathon Oil Corp. 14,571 476 445Marathon Petroleum Corp. 6,999 300 439Murphy Oil Corp. 3,770 209 223Nabors Industries, Ltd. 5,930 115 85National Oilwell Varco, Inc. 8,786 422 598Newfield Exploration Company 312 19 8Noble Corp. 5,161 192 179Noble Energy, Inc. 3,683 276 373NRG Energy, Inc. 6,644 153 152Occidental Petroleum Corp. 15,891 1,363 1,212PBF Energy, Inc. 8,111 208 234Peabody Energy Corp. 5,481 211 145Phillips 66 12,910 464 682Pioneer Natural Resources Co. 2,560 229 272QEP Resources, Inc. 3,630 112 109
The accompanying notes are an integral part of the financial statements. 31

BlackRock CDN US Equity Index Plus Non-Taxable Fund
Statement of Investment Portfolio — As at December 31, 2012
Security
Par value
(000s)/
Holdings
Average
cost
Fair
value
(in $000s) (in $000s)
Energy (continued)Range Resources Corp. 3,319 185 208Rowan Cos. PLC 2,536 72 79Schlumberger, Ltd. 27,370 1,743 1,888Seacor Holdings, Inc. 150 12 13Southwestern Energy Co. 7,263 294 242Spectra Energy Corp. 13,727 319 374Tesoro Corp. 2,885 56 127Valero Energy Corp. 11,418 251 388Williams Cos., Inc. 16,060 448 523WPX Energy, Inc. 4,063 70 60
25,413 28,745
Financials — 16.9%
Aflac, Inc. 10,273 500 543AG Mortgage Investment Trust, Inc. 2,220 52 52Allstate Corp. (The) 9,868 327 395American Express Co. 20,118 970 1,151American Financial Group, Inc. 390 15 15American International Group, Inc. 30,504 968 1,072American Tower Corp. REIT 8,143 424 626Ameriprise Financial, Inc. 4,202 192 262AON PLC 6,524 300 361Apartment Investment &
Management Co. REIT-Class A 3,050 70 82Arch Capital Group, Ltd. 740 32 32Assurant, Inc. 1,632 61 56Australia & New Zealand Banking
Group, Ltd. 4,635 148 163AvalonBay Communities, Inc. REIT 2,359 279 318Bank of America Corp. 222,208 2,743 2,569Bank of New York Mellon Corp. 23,991 642 614BB&T Corp. 14,465 440 419Berkshire Hathaway, Inc.-Class B 37,635 3,067 3,364BlackRock, Inc. 2,574 486 530Boston Properties, Inc. REIT 3,129 275 330Capital One Financial Corp. 11,960 619 690Capitalsource, Inc. REIT 2,130 16 16Capitol Federal Financial, Inc. 760 9 9CBOE Holdings, Inc. 290 9 9CBRE Group, Inc. 6,167 116 122Charles Schwab Corp. (The) 22,734 355 325Chubb Corp. 5,432 325 407Cincinnati Financial Corp. 2,988 98 117Citigroup, Inc. 60,459 2,316 2,383CME Group, Inc. 7,807 457 394Comerica, Inc. 3,952 143 119Discover Financial Services 11,323 304 435E*Trade Financial Corp. 5,433 72 48Equity Residential REIT 6,633 342 374
Security
Par value
(000s)/
Holdings
Average
cost
Fair
value
(in $000s) (in $000s)
Financials (continued)Extra Space Storage, Inc. REIT 890 32 32Fidelity National Financial, Inc. 1,360 32 32Fifth Third Bancorp 18,326 259 277First Horizon National Corp. 4,901 53 48Franklin Resources, Inc. 3,113 339 390Genworth Financial, Inc.-Class A 10,457 137 78Goldman Sachs Group, Inc. 9,108 1,194 1,157Hartford Financial Services Group, Inc. 8,903 217 199HCC Insurance Holdings, Inc. 870 32 32HCP, Inc. 9,338 385 420Health Care, Inc. REIT 5,354 284 327Home Loan Servicing Solutions, Ltd. 3,704 69 70Host Hotels & Resorts, Inc. REIT 15,085 232 235Hudson City Bancorp, Inc. 9,815 111 79Huntington Bancshares, Inc. 17,532 115 112Interactive Brokers Group, Inc.-
Class A 340 5 5IntercontinentalExchange, Inc. 1,487 183 183Invesco, Ltd. 9,096 190 236Jefferies Group, Inc. 1,730 32 32JPMorgan Chase & Co. 78,433 3,151 3,436Keycorp 19,273 164 162Kimco Realty Corp. REIT 8,314 130 160Legg Mason, Inc. 2,317 71 59Leucadia National Corp. 4,046 92 96Lincoln National Corp. 5,703 154 147Loews Corp. 6,385 233 259M&T Bank Corp. 2,459 213 241Markel Corp. 70 30 30Marsh & McLennan Cos., Inc. 11,263 294 387Merck & Co., Inc. 62,731 2,383 2,558Metlife, Inc. 22,573 829 740Moody’s Corp. 4,592 141 230Morgan Stanley 28,551 586 544NASDAQ OMX Group, Inc. 2,395 59 60Northern Trust Corp. 4,471 229 223NYSE Euronext 3,035 88 95People’s United Financial, Inc. 7,173 100 86Plum Creek Timber Co., Inc. REIT 3,299 122 146PNC Financial Services Group, Inc. 10,904 683 633Popular, Inc. 1,560 32 32Principal Financial Group 5,666 158 161ProAssurance Corp. 380 16 16Progressive Corp. (The) 11,450 235 241ProLogis, Inc. REIT 9,554 294 347Prudential Financial, Inc. 9,517 554 505Public Storage, Inc. REIT 2,981 328 430Regions Financial Corp. 28,874 212 205SEI Investments Co. 520 12 12
The accompanying notes are an integral part of the financial statements. 32

BlackRock CDN US Equity Index Plus Non-Taxable Fund
Statement of Investment Portfolio — As at December 31, 2012
Security
Par value
(000s)/
Holdings
Average
cost
Fair
value
(in $000s) (in $000s)
Financials (continued)Simon Property Group, Inc. REIT 6,378 728 1,004SLM Corp. 9,589 141 164St. Joe Co. 1,420 33 33State Street Corp. 9,583 403 449SunTrust Banks, Inc. 11,178 307 315T Rowe Price Group, Inc. 6,272 357 407TD Ameritrade Holding Corp. 2,260 38 38Torchmark Corp. 1,948 76 100Travelers Cos. (The), Inc. 7,874 464 563U.S. Bancorp 38,685 1,047 1,230Unum Group 5,722 133 119Ventas, Inc. REIT 6,114 343 394Visa, Inc.-Class A 10,967 1,087 1,654Vornado Realty Trust-REIT 3,519 287 281Wells Fargo & Co. 100,995 3,098 3,440XL Group PLC 6,244 121 156Zions Bancorporation 3,760 87 80
41,416 45,014
Health Care — 11.2%
Abbott Laboratories 32,628 1,809 2,128Accenture PLC-Class A 13,165 807 872Aetna, Inc. 5,799 202 267Alexion Pharmaceuticals 3,999 385 373Allergan, Inc. 6,340 470 579AmerisourceBergen Corp. 4,915 174 211Amgen, Inc. 16,219 1,087 1,395Baxter International, Inc. 11,336 565 752Becton Dickinson & Co. 4,078 311 318Biogen Idec, Inc. 5,085 429 742BioMarin Pharmaceutical, Inc. 660 32 32Boston Scientific Corp. 27,846 174 159Bristol-Myers Squibb Co. 34,032 920 1,105Cardinal Health, Inc. 6,969 271 286CareFusion Corp. 4,544 120 129Celgene Corp. 8,753 547 686Cerner Corp. 3,037 158 235Cigna Corp. 5,892 231 314Community Health Systems, Inc. 860 25 26Covance, Inc. 560 32 32Coventry Health Care, Inc. 5,384 188 240Covidien PLC 9,805 510 564CR Bard, Inc. 1,593 149 155DaVita, Inc. 1,745 141 192DENTSPLY International, Inc. 2,926 103 115Edwards Lifesciences Corp. 2,364 204 212Eli Lilly & Co. 21,102 799 1,036Express Scripts Holding Co. 16,832 947 905Forest Laboratories, Inc. 4,777 146 168
Security
Par value
(000s)/
Holdings
Average
cost
Fair
value
(in $000s) (in $000s)
Health Care (continued)Gilead Sciences, Inc. 16,064 741 1,176Hospira, Inc. 1,324 67 41Humana, Inc. 2,299 126 157Intuitive Surgical, Inc. 815 318 398Johnson & Johnson 57,171 3,684 3,991Laboratory Corp. of America
Holdings 1,959 161 169Life Technologies Corp. 3,581 184 175McKesson Corp. 4,876 405 471Medtronic, Inc. 20,789 838 849Mylan, Inc. 8,473 183 232Patterson Cos., Inc. 1,702 54 58PerkinElmer, Inc. 3,349 90 106Perrigo Co. 1,844 195 191Pfizer, Inc. 151,792 2,902 3,792Quest Diagnostics, Inc. 3,244 177 188Regeneron Pharmaceuticals, Inc. 190 32 32Sirona Dental Systems, Inc. 510 32 33St. Jude Medical, Inc. 4,641 185 167Stryker Corp. 5,998 321 327Team Health Holdings, Inc. 2,220 63 64Tenet Healthcare Corp. 3,144 79 102Thermo Fisher Scientific, Inc. 7,467 417 474UnitedHealth Group, Inc. 21,108 882 1,140Universal Health Services-Class B 570 26 27Varian Medical Systems, Inc. 2,262 131 158Waters Corp. 1,791 133 155Watson Pharmaceuticals, Inc. 2,608 168 223WellPoint, Inc. 5,177 332 314Zimmer Holdings, Inc. 3,569 212 237
25,074 29,675
Industrials — 10.2%
3M Co. 13,133 1,119 1,214ACE Aviation Holdings, Inc. 6,992 435 555ADT Corp. 4,810 176 223AMETEK, Inc. 860 32 32Avery Dennison Corp. 2,098 73 73Boeing Co. 13,992 963 1,050C.H. Robinson Worldwide, Inc. 3,299 211 208Caterpillar, Inc. 13,489 1,086 1,204Cintas Corp. 2,196 70 89CNH Global 840 33 34Colfax Corp. 820 33 33Copart, Inc. 1,090 32 32CSX Corp. 17,881 352 351Cummins, Inc. 3,668 299 396Danaher Corp. 12,030 579 670Deere & Co. 8,064 584 694Dover Corp. 3,650 187 239
The accompanying notes are an integral part of the financial statements. 33

BlackRock CDN US Equity Index Plus Non-Taxable Fund
Statement of Investment Portfolio — As at December 31, 2012
Security
Par value
(000s)/
Holdings
Average
cost
Fair
value
(in $000s) (in $000s)
Industrials (continued)Dun & Bradstreet Corp. 897 68 70Eaton Corp. PLC 9,429 484 509Emerson Electric Co. 14,962 744 789Equifax, Inc. 3,061 120 165Expeditors International of
Washington, Inc. 4,300 174 169Fastenal Co. 5,506 179 256FedEx Corp. 6,023 523 550Flowserve Corp. 1,045 113 153Fluor Corp. 3,411 170 200General Dynamics Corp. 6,851 466 472General Electric Co. 216,192 3,901 4,516Honeywell International, Inc. 16,151 811 1,021Illinois Tool Works, Inc. 8,748 473 530Ingersoll-Rand PLC 5,717 245 273Iron Mountain, Inc. 3,465 98 107Jacobs Engineering Group, Inc. 2,678 116 113Joy Global, Inc. 2,172 182 138L-3 Communications Holdings, Inc. 1,973 159 150Lincoln Electric Holdings, Inc. 670 32 32Lockheed Martin Corp. 5,557 462 511Masco Corp. 7,320 99 121Nordson Corp. 520 32 33Norfolk Southern Corp. 5,430 346 334Northrop Grumman Corp. 5,051 314 340Paccar, Inc. 7,335 327 330Pall Corp. 2,247 97 135Parker Hannifin Corp. 3,053 212 259Pentair, Ltd. 4,384 191 215Pitney Bowes, Inc. 10 - -Precision Castparts Corp. 2,998 405 565Quanta Services, Inc. 4,406 101 120Raytheon Co. 6,756 369 387Republic Services, Inc. 6,119 185 179Robert Half International, Inc. 2,895 78 92Rockwell Automation, Inc. 2,884 178 241Rockwell Collins, Inc. 2,904 172 168Roper Industries, Inc. 2,334 189 259Ryder System, Inc. 1,070 49 53Snap-On, Inc. 1,598 95 126Southwest Airlines Co. 15,178 185 155Stanley Black & Decker, Inc. 3,503 224 258Stericycle, Inc. 1,750 130 162Textron, Inc. 5,739 125 142Toro Co. 770 33 33TRW Automotive Holdings Corp. 610 32 33Union Pacific Corp. 9,678 862 1,211United Parcel Service, Inc.-Class B 14,781 1,003 1,085
Security
Par value
(000s)/
Holdings
Average
cost
Fair
value
(in $000s) (in $000s)
Industrials (continued)United Technologies Corp. 17,416 1,296 1,422Valmont Industries, Inc. 240 32 33Verisk Analytics, Inc.-Class A 640 32 32W.W. Grainger, Inc. 1,225 182 247Waste Management, Inc. 9,051 310 304Xylem, Inc. 3,879 102 105
23,771 27,000
Information Technology — 17.6%
Adobe Systems, Inc. 10,190 339 382Advanced Micro Devices, Inc. 11,428 77 27Agilent Technologies, Inc. 7,243 253 295Akamai Technologies, Inc. 3,622 157 148Altera Corp. 6,681 199 229Amphenol Corp.-Class A 3,289 160 212Analog Devices, Inc. 6,226 222 261Apple, Inc. 19,398 7,459 10,295Applied Materials, Inc. 24,459 318 278Automatic Data Processing, Inc. 9,988 479 567BMC Software, Inc. 2,996 120 118Broadcom Corp.-Class A 10,698 385 354CA, Inc. 4,098 95 90Cisco Systems, Inc. 109,589 2,369 2,144Citrix Systems, Inc. 2,855 154 187Cognizant Technology Solutions
Corp.-Class A 6,173 365 455Computer Sciences Corp. 4,003 183 160CoreLogic, Inc. 1,200 32 32Corning, Inc. 30,262 458 380Dell, Inc. 24,041 321 243Dolby Laboratories, Inc.-Class A 600 19 18DST Systems, Inc. 530 32 32eBay, Inc. 24,650 750 1,252EMC Corp., Massachusetts 43,432 1,025 1,095F5 Networks, Inc. 1,614 207 156Fidelity National Information
Services, Inc. 5,116 154 177First Solar, Inc. 1,210 123 37Fiserv, Inc. 3,182 188 250Flir Systems, Inc. 271 8 6Genpact, Ltd. 4,440 68 68Google, Inc.-Class A 5,491 3,262 3,878Harris Corp. 2,313 112 113Hewlett-Packard Co. 36,027 1,203 511Intel Corp. 99,371 2,277 2,041International Business
Machines Corp. 21,898 3,518 4,177Intuit, Inc. 5,738 281 340Jabil Circuit, Inc. 3,924 67 75
The accompanying notes are an integral part of the financial statements. 34
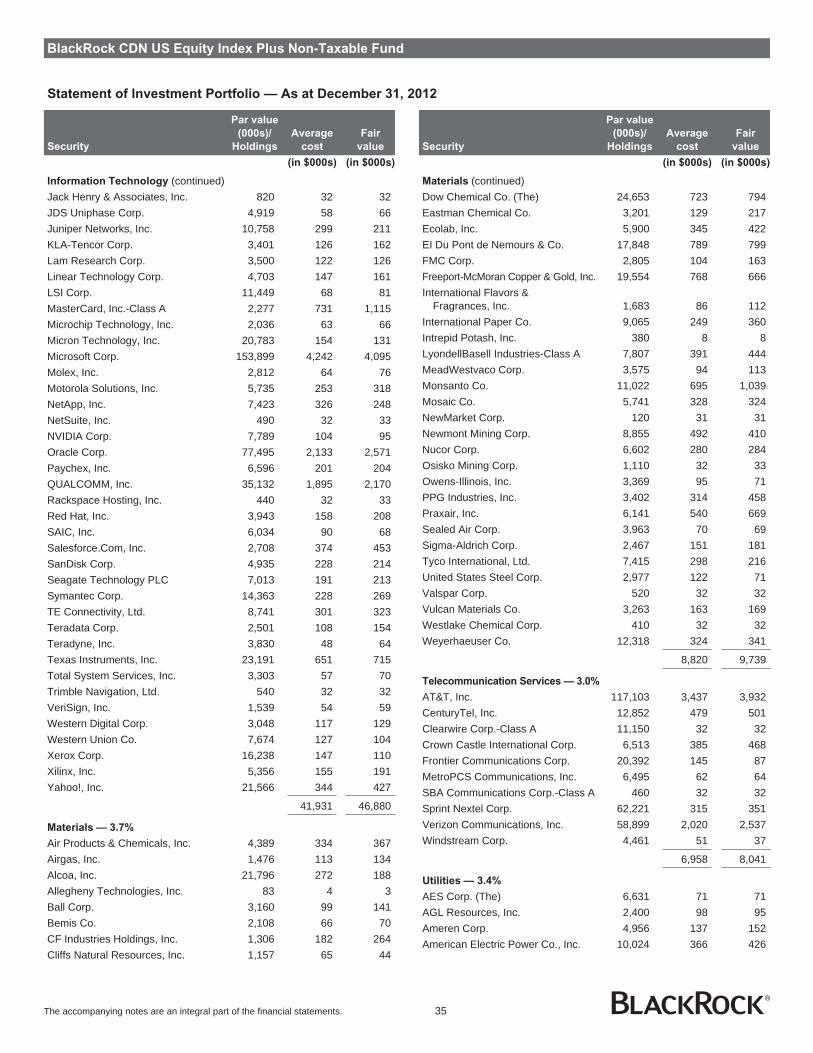
BlackRock CDN US Equity Index Plus Non-Taxable Fund
Statement of Investment Portfolio — As at December 31, 2012
Security
Par value
(000s)/
Holdings
Average
cost
Fair
value
(in $000s) (in $000s)
Information Technology (continued)Jack Henry & Associates, Inc. 820 32 32JDS Uniphase Corp. 4,919 58 66Juniper Networks, Inc. 10,758 299 211KLA-Tencor Corp. 3,401 126 162Lam Research Corp. 3,500 122 126Linear Technology Corp. 4,703 147 161LSI Corp. 11,449 68 81MasterCard, Inc.-Class A 2,277 731 1,115Microchip Technology, Inc. 2,036 63 66Micron Technology, Inc. 20,783 154 131Microsoft Corp. 153,899 4,242 4,095Molex, Inc. 2,812 64 76Motorola Solutions, Inc. 5,735 253 318NetApp, Inc. 7,423 326 248NetSuite, Inc. 490 32 33NVIDIA Corp. 7,789 104 95Oracle Corp. 77,495 2,133 2,571Paychex, Inc. 6,596 201 204QUALCOMM, Inc. 35,132 1,895 2,170Rackspace Hosting, Inc. 440 32 33Red Hat, Inc. 3,943 158 208SAIC, Inc. 6,034 90 68Salesforce.Com, Inc. 2,708 374 453SanDisk Corp. 4,935 228 214Seagate Technology PLC 7,013 191 213Symantec Corp. 14,363 228 269TE Connectivity, Ltd. 8,741 301 323Teradata Corp. 2,501 108 154Teradyne, Inc. 3,830 48 64Texas Instruments, Inc. 23,191 651 715Total System Services, Inc. 3,303 57 70Trimble Navigation, Ltd. 540 32 32VeriSign, Inc. 1,539 54 59Western Digital Corp. 3,048 117 129Western Union Co. 7,674 127 104Xerox Corp. 16,238 147 110Xilinx, Inc. 5,356 155 191Yahoo!, Inc. 21,566 344 427
41,931 46,880
Materials — 3.7%
Air Products & Chemicals, Inc. 4,389 334 367Airgas, Inc. 1,476 113 134Alcoa, Inc. 21,796 272 188Allegheny Technologies, Inc. 83 4 3Ball Corp. 3,160 99 141Bemis Co. 2,108 66 70CF Industries Holdings, Inc. 1,306 182 264Cliffs Natural Resources, Inc. 1,157 65 44
Security
Par value
(000s)/
Holdings
Average
cost
Fair
value
(in $000s) (in $000s)
Materials (continued)Dow Chemical Co. (The) 24,653 723 794Eastman Chemical Co. 3,201 129 217Ecolab, Inc. 5,900 345 422EI Du Pont de Nemours & Co. 17,848 789 799FMC Corp. 2,805 104 163Freeport-McMoran Copper & Gold, Inc. 19,554 768 666International Flavors &
Fragrances, Inc. 1,683 86 112International Paper Co. 9,065 249 360Intrepid Potash, Inc. 380 8 8LyondellBasell Industries-Class A 7,807 391 444MeadWestvaco Corp. 3,575 94 113Monsanto Co. 11,022 695 1,039Mosaic Co. 5,741 328 324NewMarket Corp. 120 31 31Newmont Mining Corp. 8,855 492 410Nucor Corp. 6,602 280 284Osisko Mining Corp. 1,110 32 33Owens-Illinois, Inc. 3,369 95 71PPG Industries, Inc. 3,402 314 458Praxair, Inc. 6,141 540 669Sealed Air Corp. 3,963 70 69Sigma-Aldrich Corp. 2,467 151 181Tyco International, Ltd. 7,415 298 216United States Steel Corp. 2,977 122 71Valspar Corp. 520 32 32Vulcan Materials Co. 3,263 163 169Westlake Chemical Corp. 410 32 32Weyerhaeuser Co. 12,318 324 341
8,820 9,739
Telecommunication Services — 3.0%
AT&T, Inc. 117,103 3,437 3,932CenturyTel, Inc. 12,852 479 501Clearwire Corp.-Class A 11,150 32 32Crown Castle International Corp. 6,513 385 468Frontier Communications Corp. 20,392 145 87MetroPCS Communications, Inc. 6,495 62 64SBA Communications Corp.-Class A 460 32 32Sprint Nextel Corp. 62,221 315 351Verizon Communications, Inc. 58,899 2,020 2,537Windstream Corp. 4,461 51 37
6,958 8,041
Utilities — 3.4%
AES Corp. (The) 6,631 71 71AGL Resources, Inc. 2,400 98 95Ameren Corp. 4,956 137 152American Electric Power Co., Inc. 10,024 366 426
The accompanying notes are an integral part of the financial statements. 35
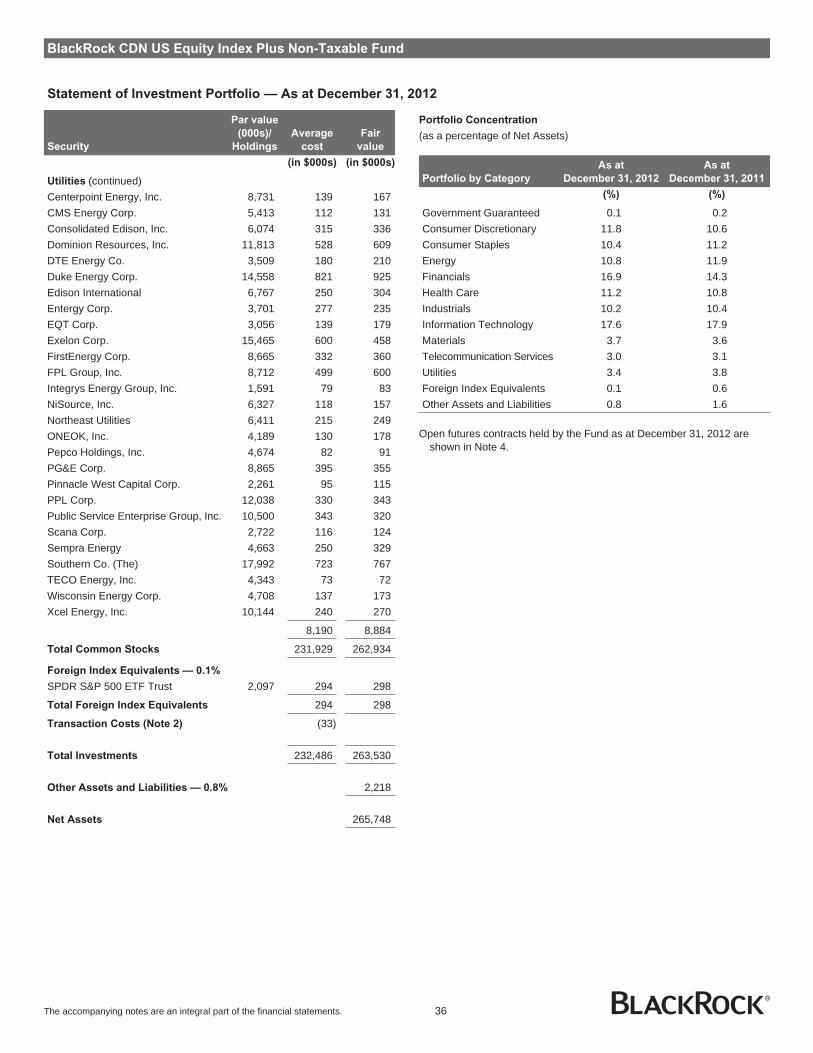
BlackRock CDN US Equity Index Plus Non-Taxable Fund
Statement of Investment Portfolio — As at December 31, 2012
Security
Par value
(000s)/
Holdings
Average
cost
Fair
value
(in $000s) (in $000s)
Utilities (continued)Centerpoint Energy, Inc. 8,731 139 167CMS Energy Corp. 5,413 112 131Consolidated Edison, Inc. 6,074 315 336Dominion Resources, Inc. 11,813 528 609DTE Energy Co. 3,509 180 210Duke Energy Corp. 14,558 821 925Edison International 6,767 250 304Entergy Corp. 3,701 277 235EQT Corp. 3,056 139 179Exelon Corp. 15,465 600 458FirstEnergy Corp. 8,665 332 360FPL Group, Inc. 8,712 499 600Integrys Energy Group, Inc. 1,591 79 83NiSource, Inc. 6,327 118 157Northeast Utilities 6,411 215 249ONEOK, Inc. 4,189 130 178Pepco Holdings, Inc. 4,674 82 91PG&E Corp. 8,865 395 355Pinnacle West Capital Corp. 2,261 95 115PPL Corp. 12,038 330 343Public Service Enterprise Group, Inc. 10,500 343 320Scana Corp. 2,722 116 124Sempra Energy 4,663 250 329Southern Co. (The) 17,992 723 767TECO Energy, Inc. 4,343 73 72Wisconsin Energy Corp. 4,708 137 173Xcel Energy, Inc. 10,144 240 270
8,190 8,884
Total Common Stocks 231,929 262,934
Foreign Index Equivalents — 0.1%
SPDR S&P 500 ETF Trust 2,097 294 298
Total Foreign Index Equivalents 294 298
Transaction Costs (Note 2) (33)
Total Investments 232,486 263,530
Other Assets and Liabilities — 0.8% 2,218
Net Assets 265,748
Portfolio Concentration
(as a percentage of Net Assets)
Portfolio by Category
As at
December 31, 2012
As at
December 31, 2011
(%) (%)
Government Guaranteed 0.1 0.2Consumer Discretionary 11.8 10.6Consumer Staples 10.4 11.2Energy 10.8 11.9Financials 16.9 14.3Health Care 11.2 10.8Industrials 10.2 10.4Information Technology 17.6 17.9Materials 3.7 3.6Telecommunication Services 3.0 3.1Utilities 3.4 3.8Foreign Index Equivalents 0.1 0.6Other Assets and Liabilities 0.8 1.6
Open futures contracts held by the Fund as at December 31, 2012 areshown in Note 4.
The accompanying notes are an integral part of the financial statements. 36
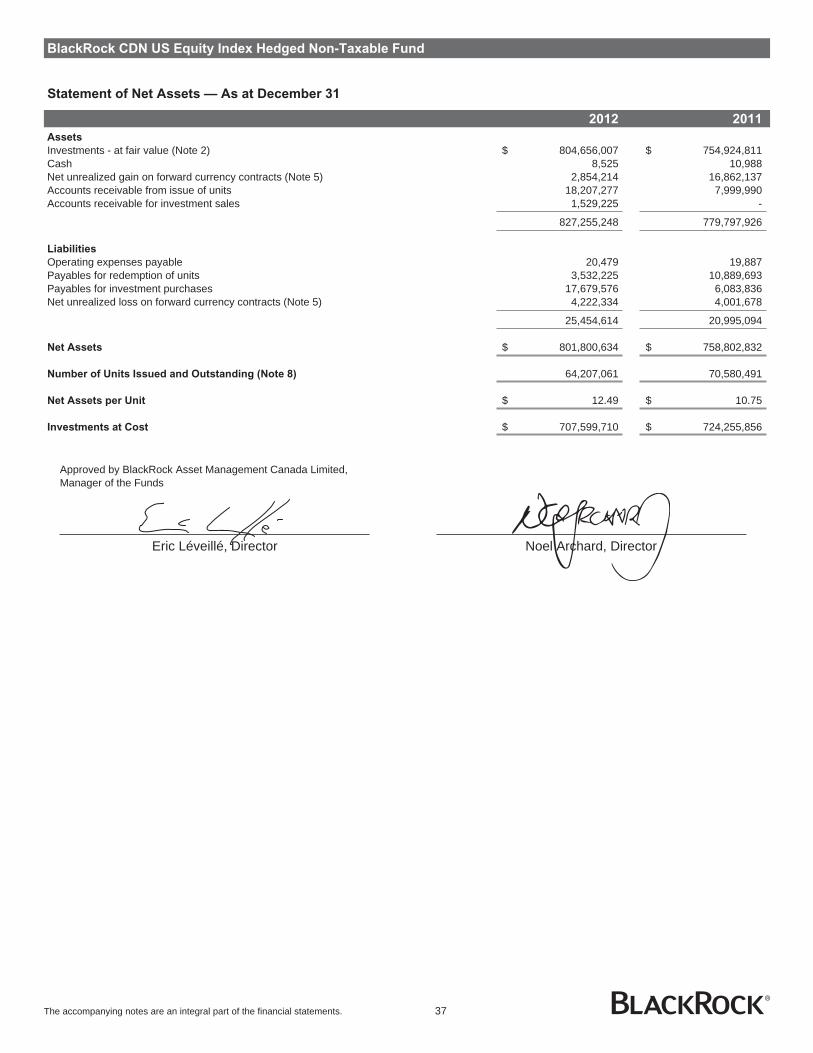
BlackRock CDN US Equity Index Hedged Non-Taxable Fund
Statement of Net Assets — As at December 31
2012 2011
Assets
Investments - at fair value (Note 2) $ 804,656,007 $ 754,924,811Cash 8,525 10,988Net unrealized gain on forward currency contracts (Note 5) 2,854,214 16,862,137Accounts receivable from issue of units 18,207,277 7,999,990Accounts receivable for investment sales 1,529,225 -
827,255,248 779,797,926
Liabilities
Operating expenses payable 20,479 19,887Payables for redemption of units 3,532,225 10,889,693Payables for investment purchases 17,679,576 6,083,836Net unrealized loss on forward currency contracts (Note 5) 4,222,334 4,001,678
25,454,614 20,995,094
Net Assets $ 801,800,634 $ 758,802,832
Number of Units Issued and Outstanding (Note 8) 64,207,061 70,580,491
Net Assets per Unit $ 12.49 $ 10.75
Investments at Cost $ 707,599,710 $ 724,255,856
Approved by BlackRock Asset Management Canada Limited,Manager of the Funds
Eric Léveillé, Director Noel Archard, Director
The accompanying notes are an integral part of the financial statements. 37

BlackRock CDN US Equity Index Hedged Non-Taxable Fund
Statement of Operations — For the Years Ended December 31
2012 2011
Revenue
Dividend income $ 21,288,876 $ 18,938,336Interest income 709 164
21,289,585 18,938,500
Expenses
Custodian fees 206 253Fund accounting expenses 12,127 13,303Unitholder communication costs - 601Audit fees 14,055 14,915Securities filing fees 13,308 12,448Independent review committee fees 361 903Other operating expenses 2,289 2,945
42,346 45,368
Net Investment Income for the Year 21,247,239 18,893,132
Gain (Loss) on Investments
Net realized gain on sale of investments 12,612,567 5,056,620Net realized gain (loss) from forward currency contracts 33,249,029 (11,234,033)Net change in unrealized appreciation in value of investments 66,387,342 8,000,194Net change in unrealized depreciation in value of forward currency contracts (14,228,579) (5,096,582)
Net Gain (Loss) on Investments 98,020,359 (3,273,801)
Increase in Net Assets from Operations $ 119,267,598 $ 15,619,331
Increase in Net Assets from Operations per Unit $ 1.76 $ 0.21
Statement of Changes in Net Assets — For the Years Ended December 31
2012 2011
Net Assets - Beginning of Year $ 758,802,832 $ 870,252,124
Increase in Net Assets from Operations 119,267,598 15,619,331
Capital Transactions
Proceeds from issue of units 33,007,395 50,950,684Reinvestment of distributions 23,425,288 18,893,047Redemption of units (109,277,191) (178,019,307)
Net capital transactions (52,844,508) (108,175,576)
Distributions
From net investment income (21,247,242) (18,893,047)From capital gains redemption in kind (Note 9) (2,178,046) -
Total distributions (23,425,288) (18,893,047)
Increase (Decrease) in Net Assets for the Year 42,997,802 (111,449,292)
Net Assets - End of Year $ 801,800,634 $ 758,802,832
The accompanying notes are an integral part of the financial statements. 38

BlackRock CDN US Equity Index Hedged Non-Taxable Fund
Statement of Investment Portfolio — As at December 31, 2012
Security Holdings
Average
cost
Fair
value
(in $000s) (in $000s)
Foreign Index
Equivalents — 100.4%
BlackRock CDN US Equity IndexNon-Taxable Class A 80,167,282 707,600 804,656
Total Foreign Index Equivalents 707,600 804,656
Total Investments 707,600 804,656
Other Assets and Liabilities — (0.4)% (2,855)
Net Assets 801,801
Portfolio Concentration
(as a percentage of Net Assets)
Portfolio by Category
As at
December 31, 2012
As at
December 31, 2011
(%) (%)
Foreign Index Equivalents 100.4 99.5Other Assets and Liabilities (0.4) 0.5
Open forward currency contracts held by the Fund as at December 31,2012 as shown in Note 5.
The accompanying notes are an integral part of the financial statements. 39

BlackRock CDN US Equity Index Fund
Statement of Net Assets — As at December 31
2012 2011
Assets
Investments - at fair value* (Note 2) $ 2,688,930,323 $ 1,732,096,304Cash 47,384,864 35,964,091Margin due from brokers 1,523,105 -Dividends receivable 2,967,458 2,219,588Tax reclaim on dividends receivable 119,363 34,224Accounts receivable from issue of units 1,001,432 5,111,655Accounts receivable for investment sales 397,816 274,298
2,742,324,361 1,775,700,160
Liabilities
Margin due to brokers - 147,204Operating expenses payable 63,268 45,551Payables for redemption of units 2,029,641 -
2,092,909 192,755
Net Assets $ 2,740,231,452 $ 1,775,507,405
Net Assets per Class
Class A $ 777,996,585 $ 680,359,540Class D 1,962,234,867 1,095,147,865
$ 2,740,231,452 $ 1,775,507,405
Number of Units Issued and Outstanding (Note 8)
Class A 90,299,438 89,288,642Class D 227,768,581 143,736,013
Net Assets per Unit
Class A $ 8.62 $ 7.62Class D $ 8.62 $ 7.62
Investments at Cost* $ 2,532,472,506 $ 1,773,540,975
* Includes short-term investments
Approved by BlackRock Asset Management Canada Limited,Manager of the Funds
Eric Léveillé, Director Noel Archard, Director
The accompanying notes are an integral part of the financial statements. 40
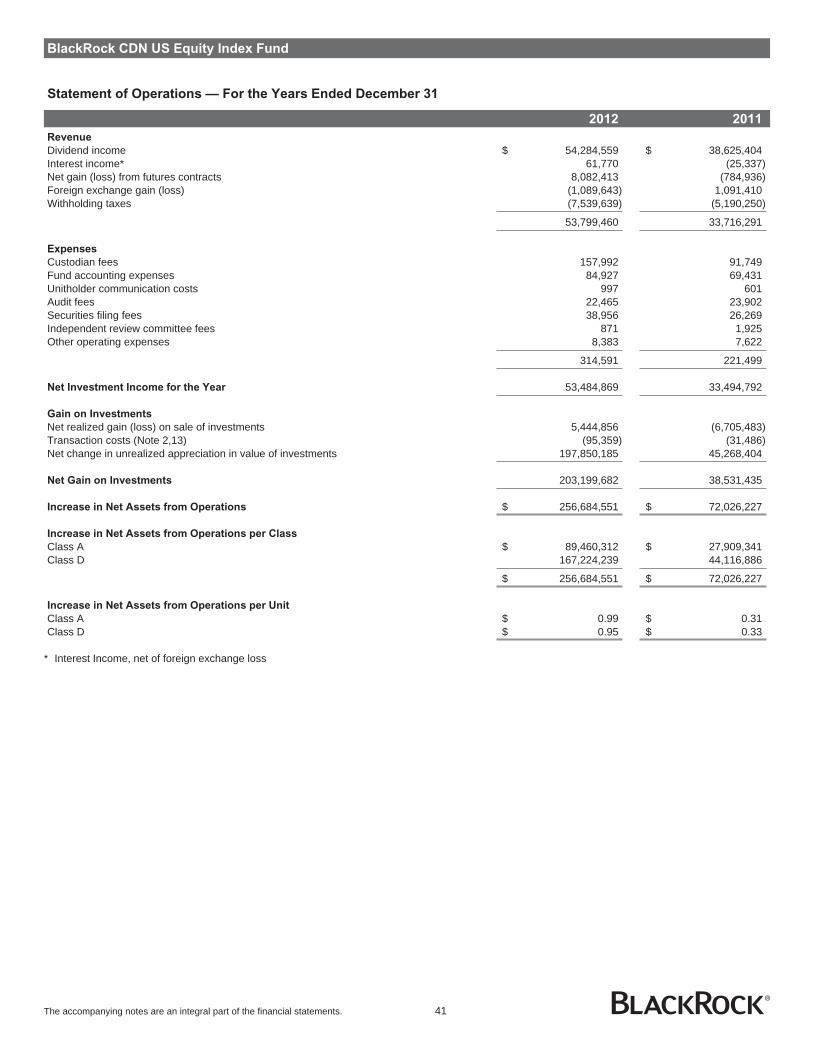
BlackRock CDN US Equity Index Fund
Statement of Operations — For the Years Ended December 31
2012 2011
Revenue
Dividend income $ 54,284,559 $ 38,625,404Interest income* 61,770 (25,337)Net gain (loss) from futures contracts 8,082,413 (784,936)Foreign exchange gain (loss) (1,089,643) 1,091,410Withholding taxes (7,539,639) (5,190,250)
53,799,460 33,716,291
Expenses
Custodian fees 157,992 91,749Fund accounting expenses 84,927 69,431Unitholder communication costs 997 601Audit fees 22,465 23,902Securities filing fees 38,956 26,269Independent review committee fees 871 1,925Other operating expenses 8,383 7,622
314,591 221,499
Net Investment Income for the Year 53,484,869 33,494,792
Gain on Investments
Net realized gain (loss) on sale of investments 5,444,856 (6,705,483)Transaction costs (Note 2,13) (95,359) (31,486)Net change in unrealized appreciation in value of investments 197,850,185 45,268,404
Net Gain on Investments 203,199,682 38,531,435
Increase in Net Assets from Operations $ 256,684,551 $ 72,026,227
Increase in Net Assets from Operations per Class
Class A $ 89,460,312 $ 27,909,341Class D 167,224,239 44,116,886
$ 256,684,551 $ 72,026,227
Increase in Net Assets from Operations per Unit
Class A $ 0.99 $ 0.31Class D $ 0.95 $ 0.33
* Interest Income, net of foreign exchange loss
The accompanying notes are an integral part of the financial statements. 41
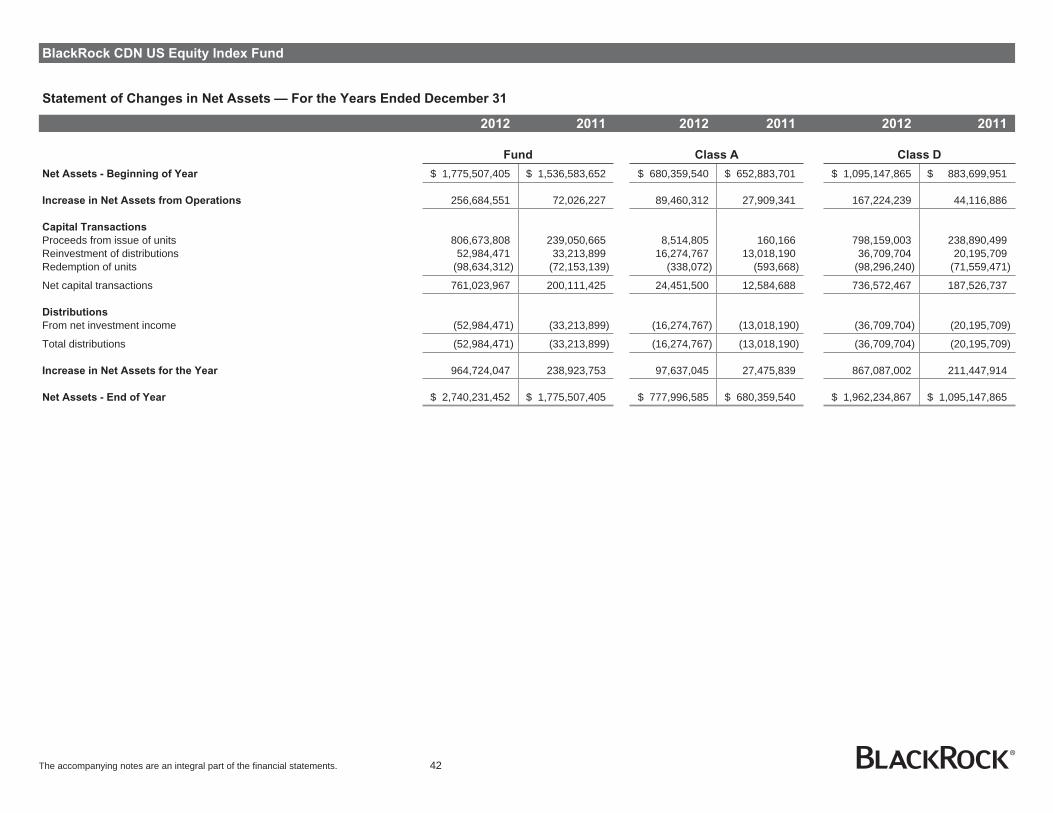
BlackRock CDN US Equity Index Fund
Statement of Changes in Net Assets — For the Years Ended December 31
2012 2011 2012 2011 2012 2011
Fund Class A Class D
Net Assets - Beginning of Year $ 1,775,507,405 $ 1,536,583,652 $ 680,359,540 $ 652,883,701 $ 1,095,147,865 $ 883,699,951
Increase in Net Assets from Operations 256,684,551 72,026,227 89,460,312 27,909,341 167,224,239 44,116,886
Capital Transactions
Proceeds from issue of units 806,673,808 239,050,665 8,514,805 160,166 798,159,003 238,890,499Reinvestment of distributions 52,984,471 33,213,899 16,274,767 13,018,190 36,709,704 20,195,709Redemption of units (98,634,312) (72,153,139) (338,072) (593,668) (98,296,240) (71,559,471)
Net capital transactions 761,023,967 200,111,425 24,451,500 12,584,688 736,572,467 187,526,737
Distributions
From net investment income (52,984,471) (33,213,899) (16,274,767) (13,018,190) (36,709,704) (20,195,709)
Total distributions (52,984,471) (33,213,899) (16,274,767) (13,018,190) (36,709,704) (20,195,709)
Increase in Net Assets for the Year 964,724,047 238,923,753 97,637,045 27,475,839 867,087,002 211,447,914
Net Assets - End of Year $ 2,740,231,452 $ 1,775,507,405 $ 777,996,585 $ 680,359,540 $ 1,962,234,867 $ 1,095,147,865
The accompanying notes are an integral part of the financial statements. 42

BlackRock CDN US Equity Index Fund
Statement of Investment Portfolio — As at December 31, 2012
Security
Par value
(000s)/
Holdings
Average
cost
Fair
value
(in $000s) (in $000s)
Short Term Investments
Government Guaranteed — 0.2%
U.S. Treasury Bill1.00% March 21, 2013 4,860 4,796 4,838
4,796 4,838
Total Short Term Investments 4,796 4,838
Common Stocks
Consumer Discretionary — 11.5%
Abercrombie & Fitch Co.-Class A 16,852 971 805Amazon.Com, Inc. 76,665 10,474 19,181Apollo Group, Inc.-Class A 21,270 1,338 443AutoNation, Inc. 8,178 202 323AutoZone, Inc. 7,817 2,042 2,759Beam, Inc. 33,657 2,264 2,047Bed Bath & Beyond, Inc. 48,508 2,290 2,699Best Buy Co., Inc. 56,093 2,036 661Big Lots, Inc. 12,194 330 345BorgWarner, Inc. 24,756 1,636 1,765Cablevision Systems-NY Group A 45,515 1,295 677CarMax, Inc. 48,441 1,236 1,811Carnival Corp. 94,360 3,954 3,454CBS Corp.-Class B 125,044 3,292 4,737Chipotle Mexican Grill, Inc. 6,650 1,811 1,967Coach, Inc. 60,006 2,494 3,317Comcast Corp.-Class A 562,223 14,419 20,926D.R. Horton, Inc. 59,095 1,290 1,163Darden Restaurants, Inc. 27,270 1,126 1,224Delphi Automotive PLC 62,471 2,246 2,379DIRECTV 127,835 4,659 6,386Discovery Communications-Class A 50,550 1,985 3,195Dollar General Corp. 55,578 2,753 2,441Dollar Tree, Inc. 48,093 2,111 1,942Electrolux AB-Class B 64,623 2,205 934Expedia, Inc. 19,758 1,075 1,209Family Dollar Stores, Inc. 20,280 894 1,280Ford Motor Co. 806,611 8,142 10,401Fossil, Inc. 11,439 1,344 1,060GameStop Corp.-Class A 25,647 990 640Gannett Co., Inc. 48,810 2,119 875Gap (The), Inc. 62,912 1,529 1,943Garmin, Ltd. 23,018 962 935Genuine Parts Co. 32,880 1,692 2,081Goodyear Tire & Rubber Co. (The) 51,677 844 710H&R Block, Inc. 57,188 1,299 1,057Harley-Davidson, Inc. 47,881 2,291 2,329Harman International Industries, Inc. 14,237 874 633Hasbro, Inc. 24,446 824 873Home Depot, Inc. 316,351 13,260 19,482International Game Technology 56,333 1,537 795
Security
Par value
(000s)/
Holdings
Average
cost
Fair
value
(in $000s) (in $000s)
Consumer Discretionary (continued)Interpublic Group of Cos., Inc. 91,328 1,015 1,003JC Penney Co., Inc. 30,172 1,166 592Johnson Controls, Inc. 144,657 4,070 4,418Kohl’s Corp. 44,792 2,475 1,917Leggett & Platt, Inc. 30,016 766 814Lennar Corp.-Class A 34,721 1,230 1,337Lowe’s Cos., Inc. 237,975 6,879 8,417Ltd. Brands 50,631 1,573 2,372Macy’s, Inc. 83,653 2,629 3,250Marriott International, Inc.-Class A 52,097 1,789 1,933Mattel, Inc. 72,586 1,905 2,646McDonald’s Corp. 212,423 13,787 18,664McGraw-Hill Cos. (The), Inc. 58,770 2,738 3,199NetFlix, Inc. 11,714 1,682 1,081Newell Rubbermaid, Inc. 60,925 1,316 1,351News Corp.-Class A 426,625 8,174 10,845Nike, Inc.-Class B 154,444 5,456 7,935Nordstrom, Inc. 32,228 1,297 1,717O’Reilly Automotive, Inc. 24,261 1,363 2,161Omnicom Group 55,850 2,628 2,779PetSmart, Inc. 22,683 1,507 1,544Priceline.Com, Inc. 10,550 3,715 6,525Pulte Homes, Inc. 71,902 1,714 1,300Ralph Lauren Corp. 12,966 1,391 1,935Ross Stores, Inc. 47,061 1,638 2,537Scripps Networks Interactive-Class A 18,398 867 1,061Sherwin-Williams Co. (The) 18,104 1,495 2,773Staples, Inc. 142,651 2,847 1,618Starbucks Corp. 157,341 5,204 8,403Starwood Hotels & Resorts
Worldwide, Inc. 41,454 2,185 2,367Target Corp. 137,704 7,727 8,112Tiffany & Co. 25,284 1,271 1,444Time Warner Cable 63,856 3,980 6,181Time Warner, Inc. 200,255 8,044 9,537TJX Cos., Inc. 154,311 3,750 6,522Tripadvisor, Inc. 23,117 758 965Urban Outfitters, Inc. 23,021 756 902VF Corp. 18,642 1,838 2,802Viacom, Inc.-Class B 97,764 5,330 5,135Walt Disney Co. (The) 374,947 14,118 18,585Washington Post Co. (The)-Class B 944 553 342Whirlpool Corp. 16,468 1,345 1,669Wyndham Worldwide Corp. 29,694 1,006 1,573Wynn Resorts, Ltd. 16,843 1,360 1,885Yum! Brands, Inc. 95,604 4,160 6,323
252,632 314,355
The accompanying notes are an integral part of the financial statements. 43

BlackRock CDN US Equity Index Fund
Statement of Investment Portfolio — As at December 31, 2012
Security
Par value
(000s)/
Holdings
Average
cost
Fair
value
(in $000s) (in $000s)
Consumer Staples — 10.3%
Altria Group, Inc. 428,481 10,539 13,409Archer-Daniels-Midland Co. 139,335 4,139 3,799Avon Products, Inc. 91,149 2,841 1,304Brown-Forman Corp.-Class B 32,111 1,459 2,021Campbell Soup Co. 37,998 1,398 1,320Clorox Co. 27,598 1,894 2,012Coca-Cola Co. (The) 816,104 25,792 29,473Coca-Cola Ent., Inc. 57,116 1,415 1,805Colgate-Palmolive Co. 93,967 7,795 9,783ConAgra Foods, Inc. 86,208 2,327 2,532Constellation Brands, Inc.-Class A 32,030 843 1,129Costco Wholesale Corp. 91,484 6,465 9,001CVS Caremark Corp. 263,783 9,702 12,704Dean Foods Co. 38,981 920 640Dr Pepper Snapple Group, Inc. 44,051 1,447 1,937Estee Lauder Cos. (The), Inc.-Class A 50,823 1,843 3,029General Mills, Inc. 136,533 4,800 5,494Hershey Co. (The) 31,652 1,818 2,276HJ Heinz Co. 67,835 3,396 3,897Hormel Foods Corp. 28,277 656 878JM Smucker Co. (The) 22,959 1,392 1,971Kellogg Co. 52,316 2,779 2,909Kimberly-Clark Corp. 82,796 6,265 6,958Kraft Foods Group, Inc. 125,327 4,408 5,672Kroger Co. (The) 108,739 2,683 2,817Lorillard, Inc. 27,395 2,520 3,182McCormick & Co., Inc. 27,984 1,307 1,769Mead Johnson Nutrition Co.-Class A 42,996 2,355 2,821Molson Coors Brewing Co.-Class B 33,059 1,520 1,408Mondelez International, Inc. 375,963 8,356 9,538Monster Beverage Corp. 31,561 2,150 1,662PepsiCo, Inc. 327,282 22,288 22,303Philip Morris International, Inc. 353,451 21,116 29,439Procter & Gamble Co. (The) 578,497 38,372 39,117Reynolds American, Inc. 68,611 2,241 2,830Safeway, Inc. 50,515 1,240 909Sysco Corp. 124,349 4,278 3,920Tyson Foods, Inc.-Class A 60,573 1,036 1,170Wal-Mart Stores, Inc. 353,891 22,518 24,053Walgreen Co. 181,747 7,295 6,701Whole Foods Market, Inc. 36,500 2,447 3,319
250,055 282,911
Energy — 10.7%
Anadarko Petroleum Corp. 105,729 6,171 7,824Apache Corp. 82,779 7,322 6,469Baker Hughes, Inc. 93,006 4,935 3,783Cabot Oil & Gas Corp. 44,306 1,398 2,195Cameron International Corp. 52,190 2,356 2,933
Security
Par value
(000s)/
Holdings
Average
cost
Fair
value
(in $000s) (in $000s)
Energy (continued)Chesapeake Energy Corp. 109,504 3,100 1,811Chevron Corp. 414,097 35,924 44,621ConocoPhillips 256,818 13,034 14,834Consol Energy, Inc. 48,322 2,032 1,544Denbury Resources, Inc. 81,915 1,410 1,321Devon Energy Corp. 79,681 5,278 4,129Diamond Offshore Drilling, Inc. 14,663 1,117 992Ensco PLC-Class A 49,138 2,767 2,899EOG Resources, Inc. 57,308 4,987 6,892Exxon Mobil Corp. 964,634 74,220 83,178FMC Technologies, Inc. 50,297 1,627 2,144Halliburton Co. 196,323 6,261 6,783Helmerich & Payne, Inc. 22,296 1,021 1,243Hess Corp. 62,883 3,578 3,315Kinder Morgan, Inc. 133,793 4,346 4,707Marathon Oil Corp. 149,443 5,137 4,561Marathon Petroleum Corp. 71,755 3,028 4,500Murphy Oil Corp. 39,101 2,377 2,318Nabors Industries, Ltd. 61,246 1,461 881National Oilwell Varco, Inc. 90,315 4,940 6,148Newfield Exploration Company 28,467 1,662 759Noble Corp. 53,570 1,978 1,857Noble Energy, Inc. 37,633 2,916 3,812NRG Energy, Inc. 68,167 1,579 1,560Occidental Petroleum Corp. 171,406 11,859 13,075Peabody Energy Corp. 56,611 2,327 1,500Phillips 66 132,299 4,460 6,994Pioneer Natural Resources Co. 26,069 1,831 2,767QEP Resources, Inc. 37,827 1,215 1,140Range Resources Corp. 34,441 1,869 2,155Rowan Cos. PLC 26,194 872 815Schlumberger, Ltd. 280,869 18,728 19,378Southwestern Energy Co. 73,917 3,007 2,458Spectra Energy Corp. 140,852 3,692 3,839Tesoro Corp. 29,716 975 1,303Valero Energy Corp. 117,100 4,013 3,976Williams Cos., Inc. 142,549 3,779 4,646WPX Energy, Inc. 41,971 740 622
267,329 294,681
Financials — 16.6%
Aflac, Inc. 99,200 4,843 5,246Allstate Corp. (The) 101,953 4,563 4,078American Express Co. 205,998 10,926 11,790American International Group, Inc. 312,331 26,370 10,978American Tower Corp. REIT 83,640 4,292 6,433Ameriprise Financial, Inc. 43,559 1,990 2,716AON PLC 67,437 2,945 3,733
The accompanying notes are an integral part of the financial statements. 44

BlackRock CDN US Equity Index Fund
Statement of Investment Portfolio — As at December 31, 2012
Security
Par value
(000s)/
Holdings
Average
cost
Fair
value
(in $000s) (in $000s)
Financials (continued)Apartment Investment &
Management Co. REIT-Class A 30,695 835 827Assurant, Inc. 16,678 793 576Australia & New Zealand Banking
Group, Ltd. 47,566 1,578 1,673AvalonBay Communities, Inc. REIT 24,197 3,057 3,266Bank of America Corp. 2,280,289 49,235 26,360Bank of New York Mellon Corp. 247,278 8,074 6,330BB&T Corp. 148,009 5,080 4,290Berkshire Hathaway, Inc.-Class B 385,927 31,621 34,500BlackRock, Inc. 27,000 5,007 5,557Boston Properties, Inc. REIT 31,915 3,057 3,362Capital One Financial Corp. 123,061 7,129 7,099CBRE Group, Inc. 63,699 1,188 1,263Charles Schwab Corp. (The) 231,975 3,716 3,317Chubb Corp. 55,432 3,253 4,157Cincinnati Financial Corp. 30,856 1,217 1,203Citigroup, Inc. 620,425 45,930 24,451CME Group, Inc. 64,884 5,188 3,275Comerica, Inc. 40,301 1,709 1,217Discover Financial Services 106,820 2,582 4,100E*Trade Financial Corp. 54,126 1,295 482Equity Residential REIT 68,063 3,279 3,839Fifth Third Bancorp 189,938 4,038 2,875First Horizon National Corp. 51,992 847 513Franklin Resources, Inc. 29,161 3,018 3,650Genworth Financial, Inc.-Class A 103,715 1,872 776Goldman Sachs Group, Inc. 93,468 13,167 11,877Hartford Financial Services Group, Inc. 92,390 3,753 2,064HCP, Inc. 95,635 3,524 4,300Health Care, Inc. REIT 54,934 2,754 3,352Host Hotels & Resorts, Inc. REIT 153,309 2,759 2,392Hudson City Bancorp, Inc. 100,247 1,270 810Huntington Bancshares, Inc. 181,074 1,648 1,152IntercontinentalExchange, Inc. 15,352 1,980 1,892Invesco, Ltd. 93,942 2,177 2,439JPMorgan Chase & Co. 804,256 35,026 35,227Keycorp 197,638 2,581 1,657Kimco Realty Corp. REIT 86,367 1,971 1,661Legg Mason, Inc. 24,835 1,482 636Leucadia National Corp. 41,787 1,364 989Lincoln National Corp. 58,220 2,152 1,501Loews Corp. 65,700 2,508 2,666M&T Bank Corp. 25,724 2,370 2,522Marsh & McLennan Cos., Inc. 115,164 4,007 3,951Merck & Co., Inc. 643,181 26,605 26,225Metlife, Inc. 230,820 9,445 7,568Moody’s Corp. 41,021 1,676 2,055Morgan Stanley 292,373 9,619 5,566
Security
Par value
(000s)/
Holdings
Average
cost
Fair
value
(in $000s) (in $000s)
Financials (continued)NASDAQ OMX Group, Inc. 24,686 745 615Northern Trust Corp. 46,180 2,611 2,306NYSE Euronext 51,440 2,643 1,615People’s United Financial, Inc. 73,277 1,273 882Plum Creek Timber Co., Inc. REIT 34,076 1,353 1,504PNC Financial Services Group, Inc. 111,890 9,051 6,496Principal Financial Group 58,527 2,058 1,662Progressive Corp. (The) 117,754 2,644 2,474ProLogis, Inc. REIT 97,504 3,944 3,543Prudential Financial, Inc. 98,153 5,854 5,211Public Storage, Inc. REIT 30,503 3,259 4,403Regions Financial Corp. 298,200 3,699 2,114Simon Property Group, Inc. REIT 65,447 6,907 10,302SLM Corp. 97,833 2,548 1,670State Street Corp. 98,360 5,130 4,604SunTrust Banks, Inc. 113,986 4,609 3,216T Rowe Price Group, Inc. 53,916 2,744 3,496Torchmark Corp. 20,123 852 1,035Travelers Cos. (The), Inc. 80,716 4,476 5,772U.S. Bancorp 397,859 12,565 12,653Unum Group 58,251 1,227 1,207Ventas, Inc. REIT 62,525 3,065 4,028Visa, Inc.-Class A 110,305 11,389 16,636Vornado Realty Trust-REIT 35,833 3,055 2,857Wells Fargo & Co. 1,035,828 42,067 35,283XL Group PLC 63,636 1,990 1,587Zions Bancorporation 38,837 1,359 828
527,482 454,433
Health Care — 11.0%
Abbott Laboratories 334,417 19,539 21,813Accenture PLC-Class A 135,087 8,139 8,945Aetna, Inc. 70,781 2,731 3,264Alexion Pharmaceuticals 41,101 4,000 3,836Allergan, Inc. 65,061 4,408 5,940AmerisourceBergen Corp. 49,841 1,399 2,143Amgen, Inc. 162,361 11,625 13,960Baxter International, Inc. 116,226 6,367 7,714Becton Dickinson & Co. 41,683 3,169 3,246Biogen Idec, Inc. 50,055 4,216 7,307Boston Scientific Corp. 290,639 4,102 1,655Bristol-Myers Squibb Co. 349,265 10,496 11,341Cardinal Health, Inc. 71,972 3,221 2,951CareFusion Corp. 46,815 1,427 1,332Celgene Corp. 89,504 5,699 7,009Cerner Corp. 30,848 1,670 2,384Cigna Corp. 60,503 2,373 3,219Coventry Health Care, Inc. 28,460 1,191 1,270Covidien PLC 100,171 5,175 5,758
The accompanying notes are an integral part of the financial statements. 45

BlackRock CDN US Equity Index Fund
Statement of Investment Portfolio — As at December 31, 2012
Security
Par value
(000s)/
Holdings
Average
cost
Fair
value
(in $000s) (in $000s)
Health Care (continued)CR Bard, Inc. 16,205 1,432 1,577DaVita, Inc. 17,731 1,263 1,951DENTSPLY International, Inc. 29,909 1,094 1,179Edwards Lifesciences Corp. 24,415 2,122 2,191Eli Lilly & Co. 216,047 11,397 10,610Express Scripts Holding Co. 172,719 9,781 9,283Forest Laboratories, Inc. 49,611 2,249 1,745Gilead Sciences, Inc. 160,291 7,107 11,729Hospira, Inc. 34,829 1,413 1,083Humana, Inc. 33,489 1,861 2,288Intuitive Surgical, Inc. 8,406 2,961 4,102Johnson & Johnson 586,312 40,718 40,924Laboratory Corp. of America
Holdings 20,025 1,501 1,726Life Technologies Corp. 36,420 1,396 1,781McKesson Corp. 49,935 3,274 4,821Medtronic, Inc. 213,996 10,414 8,740Mylan, Inc. 86,205 1,807 2,358Patterson Cos., Inc. 17,679 628 602PerkinElmer, Inc. 24,370 625 770Perrigo Co. 18,667 1,949 1,933Pfizer, Inc. 1,557,741 40,260 38,916Quest Diagnostics, Inc. 33,662 1,926 1,952St. Jude Medical, Inc. 65,227 2,769 2,348Stryker Corp. 61,189 3,363 3,339Tenet Healthcare Corp. 22,514 662 727Thermo Fisher Scientific, Inc. 76,225 3,747 4,842UnitedHealth Group, Inc. 216,135 10,148 11,673Varian Medical Systems, Inc. 23,160 1,291 1,619Waters Corp. 18,386 1,188 1,595Watson Pharmaceuticals, Inc. 27,044 1,471 2,316WellPoint, Inc. 64,239 4,137 3,897Zimmer Holdings, Inc. 36,715 2,638 2,436
279,539 302,140
Industrials — 10.0%
3M Co. 134,677 12,046 12,451ACE Aviation Holdings, Inc. 71,889 4,520 5,711ADT Corp. 49,174 1,767 2,277Avery Dennison Corp. 21,097 1,001 734Boeing Co. 143,581 10,155 10,778C.H. Robinson Worldwide, Inc. 34,070 2,026 2,145Caterpillar, Inc. 138,349 9,938 12,346Cintas Corp. 22,451 889 914CSX Corp. 218,255 3,500 4,285Cummins, Inc. 37,367 2,225 4,031Danaher Corp. 123,085 5,254 6,853Deere & Co. 82,861 5,040 7,130Dover Corp. 37,888 1,922 2,481
Security
Par value
(000s)/
Holdings
Average
cost
Fair
value
(in $000s) (in $000s)
Industrials (continued)Dun & Bradstreet Corp. 9,465 838 741Eaton Corp. PLC 97,689 4,999 5,272Emerson Electric Co. 153,224 7,058 8,083Equifax, Inc. 25,287 989 1,363Expeditors International of
Washington, Inc. 44,169 1,913 1,739Fastenal Co. 57,087 1,808 2,653FedEx Corp. 61,796 5,732 5,645Flowserve Corp. 10,582 1,067 1,546Fluor Corp. 35,228 1,705 2,062General Dynamics Corp. 70,212 4,857 4,843General Electric Co. 2,218,637 61,395 46,347Honeywell International, Inc. 165,732 8,287 10,475Illinois Tool Works, Inc. 90,223 4,652 5,464Ingersoll-Rand PLC 59,244 2,523 2,829Iron Mountain, Inc. 35,347 1,050 1,092Jacobs Engineering Group, Inc. 27,598 1,560 1,170Joy Global, Inc. 22,336 1,823 1,418L-3 Communications Holdings, Inc. 19,912 1,696 1,518Lockheed Martin Corp. 56,821 4,776 5,223Masco Corp. 75,331 1,625 1,250Norfolk Southern Corp. 66,880 3,731 4,117Northrop Grumman Corp. 51,942 3,406 3,495Paccar, Inc. 74,594 3,014 3,356Pall Corp. 23,519 1,010 1,411Parker Hannifin Corp. 31,533 2,059 2,671Pentair, Ltd. 44,483 1,942 2,177Pitney Bowes, Inc. 42,840 1,362 454Precision Castparts Corp. 30,790 4,106 5,805Quanta Services, Inc. 44,959 1,096 1,221Raytheon Co. 69,806 3,654 4,001Republic Services, Inc. 63,195 1,799 1,846Robert Half International, Inc. 29,909 886 947Rockwell Automation, Inc. 29,485 1,766 2,466Rockwell Collins, Inc. 29,681 1,601 1,719Roper Industries, Inc. 20,813 1,526 2,309Ryder System, Inc. 10,878 510 541Snap-On, Inc. 12,268 651 965Southwest Airlines Co. 155,820 2,034 1,589Stanley Black & Decker, Inc. 35,705 2,172 2,630Stericycle, Inc. 18,179 1,420 1,688Textron, Inc. 59,674 1,807 1,472Union Pacific Corp. 99,530 7,632 12,459United Parcel Service, Inc.-Class B 151,393 11,412 11,116United Technologies Corp. 178,396 12,470 14,567W.W. Grainger, Inc. 12,646 1,567 2,548Waste Management, Inc. 92,246 3,285 3,098Xylem, Inc. 39,149 1,019 1,056
259,573 274,593
The accompanying notes are an integral part of the financial statements. 46
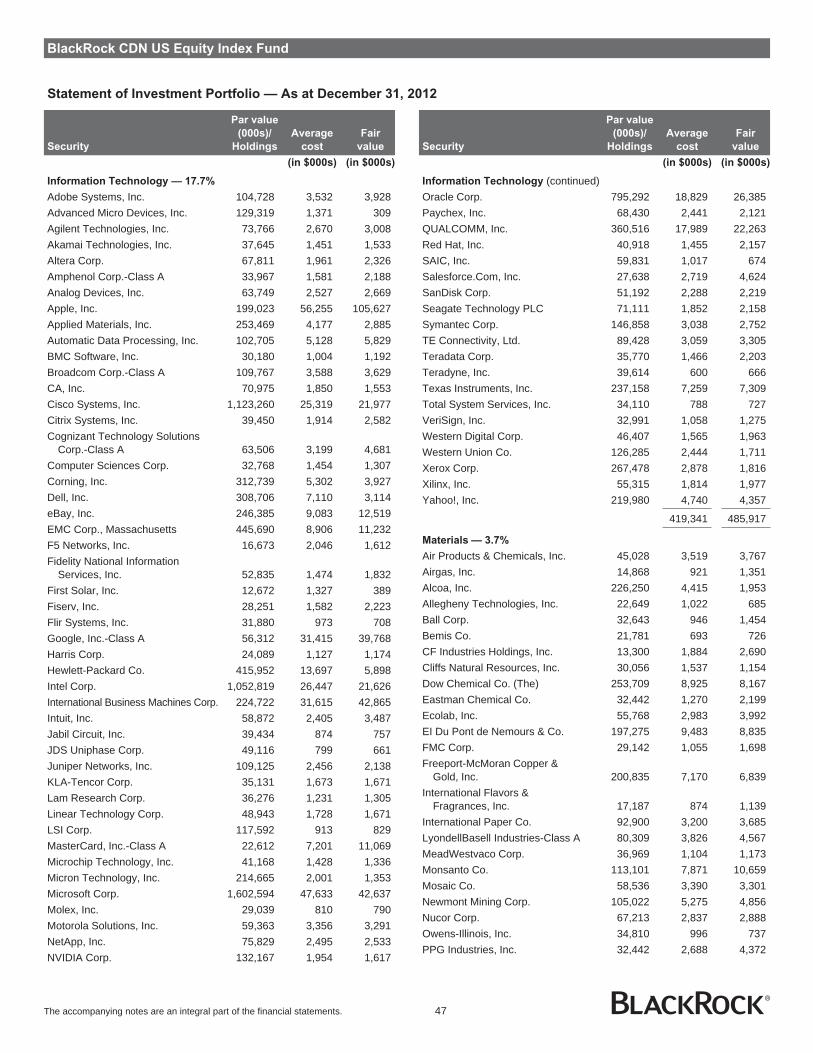
BlackRock CDN US Equity Index Fund
Statement of Investment Portfolio — As at December 31, 2012
Security
Par value
(000s)/
Holdings
Average
cost
Fair
value
(in $000s) (in $000s)
Information Technology — 17.7%
Adobe Systems, Inc. 104,728 3,532 3,928Advanced Micro Devices, Inc. 129,319 1,371 309Agilent Technologies, Inc. 73,766 2,670 3,008Akamai Technologies, Inc. 37,645 1,451 1,533Altera Corp. 67,811 1,961 2,326Amphenol Corp.-Class A 33,967 1,581 2,188Analog Devices, Inc. 63,749 2,527 2,669Apple, Inc. 199,023 56,255 105,627Applied Materials, Inc. 253,469 4,177 2,885Automatic Data Processing, Inc. 102,705 5,128 5,829BMC Software, Inc. 30,180 1,004 1,192Broadcom Corp.-Class A 109,767 3,588 3,629CA, Inc. 70,975 1,850 1,553Cisco Systems, Inc. 1,123,260 25,319 21,977Citrix Systems, Inc. 39,450 1,914 2,582Cognizant Technology Solutions
Corp.-Class A 63,506 3,199 4,681Computer Sciences Corp. 32,768 1,454 1,307Corning, Inc. 312,739 5,302 3,927Dell, Inc. 308,706 7,110 3,114eBay, Inc. 246,385 9,083 12,519EMC Corp., Massachusetts 445,690 8,906 11,232F5 Networks, Inc. 16,673 2,046 1,612Fidelity National Information
Services, Inc. 52,835 1,474 1,832First Solar, Inc. 12,672 1,327 389Fiserv, Inc. 28,251 1,582 2,223Flir Systems, Inc. 31,880 973 708Google, Inc.-Class A 56,312 31,415 39,768Harris Corp. 24,089 1,127 1,174Hewlett-Packard Co. 415,952 13,697 5,898Intel Corp. 1,052,819 26,447 21,626International Business Machines Corp. 224,722 31,615 42,865Intuit, Inc. 58,872 2,405 3,487Jabil Circuit, Inc. 39,434 874 757JDS Uniphase Corp. 49,116 799 661Juniper Networks, Inc. 109,125 2,456 2,138KLA-Tencor Corp. 35,131 1,673 1,671Lam Research Corp. 36,276 1,231 1,305Linear Technology Corp. 48,943 1,728 1,671LSI Corp. 117,592 913 829MasterCard, Inc.-Class A 22,612 7,201 11,069Microchip Technology, Inc. 41,168 1,428 1,336Micron Technology, Inc. 214,665 2,001 1,353Microsoft Corp. 1,602,594 47,633 42,637Molex, Inc. 29,039 810 790Motorola Solutions, Inc. 59,363 3,356 3,291NetApp, Inc. 75,829 2,495 2,533NVIDIA Corp. 132,167 1,954 1,617
Security
Par value
(000s)/
Holdings
Average
cost
Fair
value
(in $000s) (in $000s)
Information Technology (continued)Oracle Corp. 795,292 18,829 26,385Paychex, Inc. 68,430 2,441 2,121QUALCOMM, Inc. 360,516 17,989 22,263Red Hat, Inc. 40,918 1,455 2,157SAIC, Inc. 59,831 1,017 674Salesforce.Com, Inc. 27,638 2,719 4,624SanDisk Corp. 51,192 2,288 2,219Seagate Technology PLC 71,111 1,852 2,158Symantec Corp. 146,858 3,038 2,752TE Connectivity, Ltd. 89,428 3,059 3,305Teradata Corp. 35,770 1,466 2,203Teradyne, Inc. 39,614 600 666Texas Instruments, Inc. 237,158 7,259 7,309Total System Services, Inc. 34,110 788 727VeriSign, Inc. 32,991 1,058 1,275Western Digital Corp. 46,407 1,565 1,963Western Union Co. 126,285 2,444 1,711Xerox Corp. 267,478 2,878 1,816Xilinx, Inc. 55,315 1,814 1,977Yahoo!, Inc. 219,980 4,740 4,357
419,341 485,917
Materials — 3.7%
Air Products & Chemicals, Inc. 45,028 3,519 3,767Airgas, Inc. 14,868 921 1,351Alcoa, Inc. 226,250 4,415 1,953Allegheny Technologies, Inc. 22,649 1,022 685Ball Corp. 32,643 946 1,454Bemis Co. 21,781 693 726CF Industries Holdings, Inc. 13,300 1,884 2,690Cliffs Natural Resources, Inc. 30,056 1,537 1,154Dow Chemical Co. (The) 253,709 8,925 8,167Eastman Chemical Co. 32,442 1,270 2,199Ecolab, Inc. 55,768 2,983 3,992EI Du Pont de Nemours & Co. 197,275 9,483 8,835FMC Corp. 29,142 1,055 1,698Freeport-McMoran Copper &
Gold, Inc. 200,835 7,170 6,839International Flavors &
Fragrances, Inc. 17,187 874 1,139International Paper Co. 92,900 3,200 3,685LyondellBasell Industries-Class A 80,309 3,826 4,567MeadWestvaco Corp. 36,969 1,104 1,173Monsanto Co. 113,101 7,871 10,659Mosaic Co. 58,536 3,390 3,301Newmont Mining Corp. 105,022 5,275 4,856Nucor Corp. 67,213 2,837 2,888Owens-Illinois, Inc. 34,810 996 737PPG Industries, Inc. 32,442 2,688 4,372
The accompanying notes are an integral part of the financial statements. 47
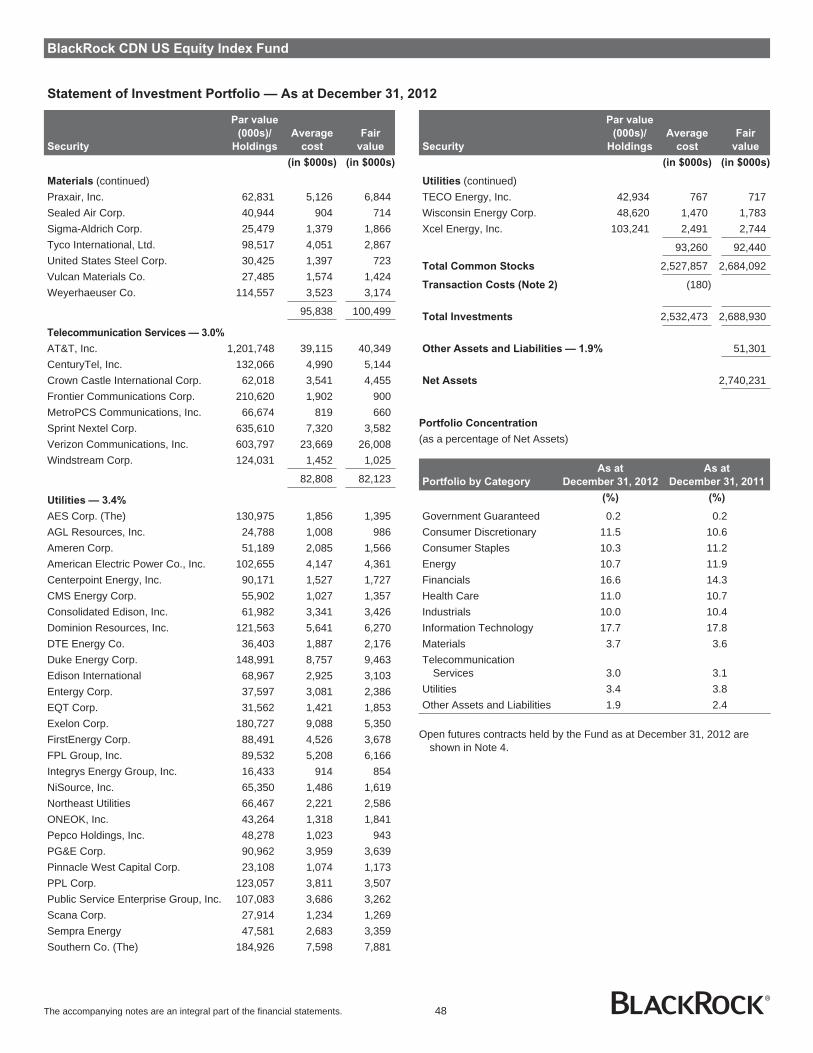
BlackRock CDN US Equity Index Fund
Statement of Investment Portfolio — As at December 31, 2012
Security
Par value
(000s)/
Holdings
Average
cost
Fair
value
(in $000s) (in $000s)
Materials (continued)Praxair, Inc. 62,831 5,126 6,844Sealed Air Corp. 40,944 904 714Sigma-Aldrich Corp. 25,479 1,379 1,866Tyco International, Ltd. 98,517 4,051 2,867United States Steel Corp. 30,425 1,397 723Vulcan Materials Co. 27,485 1,574 1,424Weyerhaeuser Co. 114,557 3,523 3,174
95,838 100,499
Telecommunication Services — 3.0%
AT&T, Inc. 1,201,748 39,115 40,349CenturyTel, Inc. 132,066 4,990 5,144Crown Castle International Corp. 62,018 3,541 4,455Frontier Communications Corp. 210,620 1,902 900MetroPCS Communications, Inc. 66,674 819 660Sprint Nextel Corp. 635,610 7,320 3,582Verizon Communications, Inc. 603,797 23,669 26,008Windstream Corp. 124,031 1,452 1,025
82,808 82,123
Utilities — 3.4%
AES Corp. (The) 130,975 1,856 1,395AGL Resources, Inc. 24,788 1,008 986Ameren Corp. 51,189 2,085 1,566American Electric Power Co., Inc. 102,655 4,147 4,361Centerpoint Energy, Inc. 90,171 1,527 1,727CMS Energy Corp. 55,902 1,027 1,357Consolidated Edison, Inc. 61,982 3,341 3,426Dominion Resources, Inc. 121,563 5,641 6,270DTE Energy Co. 36,403 1,887 2,176Duke Energy Corp. 148,991 8,757 9,463Edison International 68,967 2,925 3,103Entergy Corp. 37,597 3,081 2,386EQT Corp. 31,562 1,421 1,853Exelon Corp. 180,727 9,088 5,350FirstEnergy Corp. 88,491 4,526 3,678FPL Group, Inc. 89,532 5,208 6,166Integrys Energy Group, Inc. 16,433 914 854NiSource, Inc. 65,350 1,486 1,619Northeast Utilities 66,467 2,221 2,586ONEOK, Inc. 43,264 1,318 1,841Pepco Holdings, Inc. 48,278 1,023 943PG&E Corp. 90,962 3,959 3,639Pinnacle West Capital Corp. 23,108 1,074 1,173PPL Corp. 123,057 3,811 3,507Public Service Enterprise Group, Inc. 107,083 3,686 3,262Scana Corp. 27,914 1,234 1,269Sempra Energy 47,581 2,683 3,359Southern Co. (The) 184,926 7,598 7,881
Security
Par value
(000s)/
Holdings
Average
cost
Fair
value
(in $000s) (in $000s)
Utilities (continued)TECO Energy, Inc. 42,934 767 717Wisconsin Energy Corp. 48,620 1,470 1,783Xcel Energy, Inc. 103,241 2,491 2,744
93,260 92,440
Total Common Stocks 2,527,857 2,684,092
Transaction Costs (Note 2) (180)
Total Investments 2,532,473 2,688,930
Other Assets and Liabilities — 1.9% 51,301
Net Assets 2,740,231
Portfolio Concentration
(as a percentage of Net Assets)
Portfolio by Category
As at
December 31, 2012
As at
December 31, 2011
(%) (%)
Government Guaranteed 0.2 0.2Consumer Discretionary 11.5 10.6Consumer Staples 10.3 11.2Energy 10.7 11.9Financials 16.6 14.3Health Care 11.0 10.7Industrials 10.0 10.4Information Technology 17.7 17.8Materials 3.7 3.6Telecommunication
Services 3.0 3.1Utilities 3.4 3.8Other Assets and Liabilities 1.9 2.4
Open futures contracts held by the Fund as at December 31, 2012 areshown in Note 4.
The accompanying notes are an integral part of the financial statements. 48
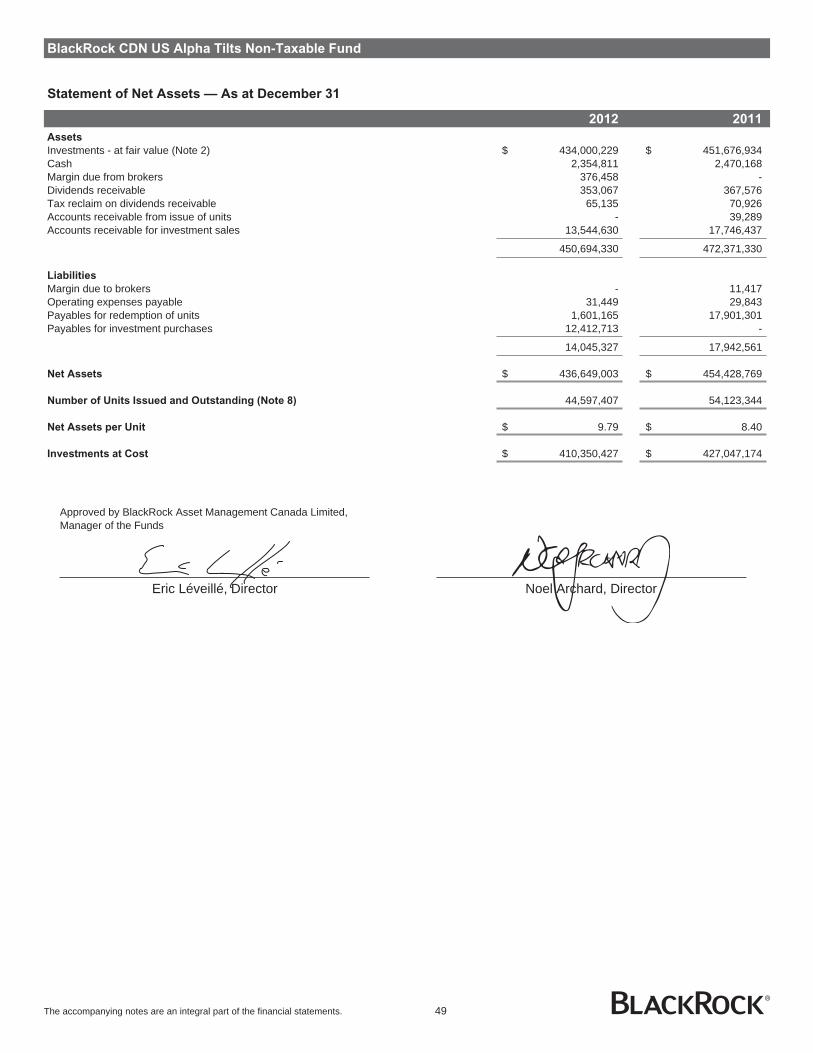
BlackRock CDN US Alpha Tilts Non-Taxable Fund
Statement of Net Assets — As at December 31
2012 2011
Assets
Investments - at fair value (Note 2) $ 434,000,229 $ 451,676,934Cash 2,354,811 2,470,168Margin due from brokers 376,458 -Dividends receivable 353,067 367,576Tax reclaim on dividends receivable 65,135 70,926Accounts receivable from issue of units - 39,289Accounts receivable for investment sales 13,544,630 17,746,437
450,694,330 472,371,330
Liabilities
Margin due to brokers - 11,417Operating expenses payable 31,449 29,843Payables for redemption of units 1,601,165 17,901,301Payables for investment purchases 12,412,713 -
14,045,327 17,942,561
Net Assets $ 436,649,003 $ 454,428,769
Number of Units Issued and Outstanding (Note 8) 44,597,407 54,123,344
Net Assets per Unit $ 9.79 $ 8.40
Investments at Cost $ 410,350,427 $ 427,047,174
Approved by BlackRock Asset Management Canada Limited,Manager of the Funds
Eric Léveillé, Director Noel Archard, Director
The accompanying notes are an integral part of the financial statements. 49

BlackRock CDN US Alpha Tilts Non-Taxable Fund
Statement of Operations — For the Years Ended December 31
2012 2011
Revenue
Dividend income $ 13,510,003 $ 10,621,116Interest income 701 2,253Net gain from futures contracts 317,905 141,382Foreign exchange loss (7,301) (27,561)Withholding taxes (26,255) (26,186)
13,795,053 10,711,004
Expenses
Custodian fees 141,080 124,475Fund accounting expenses 40,780 40,716Unitholder communication costs - 601Audit fees 15,049 15,910Securities filing fees 7,969 7,663Independent review committee fees 246 612Other operating expenses 4,874 1,410
209,998 191,387
Net Investment Income for the Year 13,585,055 10,519,617
Gain on Investments
Net realized gain on sale of investments 60,567,460 26,043,448Transaction costs (Note 2,13) (479,117) (555,681)Net change in unrealized appreciation (depreciation) in value of investments (980,675) 430,615
Net Gain on Investments 59,107,668 25,918,382
Increase in Net Assets from Operations $ 72,692,723 $ 36,437,999
Increase in Net Assets from Operations per Unit $ 1.39 $ 0.56
Statement of Changes In Net Assets — For the Years Ended December 31
2012 2011
Net Assets - Beginning of Year $ 454,428,769 $ 659,929,936
Increase in Net Assets from Operations 72,692,723 36,437,999
Capital Transactions
Proceeds from issue of units 16,762,973 11,602,166Reinvestment of distributions 19,465,987 10,960,012Redemption of units (107,235,462) (253,541,332)
Net capital transactions (71,006,502) (230,979,154)
Distributions
From net investment income (13,603,458) (10,960,012)From capital gains redemption in kind (Note 9) (5,862,529) -
Total distributions (19,465,987) (10,960,012)
Decrease in Net Assets for the Year (17,779,766) (205,501,167)
Net Assets - End of Year $ 436,649,003 $ 454,428,769
The accompanying notes are an integral part of the financial statements. 50
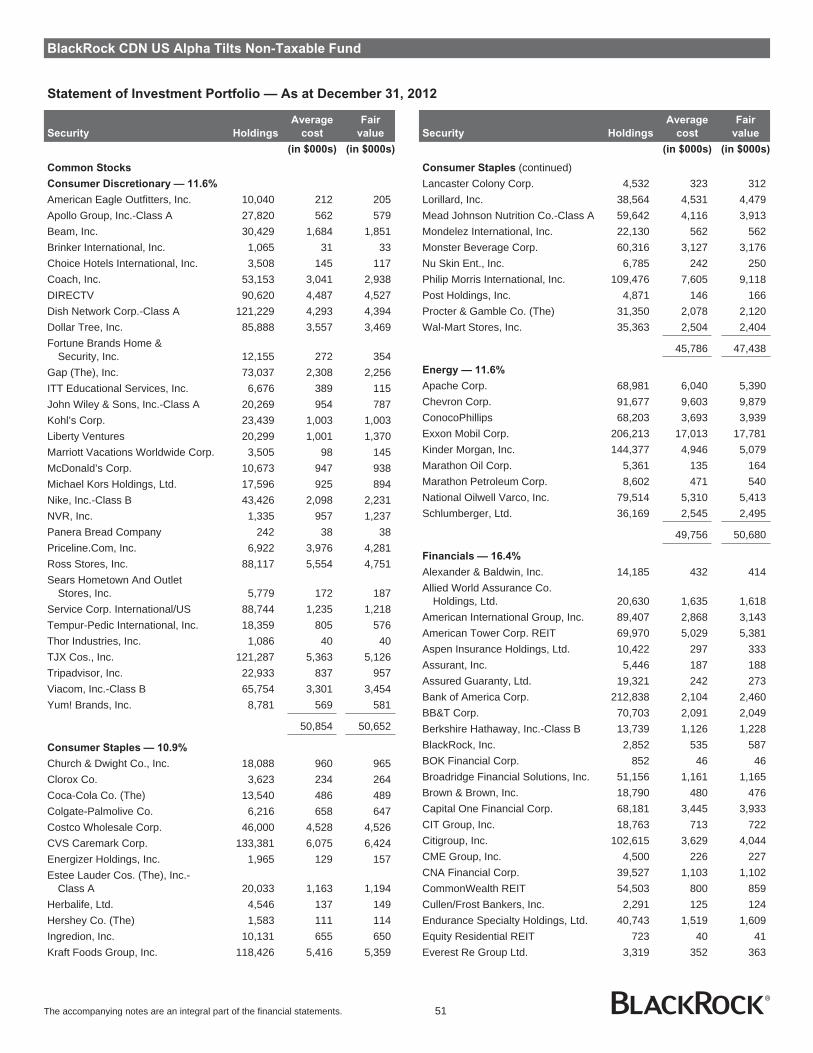
BlackRock CDN US Alpha Tilts Non-Taxable Fund
Statement of Investment Portfolio — As at December 31, 2012
Security Holdings
Average
cost
Fair
value
(in $000s) (in $000s)
Common Stocks
Consumer Discretionary — 11.6%
American Eagle Outfitters, Inc. 10,040 212 205Apollo Group, Inc.-Class A 27,820 562 579Beam, Inc. 30,429 1,684 1,851Brinker International, Inc. 1,065 31 33Choice Hotels International, Inc. 3,508 145 117Coach, Inc. 53,153 3,041 2,938DIRECTV 90,620 4,487 4,527Dish Network Corp.-Class A 121,229 4,293 4,394Dollar Tree, Inc. 85,888 3,557 3,469Fortune Brands Home &
Security, Inc. 12,155 272 354Gap (The), Inc. 73,037 2,308 2,256ITT Educational Services, Inc. 6,676 389 115John Wiley & Sons, Inc.-Class A 20,269 954 787Kohl’s Corp. 23,439 1,003 1,003Liberty Ventures 20,299 1,001 1,370Marriott Vacations Worldwide Corp. 3,505 98 145McDonald’s Corp. 10,673 947 938Michael Kors Holdings, Ltd. 17,596 925 894Nike, Inc.-Class B 43,426 2,098 2,231NVR, Inc. 1,335 957 1,237Panera Bread Company 242 38 38Priceline.Com, Inc. 6,922 3,976 4,281Ross Stores, Inc. 88,117 5,554 4,751Sears Hometown And Outlet
Stores, Inc. 5,779 172 187Service Corp. International/US 88,744 1,235 1,218Tempur-Pedic International, Inc. 18,359 805 576Thor Industries, Inc. 1,086 40 40TJX Cos., Inc. 121,287 5,363 5,126Tripadvisor, Inc. 22,933 837 957Viacom, Inc.-Class B 65,754 3,301 3,454Yum! Brands, Inc. 8,781 569 581
50,854 50,652
Consumer Staples — 10.9%
Church & Dwight Co., Inc. 18,088 960 965Clorox Co. 3,623 234 264Coca-Cola Co. (The) 13,540 486 489Colgate-Palmolive Co. 6,216 658 647Costco Wholesale Corp. 46,000 4,528 4,526CVS Caremark Corp. 133,381 6,075 6,424Energizer Holdings, Inc. 1,965 129 157Estee Lauder Cos. (The), Inc.-
Class A 20,033 1,163 1,194Herbalife, Ltd. 4,546 137 149Hershey Co. (The) 1,583 111 114Ingredion, Inc. 10,131 655 650Kraft Foods Group, Inc. 118,426 5,416 5,359
Security Holdings
Average
cost
Fair
value
(in $000s) (in $000s)
Consumer Staples (continued)Lancaster Colony Corp. 4,532 323 312Lorillard, Inc. 38,564 4,531 4,479Mead Johnson Nutrition Co.-Class A 59,642 4,116 3,913Mondelez International, Inc. 22,130 562 562Monster Beverage Corp. 60,316 3,127 3,176Nu Skin Ent., Inc. 6,785 242 250Philip Morris International, Inc. 109,476 7,605 9,118Post Holdings, Inc. 4,871 146 166Procter & Gamble Co. (The) 31,350 2,078 2,120Wal-Mart Stores, Inc. 35,363 2,504 2,404
45,786 47,438
Energy — 11.6%
Apache Corp. 68,981 6,040 5,390Chevron Corp. 91,677 9,603 9,879ConocoPhillips 68,203 3,693 3,939Exxon Mobil Corp. 206,213 17,013 17,781Kinder Morgan, Inc. 144,377 4,946 5,079Marathon Oil Corp. 5,361 135 164Marathon Petroleum Corp. 8,602 471 540National Oilwell Varco, Inc. 79,514 5,310 5,413Schlumberger, Ltd. 36,169 2,545 2,495
49,756 50,680
Financials — 16.4%
Alexander & Baldwin, Inc. 14,185 432 414Allied World Assurance Co.
Holdings, Ltd. 20,630 1,635 1,618American International Group, Inc. 89,407 2,868 3,143American Tower Corp. REIT 69,970 5,029 5,381Aspen Insurance Holdings, Ltd. 10,422 297 333Assurant, Inc. 5,446 187 188Assured Guaranty, Ltd. 19,321 242 273Bank of America Corp. 212,838 2,104 2,460BB&T Corp. 70,703 2,091 2,049Berkshire Hathaway, Inc.-Class B 13,739 1,126 1,228BlackRock, Inc. 2,852 535 587BOK Financial Corp. 852 46 46Broadridge Financial Solutions, Inc. 51,156 1,161 1,165Brown & Brown, Inc. 18,790 480 476Capital One Financial Corp. 68,181 3,445 3,933CIT Group, Inc. 18,763 713 722Citigroup, Inc. 102,615 3,629 4,044CME Group, Inc. 4,500 226 227CNA Financial Corp. 39,527 1,103 1,102CommonWealth REIT 54,503 800 859Cullen/Frost Bankers, Inc. 2,291 125 124Endurance Specialty Holdings, Ltd. 40,743 1,519 1,609Equity Residential REIT 723 40 41Everest Re Group Ltd. 3,319 352 363
The accompanying notes are an integral part of the financial statements. 51
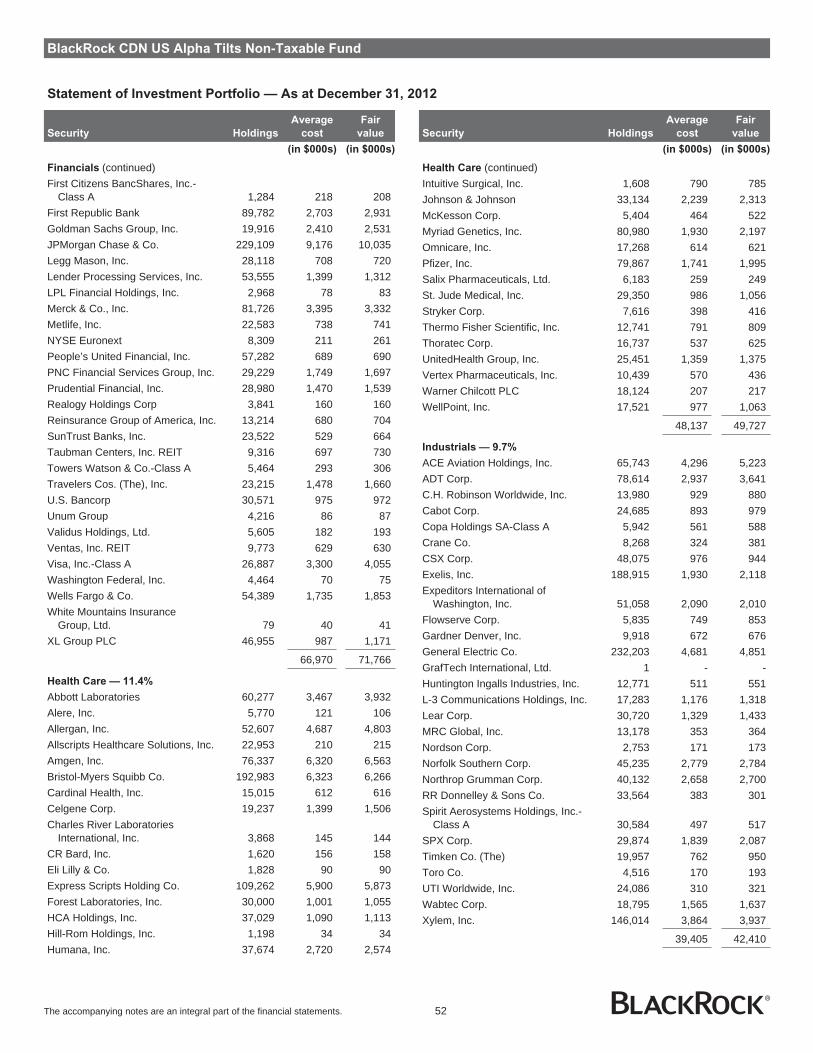
BlackRock CDN US Alpha Tilts Non-Taxable Fund
Statement of Investment Portfolio — As at December 31, 2012
Security Holdings
Average
cost
Fair
value
(in $000s) (in $000s)
Financials (continued)First Citizens BancShares, Inc.-
Class A 1,284 218 208First Republic Bank 89,782 2,703 2,931Goldman Sachs Group, Inc. 19,916 2,410 2,531JPMorgan Chase & Co. 229,109 9,176 10,035Legg Mason, Inc. 28,118 708 720Lender Processing Services, Inc. 53,555 1,399 1,312LPL Financial Holdings, Inc. 2,968 78 83Merck & Co., Inc. 81,726 3,395 3,332Metlife, Inc. 22,583 738 741NYSE Euronext 8,309 211 261People’s United Financial, Inc. 57,282 689 690PNC Financial Services Group, Inc. 29,229 1,749 1,697Prudential Financial, Inc. 28,980 1,470 1,539Realogy Holdings Corp 3,841 160 160Reinsurance Group of America, Inc. 13,214 680 704SunTrust Banks, Inc. 23,522 529 664Taubman Centers, Inc. REIT 9,316 697 730Towers Watson & Co.-Class A 5,464 293 306Travelers Cos. (The), Inc. 23,215 1,478 1,660U.S. Bancorp 30,571 975 972Unum Group 4,216 86 87Validus Holdings, Ltd. 5,605 182 193Ventas, Inc. REIT 9,773 629 630Visa, Inc.-Class A 26,887 3,300 4,055Washington Federal, Inc. 4,464 70 75Wells Fargo & Co. 54,389 1,735 1,853White Mountains Insurance
Group, Ltd. 79 40 41XL Group PLC 46,955 987 1,171
66,970 71,766
Health Care — 11.4%
Abbott Laboratories 60,277 3,467 3,932Alere, Inc. 5,770 121 106Allergan, Inc. 52,607 4,687 4,803Allscripts Healthcare Solutions, Inc. 22,953 210 215Amgen, Inc. 76,337 6,320 6,563Bristol-Myers Squibb Co. 192,983 6,323 6,266Cardinal Health, Inc. 15,015 612 616Celgene Corp. 19,237 1,399 1,506Charles River Laboratories
International, Inc. 3,868 145 144CR Bard, Inc. 1,620 156 158Eli Lilly & Co. 1,828 90 90Express Scripts Holding Co. 109,262 5,900 5,873Forest Laboratories, Inc. 30,000 1,001 1,055HCA Holdings, Inc. 37,029 1,090 1,113Hill-Rom Holdings, Inc. 1,198 34 34Humana, Inc. 37,674 2,720 2,574
Security Holdings
Average
cost
Fair
value
(in $000s) (in $000s)
Health Care (continued)Intuitive Surgical, Inc. 1,608 790 785Johnson & Johnson 33,134 2,239 2,313McKesson Corp. 5,404 464 522Myriad Genetics, Inc. 80,980 1,930 2,197Omnicare, Inc. 17,268 614 621Pfizer, Inc. 79,867 1,741 1,995Salix Pharmaceuticals, Ltd. 6,183 259 249St. Jude Medical, Inc. 29,350 986 1,056Stryker Corp. 7,616 398 416Thermo Fisher Scientific, Inc. 12,741 791 809Thoratec Corp. 16,737 537 625UnitedHealth Group, Inc. 25,451 1,359 1,375Vertex Pharmaceuticals, Inc. 10,439 570 436Warner Chilcott PLC 18,124 207 217WellPoint, Inc. 17,521 977 1,063
48,137 49,727
Industrials — 9.7%
ACE Aviation Holdings, Inc. 65,743 4,296 5,223ADT Corp. 78,614 2,937 3,641C.H. Robinson Worldwide, Inc. 13,980 929 880Cabot Corp. 24,685 893 979Copa Holdings SA-Class A 5,942 561 588Crane Co. 8,268 324 381CSX Corp. 48,075 976 944Exelis, Inc. 188,915 1,930 2,118Expeditors International of
Washington, Inc. 51,058 2,090 2,010Flowserve Corp. 5,835 749 853Gardner Denver, Inc. 9,918 672 676General Electric Co. 232,203 4,681 4,851GrafTech International, Ltd. 1 - -Huntington Ingalls Industries, Inc. 12,771 511 551L-3 Communications Holdings, Inc. 17,283 1,176 1,318Lear Corp. 30,720 1,329 1,433MRC Global, Inc. 13,178 353 364Nordson Corp. 2,753 171 173Norfolk Southern Corp. 45,235 2,779 2,784Northrop Grumman Corp. 40,132 2,658 2,700RR Donnelley & Sons Co. 33,564 383 301Spirit Aerosystems Holdings, Inc.-
Class A 30,584 497 517SPX Corp. 29,874 1,839 2,087Timken Co. (The) 19,957 762 950Toro Co. 4,516 170 193UTI Worldwide, Inc. 24,086 310 321Wabtec Corp. 18,795 1,565 1,637Xylem, Inc. 146,014 3,864 3,937
39,405 42,410
The accompanying notes are an integral part of the financial statements. 52

BlackRock CDN US Alpha Tilts Non-Taxable Fund
Statement of Investment Portfolio — As at December 31, 2012
Security Holdings
Average
cost
Fair
value
(in $000s) (in $000s)
Information Technology — 18.8%
Agilent Technologies, Inc. 27,433 1,010 1,119Altera Corp. 3,699 118 127Amdocs, Ltd. 85,153 2,640 2,880Apple, Inc. 40,605 14,490 21,550Avago Technologies, Ltd. 69,466 2,304 2,190Broadcom Corp.-Class A 32,362 1,043 1,070Cisco Systems, Inc. 40,359 757 790Citrix Systems, Inc. 38,746 2,491 2,536CoreLogic, Inc. 62,117 1,425 1,665Fidelity National Information
Services, Inc. 15,513 532 538First Solar, Inc. 11,036 243 339Flir Systems, Inc. 19,167 374 426Google, Inc.-Class A 13,645 7,996 9,636IAC/InterActiveCorp. 7,502 340 353Ingram Micro, Inc.-Class A 21,590 333 364Intel Corp. 41,343 841 849International Business
Machines Corp. 13,724 2,260 2,618Intuit, Inc. 14,132 832 837KLA-Tencor Corp. 42,359 1,973 2,014LSI Corp. 9,568 66 68Marvell Technology Group, Ltd. 15,752 162 114MasterCard, Inc.-Class A 12,535 4,636 6,136Microsoft Corp. 420,587 11,519 11,190NVIDIA Corp. 12,506 153 153Plantronics, Inc. 2,076 71 76QLogic Corp. 4,132 37 40QUALCOMM, Inc. 91,738 5,398 5,665Skyworks Solutions, Inc. 41,003 868 828SolarWinds, Inc. 23,445 1,312 1,225Synopsys, Inc. 1,828 58 58Tech Data Corp. 1,449 65 66TIBCO Software, Inc. 12,201 247 267Total System Services, Inc. 27,830 602 593VeriSign, Inc. 102,121 4,309 3,947
71,505 82,327
Materials — 2.5%
CF Industries Holdings, Inc. 10,798 2,077 2,183Domtar Corp. 15,540 1,185 1,292Greif, Inc.-Class A 5,446 243 241Hubbell, Inc.-Class B 29,645 2,362 2,499LyondellBasell Industries-Class A 51,569 2,409 2,932Minerals Technologies, Inc. 2,737 107 109NewMarket Corp. 116 30 30Newmont Mining Corp. 4,734 237 219Osisko Mining Corp. 21,239 612 627Royal Gold, Inc. 1,436 123 116Valspar Corp. 3,019 185 188Westlake Chemical Corp. 3,720 278 294
9,848 10,730
Security Holdings
Average
cost
Fair
value
(in $000s) (in $000s)
Telecommunication Services — 4.1%
AT&T, Inc. 302,803 10,376 10,167Echostar Corp.-Class A 3,304 105 112MetroPCS Communications, Inc. 97,194 1,028 962Telephone & Data Systems, Inc. 78,654 1,768 1,733U.S. Cellular Corp. 11,873 441 417Verizon Communications, Inc. 100,265 4,088 4,319
17,806 17,710
Utilities — 2.4%
AES Corp. (The) 164,840 1,817 1,756Ameren Corp. 40,085 1,175 1,227American Water Works Co., Inc. 116,607 3,991 4,309Consolidated Edison, Inc. 21,843 1,208 1,207ONEOK, Inc. 4,466 156 190PG&E Corp. 46,766 2,046 1,871
10,393 10,560
Total Common Stocks 410,460 434,000
Transaction Costs (Note 2) (110)
Total Investments 410,350 434,000
Other Assets and Liabilities — 0.6% 2,649
Net Assets 436,649
Portfolio Concentration
(as a percentage of Net Assets)
Portfolio by Category
As at
December 31, 2012
As at
December 31, 2011
(%) (%)
Government Guaranteed - 0.1Consumer Discretionary 11.6 13.8Consumer Staples 10.9 10.9Energy 11.6 12.5Financials 16.4 13.0Health Care 11.4 12.4Industrials 9.7 8.1Information Technology 18.8 20.0Materials 2.5 2.9Telecommunication
Services 4.1 2.8Utilities 2.4 2.9Other Assets and Liabilities 0.6 0.6
Open futures contracts held by the Fund as at December 31, 2012 areshown in Note 4.
The accompanying notes are an integral part of the financial statements. 53

BlackRock CDN US Alpha Tilts Hedged Non-Taxable Fund
Statement of Net Assets — As at December 31
2012 2011
Assets
Investments - at fair value (Note 2) $ 28,516,146 $ 23,856,883Cash 13,856 14,828Net unrealized gain on forward currency contracts (Note 5) 25,349 1,069,984Accounts receivable for investment sales 5,148 8,404,769
28,560,499 33,346,464
Liabilities
Operating expenses payable 14,927 16,055Payables for redemption of units - 9,139,074Payables for investment purchases - 39,289Net unrealized loss on forward currency contracts (Note 5) 54,958 142,266
69,885 9,336,684
Net Assets $ 28,490,614 $ 24,009,780
Number of Units Issued and Outstanding (Note 8) 2,339,243 2,349,029
Net Assets per Unit $ 12.18 $ 10.22
Investments at Cost $ 27,318,655 $ 25,811,031
Approved by BlackRock Asset Management Canada Limited,Manager of the Funds
Eric Léveillé, Director Noel Archard, Director
The accompanying notes are an integral part of the financial statements. 54

BlackRock CDN US Alpha Tilts Hedged Non-Taxable Fund
Statement of Operations — For the Years Ended December 31
2012 2011
Revenue
Dividend income $ 816,040 $ 788,639
816,040 788,639
Expenses
Custodian fees 210 203Fund accounting expenses 6,156 13,303Unitholder communication costs - 601Audit fees 13,720 14,295Securities filing fees 454 506Independent review committee fees 17 41Other operating expenses 631 1,704
21,188 30,653
Net Investment Income for the Year 794,852 757,986
Gain on Investments
Net realized gain (loss) on sale of investments 36,121 (2,070,716)Net realized gain (loss) from forward currency contracts 1,560,820 (849,587)Net change in unrealized appreciation in value of investments 3,151,639 3,429,051Net change in unrealized appreciation (depreciation) in value of forward currency contracts (957,327) 57,680
Net Gain on Investments 3,791,253 566,428
Increase in Net Assets from Operations $ 4,586,105 $ 1,324,414
Increase in Net Assets from Operations per Unit $ 1.96 $ 0.39
Statement of Changes in Net Assets — For the Years Ended December 31
2012 2011
Net Assets - Beginning of Year $ 24,009,780 $ 36,775,704
Increase in Net Assets from Operations 4,586,105 1,324,414
Capital Transactions
Proceeds from issue of units - 1,099,019Reinvestment of distributions 794,853 757,904Redemption of units (105,271) (15,189,357)
Net capital transactions 689,582 (13,332,434)
Distributions
From net investment income (794,853) (757,904)
Total distributions (794,853) (757,904)
Increase (Decrease) in Net Assets for the Year 4,480,834 (12,765,924)
Net Assets - End of Year $ 28,490,614 $ 24,009,780
The accompanying notes are an integral part of the financial statements. 55
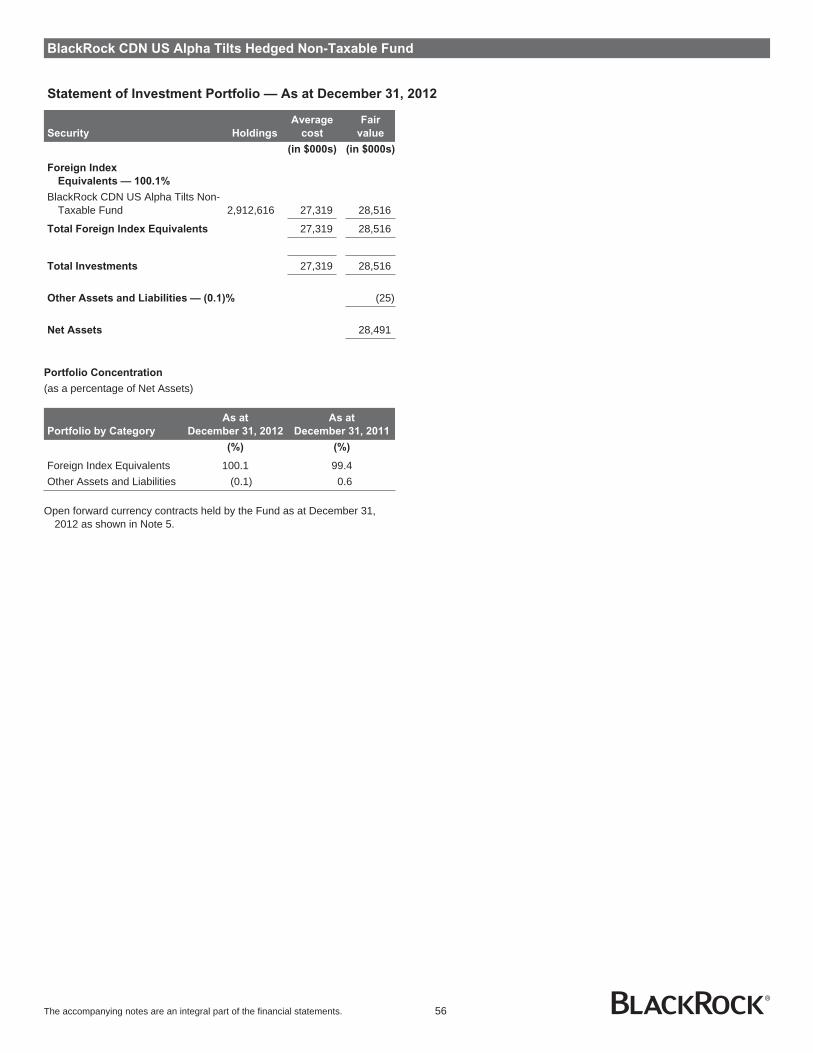
BlackRock CDN US Alpha Tilts Hedged Non-Taxable Fund
Statement of Investment Portfolio — As at December 31, 2012
Security Holdings
Average
cost
Fair
value
(in $000s) (in $000s)
Foreign Index
Equivalents — 100.1%
BlackRock CDN US Alpha Tilts Non-Taxable Fund 2,912,616 27,319 28,516
Total Foreign Index Equivalents 27,319 28,516
Total Investments 27,319 28,516
Other Assets and Liabilities — (0.1)% (25)
Net Assets 28,491
Portfolio Concentration
(as a percentage of Net Assets)
Portfolio by Category
As at
December 31, 2012
As at
December 31, 2011
(%) (%)
Foreign Index Equivalents 100.1 99.4Other Assets and Liabilities (0.1) 0.6
Open forward currency contracts held by the Fund as at December 31,2012 as shown in Note 5.
The accompanying notes are an integral part of the financial statements. 56

BlackRock CDN Russell 3000 Index Non-Taxable Fund
Statement of Net Assets — As at December 31
2012 2011
Assets
Investments - at fair value* (Note 2) $ 394,366,576 $ 374,943,193Cash 4,715,915 7,304,091Margin due from brokers 163,006 -Securities lending income receivable 1,555 -Dividends receivable 448,556 596,002Tax reclaim on dividends receivable 26,355 13,383Accounts receivable from issue of units - 7,047,355Accounts receivable for investment sales 31,617 46,503
399,753,580 389,950,527
Liabilities
Margin due to brokers - 36,038Operating expenses payable 25,136 21,185Payables for investment purchases - 12,343,152
25,136 12,400,375
Net Assets $ 399,728,444 $ 377,550,152
Number of Units Issued and Outstanding (Note 8) 33,314,102 35,822,734
Net Assets per Unit $ 12.00 $ 10.54
Investments at Cost* $ 353,733,365 $ 366,306,929
* Includes short-term investments
Approved by BlackRock Asset Management Canada Limited,Manager of the Funds
Eric Léveillé, Director Noel Archard, Director
The accompanying notes are an integral part of the financial statements. 57

BlackRock CDN Russell 3000 Index Non-Taxable Fund
Statement of Operations — For the Years Ended December 31
2012 2011
Revenue
Dividend income $ 9,355,043 $ 11,822,589Interest income* 12,270 (28,139)Securities lending income 1,613 –Net gain (loss) from futures contracts 847,010 (693,018)Foreign exchange gain (loss) (97,348) 491,515Withholding taxes (6,107) (9,458)
10,112,481 11,583,489
Expenses
Custodian fees 111,292 106,158Fund accounting expenses 39,149 42,381Unitholder communication costs - 601Audit fees 13,543 14,148Securities filing fees 6,544 8,281Independent review committee fees 200 609Other operating expenses 15,359 15,636
186,087 187,814
Net Investment Income for the Year 9,926,394 11,395,675
Gain on Investments
Net realized gain on sale of investments 7,898,584 5,513,790Transaction costs (Note 2,13) (16,016) (53,961)Net change in unrealized appreciation (depreciation) in value of investments 31,986,530 (193,586)
Net Gain on Investments 39,869,098 5,266,243
Increase in Net Assets from Operations $ 49,795,492 $ 16,661,918
Increase in Net Assets from Operations per Unit $ 1.44 $ 0.31
* Interest Income, net of foreign exchange loss
Statement of Changes in Net Assets — For the Years Ended December 31
2012 2011
Net Assets - Beginning of Year $ 377,550,152 $ 603,359,248
Increase in Net Assets from Operations 49,795,492 16,661,918
Capital Transactions
Proceeds from issue of units 440,637,183 186,355,199Reinvestment of distributions 20,596,120 17,675,842Redemption of units (468,254,383) (428,826,213)
Net capital transactions (7,021,080) (224,795,172)
Distributions
From net investment income (9,949,087) (11,429,010)From capital gains (10,647,033) (6,246,832)
Total distributions (20,596,120) (17,675,842)
Increase (Decrease) in Net Assets for the Year 22,178,292 (225,809,096)
Net Assets - End of Year $ 399,728,444 $ 377,550,152
The accompanying notes are an integral part of the financial statements. 58
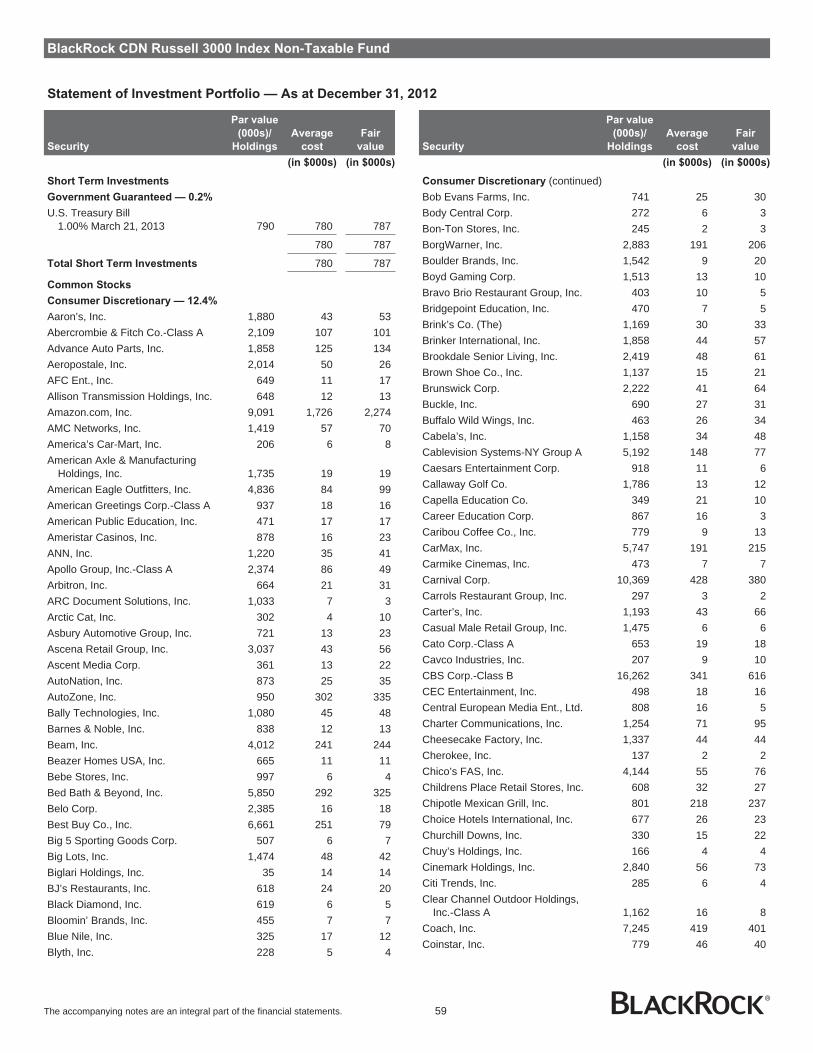
BlackRock CDN Russell 3000 Index Non-Taxable Fund
Statement of Investment Portfolio — As at December 31, 2012
Security
Par value
(000s)/
Holdings
Average
cost
Fair
value
(in $000s) (in $000s)
Short Term Investments
Government Guaranteed — 0.2%
U.S. Treasury Bill1.00% March 21, 2013 790 780 787
780 787
Total Short Term Investments 780 787
Common Stocks
Consumer Discretionary — 12.4%
Aaron’s, Inc. 1,880 43 53Abercrombie & Fitch Co.-Class A 2,109 107 101Advance Auto Parts, Inc. 1,858 125 134Aeropostale, Inc. 2,014 50 26AFC Ent., Inc. 649 11 17Allison Transmission Holdings, Inc. 648 12 13Amazon.com, Inc. 9,091 1,726 2,274AMC Networks, Inc. 1,419 57 70America’s Car-Mart, Inc. 206 6 8American Axle & Manufacturing
Holdings, Inc. 1,735 19 19American Eagle Outfitters, Inc. 4,836 84 99American Greetings Corp.-Class A 937 18 16American Public Education, Inc. 471 17 17Ameristar Casinos, Inc. 878 16 23ANN, Inc. 1,220 35 41Apollo Group, Inc.-Class A 2,374 86 49Arbitron, Inc. 664 21 31ARC Document Solutions, Inc. 1,033 7 3Arctic Cat, Inc. 302 4 10Asbury Automotive Group, Inc. 721 13 23Ascena Retail Group, Inc. 3,037 43 56Ascent Media Corp. 361 13 22AutoNation, Inc. 873 25 35AutoZone, Inc. 950 302 335Bally Technologies, Inc. 1,080 45 48Barnes & Noble, Inc. 838 12 13Beam, Inc. 4,012 241 244Beazer Homes USA, Inc. 665 11 11Bebe Stores, Inc. 997 6 4Bed Bath & Beyond, Inc. 5,850 292 325Belo Corp. 2,385 16 18Best Buy Co., Inc. 6,661 251 79Big 5 Sporting Goods Corp. 507 6 7Big Lots, Inc. 1,474 48 42Biglari Holdings, Inc. 35 14 14BJ’s Restaurants, Inc. 618 24 20Black Diamond, Inc. 619 6 5Bloomin’ Brands, Inc. 455 7 7Blue Nile, Inc. 325 17 12Blyth, Inc. 228 5 4
Security
Par value
(000s)/
Holdings
Average
cost
Fair
value
(in $000s) (in $000s)
Consumer Discretionary (continued)Bob Evans Farms, Inc. 741 25 30Body Central Corp. 272 6 3Bon-Ton Stores, Inc. 245 2 3BorgWarner, Inc. 2,883 191 206Boulder Brands, Inc. 1,542 9 20Boyd Gaming Corp. 1,513 13 10Bravo Brio Restaurant Group, Inc. 403 10 5Bridgepoint Education, Inc. 470 7 5Brink’s Co. (The) 1,169 30 33Brinker International, Inc. 1,858 44 57Brookdale Senior Living, Inc. 2,419 48 61Brown Shoe Co., Inc. 1,137 15 21Brunswick Corp. 2,222 41 64Buckle, Inc. 690 27 31Buffalo Wild Wings, Inc. 463 26 34Cabela’s, Inc. 1,158 34 48Cablevision Systems-NY Group A 5,192 148 77Caesars Entertainment Corp. 918 11 6Callaway Golf Co. 1,786 13 12Capella Education Co. 349 21 10Career Education Corp. 867 16 3Caribou Coffee Co., Inc. 779 9 13CarMax, Inc. 5,747 191 215Carmike Cinemas, Inc. 473 7 7Carnival Corp. 10,369 428 380Carrols Restaurant Group, Inc. 297 3 2Carter’s, Inc. 1,193 43 66Casual Male Retail Group, Inc. 1,475 6 6Cato Corp.-Class A 653 19 18Cavco Industries, Inc. 207 9 10CBS Corp.-Class B 16,262 341 616CEC Entertainment, Inc. 498 18 16Central European Media Ent., Ltd. 808 16 5Charter Communications, Inc. 1,254 71 95Cheesecake Factory, Inc. 1,337 44 44Cherokee, Inc. 137 2 2Chico’s FAS, Inc. 4,144 55 76Childrens Place Retail Stores, Inc. 608 32 27Chipotle Mexican Grill, Inc. 801 218 237Choice Hotels International, Inc. 677 26 23Churchill Downs, Inc. 330 15 22Chuy’s Holdings, Inc. 166 4 4Cinemark Holdings, Inc. 2,840 56 73Citi Trends, Inc. 285 6 4Clear Channel Outdoor Holdings,
Inc.-Class A 1,162 16 8Coach, Inc. 7,245 419 401Coinstar, Inc. 779 46 40
The accompanying notes are an integral part of the financial statements. 59

BlackRock CDN Russell 3000 Index Non-Taxable Fund
Statement of Investment Portfolio — As at December 31, 2012
Security
Par value
(000s)/
Holdings
Average
cost
Fair
value
(in $000s) (in $000s)
Consumer Discretionary (continued)Columbia Sportswear Co. 287 17 15Comcast Corp.-Class A 67,384 1,566 2,508Conn’s, Inc. 476 9 15Cooper Tire & Rubber Co. 1,541 33 39Core-Mark Holding Co., Inc. 271 10 13Corinthian Colleges, Inc. 2,293 7 6Cracker Barrel Old Country Store, Inc. 484 27 31Crocs, Inc. 2,248 40 32CSS Industries, Inc. 310 6 7Cumulus Media, Inc.-Class A 1,162 4 3D.R. Horton, Inc. 7,003 84 138Dana Holding Corp. 3,649 58 57Darden Restaurants, Inc. 3,223 160 145Deckers Outdoor Corp. 959 75 38Delphi Automotive PLC 8,208 239 313Delta Apparel, Inc. 141 2 2Denny’s Corp. 2,701 10 13Destination Maternity Corp. 338 6 7Devry, Inc. 1,626 66 38Dick’s Sporting Goods, Inc. 2,358 89 107Digital Generation, Inc. 789 14 9Dillard’s, Inc.-Class A 729 29 61DineEquity, Inc. 394 20 26DIRECTV 15,228 659 761Discovery Communications-Class A 6,311 275 399Dish Network Corp.-Class A 5,142 110 186Dollar General Corp. 4,636 202 204Dollar Tree, Inc. 5,826 186 235Domino’s Pizza, Inc. 1,435 31 62Dorman Products, Inc. 604 12 21DreamWorks Animation SKG, Inc. 1,696 49 28Drew Industries, Inc. 520 12 17DSW, Inc.-Class A 818 38 53Dunkin’ Brands Group, Inc. 1,797 60 59Education Management Corp. 1,082 8 5Electrolux AB-Class B 7,864 123 114Entercom Communications
Corp.-Class A 797 6 6Ethan Allen Interiors, Inc. 656 12 17EW Scripps Co.-Class A 693 7 7Exide Technologies 1,629 14 6Expedia, Inc. 2,223 117 136Express, Inc. 2,223 43 33Family Dollar Stores, Inc. 2,427 129 153Federal-Mogul Corp. 259 5 2Fiesta Restaurant Group, Inc. 484 6 7Fifth & Pacific Co., Inc. 2,705 22 33Finish Line, Inc.-Class A 1,278 24 24Fisher Communications, Inc. 273 8 7
Security
Par value
(000s)/
Holdings
Average
cost
Fair
value
(in $000s) (in $000s)
Consumer Discretionary (continued)Five Below, Inc. 274 11 9Foot Locker, Inc. 3,741 81 120Ford Motor Co. 94,152 1,427 1,214Fortune Brands Home & Security, Inc. 3,950 58 115Fossil, Inc. 1,357 102 126Francesca’s Holdings Corp. 871 23 22Fred’s, Inc.-Class A 825 11 11Fuel Systems Solutions, Inc. 349 12 5G-III Apparel Group, Ltd. 430 12 15GameStop Corp.-Class A 3,079 65 77Gannett Co., Inc. 5,799 81 104Gap (The), Inc. 7,617 178 235Garmin, Ltd. 2,709 88 110General Cable Corp. 1,244 41 38General Motors Co. 19,254 534 553Genesco, Inc. 609 29 33Gentex Corp. 3,563 85 67Gentherm, Inc. 787 12 10Genuine Parts Co. 3,904 203 247Global Sources, Ltd. 767 5 5GNC Holdings, Inc.-Class A 1,711 57 57Goodyear Tire & Rubber Co. (The) 6,034 67 83Gordmans Stores, Inc. 282 5 4Grand Canyon Education, Inc. 1,014 19 24Group 1 Automotive, Inc. 574 24 35Groupon, Inc. 974 23 5H&R Block, Inc. 6,779 90 125Hanesbrands, Inc. 2,415 67 86Harley-Davidson, Inc. 5,858 208 285Harman International Industries, Inc. 1,750 80 78Harte-Hanks, Inc. 887 11 5Hasbro, Inc. 2,858 129 102Haverty Furniture Cos., Inc. 561 6 9Helen of Troy, Ltd. 812 21 27Hertz Global Holdings, Inc. 6,313 85 102hhgregg, Inc. 400 6 3Hibbett Sports, Inc. 661 27 35Hillenbrand, Inc. 1,383 27 31Home Depot, Inc. 38,399 1,397 2,365HOT Topic, Inc. 890 6 9Hovnanian Ent., Inc. 2,899 6 20HSN, Inc. 952 31 52Hyatt Hotels Corp.-Class A 1,101 47 42Iconix Brand Group, Inc. 1,766 34 39Ignite Restaurant Group, Inc. 266 5 3International Game Technology 6,617 105 93International Speedway
Corp.-Class A 699 18 19Interpublic Group of Cos., Inc. 10,918 118 120
The accompanying notes are an integral part of the financial statements. 60

BlackRock CDN Russell 3000 Index Non-Taxable Fund
Statement of Investment Portfolio — As at December 31, 2012
Security
Par value
(000s)/
Holdings
Average
cost
Fair
value
(in $000s) (in $000s)
Consumer Discretionary (continued)Interval Leisure Group, Inc. 896 16 17iRobot Corp. 704 16 13Isle of Capri Casinos, Inc. 698 6 4ITT Educational Services, Inc. 618 34 11Jack in the Box, Inc. 1,108 24 32Jakks Pacific, Inc. 580 11 7Jamba, Inc. 1,330 3 3Jarden Corp. 1,971 66 101JC Penney Co., Inc. 3,953 131 78John Wiley & Sons, Inc.-Class A 1,153 51 45Johnson Controls, Inc. 17,134 621 523Jones Group, Inc. 2,047 29 23JOS A Bank Clothiers, Inc. 701 31 30Journal Communications, Inc. 1,176 6 6K-Swiss, Inc.-Class A 946 12 3K12, Inc. 708 18 14KB Home 1,954 24 31Kirkland’s, Inc. 500 6 5Kohl’s Corp. 6,008 333 257Krispy Kreme Doughnuts, Inc. 1,514 10 14La-Z-Boy, Inc. 1,229 10 17Lamar Advertising Co.-Class A 1,919 67 74Las Vegas Sands Corp. 10,017 486 460Leapfrog Ent., Inc. 1,147 8 10Leggett & Platt, Inc. 3,544 79 96Lennar Corp.-Class A 4,076 76 157Libbey, Inc. 427 6 8Liberty Global, Inc. 6,602 263 414Liberty Media Corp. 2,731 203 315Liberty Ventures 968 46 65Life Time Fitness, Inc. 1,068 45 52Lifetime Brands, Inc. 247 3 3LIN TV Corp.-Class A 618 3 5Lincoln Educational Services Corp. 719 11 4Lions Gate Entertainment Corp. 2,123 24 35Lithia Motors, Inc.-Class A 560 10 21Live Nation Entertainment, Inc. 3,480 37 32LKQ Corp. 7,451 95 157Lowe’s Cos., Inc. 28,239 697 999Ltd. Brands 6,070 225 284Lumber Liquidators Holdings, Inc. 688 20 36M/I Homes, Inc. 521 7 14Mac-Gray Corp. 401 6 5Macy’s, Inc. 10,391 294 404Madison Square Garden, Inc. 1,506 41 66Maidenform Brands, Inc. 646 16 13Marcus Corp. 617 6 8MarineMax, Inc. 406 3 4
Security
Par value
(000s)/
Holdings
Average
cost
Fair
value
(in $000s) (in $000s)
Consumer Discretionary (continued)Marriott International, Inc.-Class A 6,403 252 238Marriott Vacations Worldwide Corp. 668 13 28Martha Stewart Living Omnimedia-
Class A 394 2 1Mattel, Inc. 8,632 237 315Matthews International Corp.-Class A 712 24 23Mattress Firm Holding Corp. 300 8 7McClatchy Co.-Class A 1,373 7 4McDonald’s Corp. 25,493 2,114 2,240McGraw-Hill Cos. (The), Inc. 7,042 272 383MDC Holdings, Inc. 950 27 35MDC Partners, Inc.-Class A 568 10 6Men’s Wearhouse, Inc. 1,267 38 39Meredith Corp. 903 31 31Meritage Homes Corp. 819 20 30MGM Resorts International 10,121 123 117Michael Kors Holdings, Ltd. 2,163 101 110Modine Manufacturing Co. 1,211 18 10Mohawk Industries, Inc. 1,412 81 127Monro Muffler Brake, Inc. 769 26 27Morgans Hotel Group Co. 836 6 5Morningstar, Inc. 598 31 37Movado Group, Inc. 463 9 14MTR Gaming Group, Inc. 942 5 4Multimedia Games Holding Co., Inc. 599 6 9National CineMedia, Inc. 1,443 26 20NetFlix, Inc. 1,411 246 130New York Times Co.-Class A 3,403 32 29Newell Rubbermaid, Inc. 7,319 130 162News Corp.-Class A 52,582 834 1,337Nike, Inc.-Class B 18,188 826 934Nordstrom, Inc. 3,972 183 212Nutrisystem, Inc. 732 15 6NVR, Inc. 128 88 119O’Reilly Automotive, Inc. 2,984 195 266Office Depot, Inc. 7,663 35 25OfficeMax, Inc. 2,297 38 22Omnicom Group 6,846 324 341Orchard Supply Hardware Stores
Corp.-Class A 43 - -Orient-Express Hotels, Ltd. 2,335 28 27Overstock.Com, Inc. 195 3 3Oxford Industries, Inc. 377 12 17Pandora Media, Inc. 2,525 30 23Panera Bread Company 722 83 114Papa John’s International, Inc. 456 14 25Penn National Gaming, Inc. 1,631 60 80Penske Automotive Group, Inc. 1,061 19 32PEP Boys-Manny Moe & Jack 1,221 16 12
The accompanying notes are an integral part of the financial statements. 61
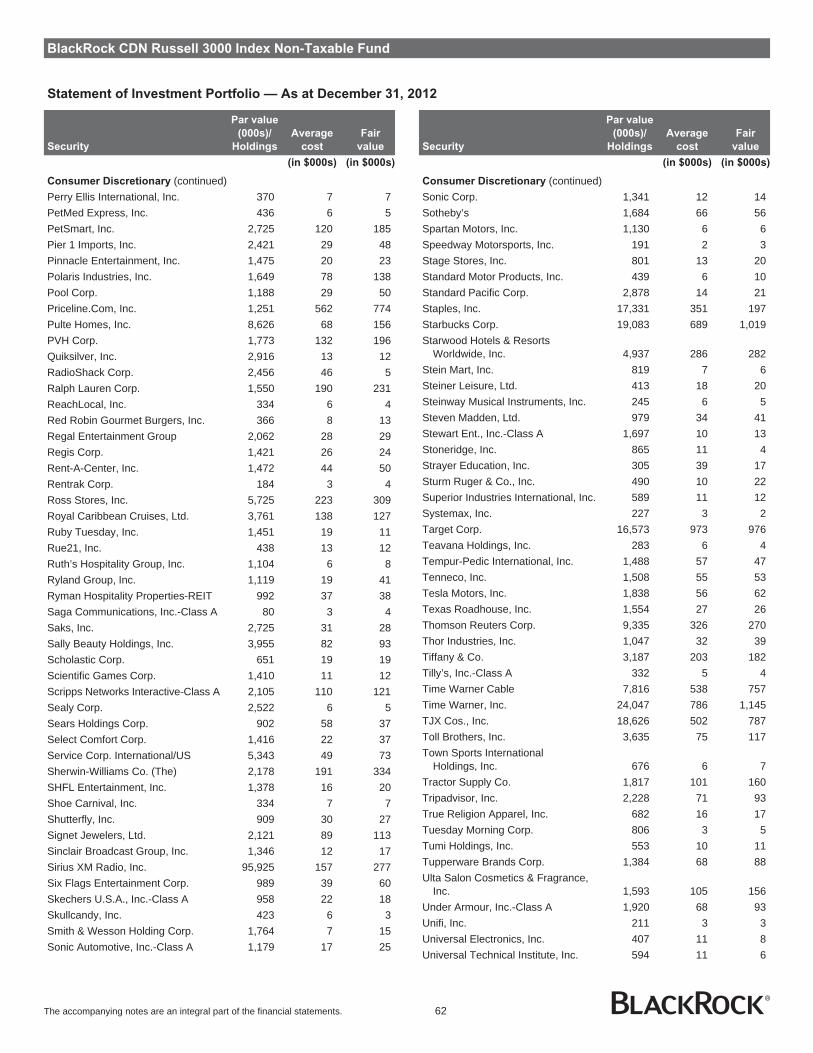
BlackRock CDN Russell 3000 Index Non-Taxable Fund
Statement of Investment Portfolio — As at December 31, 2012
Security
Par value
(000s)/
Holdings
Average
cost
Fair
value
(in $000s) (in $000s)
Consumer Discretionary (continued)Perry Ellis International, Inc. 370 7 7PetMed Express, Inc. 436 6 5PetSmart, Inc. 2,725 120 185Pier 1 Imports, Inc. 2,421 29 48Pinnacle Entertainment, Inc. 1,475 20 23Polaris Industries, Inc. 1,649 78 138Pool Corp. 1,188 29 50Priceline.Com, Inc. 1,251 562 774Pulte Homes, Inc. 8,626 68 156PVH Corp. 1,773 132 196Quiksilver, Inc. 2,916 13 12RadioShack Corp. 2,456 46 5Ralph Lauren Corp. 1,550 190 231ReachLocal, Inc. 334 6 4Red Robin Gourmet Burgers, Inc. 366 8 13Regal Entertainment Group 2,062 28 29Regis Corp. 1,421 26 24Rent-A-Center, Inc. 1,472 44 50Rentrak Corp. 184 3 4Ross Stores, Inc. 5,725 223 309Royal Caribbean Cruises, Ltd. 3,761 138 127Ruby Tuesday, Inc. 1,451 19 11Rue21, Inc. 438 13 12Ruth’s Hospitality Group, Inc. 1,104 6 8Ryland Group, Inc. 1,119 19 41Ryman Hospitality Properties-REIT 992 37 38Saga Communications, Inc.-Class A 80 3 4Saks, Inc. 2,725 31 28Sally Beauty Holdings, Inc. 3,955 82 93Scholastic Corp. 651 19 19Scientific Games Corp. 1,410 11 12Scripps Networks Interactive-Class A 2,105 110 121Sealy Corp. 2,522 6 5Sears Holdings Corp. 902 58 37Select Comfort Corp. 1,416 22 37Service Corp. International/US 5,343 49 73Sherwin-Williams Co. (The) 2,178 191 334SHFL Entertainment, Inc. 1,378 16 20Shoe Carnival, Inc. 334 7 7Shutterfly, Inc. 909 30 27Signet Jewelers, Ltd. 2,121 89 113Sinclair Broadcast Group, Inc. 1,346 12 17Sirius XM Radio, Inc. 95,925 157 277Six Flags Entertainment Corp. 989 39 60Skechers U.S.A., Inc.-Class A 958 22 18Skullcandy, Inc. 423 6 3Smith & Wesson Holding Corp. 1,764 7 15Sonic Automotive, Inc.-Class A 1,179 17 25
Security
Par value
(000s)/
Holdings
Average
cost
Fair
value
(in $000s) (in $000s)
Consumer Discretionary (continued)Sonic Corp. 1,341 12 14Sotheby’s 1,684 66 56Spartan Motors, Inc. 1,130 6 6Speedway Motorsports, Inc. 191 2 3Stage Stores, Inc. 801 13 20Standard Motor Products, Inc. 439 6 10Standard Pacific Corp. 2,878 14 21Staples, Inc. 17,331 351 197Starbucks Corp. 19,083 689 1,019Starwood Hotels & Resorts
Worldwide, Inc. 4,937 286 282Stein Mart, Inc. 819 7 6Steiner Leisure, Ltd. 413 18 20Steinway Musical Instruments, Inc. 245 6 5Steven Madden, Ltd. 979 34 41Stewart Ent., Inc.-Class A 1,697 10 13Stoneridge, Inc. 865 11 4Strayer Education, Inc. 305 39 17Sturm Ruger & Co., Inc. 490 10 22Superior Industries International, Inc. 589 11 12Systemax, Inc. 227 3 2Target Corp. 16,573 973 976Teavana Holdings, Inc. 283 6 4Tempur-Pedic International, Inc. 1,488 57 47Tenneco, Inc. 1,508 55 53Tesla Motors, Inc. 1,838 56 62Texas Roadhouse, Inc. 1,554 27 26Thomson Reuters Corp. 9,335 326 270Thor Industries, Inc. 1,047 32 39Tiffany & Co. 3,187 203 182Tilly’s, Inc.-Class A 332 5 4Time Warner Cable 7,816 538 757Time Warner, Inc. 24,047 786 1,145TJX Cos., Inc. 18,626 502 787Toll Brothers, Inc. 3,635 75 117Town Sports International
Holdings, Inc. 676 6 7Tractor Supply Co. 1,817 101 160Tripadvisor, Inc. 2,228 71 93True Religion Apparel, Inc. 682 16 17Tuesday Morning Corp. 806 3 5Tumi Holdings, Inc. 553 10 11Tupperware Brands Corp. 1,384 68 88Ulta Salon Cosmetics & Fragrance,
Inc. 1,593 105 156Under Armour, Inc.-Class A 1,920 68 93Unifi, Inc. 211 3 3Universal Electronics, Inc. 407 11 8Universal Technical Institute, Inc. 594 11 6
The accompanying notes are an integral part of the financial statements. 62

BlackRock CDN Russell 3000 Index Non-Taxable Fund
Statement of Investment Portfolio — As at December 31, 2012
Security
Par value
(000s)/
Holdings
Average
cost
Fair
value
(in $000s) (in $000s)
Consumer Discretionary (continued)Urban Outfitters, Inc. 2,636 97 103Vail Resorts, Inc. 896 44 48Valassis Communications, Inc. 1,126 36 29Vera Bradley, Inc. 528 17 13VF Corp. 2,197 216 330Viacom, Inc.-Class B 13,218 551 694Virgin Media, Inc. 6,974 186 255Visteon Corp. 1,307 79 70Vitamin Shoppe, Inc. 734 30 42Voxx International Corp. 407 3 3Walt Disney Co. (The) 44,818 1,756 2,221Warnaco Group, Inc. 1,020 56 73Washington Post Co. (The)-Class B 105 40 38Weight Watchers International, Inc. 665 29 35Wendy’s Co. 6,841 33 32West Marine, Inc. 307 3 3Wet Seal, Inc.-Class A 2,681 11 7Weyco Group, Inc. 253 6 6Whirlpool Corp. 1,945 143 197Williams-Sonoma, Inc. 2,185 79 95Winmark Corp. 55 3 3Winnebago Industries, Inc. 690 6 12WMS Industries, Inc. 1,371 52 24Wolverine World Wide, Inc. 1,204 43 49World Wrestling Entertainment, Inc. 557 7 4Wyndham Worldwide Corp. 3,675 123 195Wynn Resorts, Ltd. 2,013 217 225Yum! Brands, Inc. 11,579 619 766Zumiez, Inc. 504 15 10
41,179 49,713
Consumer Staples — 9.1%
Alliance One International, Inc. 1,733 6 6Altria Group, Inc. 51,058 1,340 1,598Andersons, Inc. 488 17 21Annie’s, Inc. 149 5 5Archer-Daniels-Midland Co. 16,559 489 451Avon Products, Inc. 10,953 290 157B&G Foods, Inc.-Class A 1,422 27 40Boston Beer Co., Inc.-Class A 202 18 27Brown-Forman Corp.-Class B 3,819 186 240Bunge, Ltd. 3,662 232 265Cal-Maine Foods, Inc. 383 13 15Calavo Growers, Inc. 261 6 7Campbell Soup Co. 4,400 152 153Casey’s General Stores, Inc. 950 42 50Central Euro Distribution Corp. 1,129 22 2Central Garden and Pet Co. 1,056 11 11Chefs Warehouse, Inc. 208 3 3
Security
Par value
(000s)/
Holdings
Average
cost
Fair
value
(in $000s) (in $000s)
Consumer Staples (continued)Chiquita Brands International, Inc. 1,329 15 11Church & Dwight Co., Inc. 3,478 133 186Clorox Co. 3,242 210 236Coca-Cola Bottling Co. Consolidated 134 8 9Coca-Cola Co. (The) 97,563 3,283 3,523Coca-Cola Ent., Inc. 7,550 196 239Colgate-Palmolive Co. 11,970 1,001 1,246ConAgra Foods, Inc. 10,407 241 306Constellation Brands, Inc.-Class A 3,670 81 129Costco Wholesale Corp. 10,885 815 1,071CVS Caremark Corp. 32,126 1,128 1,547Darling International, Inc. 2,913 40 46Dean Foods Co. 4,580 42 75Diamond Foods, Inc. 537 27 7Dole Food Co., Inc. 970 10 11Dr Pepper Snapple Group, Inc. 5,308 205 233Elizabeth Arden, Inc. 638 18 29Energizer Holdings, Inc. 1,615 118 129Estee Lauder Cos. (The), Inc.-
Class A 5,799 255 346Flowers Foods, Inc. 2,761 51 64Fresh Del Monte Produce, Inc. 984 23 26Fresh Market, Inc. 685 29 33General Mills, Inc. 16,189 598 651Green Mountain Coffee Roasters, Inc. 3,499 132 144Hain Celestial Group, Inc. 918 33 50Harbinger Group, Inc. 1,077 8 8Harris Teeter Supermarkets, Inc. 1,091 43 42Heckmann Corp. 4,283 20 17Herbalife, Ltd. 2,906 115 95Hershey Co. (The) 3,766 197 271Hillshire Brands Co. 2,933 83 82HJ Heinz Co. 8,004 406 460Hormel Foods Corp. 3,309 87 103Ingles Markets, Inc.-Class A 361 6 6Ingredion, Inc. 1,947 93 125Inter Parfums, Inc. 323 7 6J&J Snack Foods Corp. 385 19 24JM Smucker Co. (The) 2,812 195 241John B. Sanfilippo & Son, Inc. 141 2 3Kellogg Co. 6,056 306 337Kimberly-Clark Corp. 9,796 654 823Kraft Foods Group, Inc. 14,862 514 673Kroger Co. (The) 13,203 314 342Lancaster Colony Corp. 465 28 32Limoneira Co. 314 7 6Lorillard, Inc. 3,273 298 380McCormick & Co., Inc. 3,342 160 211Mead Johnson Nutrition Co.-Class A 5,136 329 337
The accompanying notes are an integral part of the financial statements. 63
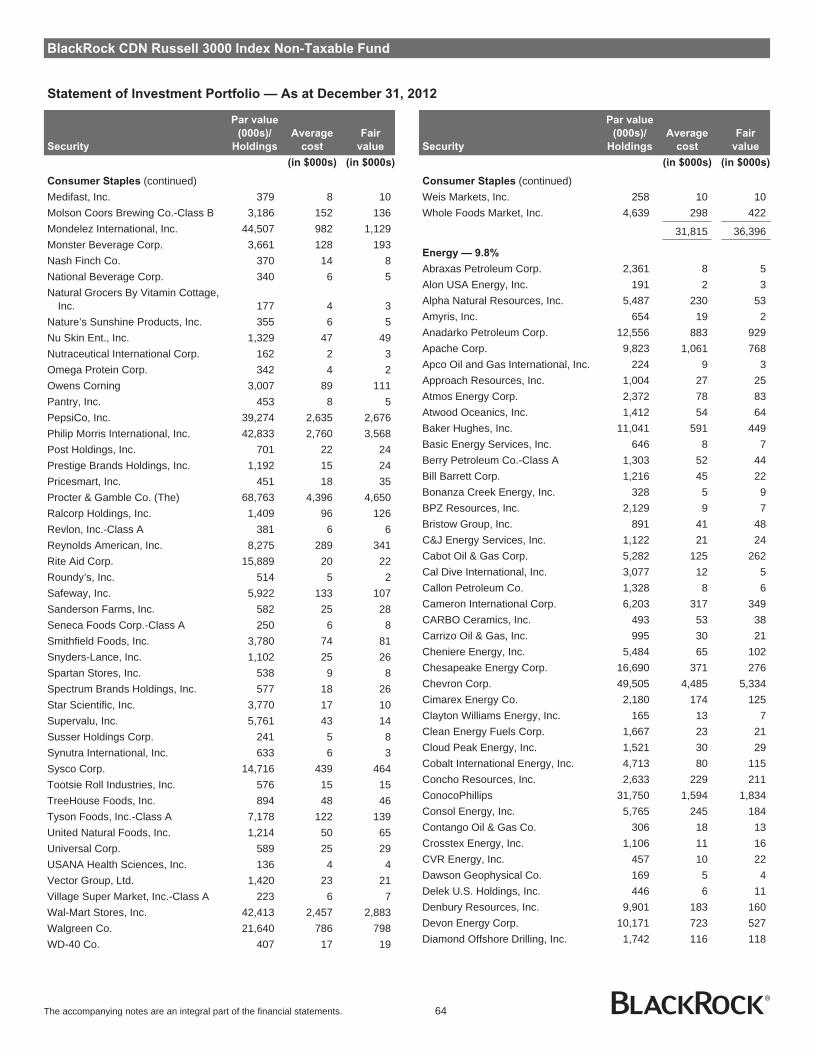
BlackRock CDN Russell 3000 Index Non-Taxable Fund
Statement of Investment Portfolio — As at December 31, 2012
Security
Par value
(000s)/
Holdings
Average
cost
Fair
value
(in $000s) (in $000s)
Consumer Staples (continued)Medifast, Inc. 379 8 10Molson Coors Brewing Co.-Class B 3,186 152 136Mondelez International, Inc. 44,507 982 1,129Monster Beverage Corp. 3,661 128 193Nash Finch Co. 370 14 8National Beverage Corp. 340 6 5Natural Grocers By Vitamin Cottage,
Inc. 177 4 3Nature’s Sunshine Products, Inc. 355 6 5Nu Skin Ent., Inc. 1,329 47 49Nutraceutical International Corp. 162 2 3Omega Protein Corp. 342 4 2Owens Corning 3,007 89 111Pantry, Inc. 453 8 5PepsiCo, Inc. 39,274 2,635 2,676Philip Morris International, Inc. 42,833 2,760 3,568Post Holdings, Inc. 701 22 24Prestige Brands Holdings, Inc. 1,192 15 24Pricesmart, Inc. 451 18 35Procter & Gamble Co. (The) 68,763 4,396 4,650Ralcorp Holdings, Inc. 1,409 96 126Revlon, Inc.-Class A 381 6 6Reynolds American, Inc. 8,275 289 341Rite Aid Corp. 15,889 20 22Roundy’s, Inc. 514 5 2Safeway, Inc. 5,922 133 107Sanderson Farms, Inc. 582 25 28Seneca Foods Corp.-Class A 250 6 8Smithfield Foods, Inc. 3,780 74 81Snyders-Lance, Inc. 1,102 25 26Spartan Stores, Inc. 538 9 8Spectrum Brands Holdings, Inc. 577 18 26Star Scientific, Inc. 3,770 17 10Supervalu, Inc. 5,761 43 14Susser Holdings Corp. 241 5 8Synutra International, Inc. 633 6 3Sysco Corp. 14,716 439 464Tootsie Roll Industries, Inc. 576 15 15TreeHouse Foods, Inc. 894 48 46Tyson Foods, Inc.-Class A 7,178 122 139United Natural Foods, Inc. 1,214 50 65Universal Corp. 589 25 29USANA Health Sciences, Inc. 136 4 4Vector Group, Ltd. 1,420 23 21Village Super Market, Inc.-Class A 223 6 7Wal-Mart Stores, Inc. 42,413 2,457 2,883Walgreen Co. 21,640 786 798WD-40 Co. 407 17 19
Security
Par value
(000s)/
Holdings
Average
cost
Fair
value
(in $000s) (in $000s)
Consumer Staples (continued)Weis Markets, Inc. 258 10 10Whole Foods Market, Inc. 4,639 298 422
31,815 36,396
Energy — 9.8%
Abraxas Petroleum Corp. 2,361 8 5Alon USA Energy, Inc. 191 2 3Alpha Natural Resources, Inc. 5,487 230 53Amyris, Inc. 654 19 2Anadarko Petroleum Corp. 12,556 883 929Apache Corp. 9,823 1,061 768Apco Oil and Gas International, Inc. 224 9 3Approach Resources, Inc. 1,004 27 25Atmos Energy Corp. 2,372 78 83Atwood Oceanics, Inc. 1,412 54 64Baker Hughes, Inc. 11,041 591 449Basic Energy Services, Inc. 646 8 7Berry Petroleum Co.-Class A 1,303 52 44Bill Barrett Corp. 1,216 45 22Bonanza Creek Energy, Inc. 328 5 9BPZ Resources, Inc. 2,129 9 7Bristow Group, Inc. 891 41 48C&J Energy Services, Inc. 1,122 21 24Cabot Oil & Gas Corp. 5,282 125 262Cal Dive International, Inc. 3,077 12 5Callon Petroleum Co. 1,328 8 6Cameron International Corp. 6,203 317 349CARBO Ceramics, Inc. 493 53 38Carrizo Oil & Gas, Inc. 995 30 21Cheniere Energy, Inc. 5,484 65 102Chesapeake Energy Corp. 16,690 371 276Chevron Corp. 49,505 4,485 5,334Cimarex Energy Co. 2,180 174 125Clayton Williams Energy, Inc. 165 13 7Clean Energy Fuels Corp. 1,667 23 21Cloud Peak Energy, Inc. 1,521 30 29Cobalt International Energy, Inc. 4,713 80 115Concho Resources, Inc. 2,633 229 211ConocoPhillips 31,750 1,594 1,834Consol Energy, Inc. 5,765 245 184Contango Oil & Gas Co. 306 18 13Crosstex Energy, Inc. 1,106 11 16CVR Energy, Inc. 457 10 22Dawson Geophysical Co. 169 5 4Delek U.S. Holdings, Inc. 446 6 11Denbury Resources, Inc. 9,901 183 160Devon Energy Corp. 10,171 723 527Diamond Offshore Drilling, Inc. 1,742 116 118
The accompanying notes are an integral part of the financial statements. 64
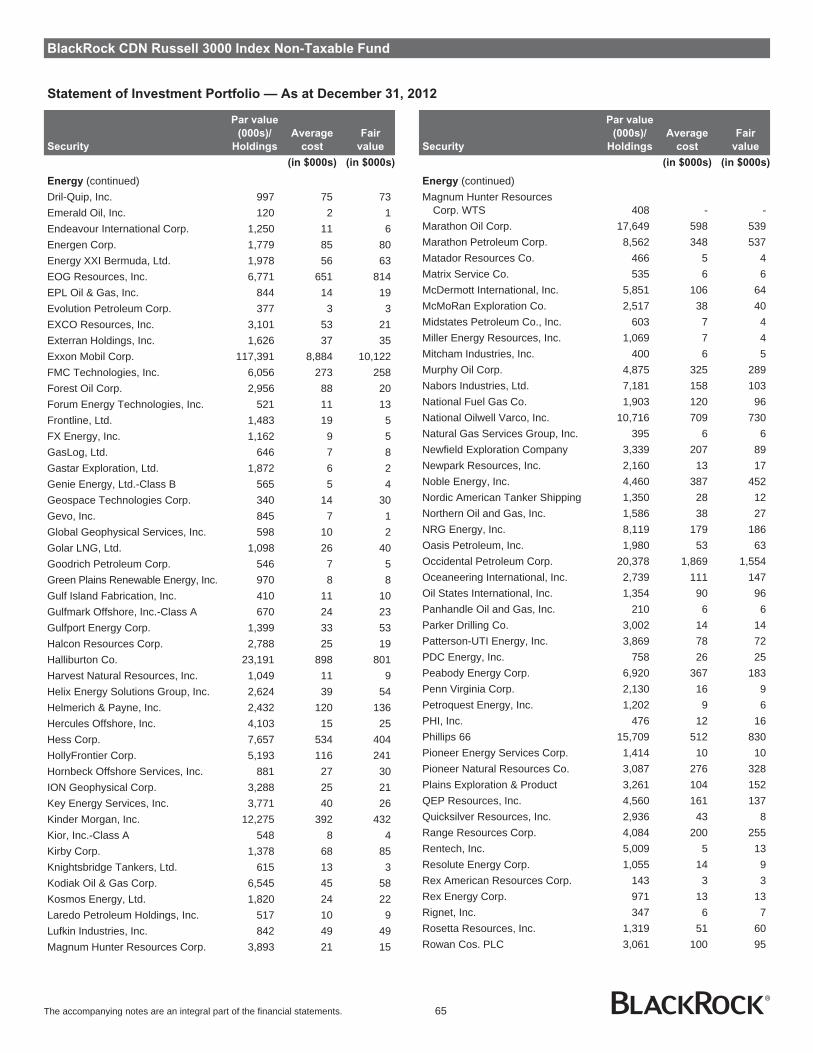
BlackRock CDN Russell 3000 Index Non-Taxable Fund
Statement of Investment Portfolio — As at December 31, 2012
Security
Par value
(000s)/
Holdings
Average
cost
Fair
value
(in $000s) (in $000s)
Energy (continued)Dril-Quip, Inc. 997 75 73Emerald Oil, Inc. 120 2 1Endeavour International Corp. 1,250 11 6Energen Corp. 1,779 85 80Energy XXI Bermuda, Ltd. 1,978 56 63EOG Resources, Inc. 6,771 651 814EPL Oil & Gas, Inc. 844 14 19Evolution Petroleum Corp. 377 3 3EXCO Resources, Inc. 3,101 53 21Exterran Holdings, Inc. 1,626 37 35Exxon Mobil Corp. 117,391 8,884 10,122FMC Technologies, Inc. 6,056 273 258Forest Oil Corp. 2,956 88 20Forum Energy Technologies, Inc. 521 11 13Frontline, Ltd. 1,483 19 5FX Energy, Inc. 1,162 9 5GasLog, Ltd. 646 7 8Gastar Exploration, Ltd. 1,872 6 2Genie Energy, Ltd.-Class B 565 5 4Geospace Technologies Corp. 340 14 30Gevo, Inc. 845 7 1Global Geophysical Services, Inc. 598 10 2Golar LNG, Ltd. 1,098 26 40Goodrich Petroleum Corp. 546 7 5Green Plains Renewable Energy, Inc. 970 8 8Gulf Island Fabrication, Inc. 410 11 10Gulfmark Offshore, Inc.-Class A 670 24 23Gulfport Energy Corp. 1,399 33 53Halcon Resources Corp. 2,788 25 19Halliburton Co. 23,191 898 801Harvest Natural Resources, Inc. 1,049 11 9Helix Energy Solutions Group, Inc. 2,624 39 54Helmerich & Payne, Inc. 2,432 120 136Hercules Offshore, Inc. 4,103 15 25Hess Corp. 7,657 534 404HollyFrontier Corp. 5,193 116 241Hornbeck Offshore Services, Inc. 881 27 30ION Geophysical Corp. 3,288 25 21Key Energy Services, Inc. 3,771 40 26Kinder Morgan, Inc. 12,275 392 432Kior, Inc.-Class A 548 8 4Kirby Corp. 1,378 68 85Knightsbridge Tankers, Ltd. 615 13 3Kodiak Oil & Gas Corp. 6,545 45 58Kosmos Energy, Ltd. 1,820 24 22Laredo Petroleum Holdings, Inc. 517 10 9Lufkin Industries, Inc. 842 49 49Magnum Hunter Resources Corp. 3,893 21 15
Security
Par value
(000s)/
Holdings
Average
cost
Fair
value
(in $000s) (in $000s)
Energy (continued)Magnum Hunter Resources
Corp. WTS 408 - -Marathon Oil Corp. 17,649 598 539Marathon Petroleum Corp. 8,562 348 537Matador Resources Co. 466 5 4Matrix Service Co. 535 6 6McDermott International, Inc. 5,851 106 64McMoRan Exploration Co. 2,517 38 40Midstates Petroleum Co., Inc. 603 7 4Miller Energy Resources, Inc. 1,069 7 4Mitcham Industries, Inc. 400 6 5Murphy Oil Corp. 4,875 325 289Nabors Industries, Ltd. 7,181 158 103National Fuel Gas Co. 1,903 120 96National Oilwell Varco, Inc. 10,716 709 730Natural Gas Services Group, Inc. 395 6 6Newfield Exploration Company 3,339 207 89Newpark Resources, Inc. 2,160 13 17Noble Energy, Inc. 4,460 387 452Nordic American Tanker Shipping 1,350 28 12Northern Oil and Gas, Inc. 1,586 38 27NRG Energy, Inc. 8,119 179 186Oasis Petroleum, Inc. 1,980 53 63Occidental Petroleum Corp. 20,378 1,869 1,554Oceaneering International, Inc. 2,739 111 147Oil States International, Inc. 1,354 90 96Panhandle Oil and Gas, Inc. 210 6 6Parker Drilling Co. 3,002 14 14Patterson-UTI Energy, Inc. 3,869 78 72PDC Energy, Inc. 758 26 25Peabody Energy Corp. 6,920 367 183Penn Virginia Corp. 2,130 16 9Petroquest Energy, Inc. 1,202 9 6PHI, Inc. 476 12 16Phillips 66 15,709 512 830Pioneer Energy Services Corp. 1,414 10 10Pioneer Natural Resources Co. 3,087 276 328Plains Exploration & Product 3,261 104 152QEP Resources, Inc. 4,560 161 137Quicksilver Resources, Inc. 2,936 43 8Range Resources Corp. 4,084 200 255Rentech, Inc. 5,009 5 13Resolute Energy Corp. 1,055 14 9Rex American Resources Corp. 143 3 3Rex Energy Corp. 971 13 13Rignet, Inc. 347 6 7Rosetta Resources, Inc. 1,319 51 60Rowan Cos. PLC 3,061 100 95
The accompanying notes are an integral part of the financial statements. 65
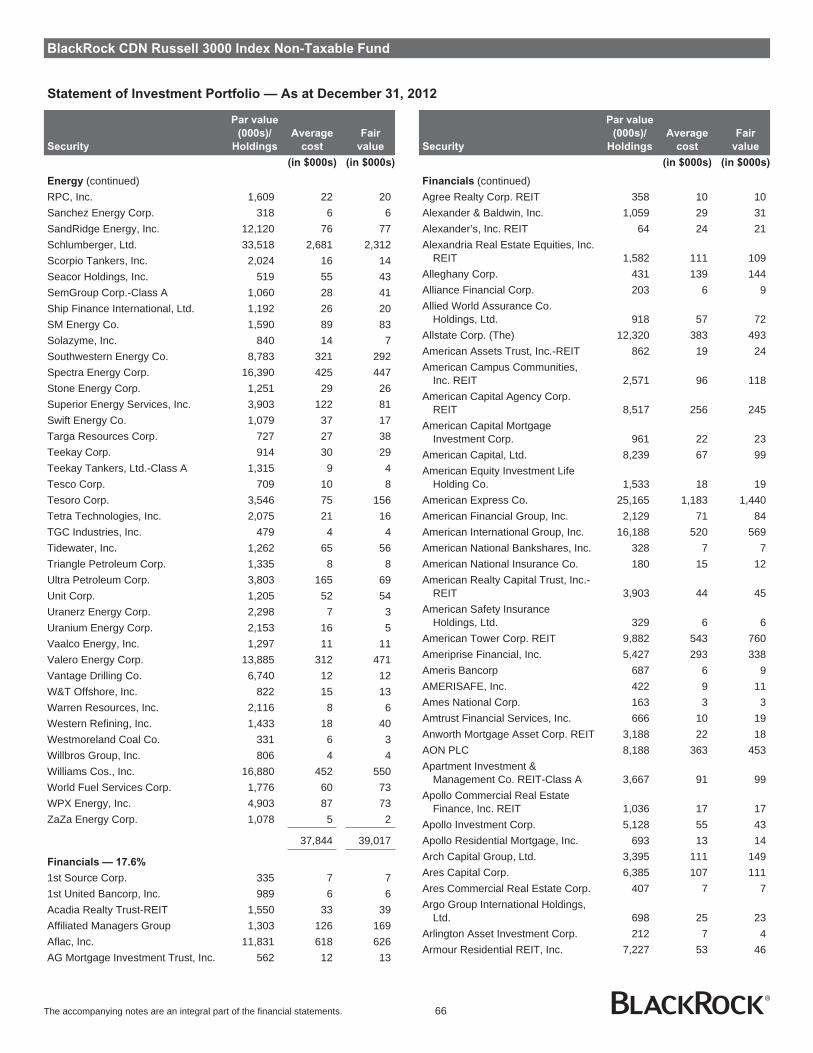
BlackRock CDN Russell 3000 Index Non-Taxable Fund
Statement of Investment Portfolio — As at December 31, 2012
Security
Par value
(000s)/
Holdings
Average
cost
Fair
value
(in $000s) (in $000s)
Energy (continued)RPC, Inc. 1,609 22 20Sanchez Energy Corp. 318 6 6SandRidge Energy, Inc. 12,120 76 77Schlumberger, Ltd. 33,518 2,681 2,312Scorpio Tankers, Inc. 2,024 16 14Seacor Holdings, Inc. 519 55 43SemGroup Corp.-Class A 1,060 28 41Ship Finance International, Ltd. 1,192 26 20SM Energy Co. 1,590 89 83Solazyme, Inc. 840 14 7Southwestern Energy Co. 8,783 321 292Spectra Energy Corp. 16,390 425 447Stone Energy Corp. 1,251 29 26Superior Energy Services, Inc. 3,903 122 81Swift Energy Co. 1,079 37 17Targa Resources Corp. 727 27 38Teekay Corp. 914 30 29Teekay Tankers, Ltd.-Class A 1,315 9 4Tesco Corp. 709 10 8Tesoro Corp. 3,546 75 156Tetra Technologies, Inc. 2,075 21 16TGC Industries, Inc. 479 4 4Tidewater, Inc. 1,262 65 56Triangle Petroleum Corp. 1,335 8 8Ultra Petroleum Corp. 3,803 165 69Unit Corp. 1,205 52 54Uranerz Energy Corp. 2,298 7 3Uranium Energy Corp. 2,153 16 5Vaalco Energy, Inc. 1,297 11 11Valero Energy Corp. 13,885 312 471Vantage Drilling Co. 6,740 12 12W&T Offshore, Inc. 822 15 13Warren Resources, Inc. 2,116 8 6Western Refining, Inc. 1,433 18 40Westmoreland Coal Co. 331 6 3Willbros Group, Inc. 806 4 4Williams Cos., Inc. 16,880 452 550World Fuel Services Corp. 1,776 60 73WPX Energy, Inc. 4,903 87 73ZaZa Energy Corp. 1,078 5 2
37,844 39,017
Financials — 17.6%
1st Source Corp. 335 7 71st United Bancorp, Inc. 989 6 6Acadia Realty Trust-REIT 1,550 33 39Affiliated Managers Group 1,303 126 169Aflac, Inc. 11,831 618 626AG Mortgage Investment Trust, Inc. 562 12 13
Security
Par value
(000s)/
Holdings
Average
cost
Fair
value
(in $000s) (in $000s)
Financials (continued)Agree Realty Corp. REIT 358 10 10Alexander & Baldwin, Inc. 1,059 29 31Alexander’s, Inc. REIT 64 24 21Alexandria Real Estate Equities, Inc.
REIT 1,582 111 109Alleghany Corp. 431 139 144Alliance Financial Corp. 203 6 9Allied World Assurance Co.
Holdings, Ltd. 918 57 72Allstate Corp. (The) 12,320 383 493American Assets Trust, Inc.-REIT 862 19 24American Campus Communities,
Inc. REIT 2,571 96 118American Capital Agency Corp.
REIT 8,517 256 245American Capital Mortgage
Investment Corp. 961 22 23American Capital, Ltd. 8,239 67 99American Equity Investment Life
Holding Co. 1,533 18 19American Express Co. 25,165 1,183 1,440American Financial Group, Inc. 2,129 71 84American International Group, Inc. 16,188 520 569American National Bankshares, Inc. 328 7 7American National Insurance Co. 180 15 12American Realty Capital Trust, Inc.-
REIT 3,903 44 45American Safety Insurance
Holdings, Ltd. 329 6 6American Tower Corp. REIT 9,882 543 760Ameriprise Financial, Inc. 5,427 293 338Ameris Bancorp 687 6 9AMERISAFE, Inc. 422 9 11Ames National Corp. 163 3 3Amtrust Financial Services, Inc. 666 10 19Anworth Mortgage Asset Corp. REIT 3,188 22 18AON PLC 8,188 363 453Apartment Investment &
Management Co. REIT-Class A 3,667 91 99Apollo Commercial Real Estate
Finance, Inc. REIT 1,036 17 17Apollo Investment Corp. 5,128 55 43Apollo Residential Mortgage, Inc. 693 13 14Arch Capital Group, Ltd. 3,395 111 149Ares Capital Corp. 6,385 107 111Ares Commercial Real Estate Corp. 407 7 7Argo Group International Holdings,
Ltd. 698 25 23Arlington Asset Investment Corp. 212 7 4Armour Residential REIT, Inc. 7,227 53 46
The accompanying notes are an integral part of the financial statements. 66

BlackRock CDN Russell 3000 Index Non-Taxable Fund
Statement of Investment Portfolio — As at December 31, 2012
Security
Par value
(000s)/
Holdings
Average
cost
Fair
value
(in $000s) (in $000s)
Financials (continued)Arrow Financial Corp. 382 9 9Arthur J Gallagher & Co. 2,939 89 101Artio Global Investors, Inc. 1,065 10 2Ashford Hospitality Trust, Inc.-REIT 1,254 12 13Aspen Insurance Holdings, Ltd. 1,817 52 58Associated Banc-Corp. 4,235 56 55Associated Estates Realty Corp.
REIT 1,225 18 20Assurant, Inc. 2,017 75 70Assured Guaranty, Ltd. 4,265 71 60Astoria Financial Corp. 2,093 26 20Australia & New Zealand Banking
Group, Ltd. 5,875 214 207AvalonBay Communities, Inc. REIT 2,831 344 382Axis Capital Holdings, Ltd. 2,748 98 95Baldwin & Lyons, Inc.-Class B 263 6 6Bancfirst Corp. 158 6 7Banco Latinoamericano de
Comercio Exterior SA 766 15 16Bancorp, Inc. 804 8 9BancorpSouth, Inc. 2,314 30 33Bank Mutual Corp. 836 3 4Bank of America Corp. 270,603 2,871 3,128Bank of Hawaii Corp. 1,253 57 55Bank of Kentucky Financial Corp. 238 6 6Bank of Marin Bancorp 224 9 8Bank of New York Mellon Corp. 29,962 796 767Bank of the Ozarks, Inc. 741 17 25BankFinancial Corp. 713 6 5BankUnited, Inc. 860 21 21Banner Corp. 538 10 16BB&T Corp. 17,560 447 509BBCN Bancorp, Inc. 1,976 19 23Beneficial Mutual Bancorp, Inc. 736 6 7Berkshire Hathaway, Inc.-Class B 44,699 3,653 3,996Berkshire Hills Bancorp, Inc. 988 22 23BGC Partners, Inc.-Class A 2,775 19 10BioMed Realty Trust, Inc.-REIT 3,948 70 76BlackRock Kelso Capital Corp. 1,611 19 16BlackRock, Inc. 3,151 571 649BofI Holding, Inc. 399 7 11BOK Financial Corp. 619 31 34Boston Private Financial Holdings, Inc. 2,033 13 18Boston Properties, Inc. REIT 3,747 344 395Brandywine Realty Trust-REIT 3,547 40 43BRE Properties, Inc. REIT 1,957 88 99Bridge Bancorp, Inc. 268 6 5Bridge Capital Holdings 372 6 6Broadridge Financial Solutions, Inc. 3,095 68 70
Security
Par value
(000s)/
Holdings
Average
cost
Fair
value
(in $000s) (in $000s)
Financials (continued)Brookline Bancorp, Inc. 1,832 15 15Brown & Brown, Inc. 2,898 70 73Bryn Mawr Bank Corp. 375 8 8Calamos Asset Management, Inc. 415 5 4Camden National Corp. 169 5 6Camden Property Trust-REIT 2,035 114 138Campus Crest Communities, Inc.
REIT 1,055 12 13Capital One Financial Corp. 14,583 652 841Capital Southwest Corp. 69 7 7Capitalsource, Inc. REIT 5,736 39 43Capitol Federal Financial, Inc. 3,987 45 47CapLease, Inc. REIT 1,627 8 9Capstead Mortgage Corp. REIT 2,389 30 27Cardinal Financial Corp. 722 8 12Cash America International, Inc. 749 28 30Cathay General Bancorp 1,942 28 38CBL & Associates Properties, Inc.
REIT 3,826 68 81CBOE Holdings, Inc. 2,330 61 68CBRE Group, Inc. 8,294 156 164Cedar Shopping Centers, Inc. REIT 1,542 7 8Centerstate Banks, Inc. 953 6 8Central Pacific Financial Corp. 445 6 7Charles Schwab Corp. (The) 27,065 414 387Chatham Lodging Trust-REIT 381 5 6Chemical Financial Corp. 730 16 17Chesapeake Lodging Trust-REIT 980 18 20Chimera Investment Corp. REIT 25,480 98 66Chubb Corp. 6,741 414 506Cincinnati Financial Corp. 3,695 117 144CIT Group, Inc. 5,086 204 196Citigroup, Inc. 73,649 2,926 2,902Citizens & Northern Corp. 413 6 8Citizens Republic Bancorp, Inc. 1,036 18 20Citizens, Inc. 887 6 10City Holding Co. 451 15 16City National Corp. 1,248 66 61CME Group, Inc. 8,359 494 422CNA Financial Corp. 708 19 20CNB Financial Corp. 463 6 8CNO Financial Group, Inc. 5,289 35 49CoBiz Financial, Inc. 954 6 7Cohen & Steers, Inc. 525 15 16Colonial Properties Trust-REIT 2,204 41 47Colony Financial, Inc. REIT 1,611 29 31Columbia Banking System, Inc. 1,039 19 19Comerica, Inc. 4,935 175 149Commerce Bancshares, Inc. 2,025 74 71
The accompanying notes are an integral part of the financial statements. 67
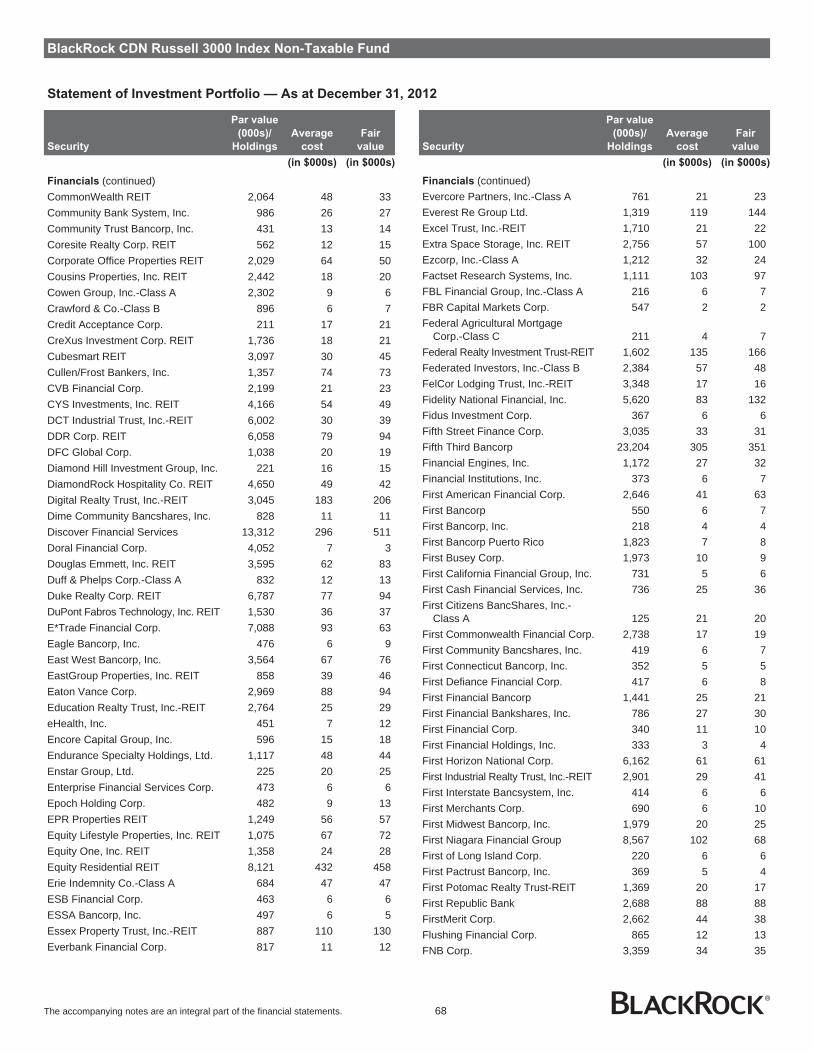
BlackRock CDN Russell 3000 Index Non-Taxable Fund
Statement of Investment Portfolio — As at December 31, 2012
Security
Par value
(000s)/
Holdings
Average
cost
Fair
value
(in $000s) (in $000s)
Financials (continued)CommonWealth REIT 2,064 48 33Community Bank System, Inc. 986 26 27Community Trust Bancorp, Inc. 431 13 14Coresite Realty Corp. REIT 562 12 15Corporate Office Properties REIT 2,029 64 50Cousins Properties, Inc. REIT 2,442 18 20Cowen Group, Inc.-Class A 2,302 9 6Crawford & Co.-Class B 896 6 7Credit Acceptance Corp. 211 17 21CreXus Investment Corp. REIT 1,736 18 21Cubesmart REIT 3,097 30 45Cullen/Frost Bankers, Inc. 1,357 74 73CVB Financial Corp. 2,199 21 23CYS Investments, Inc. REIT 4,166 54 49DCT Industrial Trust, Inc.-REIT 6,002 30 39DDR Corp. REIT 6,058 79 94DFC Global Corp. 1,038 20 19Diamond Hill Investment Group, Inc. 221 16 15DiamondRock Hospitality Co. REIT 4,650 49 42Digital Realty Trust, Inc.-REIT 3,045 183 206Dime Community Bancshares, Inc. 828 11 11Discover Financial Services 13,312 296 511Doral Financial Corp. 4,052 7 3Douglas Emmett, Inc. REIT 3,595 62 83Duff & Phelps Corp.-Class A 832 12 13Duke Realty Corp. REIT 6,787 77 94DuPont Fabros Technology, Inc. REIT 1,530 36 37E*Trade Financial Corp. 7,088 93 63Eagle Bancorp, Inc. 476 6 9East West Bancorp, Inc. 3,564 67 76EastGroup Properties, Inc. REIT 858 39 46Eaton Vance Corp. 2,969 88 94Education Realty Trust, Inc.-REIT 2,764 25 29eHealth, Inc. 451 7 12Encore Capital Group, Inc. 596 15 18Endurance Specialty Holdings, Ltd. 1,117 48 44Enstar Group, Ltd. 225 20 25Enterprise Financial Services Corp. 473 6 6Epoch Holding Corp. 482 9 13EPR Properties REIT 1,249 56 57Equity Lifestyle Properties, Inc. REIT 1,075 67 72Equity One, Inc. REIT 1,358 24 28Equity Residential REIT 8,121 432 458Erie Indemnity Co.-Class A 684 47 47ESB Financial Corp. 463 6 6ESSA Bancorp, Inc. 497 6 5Essex Property Trust, Inc.-REIT 887 110 130Everbank Financial Corp. 817 11 12
Security
Par value
(000s)/
Holdings
Average
cost
Fair
value
(in $000s) (in $000s)
Financials (continued)Evercore Partners, Inc.-Class A 761 21 23Everest Re Group Ltd. 1,319 119 144Excel Trust, Inc.-REIT 1,710 21 22Extra Space Storage, Inc. REIT 2,756 57 100Ezcorp, Inc.-Class A 1,212 32 24Factset Research Systems, Inc. 1,111 103 97FBL Financial Group, Inc.-Class A 216 6 7FBR Capital Markets Corp. 547 2 2Federal Agricultural Mortgage
Corp.-Class C 211 4 7Federal Realty Investment Trust-REIT 1,602 135 166Federated Investors, Inc.-Class B 2,384 57 48FelCor Lodging Trust, Inc.-REIT 3,348 17 16Fidelity National Financial, Inc. 5,620 83 132Fidus Investment Corp. 367 6 6Fifth Street Finance Corp. 3,035 33 31Fifth Third Bancorp 23,204 305 351Financial Engines, Inc. 1,172 27 32Financial Institutions, Inc. 373 6 7First American Financial Corp. 2,646 41 63First Bancorp 550 6 7First Bancorp, Inc. 218 4 4First Bancorp Puerto Rico 1,823 7 8First Busey Corp. 1,973 10 9First California Financial Group, Inc. 731 5 6First Cash Financial Services, Inc. 736 25 36First Citizens BancShares, Inc.-
Class A 125 21 20First Commonwealth Financial Corp. 2,738 17 19First Community Bancshares, Inc. 419 6 7First Connecticut Bancorp, Inc. 352 5 5First Defiance Financial Corp. 417 6 8First Financial Bancorp 1,441 25 21First Financial Bankshares, Inc. 786 27 30First Financial Corp. 340 11 10First Financial Holdings, Inc. 333 3 4First Horizon National Corp. 6,162 61 61First Industrial Realty Trust, Inc.-REIT 2,901 29 41First Interstate Bancsystem, Inc. 414 6 6First Merchants Corp. 690 6 10First Midwest Bancorp, Inc. 1,979 20 25First Niagara Financial Group 8,567 102 68First of Long Island Corp. 220 6 6First Pactrust Bancorp, Inc. 369 5 4First Potomac Realty Trust-REIT 1,369 20 17First Republic Bank 2,688 88 88FirstMerit Corp. 2,662 44 38Flushing Financial Corp. 865 12 13FNB Corp. 3,359 34 35
The accompanying notes are an integral part of the financial statements. 68

BlackRock CDN Russell 3000 Index Non-Taxable Fund
Statement of Investment Portfolio — As at December 31, 2012
Security
Par value
(000s)/
Holdings
Average
cost
Fair
value
(in $000s) (in $000s)
Financials (continued)FNB United Corp. 397 5 5Forest City Enterprises-Class A 3,923 62 63Forestar Group, Inc. 936 16 16Fox Chase Bancorp, Inc. 437 6 7Franklin Financial Corp. 485 7 8Franklin Resources, Inc. 3,500 411 438Franklin Street Properties Corp. REIT 1,737 22 21Fulton Financial Corp. 4,856 45 46FXCM, Inc. 647 6 6GAMCO Investors, Inc. 190 9 10General Growth Properties, Inc. REIT 13,411 217 265Genworth Financial, Inc.-Class A 12,219 132 91German American Bancorp, Inc. 410 8 9Getty Realty Corp. REIT 542 14 10GFI Group, Inc. 1,249 5 4Glacier Bancorp, Inc. 1,791 25 26Gladstone Capital Corp. 855 7 7Gladstone Commercial Corp. REIT 1,229 21 22Gladstone Investment Corp. 832 6 6Glimcher Realty Trust-REIT 3,472 31 38Global Indemnity PLC 327 6 7Goldman Sachs Group, Inc. 12,338 1,836 1,568Golub Capital BDC, Inc. 415 6 7Government Properties Income
Trust-REIT 1,311 33 31Gramercy Capital Corp. REIT 1,894 5 6Great Southern Bancorp, Inc. 315 7 8Green Dot Corp.-Class A 605 27 7Greenhill & Co., Inc. 739 45 38Greenlight Capital Re, Ltd. 765 21 18GSV Capital Corp. 568 6 5Guaranty Bancorp. 2,525 5 5Gyrodyne Co. of America, Inc. REIT 54 6 4Hancock Holding Co. 2,092 61 66Hanmi Financial Corp. 850 6 12Hanover Insurance Group, Inc. 1,138 50 44Harris & Harris Group, Inc. 1,191 6 4Hartford Financial Services Group,
Inc. 11,113 250 248Hatteras Financial Corp. REIT 2,455 70 61HCC Insurance Holdings, Inc. 2,516 74 93HCP, Inc. 11,259 404 506Health Care, Inc. REIT 6,460 319 394Healthcare Realty Trust, Inc.-REIT 2,286 47 55Heartland Financial USA, Inc. 410 7 11Hercules Technology Growth
Capital, Inc. 1,719 18 19Heritage Financial Corp. 526 7 8Hersha Hospitality Trust-REIT 4,303 25 21
Security
Par value
(000s)/
Holdings
Average
cost
Fair
value
(in $000s) (in $000s)
Financials (continued)HFF, Inc.-Class A 725 10 11Highwoods Properties, Inc. REIT 1,631 52 54Hilltop Holdings, Inc. 877 8 12Home Bancshares, Inc. 552 14 18Home Federal Bancorp, Inc. 561 6 7Home Loan Servicing Solutions, Ltd. 717 11 13Home Properties, Inc. REIT 1,273 71 78Homeowners Choice, Inc. 414 8 9Homestreet, Inc. 306 5 8Hometrust Bancshares, Inc. 524 7 7Horace Mann Educators Corp. 1,089 18 22Hospitality Properties Trust-REIT 3,186 74 74Host Hotels & Resorts, Inc. REIT 18,098 298 282Howard Hughes Corp. 682 35 50Hudson City Bancorp, Inc. 13,384 135 108Hudson Pacific Properties, Inc. REIT 1,160 19 24Hudson Valley Holding Corp. 442 9 7Huntington Bancshares, Inc. 22,070 140 140Iberiabank Corp. 738 39 36Independent Bank Corp. 592 16 17Infinity Property & Casualty Corp. 333 20 19Inland Real Estate Corp. REIT 2,065 17 17Interactive Brokers Group, Inc.-
Class A 1,104 18 15IntercontinentalExchange, Inc. 1,836 220 226International Bancshares Corp. 1,327 24 24Internet Capital Group, Inc. 1,101 13 13INTL FCStone, Inc. 329 8 6Invesco Mortgage Capital, Inc. REIT 2,812 57 55Invesco, Ltd. 11,222 256 291Investment Technology Group, Inc. 1,102 13 10Investors Bancorp, Inc. 1,140 15 20Investors Real Estate Trust-REIT 2,226 18 19iStar Financial, Inc. REIT 2,183 13 18Janus Capital Group, Inc. 4,709 49 40Jefferies Group, Inc. 3,518 75 65JMP Group, Inc. 272 2 2Joyo Bank, Ltd. (The) 1,082 86 90JPMorgan Chase & Co. 95,530 3,702 4,184Kansas City Life Insurance Co. 97 3 4KBW, Inc. 855 21 13KCAP Financial, Inc. 747 6 7Kemper Corp. 1,245 32 37Kennedy-Wilson Holdings, Inc. 1,068 14 15Keycorp 23,779 190 199Kilroy Realty Corp. REIT 1,907 69 90Kimco Realty Corp. REIT 10,188 175 196Kite Realty Group Trust-REIT 3,179 16 18Knight Capital Group, Inc. 4,496 35 16
The accompanying notes are an integral part of the financial statements. 69
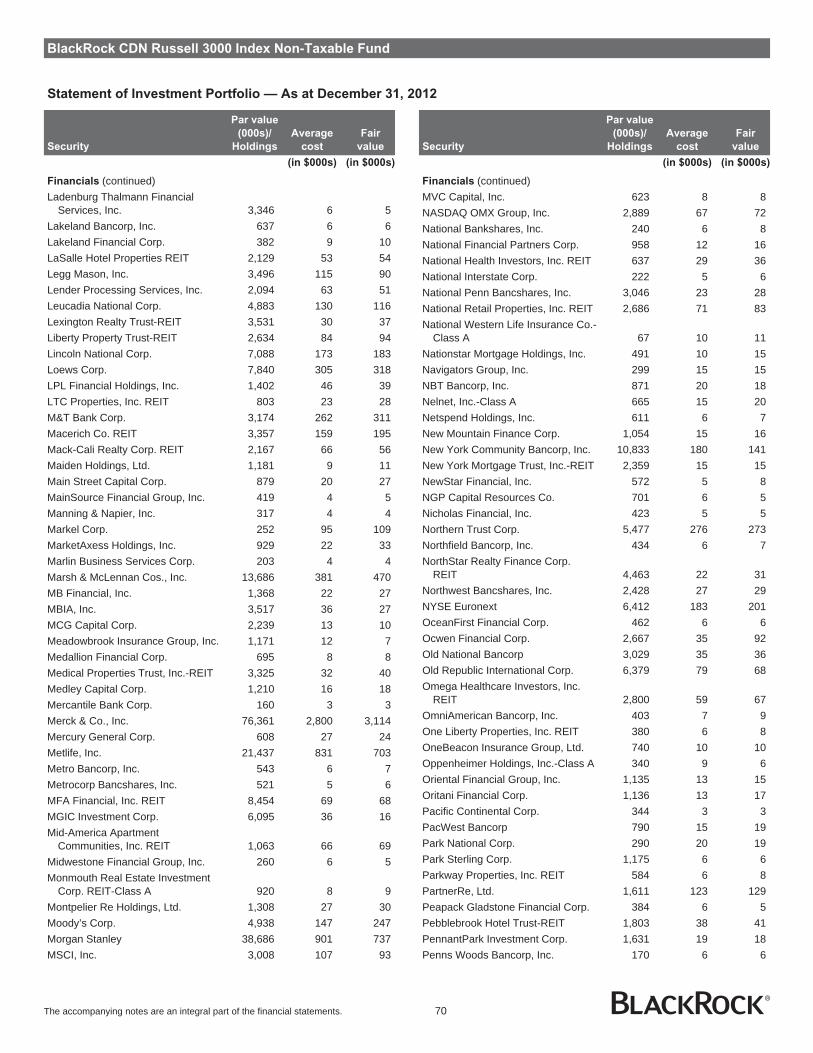
BlackRock CDN Russell 3000 Index Non-Taxable Fund
Statement of Investment Portfolio — As at December 31, 2012
Security
Par value
(000s)/
Holdings
Average
cost
Fair
value
(in $000s) (in $000s)
Financials (continued)Ladenburg Thalmann Financial
Services, Inc. 3,346 6 5Lakeland Bancorp, Inc. 637 6 6Lakeland Financial Corp. 382 9 10LaSalle Hotel Properties REIT 2,129 53 54Legg Mason, Inc. 3,496 115 90Lender Processing Services, Inc. 2,094 63 51Leucadia National Corp. 4,883 130 116Lexington Realty Trust-REIT 3,531 30 37Liberty Property Trust-REIT 2,634 84 94Lincoln National Corp. 7,088 173 183Loews Corp. 7,840 305 318LPL Financial Holdings, Inc. 1,402 46 39LTC Properties, Inc. REIT 803 23 28M&T Bank Corp. 3,174 262 311Macerich Co. REIT 3,357 159 195Mack-Cali Realty Corp. REIT 2,167 66 56Maiden Holdings, Ltd. 1,181 9 11Main Street Capital Corp. 879 20 27MainSource Financial Group, Inc. 419 4 5Manning & Napier, Inc. 317 4 4Markel Corp. 252 95 109MarketAxess Holdings, Inc. 929 22 33Marlin Business Services Corp. 203 4 4Marsh & McLennan Cos., Inc. 13,686 381 470MB Financial, Inc. 1,368 22 27MBIA, Inc. 3,517 36 27MCG Capital Corp. 2,239 13 10Meadowbrook Insurance Group, Inc. 1,171 12 7Medallion Financial Corp. 695 8 8Medical Properties Trust, Inc.-REIT 3,325 32 40Medley Capital Corp. 1,210 16 18Mercantile Bank Corp. 160 3 3Merck & Co., Inc. 76,361 2,800 3,114Mercury General Corp. 608 27 24Metlife, Inc. 21,437 831 703Metro Bancorp, Inc. 543 6 7Metrocorp Bancshares, Inc. 521 5 6MFA Financial, Inc. REIT 8,454 69 68MGIC Investment Corp. 6,095 36 16Mid-America Apartment
Communities, Inc. REIT 1,063 66 69Midwestone Financial Group, Inc. 260 6 5Monmouth Real Estate Investment
Corp. REIT-Class A 920 8 9Montpelier Re Holdings, Ltd. 1,308 27 30Moody’s Corp. 4,938 147 247Morgan Stanley 38,686 901 737MSCI, Inc. 3,008 107 93
Security
Par value
(000s)/
Holdings
Average
cost
Fair
value
(in $000s) (in $000s)
Financials (continued)MVC Capital, Inc. 623 8 8NASDAQ OMX Group, Inc. 2,889 67 72National Bankshares, Inc. 240 6 8National Financial Partners Corp. 958 12 16National Health Investors, Inc. REIT 637 29 36National Interstate Corp. 222 5 6National Penn Bancshares, Inc. 3,046 23 28National Retail Properties, Inc. REIT 2,686 71 83National Western Life Insurance Co.-
Class A 67 10 11Nationstar Mortgage Holdings, Inc. 491 10 15Navigators Group, Inc. 299 15 15NBT Bancorp, Inc. 871 20 18Nelnet, Inc.-Class A 665 15 20Netspend Holdings, Inc. 611 6 7New Mountain Finance Corp. 1,054 15 16New York Community Bancorp, Inc. 10,833 180 141New York Mortgage Trust, Inc.-REIT 2,359 15 15NewStar Financial, Inc. 572 5 8NGP Capital Resources Co. 701 6 5Nicholas Financial, Inc. 423 5 5Northern Trust Corp. 5,477 276 273Northfield Bancorp, Inc. 434 6 7NorthStar Realty Finance Corp.
REIT 4,463 22 31Northwest Bancshares, Inc. 2,428 27 29NYSE Euronext 6,412 183 201OceanFirst Financial Corp. 462 6 6Ocwen Financial Corp. 2,667 35 92Old National Bancorp 3,029 35 36Old Republic International Corp. 6,379 79 68Omega Healthcare Investors, Inc.
REIT 2,800 59 67OmniAmerican Bancorp, Inc. 403 7 9One Liberty Properties, Inc. REIT 380 6 8OneBeacon Insurance Group, Ltd. 740 10 10Oppenheimer Holdings, Inc.-Class A 340 9 6Oriental Financial Group, Inc. 1,135 13 15Oritani Financial Corp. 1,136 13 17Pacific Continental Corp. 344 3 3PacWest Bancorp 790 15 19Park National Corp. 290 20 19Park Sterling Corp. 1,175 6 6Parkway Properties, Inc. REIT 584 6 8PartnerRe, Ltd. 1,611 123 129Peapack Gladstone Financial Corp. 384 6 5Pebblebrook Hotel Trust-REIT 1,803 38 41PennantPark Investment Corp. 1,631 19 18Penns Woods Bancorp, Inc. 170 6 6
The accompanying notes are an integral part of the financial statements. 70

BlackRock CDN Russell 3000 Index Non-Taxable Fund
Statement of Investment Portfolio — As at December 31, 2012
Security
Par value
(000s)/
Holdings
Average
cost
Fair
value
(in $000s) (in $000s)
Financials (continued)Pennsylvania Real Estate
Investment Trust-REIT 1,435 20 25People’s United Financial, Inc. 8,550 108 103Peoples Bancorp, Inc. 347 6 7PHH Corp. 1,406 29 32Phoenix Cos., Inc. 187 9 5Pico Holdings, Inc. 580 16 12Piedmont Office Realty Trust, Inc.-
REIT 4,335 82 78Pinnacle Financial Partners, Inc. 906 12 17Piper Jaffray Cos. 386 11 12Platinum Underwriters Holdings, Ltd. 923 39 42Plum Creek Timber Co., Inc. REIT 4,039 148 178PNC Financial Services Group, Inc. 13,079 751 759Popular, Inc. 2,571 72 53Portfolio Recovery Associates, Inc. 431 32 46Post Properties, Inc. REIT 1,410 53 70Potlatch Corp. REIT 1,036 33 40Preferred Bank 456 6 6Primerica, Inc. 1,255 31 38Principal Financial Group 7,591 216 216PrivateBancorp, Inc. 1,511 20 23ProAssurance Corp. 1,522 51 64Progressive Corp. (The) 15,331 315 322ProLogis, Inc. REIT 11,597 354 421Prospect Capital Corp. 4,735 49 51Prosperity Bancshares, Inc. 1,164 43 49Protective Life Corp. 2,037 51 58Provident Financial Services, Inc. 1,428 20 21Provident New York Bancorp 918 8 9Prudential Financial, Inc. 11,746 633 624PS Business Parks, Inc. REIT 598 35 39Public Storage, Inc. REIT 3,556 390 513Radian Group, Inc. 3,747 19 23RAIT Financial Trust-REIT 1,257 7 7Ramco-Gershenson Properties
Trust-REIT 1,259 15 17Raymond James Financial, Inc. 2,904 94 111Rayonier, Inc. REIT 3,073 112 159Realogy Holdings Corp. 1,233 51 51Realty Income Corp. REIT 3,351 116 134Redwood Trust, Inc.-REIT 2,033 27 34Regency Centers Corp. REIT 2,295 93 108Regions Financial Corp. 35,565 215 252Reinsurance Group of America, Inc. 1,860 99 99RenaissanceRe Holdings, Ltd. 1,306 85 106Renasant Corp. 710 13 13Republic Bancorp, Inc.-Class A 315 6 7Resource Capital Corp. REIT 3,074 18 17
Security
Par value
(000s)/
Holdings
Average
cost
Fair
value
(in $000s) (in $000s)
Financials (continued)Retail Opportunity Investments Corp.
REIT 1,576 18 20Retail Properties of America, Inc.
REIT 2,166 21 26RLI Corp. 548 36 35RLJ Lodging Trust-REIT 2,601 45 50Rockville Financial, Inc. 857 9 11Rouse Properties, Inc. REIT 561 7 9S&T Bancorp, Inc. 711 15 13Sabra Healthcare, Inc. REIT 805 14 17Safeguard Scientifics, Inc. 656 10 10Safety Insurance Group, Inc. 375 17 17Sandy Spring Bancorp, Inc. 585 11 11Saul Centers, Inc. REIT 224 9 10SCBT Financial Corp. 420 14 17SeaBright Holdings, Inc. 637 6 7Seacoast Banking Corp. of Florida 1,260 2 2SEI Investments Co. 3,598 80 84Select Income REIT 560 14 14Selective Insurance Group, Inc. 1,391 25 27Senior Housing Properties Trust-
REIT 4,433 97 104Signature Bank 1,234 65 88Simmons First National Corp.-Class A 447 13 11Simon Property Group, Inc. REIT 7,598 852 1,196SL Green Realty Corp. REIT 2,219 153 169SLM Corp. 12,085 156 206Solar Capital, Ltd. 1,032 24 25Solar Senior Capital, Ltd. 345 6 6Southside Bancshares, Inc. 532 11 11Southwest Bancorp, Inc. 547 6 6Sovran Self Storage, Inc. REIT 733 29 45St. Joe Co. 1,618 30 37STAG Industrial, Inc. REIT 770 11 14StanCorp Financial Group, Inc. 1,133 45 41Starwood Property Trust, Inc.-REIT 3,177 66 73State Auto Financial Corp. 370 6 6State Bank Financial Corp. 834 13 13State Street Corp. 12,261 547 574StellarOne Corp. 606 8 9Stellus Capital Investment Corp. 201 3 3Sterling Bancorp 661 6 6Sterling Financial Corp. 691 12 14Stewart Information Services Corp. 538 7 14Stifel Financial Corp. 1,366 48 43Strategic Hotels & Resorts, Inc.
REIT 4,576 25 29Summit Hotel Properties, Inc. REIT 940 9 9Sun Bancorp, Inc. 602 2 2
The accompanying notes are an integral part of the financial statements. 71
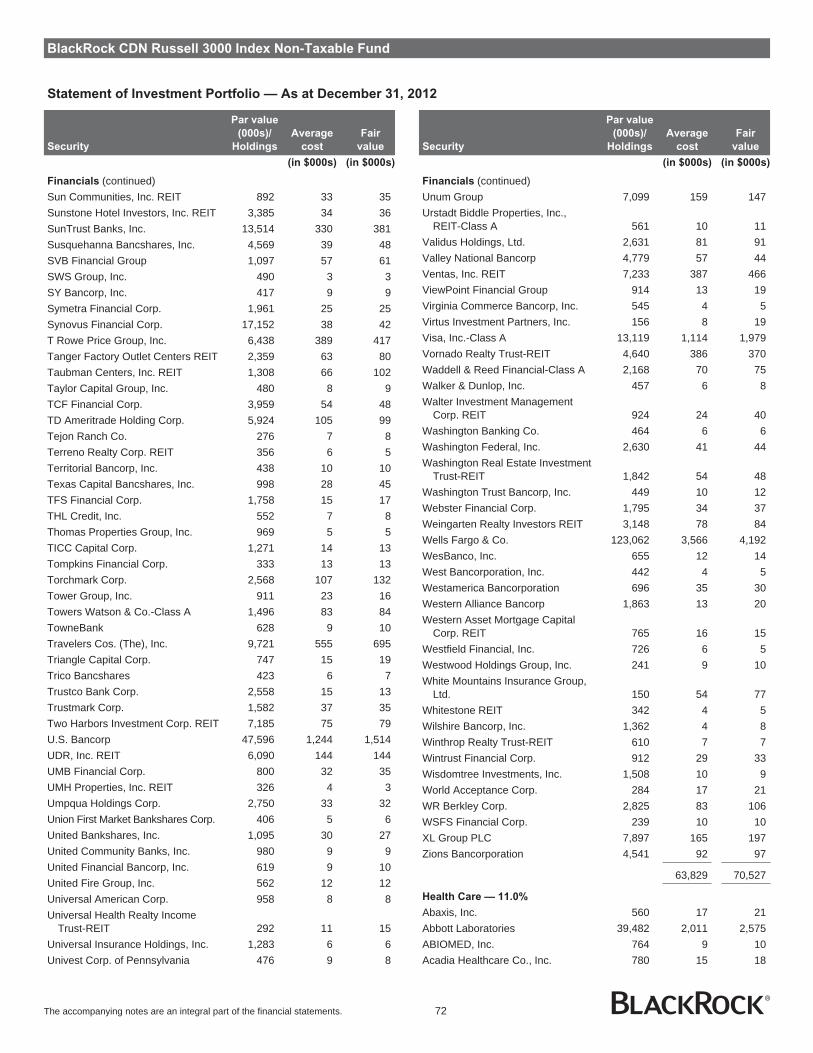
BlackRock CDN Russell 3000 Index Non-Taxable Fund
Statement of Investment Portfolio — As at December 31, 2012
Security
Par value
(000s)/
Holdings
Average
cost
Fair
value
(in $000s) (in $000s)
Financials (continued)Sun Communities, Inc. REIT 892 33 35Sunstone Hotel Investors, Inc. REIT 3,385 34 36SunTrust Banks, Inc. 13,514 330 381Susquehanna Bancshares, Inc. 4,569 39 48SVB Financial Group 1,097 57 61SWS Group, Inc. 490 3 3SY Bancorp, Inc. 417 9 9Symetra Financial Corp. 1,961 25 25Synovus Financial Corp. 17,152 38 42T Rowe Price Group, Inc. 6,438 389 417Tanger Factory Outlet Centers REIT 2,359 63 80Taubman Centers, Inc. REIT 1,308 66 102Taylor Capital Group, Inc. 480 8 9TCF Financial Corp. 3,959 54 48TD Ameritrade Holding Corp. 5,924 105 99Tejon Ranch Co. 276 7 8Terreno Realty Corp. REIT 356 6 5Territorial Bancorp, Inc. 438 10 10Texas Capital Bancshares, Inc. 998 28 45TFS Financial Corp. 1,758 15 17THL Credit, Inc. 552 7 8Thomas Properties Group, Inc. 969 5 5TICC Capital Corp. 1,271 14 13Tompkins Financial Corp. 333 13 13Torchmark Corp. 2,568 107 132Tower Group, Inc. 911 23 16Towers Watson & Co.-Class A 1,496 83 84TowneBank 628 9 10Travelers Cos. (The), Inc. 9,721 555 695Triangle Capital Corp. 747 15 19Trico Bancshares 423 6 7Trustco Bank Corp. 2,558 15 13Trustmark Corp. 1,582 37 35Two Harbors Investment Corp. REIT 7,185 75 79U.S. Bancorp 47,596 1,244 1,514UDR, Inc. REIT 6,090 144 144UMB Financial Corp. 800 32 35UMH Properties, Inc. REIT 326 4 3Umpqua Holdings Corp. 2,750 33 32Union First Market Bankshares Corp. 406 5 6United Bankshares, Inc. 1,095 30 27United Community Banks, Inc. 980 9 9United Financial Bancorp, Inc. 619 9 10United Fire Group, Inc. 562 12 12Universal American Corp. 958 8 8Universal Health Realty Income
Trust-REIT 292 11 15Universal Insurance Holdings, Inc. 1,283 6 6Univest Corp. of Pennsylvania 476 9 8
Security
Par value
(000s)/
Holdings
Average
cost
Fair
value
(in $000s) (in $000s)
Financials (continued)Unum Group 7,099 159 147Urstadt Biddle Properties, Inc.,
REIT-Class A 561 10 11Validus Holdings, Ltd. 2,631 81 91Valley National Bancorp 4,779 57 44Ventas, Inc. REIT 7,233 387 466ViewPoint Financial Group 914 13 19Virginia Commerce Bancorp, Inc. 545 4 5Virtus Investment Partners, Inc. 156 8 19Visa, Inc.-Class A 13,119 1,114 1,979Vornado Realty Trust-REIT 4,640 386 370Waddell & Reed Financial-Class A 2,168 70 75Walker & Dunlop, Inc. 457 6 8Walter Investment Management
Corp. REIT 924 24 40Washington Banking Co. 464 6 6Washington Federal, Inc. 2,630 41 44Washington Real Estate Investment
Trust-REIT 1,842 54 48Washington Trust Bancorp, Inc. 449 10 12Webster Financial Corp. 1,795 34 37Weingarten Realty Investors REIT 3,148 78 84Wells Fargo & Co. 123,062 3,566 4,192WesBanco, Inc. 655 12 14West Bancorporation, Inc. 442 4 5Westamerica Bancorporation 696 35 30Western Alliance Bancorp 1,863 13 20Western Asset Mortgage Capital
Corp. REIT 765 16 15Westfield Financial, Inc. 726 6 5Westwood Holdings Group, Inc. 241 9 10White Mountains Insurance Group,
Ltd. 150 54 77Whitestone REIT 342 4 5Wilshire Bancorp, Inc. 1,362 4 8Winthrop Realty Trust-REIT 610 7 7Wintrust Financial Corp. 912 29 33Wisdomtree Investments, Inc. 1,508 10 9World Acceptance Corp. 284 17 21WR Berkley Corp. 2,825 83 106WSFS Financial Corp. 239 10 10XL Group PLC 7,897 165 197Zions Bancorporation 4,541 92 97
63,829 70,527
Health Care — 11.0%
Abaxis, Inc. 560 17 21Abbott Laboratories 39,482 2,011 2,575ABIOMED, Inc. 764 9 10Acadia Healthcare Co., Inc. 780 15 18
The accompanying notes are an integral part of the financial statements. 72

BlackRock CDN Russell 3000 Index Non-Taxable Fund
Statement of Investment Portfolio — As at December 31, 2012
Security
Par value
(000s)/
Holdings
Average
cost
Fair
value
(in $000s) (in $000s)
Health Care (continued)Accelrys, Inc. 1,182 9 11Accenture PLC-Class A 16,179 794 1,071Accretive Health, Inc. 1,411 27 16Accuray, Inc. 1,857 10 12Achillion Pharmaceuticals, Inc. 1,480 10 12Acorda Therapeutics, Inc. 1,006 26 25Aegerion Pharmaceuticals, Inc. 661 10 17Aetna, Inc. 8,718 284 402Affymax, Inc. 949 8 18Affymetrix, Inc. 1,382 6 4Agenus, Inc. 294 1 1Air Methods Corp. 966 21 35Akorn, Inc. 1,489 13 20Alere, Inc. 2,016 61 37Alexion Pharmaceuticals 4,845 257 452Align Technology, Inc. 1,781 41 49Alkermes PLC 3,056 51 56Allergan, Inc. 7,627 551 696Allos Therapeutics, Inc. 5,650 - -Allscripts Healthcare Solutions, Inc. 4,235 76 40Almost Family, Inc. 144 5 3Alnylam Pharmaceuticals, Inc. 1,166 14 21Alphatec Holdings, Inc. 1,659 6 3AMAG Pharmaceuticals Inc. 584 10 9Amedisys, Inc. 840 22 9AmerisourceBergen Corp. 6,257 211 269Amgen, Inc. 19,519 1,146 1,678Amicus Therapeutics, Inc. 908 5 2AMN Healthcare Services, Inc. 1,146 9 13Ampio Pharmaceuticals, Inc. 729 6 3Amsurg Corp. 728 14 22Analogic Corp. 320 17 24Angiodynamics, Inc. 614 9 7Anika Therapeutics, Inc. 354 5 3Antares Pharma, Inc. 3,280 9 12Arena Pharmaceuticals, Inc. 5,368 19 48Ariad Pharmaceuticals, Inc. 4,106 36 78Arqule, Inc. 1,591 10 4Array Biopharma, Inc. 3,744 13 14Arthrocare Corp. 702 22 24Assisted Living Concepts, Inc. 389 7 4Astex Pharmaceuticals 2,113 6 6athenahealth, Inc. 889 44 65AtriCure, Inc. 487 6 3Atrion Corp. 45 8 9Auxilium Pharmaceuticals, Inc. 1,220 25 22AVANIR Pharmaceuticals, Inc. 3,583 12 9AVEO Pharmaceuticals, Inc. 872 16 7
Security
Par value
(000s)/
Holdings
Average
cost
Fair
value
(in $000s) (in $000s)
Health Care (continued)Baxter International, Inc. 13,815 715 917Becton Dickinson & Co. 5,073 408 395Bio-Rad Laboratories, Inc.-Class A 499 50 52Bio-Reference Labs, Inc. 636 13 18BioCryst Pharmaceuticals, Inc. 1,337 5 2Biogen Idec, Inc. 6,032 496 880BioMarin Pharmaceutical, Inc. 3,123 96 153BioScrip, Inc. 1,384 11 15Biospecifics Technologies Corp. 80 2 1Biotime, Inc. 342 2 1Boston Scientific Corp. 36,116 234 206Bristol-Myers Squibb Co. 42,395 1,174 1,377Bruker Corp. 2,310 35 35Cadence Pharmaceuticals, Inc. 1,340 12 6Cambrex Corp. 693 5 8Cantel Medical Corp. 553 9 16Capital Senior Living Corp. 807 7 15Cardinal Health, Inc. 8,669 333 355Cardiovascular Systems, Inc. 446 6 6CareFusion Corp. 5,458 135 155Catamaran Corp. 5,155 172 242Celgene Corp. 11,083 697 868Celldex Therapeutics, Inc. 2,218 11 15Centene Corp. 1,279 36 52Cepheid, Inc. 1,630 40 55Cerner Corp. 3,669 194 284Cerus Corp. 1,464 5 5Charles River Laboratories
International, Inc. 1,225 41 46Chemed Corp. 479 30 33Chindex International, Inc. 488 6 5Cigna Corp. 7,250 292 386Clovis Oncology, Inc. 271 3 4Codexis, Inc. 726 7 2Community Health Systems, Inc. 2,251 70 69Computer Programs & Systems, Inc. 303 16 15Conceptus, Inc. 845 12 18CONMED Corp. 740 18 21Cooper Cos., Inc. 1,199 77 110Corcept Therapeutics, Inc. 1,353 6 2Corvel Corp. 161 8 7Covance, Inc. 1,370 65 79Coventry Health Care, Inc. 3,375 97 151Covidien PLC 12,106 558 696CR Bard, Inc. 2,104 189 205Cross Country Healthcare, Inc. 860 6 4CryoLife, Inc. 476 3 3Cubist Pharmaceuticals, Inc. 1,567 41 66
The accompanying notes are an integral part of the financial statements. 73

BlackRock CDN Russell 3000 Index Non-Taxable Fund
Statement of Investment Portfolio — As at December 31, 2012
Security
Par value
(000s)/
Holdings
Average
cost
Fair
value
(in $000s) (in $000s)
Health Care (continued)Curis, Inc. 1,701 6 6Cyberonics, Inc. 694 22 36Cynosure, Inc. 291 6 7Cytori Therapeutics, Inc. 1,786 9 5DaVita, Inc. 2,351 184 259Dendreon Corp. 3,195 97 17DENTSPLY International, Inc. 3,636 122 143Depomed, Inc. 1,191 9 7DexCom, Inc. 1,718 20 23Dyax Corp. 3,373 9 12Dynavax Technologies Corp. 4,536 16 13Edwards Lifesciences Corp. 2,890 216 259Eli Lilly & Co. 25,698 943 1,262Emergent Biosolutions, Inc. 520 10 8Emeritus Corp. 808 15 20Endo Pharmaceuticals
Holdings, Inc. 2,914 106 76Endocyte, Inc. 825 10 7Endologix, Inc. 1,341 13 19Ensign Group, Inc. 459 11 12Enzon Pharmaceuticals, Inc. 815 7 4ePocrates, Inc. 316 6 3Exact Sciences Corp. 1,983 17 21Exactech, Inc. 335 6 6ExamWorks Group, Inc. 1,000 20 14Exelixis, Inc. 4,660 26 21Express Scripts Holding Co. 20,265 1,146 1,089Five Star Quality Care, Inc. 1,100 7 5Fluidigm Corp. 576 9 8Forest Laboratories, Inc. 6,687 220 235Furiex Pharmaceuticals, Inc. 584 10 11Genomic Health, Inc. 413 10 11Gentiva Health Services, Inc. 875 18 9Geron Corp. 3,771 13 5Gilead Sciences, Inc. 19,031 780 1,393Globus Medical, Inc. 237 4 2Greatbatch, Inc. 544 12 13Greenway Medical Technologies 302 5 5Haemonetics Corp. 1,256 40 51Halozyme Therapeutics, Inc. 2,380 17 16Hanger Orthopedic Group, Inc. 868 18 24Hansen Medical, Inc. 740 2 2HCA Holdings, Inc. 4,180 124 126Health Management Associates, Inc. 6,340 56 59Health Net, Inc. 2,068 57 50Healthsouth Corp. 2,393 46 50HealthStream, Inc. 529 8 13Healthways, Inc. 926 8 10HeartWare International, Inc. 353 30 30
Security
Par value
(000s)/
Holdings
Average
cost
Fair
value
(in $000s) (in $000s)
Health Care (continued)Henry Schein, Inc. 2,284 146 183Hi-Tech Pharmacal Co., Inc. 279 8 10Hill-Rom Holdings, Inc. 1,553 61 44HMS Holdings Corp. 2,127 50 55Hologic, Inc. 6,761 122 135Hospira, Inc. 4,083 210 127Humana, Inc. 4,108 254 281ICU Medical, Inc. 343 14 21Idenix Pharmaceuticals, Inc. 2,229 15 11IDEXX Laboratories, Inc. 1,413 102 131Illumina, Inc. 3,120 181 173Immunocellular Therapeutics, Ltd. 1,348 5 3Immunogen, Inc. 2,195 25 28Immunomedics, Inc. 2,074 8 6Impax Laboratories, Inc. 1,684 34 34Incyte Corp., Ltd. 2,394 40 40Infinity Pharmaceuticals, Inc. 690 10 24Insulet Corp. 1,196 19 25Integra LifeSciences Holdings Corp. 473 22 18InterMune, Inc. 1,782 22 17Intuitive Surgical, Inc. 1,000 321 488Invacare Corp. 866 19 14IPC The Hospitalist Co., Inc. 432 16 17Ironwood Pharmaceuticals, Inc. 1,879 27 21Isis Pharmaceuticals, Inc. 2,504 25 26Jazz Pharmaceuticals PLC 1,047 49 55Johnson & Johnson 68,914 4,411 4,810Keryx Biopharmaceuticals, Inc. 2,376 11 6Kindred Healthcare, Inc. 1,207 23 13Laboratory Corp. of America
Holdings 2,427 212 209Landauer, Inc. 248 15 15Lexicon Pharmaceuticals, Inc. 5,270 10 12LHC Group, Inc. 354 10 7Life Technologies Corp. 4,517 230 221LifePoint Hospitals, Inc. 1,208 44 45Ligand Pharmaceuticals, Inc.-
Class B 621 9 13Luminex Corp. 1,050 19 18Magellan Health Services, Inc. 688 34 34MAKO Surgical Corp. 922 20 12MannKind Corp. 3,358 13 7MAP Pharmaceuticals, Inc. 752 11 12Masimo Corp. 1,252 38 26Maxygen, Inc. 498 3 1McKesson Corp. 5,905 423 570MedAssets, Inc. 1,648 28 27Medicines Co. 1,392 24 33Medidata Solutions, Inc. 576 13 22
The accompanying notes are an integral part of the financial statements. 74
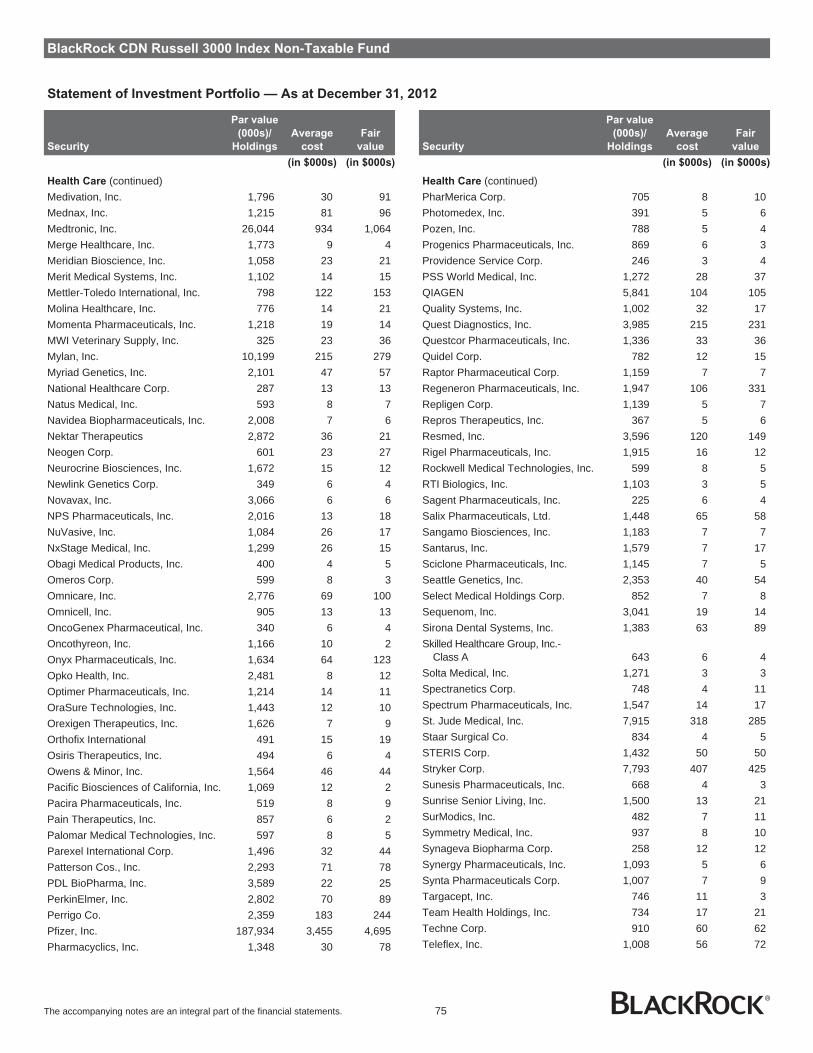
BlackRock CDN Russell 3000 Index Non-Taxable Fund
Statement of Investment Portfolio — As at December 31, 2012
Security
Par value
(000s)/
Holdings
Average
cost
Fair
value
(in $000s) (in $000s)
Health Care (continued)Medivation, Inc. 1,796 30 91Mednax, Inc. 1,215 81 96Medtronic, Inc. 26,044 934 1,064Merge Healthcare, Inc. 1,773 9 4Meridian Bioscience, Inc. 1,058 23 21Merit Medical Systems, Inc. 1,102 14 15Mettler-Toledo International, Inc. 798 122 153Molina Healthcare, Inc. 776 14 21Momenta Pharmaceuticals, Inc. 1,218 19 14MWI Veterinary Supply, Inc. 325 23 36Mylan, Inc. 10,199 215 279Myriad Genetics, Inc. 2,101 47 57National Healthcare Corp. 287 13 13Natus Medical, Inc. 593 8 7Navidea Biopharmaceuticals, Inc. 2,008 7 6Nektar Therapeutics 2,872 36 21Neogen Corp. 601 23 27Neurocrine Biosciences, Inc. 1,672 15 12Newlink Genetics Corp. 349 6 4Novavax, Inc. 3,066 6 6NPS Pharmaceuticals, Inc. 2,016 13 18NuVasive, Inc. 1,084 26 17NxStage Medical, Inc. 1,299 26 15Obagi Medical Products, Inc. 400 4 5Omeros Corp. 599 8 3Omnicare, Inc. 2,776 69 100Omnicell, Inc. 905 13 13OncoGenex Pharmaceutical, Inc. 340 6 4Oncothyreon, Inc. 1,166 10 2Onyx Pharmaceuticals, Inc. 1,634 64 123Opko Health, Inc. 2,481 8 12Optimer Pharmaceuticals, Inc. 1,214 14 11OraSure Technologies, Inc. 1,443 12 10Orexigen Therapeutics, Inc. 1,626 7 9Orthofix International 491 15 19Osiris Therapeutics, Inc. 494 6 4Owens & Minor, Inc. 1,564 46 44Pacific Biosciences of California, Inc. 1,069 12 2Pacira Pharmaceuticals, Inc. 519 8 9Pain Therapeutics, Inc. 857 6 2Palomar Medical Technologies, Inc. 597 8 5Parexel International Corp. 1,496 32 44Patterson Cos., Inc. 2,293 71 78PDL BioPharma, Inc. 3,589 22 25PerkinElmer, Inc. 2,802 70 89Perrigo Co. 2,359 183 244Pfizer, Inc. 187,934 3,455 4,695Pharmacyclics, Inc. 1,348 30 78
Security
Par value
(000s)/
Holdings
Average
cost
Fair
value
(in $000s) (in $000s)
Health Care (continued)PharMerica Corp. 705 8 10Photomedex, Inc. 391 5 6Pozen, Inc. 788 5 4Progenics Pharmaceuticals, Inc. 869 6 3Providence Service Corp. 246 3 4PSS World Medical, Inc. 1,272 28 37QIAGEN 5,841 104 105Quality Systems, Inc. 1,002 32 17Quest Diagnostics, Inc. 3,985 215 231Questcor Pharmaceuticals, Inc. 1,336 33 36Quidel Corp. 782 12 15Raptor Pharmaceutical Corp. 1,159 7 7Regeneron Pharmaceuticals, Inc. 1,947 106 331Repligen Corp. 1,139 5 7Repros Therapeutics, Inc. 367 5 6Resmed, Inc. 3,596 120 149Rigel Pharmaceuticals, Inc. 1,915 16 12Rockwell Medical Technologies, Inc. 599 8 5RTI Biologics, Inc. 1,103 3 5Sagent Pharmaceuticals, Inc. 225 6 4Salix Pharmaceuticals, Ltd. 1,448 65 58Sangamo Biosciences, Inc. 1,183 7 7Santarus, Inc. 1,579 7 17Sciclone Pharmaceuticals, Inc. 1,145 7 5Seattle Genetics, Inc. 2,353 40 54Select Medical Holdings Corp. 852 7 8Sequenom, Inc. 3,041 19 14Sirona Dental Systems, Inc. 1,383 63 89Skilled Healthcare Group, Inc.-
Class A 643 6 4Solta Medical, Inc. 1,271 3 3Spectranetics Corp. 748 4 11Spectrum Pharmaceuticals, Inc. 1,547 14 17St. Jude Medical, Inc. 7,915 318 285Staar Surgical Co. 834 4 5STERIS Corp. 1,432 50 50Stryker Corp. 7,793 407 425Sunesis Pharmaceuticals, Inc. 668 4 3Sunrise Senior Living, Inc. 1,500 13 21SurModics, Inc. 482 7 11Symmetry Medical, Inc. 937 8 10Synageva Biopharma Corp. 258 12 12Synergy Pharmaceuticals, Inc. 1,093 5 6Synta Pharmaceuticals Corp. 1,007 7 9Targacept, Inc. 746 11 3Team Health Holdings, Inc. 734 17 21Techne Corp. 910 60 62Teleflex, Inc. 1,008 56 72
The accompanying notes are an integral part of the financial statements. 75

BlackRock CDN Russell 3000 Index Non-Taxable Fund
Statement of Investment Portfolio — As at December 31, 2012
Security
Par value
(000s)/
Holdings
Average
cost
Fair
value
(in $000s) (in $000s)
Health Care (continued)Tenet Healthcare Corp. 2,562 48 83Theravance, Inc. 1,513 39 33Thermo Fisher Scientific, Inc. 9,224 490 586Thoratec Corp. 1,451 43 54Threshold Pharmaceuticals, Inc. 1,180 8 5Tornier BV 348 9 6Triple-S Management Corp. 544 11 10Trius Therapeutics, Inc. 1,805 9 9U.S. Physical Therapy, Inc. 328 8 9Unilife Corp. 1,689 7 4United Therapeutics Corp. 1,254 75 67UnitedHealth Group, Inc. 26,055 1,080 1,407Universal Health Services-Class B 2,270 96 109Vanda Pharmaceuticals, Inc. 907 6 3Vanguard Health Systems, Inc. 1,019 11 12Varian Medical Systems, Inc. 2,816 189 197Vascular Solutions, Inc. 506 6 8VCA Antech, Inc. 2,177 48 46Ventrus Biosciences, Inc. 443 6 1Vertex Pharmaceuticals, Inc. 5,333 200 223Vical, Inc. 2,254 9 7Viropharma, Inc. 1,735 31 39Vivus, Inc. 2,481 28 33Vocera Communications, Inc. 200 5 5Volcano Corp. 1,332 37 31Warner Chilcott PLC 4,191 84 50Waters Corp. 2,253 181 195Watson Pharmaceuticals, Inc. 3,189 184 273WellCare Health Plans, Inc. 1,069 37 52WellPoint, Inc. 7,624 447 463West Pharmaceutical Services, Inc. 840 35 46Wright Medical Group, Inc. 1,013 16 21XenoPort, Inc. 1,306 10 10XOMA Corp. 1,870 5 4Young Innovations, Inc. 194 6 8Zimmer Holdings, Inc. 4,416 236 293ZIOPHARM Oncology, Inc. 1,599 9 7
36,006 43,914
Industrials — 11.2%
3D Systems Corp. 1,174 26 623M Co. 17,418 1,525 1,610A.T. Cross Co.-Class A 215 3 2AAON, Inc. 409 7 9AAR Corp. 924 24 17ABM Industries, Inc. 1,336 31 27Acacia Research 1,243 40 32ACCO Brands Corp. 2,853 25 21Accuride Corp. 1,293 15 4
Security
Par value
(000s)/
Holdings
Average
cost
Fair
value
(in $000s) (in $000s)
Industrials (continued)ACE Aviation Holdings, Inc. 8,486 536 674Aceto Corp. 541 3 5Acorn Energy, Inc. 569 5 4Actuant Corp.-Class A 1,760 46 49Acuity Brands, Inc. 1,045 59 70ADT Corp. 5,837 207 270Advisory Board Co. 861 24 40Aegion Corp. 1,001 23 22Aerovironment, Inc. 480 12 10AGCO Corp. 2,395 107 117Air Lease Corp. 1,657 36 35Air Transport Services Group, Inc. 1,299 10 5Aircastle, Ltd. 1,496 16 19Alamo Group, Inc. 163 3 5Alaska Air Group, Inc. 1,743 52 75Albany International Corp.-Class A 681 15 15Allegiant Travel Co. 375 21 27Alliant Techsystems, Inc. 829 61 51Altra Holdings, Inc. 748 14 16Amerco, Inc. 223 22 28Ameresco, Inc.-Class A 565 8 6American Railcar Industries, Inc. 370 10 12American Science & Engineering, Inc. 236 18 15American Superconductor Corp. 736 24 2American Woodmark Corp. 347 6 10AMETEK, Inc. 6,101 175 228Ampco-Pittsburgh Corp. 211 5 4AO Smith Corp. 964 42 61Apogee Ent., Inc. 744 9 18Applied Industrial Technologies, Inc. 1,055 34 44Argan, Inc. 187 3 3Arkansas Best Corp. 693 17 7Astec Industries, Inc. 489 16 16Astronics Corp. 273 7 6Atlas Air Worldwide Holdings, Inc. 662 35 29Avery Dennison Corp. 2,568 95 89Avis Budget Group, Inc. 2,641 38 52AZZ, Inc. 642 14 25Babcock & Wilcox Co. 2,908 73 76Badger Meter, Inc. 397 15 19Barnes Group, Inc. 1,356 28 30Barrett Business Services, Inc. 158 3 6BE Aerospace, Inc. 2,531 97 124Beacon Roofing Supply, Inc. 1,173 24 39Belden, Inc. 1,140 42 51Blount International, Inc. 1,238 20 20Boeing Co. 18,829 1,281 1,413Brady Corp.-Class A 1,231 39 41
The accompanying notes are an integral part of the financial statements. 76

BlackRock CDN Russell 3000 Index Non-Taxable Fund
Statement of Investment Portfolio — As at December 31, 2012
Security
Par value
(000s)/
Holdings
Average
cost
Fair
value
(in $000s) (in $000s)
Industrials (continued)Briggs & Stratton Corp. 1,218 22 26Builders Firstsource, Inc. 1,138 5 6C.H. Robinson Worldwide, Inc. 4,099 300 258Cabot Corp. 1,575 59 62CAI International, Inc. 602 12 13Capstone Turbine Corp. 6,121 8 5Carlisle Cos., Inc. 1,538 64 90Cascade Corp. 225 9 14Casella Waste Systems, Inc. 2,006 10 9Caterpillar, Inc. 16,392 1,474 1,463CBIZ, Inc. 842 6 5CDI Corp. 254 3 4Celadon Group, Inc. 398 5 7Cenveo, Inc. 1,804 11 5Chart Industries, Inc. 747 31 50Chicago Bridge & Iron Co. 2,414 79 111Cintas Corp. 2,789 86 114CIRCOR International, Inc. 467 18 18CLARCOR, Inc. 1,237 54 59Clean Harbors, Inc. 1,343 59 74CNH Global 703 30 28Colfax Corp. 1,086 29 44Columbus McKinnon Corp. 541 8 9Comfort Systems USA, Inc. 1,051 12 13Commercial Vehicle Group, Inc. 703 11 6Con-Way, Inc. 1,380 47 38Consolidated Graphics, Inc. 227 11 8Continental Airlines-Class B 1,048 63 77Copa Holdings SA-Class A 824 51 82Copart, Inc. 2,500 49 73Corporate Executive Board Co. 838 32 40Corrections Corp. of America 2,454 64 87CoStar Group, Inc. 701 43 62Covanta Holding Corp. 2,666 44 49CRA International, Inc. 178 4 3Crane Co. 1,220 49 56Crown Holdings, Inc. 3,763 125 138CSX Corp. 26,040 561 511Cubic Corp. 407 20 19Cummins, Inc. 4,834 493 522Curtiss-Wright Corp. 1,177 38 38Danaher Corp. 14,593 687 813Deere & Co. 9,968 780 858Delta Air Lines, Inc. 21,372 273 253Deluxe Corp. 1,270 30 41DigitalGlobe, Inc. 908 26 22Dolan Co. 909 11 4Donaldson Co., Inc. 3,669 109 120
Security
Par value
(000s)/
Holdings
Average
cost
Fair
value
(in $000s) (in $000s)
Industrials (continued)Douglas Dynamics, Inc. 490 7 7Dover Corp. 4,616 269 302Dresser-Rand Group, Inc. 1,941 84 109Dun & Bradstreet Corp. 1,151 90 90DXP Ent., Inc. 259 8 13Dycom Industries, Inc. 985 17 19Dynamic Materials Corp. 310 6 4Eaton Corp. PLC 11,559 592 624Edgen Group, Inc. 579 5 4EMCOR Group, Inc. 1,649 47 57Emerson Electric Co. 18,450 1,019 973Encore Wire Corp. 391 10 12Energy Recovery, Inc. 722 2 2EnergySolutions, Inc. 2,502 11 8EnerNOC, Inc. 719 14 8EnerSys 1,197 39 45Engility Holdings, Inc. 414 7 8Ennis, Inc. 735 12 11EnPro Industries, Inc. 498 20 20Equifax, Inc. 3,027 113 163ESCO Technologies, Inc. 664 24 25Esterline Technologies Corp. 765 47 48Exelis, Inc. 4,569 52 51Expeditors International of
Washington, Inc. 5,385 277 212Exponent, Inc. 362 15 20Fastenal Co. 7,465 239 347Federal Signal Corp. 1,683 10 13FedEx Corp. 7,895 737 721Flow International Corp. 1,482 5 5Flowserve Corp. 1,285 143 188Fluor Corp. 4,253 254 249Forward Air Corp. 721 21 25Franklin Covey Co. 318 3 4Franklin Electric Co., Inc. 589 25 36FreightCar America, Inc. 231 6 5FTI Consulting, Inc. 1,052 38 35FuelCell Energy, Inc. 4,585 7 4Furmanite Corp. 1,185 9 6G&K Services, Inc.-Class A 503 15 17Gardner Denver, Inc. 1,242 86 85GATX Corp. 1,169 42 50Genco Shipping & Trading, Ltd. 568 8 2GenCorp, Inc. 1,479 8 13Generac Holdings, Inc. 697 14 24General Dynamics Corp. 7,998 546 552General Electric Co. 266,021 4,634 5,557Genesee & Wyoming, Inc.-Class A 1,097 61 83
The accompanying notes are an integral part of the financial statements. 77

BlackRock CDN Russell 3000 Index Non-Taxable Fund
Statement of Investment Portfolio — As at December 31, 2012
Security
Par value
(000s)/
Holdings
Average
cost
Fair
value
(in $000s) (in $000s)
Industrials (continued)Geo Group, Inc. 1,744 45 49GeoEye, Inc. 363 14 11Gibraltar Industries, Inc. 721 8 11Global Power Equipment Group, Inc. 387 10 7Gorman-Rupp Co. 328 9 10GP Strategies Corp. 441 7 9Graco, Inc. 1,497 60 77GrafTech International, Ltd. 2,748 53 26Graham Corp. 327 6 6Granite Construction, Inc. 1,041 28 35Great Lakes Dredge & Dock Corp. 1,261 9 11Greenbrier Cos., Inc. 500 10 8Griffon Corp. 963 12 11GS Yuasa Corp. 1,603 71 39H&E Equipment Services, Inc. 757 10 11Harsco Corp. 1,984 48 46Hawaiian Holdings, Inc. 1,232 10 8Healthcare Services Group, Inc. 1,660 28 38Heartland Express, Inc. 1,207 19 16HEICO Corp. 1,315 46 59Heidrick & Struggles International, Inc. 488 11 7Heritage-Crystal Clean, Inc. 273 5 4Herman Miller, Inc. 1,784 40 38Hexcel Corp. 2,467 48 66Higher One Holdings, Inc. 713 13 8Hill International, Inc. 536 3 2HNI Corp. 1,138 32 34Honeywell International, Inc. 19,580 1,041 1,238Houston Wire & Cable Co. 528 8 6HUB Group, Inc.-Class A 933 31 31Hudson Global, Inc. 1,182 6 5Huntington Ingalls Industries, Inc. 1,233 47 53Hurco Cos., Inc. 212 6 5Huron Consulting Group, Inc. 584 16 20Hyster-yale Materials Handling, Inc. 298 13 14ICF International, Inc. 463 11 11IDEX Corp. 2,076 82 96IHS, Inc.-Class A 1,286 106 123II-VI, Inc. 1,316 29 24Illinois Tool Works, Inc. 10,691 544 647Ingersoll-Rand PLC 7,518 321 359Innerworkings, Inc. 753 6 10Insperity, Inc. 614 17 20Insteel Industries, Inc. 504 6 6Interface, Inc. 1,502 21 24Intersections, Inc. 159 2 2Iron Mountain, Inc. 4,217 109 130ITT Corp. 2,281 201 53
Security
Par value
(000s)/
Holdings
Average
cost
Fair
value
(in $000s) (in $000s)
Industrials (continued)Jacobs Engineering Group, Inc. 3,267 133 138JB Hunt Transport Services, Inc. 2,263 94 134Jetblue Airways 5,718 36 33John Bean Technologies Corp. 728 13 13Joy Global, Inc. 2,701 211 172Kadant, Inc. 231 7 6Kaman Corp. 670 21 25Kansas City Southern 2,766 150 230KAR Auction Services, Inc. 766 13 15Kaydon Corp. 810 27 19KBR, Inc. 3,661 105 109Kelly Services, Inc.-Class A 569 11 9Kennametal, Inc. 1,976 72 79KEYW Holding Corp. 568 7 7Kforce, Inc. 692 11 10Kimball International, Inc. 942 6 11Knight Transportation, Inc. 1,444 27 21Knoll, Inc. 1,092 18 17Korn/Ferry International 1,129 21 18Kratos Defense & Security
Solutions, Inc. 1,097 12 5L-3 Communications Holdings, Inc. 2,450 178 187Landstar System, Inc. 1,160 47 61Layne Christensen Co. 569 17 14LB Foster Co. 212 8 9Lear Corp. 2,551 114 119Lennox International, Inc. 1,262 55 66Lincoln Electric Holdings, Inc. 2,072 70 100Lindsay Corp. 330 20 26LMI Aerospace, Inc. 292 6 6Lockheed Martin Corp. 6,548 485 602LSI Industries, Inc. 760 6 5Lydall, Inc. 535 6 8Manitowoc Co. (The), Inc. 3,293 40 51Manpower, Inc. 1,973 108 83Marten Transport, Ltd. 352 7 6Masco Corp. 9,016 110 150MasTec, Inc. 1,441 23 36Matson, Inc. 1,048 40 26McGrath Rentcorp 590 17 17Meritor, Inc. 2,563 39 12Metalico, Inc. 1,414 8 3Michael Baker Corp. 274 6 7Middleby Corp. 468 42 60Miller Industries, Inc. 343 6 5Mine Safety Appliances Co. 694 23 30Mistras Group, Inc. 355 5 9Mobile Mini, Inc. 1,012 20 21
The accompanying notes are an integral part of the financial statements. 78

BlackRock CDN Russell 3000 Index Non-Taxable Fund
Statement of Investment Portfolio — As at December 31, 2012
Security
Par value
(000s)/
Holdings
Average
cost
Fair
value
(in $000s) (in $000s)
Industrials (continued)Monster Worldwide, Inc. 3,061 51 17Moog, Inc.-Class A 1,123 44 46MRC Global, Inc. 558 11 15MSC Industrial Direct Co. 1,127 73 85Mueller Industries, Inc. 673 24 34Mueller Water Products, Inc. 4,174 14 23Multi-Color Corp. 344 8 8MYR Group, Inc. 603 10 13NACCO Industries, Inc.-Class A 149 15 9National Presto Industries, Inc. 137 14 9Navigant Consulting, Inc. 1,295 11 14Navistar International Corp. 1,896 83 41NCI Building Systems, Inc. 816 10 11Nielsen Holdings 3,042 87 93NN, Inc. 573 7 5Nordson Corp. 1,596 72 100Norfolk Southern Corp. 8,172 528 503Nortek, Inc. 202 10 13Northrop Grumman Corp. 6,301 404 424Northwest Pipe Co. 216 5 5Odyssey Marine Exploration, Inc. 1,516 4 4Old Dominion Freight Line, Inc. 1,759 40 60On Assignment, Inc. 1,134 13 23Orbital Sciences Corp. 1,483 25 20Orion Marine Group, Inc. 621 5 5Paccar, Inc. 8,992 474 405Pacer International, Inc. 1,291 6 5Pall Corp. 2,943 146 177Park-Ohio Holdings Corp. 304 6 6Parker Hannifin Corp. 3,811 320 323Patriot Transportation Holding, Inc. 255 6 7Pentair, Ltd. 5,294 210 259Pike Electric Corp. 318 3 3Pilgrim’s Pride Corp. 1,315 7 9Pitney Bowes, Inc. 4,171 91 44PMFG, Inc. 522 10 5Polypore International, Inc. 1,161 54 54Powell Industries, Inc. 223 8 9Precision Castparts Corp. 3,663 542 691Preformed Line Products Co. 86 6 5Primoris Services Corp. 752 10 11Proto Labs, Inc. 140 5 6Quad/Graphics, Inc. 664 18 14Quality Distribution, Inc. 501 6 3Quanex Building Products Corp. 982 17 20Quanta Services, Inc. 5,248 102 143Rand Logistics, Inc. 590 5 4Raven Industries, Inc. 912 23 24
Security
Par value
(000s)/
Holdings
Average
cost
Fair
value
(in $000s) (in $000s)
Industrials (continued)Raytheon Co. 8,341 408 478RBC Bearings, Inc. 569 23 28Regal-Beloit Corp. 1,090 71 77Republic Airways Holdings, Inc. 1,367 6 8Republic Services, Inc. 7,580 220 221Resources Connection, Inc. 1,176 17 14Rexnord Corp. 837 17 18Roadrunner Transportation
Systems, Inc. 371 6 7Robbins & Myers, Inc. 959 39 57Robert Half International, Inc. 3,507 102 111Rockwell Automation, Inc. 3,598 253 301Rockwell Collins, Inc. 3,670 209 213Rollins, Inc. 1,540 30 34Roper Industries, Inc. 2,451 197 272RPM International, Inc. 3,245 73 95RPX Corp. 398 8 4RR Donnelley & Sons Co. 4,461 70 40Rush Ent., Inc.-Class A 881 16 18Ryder System, Inc. 1,264 59 63Saia, Inc. 450 8 10Sauer-Danfoss, Inc. 277 9 15Schawk, Inc. 368 6 5Seaboard Corp. 7 15 18SeaCube Container Leasing, Ltd. 364 6 7Shaw Group, Inc. 1,639 54 76Simpson Manufacturing Co., Inc. 1,007 28 33Skywest, Inc. 1,323 19 16Snap-On, Inc. 1,436 82 113Southwest Airlines Co. 19,264 240 196Spirit Aerosystems Holdings, Inc.-
Class A 2,937 61 50Spirit Airlines Inc. 1,053 18 19SPX Corp. 1,255 84 88Standard Parking Corp. 324 5 7Standex International Corp. 347 12 18Stanley Black & Decker, Inc. 4,309 275 317Steelcase, Inc.-Class A 1,957 19 25Stericycle, Inc. 2,130 169 198Sterling Construction Co., Inc. 490 6 5Sun Hydraulics Corp. 455 10 12Swift Transportation Co. 2,092 25 19Swisher Hygiene, Inc. 2,615 13 5SYKES Ent., Inc. 958 19 15TAL International Group, Inc. 729 23 26Taser International, Inc. 1,180 5 11Team, Inc. 529 13 20Teledyne Technologies, Inc. 914 43 59Tennant Co. 472 18 21
The accompanying notes are an integral part of the financial statements. 79

BlackRock CDN Russell 3000 Index Non-Taxable Fund
Statement of Investment Portfolio — As at December 31, 2012
Security
Par value
(000s)/
Holdings
Average
cost
Fair
value
(in $000s) (in $000s)
Industrials (continued)Terex Corp. 2,745 68 77Tetra Tech, Inc. 1,575 39 41Textainer Group Holdings, Ltd. 352 11 11Textron, Inc. 7,117 167 176Thermon Group Holdings, Inc. 305 5 7Timken Co. (The) 2,164 99 103Titan International, Inc. 1,320 25 29Titan Machinery, Inc. 362 8 9TMS International Corp. 446 6 6Toro Co. 1,483 47 63TransDigm Group, Inc. 1,287 106 175TRC Cos., Inc. 383 2 2Tredegar Corp. 556 11 11Trex Co., Inc. 405 9 15Trimas Corp. 839 17 23Trinity Industries, Inc. 1,994 51 71Triumph Group, Inc. 1,229 62 80TrueBlue, Inc. 1,033 18 16TRW Automotive Holdings Corp. 2,550 125 136Tutor Perini Corp. 907 18 12Twin Disc, Inc. 199 7 3U.S. Airways Group, Inc. 4,021 44 54U.S. Ecology, Inc. 528 9 12Unifirst Corp. 352 19 26Union Pacific Corp. 11,936 1,169 1,494United Continental Holdings, Inc. 8,372 218 195United Parcel Service, Inc.-Class B 18,154 1,322 1,333United Rentals, Inc. 2,389 72 108United Stationers, Inc. 1,029 32 32United Technologies Corp. 22,892 1,812 1,869Universal Forest Products, Inc. 480 17 18URS Corp. 1,863 77 73USG Corp. 1,851 28 52UTI Worldwide, Inc. 2,591 47 35Valmont Industries, Inc. 576 52 78Verisk Analytics, Inc.-Class A 3,715 140 189Viad Corp. 521 12 14Vicor Corp. 584 9 3VSE Corp. 83 2 2W.W. Grainger, Inc. 1,463 213 295Wabash National Corp. 1,838 19 16WABCO Holdings, Inc. 1,587 86 103Wabtec Corp. 1,193 65 104Waste Connections, Inc. 3,095 87 104Waste Management, Inc. 11,500 404 386Watsco, Inc. 728 47 54Watts Water Technologies, Inc. 715 25 31Werner Enterprises, Inc. 1,095 24 24WESCO Aircraft Holdings, Inc. 375 4 5
Security
Par value
(000s)/
Holdings
Average
cost
Fair
value
(in $000s) (in $000s)
Industrials (continued)WESCO International, Inc. 1,079 56 72Woodward Governor Co. 1,718 63 65XPO Logistics, Inc. 476 8 8Xylem, Inc. 4,781 126 129Zipcar, Inc. 1,158 13 10
40,612 44,673
Information Technology — 17.2%
ACI Worldwide, Inc. 988 31 43Acme Packet, Inc. 1,457 71 32Active Network, Inc. 783 12 4Activision Blizzard, Inc. 10,408 127 110Actuate Corp. 1,102 6 6Acxiom Corp. 1,913 34 33Adobe Systems, Inc. 12,512 370 469ADTRAN, Inc. 1,586 51 31Advanced Energy Industries, Inc. 979 12 13Advanced Micro Devices, Inc. 15,585 109 37Advent Software, Inc. 812 22 17Aecom Technology Corp. 2,787 71 66Aeroflex Holding Corp. 689 11 5Agilent Technologies, Inc. 8,753 329 357Agilysys, Inc. 334 3 3Akamai Technologies, Inc. 4,544 217 185Alliance Data Systems Corp. 1,266 101 182Alpha and Omega Semiconductor, Ltd. 457 6 4Altera Corp. 8,104 305 278Amdocs, Ltd. 4,176 116 141American Software, Inc.-Class A 773 6 6Amkor Technology, Inc. 1,611 12 7Amphenol Corp.-Class A 4,091 219 264Anadigics, Inc. 1,870 6 5Analog Devices, Inc. 7,431 279 311Anaren, Inc. 391 7 8Angie’s List, Inc. 1,126 16 13Anixter International, Inc. 700 41 45Annaly Capital Management, Inc. 24,135 426 337ANSYS, Inc. 2,377 129 159AOL, Inc. 2,052 47 61Apple, Inc. 23,472 8,844 12,457Applied Materials, Inc. 31,615 405 360Applied Micro Circuits Corp. 1,752 16 15Arris Group, Inc. 2,793 31 42Arrow Electronics, Inc. 2,751 93 104Aruba Networks, Inc. 2,782 60 57Aspen Technology, Inc. 2,329 38 64Atmel Corp. 10,966 115 72ATMI, Inc. 741 14 15Audience, Inc. 235 5 2
The accompanying notes are an integral part of the financial statements. 80

BlackRock CDN Russell 3000 Index Non-Taxable Fund
Statement of Investment Portfolio — As at December 31, 2012
Security
Par value
(000s)/
Holdings
Average
cost
Fair
value
(in $000s) (in $000s)
Information Technology (continued)Automatic Data Processing, Inc. 12,304 603 698Avago Technologies, Ltd. 6,050 197 191Aviat Networks, Inc. 1,930 7 6Avid Technology, Inc. 905 12 7Avnet, Inc. 3,570 115 109AVX Corp. 1,008 14 11Axcelis Technologies, Inc. 3,659 6 5AXT, Inc. 633 6 2Bankrate, Inc. 1,185 21 15Bazaarvoice, Inc. 267 5 2Bel Fuse, Inc.-Class B 299 6 6Benchmark Electronics, Inc. 1,410 24 23Black Box Corp. 412 16 10Blackbaud, Inc. 1,138 31 26Blucora, Inc. 945 8 15BMC Software, Inc. 4,078 182 161Boingo Wireless, Inc. 497 6 4Booz Allen Hamilton Holding Corp. 596 11 8Bottomline Technologies, Inc. 883 18 23Broadcom Corp.-Class A 13,807 591 456BroadSoft, Inc. 663 24 24Brocade Communications Sys 11,311 60 60Brooks Automation, Inc. 1,804 15 14CA, Inc. 8,923 214 195Cabot Microelectronics Corp. 567 24 20CACI International, Inc.-Class A 561 30 31Cadence Design Sys, Inc. 6,762 60 91Calamp Corp. 846 7 7Calix, Inc. 1,097 16 8Callidus Software, Inc. 1,059 6 5Cardtronics, Inc. 1,117 23 26Cass Information Systems, Inc. 279 10 12Cavum, Inc. 1,241 47 39Ceva, Inc. 624 14 10Checkpoint Systems, Inc. 1,042 18 11Ciber, Inc. 2,065 11 7Ciena Corp. 2,468 39 39Cirrus Logic, Inc. 1,598 32 46Cisco Systems, Inc. 134,493 2,612 2,631Citrix Systems, Inc. 4,709 332 308Cognex Corp. 1,067 34 39Cognizant Technology Solutions
Corp.-Class A 7,678 524 566Coherent, Inc. 592 26 30Cohu, Inc. 446 5 5CommVault Systems, Inc. 1,109 38 77Computer Sciences Corp. 3,925 172 157Computer Task Group, Inc. 502 7 9Compuware Corp. 5,322 56 58
Security
Par value
(000s)/
Holdings
Average
cost
Fair
value
(in $000s) (in $000s)
Information Technology (continued)comScore, Inc. 878 20 12Comtech Telecommunications Corp. 501 15 13Comverse Technology, Inc. 5,460 32 21Comverse, Inc. 546 16 15Concur Technologies, Inc. 1,128 62 76Constant Contact, Inc. 796 20 11Convergys Corp. 2,882 40 47CoreLogic, Inc. 2,645 51 71Cornerstone OnDemand, Inc. 863 19 25Corning, Inc. 38,150 655 479Cray, Inc. 811 5 13Cree, Inc. 2,867 159 97CSG Systems International, Inc. 851 16 15CTS Corp. 923 9 10Cymer, Inc. 769 33 69Cypress Semiconductor Corp. 3,788 62 41Daktronics, Inc. 952 12 11Datalink Corp. 501 5 4DealerTrack Holdings, Inc. 1,063 23 30Dell, Inc. 37,155 501 375Demand Media, Inc. 611 8 6Demandware, Inc. 180 5 5Dice Holdings, Inc. 1,050 14 10Diebold, Inc. 1,562 51 48Digi International, Inc. 791 10 7Digimarc Corp. 204 7 4Digital River, Inc. 885 34 13Diodes, Inc. 912 21 16Dolby Laboratories, Inc.-Class A 1,247 72 36DSP Group, Inc. 709 6 4DST Systems, Inc. 832 37 50DTS, Inc. 485 22 8Earthlink, Inc. 2,742 23 18eBay, Inc. 29,121 938 1,480Ebix, Inc. 716 16 11Echelon Corp. 1,121 11 3Echo Global Logistics, Inc. 359 6 6Electro Rent Corp. 469 7 7Electro Scientific Industries, Inc. 517 8 5Electronics for Imaging, Inc. 1,077 14 20Ellie Mae, Inc. 651 12 18Eloqua, Inc. 229 4 5EMC Corp., Massachusetts 52,726 1,220 1,329Emulex Corp. 2,249 24 16Entegris, Inc. 3,417 25 31Entropic Communications, Inc. 2,328 20 12Envestnet, Inc. 615 8 9EPIQ Systems, Inc. 875 11 11ePlus, Inc. 150 5 6
The accompanying notes are an integral part of the financial statements. 81
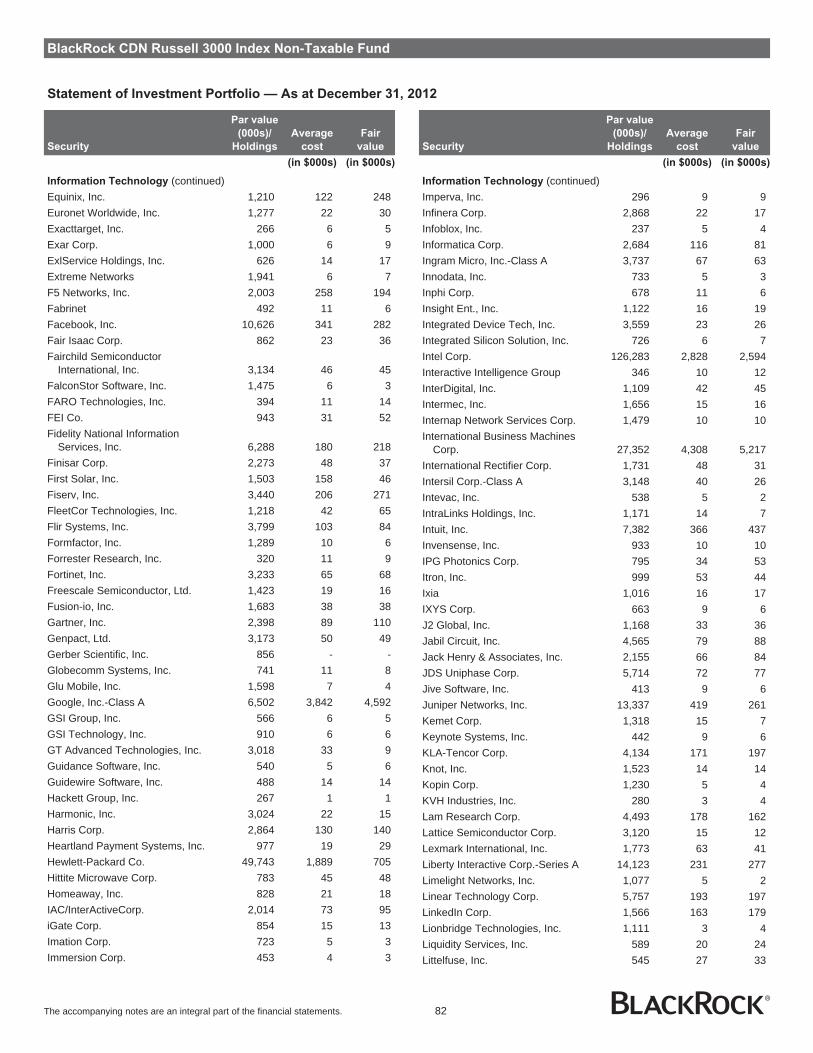
BlackRock CDN Russell 3000 Index Non-Taxable Fund
Statement of Investment Portfolio — As at December 31, 2012
Security
Par value
(000s)/
Holdings
Average
cost
Fair
value
(in $000s) (in $000s)
Information Technology (continued)Equinix, Inc. 1,210 122 248Euronet Worldwide, Inc. 1,277 22 30Exacttarget, Inc. 266 6 5Exar Corp. 1,000 6 9ExlService Holdings, Inc. 626 14 17Extreme Networks 1,941 6 7F5 Networks, Inc. 2,003 258 194Fabrinet 492 11 6Facebook, Inc. 10,626 341 282Fair Isaac Corp. 862 23 36Fairchild Semiconductor
International, Inc. 3,134 46 45FalconStor Software, Inc. 1,475 6 3FARO Technologies, Inc. 394 11 14FEI Co. 943 31 52Fidelity National Information
Services, Inc. 6,288 180 218Finisar Corp. 2,273 48 37First Solar, Inc. 1,503 158 46Fiserv, Inc. 3,440 206 271FleetCor Technologies, Inc. 1,218 42 65Flir Systems, Inc. 3,799 103 84Formfactor, Inc. 1,289 10 6Forrester Research, Inc. 320 11 9Fortinet, Inc. 3,233 65 68Freescale Semiconductor, Ltd. 1,423 19 16Fusion-io, Inc. 1,683 38 38Gartner, Inc. 2,398 89 110Genpact, Ltd. 3,173 50 49Gerber Scientific, Inc. 856 - -Globecomm Systems, Inc. 741 11 8Glu Mobile, Inc. 1,598 7 4Google, Inc.-Class A 6,502 3,842 4,592GSI Group, Inc. 566 6 5GSI Technology, Inc. 910 6 6GT Advanced Technologies, Inc. 3,018 33 9Guidance Software, Inc. 540 5 6Guidewire Software, Inc. 488 14 14Hackett Group, Inc. 267 1 1Harmonic, Inc. 3,024 22 15Harris Corp. 2,864 130 140Heartland Payment Systems, Inc. 977 19 29Hewlett-Packard Co. 49,743 1,889 705Hittite Microwave Corp. 783 45 48Homeaway, Inc. 828 21 18IAC/InterActiveCorp. 2,014 73 95iGate Corp. 854 15 13Imation Corp. 723 5 3Immersion Corp. 453 4 3
Security
Par value
(000s)/
Holdings
Average
cost
Fair
value
(in $000s) (in $000s)
Information Technology (continued)Imperva, Inc. 296 9 9Infinera Corp. 2,868 22 17Infoblox, Inc. 237 5 4Informatica Corp. 2,684 116 81Ingram Micro, Inc.-Class A 3,737 67 63Innodata, Inc. 733 5 3Inphi Corp. 678 11 6Insight Ent., Inc. 1,122 16 19Integrated Device Tech, Inc. 3,559 23 26Integrated Silicon Solution, Inc. 726 6 7Intel Corp. 126,283 2,828 2,594Interactive Intelligence Group 346 10 12InterDigital, Inc. 1,109 42 45Intermec, Inc. 1,656 15 16Internap Network Services Corp. 1,479 10 10International Business Machines
Corp. 27,352 4,308 5,217International Rectifier Corp. 1,731 48 31Intersil Corp.-Class A 3,148 40 26Intevac, Inc. 538 5 2IntraLinks Holdings, Inc. 1,171 14 7Intuit, Inc. 7,382 366 437Invensense, Inc. 933 10 10IPG Photonics Corp. 795 34 53Itron, Inc. 999 53 44Ixia 1,016 16 17IXYS Corp. 663 9 6J2 Global, Inc. 1,168 33 36Jabil Circuit, Inc. 4,565 79 88Jack Henry & Associates, Inc. 2,155 66 84JDS Uniphase Corp. 5,714 72 77Jive Software, Inc. 413 9 6Juniper Networks, Inc. 13,337 419 261Kemet Corp. 1,318 15 7Keynote Systems, Inc. 442 9 6KLA-Tencor Corp. 4,134 171 197Knot, Inc. 1,523 14 14Kopin Corp. 1,230 5 4KVH Industries, Inc. 280 3 4Lam Research Corp. 4,493 178 162Lattice Semiconductor Corp. 3,120 15 12Lexmark International, Inc. 1,773 63 41Liberty Interactive Corp.-Series A 14,123 231 277Limelight Networks, Inc. 1,077 5 2Linear Technology Corp. 5,757 193 197LinkedIn Corp. 1,566 163 179Lionbridge Technologies, Inc. 1,111 3 4Liquidity Services, Inc. 589 20 24Littelfuse, Inc. 545 27 33
The accompanying notes are an integral part of the financial statements. 82

BlackRock CDN Russell 3000 Index Non-Taxable Fund
Statement of Investment Portfolio — As at December 31, 2012
Security
Par value
(000s)/
Holdings
Average
cost
Fair
value
(in $000s) (in $000s)
Information Technology (continued)LivePerson, Inc. 1,385 17 18LogMeIn, Inc. 594 23 13Loral Space & Communications, Inc. 286 21 16LSI Corp. 14,009 87 99LTX-Credence Corp. 970 7 6Manhattan Associates, Inc. 534 18 32Mantech International Corp. 616 22 16Marchex, Inc.-Class B 707 6 3Marvell Technology Group, Ltd. 11,603 214 84MasterCard, Inc.-Class A 2,722 781 1,333Maxim Integrated Products, Inc. 7,309 182 214MAXIMUS, Inc. 844 31 53Maxwell Technologies, Inc. 805 13 7Measurement Specialties, Inc. 404 11 14MEMC Electronic Materials, Inc. 5,701 69 18Mentor Graphics Corp. 2,312 30 39Mercury Computer Systems, Inc. 905 14 8Methode Electronics, Inc. 1,011 10 10Micrel, Inc. 1,176 15 11Microchip Technology, Inc. 4,852 170 157Micron Technology, Inc. 24,905 178 157MICROS Systems, Inc. 1,986 92 84Microsemi Corp. 2,201 49 46Microsoft Corp. 189,046 5,137 5,030MicroStrategy, Inc.-Class A 216 22 20Millennial Media, Inc. 403 5 5Mindspeed Technologies, Inc. 968 7 5MIPS Technologies, Inc. 1,359 16 11MKS Instruments, Inc. 1,307 30 34ModusLink Global Solutions, Inc. 1,373 9 4Molex, Inc. 3,401 78 93Moneygram International, Inc. 458 10 6Monolithic Power Systems, Inc. 807 14 18Monotype Imaging Holdings, Inc. 957 14 15MoSys, Inc. 1,159 6 4Motorola Solutions, Inc. 7,340 282 407Move, Inc. 1,729 13 13MTS Systems Corp. 418 17 21Multi-Fineline Electronix, Inc. 170 3 3Nanometrics, Inc. 573 10 8National Instruments Corp. 2,284 56 59NCR Corp. 3,915 64 99Neonode, Inc. 770 5 4NetApp, Inc. 9,155 449 306Netgear, Inc. 951 33 37Netscout Systems, Inc. 926 21 24NetSuite, Inc. 778 28 52NeuStar, Inc.-Class A 1,656 44 69
Security
Par value
(000s)/
Holdings
Average
cost
Fair
value
(in $000s) (in $000s)
Information Technology (continued)Newport Corp. 1,028 15 14NIC, Inc. 1,934 20 31NII Holdings, Inc.-Class B 4,285 148 30Nuance Communications, Inc. 6,166 121 137NVE Corp. 107 6 6NVIDIA Corp. 15,586 226 191Oclaro, Inc. 2,068 12 3OCZ Technology Group, Inc. 1,441 12 3Omnivision Technologies, Inc. 1,318 34 18ON Semiconductor Corp. 11,171 94 78OpenTable, Inc. 571 38 28Oplink Communications, Inc. 510 9 8Oracle Corp. 95,985 2,787 3,184OSI Systems, Inc. 499 23 32Palo Alto Networks, Inc. 176 11 9Parametric Technology Corp. 2,954 65 66Park Electrochemical Corp. 558 16 14Parkervision, Inc. 2,233 5 5Paychex, Inc. 8,163 247 253PDF Solutions, Inc. 731 6 10Pegasystems, Inc. 381 13 9Perficient, Inc. 940 9 11Pericom Semiconductor Corp. 680 6 5Photronics, Inc. 1,668 10 10Plantronics, Inc. 1,059 39 39Plexus Corp. 883 26 23PLX Technology, Inc. 1,030 3 4PMC-Sierra, Inc. 5,017 38 26Polycom, Inc. 4,407 81 46Power Integrations, Inc. 711 29 24Power-One, Inc. 1,779 13 7PRGX Global, Inc. 403 3 3Procera Networks, Inc. 500 8 9Progress Software Corp. 1,571 40 33PROS Holdings, Inc. 531 9 10QLIK Technologies, Inc. 2,129 60 46QLogic Corp. 2,424 42 24QUALCOMM, Inc. 43,070 2,209 2,660Quantum Corp. 6,381 24 8QuinStreet, Inc. 615 8 4Rackspace Hosting, Inc. 2,747 102 203Radisys Corp. 930 6 3Rambus, Inc. 2,526 46 12RealD, Inc. 942 20 10Realnetworks, Inc. 587 8 4RealPage, Inc. 896 23 19Red Hat, Inc. 4,877 234 257Responsys, Inc. 737 10 4
The accompanying notes are an integral part of the financial statements. 83

BlackRock CDN Russell 3000 Index Non-Taxable Fund
Statement of Investment Portfolio — As at December 31, 2012
Security
Par value
(000s)/
Holdings
Average
cost
Fair
value
(in $000s) (in $000s)
Information Technology (continued)RF Micro Devices, Inc. 6,980 48 31Richardson Electronics, Ltd. 465 6 5Riverbed Technology, Inc. 4,017 124 79Rofin-Sinar Technologies, Inc. 737 21 16Rogers Corp. 446 16 22Rosetta Stone, Inc. 361 5 4Rovi Corp. 2,762 134 42Rubicon Technology, Inc. 529 12 3Rudolph Technologies, Inc. 985 10 13Saba Software, Inc. 877 7 8SAIC, Inc. 6,966 107 78Salesforce.Com, Inc. 3,485 494 583SanDisk Corp. 6,137 285 266Sanmina Corp. 2,035 21 22Sapient Corp. 3,033 37 32Scansource, Inc. 653 20 21SciQuest, Inc. 370 6 6Seachange International, Inc. 729 8 7Semtech Corp. 1,625 39 47Servicenow, Inc. 360 14 11ServiceSource International, Inc. 1,355 19 8ShoreTel, Inc. 1,017 8 4Sigma Designs, Inc. 957 9 5Silicon Graphics International Corp. 670 10 7Silicon Image, Inc. 2,025 14 10Skyworks Solutions, Inc. 4,687 125 95SolarWinds, Inc. 1,524 42 80Solera Holdings, Inc. 1,781 88 95Sonus Networks, Inc. 4,882 14 8Sourcefire, Inc. 736 23 35Spansion, Inc.-Class A 1,274 18 18Splunk, Inc. 382 11 11SPS Commerce, Inc. 310 9 11SS&C Technologies Holdings, Inc. 873 17 20Stamps.com, Inc. 328 8 8STEC, Inc. 798 14 4Stratasys, Ltd. 760 41 61Sunpower Corp. 1,107 14 6Super Micro Computer, Inc. 704 11 7Supertex, Inc. 225 5 4Support.com, Inc. 763 2 3Sycamore Networks, Inc. 553 13 1Symantec Corp. 18,141 315 340Symmetricom, Inc. 1,127 6 6Synaptics, Inc. 879 26 26Synchronoss Technologies, Inc. 696 19 15SYNNEX Corp. 618 19 21Synopsys, Inc. 3,580 98 114Syntel, Inc. 407 21 22
Security
Par value
(000s)/
Holdings
Average
cost
Fair
value
(in $000s) (in $000s)
Information Technology (continued)Take-Two Interactive Software, Inc. 2,178 25 24Tangoe, Inc. 804 15 10Tech Data Corp. 988 47 45TeleNav, Inc. 547 9 4TeleTech Holdings, Inc. 480 10 9Tellabs, Inc. 9,020 53 20Telular Corp. 582 5 6Teradata Corp. 4,252 203 262Teradyne, Inc. 4,594 60 77Tessera Technologies, Inc. 1,303 25 21Texas Instruments, Inc. 28,664 925 883TIBCO Software, Inc. 4,072 91 89TiVo, Inc. 3,246 30 40TNS, Inc. 896 18 19Total System Services, Inc. 3,989 68 85Travelzoo, Inc. 235 9 4Trimble Navigation, Ltd. 3,195 130 190TriQuint Semiconductor, Inc. 4,162 43 20TTM Technologies, Inc. 1,344 18 12Tyler Technologies, Inc. 756 18 36Ubiquiti Networks, Inc. 182 4 2Ultimate Software Group, Inc. 660 36 62Ultra Clean Holdings 716 6 4Ultratech, Inc. 667 15 25Unisys Corp. 1,043 25 18United Online, Inc. 2,414 16 13Universal Display Corp. 988 32 25Unwired Planet, Inc. 2,683 6 3ValueClick, Inc. 1,952 33 38Vantiv, Inc.-Class A 993 23 20VASCO Data Security International,
Inc. 796 8 6Veeco Instruments, Inc. 972 40 29VeriFone Systems, Inc. 2,664 98 79Verint Systems, Inc. 709 23 21VeriSign, Inc. 4,016 147 155Viasat, Inc. 936 39 36VirnetX Holding Corp. 1,053 18 31Virtusa Corp. 447 8 7Vishay Intertechnology, Inc. 3,151 47 33Vishay Precision Group, Inc. 407 7 5VistaPrint 888 37 29VMware, Inc.-Class A 2,235 196 210Vocus, Inc. 590 13 10Volterra Semiconductor Corp. 675 16 12Web.com Group, Inc. 1,060 12 16WebMD Health Corp. 1,295 58 19Websense, Inc. 991 20 15Westell Technologies, Inc. 1,798 6 3
The accompanying notes are an integral part of the financial statements. 84

BlackRock CDN Russell 3000 Index Non-Taxable Fund
Statement of Investment Portfolio — As at December 31, 2012
Security
Par value
(000s)/
Holdings
Average
cost
Fair
value
(in $000s) (in $000s)
Information Technology (continued)Western Digital Corp. 5,818 204 246Western Union Co. 15,506 282 210WEX, Inc. 967 48 73Xerox Corp. 33,232 363 226Xilinx, Inc. 6,585 197 235Yahoo!, Inc. 30,640 497 607Yelp, Inc. 253 6 5Zebra Technologies Corp.-Class A 1,291 49 51Zillow, Inc. 67 2 2Zix Corp. 2,335 9 7Zygo Corp. 333 4 5Zynga, Inc.-Class A 3,735 38 9
63,863 68,725
Materials — 4.1%
A Schulman, Inc. 775 18 22ADA-ES, Inc. 256 7 4AEP Industries, Inc. 145 6 9Air Products & Chemicals, Inc. 5,322 464 445Airgas, Inc. 1,732 115 157AK Steel Holding Corp. 4,075 39 19Albemarle Corp. 2,210 125 137Alcoa, Inc. 26,848 346 232Allegheny Technologies, Inc. 2,649 138 80Allied Nevada Gold Corp. 2,228 68 67AM Castle & Co. 364 6 5AMCOL International Corp. 589 18 18American Vanguard Corp. 680 9 21Aptargroup, Inc. 1,646 80 78Arabian American Development Co. 564 6 5Arch Coal, Inc. 5,285 136 38Armstrong World Industries 531 25 27Ashland, Inc. 1,994 112 160Balchem Corp. 766 25 28Ball Corp. 3,936 141 175Bemis Co. 2,605 84 87Boise, Inc. 2,507 19 20Buckeye Technologies, Inc. 996 24 28Calgon Carbon Corp. 1,313 19 19Carpenter Technology Corp. 1,095 47 56Celanese Corp.-Series A 3,973 159 176Century Aluminum Co. 1,435 17 12CF Industries Holdings, Inc. 1,647 231 333Chemtura Corp. 2,469 40 52Clearwater Paper Corp. 550 23 21Cliffs Natural Resources, Inc. 3,634 246 139Coeur d’Alene Mines Corp. 2,230 57 55Commercial Metals Co. 2,858 45 42Compass Minerals International, Inc. 819 68 61
Security
Par value
(000s)/
Holdings
Average
cost
Fair
value
(in $000s) (in $000s)
Materials (continued)Comstock Resources, Inc. 1,223 29 18Cytec Industries, Inc. 1,141 60 78Deltic Timber Corp. 358 21 25Domtar Corp. 898 71 75Dow Chemical Co. (The) 30,069 973 968Eagle Materials, Inc. 1,239 38 72Eastman Chemical Co. 3,845 171 261Ecolab, Inc. 6,545 351 468EI Du Pont de Nemours & Co. 23,561 1,157 1,055Ferro Corp. 2,570 27 11Flotek Industries, Inc. 1,334 12 16FMC Corp. 3,471 149 202Freeport-McMoran Copper &
Gold, Inc. 23,853 1,200 812FutureFuel Corp. 529 6 6General Moly, Inc. 1,959 9 8Georgia Gulf Corp. 859 20 35Globe Specialty Metals, Inc. 1,551 26 21Gold Reserve, Inc. 1,670 6 5Gold Resource Corp. 756 18 12Golden Minerals Co. 858 7 4Golden Star Resources, Ltd. 6,036 27 11Graphic Packaging Holding Co. 3,962 19 25Greif, Inc.-Class A 781 45 35Hawkins, Inc. 258 11 10Haynes International, Inc. 330 16 17HB Fuller Co. 1,249 31 43Headwaters, Inc. 1,946 9 17Hecla Mining Co. 7,063 64 41Horsehead Holding Corp. 913 10 9Hubbell, Inc.-Class B 1,525 97 129Huntsman Corp. 4,739 71 75Innophos Holdings, Inc. 555 21 26Innospec, Inc. 609 19 21International Flavors &
Fragrances, Inc. 2,048 115 136International Paper Co. 10,953 302 434Intrepid Potash, Inc. 1,346 39 29Kaiser Aluminum Corp. 489 25 30KapStone Paper and Packaging
Corp. 1,050 17 23KMG Chemicals, Inc. 135 2 2Koppers Holdings, Inc. 561 18 21Kraton Performance Polymers, Inc. 765 26 18Kronos Worldwide, Inc. 460 13 9Landec Corp. 500 3 5Louisiana-Pacific Corp. 3,419 30 66LSB Industries, Inc. 425 10 15LyondellBasell Industries-Class A 8,065 307 459
The accompanying notes are an integral part of the financial statements. 85
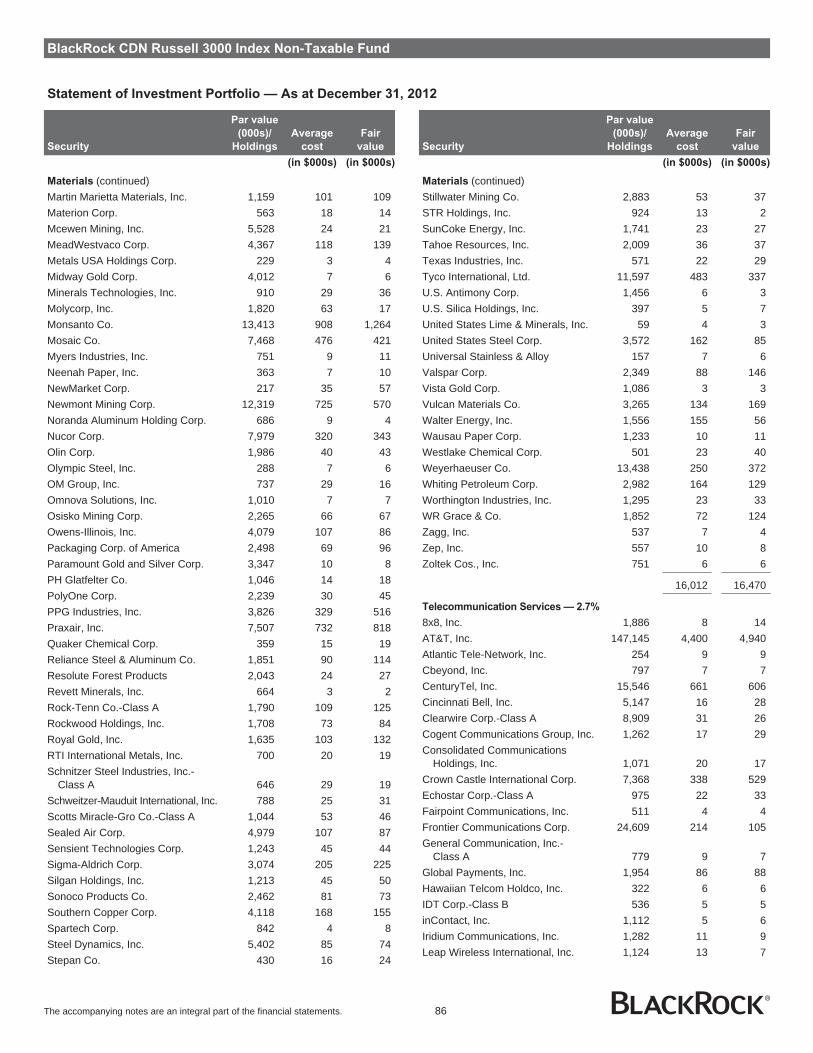
BlackRock CDN Russell 3000 Index Non-Taxable Fund
Statement of Investment Portfolio — As at December 31, 2012
Security
Par value
(000s)/
Holdings
Average
cost
Fair
value
(in $000s) (in $000s)
Materials (continued)Martin Marietta Materials, Inc. 1,159 101 109Materion Corp. 563 18 14Mcewen Mining, Inc. 5,528 24 21MeadWestvaco Corp. 4,367 118 139Metals USA Holdings Corp. 229 3 4Midway Gold Corp. 4,012 7 6Minerals Technologies, Inc. 910 29 36Molycorp, Inc. 1,820 63 17Monsanto Co. 13,413 908 1,264Mosaic Co. 7,468 476 421Myers Industries, Inc. 751 9 11Neenah Paper, Inc. 363 7 10NewMarket Corp. 217 35 57Newmont Mining Corp. 12,319 725 570Noranda Aluminum Holding Corp. 686 9 4Nucor Corp. 7,979 320 343Olin Corp. 1,986 40 43Olympic Steel, Inc. 288 7 6OM Group, Inc. 737 29 16Omnova Solutions, Inc. 1,010 7 7Osisko Mining Corp. 2,265 66 67Owens-Illinois, Inc. 4,079 107 86Packaging Corp. of America 2,498 69 96Paramount Gold and Silver Corp. 3,347 10 8PH Glatfelter Co. 1,046 14 18PolyOne Corp. 2,239 30 45PPG Industries, Inc. 3,826 329 516Praxair, Inc. 7,507 732 818Quaker Chemical Corp. 359 15 19Reliance Steel & Aluminum Co. 1,851 90 114Resolute Forest Products 2,043 24 27Revett Minerals, Inc. 664 3 2Rock-Tenn Co.-Class A 1,790 109 125Rockwood Holdings, Inc. 1,708 73 84Royal Gold, Inc. 1,635 103 132RTI International Metals, Inc. 700 20 19Schnitzer Steel Industries, Inc.-
Class A 646 29 19Schweitzer-Mauduit International, Inc. 788 25 31Scotts Miracle-Gro Co.-Class A 1,044 53 46Sealed Air Corp. 4,979 107 87Sensient Technologies Corp. 1,243 45 44Sigma-Aldrich Corp. 3,074 205 225Silgan Holdings, Inc. 1,213 45 50Sonoco Products Co. 2,462 81 73Southern Copper Corp. 4,118 168 155Spartech Corp. 842 4 8Steel Dynamics, Inc. 5,402 85 74Stepan Co. 430 16 24
Security
Par value
(000s)/
Holdings
Average
cost
Fair
value
(in $000s) (in $000s)
Materials (continued)Stillwater Mining Co. 2,883 53 37STR Holdings, Inc. 924 13 2SunCoke Energy, Inc. 1,741 23 27Tahoe Resources, Inc. 2,009 36 37Texas Industries, Inc. 571 22 29Tyco International, Ltd. 11,597 483 337U.S. Antimony Corp. 1,456 6 3U.S. Silica Holdings, Inc. 397 5 7United States Lime & Minerals, Inc. 59 4 3United States Steel Corp. 3,572 162 85Universal Stainless & Alloy 157 7 6Valspar Corp. 2,349 88 146Vista Gold Corp. 1,086 3 3Vulcan Materials Co. 3,265 134 169Walter Energy, Inc. 1,556 155 56Wausau Paper Corp. 1,233 10 11Westlake Chemical Corp. 501 23 40Weyerhaeuser Co. 13,438 250 372Whiting Petroleum Corp. 2,982 164 129Worthington Industries, Inc. 1,295 23 33WR Grace & Co. 1,852 72 124Zagg, Inc. 537 7 4Zep, Inc. 557 10 8Zoltek Cos., Inc. 751 6 6
16,012 16,470
Telecommunication Services — 2.7%
8x8, Inc. 1,886 8 14AT&T, Inc. 147,145 4,400 4,940Atlantic Tele-Network, Inc. 254 9 9Cbeyond, Inc. 797 7 7CenturyTel, Inc. 15,546 661 606Cincinnati Bell, Inc. 5,147 16 28Clearwire Corp.-Class A 8,909 31 26Cogent Communications Group, Inc. 1,262 17 29Consolidated Communications
Holdings, Inc. 1,071 20 17Crown Castle International Corp. 7,368 338 529Echostar Corp.-Class A 975 22 33Fairpoint Communications, Inc. 511 4 4Frontier Communications Corp. 24,609 214 105General Communication, Inc.-
Class A 779 9 7Global Payments, Inc. 1,954 86 88Hawaiian Telcom Holdco, Inc. 322 6 6IDT Corp.-Class B 536 5 5inContact, Inc. 1,112 5 6Iridium Communications, Inc. 1,282 11 9Leap Wireless International, Inc. 1,124 13 7
The accompanying notes are an integral part of the financial statements. 86

BlackRock CDN Russell 3000 Index Non-Taxable Fund
Statement of Investment Portfolio — As at December 31, 2012
Security
Par value
(000s)/
Holdings
Average
cost
Fair
value
(in $000s) (in $000s)
Telecommunication Services (continued)Level 3 Communications, Inc. 4,038 65 93Lumos Networks Corp. 853 9 9magicJack VocalTec, Ltd. 404 8 7MetroPCS Communications, Inc. 7,514 92 74Neutral Tandem, Inc. 581 9 2NTELOS Holdings Corp. 377 11 5Pendrell Corp. 4,379 13 6Premiere Global Services, Inc. 1,073 8 10Primus Telecommunications
Group, Inc. 362 6 4SBA Communications Corp.-Class A 3,049 134 216Shenandoah Telecommunications Co. 617 10 9Silicon Laboratories, Inc. 1,065 47 44Sprint Nextel Corp. 75,405 290 425Telephone & Data Systems, Inc. 2,332 69 51Towerstream Corp. 1,198 6 4TW Telecom, Inc. 3,729 68 95U.S. Cellular Corp. 351 16 12USA Mobility, Inc. 604 11 7Verizon Communications, Inc. 71,306 2,507 3,071Vonage Holdings Corp. 2,787 12 7Windstream Corp. 14,949 185 124
9,458 10,750
Utilities — 3.4%
AES Corp. (The) 16,301 185 174AGL Resources, Inc. 3,010 118 120Allete, Inc. 976 38 40Alliant Energy Corp. 2,824 110 123Ameren Corp. 6,116 184 187American Electric Power Co., Inc. 12,106 458 514American States Water Co. 551 21 26American Water Works Co., Inc. 4,403 120 163Aqua America, Inc. 3,645 83 92Artesian Resources Corp.-Class A 185 4 4Atlantic Power Corp. 2,861 41 33Avista Corp. 1,488 34 36Black Hills Corp. 1,115 36 40Cadiz, Inc. 587 6 5California Water Service Group 1,138 21 21Calpine Corp. 10,323 146 186Centerpoint Energy, Inc. 10,694 181 205CH Energy Group, Inc. 377 20 24Chesapeake Utilities Corp. 237 10 11Cleco Corp. 1,504 52 60CMS Energy Corp. 6,515 126 158Connecticut Water Service, Inc. 313 9 9Consolidated Edison, Inc. 7,328 380 405Dominion Resources, Inc. 14,337 643 739
Security
Par value
(000s)/
Holdings
Average
cost
Fair
value
(in $000s) (in $000s)
Utilities (continued)DTE Energy Co. 4,244 205 254Duke Energy Corp. 17,633 978 1,120Edison International 8,166 320 367El Paso Electric Co. 1,021 30 32Empire District Electric Co. 1,033 23 21Entergy Corp. 4,456 319 283EQT Corp. 3,322 152 195Exelon Corp. 21,492 828 636FirstEnergy Corp. 10,507 396 437FPL Group, Inc. 10,459 571 720Great Plains Energy, Inc. 3,320 67 67Hawaiian Electric Industries, Inc. 2,384 55 60IDACORP, Inc. 1,251 49 54Integrys Energy Group, Inc. 1,952 100 101ITC Holdings Corp. 1,334 86 102Laclede Group, Inc. 566 22 22MDU Resources Group, Inc. 4,624 98 98MGE Energy, Inc. 615 27 31Middlesex Water Co. 389 7 8New Jersey Resources Corp. 1,028 45 41NiSource, Inc. 7,619 145 189Northeast Utilities 7,871 263 306Northwest Natural Gas Co. 679 34 30NorthWestern Corp. 941 30 32NV Energy, Inc. 5,938 88 107OGE Energy Corp. 2,492 119 140ONEOK, Inc. 5,227 159 222Ormat Technologies, Inc. 734 16 14Otter Tail Corp. 964 21 24Pepco Holdings, Inc. 5,551 105 108PG&E Corp. 10,539 493 422Piedmont Natural Gas Co., Inc. 1,739 53 54Pinnacle West Capital Corp. 2,754 120 140PNM Resources, Inc. 2,004 27 41Portland General Electric Co. 1,879 43 51PPL Corp. 14,498 387 413Public Service Enterprise Group, Inc. 12,692 405 387Questar Corp. 4,343 76 85Scana Corp. 2,943 124 134Sempra Energy 6,018 324 425SJW Corp. 295 8 8South Jersey Industries, Inc. 762 40 38Southern Co. (The) 21,794 880 929Southwest Gas Corp. 1,138 42 48TECO Energy, Inc. 5,243 92 87UGI Corp. 2,948 91 96UIL Holdings Corp. 1,268 41 45Unitil Corp. 340 9 9
The accompanying notes are an integral part of the financial statements. 87

BlackRock CDN Russell 3000 Index Non-Taxable Fund
Statement of Investment Portfolio — As at December 31, 2012
Security
Par value
(000s)/
Holdings
Average
cost
Fair
value
(in $000s) (in $000s)
Utilities (continued)UNS Energy Corp. 1,025 38 43Vectren Corp. 2,007 53 59Westar Energy, Inc. 3,260 87 93WGL Holdings, Inc. 1,258 46 49Wisconsin Energy Corp. 5,795 184 213Xcel Energy, Inc. 12,198 302 324York Water Co. 317 6 6
12,355 13,395
Total Common Stocks 352,973 393,580
Transaction Costs (Note 2) (20)
Total Investments 353,733 394,367
Other Assets and Liabilities — 1.3% 5,361
Net Assets 399,728
Portfolio Concentration
(as a percentage of Net Assets)
Portfolio by Category
As at
December 31, 2012
As at
December 31, 2011
(%) (%)
Government Guaranteed 0.2 0.3Consumer Discretionary 12.4 11.6Consumer Staples 9.1 9.8Energy 9.8 11.2Financials 17.6 15.7Health Care 11.0 11.0Industrials 11.2 11.2Information Technology 17.2 17.6Materials 4.1 4.2Telecommunication Services 2.7 2.8Utilities 3.4 3.9Other Assets and Liabilities 1.3 0.7
Open futures contracts held by the Fund as at December 31, 2012 areshown in Note 4.
The accompanying notes are an integral part of the financial statements. 88

BlackRock Active Canadian Equity Fund
Statement of Net Assets — As at December 31
2012 2011
Assets
Investments - at fair value (Note 2) $ 2,080,522,377 $ 1,630,728,434Cash 18,501,104 10,322,886Margin due from brokers 1,212,043 1,452,361Securities lending income receivable 55,008 2,796Dividends and distributions from underlying trust units receivable 5,606,669 4,650,091Accounts receivable from issue of units 255,713 2,158,750Accounts receivable for investment sales 10,196,145 18,646,707
2,116,349,059 1,667,962,025
Liabilities
Operating expenses payable 50,437 38,661Payables for redemption of units 2,066,208 19,324,001Payables for investment purchases 9,431,218 -
11,547,863 19,362,662
Net Assets $ 2,104,801,196 $ 1,648,599,363
Number of Units Issued and Outstanding (Note 8) 63,254,747 53,426,840
Net Assets per Unit $ 33.27 $ 30.86
Investments at Cost $ 1,957,930,869 $ 1,585,595,755
Approved by BlackRock Asset Management Canada Limited,Manager of the Funds
Eric Léveillé, Director Noel Archard, Director
The accompanying notes are an integral part of the financial statements. 89

BlackRock Active Canadian Equity Fund
Statement of Operations — For the Years Ended December 31
2012 2011
Revenue
Dividend income and distributions from underlying trust units $ 51,531,411 $ 42,869,714Interest income 86,700 81,258Securities lending income 585,728 82,638Net gain (loss) from futures contracts 1,154,456 (1,435,030)
53,358,295 41,598,580
Expenses
Custodian fees 190,735 152,239Fund accounting expenses 69,648 73,145Unitholder communication costs 567 601Audit fees 14,408 15,757Securities filing fees 31,972 57,139Independent review committee fees 811 2,003Other operating expenses 6,470 7,006
314,611 307,890
Net Investment Income for the Year 53,043,684 41,290,690
Gain (Loss) on Investments
Net realized gain on sale of investments 28,054,978 114,183,261Transaction costs (Note 2,13) (2,887,399) (2,445,406)Net change in unrealized appreciation (depreciation) in value of investments 77,458,829 (265,452,623)
Net Gain (Loss) on Investments 102,626,408 (153,714,768)
Increase (Decrease) in Net Assets from Operations $ 155,670,092 $ (112,424,078)
Increase (Decrease) in Net Assets from Operations per Unit $ 2.70 $ (2.04)
Statement of Changes in Net Assets — For the Years Ended December 31
2012 2011
Net Assets - Beginning of Year $ 1,648,599,363 $ 1,919,568,427
Increase (Decrease) in Net Assets from Operations 155,670,092 (112,424,078)
Capital Transactions
Proceeds from issue of units 494,015,635 142,296,668Reinvestment of distributions 86,745,917 114,017,907Redemption of units (193,483,894) (300,841,654)
Net capital transactions 387,277,658 (44,527,079)
Distributions
From net investment income (51,801,863) (39,583,340)From capital gains (30,058,403) (68,950,619)From capital gains redemption in kind (Note 9) (4,885,651) (5,483,948)
Total distributions (86,745,917) (114,017,907)
Increase (Decrease) in Net Assets for the Year 456,201,833 (270,969,064)
Net Assets - End of Year $ 2,104,801,196 $ 1,648,599,363
The accompanying notes are an integral part of the financial statements. 90

BlackRock Active Canadian Equity Fund
Statement of Investment Portfolio — As at December 31, 2012
Security Holdings
Average
cost
Fair
value
(in $000s) (in $000s)
Canadian Common Stocks and
Income Trusts
Consumer Discretionary — 5.0%
Aimia, Inc. 1,637,478 22,089 24,333Astral Media, Inc.-Class A 72,190 3,482 3,335Cogeco Cable, Inc. 30,556 1,151 1,160Dollarama, Inc. 412,720 21,380 24,330Dorel Industries, Inc.-Class B 110,480 3,324 3,966Gildan Activewear, Inc. 31,442 1,107 1,140Linamar Corp. 223,263 4,560 5,175Magna International, Inc.-Class A 758,507 32,382 37,599Quebecor, Inc.-Class B 70,317 2,511 2,717Westport Innovations, Inc. 60,576 1,655 1,595
93,641 105,350
Consumer Staples — 2.1%
Alimentation Couche Tard, Inc.-Class B 262,643 10,163 12,804
Cott Corp. 1,248,622 9,876 9,989Jean Coutu Group, Inc.-Class A 621,945 9,231 9,025Loblaw Cos., Ltd. 139,377 5,684 5,834Metro, Inc.-Class A 62,617 3,715 3,959North West Co., Inc. 89,752 2,011 2,008
40,680 43,619
Energy — 26.9%
Bankers Petroleum, Ltd. 317,093 880 1,015Baytex Energy Corp. 658,642 30,805 28,216Bellatrix Exploration, Ltd. 254,015 1,193 1,080Calfrac Well Services, Ltd. 74,488 2,126 1,853Canadian Natural Resources, Ltd. 2,182,369 68,096 62,481Canadian Oil Sands, Ltd. 16,097 320 324Celtic Exploration, Ltd. 118,856 3,135 3,118Cenovus Energy, Inc. 1,688,012 57,276 56,194Cequence Energy, Ltd. 321,640 998 457Deethree Exploration, Ltd. 786,140 4,669 5,110Enbridge, Inc. 1,601,627 49,648 68,870Encana Corp. 541,341 11,642 10,610Enerflex, Ltd. 316,149 3,816 3,765Gibson Energy, Inc. 993,392 21,670 23,812Imperial Oil, Ltd. 102,463 4,383 4,378Inter Pipeline Fund 548,556 9,308 12,880Legacy Oil + Gas, Inc. 3,315,948 24,936 22,615Mullen Group, Ltd. 104,734 2,117 2,188Nexen, Inc. 738,509 16,021 19,622Niko Resources, Ltd. 83,786 732 890Parkland Fuel Corp. 654,298 10,725 12,340Pason Systems, Inc. 142,088 2,059 2,428Pembina Pipeline Corp. 45,189 1,238 1,285Petrobakken Energy, Ltd. 1,808,024 22,479 18,532Petrobank Energy & Resources, Ltd. 57,430 690 712Peyto Exploration & Development
Corp. 97,383 2,178 2,231
Security Holdings
Average
cost
Fair
value
(in $000s) (in $000s)
Energy (continued)Precision Drilling Corp. 106,164 856 870Savanna Energy Services Corp. 271,717 1,956 1,940ShawCor, Ltd.-Class A 626,091 23,639 24,361Suncor Energy, Inc. 2,780,272 91,514 90,915Surge Energy, Inc. 58,210 472 319TransCanada Corp. 1,140,183 48,569 53,554Transglobe Energy Corp. 146,120 1,453 1,360Trinidad Drilling, Ltd. 96,558 643 660Uranium One, Inc. 605,352 1,132 1,417Whitecap Resources, Inc. 2,612,718 21,672 22,574
545,046 564,976
Financials — 30.8%
Bank of Montreal 557,186 31,315 33,882Bank of Nova Scotia 1,944,879 100,882 111,675Boardwalk REIT 208,250 11,459 13,393Brookfield Asset Management, Inc.-
Class A 266,459 9,203 9,672Brookfield Properties Co. 1,624,160 26,418 27,416Canaccord Capital, Inc. 24,283 280 162Canadian Imperial Bank of
Commerce 306,554 23,208 24,512Canadian REIT 282,284 9,663 12,206Canadian Western Bank 173,112 4,592 4,916Davis & Henderson Income Corp. 394,792 7,254 8,484Dundee Corp.-Class A 231,655 5,449 7,093Extendicare Inc. 252,353 1,966 1,930Fairfax Financial Holdings, Ltd. 21,556 7,750 7,653Genworth MI Canada, Inc. 290,630 6,828 6,560Granite Real Estate, Inc. 420,387 14,578 15,857H&R REIT 166,519 3,943 4,013Home Capital Group, Inc. 120,388 5,263 7,105Industrial Alliance Insurance and
Financial Services, Inc. 391,593 11,273 12,269Intact Financial Corp. 510,130 28,476 32,985Laurentian Bank of Canada 199,932 9,106 8,837Manulife Financial Corp. 944,378 13,186 12,730Northern Property Real Estate
Investment Trust-REIT 118,825 3,640 3,666Power Corp. of Canada 1,304,196 31,462 32,983Royal Bank of Canada 2,012,627 106,424 120,375Sun Life Financial, Inc. 39,740 1,065 1,047Toronto-Dominion Bank 1,525,417 103,301 127,601
577,984 649,022
Health Care — 2.6%
Catamaran Corp. 218,651 9,450 10,196Valeant Pharmaceuticals
International, Inc. 748,893 40,738 44,364
50,188 54,560
The accompanying notes are an integral part of the financial statements. 91

BlackRock Active Canadian Equity Fund
Statement of Investment Portfolio — As at December 31, 2012
Security Holdings
Average
cost
Fair
value
(in $000s) (in $000s)
Industrials — 5.0%
Black Diamond Group, Ltd. 236,910 5,122 4,738Canadian National Railway Co. 371,707 29,212 33,562Chorus Aviation, Inc. 870,028 3,541 3,315Finning International, Inc. 177,526 4,273 4,360Progressive Waste Solutions, Ltd. 329,442 6,565 7,063Stantec, Inc. 242,262 8,377 9,589Toromont Industries, Ltd. 101,799 2,061 2,141Transcontinental, Inc.-Class A 94,460 1,250 1,049TransForce, Inc. 527,591 9,132 10,467Vicwest, Inc. 81,644 1,107 1,012Wajax Corp. 99,318 4,409 4,032Westjet Airlines, Ltd. 1,244,764 18,700 24,472Westshore Terminals Investment
Corp. 334 10 9
93,759 105,809
Information Technology — 2.1%
Constellation Software, Inc. 85,510 9,776 10,197MacDonald Dettwiler & Associates,
Ltd. 207,052 10,905 11,585Otsuka Corp. 719,412 6,997 5,719Research In Motion, Ltd. 1,052,050 8,076 12,393Sandvine Corp. 492,913 1,084 646Wi-Lan, Inc. 875,717 4,379 3,958
41,217 44,498
Materials — 17.2%
Aecon Group, Inc. 100,416 1,089 1,064Agnico-Eagle Mines, Ltd. 272,808 12,774 14,192Agrium, Inc. 24,585 2,168 2,437Alacer Gold Corp. 106,323 546 551Alamos Gold, Inc. 185,317 3,165 3,226Allied Nevada Gold Corp. 35,507 1,244 1,062Aurizon Mines, Ltd. 171,097 882 583B2Gold Corp. 3,984,393 14,568 14,065Barrick Gold Corp. 1,379,470 55,685 47,881Canexus Corp. 109,290 906 924Capstone Mining Corp. 378,017 891 907CCL Industries-Class B 102,001 3,532 4,335Centerra Gold, Inc. 709,856 8,843 6,580Dundee Precious Metals, Inc. 502,570 4,416 4,242Endeavour Silver Corp. 477,099 4,066 3,726First Quantum Minerals, Ltd. 583,329 11,863 12,752Fortuna Silver Mines, Inc. 31,474 144 131Goldcorp, Inc. 1,400,071 54,909 50,935Hudbay Minerals, Inc. 41,034 411 410Iamgold Corp. 524,746 8,287 5,961Inmet Mining Corp. 29,126 1,999 2,155International Tower Hill Mines, Ltd. 152,986 1,045 329Kinross Gold Corp. 2,876,992 35,963 27,619
Security Holdings
Average
cost
Fair
value
(in $000s) (in $000s)
Materials (continued)Kirkland Lake Gold, Inc. 62,778 581 365Labrador Iron Ore Royalty Corp. 140,027 4,534 4,806Lundin Mining Corp. 97,970 501 499Major Drilling Group International 888,805 11,146 8,675Methanex Corp. 633,275 18,748 20,012Nevsun Resources, Ltd. 1,866,574 8,702 7,877Pan American Silver Corp. 300,893 6,430 5,594Potash Corp. of Saskatchewan 675,008 29,771 27,257Rio Alto Mining, Ltd. 812,280 4,510 4,126SEMAFO, Inc. 128,353 673 436Sherritt International Corp. 1,603,321 8,535 9,107Silver Wheaton Corp. 10,843 394 388Silvercorp Metals, Inc. 72,869 419 368Sino-Forest Corp.-Class A 282,111 2,105 -Teck Resources, Ltd. 723,889 24,956 26,096Turquoise Hill Resources, Ltd. 48,692 410 365West Fraser Timber Co., Ltd. 276,022 15,603 19,324Yamana Gold, Inc. 1,235,780 19,413 21,058
386,827 362,420
Telecommunication
Services — 5.6%
BCE, Inc. 592,524 22,830 25,241Rogers Communications, Inc.-Class B 936,789 39,796 42,287TELUS Corp. 773,180 40,062 50,288
102,688 117,816
Utilities — 1.5%
Atco, Ltd.-Class I 233,139 15,443 18,716Canadian Utilities, Ltd.-Class A 189,526 11,573 13,582Fortis, Inc. 4,519 153 154
27,169 32,452
Total Canadian Common Stocks
and Income Trusts 1,959,199 2,080,522
Transaction Costs (Note 2) (1,268)
Total Investments 1,957,931 2,080,522
Other Assets and Liabilities — 1.2% 24,279
Net Assets 2,104,801
The accompanying notes are an integral part of the financial statements. 92

BlackRock Active Canadian Equity Fund
Statement of Investment Portfolio — As at December 31, 2012
Portfolio Concentration
(as a percentage of Net Assets)
Portfolio by Category
As at
December 31, 2012
As at
December 31, 2011
(%) (%)
Consumer Discretionary 5.0 3.7Consumer Staples 2.1 2.0Energy 26.9 30.3Financials 30.8 28.0Health Care 2.6 1.2Industrials 5.0 4.5Information Technology 2.1 2.5Materials 17.2 21.1Telecommunication
Services 5.6 4.3Utilities 1.5 1.3Other Assets and Liabilities 1.2 1.1
Open futures contracts held by the Fund as at December 31, 2012 areshown in Note 4.
The accompanying notes are an integral part of the financial statements. 93

BlackRock Active Canadian Equity Ex-Income Trusts Fund
Statement of Net Assets — As at December 31
2012 2011
Assets
Investments - at fair value (Note 2) $ 532,483,504 $ 1,213,361,539Cash 7,400,000 7,076,959Securities lending income receivable 14,892 1,581Dividends and distributions from underlying trust units receivable 1,486,653 3,344,411Accounts receivable from issue of units - 11,200,000Accounts receivable for investment sales 2,736,345 2,000,164
544,121,394 1,236,984,654
Liabilities
Operating expenses payable 33,393 33,943Payables for redemption of units 1,646,380 -Payables for investment purchases 2,501,839 11,255,903
4,181,612 11,289,846
Net Assets $ 539,939,782 $ 1,225,694,808
Number of Units Issued and Outstanding (Note 8) 16,421,299 39,930,659
Net Assets per Unit $ 32.88 $ 30.70
Investments at Cost $ 504,558,370 $ 1,186,958,460
Approved by BlackRock Asset Management Canada Limited,Manager of the Funds
Eric Léveillé, Director Noel Archard, Director
The accompanying notes are an integral part of the financial statements. 94

BlackRock Active Canadian Equity Ex-Income Trusts Fund
Statement of Operations — For the Years Ended December 31
2012 2011
Revenue
Dividend income and distributions from underlying trust units $ 23,399,083 $ 33,200,472Interest income 39,315 60,632Securities lending income 247,194 60,308
23,685,592 33,321,412
Expenses
Custodian fees 143,030 136,118Fund accounting expenses 42,803 64,455Unitholder communication costs - 601Audit fees 14,150 15,476Securities filing fees 12,594 21,245Independent review committee fees 500 1,568Other operating expenses 4,525 6,090
217,602 245,553
Net Investment Income for the Year 23,467,990 33,075,859
Gain (Loss) on Investments
Net realized gain on sale of investments 23,801,648 141,309,134Transaction costs (Note 2,13) (1,465,191) (2,219,072)Net change in unrealized appreciation (depreciation) in value of investments 1,522,055 (265,170,280)
Net Gain (Loss) on Investments 23,858,512 (126,080,218)
Increase (Decrease) in Net Assets from Operations $ 47,326,502 $ (93,004,359)
Increase (Decrease) in Net Assets from Operations per Unit $ 1.74 $ (2.09)
Statement of Changes in Net Assets — For the Years Ended December 31
2012 2011
Net Assets - Beginning of Year $ 1,225,694,808 $ 1,743,144,016
Increase (Decrease) in Net Assets from Operations 47,326,502 (93,004,359)
Capital Transactions
Proceeds from issue of units 9,560,827 242,140,766Reinvestment of distributions 68,159,531 153,375,889Redemption of units (742,642,355) (666,585,615)
Net capital transactions (664,921,997) (271,068,960)
Distributions
From net investment income (25,305,881) (32,811,677)From capital gains - (112,135,576)From capital gains redemption in kind (Note 9) (42,853,650) (8,428,636)
Total distributions (68,159,531) (153,375,889)
Decrease in Net Assets for the Year (685,755,026) (517,449,208)
Net Assets - End of Year $ 539,939,782 $ 1,225,694,808
The accompanying notes are an integral part of the financial statements. 95
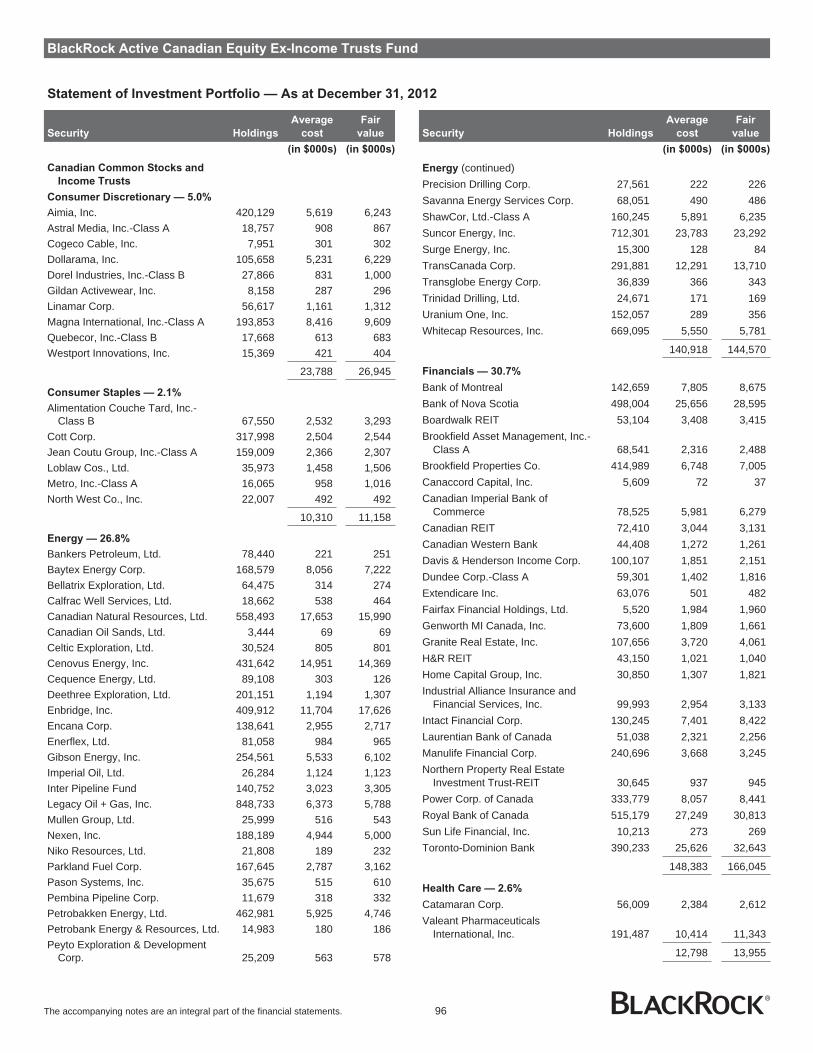
BlackRock Active Canadian Equity Ex-Income Trusts Fund
Statement of Investment Portfolio — As at December 31, 2012
Security Holdings
Average
cost
Fair
value
(in $000s) (in $000s)
Canadian Common Stocks and
Income Trusts
Consumer Discretionary — 5.0%
Aimia, Inc. 420,129 5,619 6,243Astral Media, Inc.-Class A 18,757 908 867Cogeco Cable, Inc. 7,951 301 302Dollarama, Inc. 105,658 5,231 6,229Dorel Industries, Inc.-Class B 27,866 831 1,000Gildan Activewear, Inc. 8,158 287 296Linamar Corp. 56,617 1,161 1,312Magna International, Inc.-Class A 193,853 8,416 9,609Quebecor, Inc.-Class B 17,668 613 683Westport Innovations, Inc. 15,369 421 404
23,788 26,945
Consumer Staples — 2.1%
Alimentation Couche Tard, Inc.-Class B 67,550 2,532 3,293
Cott Corp. 317,998 2,504 2,544Jean Coutu Group, Inc.-Class A 159,009 2,366 2,307Loblaw Cos., Ltd. 35,973 1,458 1,506Metro, Inc.-Class A 16,065 958 1,016North West Co., Inc. 22,007 492 492
10,310 11,158
Energy — 26.8%
Bankers Petroleum, Ltd. 78,440 221 251Baytex Energy Corp. 168,579 8,056 7,222Bellatrix Exploration, Ltd. 64,475 314 274Calfrac Well Services, Ltd. 18,662 538 464Canadian Natural Resources, Ltd. 558,493 17,653 15,990Canadian Oil Sands, Ltd. 3,444 69 69Celtic Exploration, Ltd. 30,524 805 801Cenovus Energy, Inc. 431,642 14,951 14,369Cequence Energy, Ltd. 89,108 303 126Deethree Exploration, Ltd. 201,151 1,194 1,307Enbridge, Inc. 409,912 11,704 17,626Encana Corp. 138,641 2,955 2,717Enerflex, Ltd. 81,058 984 965Gibson Energy, Inc. 254,561 5,533 6,102Imperial Oil, Ltd. 26,284 1,124 1,123Inter Pipeline Fund 140,752 3,023 3,305Legacy Oil + Gas, Inc. 848,733 6,373 5,788Mullen Group, Ltd. 25,999 516 543Nexen, Inc. 188,189 4,944 5,000Niko Resources, Ltd. 21,808 189 232Parkland Fuel Corp. 167,645 2,787 3,162Pason Systems, Inc. 35,675 515 610Pembina Pipeline Corp. 11,679 318 332Petrobakken Energy, Ltd. 462,981 5,925 4,746Petrobank Energy & Resources, Ltd. 14,983 180 186Peyto Exploration & Development
Corp. 25,209 563 578
Security Holdings
Average
cost
Fair
value
(in $000s) (in $000s)
Energy (continued)Precision Drilling Corp. 27,561 222 226Savanna Energy Services Corp. 68,051 490 486ShawCor, Ltd.-Class A 160,245 5,891 6,235Suncor Energy, Inc. 712,301 23,783 23,292Surge Energy, Inc. 15,300 128 84TransCanada Corp. 291,881 12,291 13,710Transglobe Energy Corp. 36,839 366 343Trinidad Drilling, Ltd. 24,671 171 169Uranium One, Inc. 152,057 289 356Whitecap Resources, Inc. 669,095 5,550 5,781
140,918 144,570
Financials — 30.7%
Bank of Montreal 142,659 7,805 8,675Bank of Nova Scotia 498,004 25,656 28,595Boardwalk REIT 53,104 3,408 3,415Brookfield Asset Management, Inc.-
Class A 68,541 2,316 2,488Brookfield Properties Co. 414,989 6,748 7,005Canaccord Capital, Inc. 5,609 72 37Canadian Imperial Bank of
Commerce 78,525 5,981 6,279Canadian REIT 72,410 3,044 3,131Canadian Western Bank 44,408 1,272 1,261Davis & Henderson Income Corp. 100,107 1,851 2,151Dundee Corp.-Class A 59,301 1,402 1,816Extendicare Inc. 63,076 501 482Fairfax Financial Holdings, Ltd. 5,520 1,984 1,960Genworth MI Canada, Inc. 73,600 1,809 1,661Granite Real Estate, Inc. 107,656 3,720 4,061H&R REIT 43,150 1,021 1,040Home Capital Group, Inc. 30,850 1,307 1,821Industrial Alliance Insurance and
Financial Services, Inc. 99,993 2,954 3,133Intact Financial Corp. 130,245 7,401 8,422Laurentian Bank of Canada 51,038 2,321 2,256Manulife Financial Corp. 240,696 3,668 3,245Northern Property Real Estate
Investment Trust-REIT 30,645 937 945Power Corp. of Canada 333,779 8,057 8,441Royal Bank of Canada 515,179 27,249 30,813Sun Life Financial, Inc. 10,213 273 269Toronto-Dominion Bank 390,233 25,626 32,643
148,383 166,045
Health Care — 2.6%
Catamaran Corp. 56,009 2,384 2,612Valeant Pharmaceuticals
International, Inc. 191,487 10,414 11,343
12,798 13,955
The accompanying notes are an integral part of the financial statements. 96
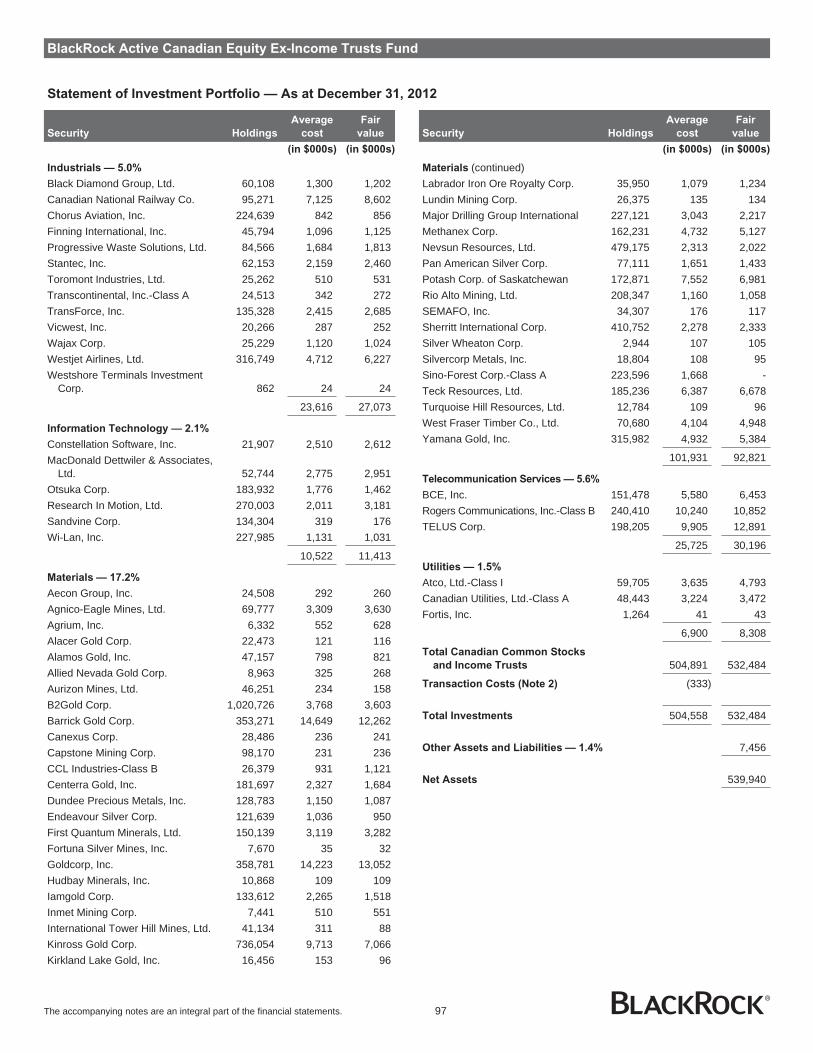
BlackRock Active Canadian Equity Ex-Income Trusts Fund
Statement of Investment Portfolio — As at December 31, 2012
Security Holdings
Average
cost
Fair
value
(in $000s) (in $000s)
Industrials — 5.0%
Black Diamond Group, Ltd. 60,108 1,300 1,202Canadian National Railway Co. 95,271 7,125 8,602Chorus Aviation, Inc. 224,639 842 856Finning International, Inc. 45,794 1,096 1,125Progressive Waste Solutions, Ltd. 84,566 1,684 1,813Stantec, Inc. 62,153 2,159 2,460Toromont Industries, Ltd. 25,262 510 531Transcontinental, Inc.-Class A 24,513 342 272TransForce, Inc. 135,328 2,415 2,685Vicwest, Inc. 20,266 287 252Wajax Corp. 25,229 1,120 1,024Westjet Airlines, Ltd. 316,749 4,712 6,227Westshore Terminals Investment
Corp. 862 24 24
23,616 27,073
Information Technology — 2.1%
Constellation Software, Inc. 21,907 2,510 2,612MacDonald Dettwiler & Associates,
Ltd. 52,744 2,775 2,951Otsuka Corp. 183,932 1,776 1,462Research In Motion, Ltd. 270,003 2,011 3,181Sandvine Corp. 134,304 319 176Wi-Lan, Inc. 227,985 1,131 1,031
10,522 11,413
Materials — 17.2%
Aecon Group, Inc. 24,508 292 260Agnico-Eagle Mines, Ltd. 69,777 3,309 3,630Agrium, Inc. 6,332 552 628Alacer Gold Corp. 22,473 121 116Alamos Gold, Inc. 47,157 798 821Allied Nevada Gold Corp. 8,963 325 268Aurizon Mines, Ltd. 46,251 234 158B2Gold Corp. 1,020,726 3,768 3,603Barrick Gold Corp. 353,271 14,649 12,262Canexus Corp. 28,486 236 241Capstone Mining Corp. 98,170 231 236CCL Industries-Class B 26,379 931 1,121Centerra Gold, Inc. 181,697 2,327 1,684Dundee Precious Metals, Inc. 128,783 1,150 1,087Endeavour Silver Corp. 121,639 1,036 950First Quantum Minerals, Ltd. 150,139 3,119 3,282Fortuna Silver Mines, Inc. 7,670 35 32Goldcorp, Inc. 358,781 14,223 13,052Hudbay Minerals, Inc. 10,868 109 109Iamgold Corp. 133,612 2,265 1,518Inmet Mining Corp. 7,441 510 551International Tower Hill Mines, Ltd. 41,134 311 88Kinross Gold Corp. 736,054 9,713 7,066Kirkland Lake Gold, Inc. 16,456 153 96
Security Holdings
Average
cost
Fair
value
(in $000s) (in $000s)
Materials (continued)Labrador Iron Ore Royalty Corp. 35,950 1,079 1,234Lundin Mining Corp. 26,375 135 134Major Drilling Group International 227,121 3,043 2,217Methanex Corp. 162,231 4,732 5,127Nevsun Resources, Ltd. 479,175 2,313 2,022Pan American Silver Corp. 77,111 1,651 1,433Potash Corp. of Saskatchewan 172,871 7,552 6,981Rio Alto Mining, Ltd. 208,347 1,160 1,058SEMAFO, Inc. 34,307 176 117Sherritt International Corp. 410,752 2,278 2,333Silver Wheaton Corp. 2,944 107 105Silvercorp Metals, Inc. 18,804 108 95Sino-Forest Corp.-Class A 223,596 1,668 -Teck Resources, Ltd. 185,236 6,387 6,678Turquoise Hill Resources, Ltd. 12,784 109 96West Fraser Timber Co., Ltd. 70,680 4,104 4,948Yamana Gold, Inc. 315,982 4,932 5,384
101,931 92,821
Telecommunication Services — 5.6%
BCE, Inc. 151,478 5,580 6,453Rogers Communications, Inc.-Class B 240,410 10,240 10,852TELUS Corp. 198,205 9,905 12,891
25,725 30,196
Utilities — 1.5%
Atco, Ltd.-Class I 59,705 3,635 4,793Canadian Utilities, Ltd.-Class A 48,443 3,224 3,472Fortis, Inc. 1,264 41 43
6,900 8,308
Total Canadian Common Stocks
and Income Trusts 504,891 532,484
Transaction Costs (Note 2) (333)
Total Investments 504,558 532,484
Other Assets and Liabilities — 1.4% 7,456
Net Assets 539,940
The accompanying notes are an integral part of the financial statements. 97
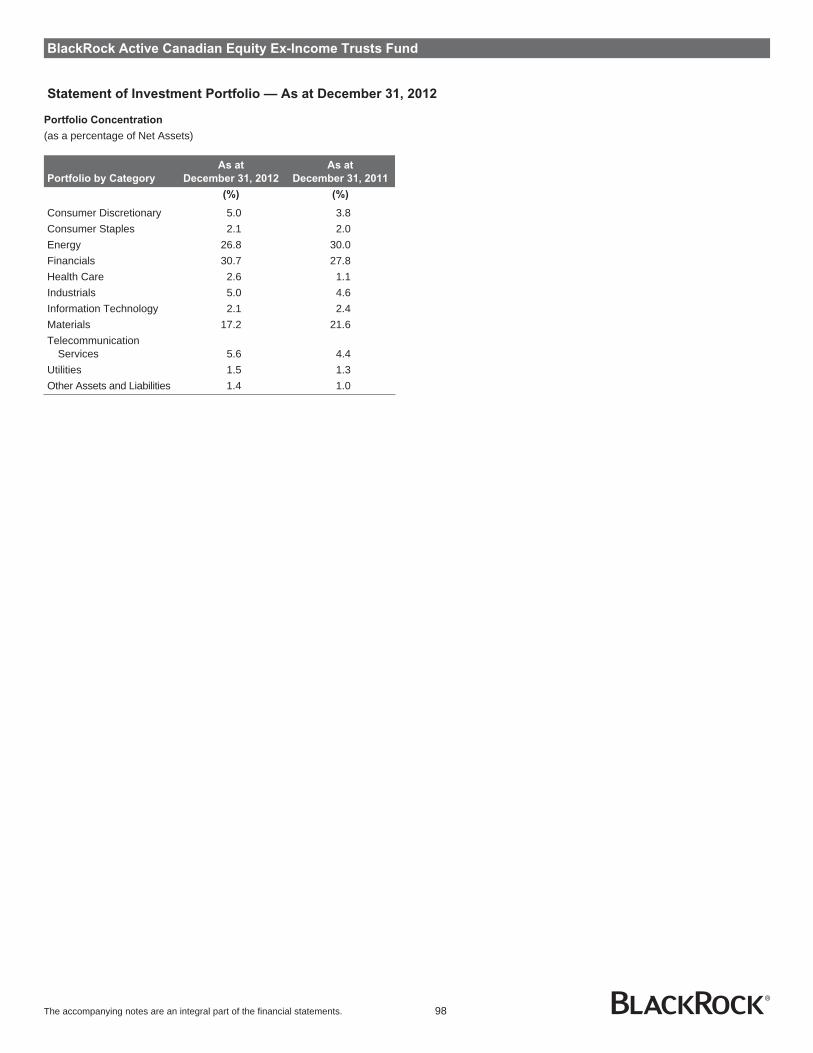
BlackRock Active Canadian Equity Ex-Income Trusts Fund
Statement of Investment Portfolio — As at December 31, 2012
Portfolio Concentration
(as a percentage of Net Assets)
Portfolio by Category
As at
December 31, 2012
As at
December 31, 2011
(%) (%)
Consumer Discretionary 5.0 3.8Consumer Staples 2.1 2.0Energy 26.8 30.0Financials 30.7 27.8Health Care 2.6 1.1Industrials 5.0 4.6Information Technology 2.1 2.4Materials 17.2 21.6Telecommunication
Services 5.6 4.4Utilities 1.5 1.3Other Assets and Liabilities 1.4 1.0
The accompanying notes are an integral part of the financial statements. 98

BlackRock Active Canadian Equity DC Fund
Statement of Net Assets — As at December 31
2012 2011
Assets
Investments - at fair value (Note 2) $ 666,988,761 $ 520,538,281Cash 7,076,514 3,632,398Margin due from brokers 468,436 402,794Securities lending income receivable 14,822 947Dividends and distributions from underlying trust units receivable 1,777,726 1,441,771Accounts receivable from issue of units 397,630 114,247Accounts receivable for investment sales 3,347,290 796,300
680,071,179 526,926,738
Liabilities
Operating expenses payable 33,353 27,760Payables for redemption of units 209,803 148,645Payables for investment purchases 3,070,363 -
3,313,519 176,405
Net Assets $ 676,757,660 $ 526,750,333
Number of Units Issued and Outstanding (Note 8) 28,096,931 23,434,669
Net Assets per Unit $ 24.09 $ 22.48
Investments at Cost $ 634,319,311 $ 509,207,633
Approved by BlackRock Asset Management Canada Limited,Manager of the Funds
Eric Léveillé, Director Noel Archard, Director
The accompanying notes are an integral part of the financial statements. 99
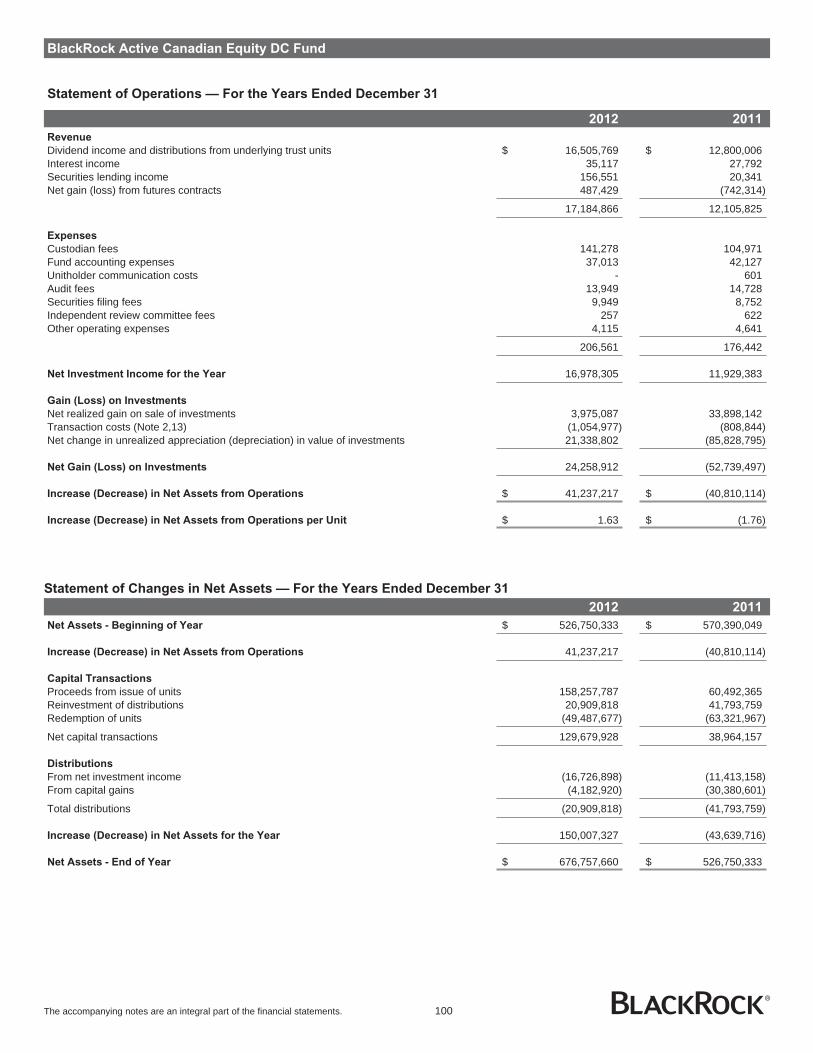
BlackRock Active Canadian Equity DC Fund
Statement of Operations — For the Years Ended December 31
2012 2011
Revenue
Dividend income and distributions from underlying trust units $ 16,505,769 $ 12,800,006Interest income 35,117 27,792Securities lending income 156,551 20,341Net gain (loss) from futures contracts 487,429 (742,314)
17,184,866 12,105,825
Expenses
Custodian fees 141,278 104,971Fund accounting expenses 37,013 42,127Unitholder communication costs - 601Audit fees 13,949 14,728Securities filing fees 9,949 8,752Independent review committee fees 257 622Other operating expenses 4,115 4,641
206,561 176,442
Net Investment Income for the Year 16,978,305 11,929,383
Gain (Loss) on Investments
Net realized gain on sale of investments 3,975,087 33,898,142Transaction costs (Note 2,13) (1,054,977) (808,844)Net change in unrealized appreciation (depreciation) in value of investments 21,338,802 (85,828,795)
Net Gain (Loss) on Investments 24,258,912 (52,739,497)
Increase (Decrease) in Net Assets from Operations $ 41,237,217 $ (40,810,114)
Increase (Decrease) in Net Assets from Operations per Unit $ 1.63 $ (1.76)
Statement of Changes in Net Assets — For the Years Ended December 31
2012 2011
Net Assets - Beginning of Year $ 526,750,333 $ 570,390,049
Increase (Decrease) in Net Assets from Operations 41,237,217 (40,810,114)
Capital Transactions
Proceeds from issue of units 158,257,787 60,492,365Reinvestment of distributions 20,909,818 41,793,759Redemption of units (49,487,677) (63,321,967)
Net capital transactions 129,679,928 38,964,157
Distributions
From net investment income (16,726,898) (11,413,158)From capital gains (4,182,920) (30,380,601)
Total distributions (20,909,818) (41,793,759)
Increase (Decrease) in Net Assets for the Year 150,007,327 (43,639,716)
Net Assets - End of Year $ 676,757,660 $ 526,750,333
The accompanying notes are an integral part of the financial statements. 100

BlackRock Active Canadian Equity DC Fund
Statement of Investment Portfolio — As at December 31, 2012
Security Holdings
Average
cost
Fair
value
(in $000s) (in $000s)
Canadian Common Stocks and
Income Trusts
Consumer Discretionary — 5.0%
Aimia, Inc. 525,347 7,112 7,807Astral Media, Inc.-Class A 23,148 1,115 1,069Cogeco Cable, Inc. 9,860 373 374Dollarama, Inc. 132,315 6,744 7,800Dorel Industries, Inc.-Class B 35,269 1,072 1,266Gildan Activewear, Inc. 10,149 357 368Linamar Corp. 71,269 1,470 1,652Magna International, Inc.-Class A 243,242 10,605 12,058Quebecor, Inc.-Class B 22,228 773 859Westport Innovations, Inc. 19,421 532 511
30,153 33,764
Consumer Staples — 2.1%
Alimentation Couche Tard, Inc.-Class B 84,444 3,219 4,117
Cott Corp. 400,770 3,180 3,206Jean Coutu Group, Inc.-Class A 198,935 2,952 2,887Loblaw Cos., Ltd. 44,577 1,805 1,866Metro, Inc.-Class A 19,995 1,189 1,264North West Co., Inc. 28,535 640 638
12,985 13,978
Energy — 26.8%
Bankers Petroleum, Ltd. 101,385 283 324Baytex Energy Corp. 211,125 10,041 9,045Bellatrix Exploration, Ltd. 79,022 381 336Calfrac Well Services, Ltd. 23,392 666 582Canadian Natural Resources, Ltd. 699,125 21,803 20,016Canadian Oil Sands, Ltd. 5,205 104 105Celtic Exploration, Ltd. 38,050 1,003 998Cenovus Energy, Inc. 541,645 18,697 18,031Cequence Energy, Ltd. 100,821 329 143Deethree Exploration, Ltd. 251,020 1,497 1,632Enbridge, Inc. 513,424 15,605 22,077Encana Corp. 173,403 3,695 3,399Enerflex, Ltd. 101,330 1,218 1,207Gibson Energy, Inc. 318,667 6,941 7,638Imperial Oil, Ltd. 32,843 1,405 1,403Inter Pipeline Fund 176,142 3,800 4,136Legacy Oil + Gas, Inc. 1,063,897 7,933 7,256Mullen Group, Ltd. 33,758 678 705Nexen, Inc. 236,213 6,162 6,276Niko Resources, Ltd. 27,243 239 289Parkland Fuel Corp. 209,886 3,506 3,959Pason Systems, Inc. 45,648 664 780Pembina Pipeline Corp. 14,506 397 412Petrobakken Energy, Ltd. 579,828 7,314 5,943Petrobank Energy & Resources, Ltd. 18,609 223 231Peyto Exploration & Development
Corp. 31,425 702 720
Security Holdings
Average
cost
Fair
value
(in $000s) (in $000s)
Energy (continued)Precision Drilling Corp. 34,402 277 282Savanna Energy Services Corp. 88,253 633 630ShawCor, Ltd.-Class A 200,684 7,522 7,809Suncor Energy, Inc. 891,285 29,541 29,145Surge Energy, Inc. 16,842 141 92TransCanada Corp. 365,536 15,525 17,169Transglobe Energy Corp. 46,797 465 436Trinidad Drilling, Ltd. 30,567 210 209Uranium One, Inc. 192,007 365 449Whitecap Resources, Inc. 837,554 6,966 7,237
176,931 181,101
Financials — 30.7%
Bank of Montreal 178,829 9,928 10,875Bank of Nova Scotia 623,509 32,225 35,802Boardwalk REIT 66,786 4,282 4,295Brookfield Asset Management, Inc.-
Class A 85,476 2,924 3,103Brookfield Properties Co. 516,222 8,385 8,714Canaccord Capital, Inc. 7,522 96 50Canadian Imperial Bank of
Commerce 98,359 7,521 7,865Canadian REIT 90,592 3,803 3,917Canadian Western Bank 55,590 1,594 1,579Davis & Henderson Income Corp. 126,558 2,363 2,720Dundee Corp.-Class A 74,151 1,768 2,270Extendicare Inc. 80,942 640 619Fairfax Financial Holdings, Ltd. 6,897 2,471 2,448Genworth MI Canada, Inc. 92,672 2,245 2,092Granite Real Estate, Inc. 134,796 4,678 5,085H&R REIT 53,782 1,272 1,296Home Capital Group, Inc. 38,346 1,681 2,263Industrial Alliance Insurance and
Financial Services, Inc. 125,686 3,659 3,938Intact Financial Corp. 163,765 9,460 10,589Laurentian Bank of Canada 63,782 2,899 2,819Manulife Financial Corp. 303,154 4,355 4,087Northern Property Real Estate
Investment Trust-REIT 38,295 1,169 1,181Power Corp. of Canada 418,114 10,112 10,574Royal Bank of Canada 645,233 34,532 38,591Sun Life Financial, Inc. 13,035 350 343Toronto-Dominion Bank 488,970 33,133 40,902
187,545 208,017
Health Care — 2.6%
Catamaran Corp. 70,134 3,037 3,271Valeant Pharmaceuticals
International, Inc. 240,464 13,103 14,245
16,140 17,516
The accompanying notes are an integral part of the financial statements. 101
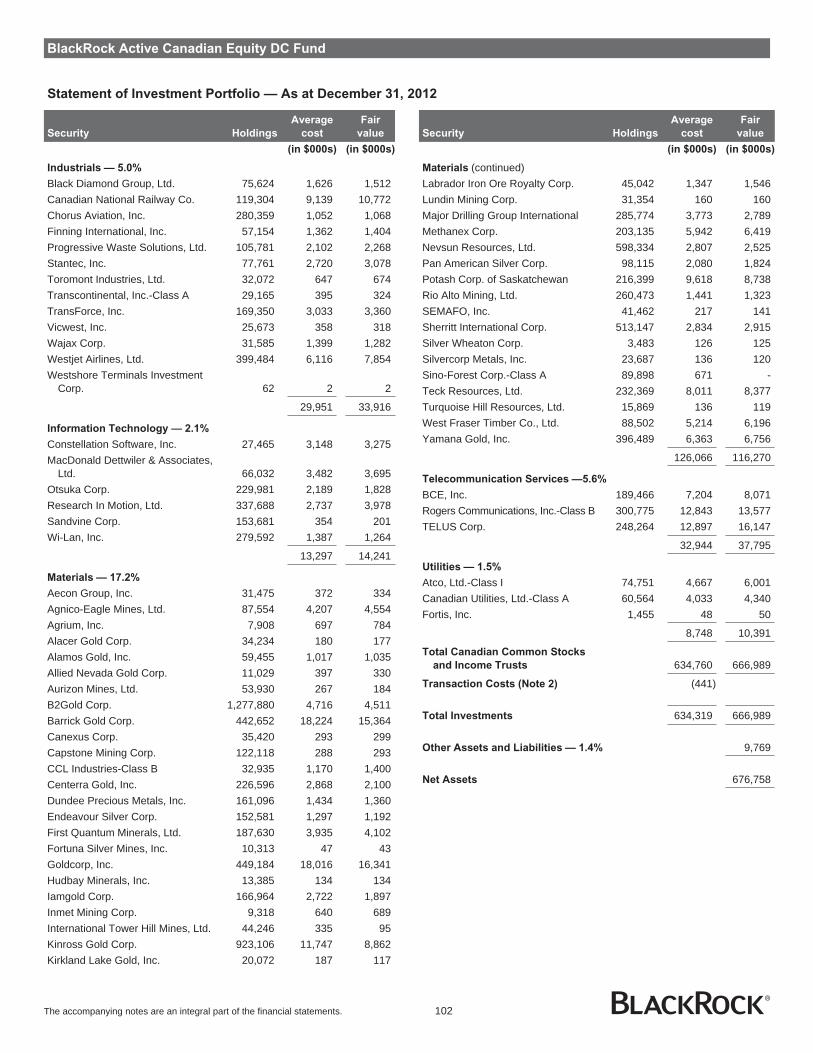
BlackRock Active Canadian Equity DC Fund
Statement of Investment Portfolio — As at December 31, 2012
Security Holdings
Average
cost
Fair
value
(in $000s) (in $000s)
Industrials — 5.0%
Black Diamond Group, Ltd. 75,624 1,626 1,512Canadian National Railway Co. 119,304 9,139 10,772Chorus Aviation, Inc. 280,359 1,052 1,068Finning International, Inc. 57,154 1,362 1,404Progressive Waste Solutions, Ltd. 105,781 2,102 2,268Stantec, Inc. 77,761 2,720 3,078Toromont Industries, Ltd. 32,072 647 674Transcontinental, Inc.-Class A 29,165 395 324TransForce, Inc. 169,350 3,033 3,360Vicwest, Inc. 25,673 358 318Wajax Corp. 31,585 1,399 1,282Westjet Airlines, Ltd. 399,484 6,116 7,854Westshore Terminals Investment
Corp. 62 2 2
29,951 33,916
Information Technology — 2.1%
Constellation Software, Inc. 27,465 3,148 3,275MacDonald Dettwiler & Associates,
Ltd. 66,032 3,482 3,695Otsuka Corp. 229,981 2,189 1,828Research In Motion, Ltd. 337,688 2,737 3,978Sandvine Corp. 153,681 354 201Wi-Lan, Inc. 279,592 1,387 1,264
13,297 14,241
Materials — 17.2%
Aecon Group, Inc. 31,475 372 334Agnico-Eagle Mines, Ltd. 87,554 4,207 4,554Agrium, Inc. 7,908 697 784Alacer Gold Corp. 34,234 180 177Alamos Gold, Inc. 59,455 1,017 1,035Allied Nevada Gold Corp. 11,029 397 330Aurizon Mines, Ltd. 53,930 267 184B2Gold Corp. 1,277,880 4,716 4,511Barrick Gold Corp. 442,652 18,224 15,364Canexus Corp. 35,420 293 299Capstone Mining Corp. 122,118 288 293CCL Industries-Class B 32,935 1,170 1,400Centerra Gold, Inc. 226,596 2,868 2,100Dundee Precious Metals, Inc. 161,096 1,434 1,360Endeavour Silver Corp. 152,581 1,297 1,192First Quantum Minerals, Ltd. 187,630 3,935 4,102Fortuna Silver Mines, Inc. 10,313 47 43Goldcorp, Inc. 449,184 18,016 16,341Hudbay Minerals, Inc. 13,385 134 134Iamgold Corp. 166,964 2,722 1,897Inmet Mining Corp. 9,318 640 689International Tower Hill Mines, Ltd. 44,246 335 95Kinross Gold Corp. 923,106 11,747 8,862Kirkland Lake Gold, Inc. 20,072 187 117
Security Holdings
Average
cost
Fair
value
(in $000s) (in $000s)
Materials (continued)Labrador Iron Ore Royalty Corp. 45,042 1,347 1,546Lundin Mining Corp. 31,354 160 160Major Drilling Group International 285,774 3,773 2,789Methanex Corp. 203,135 5,942 6,419Nevsun Resources, Ltd. 598,334 2,807 2,525Pan American Silver Corp. 98,115 2,080 1,824Potash Corp. of Saskatchewan 216,399 9,618 8,738Rio Alto Mining, Ltd. 260,473 1,441 1,323SEMAFO, Inc. 41,462 217 141Sherritt International Corp. 513,147 2,834 2,915Silver Wheaton Corp. 3,483 126 125Silvercorp Metals, Inc. 23,687 136 120Sino-Forest Corp.-Class A 89,898 671 -Teck Resources, Ltd. 232,369 8,011 8,377Turquoise Hill Resources, Ltd. 15,869 136 119West Fraser Timber Co., Ltd. 88,502 5,214 6,196Yamana Gold, Inc. 396,489 6,363 6,756
126,066 116,270
Telecommunication Services —5.6%
BCE, Inc. 189,466 7,204 8,071Rogers Communications, Inc.-Class B 300,775 12,843 13,577TELUS Corp. 248,264 12,897 16,147
32,944 37,795
Utilities — 1.5%
Atco, Ltd.-Class I 74,751 4,667 6,001Canadian Utilities, Ltd.-Class A 60,564 4,033 4,340Fortis, Inc. 1,455 48 50
8,748 10,391
Total Canadian Common Stocks
and Income Trusts 634,760 666,989
Transaction Costs (Note 2) (441)
Total Investments 634,319 666,989
Other Assets and Liabilities — 1.4% 9,769
Net Assets 676,758
The accompanying notes are an integral part of the financial statements. 102

BlackRock Active Canadian Equity DC Fund
Statement of Investment Portfolio — As at December 31, 2012
Portfolio Concentration
(as a percentage of Net Assets)
Portfolio by Category
As at
December 31, 2012
As at
December 31, 2011
(%) (%)
Consumer Discretionary 5.0 3.8Consumer Staples 2.1 2.0Energy 26.8 29.9Financials 30.7 27.7Health Care 2.6 1.1Industrials 5.0 4.6Information Technology 2.1 2.4Materials 17.2 21.6Telecommunication
Services 5.6 4.4Utilities 1.5 1.3Other Assets and Liabilities 1.4 1.2
Open futures contracts held by the Fund as at December 31, 2012 areshown in Note 4.
The accompanying notes are an integral part of the financial statements. 103

BlackRock Active Canadian Equity Small Cap Fund
Statement of Net Assets — As at December 31
2012 2011
Assets
Investments - at fair value (Note 2) $ 78,786,844 $ 132,593,968Cash 2,393,772 878,881Margin due from brokers 218,340 94,425Securities lending income receivable 995 1,312Dividends and distributions from underlying trust units receivable 200,321 254,926Accounts receivable for investment sales 771,102 933,710
82,371,374 134,757,222
Liabilities
Operating expenses payable 19,945 21,001Payables for investment purchases 651,188 -
671,133 21,001
Net Assets $ 81,700,241 $ 134,736,221
Number of Units Issued and Outstanding (Note 8) 1,679,054 3,030,381
Net Assets per Unit $ 48.66 $ 44.46
Investments at Cost $ 76,945,947 $ 132,422,594
Approved by BlackRock Asset Management Canada Limited,Manager of the Funds
Eric Léveillé, Director Noel Archard, Director
The accompanying notes are an integral part of the financial statements. 104

BlackRock Active Canadian Equity Small Cap Fund
Statement of Operations — For the Years Ended December 31
2012 2011
Revenue
Dividend income and distributions from underlying trust units $ 2,639,164 $ 3,387,876Interest income 6,481 8,737Securities lending income 40,041 26,155Net gain (loss) from futures contracts 98,876 (226,633)
2,784,562 3,196,135
Expenses
Custodian fees 61,479 56,246Fund accounting expenses 33,575 32,556Unitholder communication costs - 601Audit fees 12,630 13,224Securities filing fees 1,798 2,477Independent review committee fees 63 177Other operating expenses 2,606 3,848
112,151 109,129
Net Investment Income for the Year 2,672,411 3,087,006
Gain (Loss) on Investments
Net realized gain on sale of investments 7,419,807 15,224,861Transaction costs (Note 2,13) (404,839) (504,690)Net change in unrealized appreciation (depreciation) in value of investments 1,669,523 (29,462,203)
Net Gain (Loss) on Investments 8,684,491 (14,742,032)
Increase (Decrease) in Net Assets from Operations $ 11,356,902 $ (11,655,026)
Increase (Decrease) in Net Assets from Operations per Unit $ 4.63 $ (3.22)
Statement of Changes in Net Assets — For the Years Ended December 31
2012 2011
Net Assets - Beginning of Year $ 134,736,221 $ 177,102,860
Increase (Decrease) in Net Assets from Operations 11,356,902 (11,655,026)
Capital Transactions
Reinvestment of distributions 9,264,426 17,648,856Redemption of units (64,392,882) (30,711,613)
Net capital transactions (55,128,456) (13,062,757)
Distributions
From net investment income (2,762,933) (3,048,545)From capital gains (6,501,493) (14,600,311)
Total distributions (9,264,426) (17,648,856)
Decrease in Net Assets for the Year (53,035,980) (42,366,639)
Net Assets - End of Year $ 81,700,241 $ 134,736,221
The accompanying notes are an integral part of the financial statements. 105
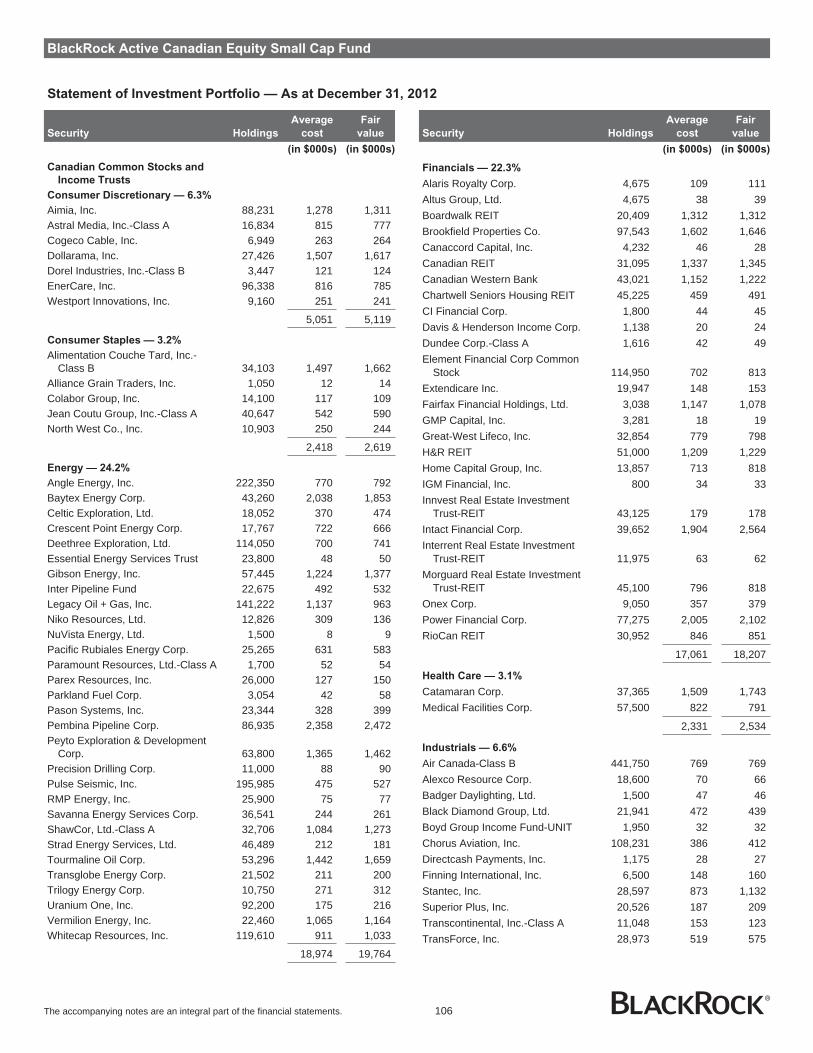
BlackRock Active Canadian Equity Small Cap Fund
Statement of Investment Portfolio — As at December 31, 2012
Security Holdings
Average
cost
Fair
value
(in $000s) (in $000s)
Canadian Common Stocks and
Income Trusts
Consumer Discretionary — 6.3%
Aimia, Inc. 88,231 1,278 1,311Astral Media, Inc.-Class A 16,834 815 777Cogeco Cable, Inc. 6,949 263 264Dollarama, Inc. 27,426 1,507 1,617Dorel Industries, Inc.-Class B 3,447 121 124EnerCare, Inc. 96,338 816 785Westport Innovations, Inc. 9,160 251 241
5,051 5,119
Consumer Staples — 3.2%
Alimentation Couche Tard, Inc.-Class B 34,103 1,497 1,662
Alliance Grain Traders, Inc. 1,050 12 14Colabor Group, Inc. 14,100 117 109Jean Coutu Group, Inc.-Class A 40,647 542 590North West Co., Inc. 10,903 250 244
2,418 2,619
Energy — 24.2%
Angle Energy, Inc. 222,350 770 792Baytex Energy Corp. 43,260 2,038 1,853Celtic Exploration, Ltd. 18,052 370 474Crescent Point Energy Corp. 17,767 722 666Deethree Exploration, Ltd. 114,050 700 741Essential Energy Services Trust 23,800 48 50Gibson Energy, Inc. 57,445 1,224 1,377Inter Pipeline Fund 22,675 492 532Legacy Oil + Gas, Inc. 141,222 1,137 963Niko Resources, Ltd. 12,826 309 136NuVista Energy, Ltd. 1,500 8 9Pacific Rubiales Energy Corp. 25,265 631 583Paramount Resources, Ltd.-Class A 1,700 52 54Parex Resources, Inc. 26,000 127 150Parkland Fuel Corp. 3,054 42 58Pason Systems, Inc. 23,344 328 399Pembina Pipeline Corp. 86,935 2,358 2,472Peyto Exploration & Development
Corp. 63,800 1,365 1,462Precision Drilling Corp. 11,000 88 90Pulse Seismic, Inc. 195,985 475 527RMP Energy, Inc. 25,900 75 77Savanna Energy Services Corp. 36,541 244 261ShawCor, Ltd.-Class A 32,706 1,084 1,273Strad Energy Services, Ltd. 46,489 212 181Tourmaline Oil Corp. 53,296 1,442 1,659Transglobe Energy Corp. 21,502 211 200Trilogy Energy Corp. 10,750 271 312Uranium One, Inc. 92,200 175 216Vermilion Energy, Inc. 22,460 1,065 1,164Whitecap Resources, Inc. 119,610 911 1,033
18,974 19,764
Security Holdings
Average
cost
Fair
value
(in $000s) (in $000s)
Financials — 22.3%
Alaris Royalty Corp. 4,675 109 111Altus Group, Ltd. 4,675 38 39Boardwalk REIT 20,409 1,312 1,312Brookfield Properties Co. 97,543 1,602 1,646Canaccord Capital, Inc. 4,232 46 28Canadian REIT 31,095 1,337 1,345Canadian Western Bank 43,021 1,152 1,222Chartwell Seniors Housing REIT 45,225 459 491CI Financial Corp. 1,800 44 45Davis & Henderson Income Corp. 1,138 20 24Dundee Corp.-Class A 1,616 42 49Element Financial Corp Common
Stock 114,950 702 813Extendicare Inc. 19,947 148 153Fairfax Financial Holdings, Ltd. 3,038 1,147 1,078GMP Capital, Inc. 3,281 18 19Great-West Lifeco, Inc. 32,854 779 798H&R REIT 51,000 1,209 1,229Home Capital Group, Inc. 13,857 713 818IGM Financial, Inc. 800 34 33Innvest Real Estate Investment
Trust-REIT 43,125 179 178Intact Financial Corp. 39,652 1,904 2,564Interrent Real Estate Investment
Trust-REIT 11,975 63 62Morguard Real Estate Investment
Trust-REIT 45,100 796 818Onex Corp. 9,050 357 379Power Financial Corp. 77,275 2,005 2,102RioCan REIT 30,952 846 851
17,061 18,207
Health Care — 3.1%
Catamaran Corp. 37,365 1,509 1,743Medical Facilities Corp. 57,500 822 791
2,331 2,534
Industrials — 6.6%
Air Canada-Class B 441,750 769 769Alexco Resource Corp. 18,600 70 66Badger Daylighting, Ltd. 1,500 47 46Black Diamond Group, Ltd. 21,941 472 439Boyd Group Income Fund-UNIT 1,950 32 32Chorus Aviation, Inc. 108,231 386 412Directcash Payments, Inc. 1,175 28 27Finning International, Inc. 6,500 148 160Stantec, Inc. 28,597 873 1,132Superior Plus, Inc. 20,526 187 209Transcontinental, Inc.-Class A 11,048 153 123TransForce, Inc. 28,973 519 575
The accompanying notes are an integral part of the financial statements. 106

BlackRock Active Canadian Equity Small Cap Fund
Statement of Investment Portfolio — As at December 31, 2012
Security Holdings
Average
cost
Fair
value
(in $000s) (in $000s)
Industrials (continued)Westernone Equity Income Fund-
UNIT 11,100 91 92Westjet Airlines, Ltd. 65,442 879 1,286
4,654 5,368
Information Technology — 6.4%
5N Plus, Inc. 61,350 169 161Aastra Technologies, Ltd. 11,150 187 183CGI Group, Inc.-Class A 22,241 557 510Constellation Software, Inc. 8,690 977 1,036MacDonald Dettwiler & Associates, Ltd. 13,838 750 774Otsuka Corp. 181,291 1,907 1,441Sierra Wireless, Inc. 27,525 216 216Wi-Lan, Inc. 195,648 955 884
5,718 5,205
Materials — 19.3%
Alamos Gold, Inc. 28,932 497 504Altius Minerals Corp. 2,150 21 21Aurizon Mines, Ltd. 9,600 33 33B2Gold Corp. 286,496 977 1,011Capstone Mining Corp. 93,579 227 225Cascades, Inc. 33,000 155 135CCL Industries-Class B 23,827 777 1,013Centerra Gold, Inc. 35,537 486 329Detour Gold Corp. 19,100 476 475Dundee Precious Metals, Inc. 114,600 999 967Eldorado Gold Corp. 7,095 102 91Endeavour Silver Corp. 77,295 664 604Fortuna Silver Mines, Inc. 36,550 170 152Franco-Nevada Corp. 15,865 699 900Hudbay Minerals, Inc. 48,806 475 488Inmet Mining Corp. 7,344 498 543International Forest Products, Ltd.-
Class A 33,197 185 264Intertape Polymer Group, Inc. 82,500 646 657Kirkland Lake Gold, Inc. 24,387 210 142Lundin Mining Corp. 58,083 285 296MAG Silver Corp. 15,000 146 152Major Drilling Group International 66,016 793 644Nevsun Resources, Ltd. 16,900 67 71New Gold, Inc. 167,131 1,827 1,832Noranda Income Fund-UNIT 16,550 80 78OceanaGold Corp. 12,750 36 36Pan American Silver Corp. 48,983 1,088 911Premier Gold Mines, Ltd. 2,850 12 12Primero Mining Corp. 36,021 111 229Revett Minerals, Inc. 9,400 32 26Rubicon Minerals Corp. 16,200 49 41SEMAFO, Inc. 150,855 737 513
Security Holdings
Average
cost
Fair
value
(in $000s) (in $000s)
Materials (continued)Sherritt International Corp. 147,348 901 837Sino-Forest Corp.-Class A 113,922 1,420 -Torex Gold Resources, Inc. 29,136 55 63Turquoise Hill Resources, Ltd. 40,003 543 300West Fraser Timber Co., Ltd. 17,378 852 1,217
17,331 15,812
Telecommunication Services — 0.5%
Bell Aliant, Inc. 9,027 244 238Manitoba Telecom Services, Inc. 5,975 199 194
443 432
Utilities — 4.5%
Atco, Ltd.-Class I 17,888 988 1,436Canadian Utilities, Ltd.-Class A 23,524 1,435 1,686Capital Power Corp. 5,750 125 130Emera, Inc. 2,828 97 98Innergex Renewable Energy, Inc. 36,550 393 377
3,038 3,727
Total Canadian Common Stocks
and Income Trusts 77,019 78,787
Transaction Costs (Note 2) (73)
Total Investments 76,946 78,787
Other Assets and Liabilities — 3.6% 2,913
Net Assets 81,700
Portfolio Concentration
(as a percentage of Net Assets)
Portfolio by Category
As at
December 31, 2012
As at
December 31, 2011
(%) (%)
Consumer Discretionary 6.3 5.0Consumer Staples 3.2 4.2Energy 24.2 32.7Financials 22.3 15.1Health Care 3.1 0.5Industrials 6.6 3.9Information Technology 6.4 6.9Materials 19.3 25.5Telecommunication
Services 0.5 0.6Utilities 4.5 4.0Other Assets and
Liabilities 3.6 1.6
Open futures contracts held by the Fund as at December 31, 2012 areshown in Note 4.
The accompanying notes are an integral part of the financial statements. 107

BlackRock Canada Alpha Advantage Fund (Note 1)
Statement of Net Assets — As at December 31
2012 2011
Assets
Investments - at fair value (Note 2) $ 458,253,367 $ 126,698,419Cash 5,466,635 980,140Margin due from brokers 342,600 224,061Dividends and distributions from underlying trust units receivable 1,292,113 338,206Accounts receivable for investment sales 6,622,061 -
471,976,776 128,240,826
Liabilities
Investments sold short (2012 proceeds - $109,071,485, 2011 proceeds - $28,951,476)(Note 2) 106,685,739 28,469,031
Dividends payable on securities sold short 468,595 83,216Operating expenses payable 18,016 12,323Payables for investment purchases 6,604,822 -
113,777,172 28,564,570
Net Assets $ 358,199,604 $ 99,676,256
Number of Units Issued and Outstanding (Note 8) 32,199,160 9,999,962
Net Assets per Unit $ 11.12 $ 9.97
Investments at Cost $ 333,566,220 $ 98,822,572
Approved by BlackRock Asset Management Canada Limited,Manager of the Funds
Eric Léveillé, Director Noel Archard, Director
The accompanying notes are an integral part of the financial statements. 108

BlackRock Canada Alpha Advantage Fund (Note 1)
Statement of Operations — For the Periods Ended December 31
2012 2011
Revenue
Dividend income and distributions from underlying trust units $ 8,459,014 $ 634,568Interest income 16,118 (13,376)Net gain from futures contracts 97,325 15,019Foreign exchange loss (3,068) (159)
8,569,389 636,052
Expenses
Fund accounting expenses 41,348 4,816Unitholder communication costs 259 -Audit fees 13,419 9,040Securities filing fees 4,589 431Financing charges 394,972 -Independent review committee fees 72 65Other operating expenses 1,970 12Dividends from short sales 2,335,181 145,517
2,791,810 159,881
Net Investment Income for the Period 5,777,579 476,171
Gain (Loss) on Investments
Net realized gain (loss) on sale of investments 1,973,330 (131,139)Transaction costs (Note 2,13) (819,734) (75,214)Net change in unrealized appreciation (depreciation) in value of investments 18,594,592 (593,184)
Net Gain (Loss) on Investments 19,748,188 (799,537)
Increase (Decrease) in Net Assets from Operations $ 25,525,767 $ (323,366)
Increase (Decrease) in Net Assets from Operations per Unit $ 1.20 $ (0.03)
Statement of Changes in Net Assets — For the Periods Ended December 31
2012 2011
Net Assets - Beginning of Period $ 99,676,256 $ -
Increase (Decrease) in Net Assets from Operations 25,525,767 (323,366)
Capital Transactions
Proceeds from issue of units 232,997,581 99,999,622Reinvestment of distributions 11,366,552 179,266
Net capital transactions 244,364,133 100,178,888
Distributions
From net investment income (5,593,814) (179,266)From capital gains (5,772,738) -
Total distributions (11,366,552) (179,266)
Increase in Net Assets for the Period 258,523,348 99,676,256
Net Assets - End of Period $ 358,199,604 $ 99,676,256
The accompanying notes are an integral part of the financial statements. 109

BlackRock Canada Alpha Advantage Fund (Note 1)
Statement of Cash Flow — For the Periods Ended December 31
2012 2011
Cash Used in Operating Activities
Net investment income for the years $ 5,777,579 $ 476,171
Changes in Working Capital Balances Relating to Operations
Purchase of investment securities* (512,629,140) (54,526,092)Proceeds from disposition of investment securities 303,122,252 25,783,337Proceeds of investment sold short 224,175,655 34,038,386Purchase from investment sold short (141,822,486) (5,324,315)Increase in margin due from brokers (118,539) (224,061)Increase in dividends receivable (953,907) (338,206)Increase in dividends payable on securities sold short 385,379 83,216Increase in accounts receivable for investment sales (6,622,061) -Increase in operating expenses payable 5,693 12,323Increase in payable for investment purchases 6,604,822 -
(127,852,332) (495,412)
Net Cash Used in Operating Activities (122,074,753) (19,241)
Financing Activities
Proceeds from issuance of units* 126,561,248 999,381
Net Cash Provided by Financing Activities 126,561,248 999,381
Net Increase in Cash and Cash Equivalent $ 4,486,495 $ 980,140
Cash - Beginning of Period $ 980,140 $ -
Cash - End of Period $ 5,466,635 $ 980,140
* Excluding in-kind activity as follows:- Purchase of investment securities (2012, $106,436,333) (2011, $99,000,241)- Proceeds from issuance of units (2012, $106,436,333) (2011, $99,000,241)
The accompanying notes are an integral part of the financial statements. 110

BlackRock Canada Alpha Advantage Fund
Statement of Investment Portfolio — As at December 31, 2012
Security Holdings
Average
cost/
Proceeds
received
Fair
value
(in $000s) (in $000s)
Canadian Common Stocks and
Income Trusts-Long
Consumer Discretionary — 6.4%
Aimia, Inc. 311,659 4,170 4,631Canadian Tire Corp.-Class A 9,604 673 665Cogeco Cable, Inc. 5,150 193 196Dollarama, Inc. 47,682 2,725 2,811Dorel Industries, Inc.-Class B 82,836 2,462 2,974Linamar Corp. 185,757 3,862 4,306Magna International, Inc.-Class A 139,042 6,009 6,892Westport Innovations, Inc. 12,534 345 330
20,439 22,805
Consumer Staples — 3.7%
Alimentation Couche Tard, Inc.-Class B 112,976 5,078 5,507
Cott Corp. 439,116 3,381 3,513Jean Coutu Group, Inc.-Class A 223,427 3,247 3,242Loblaw Cos., Ltd. 23,627 957 989Metro, Inc.-Class A 1,312 82 83
12,745 13,334
Energy — 37.9%
Bankers Petroleum, Ltd. 213,584 651 683Baytex Energy Corp. 123,250 5,976 5,280Bellatrix Exploration, Ltd. 47,812 196 203Bonterra Energy Corp. 900 40 41Calfrac Well Services, Ltd. 134,785 3,394 3,352Canadian Natural Resources, Ltd. 401,500 12,999 11,495Canadian Oil Sands, Ltd. 1,400 28 28Celtic Exploration, Ltd. 20,340 537 534Cenovus Energy, Inc. 301,176 10,317 10,026Cequence Energy, Ltd. 60,694 158 86Crescent Point Energy Corp. 66,950 2,650 2,511Deethree Exploration, Ltd. 299,349 1,795 1,946Enbridge, Inc. 282,784 10,758 12,160Encana Corp. 68,541 1,501 1,343Enerflex, Ltd. 152,548 1,897 1,817Enerplus Corp. 86,936 1,129 1,113Gibson Energy, Inc. 196,728 4,314 4,716Imperial Oil, Ltd. 88,844 3,780 3,796Keyera Corp. 29,817 1,359 1,463Legacy Oil + Gas, Inc. 639,716 4,923 4,363Mullen Group, Ltd. 194,108 4,167 4,055Nexen, Inc. 124,337 2,567 3,304Niko Resources, Ltd. 14,252 134 151Parkland Fuel Corp. 182,257 2,853 3,437Pason Systems, Inc. 99,139 1,400 1,694Pembina Pipeline Corp. 125,762 3,540 3,575Petrobakken Energy, Ltd. 353,029 4,621 3,619
Security Holdings
Average
cost/
Proceeds
received
Fair
value
(in $000s) (in $000s)
Energy (continued)Petrominerales, Ltd. 141,691 1,357 1,210Peyto Exploration & Development
Corp. 83,715 1,875 1,918Precision Drilling Corp. 516,890 4,137 4,233Savanna Energy Services Corp. 198,501 1,342 1,417ShawCor, Ltd.-Class A 119,483 4,462 4,649Suncor Energy, Inc. 486,131 15,463 15,897Surge Energy, Inc. 11,478 98 63Tourmaline Oil Corp. 2,994 93 93TransCanada Corp. 244,912 10,795 11,504Transglobe Energy Corp. 80,008 766 745Trinidad Drilling, Ltd. 374,631 2,397 2,562Uranium One, Inc. 107,526 298 252Whitecap Resources, Inc. 505,018 3,985 4,363
134,752 135,697
Financials — 35.9%
Bank of Montreal 85,413 4,949 5,194Bank of Nova Scotia 334,261 17,755 19,193Boardwalk REIT 72,466 4,351 4,660Brookfield Asset Management, Inc.-
Class A 48,266 1,696 1,752Brookfield Properties Co. 300,413 5,036 5,071Calloway REIT 15,832 462 458Canadian Imperial Bank of
Commerce 45,341 3,450 3,625Canadian REIT 108,343 4,602 4,685Canadian Western Bank 16,112 461 458Davis & Henderson Income Corp. 184,343 3,540 3,961Dundee Corp.-Class A 133,554 3,172 4,089Extendicare Inc. 73,583 582 563Fairfax Financial Holdings, Ltd. 5,260 1,902 1,867Genworth MI Canada, Inc. 192,326 3,903 4,341Granite Real Estate, Inc. 34,825 1,222 1,314H&R REIT 64,134 1,532 1,546Home Capital Group, Inc. 72,059 3,489 4,253Industrial Alliance Insurance and
Financial Services, Inc. 120,338 3,475 3,770Intact Financial Corp. 94,774 5,678 6,128Laurentian Bank of Canada 98,023 4,437 4,333Manulife Financial Corp. 119,503 1,492 1,611Northern Property Real Estate
Investment Trust-REIT 13,599 421 419Power Corp. of Canada 136,465 3,358 3,451Royal Bank of Canada 339,523 18,888 20,307Toronto-Dominion Bank 257,383 20,413 21,530
120,266 128,579
The accompanying notes are an integral part of the financial statements. 111

BlackRock Canada Alpha Advantage Fund
Statement of Investment Portfolio — As at December 31, 2012
Security Holdings
Average
cost/
Proceeds
received
Fair
value
(in $000s) (in $000s)
Health Care — 2.7%
Catamaran Corp. 25,673 1,185 1,197Valeant Pharmaceuticals
International, Inc. 141,290 7,190 8,370
8,375 9,567
Industrials — 6.7%
Black Diamond Group, Ltd. 195,173 4,207 3,904Canadian National Railway Co. 56,902 4,857 5,138Chorus Aviation, Inc. 170,403 608 649Finning International, Inc. 139,269 3,355 3,420Progressive Waste Solutions, Ltd. 77,692 1,548 1,666Stantec, Inc. 36,684 1,293 1,452Toromont Industries, Ltd. 9,608 193 202Transcontinental, Inc.-Class A 9,781 104 109TransForce, Inc. 139,116 2,481 2,760Vicwest, Inc. 16,783 170 208Westjet Airlines, Ltd. 231,961 3,608 4,560
22,424 24,068
Information Technology — 2.4%
Constellation Software, Inc. 27,711 3,225 3,304MacDonald Dettwiler & Associates,
Ltd. 17,759 961 994Otsuka Corp. 172,078 1,550 1,368Research In Motion, Ltd. 97,276 748 1,146Sandvine Corp. 94,437 145 124Wi-Lan, Inc. 389,990 1,941 1,763
8,570 8,699
Materials — 23.3%
Aecon Group, Inc. 32,178 375 341Agnico-Eagle Mines, Ltd. 58,756 2,825 3,057Alacer Gold Corp. 41,101 203 213Alamos Gold, Inc. 29,106 504 507Allied Nevada Gold Corp. 6,753 226 202Aurizon Mines, Ltd. 34,354 126 117B2Gold Corp. 1,174,077 4,303 4,145Barrick Gold Corp. 232,908 9,285 8,084Capstone Mining Corp. 69,081 192 166CCL Industries-Class B 101,694 3,666 4,322Centerra Gold, Inc. 228,289 2,672 2,116Dundee Precious Metals, Inc. 520,772 4,331 4,395Endeavour Silver Corp. 183,738 1,550 1,435First Quantum Minerals, Ltd. 112,729 2,291 2,464Fortuna Silver Mines, Inc. 18,186 78 75Goldcorp, Inc. 302,564 12,429 11,007Hudbay Minerals, Inc. 14,888 150 149Iamgold Corp. 167,978 2,483 1,908Inmet Mining Corp. 12,013 817 889
Security Holdings
Average
cost/
Proceeds
received
Fair
value
(in $000s) (in $000s)
Materials (continued)International Tower Hill Mines, Ltd. 28,369 112 61Kinross Gold Corp. 583,106 5,429 5,598Kirkland Lake Gold, Inc. 44,715 405 260Labrador Iron Ore Royalty Corp. 11,201 363 384Major Drilling Group International 302,355 3,815 2,951Methanex Corp. 11,110 324 351Nevsun Resources, Ltd. 467,683 2,090 1,974Pan American Silver Corp. 163,985 3,265 3,048Potash Corp. of Saskatchewan 100,828 4,318 4,071San Gold Corp. 8,559 11 7SEMAFO, Inc. 6,411 23 22Sherritt International Corp. 772,590 3,857 4,388Silvercorp Metals, Inc. 14,859 79 75Teck Resources, Ltd. 122,238 4,273 4,407West Fraser Timber Co., Ltd. 48,576 3,020 3,401Yamana Gold, Inc. 408,023 6,500 6,953
86,390 83,543
Telecommunication Services — 5.8%
BCE, Inc. 87,519 3,672 3,728Rogers Communications, Inc.-
Class B 176,680 6,827 7,976TELUS Corp. 138,929 8,199 9,036
18,698 20,740
Utilities — 3.1%
Atco, Ltd.-Class I 59,866 4,272 4,806Canadian Utilities, Ltd.-Class A 72,149 4,789 5,170Fortis, Inc. 36,485 1,224 1,245
10,285 11,221
Total Canadian Common Stocks
and Income Trusts -Long 442,944 458,253
Canadian Common Stocks and
Income Trusts-Short
Consumer Discretionary — (1.0)%
RONA, Inc. (23,873) (274) (255)Shaw Communications, Inc.-Class B (93,295) (1,873) (2,132)Thomson Reuters Corp. (53,398) (1,479) (1,540)
(3,626) (3,927)
Consumer Staples — (0.3)%
Maple Leaf Foods, Inc. (629) (7) (7)Saputo, Inc. (18,269) (781) (920)
(788) (927)
Energy — (10.2)%
Advantage Oil & Gas, Ltd. (509,988) (1,804) (1,642)AltaGas, Ltd. (16,142) (538) (542)Birchcliff Energy, Ltd. (114,337) (890) (853)Crew Energy, Inc. (135,159) (925) (878)
The accompanying notes are an integral part of the financial statements. 112

BlackRock Canada Alpha Advantage Fund
Statement of Investment Portfolio — As at December 31, 2012
Security Holdings
Average
cost/
Proceeds
received
Fair
value
(in $000s) (in $000s)
Energy (continued)Ensign Resource Service Group, Inc. (218,167) (3,279) (3,362)Freehold Royalties, Ltd. (122,592) (2,429) (2,746)Husky Energy, Inc. (66,566) (1,766) (1,964)MEG Energy Corp. (5,700) (177) (174)Pacific Rubiales Energy Corp. (111,588) (2,575) (2,588)Paramount Resources, Ltd.-Class A (57,099) (1,596) (1,827)Pengrowth Energy Corp. (722,889) (4,532) (3,578)Penn West Petroleum, Ltd. (245,627) (3,316) (2,660)Petrobank Energy & Resources, Ltd. (58,954) (714) (732)Secure Energy Services, Inc. (373,594) (3,555) (3,713)Trican Well Service, Ltd. (280,722) (3,652) (3,686)Trilogy Energy Corp. (65,634) (1,759) (1,921)Veresen, Inc. (303,695) (4,028) (3,596)
(37,535) (36,462)
Financials — (4.9)%
AGF Management, Ltd.-Class B (393,241) (4,837) (3,901)Allied Properties Real Estate
Investment Trust-REIT (16,620) (528) (549)CI Financial Corp. (40,939) (909) (1,021)Cominar REIT (62,354) (1,400) (1,411)Crombie Real Estate Investment
Trust-REIT (144,819) (2,164) (2,143)FirstService Corp. (103,312) (2,853) (2,902)Great-West Lifeco, Inc. (56,234) (1,232) (1,372)IGM Financial, Inc. (73,924) (2,873) (3,082)Primaris Retail REIT (33,462) (824) (902)Sun Life Financial, Inc. (13,284) (353) (351)TMX Group, Ltd. (939) (48) (48)
(18,021) (17,682)
Health Care — (0.4)%
CML HealthCare, Inc. (201,864) (1,912) (1,344)
(1,912) (1,344)
Industrials — (2.0)%
CAE, Inc. (51,840) (532) (524)Canadian Pacific Railway, Ltd. (6,024) (532) (608)Genivar, Inc. (196,789) (4,240) (3,896)Russel Metals, Inc. (20,800) (574) (574)SNC-Lavalin Group, Inc. (38,697) (1,467) (1,562)
(7,345) (7,164)
Information Technology — (1.7)%
Celestica, Inc. (388,983) (2,811) (3,151)CGI Group, Inc.-Class A (108,868) (2,549) (2,501)Open Text Corp. (7,019) (388) (390)
(5,748) (6,042)
Security Holdings
Average
cost/
Proceeds
received
Fair
value
(in $000s) (in $000s)
Materials — (6.1)%
Banro Corp. (65,255) (291) (182)Canfor Corp. (223,357) (3,226) (3,717)Colossus Minerals, Inc. (393,815) (1,868) (1,819)First Majestic Silver Corp. (114,879) (2,009) (2,306)Franco-Nevada Corp. (500) (28) (28)Gabriel Resources, Ltd. (134,396) (458) (319)Gammon Gold, Inc. (458,659) (3,538) (3,756)Guyana Goldfields, Inc. (129,885) (497) (407)Harry Winston Diamond Corp. (283,490) (3,653) (3,963)Lundin Mining Corp. (83,097) (417) (425)North American Palladium, Ltd. (4,890) (12) (7)Northern Dynasty Minerals, Ltd. (261,515) (1,660) (837)Premier Gold Mines, Ltd. (30,776) (183) (130)Pretium Resources, Inc. (208,742) (2,792) (2,739)Rubicon Minerals Corp. (184,772) (621) (473)Tahoe Resources, Inc. (1,710) (30) (31)Thompson Creek Metals Co., Inc. (50,185) (238) (208)Turquoise Hill Resources, Ltd. (46,980) (342) (358)
(21,863) (21,705)
Telecommunication
Services — (0.9)%
Bell Aliant, Inc. (120,666) (3,198) (3,182)Manitoba Telecom Services, Inc. (1,623) (55) (53)
(3,253) (3,235)
Utilities — (2.3)%
Algonquin Power & Utilities Corp. (9,690) (65) (66)Atlantic Power Corp. (335,840) (4,451) (3,812)Just Energy Group, Inc. (2,300) (22) (22)Northland Power, Inc. (61,707) (1,081) (1,159)TransAlta Corp. (207,452) (3,362) (3,138)
(8,981) (8,197)
Total Canadian Common Stocks
and Income Trusts-Short (109,072) (106,685)
Transaction Costs (Note 2) (306)
Total Investments 333,566 351,568
Other Assets and Liabilities — 1.9% 6,632
Net Assets 358,200
The accompanying notes are an integral part of the financial statements. 113
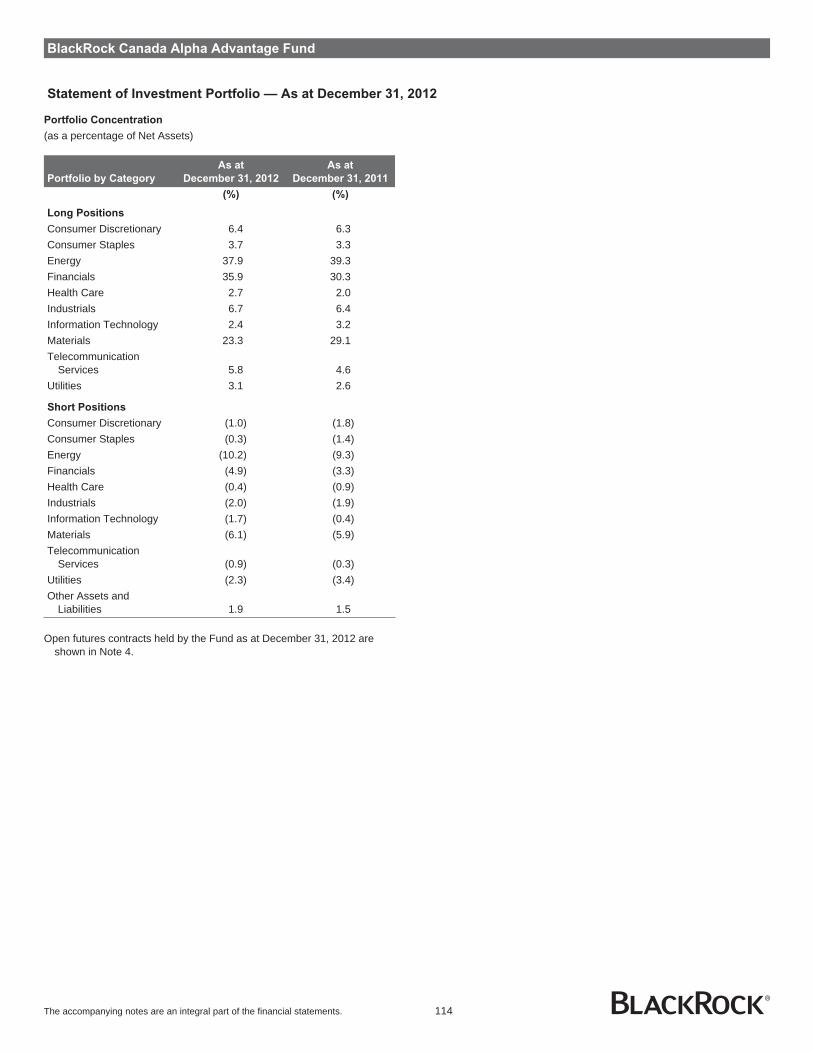
BlackRock Canada Alpha Advantage Fund
Statement of Investment Portfolio — As at December 31, 2012
Portfolio Concentration
(as a percentage of Net Assets)
Portfolio by Category
As at
December 31, 2012
As at
December 31, 2011
(%) (%)
Long Positions
Consumer Discretionary 6.4 6.3Consumer Staples 3.7 3.3Energy 37.9 39.3Financials 35.9 30.3Health Care 2.7 2.0Industrials 6.7 6.4Information Technology 2.4 3.2Materials 23.3 29.1Telecommunication
Services 5.8 4.6Utilities 3.1 2.6
Short Positions
Consumer Discretionary (1.0) (1.8)Consumer Staples (0.3) (1.4)Energy (10.2) (9.3)Financials (4.9) (3.3)Health Care (0.4) (0.9)Industrials (2.0) (1.9)Information Technology (1.7) (0.4)Materials (6.1) (5.9)Telecommunication
Services (0.9) (0.3)Utilities (2.3) (3.4)Other Assets and
Liabilities 1.9 1.5
Open futures contracts held by the Fund as at December 31, 2012 areshown in Note 4.
The accompanying notes are an integral part of the financial statements. 114
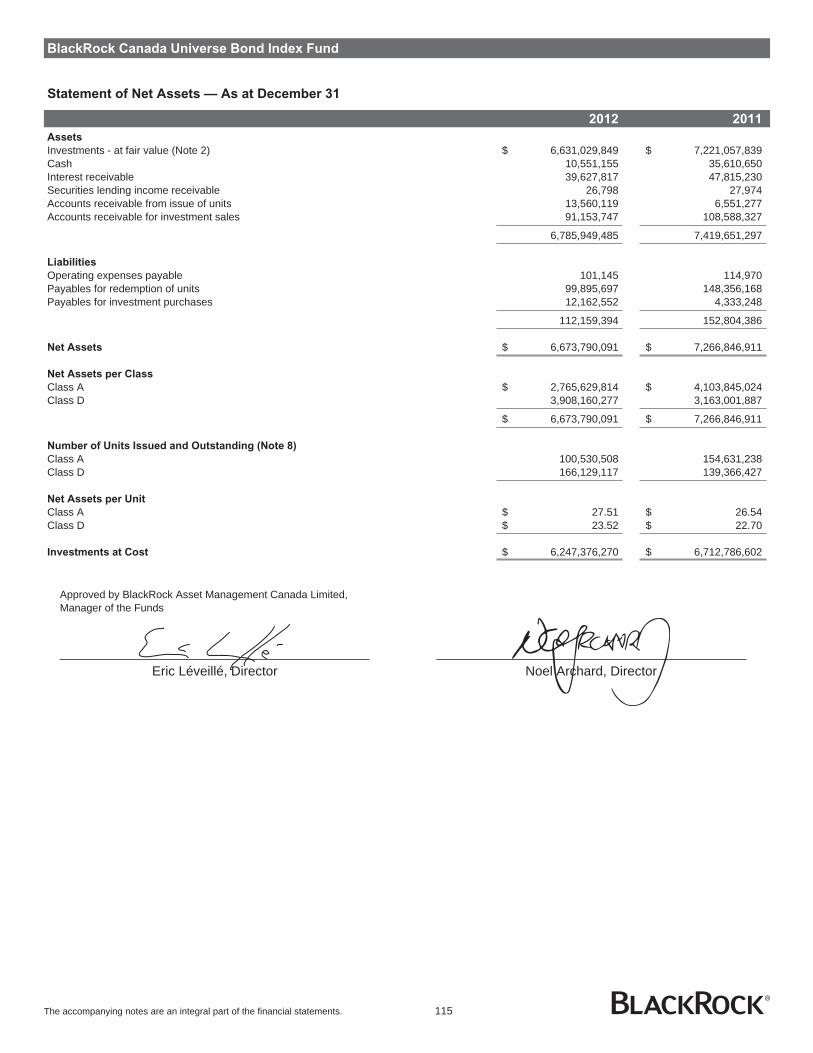
BlackRock Canada Universe Bond Index Fund
Statement of Net Assets — As at December 31
2012 2011
Assets
Investments - at fair value (Note 2) $ 6,631,029,849 $ 7,221,057,839Cash 10,551,155 35,610,650Interest receivable 39,627,817 47,815,230Securities lending income receivable 26,798 27,974Accounts receivable from issue of units 13,560,119 6,551,277Accounts receivable for investment sales 91,153,747 108,588,327
6,785,949,485 7,419,651,297
Liabilities
Operating expenses payable 101,145 114,970Payables for redemption of units 99,895,697 148,356,168Payables for investment purchases 12,162,552 4,333,248
112,159,394 152,804,386
Net Assets $ 6,673,790,091 $ 7,266,846,911
Net Assets per Class
Class A $ 2,765,629,814 $ 4,103,845,024Class D 3,908,160,277 3,163,001,887
$ 6,673,790,091 $ 7,266,846,911
Number of Units Issued and Outstanding (Note 8)
Class A 100,530,508 154,631,238Class D 166,129,117 139,366,427
Net Assets per Unit
Class A $ 27.51 $ 26.54Class D $ 23.52 $ 22.70
Investments at Cost $ 6,247,376,270 $ 6,712,786,602
Approved by BlackRock Asset Management Canada Limited,Manager of the Funds
Eric Léveillé, Director Noel Archard, Director
The accompanying notes are an integral part of the financial statements. 115

BlackRock Canada Universe Bond Index Fund
Statement of Operations — For the Years Ended December 31
2012 2011
Revenue
Interest income $ 253,328,416 $ 306,699,081Securities lending income 330,049 280,493
253,658,465 306,979,574
Expenses
Custodian fees 168,873 177,688Fund accounting expenses 210,791 243,632Unitholder communication costs 4,506 601Audit fees 17,771 25,814Securities filing fees 110,683 122,323Independent review committee fees 3,089 8,520Other operating expenses 11,269 6,456
526,982 585,034
Net Investment Income for the Year 253,131,483 306,394,540
Gain (Loss) on Investments
Net realized gain on sale of investments 119,227,345 76,271,805Net change in unrealized appreciation (depreciation) in value of investments (124,617,658) 328,706,220
Net Gain (Loss) on Investments (5,390,313) 404,978,025
Increase in Net Assets from Operations $ 247,741,170 $ 711,372,565
Increase in Net Assets from Operations per Class
Class A $ 123,845,606 $ 432,696,435Class D 123,895,564 278,676,130
$ 247,741,170 $ 711,372,565
Increase in Net Assets from Operations per Unit
Class A $ 0.96 $ 2.33Class D $ 0.83 $ 2.03
The accompanying notes are an integral part of the financial statements. 116

BlackRock Canada Universe Bond Index Fund
Statement of Changes in Net Assets — For the Years Ended December 31
2012 2011 2012 2011 2012 2011
Fund Class A Class D
Net Assets - Beginning of Year $ 7,266,846,911 $ 7,293,742,380 $ 4,103,845,024 $ 4,598,904,894 $ 3,163,001,887 $ 2,694,837,486
Increase in Net Assets from Operations 247,741,170 711,372,565 123,845,606 432,696,435 123,895,564 278,676,130
Capital Transactions
Proceeds from issue of units 1,270,020,035 1,502,180,005 232,995,674 796,788,117 1,037,024,361 705,391,888Reinvestment of distributions 376,409,181 379,008,632 179,809,058 230,861,139 196,600,123 148,147,493Redemption of units (2,110,818,025) (2,240,448,039) (1,695,056,490) (1,724,544,422) (415,761,535) (515,903,617)
Net capital transactions (464,388,809) (359,259,402) (1,282,251,758) (696,895,166) 817,862,949 337,635,764
Distributions
From net investment income (253,113,292) (306,379,648) (117,369,138) (184,606,840) (135,744,154) (121,772,808)From capital gains (96,640,335) (57,835,200) (40,946,276) (33,180,524) (55,694,059) (24,654,676)From capital gains redemption in kind (Note 9) (26,655,554) (14,793,784) (21,493,644) (13,073,775) (5,161,910) (1,720,009)
Total distributions (376,409,181) (379,008,632) (179,809,058) (230,861,139) (196,600,123) (148,147,493)
Increase (Decrease) in Net Assets for the Year (593,056,820) (26,895,469) (1,338,215,210) (495,059,870) 745,158,390 468,164,401
Net Assets - End of Year $ 6,673,790,091 $ 7,266,846,911 $ 2,765,629,814 $ 4,103,845,024 $ 3,908,160,277 $ 3,163,001,887
The accompanying notes are an integral part of the financial statements. 117

BlackRock Canada Universe Bond Index Fund
Statement of Investment Portfolio — As at December 31, 2012
Security
Par
value
Average
cost
Fair
value
(in 000s) (in $000s) (in $000s)
Fixed Income Investments
Government Federal
Non-Agency — 28.5%
Government of Canada1.00% February 01, 2014 29,808 29,840 29,7742.00% March 01, 2014 43,967 43,798 44,4150.75% May 01, 2014 47,284 46,942 47,0545.00% June 01, 2014 39,451 43,220 41,5823.00% June 01, 2014 70,767 72,627 72,6162.25% August 01, 2014 70,568 71,775 71,7981.00% November 01, 2014 43,287 43,192 43,1792.00% December 01, 2014 77,801 77,622 79,0501.00% February 01, 2015 68,321 68,152 68,1214.50% June 01, 2015 45,031 47,809 48,5952.50% June 01, 2015 52,391 53,009 54,0521.50% August 01, 2015 39,114 39,392 39,3953.00% December 01, 2015 60,853 62,546 63,8961.25% February 01, 2016 22,149 22,128 22,1314.00% June 01, 2016 47,206 49,456 51,4512.00% June 01, 2016 49,640 48,783 50,7992.75% September 01, 2016 48,652 51,487 51,1111.50% March 01, 2017 46,856 47,196 47,1224.00% June 01, 2017 50,647 56,267 56,3341.50% September 01, 2017 44,550 44,758 44,7861.25% March 01, 2018 14,904 14,839 14,7724.25% June 01, 2018 52,165 58,233 59,7783.75% June 01, 2019 84,164 91,902 95,4153.50% June 01, 2020 69,678 72,443 78,74110.50% March 15, 2021 564 912 9459.75% June 01, 2021 1,042 1,643 1,7003.25% June 01, 2021 56,738 62,170 63,5849.25% June 01, 2022 988 1,650 1,6272.75% June 01, 2022 56,430 60,613 61,0568.00% June 01, 2023 13,234 19,096 20,8901.50% June 01, 2023 22,394 21,608 21,5519.00% June 01, 2025 11,562 18,081 20,4418.00% June 01, 2027 16,390 24,507 28,3305.75% June 01, 2029 53,211 65,818 79,0615.75% June 01, 2033 57,310 74,275 88,9955.00% June 01, 2037 63,855 80,138 94,4904.00% June 01, 2041 76,164 95,851 101,8123.50% December 01, 2045 33,644 40,323 42,391
1,824,101 1,902,840
Federal Agency — 11.6%
Asian Development Bank, SeriesMPLE, Senior Unsecured Note4.65% February 16, 2027 5,106 5,199 5,960
Canada Housing Trust2.20% March 15, 2014 36,335 35,697 36,7833.15% June 15, 2014 45,002 46,994 46,2712.75% September 15, 2014 38,258 39,216 39,2492.75% December 15, 2014 35,798 36,075 36,8482.95% March 15, 2015 32,761 32,471 33,9553.15% June 15, 2015 30,060 30,966 31,4024.10% December 15, 2018 42,345 44,045 47,7283.75% March 15, 2020 27,349 27,190 30,5273.35% December 15, 2020 23,679 24,016 25,823
Canada Housing Trust No 12.75% December 15, 2015 32,390 32,469 33,6562.45% December 15, 2015 31,062 31,150 32,008
Security
Par
value
Average
cost
Fair
value
(in 000s) (in $000s) (in $000s)
Federal Agency (continued)2.75% June 15, 2016 70,640 71,031 73,6251.85% December 15, 2016 57,226 57,818 57,8382.05% June 15, 2017 56,929 57,524 57,9391.70% December 15, 2017 53,644 53,595 53,6463.80% June 15, 2021 39,577 40,909 44,5292.65% March 15, 2022 35,483 35,953 36,6032.40% December 15, 2022 24,840 24,924 25,005
Canada Post Corp.4.08% July 16, 2025 3,283 3,307 3,8224.36% July 16, 2040 1,883 1,882 2,364
Farm Credit Canada4.55% April 12, 2021 546 590 644
Inter-American Development Bank,Note4.40% January 26, 2026 7,408 7,135 8,427
Royal Office Finance LP, Series A,Note5.21% November 12, 2037 7,253 7,196 8,604
South Coast British ColumbiaTransportation Authority3.80% November 02, 2020 753 752 8054.65% June 20, 2041 1,423 1,610 1,6333.85% February 09, 2052 988 1,011 999
750,725 776,693
Government Guaranteed — 0.1%
Milit-Air, Inc., Secured Note5.75% June 30, 2019 4,194 4,405 4,659
4,405 4,659
Municipal — 2.0%
Alberta Capital Finance Authority,Note3.05% June 15, 2015 4,632 4,621 4,8224.35% June 15, 2016 3,934 3,952 4,3004.65% June 15, 2017 4,445 5,036 4,993
City of Montreal4.95% December 10, 2014 4,635 4,970 4,9285.00% December 01, 2018 377 427 4265.45% December 01, 2019 3,139 3,652 3,6384.50% December 01, 2021 2,679 2,660 2,9356.00% June 01, 2043 4,224 4,396 5,740
City of Ottawa4.60% July 14, 2042 1,368 1,516 1,554
City of Toronto4.55% May 20, 2015 888 960 9484.85% July 28, 2016 4,394 4,463 4,8374.95% June 27, 2018 941 1,008 1,0674.50% December 02, 2019 1,032 1,034 1,1526.80% July 26, 2021 1,464 1,858 1,8853.50% December 06, 2021 5,629 5,714 5,8435.20% June 01, 2040 3,660 3,646 4,4924.70% June 10, 2041 2,759 2,747 3,162
City of Winnipeg9.13% May 12, 2015 3,372 4,532 3,948
The accompanying notes are an integral part of the financial statements. 118

BlackRock Canada Universe Bond Index Fund
Statement of Investment Portfolio — As at December 31, 2012
Security
Par
value
Average
cost
Fair
value
(in 000s) (in $000s) (in $000s)
Municipal (continued)Municipal Finance Authority of British
Columbia4.90% December 02, 2014 988 1,062 1,0524.65% April 19, 2016 7,388 7,486 8,0693.00% June 01, 2016 9,435 9,422 9,8134.80% December 01, 2017 380 412 4284.60% April 23, 2018 2,469 2,774 2,7684.88% June 03, 2019 8,992 9,259 10,2914.45% June 01, 2020 1,033 1,031 1,1604.15% June 01, 2021 1,861 1,865 2,0503.35% June 01, 2022 4,692 4,879 4,8524.95% December 01, 2027 1,951 1,944 2,288
Peel Regional Municipality5.10% June 29, 2040 3,018 3,046 3,6763.85% October 30, 2042 1,877 1,866 1,897
PSP Capital, Inc.2.94% December 03, 2015 7,737 7,734 7,9962.26% February 16, 2017 2,818 2,817 2,849
Regional Municipality of Halton4.05% October 11, 2041 856 863 889
Regional Municipality of York7.25% June 19, 2017 3,177 3,810 3,8545.00% April 29, 2019 2,173 2,489 2,4744.50% June 30, 2020 2,256 2,291 2,5194.00% June 30, 2021 5,586 5,867 6,0254.15% November 18, 2041 593 628 623
Ville Montreal5.00% December 01, 2017 380 411 426
129,148 136,669
Provincial — 27.9%
Centre Hospitalier de L’universite deMontreal4.45% October 01, 2049 1,445 1,445 1,545
City of Toronto3.80% December 13, 2042 2,000 1,992 1,992
Financement-Quebec4.25% March 01, 2014 8,490 8,893 8,7803.25% June 01, 2014 6,514 6,681 6,6904.25% December 01, 2015 8,540 9,217 9,1863.50% December 01, 2016 9,110 9,629 9,6893.50% December 01, 2017 9,239 9,186 9,8882.40% December 01, 2018 8,339 8,331 8,4232.45% December 01, 2019 12,248 12,248 12,2605.25% June 01, 2034 9,076 9,843 11,205
Hydro Quebec9.63% July 15, 2022 4,425 6,407 6,8945.00% February 15, 2050 12,030 14,803 15,804
Hydro Quebec, (MTN)6.00% February 15, 2040 6,551 7,803 9,296
Hydro Quebec, Series 19, Note6.50% February 15, 2035 12,566 15,681 18,128
Hydro Quebec, Series HL, Note11.00% August 15, 2020 14,221 22,712 22,505
Hydro Quebec, Series JM, Note5.00% February 15, 2045 7,244 7,442 9,306
Security
Par
value
Average
cost
Fair
value
(in 000s) (in $000s) (in $000s)
Provincial (continued)Ontario Electricity Financial Corp., Note
8.25% June 22, 2026 7,427 10,734 11,537Province of Alberta
2.75% December 01, 2014 4,164 4,344 4,2831.85% September 01, 2016 3,433 3,428 3,4691.75% June 15, 2017 6,420 6,422 6,4324.00% December 01, 2019 6,467 6,649 7,2392.55% December 15, 2022 8,198 8,177 8,1854.50% December 01, 2040 4,377 4,359 5,396
Province of British Columbia7.50% June 09, 2014 2,521 3,048 2,7435.30% June 18, 2014 988 1,053 1,0464.25% June 18, 2014 7,722 8,220 8,0574.70% December 01, 2017 2,731 2,755 3,1065.30% June 17, 2019 189 209 2244.10% December 18, 2019 9,097 9,216 10,2053.70% December 18, 2020 10,786 10,750 11,8319.95% May 15, 2021 3,543 5,362 5,5203.25% December 18, 2021 9,736 9,820 10,3102.70% December 18, 2022 5,334 5,337 5,3558.00% September 08, 2023 2,079 2,779 3,0719.00% August 23, 2024 2,944 4,326 4,7086.15% November 19, 2027 988 1,348 1,3485.70% June 18, 2029 11,259 14,133 14,9546.35% June 18, 2031 9,124 10,657 13,0375.40% June 18, 2035 2,667 3,439 3,5324.70% June 18, 2037 7,768 7,688 9,5104.30% June 18, 2042 18,224 19,027 21,610
Province of British Columbia,Unsecured Note3.20% June 18, 2044 3,000 2,971 2,954
Province of British Columbia, (MTN)4.65% December 18, 2018 11,248 11,603 12,9194.95% June 18, 2040 9,647 9,898 12,417
Province of Manitoba4.80% December 03, 2014 4,162 4,356 4,4364.30% March 01, 2016 6,325 6,663 6,8641.85% June 01, 2017 5,708 5,701 5,7334.15% June 03, 2020 2,728 2,723 3,0613.85% December 01, 2021 2,759 2,757 3,0387.75% December 22, 2025 4,082 5,164 6,1085.70% March 05, 2037 6,023 6,863 8,3084.60% March 05, 2038 5,348 5,222 6,4404.65% March 05, 2040 4,539 4,426 5,5574.10% March 05, 2041 6,012 5,731 6,8334.40% March 05, 2042 2,378 2,782 2,8433.35% March 05, 2043 1,383 1,376 1,391
Province of Manitoba, (MTN)6.50% September 22, 2017 6,261 7,265 7,5735.50% November 15, 2018 1,975 2,357 2,3474.40% September 05, 2025 3,263 3,275 3,725
Province of New Brunswick4.50% February 04, 2015 2,708 2,921 2,8834.30% December 03, 2015 3,111 3,338 3,3554.70% July 21, 2016 2,634 2,876 2,9086.00% December 27, 2017 3,580 3,901 4,2634.45% March 26, 2018 5,694 5,681 6,3834.40% June 03, 2019 4,826 4,932 5,441
The accompanying notes are an integral part of the financial statements. 119

BlackRock Canada Universe Bond Index Fund
Statement of Investment Portfolio — As at December 31, 2012
Security
Par
value
Average
cost
Fair
value
(in 000s) (in $000s) (in $000s)
Provincial (continued)4.50% June 02, 2020 8,950 9,150 10,1993.35% December 03, 2021 8,065 8,197 8,4902.85% June 02, 2023 1,939 1,932 1,9315.65% December 27, 2028 2,854 3,694 3,6684.65% September 26, 2035 5,126 4,844 6,0054.55% March 26, 2037 5,222 4,944 6,0594.80% September 26, 2039 5,595 5,510 6,7944.80% June 03, 2041 4,757 5,825 5,8493.55% June 03, 2043 2,469 2,461 2,499
Province of Newfoundland5.25% June 04, 2014 3,409 3,619 3,59910.95% April 15, 2021 2,941 4,608 4,7676.15% April 17, 2028 1,902 2,611 2,5796.55% October 17, 2030 1,427 2,067 2,0535.60% October 17, 2033 5,008 5,095 6,6674.65% October 17, 2040 6,606 6,355 8,095
Province of Nova Scotia4.60% August 18, 2016 753 787 8301.90% September 08, 2017 30,416 30,308 30,4544.15% November 25, 2019 5,221 5,489 5,8274.10% June 01, 2021 7,337 7,320 8,1776.60% December 01, 2031 1,482 2,146 2,1454.90% June 01, 2035 1,975 2,348 2,4124.50% June 01, 2037 3,916 3,719 4,5634.70% June 01, 2041 3,667 3,594 4,4894.40% June 01, 2042 4,901 5,406 5,7653.50% June 02, 2043 45,152 45,499 46,1873.50% June 02, 2062 5,457 5,435 5,565
Province of Nova Scotia, (MTN)5.80% June 01, 2033 2,963 3,887 3,992
Province of Nova Scotia, Series 9Z6.60% June 01, 2027 1,975 2,701 2,747
Province of Ontario5.00% March 08, 2014 33,234 35,831 34,6923.25% September 08, 2014 16,153 16,521 16,6764.50% March 08, 2015 16,461 17,484 17,5623.15% September 08, 2015 12,331 12,649 12,8774.40% March 08, 2016 16,423 16,521 17,8553.20% September 08, 2016 6,463 6,447 6,8104.30% March 08, 2017 30,031 30,246 33,0544.20% March 08, 2018 16,743 17,608 18,5704.40% June 02, 2019 39,859 42,669 44,9794.20% June 02, 2020 46,731 48,189 52,3784.00% June 02, 2021 49,592 53,147 54,8783.15% June 02, 2022 60,759 61,698 62,8672.85% June 02, 2023 13,500 13,490 13,4858.10% September 08, 2023 7,167 9,590 10,5577.50% February 07, 2024 988 1,408 1,4088.50% December 02, 2025 4,505 6,206 7,0848.00% June 02, 2026 480 631 7347.60% June 02, 2027 17,308 22,848 26,1376.50% March 08, 2029 26,034 32,181 36,7006.20% June 02, 2031 12,264 14,609 17,0515.85% March 08, 2033 21,449 25,396 29,1334.70% June 02, 2037 27,353 27,453 32,9714.60% June 02, 2039 31,172 31,070 37,3794.65% June 02, 2041 52,083 54,568 63,817
Security
Par
value
Average
cost
Fair
value
(in 000s) (in $000s) (in $000s)
Provincial (continued)Province of Ontario, (MTN)
5.50% June 02, 2018 4,616 4,958 5,4204.85% June 02, 2020 2,469 2,894 2,8735.60% June 02, 2035 27,439 30,638 36,668
Province of Ontario, Series HC9.50% July 13, 2022 6,152 8,942 9,563
Province of Prince Edward Island4.25% September 24, 2019 283 290 3166.10% July 29, 2027 1,321 1,391 1,7445.70% June 15, 2035 2,050 2,239 2,7124.65% November 19, 2037 941 919 1,1004.60% May 19, 2041 1,767 1,755 2,0823.65% June 27, 2042 1,185 1,182 1,198
Province of Quebec5.50% December 01, 2014 15,384 17,239 16,5905.00% December 01, 2015 14,601 15,437 16,0334.50% December 01, 2016 14,772 15,609 16,2974.50% December 01, 2017 28,683 29,456 32,1074.50% December 01, 2019 23,747 24,833 26,9424.50% December 01, 2020 32,161 33,686 36,6014.25% December 01, 2021 32,909 35,032 36,8143.50% December 01, 2022 35,331 36,388 37,2139.38% January 16, 2023 3,537 5,094 5,4945.35% June 01, 2025 3,753 4,554 4,5658.50% April 01, 2026 5,627 7,678 8,7806.00% October 01, 2029 11,403 12,736 15,2106.25% June 01, 2032 18,296 21,501 25,3575.75% December 01, 2036 18,726 22,003 25,2135.00% December 01, 2038 22,834 23,966 28,2605.00% December 01, 2041 39,298 42,130 49,6144.25% December 01, 2043 31,051 34,177 35,334
Province of Quebec, SeniorUnsecured Note3.00% September 01, 2023 8,500 8,491 8,515
Province of Quebec, (MTN)4.50% December 01, 2018 16,708 16,702 18,862
Province of Saskatchewan4.65% September 05, 2017 2,644 2,660 2,9903.90% July 28, 2020 2,540 2,533 2,8339.60% February 04, 2022 1,673 2,433 2,6216.40% September 05, 2031 7,798 9,003 11,3395.80% September 05, 2033 988 1,368 1,3745.60% September 05, 2035 1,427 1,727 1,9625.00% March 05, 2037 1,975 2,583 2,5454.75% June 01, 2040 5,738 6,253 7,2863.40% February 03, 2042 3,483 3,532 3,605
1,712,398 1,862,172
Total Government 4,420,777 4,683,033
Corporate — 29.2%
407 East Development GroupGeneral Partnership2.81% December 18, 2016 1,482 1,482 1,505
407 International, Inc., (MTN)3.88% June 16, 2015 3,888 3,920 4,0833.87% November 24, 2017 1,561 1,561 1,664
The accompanying notes are an integral part of the financial statements. 120

BlackRock Canada Universe Bond Index Fund
Statement of Investment Portfolio — As at December 31, 2012
Security
Par
value
Average
cost
Fair
value
(in 000s) (in $000s) (in $000s)
Corporate (continued)4.99% June 16, 2020 1,649 1,672 1,9134.30% May 26, 2021 2,510 2,532 2,7934.45% November 15, 2041 2,803 2,981 3,0764.19% April 25, 2042 2,371 2,368 2,496
407 International, Inc., Series 04A35.96% December 03, 2035 1,975 2,528 2,617
407 International, Inc., Series 06D1,Note5.75% February 14, 2036 4,888 5,188 6,029
407 International, Inc., Series 99A2,Senior Note6.47% July 27, 2029 3,142 3,389 4,215
Aeroports de Montreal5.17% September 17, 2035 4,796 4,563 5,7375.67% October 16, 2037 3,905 4,015 5,0185.47% April 16, 2040 988 988 1,252
Aimia, Inc.4.35% January 22, 2018 2,000 1,996 1,993
Aimia, Inc., (MTN)5.60% May 17, 2019 1,284 1,283 1,346
Alimentation Couche Tard, Inc.2.86% November 01, 2017 2,963 2,963 2,9723.32% November 01, 2019 1,778 1,778 1,7883.90% November 01, 2022 1,975 1,975 1,987
Alliance Pipeline, LP4.93% December 16, 2019 1,975 2,180 2,167
Alliance Pipeline, LP, Senior Note5.55% December 31, 2023 936 990 1,0376.77% December 31, 2025 2,522 2,731 3,042
AltaGas Income Trust5.49% March 27, 2017 1,073 1,073 1,191
AltaGas, Ltd.7.42% April 29, 2014 1,235 1,362 1,314
AltaGas, Ltd., (MTN)4.10% March 24, 2016 1,159 1,159 1,2144.60% January 15, 2018 879 878 9504.55% January 17, 2019 1,778 1,778 1,9234.07% June 01, 2020 1,185 1,185 1,247
AltaLink Investments, LP3.67% June 05, 2019 1,975 1,975 1,988
AltaLink, LP5.38% March 26, 2040 977 977 1,224
AltaLink, LP, (MTN)5.24% May 29, 2018 2,653 2,782 3,0402.98% November 28, 2022 1,000 1,000 9994.87% November 15, 2040 1,076 1,056 1,2604.46% November 08, 2041 1,975 2,180 2,1783.99% June 30, 2042 988 988 1,012
American Express Canada (MTN)4.85% October 03, 2014 5,112 5,114 5,382
American Express Canada,Guaranteed Note, (MTN)3.60% June 03, 2016 3,876 3,900 4,050
AON Finance NS1 ULC4.76% March 08, 2018 1,675 1,693 1,795
Security
Par
value
Average
cost
Fair
value
(in 000s) (in $000s) (in $000s)
Corporate (continued)Arrow Lakes Power
5.52% April 05, 2041 1,948 1,948 2,261Bank of Montreal
3.93% April 27, 2015 9,269 9,269 9,7111.89% October 05, 2015 7,902 7,903 7,9013.10% March 10, 2016 6,633 6,646 6,8533.49% June 10, 2016 8,518 8,535 8,9112.96% August 02, 2016 11,335 11,383 11,6622.39% July 12, 2017 7,210 7,210 7,2485.45% July 17, 2017 1,077 1,179 1,2232.24% December 11, 2017 9,000 8,998 8,9616.17% March 28, 2023(1) 2,501 2,395 2,9374.61% September 10, 2025 3,252 3,329 3,715
Bank of Montreal, (MTN)3.98% July 08, 2021(1) 8,708 8,708 9,200
Bank of Montreal, DPNT5.18% June 10, 2015 6,392 6,505 6,8986.02% May 02, 2018 8,122 8,425 9,574
Bank of Montreal, Series C,Subordinated Note4.87% April 22, 2020(1) 1,241 1,150 1,321
Bank of Nova Scotia3.43% July 16, 2014 6,232 6,346 6,4013.35% November 18, 2014 8,280 8,332 8,5283.34% March 25, 2015 6,539 6,549 6,7592.25% May 08, 2015 8,346 8,379 8,4293.61% February 22, 2016 8,310 8,329 8,7082.74% December 01, 2016 7,035 7,035 7,1852.60% February 27, 2017 8,396 8,396 8,5134.10% June 08, 2017 6,848 6,884 7,3714.94% April 15, 2019(1) 5,260 5,426 5,4616.65% January 22, 2021(1) 4,972 5,102 5,5973.04% October 18, 2024(1) 9,877 9,877 9,982
Bank of Nova Scotia, (MTN)2.90% August 03, 2022(1) 8,240 8,240 8,389
Bank of Nova Scotia, Note8.90% June 20, 2025 1,363 1,795 2,100
BC Tel, Note9.65% April 08, 2022 3,407 4,970 4,990
BC Tel, Series 3, Note10.65% June 19, 2021 2,015 2,900 3,065
BCIMC Realty Corp.2.65% June 29, 2017 3,210 3,209 3,2502.96% March 07, 2019 3,951 3,953 4,0193.51% June 29, 2022 1,482 1,482 1,512
BCIMC Realty Corp., (MTN)5.65% January 05, 2018 2,850 3,069 3,272
Bell Aliant RegionalCommunications, LP, (MTN)4.95% February 26, 2014 1,975 2,063 2,0396.29% February 17, 2015 2,584 2,640 2,7914.37% September 13, 2017 2,751 2,750 2,9154.88% April 26, 2018 1,947 1,947 2,1045.52% February 26, 2019 2,728 2,744 3,034
Bell Aliant RegionalCommunications, Note5.41% September 26, 2016 3,263 3,351 3,562
The accompanying notes are an integral part of the financial statements. 121

BlackRock Canada Universe Bond Index Fund
Statement of Investment Portfolio — As at December 31, 2012
Security
Par
value
Average
cost
Fair
value
(in 000s) (in $000s) (in $000s)
Corporate (continued)Bell Canada
3.60% December 02, 2015 7,252 7,240 7,5593.65% May 19, 2016 1,975 2,075 2,0674.40% March 16, 2018 10,364 10,425 11,2623.35% June 18, 2019 4,148 4,141 4,271
Bell Canada, (MTN)4.85% June 30, 2014 8,360 8,567 8,729
Bell Canada, Note, (MTN)7.85% April 02, 2031 3,944 4,458 5,4767.30% February 23, 2032 3,733 4,221 4,974
Bell Canada, Series M-176.10% March 16, 2035 4,988 5,653 6,064
BMO Capital Trust5.47% December 31, 2014 494 536 527
BMO Capital Trust II, Series A,Note10.22% December 31, 2107(1) 4,033 4,454 5,559
BMO Subordinated Notes Trust5.75% September 26, 2022(1) 2,963 3,408 3,391
BMW Canada, Inc.2.76% April 01, 2014 3,487 3,494 3,5293.15% April 01, 2015 873 873 8972.11% May 26, 2016 3,000 2,999 2,9952.39% November 27, 2017 2,000 2,000 1,998
Borealis Infrastructure Trust, SeriesN, Secured Note6.35% December 01, 2020 3,222 3,606 3,666
British Columbia Ferry Services,Inc., Series 08-1, Senior SecuredNote5.58% January 11, 2038 2,931 2,905 3,565
British Columbia Ferry Services,Inc., Series B, Senior SecuredNote6.25% October 13, 2034 2,749 3,010 3,564
Broadcast Centre Trust, SecuredNote7.53% May 01, 2027 2,489 3,195 3,314
Broadway Credit Card Trust, Series A,Note4.80% March 17, 2017 4,526 4,399 4,690
Brookfield Asset Management, Inc.8.95% June 02, 2014 711 824 7725.29% April 25, 2017 2,407 2,522 2,612
Brookfield Asset Management, Inc.,(MTN)3.95% April 09, 2019 1,975 1,975 2,0245.30% March 01, 2021 3,843 3,858 4,246
Brookfield Asset Management, Inc.,Note5.95% June 14, 2035 1,832 1,693 1,824
Brookfield Power Corp.5.25% November 05, 2018 2,321 2,465 2,5455.84% November 05, 2036 966 901 965
Brookfield Renewable Power, Inc.,(MTN)6.13% November 30, 2016 1,146 1,276 1,2745.14% October 13, 2020 3,149 3,206 3,434
Security
Par
value
Average
cost
Fair
value
(in 000s) (in $000s) (in $000s)
Corporate (continued)BRP Finance ULC, (MTN)
4.79% February 07, 2022 1,748 1,748 1,848Cadillac Fairview Finance Trust
3.24% January 25, 2016 8,371 8,371 8,7063.64% May 09, 2018 5,761 5,772 6,1524.31% January 25, 2021 9,232 9,271 10,340
Caisse Centrale Desjardins duQuebec3.79% June 08, 2015 2,449 2,473 2,5592.28% October 17, 2016 4,939 4,955 4,9563.50% October 05, 2017 3,643 3,685 3,827
Calloway Real Estate InvestmentTrust5.37% October 12, 2016 49 53 53
Cameco Corp.4.70% September 16, 2015 2,441 2,452 2,5935.67% September 02, 2019 4,309 4,513 4,9523.75% November 14, 2022 1,432 1,432 1,4235.09% November 14, 2042 2,963 2,962 2,952
Canadian Credit Card TST2.31% April 24, 2015 1,800 1,800 1,8223.44% July 24, 2015 5,687 5,687 5,916
Canadian Imperial Bank ofCommerce3.30% November 19, 2014 5,097 5,135 5,2484.75% December 22, 2014 593 639 6273.10% March 02, 2015 5,533 5,648 5,6852.20% May 22, 2015 4,939 4,933 4,9833.40% January 14, 2016 11,496 11,488 11,9632.65% November 08, 2016 13,285 13,280 13,5183.95% July 14, 2017 8,637 8,810 9,2572.35% October 18, 2017 8,739 8,747 8,7484.11% April 30, 2020(1) 8,728 8,728 9,1523.15% November 02, 2020(1) 7,780 7,767 7,991
Canadian Imperial Bank ofCommerce, (MTN)6.00% June 06, 2023(1) 293 324 344
Canadian Imperial Bank ofCommerce, DPNT, Note4.95% January 23, 2014 4,962 5,300 5,142
Canadian Natural Resources, Ltd.,(MTN)4.95% June 01, 2015 3,393 3,648 3,6323.05% June 19, 2019 3,457 3,455 3,499
Canadian Pacific RR Co., (MTN)6.45% November 17, 2039 3,231 3,371 3,971
Canadian Pacific RR Co., SeniorUnsecured Note, (MTN)6.25% June 01, 2018 6,331 6,287 7,348
Canadian Tire Corp., Ltd. (MTN)4.95% June 01, 2015 988 1,064 1,0535.65% June 01, 2016 1,167 1,177 1,2926.32% February 24, 2034 2,943 2,918 3,369
Canadian Utilities, Ltd., Series 19929.40% May 01, 2023 2,165 3,029 3,320
The accompanying notes are an integral part of the financial statements. 122
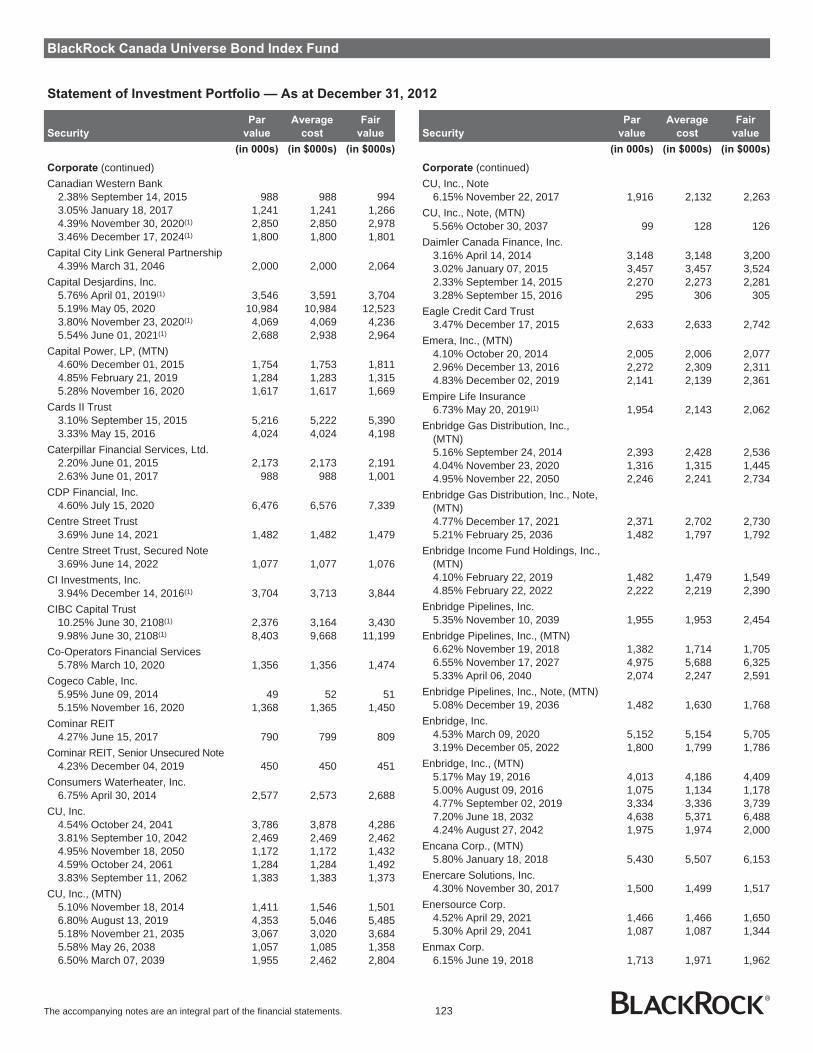
BlackRock Canada Universe Bond Index Fund
Statement of Investment Portfolio — As at December 31, 2012
Security
Par
value
Average
cost
Fair
value
(in 000s) (in $000s) (in $000s)
Corporate (continued)Canadian Western Bank
2.38% September 14, 2015 988 988 9943.05% January 18, 2017 1,241 1,241 1,2664.39% November 30, 2020(1) 2,850 2,850 2,9783.46% December 17, 2024(1) 1,800 1,800 1,801
Capital City Link General Partnership4.39% March 31, 2046 2,000 2,000 2,064
Capital Desjardins, Inc.5.76% April 01, 2019(1) 3,546 3,591 3,7045.19% May 05, 2020 10,984 10,984 12,5233.80% November 23, 2020(1) 4,069 4,069 4,2365.54% June 01, 2021(1) 2,688 2,938 2,964
Capital Power, LP, (MTN)4.60% December 01, 2015 1,754 1,753 1,8114.85% February 21, 2019 1,284 1,283 1,3155.28% November 16, 2020 1,617 1,617 1,669
Cards II Trust3.10% September 15, 2015 5,216 5,222 5,3903.33% May 15, 2016 4,024 4,024 4,198
Caterpillar Financial Services, Ltd.2.20% June 01, 2015 2,173 2,173 2,1912.63% June 01, 2017 988 988 1,001
CDP Financial, Inc.4.60% July 15, 2020 6,476 6,576 7,339
Centre Street Trust3.69% June 14, 2021 1,482 1,482 1,479
Centre Street Trust, Secured Note3.69% June 14, 2022 1,077 1,077 1,076
CI Investments, Inc.3.94% December 14, 2016(1) 3,704 3,713 3,844
CIBC Capital Trust10.25% June 30, 2108(1) 2,376 3,164 3,4309.98% June 30, 2108(1) 8,403 9,668 11,199
Co-Operators Financial Services5.78% March 10, 2020 1,356 1,356 1,474
Cogeco Cable, Inc.5.95% June 09, 2014 49 52 515.15% November 16, 2020 1,368 1,365 1,450
Cominar REIT4.27% June 15, 2017 790 799 809
Cominar REIT, Senior Unsecured Note4.23% December 04, 2019 450 450 451
Consumers Waterheater, Inc.6.75% April 30, 2014 2,577 2,573 2,688
CU, Inc.4.54% October 24, 2041 3,786 3,878 4,2863.81% September 10, 2042 2,469 2,469 2,4624.95% November 18, 2050 1,172 1,172 1,4324.59% October 24, 2061 1,284 1,284 1,4923.83% September 11, 2062 1,383 1,383 1,373
CU, Inc., (MTN)5.10% November 18, 2014 1,411 1,546 1,5016.80% August 13, 2019 4,353 5,046 5,4855.18% November 21, 2035 3,067 3,020 3,6845.58% May 26, 2038 1,057 1,085 1,3586.50% March 07, 2039 1,955 2,462 2,804
Security
Par
value
Average
cost
Fair
value
(in 000s) (in $000s) (in $000s)
Corporate (continued)CU, Inc., Note
6.15% November 22, 2017 1,916 2,132 2,263CU, Inc., Note, (MTN)
5.56% October 30, 2037 99 128 126Daimler Canada Finance, Inc.
3.16% April 14, 2014 3,148 3,148 3,2003.02% January 07, 2015 3,457 3,457 3,5242.33% September 14, 2015 2,270 2,273 2,2813.28% September 15, 2016 295 306 305
Eagle Credit Card Trust3.47% December 17, 2015 2,633 2,633 2,742
Emera, Inc., (MTN)4.10% October 20, 2014 2,005 2,006 2,0772.96% December 13, 2016 2,272 2,309 2,3114.83% December 02, 2019 2,141 2,139 2,361
Empire Life Insurance6.73% May 20, 2019(1) 1,954 2,143 2,062
Enbridge Gas Distribution, Inc.,(MTN)5.16% September 24, 2014 2,393 2,428 2,5364.04% November 23, 2020 1,316 1,315 1,4454.95% November 22, 2050 2,246 2,241 2,734
Enbridge Gas Distribution, Inc., Note,(MTN)4.77% December 17, 2021 2,371 2,702 2,7305.21% February 25, 2036 1,482 1,797 1,792
Enbridge Income Fund Holdings, Inc.,(MTN)4.10% February 22, 2019 1,482 1,479 1,5494.85% February 22, 2022 2,222 2,219 2,390
Enbridge Pipelines, Inc.5.35% November 10, 2039 1,955 1,953 2,454
Enbridge Pipelines, Inc., (MTN)6.62% November 19, 2018 1,382 1,714 1,7056.55% November 17, 2027 4,975 5,688 6,3255.33% April 06, 2040 2,074 2,247 2,591
Enbridge Pipelines, Inc., Note, (MTN)5.08% December 19, 2036 1,482 1,630 1,768
Enbridge, Inc.4.53% March 09, 2020 5,152 5,154 5,7053.19% December 05, 2022 1,800 1,799 1,786
Enbridge, Inc., (MTN)5.17% May 19, 2016 4,013 4,186 4,4095.00% August 09, 2016 1,075 1,134 1,1784.77% September 02, 2019 3,334 3,336 3,7397.20% June 18, 2032 4,638 5,371 6,4884.24% August 27, 2042 1,975 1,974 2,000
Encana Corp., (MTN)5.80% January 18, 2018 5,430 5,507 6,153
Enercare Solutions, Inc.4.30% November 30, 2017 1,500 1,499 1,517
Enersource Corp.4.52% April 29, 2021 1,466 1,466 1,6505.30% April 29, 2041 1,087 1,087 1,344
Enmax Corp.6.15% June 19, 2018 1,713 1,971 1,962
The accompanying notes are an integral part of the financial statements. 123

BlackRock Canada Universe Bond Index Fund
Statement of Investment Portfolio — As at December 31, 2012
Security
Par
value
Average
cost
Fair
value
(in 000s) (in $000s) (in $000s)
Corporate (continued)EPCOR Utilities, Inc.
6.80% June 28, 2029 99 133 132EPCOR Utilities, Inc., (MTN)
5.65% November 16, 2035 2,554 2,499 3,1026.65% April 15, 2038 1,404 1,636 1,9455.75% November 24, 2039 1,954 2,140 2,4454.55% February 28, 2042 2,472 2,499 2,624
Fairfax Financial Holdings, Ltd.7.25% June 22, 2020 1,955 1,955 2,2286.40% May 25, 2021 1,531 1,526 1,665
Fifth Avenue, LP4.71% August 05, 2021 3,454 3,454 3,700
Finning International, Inc., (MTN)5.08% June 13, 2042 1,259 1,259 1,310
First Capital Realty, Inc.5.48% July 30, 2019 1,954 1,956 2,1865.60% April 30, 2020 879 882 9943.95% December 05, 2022 900 895 894
First Capital Realty, Inc., Series E,Note, (MTN)5.36% January 31, 2014 2,624 2,584 2,710
Ford Credit Canada, Ltd.4.88% March 17, 2014 2,766 2,881 2,8537.50% August 18, 2015 3,062 3,431 3,4274.88% February 08, 2017 3,260 3,464 3,4653.32% December 19, 2017 3,700 3,698 3,691
FortisAlberta, Inc.7.06% February 14, 2039 988 1,511 1,509
FortisAlberta, Inc., (MTN)5.85% April 15, 2038 741 980 9795.37% October 30, 2039 1,767 1,776 2,2184.54% October 18, 2041 988 988 1,1074.99% January 03, 2047 1,256 1,255 1,5314.80% October 27, 2050 977 976 1,161
FortisAlberta, Inc., Senior Note6.22% October 31, 2034 1,821 1,971 2,455
FortisBC, Inc., (MTN)6.10% June 02, 2039 494 619 6655.00% November 24, 2050 967 1,049 1,163
FortisBC, Inc., Note5.60% November 09, 2035 1,481 1,472 1,844
Gaz Metro, Inc., Guaranteed Note5.45% July 12, 2021 3,306 3,850 3,958
Gaz Metro, LP, Secured Note, Series I(MTN)7.05% October 30, 2030 163 230 229
Gaz Metro, LP, Series D, Note10.45% October 31, 2016 3,594 5,155 4,640
GE Capital Canada Funding Co.2.95% February 10, 2014 1,954 1,952 1,983
GE Capital Canada Funding Co., (MTN)4.40% June 01, 2014 8,680 8,536 9,0074.24% June 08, 2015 5,108 5,137 5,3883.35% November 23, 2016 4,707 4,701 4,8875.53% August 17, 2017 15,515 16,062 17,5683.55% June 11, 2019 1,975 1,971 2,051
Security
Par
value
Average
cost
Fair
value
(in 000s) (in $000s) (in $000s)
Corporate (continued)5.68% September 10, 2019 977 1,040 1,1394.60% January 26, 2022 2,469 2,468 2,7255.73% October 22, 2037 7,399 7,301 9,130
GE Capital Canada Funding Co.,Note, (MTN)4.55% January 17, 2017 684 688 741
Genworth MI Canada, Inc.4.59% December 15, 2015 1,322 1,322 1,358
George Weston, Ltd.5.05% March 10, 2014 2,344 2,470 2,4266.69% March 01, 2033 988 1,106 1,130
George Weston, Ltd., (MTN)3.78% October 25, 2016 2,025 2,037 2,1167.10% February 05, 2032 965 1,079 1,145
Glacier Credit Card Trust3.16% November 20, 2015 780 780 8062.39% April 20, 2020 3,655 3,655 3,662
Golden Credit Card Trust3.51% May 15, 2016 13,051 13,051 13,693
Great-West Lifeco Finance Delaware,LP II7.13% June 26, 2068(1) 2,648 3,001 3,147
Great-West Lifeco Finance Delaware,LP, Subordinated Note5.69% June 21, 2067(1) 5,261 5,128 5,785
Great-West Lifeco, Inc.4.65% August 13, 2020 3,241 3,241 3,599
Great-West Lifeco, Inc., Note6.67% March 21, 2033 3,792 4,325 4,8456.00% November 16, 2039 1,955 1,965 2,436
Great-West Lifeco, Inc., SeniorUnsecured Note6.14% March 21, 2018 2,245 2,468 2,623
Greater Toronto Airports Authority3.04% September 21, 2022 1,185 1,185 1,201
Greater Toronto Airports Authority,(MTN)4.70% February 15, 2016 5,819 5,823 6,3114.85% June 01, 2017 3,792 3,928 4,2275.26% April 17, 2018 3,257 3,728 3,7407.05% June 12, 2030 6,166 6,532 8,6407.10% June 04, 2031 4,493 4,934 6,4036.47% February 02, 2034 3,062 4,133 4,1895.63% June 07, 2040 2,833 2,982 3,6775.30% February 25, 2041 3,537 3,536 4,412
Greater Toronto Airports Authority,Note6.45% December 03, 2027 3,444 3,357 4,523
Greater Toronto Airports Authority,Note, (MTN)6.45% July 30, 2029 1,609 2,002 2,010
H&R REIT4.78% July 27, 2016 1,807 1,811 1,908
Halifax International Airport Authority4.89% November 15, 2050 2,028 2,028 2,410
The accompanying notes are an integral part of the financial statements. 124
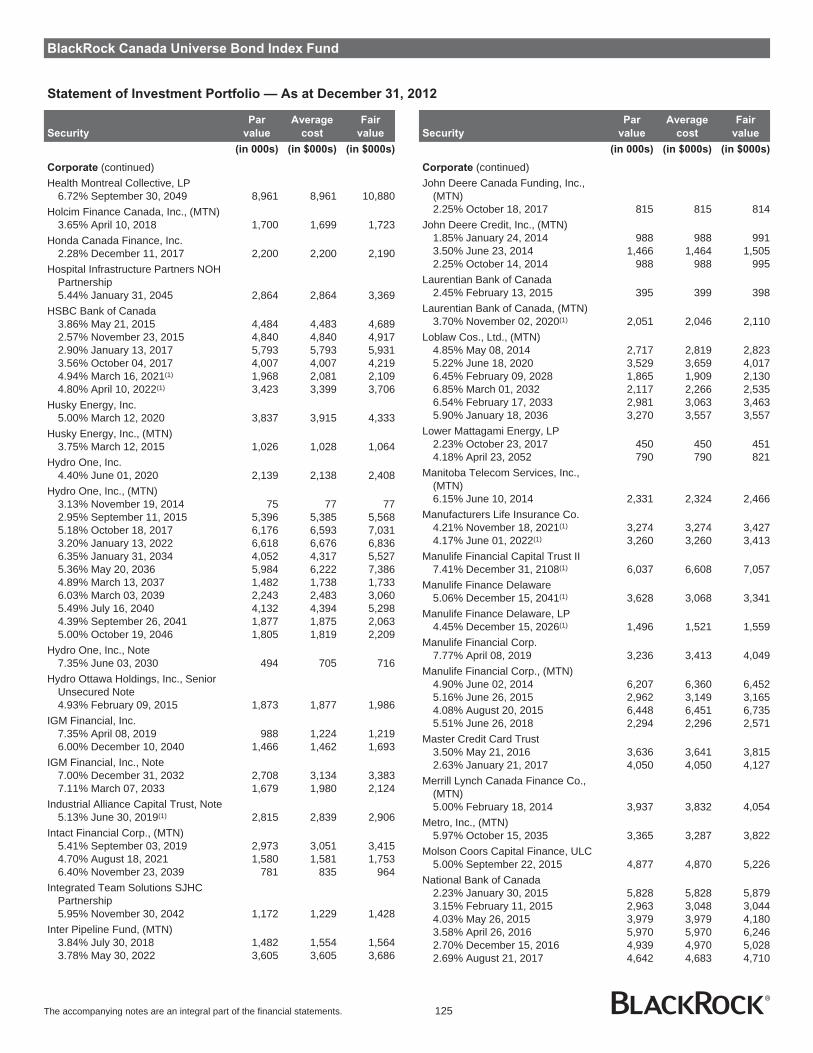
BlackRock Canada Universe Bond Index Fund
Statement of Investment Portfolio — As at December 31, 2012
Security
Par
value
Average
cost
Fair
value
(in 000s) (in $000s) (in $000s)
Corporate (continued)Health Montreal Collective, LP
6.72% September 30, 2049 8,961 8,961 10,880Holcim Finance Canada, Inc., (MTN)
3.65% April 10, 2018 1,700 1,699 1,723Honda Canada Finance, Inc.
2.28% December 11, 2017 2,200 2,200 2,190Hospital Infrastructure Partners NOH
Partnership5.44% January 31, 2045 2,864 2,864 3,369
HSBC Bank of Canada3.86% May 21, 2015 4,484 4,483 4,6892.57% November 23, 2015 4,840 4,840 4,9172.90% January 13, 2017 5,793 5,793 5,9313.56% October 04, 2017 4,007 4,007 4,2194.94% March 16, 2021(1) 1,968 2,081 2,1094.80% April 10, 2022(1) 3,423 3,399 3,706
Husky Energy, Inc.5.00% March 12, 2020 3,837 3,915 4,333
Husky Energy, Inc., (MTN)3.75% March 12, 2015 1,026 1,028 1,064
Hydro One, Inc.4.40% June 01, 2020 2,139 2,138 2,408
Hydro One, Inc., (MTN)3.13% November 19, 2014 75 77 772.95% September 11, 2015 5,396 5,385 5,5685.18% October 18, 2017 6,176 6,593 7,0313.20% January 13, 2022 6,618 6,676 6,8366.35% January 31, 2034 4,052 4,317 5,5275.36% May 20, 2036 5,984 6,222 7,3864.89% March 13, 2037 1,482 1,738 1,7336.03% March 03, 2039 2,243 2,483 3,0605.49% July 16, 2040 4,132 4,394 5,2984.39% September 26, 2041 1,877 1,875 2,0635.00% October 19, 2046 1,805 1,819 2,209
Hydro One, Inc., Note7.35% June 03, 2030 494 705 716
Hydro Ottawa Holdings, Inc., SeniorUnsecured Note4.93% February 09, 2015 1,873 1,877 1,986
IGM Financial, Inc.7.35% April 08, 2019 988 1,224 1,2196.00% December 10, 2040 1,466 1,462 1,693
IGM Financial, Inc., Note7.00% December 31, 2032 2,708 3,134 3,3837.11% March 07, 2033 1,679 1,980 2,124
Industrial Alliance Capital Trust, Note5.13% June 30, 2019(1) 2,815 2,839 2,906
Intact Financial Corp., (MTN)5.41% September 03, 2019 2,973 3,051 3,4154.70% August 18, 2021 1,580 1,581 1,7536.40% November 23, 2039 781 835 964
Integrated Team Solutions SJHCPartnership5.95% November 30, 2042 1,172 1,229 1,428
Inter Pipeline Fund, (MTN)3.84% July 30, 2018 1,482 1,554 1,5643.78% May 30, 2022 3,605 3,605 3,686
Security
Par
value
Average
cost
Fair
value
(in 000s) (in $000s) (in $000s)
Corporate (continued)John Deere Canada Funding, Inc.,
(MTN)2.25% October 18, 2017 815 815 814
John Deere Credit, Inc., (MTN)1.85% January 24, 2014 988 988 9913.50% June 23, 2014 1,466 1,464 1,5052.25% October 14, 2014 988 988 995
Laurentian Bank of Canada2.45% February 13, 2015 395 399 398
Laurentian Bank of Canada, (MTN)3.70% November 02, 2020(1) 2,051 2,046 2,110
Loblaw Cos., Ltd., (MTN)4.85% May 08, 2014 2,717 2,819 2,8235.22% June 18, 2020 3,529 3,659 4,0176.45% February 09, 2028 1,865 1,909 2,1306.85% March 01, 2032 2,117 2,266 2,5356.54% February 17, 2033 2,981 3,063 3,4635.90% January 18, 2036 3,270 3,557 3,557
Lower Mattagami Energy, LP2.23% October 23, 2017 450 450 4514.18% April 23, 2052 790 790 821
Manitoba Telecom Services, Inc.,(MTN)6.15% June 10, 2014 2,331 2,324 2,466
Manufacturers Life Insurance Co.4.21% November 18, 2021(1) 3,274 3,274 3,4274.17% June 01, 2022(1) 3,260 3,260 3,413
Manulife Financial Capital Trust II7.41% December 31, 2108(1) 6,037 6,608 7,057
Manulife Finance Delaware5.06% December 15, 2041(1) 3,628 3,068 3,341
Manulife Finance Delaware, LP4.45% December 15, 2026(1) 1,496 1,521 1,559
Manulife Financial Corp.7.77% April 08, 2019 3,236 3,413 4,049
Manulife Financial Corp., (MTN)4.90% June 02, 2014 6,207 6,360 6,4525.16% June 26, 2015 2,962 3,149 3,1654.08% August 20, 2015 6,448 6,451 6,7355.51% June 26, 2018 2,294 2,296 2,571
Master Credit Card Trust3.50% May 21, 2016 3,636 3,641 3,8152.63% January 21, 2017 4,050 4,050 4,127
Merrill Lynch Canada Finance Co.,(MTN)5.00% February 18, 2014 3,937 3,832 4,054
Metro, Inc., (MTN)5.97% October 15, 2035 3,365 3,287 3,822
Molson Coors Capital Finance, ULC5.00% September 22, 2015 4,877 4,870 5,226
National Bank of Canada2.23% January 30, 2015 5,828 5,828 5,8793.15% February 11, 2015 2,963 3,048 3,0444.03% May 26, 2015 3,979 3,979 4,1803.58% April 26, 2016 5,970 5,970 6,2462.70% December 15, 2016 4,939 4,970 5,0282.69% August 21, 2017 4,642 4,683 4,710
The accompanying notes are an integral part of the financial statements. 125

BlackRock Canada Universe Bond Index Fund
Statement of Investment Portfolio — As at December 31, 2012
Security
Par
value
Average
cost
Fair
value
(in 000s) (in $000s) (in $000s)
Corporate (continued)National Bank of Canada, (MTN)
4.93% December 22, 2019(1) 4,850 4,966 5,1304.70% November 02, 2020(1) 986 1,051 1,0543.26% April 11, 2022(1) 2,963 2,963 3,052
NAV Canada4.40% February 18, 2021 1,268 1,268 1,428
NAV Canada, (MTN)4.71% February 24, 2016 2,455 2,606 2,668
NAV Canada, Note7.56% March 01, 2027 4,154 4,967 5,338
NBC Asset Trust7.45% June 30, 2020(1) 3,470 3,505 4,349
Northwestconnect Group5.95% April 30, 2041 1,912 1,910 2,361
NOVA Gas Transmission, Ltd.,Series 21, Note12.20% February 28, 2016 6,386 9,851 8,266
Nova Scotia Power, Inc., (MTN)5.67% November 14, 2035 988 1,207 1,2345.95% July 27, 2039 831 828 1,0935.61% June 15, 2040 1,838 1,843 2,3294.15% March 06, 2042 2,117 2,115 2,168
Nova Scotia Power, Inc., Series S,Note, (MTN)6.95% August 25, 2033 1,185 1,646 1,673
Ontario Electricity Financial Corp.10.13% October 15, 2021 608 961 962
Ontario Electricity Financial Corp.,Note10.00% February 06, 2020 1,400 2,131 2,087
Ontario Electricity Financial Corp.,Series DJ5, Note10.00% October 17, 2014 5,995 7,947 6,905
Ontario Electricity Financial Corp.,Series FV6, Note8.90% August 18, 2022 4,970 6,980 7,484
Ontario School Boards FinancingCorp.5.38% June 25, 2032 5,328 5,337 6,089
Ontario School Boards FinancingCorp., Note5.48% November 26, 2029 5,740 5,870 6,6685.07% April 18, 2031 5,351 5,290 5,973
Ontario School Boards FinancingCorp., Series 01A26.25% October 19, 2016 1,224 1,333 1,411
Ottawa MacDonald-CartierInternational Airport Authority, Note4.73% May 02, 2017 2,833 2,833 3,120
Pembina Pipeline Corp. (MTN)4.89% March 29, 2021 1,949 1,949 2,152
Plenary Health Bridgepoint, LP7.25% August 31, 2042 1,427 1,898 2,008
Plenary Health Care PartnershipsHumber, LP4.82% November 30, 2044 5,851 5,858 6,350
Security
Par
value
Average
cost
Fair
value
(in 000s) (in $000s) (in $000s)
Corporate (continued)Plenary Health Hamilton, LP
5.80% May 31, 2043 1,400 1,613 1,643Plenary Properties LTAP, LP
3.80% November 18, 2015 1,605 1,666 1,6426.29% January 31, 2044 5,200 5,503 6,799
Power Corp. Canada7.57% April 22, 2019 4,181 4,407 5,1958.57% April 22, 2039 988 1,383 1,498
Power Financial Corp., Note6.90% March 11, 2033 1,800 2,020 2,328
Reliance, LP4.57% March 15, 2017 1,000 1,000 1,0085.19% March 15, 2019 1,500 1,500 1,511
RioCan Real Estate Investment Trust4.50% January 21, 2016 1,269 1,270 1,3393.72% December 13, 2021 1,500 1,504 1,495
Rogers Communications, Inc.5.80% May 26, 2016 6,504 6,636 7,2323.00% June 06, 2017 3,951 3,948 4,0295.38% November 04, 2019 1,757 1,756 2,0074.70% September 29, 2020 4,419 4,417 4,8735.34% March 22, 2021 9,225 9,418 10,5614.00% June 06, 2022 3,951 3,935 4,1176.11% August 25, 2040 6,640 6,707 7,794
Rogers Communications, Inc., (MTN)6.56% March 22, 2041 2,222 2,222 2,764
RONA, Inc., Note5.40% October 20, 2016 2,737 2,731 2,890
Royal Bank of Canada5.00% January 20, 2014 1,975 2,080 2,0482.05% January 13, 2015 8,328 8,323 8,3793.36% January 11, 2016 18,155 18,144 18,8733.03% July 26, 2016 8,443 8,440 8,7062.68% December 08, 2016 10,316 10,324 10,5103.66% January 25, 2017 10,675 10,671 11,2722.58% April 13, 2017 11,359 11,357 11,5142.36% September 21, 2017 10,964 10,964 10,9923.77% March 30, 2018 3,358 3,552 3,6102.98% May 07, 2019 5,679 5,679 5,8184.35% June 15, 2020(1) 5,689 5,687 6,0023.18% November 02, 2020(1) 8,621 8,624 8,8672.99% December 06, 2024(1) 8,000 8,000 8,0424.93% July 16, 2025 5,678 5,946 6,660
Royal Bank of Canada, (MTN)3.18% March 16, 2015 9,051 9,319 9,342
Royal Bank of Canada, Senior Note4.97% June 05, 2014 5,033 5,420 5,278
Royal Bank of Canada, Series 2014,Subordinated Note5.95% June 18, 2103 6,034 6,196 6,379
Score Trust, Series 2004-1, Note4.95% February 20, 2017 2,321 2,284 2,400
Scotiabank Capital Trust, Series 06-15.65% December 31, 2056(1) 4,712 4,740 5,713
Scotiabank Tier I Capital Trust7.80% June 30, 2108(1) 3,661 3,879 4,628
The accompanying notes are an integral part of the financial statements. 126

BlackRock Canada Universe Bond Index Fund
Statement of Investment Portfolio — As at December 31, 2012
Security
Par
value
Average
cost
Fair
value
(in 000s) (in $000s) (in $000s)
Corporate (continued)Shaw Communications, Inc.
6.50% June 02, 2014 3,577 3,919 3,7895.65% October 01, 2019 7,364 7,656 8,2795.50% December 07, 2020 2,759 2,873 3,0836.75% November 09, 2039 9,997 9,990 11,101
Shaw Communications, Inc.,Series N, Senior Note6.15% May 09, 2016 3,768 3,644 4,176
SNC-Lavalin Group, Inc.6.19% July 03, 2019 3,340 3,634 3,831
SNC-Lavalin Innisfree McGillFinance, Inc.6.63% June 30, 2044 4,433 5,451 5,621
Sobeys, Inc., (MTN)6.64% June 07, 2040 1,072 1,071 1,261
SP LP/SP1, LP3.21% June 15, 2019 3,374 3,374 3,402
Sun Life Capital Trust II5.86% December 31, 2108 2,637 2,637 2,886
Sun Life Financial, Inc.5.70% July 02, 2019 1,946 2,077 2,2494.57% August 23, 2021 4,765 4,763 5,1744.95% June 01, 2036(1) 8,960 9,172 9,474
Sun Life Financial, Inc., (MTN)7.90% March 31, 2019(1) 1,879 2,025 2,0014.38% March 02, 2022(1) 1,087 1,105 1,1395.59% January 30, 2023(1) 2,241 2,268 2,4725.40% May 29, 2042(1) 855 820 850
Sun Life Financial, Inc., Senior Note,(MTN)4.80% November 23, 2035(1) 3,157 3,224 3,306
Suncor Energy, Inc., (MTN)5.80% May 22, 2018 2,766 3,215 3,2045.39% March 26, 2037 4,218 4,182 4,898
TD Capital Trust III7.24% December 31, 2018(1) 1,580 1,930 1,960
TD Capital Trust IV9.52% June 30, 2108(1) 3,735 4,899 5,0906.63% June 30, 2108(1) 6,471 7,429 7,942
TELUS Corp.4.95% May 15, 2014 4,272 4,432 4,4533.65% May 25, 2016 4,556 4,695 4,7714.95% March 15, 2017 3,241 3,420 3,5755.05% December 04, 2019 5,595 5,785 6,3655.05% July 23, 2020 5,954 6,147 6,790
TELUS Corp., Senior UnsecuredNote5.95% April 15, 2015 2,084 2,113 2,268
Teranet Holdings, LP3.53% December 16, 2015 2,823 2,823 2,9204.81% December 16, 2020 5,888 6,222 6,5485.75% December 17, 2040 2,704 2,704 3,0556.10% June 17, 2041 2,749 2,748 3,262
Terasen Gas Vancouver Island, Inc.5.20% December 06, 2040 1,024 1,021 1,227
Security
Par
value
Average
cost
Fair
value
(in 000s) (in $000s) (in $000s)
Corporate (continued)Terasen Gas Vancouver Island, Inc.,
Senior Unsecured Note6.05% February 15, 2038 1,046 1,158 1,387
Terasen Gas, Inc., (MTN)6.55% February 24, 2039 2,864 3,817 4,155
Terasen Gas, Inc., Note, (MTN)5.90% February 26, 2035 1,955 2,221 2,562
Terasen Gas, Inc., Senior Note,(MTN)5.80% May 13, 2038 1,738 1,600 2,300
Terasen Gas, Inc., Series B, Note10.30% September 30, 2016 1,658 2,268 2,124
Thomson Reuters Corp.5.20% December 01, 2014 5,043 5,060 5,3595.70% July 15, 2015 3,113 3,154 3,4006.00% March 31, 2016 5,537 6,206 6,1874.35% September 30, 2020 4,985 5,402 5,451
Tim Hortons, Inc.4.20% June 01, 2017 1,270 1,296 1,374
Toronto Hospital, Series DOM1,Note5.64% December 08, 2022 217 248 247
Toronto Hydro Corp.4.49% November 12, 2019 2,838 2,916 3,1763.54% November 18, 2021 2,469 2,468 2,593
Toronto Hydro Corp., Note5.15% November 14, 2017 2,923 2,935 3,325
Toronto-Dominion Bank2.95% August 02, 2016 12,308 12,332 12,712
Toronto-Dominion Bank, (MTN)5.48% April 02, 2020(1) 5,044 5,198 5,4333.37% November 02, 2020(1) 3,736 3,739 3,8635.83% July 09, 2023(1) 3,735 4,053 4,3674.97% October 30, 2104(1) 6,148 6,213 6,6154.78% December 14, 2105(1) 21,742 20,210 23,669
Toronto-Dominion Bank, Note10.05% August 04, 2014 454 611 5109.15% May 26, 2025 1,320 1,875 2,058
Toyota Credit Canada, Inc.2.45% February 27, 2017 2,074 2,074 2,095
Toyota Credit Canada, Inc., (MTN)3.55% February 22, 2016 2,173 2,273 2,2732.20% October 19, 2017 1,975 1,968 1,969
TransAlta Corp., (MTN)6.45% May 29, 2014 889 947 9306.40% November 18, 2019 698 772 7747.30% October 22, 2029 2,452 2,899 2,612
TransAlta Corp., Note, (MTN)6.90% November 15, 2030(1) 2,053 2,158 2,110
TransCanada PipeLines, Ltd.8.05% February 17, 2039 2,371 3,429 3,860
TransCanada PipeLines, Ltd., (MTN)5.65% January 15, 2014 3,574 3,876 3,7235.05% February 14, 2014 198 209 2054.65% October 03, 2016 3,002 3,015 3,2783.65% November 15, 2021 3,035 3,035 3,2334.55% November 15, 2041 1,677 1,667 1,836
The accompanying notes are an integral part of the financial statements. 127

BlackRock Canada Universe Bond Index Fund
Statement of Investment Portfolio — As at December 31, 2012
Security
Par
value
Average
cost
Fair
value
(in 000s) (in $000s) (in $000s)
Corporate (continued)TransCanada PipeLines, Ltd., Note,
(MTN)8.29% February 05, 2026 2,754 3,322 4,0437.90% April 15, 2027 2,333 2,829 3,3636.50% December 09, 2030 1,386 1,406 1,818
Union Gas, Ltd.8.65% November 10, 2025 2,339 3,294 3,5634.88% June 21, 2041 1,873 1,871 2,200
Union Gas, Ltd., (MTN)4.64% June 30, 2016 593 657 6444.85% April 25, 2022 988 1,124 1,1346.05% September 02, 2038 395 488 5315.20% July 23, 2040 1,034 1,197 1,259
Union Gas, Ltd., Series 1992, Note9.70% November 06, 2017 3,553 4,828 4,690
Union Gas, Ltd., Series 1993, Note8.75% August 03, 2018 2,960 3,755 3,883
Union Gas, Ltd., Series 19947.90% February 24, 2014 395 434 422
Vancouver International AirportAuthority7.43% December 07, 2026(1) 988 1,403 1,412
Veresen, Inc.5.60% July 28, 2014 2,437 2,581 2,546
Veresen, Inc., (MTN)3.95% March 14, 2017 1,185 1,184 1,222
VW Credit Canada, Inc.3.60% February 01, 2016 489 489 5112.20% October 11, 2016 2,469 2,467 2,4672.90% June 01, 2017 2,074 2,077 2,119
Wells Fargo Canada Corp., (MTN)2.94% July 25, 2019 3,951 3,951 3,986
Wells Fargo Financial Canada Corp.3.97% November 03, 2014 7,103 7,105 7,378
Wells Fargo Financial Canada Corp.,(MTN)4.38% June 30, 2015 4,910 5,082 5,1953.70% March 30, 2016 3,748 3,746 3,9252.77% February 09, 2017 14,075 14,092 14,315
Westcoast Energy, Inc.3.28% January 15, 2016 3,443 3,435 3,5639.90% January 10, 2020 988 1,417 1,4104.57% July 02, 2020 1,216 1,244 1,3573.12% December 05, 2022 3,000 2,999 2,984
Westcoast Energy, Inc., (MTN)5.60% January 16, 2019 2,148 2,360 2,5013.88% October 28, 2021 1,393 1,409 1,4877.15% March 20, 2031 2,950 3,136 4,1354.79% October 28, 2041 1,037 1,067 1,167
Security
Par
value
Average
cost
Fair
value
(in 000s) (in $000s) (in $000s)
Corporate (continued)Winnipeg Airport Authority, Inc.
4.57% November 20, 2019 988 1,110 1,103
Total Corporate 1,826,599 1,947,997
Total Fixed Income Investments 6,247,376 6,631,030
Total Investments 6,247,376 6,631,030
Other Assets and Liabilities — 0.7% 42,760
Net Assets 6,673,790
(1) Variable rate security. Rate shown is as at report date.
Portfolio Concentration
(as a percentage of Net Assets)
Portfolio by Category
As at
December 31, 2012
As at
December 31, 2011
(%) (%)
Federal Non-Agency 28.5 30.4Federal Agency 11.6 12.6Government Guaranteed 0.1 0.2Municipal 2.0 1.7Provincial 27.9 26.5Corporate 29.2 28.0Other Assets and Liabilities 0.7 0.6
The accompanying notes are an integral part of the financial statements. 128
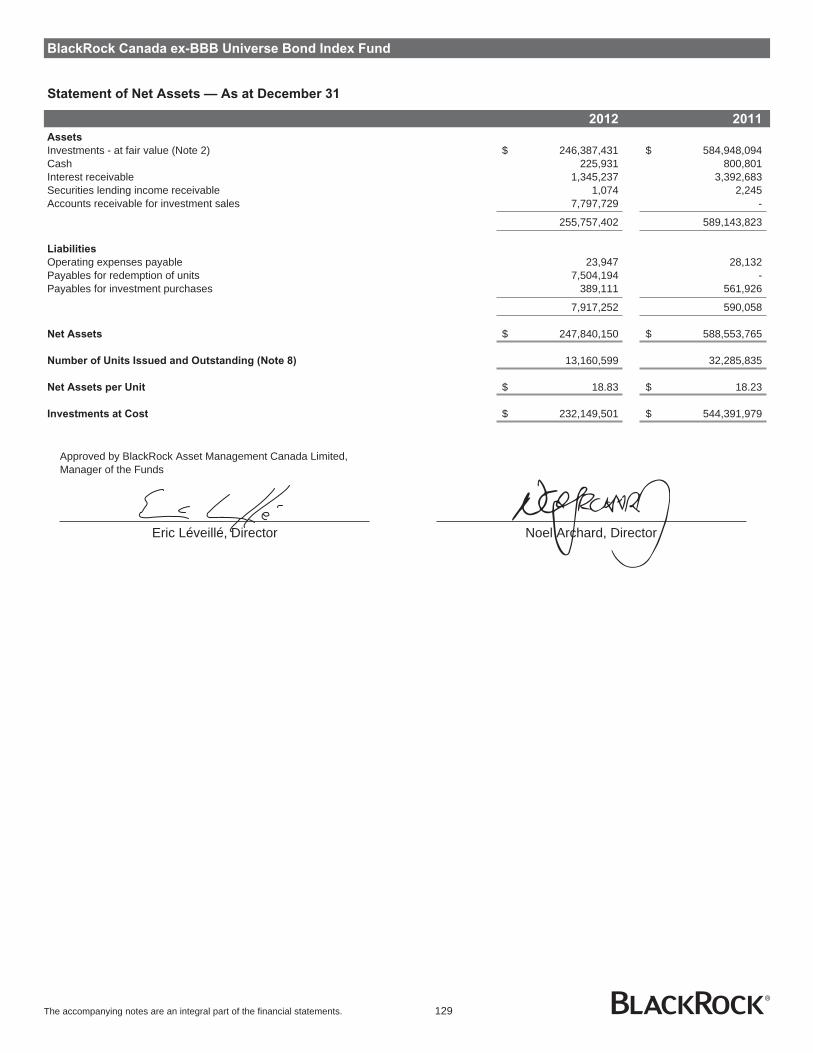
BlackRock Canada ex-BBB Universe Bond Index Fund
Statement of Net Assets — As at December 31
2012 2011
Assets
Investments - at fair value (Note 2) $ 246,387,431 $ 584,948,094Cash 225,931 800,801Interest receivable 1,345,237 3,392,683Securities lending income receivable 1,074 2,245Accounts receivable for investment sales 7,797,729 -
255,757,402 589,143,823
Liabilities
Operating expenses payable 23,947 28,132Payables for redemption of units 7,504,194 -Payables for investment purchases 389,111 561,926
7,917,252 590,058
Net Assets $ 247,840,150 $ 588,553,765
Number of Units Issued and Outstanding (Note 8) 13,160,599 32,285,835
Net Assets per Unit $ 18.83 $ 18.23
Investments at Cost $ 232,149,501 $ 544,391,979
Approved by BlackRock Asset Management Canada Limited,Manager of the Funds
Eric Léveillé, Director Noel Archard, Director
The accompanying notes are an integral part of the financial statements. 129

BlackRock Canada ex-BBB Universe Bond Index Fund
Statement of Operations — For the Years Ended December 31
2012 2011
Revenue
Interest income $ 10,907,772 $ 23,632,556Securities lending income 15,787 21,551
10,923,559 23,654,107
Expenses
Custodian fees 13,900 17,745Fund accounting expenses 41,724 59,103Unitholder communication costs - 601Audit fees 17,214 18,326Securities filing fees 5,008 8,923Independent review committee fees 164 681Other operating expenses 1,315 2,635
79,325 108,014
Net Investment Income for the Year 10,844,234 23,546,093
Gain (Loss) on Investments
Net realized gain on sale of investments 23,395,494 5,514,143Net change in unrealized appreciation (depreciation) in value of investments (26,318,185) 27,942,191
Net Gain (Loss) on Investments (2,922,691) 33,456,334
Increase in Net Assets from Operations $ 7,921,543 $ 57,002,427
Increase in Net Assets from Operations per Unit $ 0.48 $ 1.63
Statement of Changes in Net Assets — For the Years Ended December 31
2012 2011
Net Assets - Beginning of Year $ 588,553,765 $ 604,568,362
Increase in Net Assets from Operations 7,921,543 57,002,427
Capital Transactions
Proceeds from issue of units 60,000 7,516,605Reinvestment of distributions 33,806,578 29,462,482Redemption of units (348,695,158) (80,533,629)
Net capital transactions (314,828,580) (43,554,542)
Distributions
From net investment income (10,845,272) (23,544,526)From capital gains (3,647,285) (5,917,956)From capital gains redemption in kind (Note 9) (19,314,021) -
Total distributions (33,806,578) (29,462,482)
Decrease in Net Assets for the Year (340,713,615) (16,014,597)
Net Assets - End of Year $ 247,840,150 $ 588,553,765
The accompanying notes are an integral part of the financial statements. 130

BlackRock Canada ex-BBB Universe Bond Index Fund
Statement of Investment Portfolio — As at December 31, 2012
Security
Par
value
Average
cost
Fair
value
(in 000s) (in $000s) (in $000s)
Fixed Income Investments
Government Federal
Non-Agency — 31.0%
Government of Canada1.00% February 01, 2014 1,110 1,111 1,1092.00% March 01, 2014 1,808 1,815 1,8260.75% May 01, 2014 1,880 1,865 1,8715.00% June 01, 2014 1,645 1,810 1,7343.00% June 01, 2014 2,839 2,922 2,9132.25% August 01, 2014 2,850 2,920 2,9001.00% November 01, 2014 1,750 1,746 1,7462.00% December 01, 2014 3,322 3,393 3,3751.00% February 01, 2015 2,588 2,583 2,5804.50% June 01, 2015 1,868 2,024 2,0162.50% June 01, 2015 2,130 2,173 2,1981.50% August 01, 2015 1,506 1,518 1,5173.00% December 01, 2015 2,370 2,456 2,4891.25% February 01, 2016 1,000 999 9994.00% June 01, 2016 1,837 1,904 2,0022.00% June 01, 2016 2,066 2,027 2,1142.75% September 01, 2016 1,964 2,081 2,0631.50% March 01, 2017 1,893 1,905 1,9044.00% June 01, 2017 2,068 2,281 2,3001.50% September 01, 2017 1,851 1,860 1,8611.25% March 01, 2018 600 597 5954.25% June 01, 2018 2,034 2,290 2,3313.75% June 01, 2019 3,617 3,896 4,1013.50% June 01, 2020 2,725 2,821 3,07910.50% March 15, 2021 23 37 393.25% June 01, 2021 2,331 2,546 2,6122.75% June 01, 2022 2,321 2,488 2,5118.00% June 01, 2023 533 773 8411.50% June 01, 2023 915 884 8819.00% June 01, 2025 472 770 8348.00% June 01, 2027 632 946 1,0925.75% June 01, 2029 2,149 2,663 3,1935.75% June 01, 2033 2,318 2,978 3,6005.00% June 01, 2037 2,575 3,254 3,8104.00% June 01, 2041 3,098 3,848 4,1413.50% December 01, 2045 1,356 1,607 1,709
73,791 76,886
Federal Agency — 12.8%
Asian Development Bank, SeriesMPLE, Senior Unsecured Note4.65% February 16, 2027 188 200 219
Canada Housing Trust2.20% March 15, 2014 1,425 1,405 1,4433.15% June 15, 2014 2,200 2,237 2,2622.75% September 15, 2014 1,000 1,032 1,0262.75% December 15, 2014 2,125 2,116 2,1872.95% March 15, 2015 700 712 7253.15% June 15, 2015 1,100 1,125 1,1494.10% December 15, 2018 1,705 1,803 1,9223.75% March 15, 2020 1,170 1,198 1,3063.35% December 15, 2020 1,115 1,125 1,216Canada Housing Trust No 12.75% December 15, 2015 1,310 1,309 1,3612.45% December 15, 2015 1,180 1,162 1,2162.75% June 15, 2016 3,050 3,055 3,179
Security
Par
value
Average
cost
Fair
value
(in 000s) (in $000s) (in $000s)
Federal Agency (continued)1.85% December 15, 2016 2,400 2,419 2,4262.05% June 15, 2017 2,100 2,116 2,1371.70% December 15, 2017 2,250 2,248 2,2503.80% June 15, 2021 1,700 1,749 1,9132.65% March 15, 2022 1,460 1,473 1,5062.40% December 15, 2022 900 903 906
Canada Post Corp.4.08% July 16, 2025 141 143 164
Inter-American Development Bank,Note4.75% November 17, 2014 100 108 1064.40% January 26, 2026 235 228 267
Royal Office Finance LP, Series A,Note5.21% November 12, 2037 468 468 555
South Coast British ColumbiaTransportation Authority3.80% November 02, 2020 94 94 1004.65% June 20, 2041 47 53 543.85% February 09, 2052 50 51 51
30,532 31,646
Municipal — 2.3%
Alberta Capital Finance Authority,Note3.05% June 15, 2015 228 227 2374.35% June 15, 2016 188 187 206
City of Montreal5.00% December 01, 2018 235 245 2655.45% December 01, 2019 150 175 1744.50% December 01, 2021 85 84 936.00% June 01, 2043 141 142 192
City of Toronto4.55% May 20, 2015 188 190 2014.85% July 28, 2016 158 157 1744.50% December 02, 2019 235 235 2626.80% July 26, 2021 94 119 1213.50% December 06, 2021 100 102 1045.20% June 01, 2040 188 191 2314.70% June 10, 2041 94 94 108
City of Winnipeg9.13% May 12, 2015 235 316 275
Municipal Finance Authority ofBritish Columbia4.65% April 19, 2016 375 376 4103.00% June 01, 2016 141 141 1474.80% December 01, 2017 275 291 3104.88% June 03, 2019 235 234 2694.45% June 01, 2020 235 235 2644.15% June 01, 2021 41 41 453.35% June 01, 2022 100 104 1034.95% December 01, 2027 94 94 110
Peel Regional Municipality5.10% June 29, 2040 164 167 2003.85% October 30, 2042 60 60 61
PSP Capital, Inc.2.94% December 03, 2015 463 463 4782.26% February 16, 2017 191 191 193
The accompanying notes are an integral part of the financial statements. 131

BlackRock Canada ex-BBB Universe Bond Index Fund
Statement of Investment Portfolio — As at December 31, 2012
Security
Par
value
Average
cost
Fair
value
(in 000s) (in $000s) (in $000s)
Municipal (continued)Regional Municipality of York
4.50% June 30, 2020 158 158 1764.00% June 30, 2021 100 105 1084.00% May 31, 2032 50 51 51
Ville Montreal5.00% December 01, 2017 47 47 53
5,222 5,621
Provincial — 30.1%
Centre Hospitalier de L’universite deMontreal4.45% October 01, 2049 50 50 53
City of Toronto3.80% December 13, 2042 100 100 100
Financement-Quebec4.25% March 01, 2014 485 508 5023.25% June 01, 2014 200 208 2053.50% December 01, 2016 375 385 3993.50% December 01, 2017 493 490 5282.40% December 01, 2018 469 468 4742.45% December 01, 2019 550 550 5515.25% June 01, 2034 150 185 185
Hydro Quebec9.63% July 15, 2022 200 314 3125.00% February 15, 2050 513 637 674
Hydro Quebec, (MTN)6.00% February 15, 2040 273 324 387
Hydro Quebec, Series 19, Note6.50% February 15, 2035 504 608 727
Hydro Quebec, Series HL, Note11.00% August 15, 2020 486 769 769
Hydro Quebec, Series JM, Note5.00% February 15, 2045 346 358 444
Province of Alberta2.75% December 01, 2014 275 273 2831.85% September 01, 2016 141 141 1421.75% June 15, 2017 200 200 2004.00% December 01, 2019 422 434 4722.55% December 15, 2022 200 199 2004.50% December 01, 2040 141 140 174
Province of British Columbia4.25% June 18, 2014 369 391 3854.70% December 01, 2017 188 188 2144.10% December 18, 2019 369 369 4143.70% December 18, 2020 434 433 4769.95% May 15, 2021 141 214 2203.25% December 18, 2021 389 393 4122.70% December 18, 2022 100 100 1008.00% September 08, 2023 141 211 2085.70% June 18, 2029 619 687 8226.35% June 18, 2031 277 328 3965.40% June 18, 2035 135 152 1794.70% June 18, 2037 235 273 2884.30% June 18, 2042 751 772 891
Province of British Columbia,Unsecured Note3.20% June 18, 2044 100 99 98
Security
Par
value
Average
cost
Fair
value
(in 000s) (in $000s) (in $000s)
Provincial (continued)Province of British Columbia, (MTN)
4.65% December 18, 2018 446 466 5124.95% June 18, 2040 463 476 596
Province of Manitoba4.80% December 03, 2014 375 373 4001.85% June 01, 2017 235 235 2364.15% June 03, 2020 235 235 2647.75% December 22, 2025 293 345 4385.70% March 05, 2037 188 224 2594.60% March 05, 2038 235 259 2834.65% March 05, 2040 141 137 1734.10% March 05, 2041 366 349 4163.35% March 05, 2043 100 100 101
Province of Manitoba, (MTN)6.50% September 22, 2017 369 423 446
Province of New Brunswick4.50% February 04, 2015 141 151 1504.70% July 21, 2016 150 168 1666.00% December 27, 2017 305 305 3634.40% June 03, 2019 200 225 2254.50% June 02, 2020 332 344 3783.35% December 03, 2021 270 274 2842.85% June 02, 2023 100 100 1005.65% December 27, 2028 100 126 1295.50% January 27, 2034 141 183 1824.65% September 26, 2035 150 172 1764.55% March 26, 2037 225 213 2614.80% September 26, 2039 193 193 2344.80% June 03, 2041 200 239 2463.55% June 03, 2043 150 150 152
Province of Newfoundland5.25% June 04, 2014 100 108 10610.95% April 15, 2021 141 223 2296.15% April 17, 2028 234 250 3174.65% October 17, 2040 375 364 460
Province of Nova Scotia4.60% August 18, 2016 111 110 1221.90% September 08, 2017 1,188 1,184 1,1894.15% November 25, 2019 231 231 2584.10% June 01, 2021 241 256 2694.90% June 01, 2035 128 147 1564.50% June 01, 2037 164 169 1914.70% June 01, 2041 188 201 2304.40% June 01, 2042 175 193 2063.50% June 02, 2043 1,788 1,818 1,8293.50% June 02, 2062 225 225 229
Province of Nova Scotia, (MTN)5.80% June 01, 2033 117 147 158
Province of Nova Scotia, Series 9Z6.60% June 01, 2027 100 138 139
Province of Ontario5.00% March 08, 2014 1,352 1,425 1,4113.25% September 08, 2014 891 905 9204.50% March 08, 2015 644 688 6873.15% September 08, 2015 410 418 4284.40% March 08, 2016 469 465 5103.20% September 08, 2016 235 234 2484.30% March 08, 2017 1,207 1,281 1,328
The accompanying notes are an integral part of the financial statements. 132
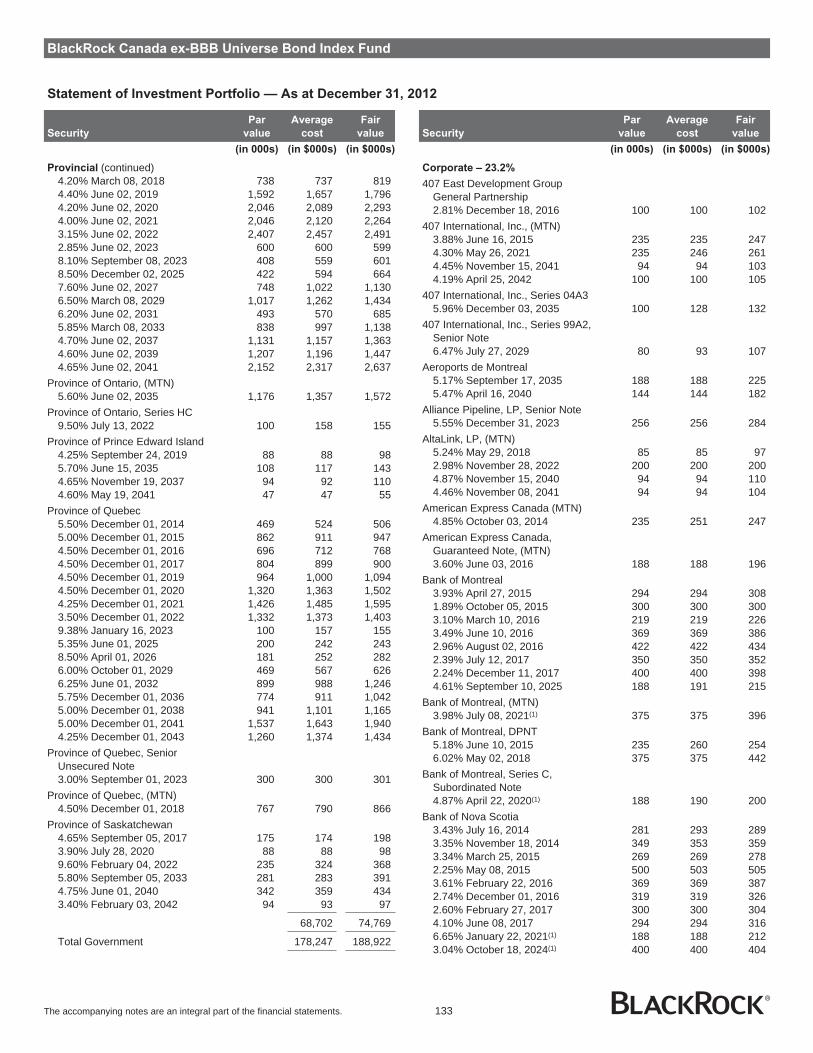
BlackRock Canada ex-BBB Universe Bond Index Fund
Statement of Investment Portfolio — As at December 31, 2012
Security
Par
value
Average
cost
Fair
value
(in 000s) (in $000s) (in $000s)
Provincial (continued)4.20% March 08, 2018 738 737 8194.40% June 02, 2019 1,592 1,657 1,7964.20% June 02, 2020 2,046 2,089 2,2934.00% June 02, 2021 2,046 2,120 2,2643.15% June 02, 2022 2,407 2,457 2,4912.85% June 02, 2023 600 600 5998.10% September 08, 2023 408 559 6018.50% December 02, 2025 422 594 6647.60% June 02, 2027 748 1,022 1,1306.50% March 08, 2029 1,017 1,262 1,4346.20% June 02, 2031 493 570 6855.85% March 08, 2033 838 997 1,1384.70% June 02, 2037 1,131 1,157 1,3634.60% June 02, 2039 1,207 1,196 1,4474.65% June 02, 2041 2,152 2,317 2,637
Province of Ontario, (MTN)5.60% June 02, 2035 1,176 1,357 1,572
Province of Ontario, Series HC9.50% July 13, 2022 100 158 155
Province of Prince Edward Island4.25% September 24, 2019 88 88 985.70% June 15, 2035 108 117 1434.65% November 19, 2037 94 92 1104.60% May 19, 2041 47 47 55
Province of Quebec5.50% December 01, 2014 469 524 5065.00% December 01, 2015 862 911 9474.50% December 01, 2016 696 712 7684.50% December 01, 2017 804 899 9004.50% December 01, 2019 964 1,000 1,0944.50% December 01, 2020 1,320 1,363 1,5024.25% December 01, 2021 1,426 1,485 1,5953.50% December 01, 2022 1,332 1,373 1,4039.38% January 16, 2023 100 157 1555.35% June 01, 2025 200 242 2438.50% April 01, 2026 181 252 2826.00% October 01, 2029 469 567 6266.25% June 01, 2032 899 988 1,2465.75% December 01, 2036 774 911 1,0425.00% December 01, 2038 941 1,101 1,1655.00% December 01, 2041 1,537 1,643 1,9404.25% December 01, 2043 1,260 1,374 1,434
Province of Quebec, SeniorUnsecured Note3.00% September 01, 2023 300 300 301
Province of Quebec, (MTN)4.50% December 01, 2018 767 790 866
Province of Saskatchewan4.65% September 05, 2017 175 174 1983.90% July 28, 2020 88 88 989.60% February 04, 2022 235 324 3685.80% September 05, 2033 281 283 3914.75% June 01, 2040 342 359 4343.40% February 03, 2042 94 93 97
68,702 74,769
Total Government 178,247 188,922
Security
Par
value
Average
cost
Fair
value
(in 000s) (in $000s) (in $000s)
Corporate – 23.2%
407 East Development GroupGeneral Partnership2.81% December 18, 2016 100 100 102
407 International, Inc., (MTN)3.88% June 16, 2015 235 235 2474.30% May 26, 2021 235 246 2614.45% November 15, 2041 94 94 1034.19% April 25, 2042 100 100 105
407 International, Inc., Series 04A35.96% December 03, 2035 100 128 132
407 International, Inc., Series 99A2,Senior Note6.47% July 27, 2029 80 93 107
Aeroports de Montreal5.17% September 17, 2035 188 188 2255.47% April 16, 2040 144 144 182
Alliance Pipeline, LP, Senior Note5.55% December 31, 2023 256 256 284
AltaLink, LP, (MTN)5.24% May 29, 2018 85 85 972.98% November 28, 2022 200 200 2004.87% November 15, 2040 94 94 1104.46% November 08, 2041 94 94 104
American Express Canada (MTN)4.85% October 03, 2014 235 251 247
American Express Canada,Guaranteed Note, (MTN)3.60% June 03, 2016 188 188 196
Bank of Montreal3.93% April 27, 2015 294 294 3081.89% October 05, 2015 300 300 3003.10% March 10, 2016 219 219 2263.49% June 10, 2016 369 369 3862.96% August 02, 2016 422 422 4342.39% July 12, 2017 350 350 3522.24% December 11, 2017 400 400 3984.61% September 10, 2025 188 191 215
Bank of Montreal, (MTN)3.98% July 08, 2021(1) 375 375 396
Bank of Montreal, DPNT5.18% June 10, 2015 235 260 2546.02% May 02, 2018 375 375 442
Bank of Montreal, Series C,Subordinated Note4.87% April 22, 2020(1) 188 190 200
Bank of Nova Scotia3.43% July 16, 2014 281 293 2893.35% November 18, 2014 349 353 3593.34% March 25, 2015 269 269 2782.25% May 08, 2015 500 503 5053.61% February 22, 2016 369 369 3872.74% December 01, 2016 319 319 3262.60% February 27, 2017 300 300 3044.10% June 08, 2017 294 294 3166.65% January 22, 2021(1) 188 188 2123.04% October 18, 2024(1) 400 400 404
The accompanying notes are an integral part of the financial statements. 133
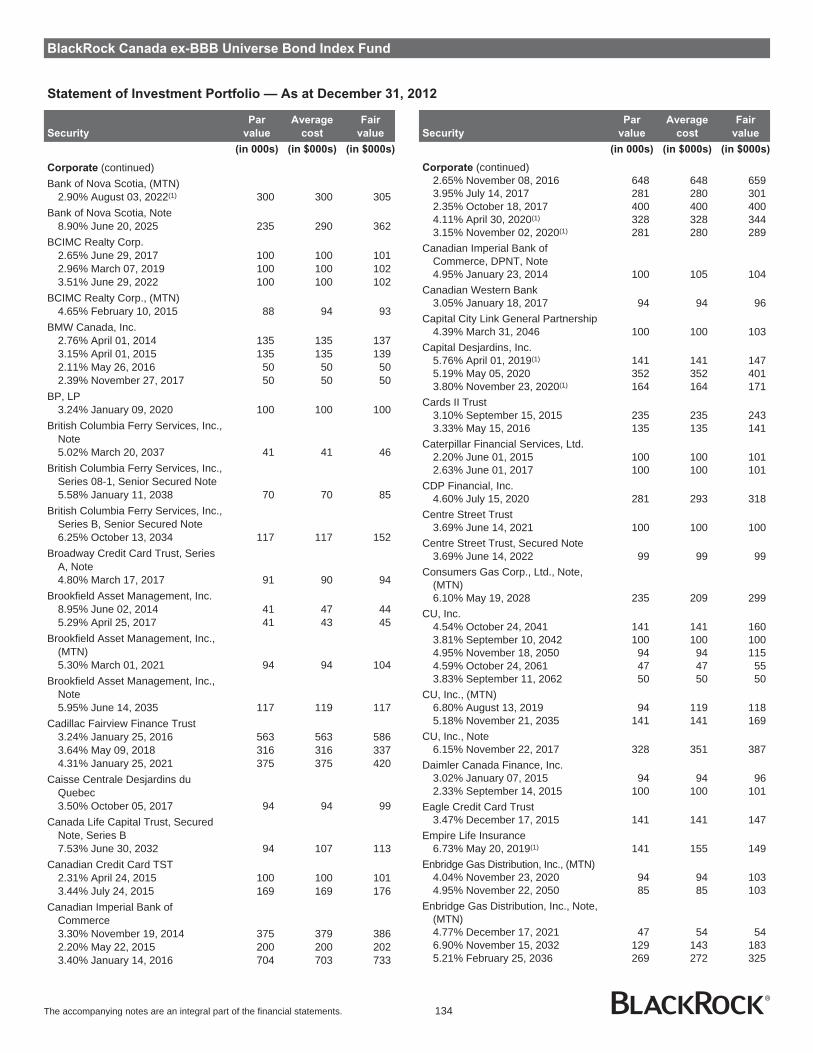
BlackRock Canada ex-BBB Universe Bond Index Fund
Statement of Investment Portfolio — As at December 31, 2012
Security
Par
value
Average
cost
Fair
value
(in 000s) (in $000s) (in $000s)
Corporate (continued)Bank of Nova Scotia, (MTN)
2.90% August 03, 2022(1) 300 300 305Bank of Nova Scotia, Note
8.90% June 20, 2025 235 290 362BCIMC Realty Corp.
2.65% June 29, 2017 100 100 1012.96% March 07, 2019 100 100 1023.51% June 29, 2022 100 100 102
BCIMC Realty Corp., (MTN)4.65% February 10, 2015 88 94 93
BMW Canada, Inc.2.76% April 01, 2014 135 135 1373.15% April 01, 2015 135 135 1392.11% May 26, 2016 50 50 502.39% November 27, 2017 50 50 50
BP, LP3.24% January 09, 2020 100 100 100
British Columbia Ferry Services, Inc.,Note5.02% March 20, 2037 41 41 46
British Columbia Ferry Services, Inc.,Series 08-1, Senior Secured Note5.58% January 11, 2038 70 70 85
British Columbia Ferry Services, Inc.,Series B, Senior Secured Note6.25% October 13, 2034 117 117 152
Broadway Credit Card Trust, SeriesA, Note4.80% March 17, 2017 91 90 94
Brookfield Asset Management, Inc.8.95% June 02, 2014 41 47 445.29% April 25, 2017 41 43 45
Brookfield Asset Management, Inc.,(MTN)5.30% March 01, 2021 94 94 104
Brookfield Asset Management, Inc.,Note5.95% June 14, 2035 117 119 117
Cadillac Fairview Finance Trust3.24% January 25, 2016 563 563 5863.64% May 09, 2018 316 316 3374.31% January 25, 2021 375 375 420
Caisse Centrale Desjardins duQuebec3.50% October 05, 2017 94 94 99
Canada Life Capital Trust, SecuredNote, Series B7.53% June 30, 2032 94 107 113
Canadian Credit Card TST2.31% April 24, 2015 100 100 1013.44% July 24, 2015 169 169 176
Canadian Imperial Bank ofCommerce3.30% November 19, 2014 375 379 3862.20% May 22, 2015 200 200 2023.40% January 14, 2016 704 703 733
Security
Par
value
Average
cost
Fair
value
(in 000s) (in $000s) (in $000s)
Corporate (continued)2.65% November 08, 2016 648 648 6593.95% July 14, 2017 281 280 3012.35% October 18, 2017 400 400 4004.11% April 30, 2020(1) 328 328 3443.15% November 02, 2020(1) 281 280 289
Canadian Imperial Bank ofCommerce, DPNT, Note4.95% January 23, 2014 100 105 104
Canadian Western Bank3.05% January 18, 2017 94 94 96
Capital City Link General Partnership4.39% March 31, 2046 100 100 103
Capital Desjardins, Inc.5.76% April 01, 2019(1) 141 141 1475.19% May 05, 2020 352 352 4013.80% November 23, 2020(1) 164 164 171
Cards II Trust3.10% September 15, 2015 235 235 2433.33% May 15, 2016 135 135 141
Caterpillar Financial Services, Ltd.2.20% June 01, 2015 100 100 1012.63% June 01, 2017 100 100 101
CDP Financial, Inc.4.60% July 15, 2020 281 293 318
Centre Street Trust3.69% June 14, 2021 100 100 100
Centre Street Trust, Secured Note3.69% June 14, 2022 99 99 99
Consumers Gas Corp., Ltd., Note,(MTN)6.10% May 19, 2028 235 209 299
CU, Inc.4.54% October 24, 2041 141 141 1603.81% September 10, 2042 100 100 1004.95% November 18, 2050 94 94 1154.59% October 24, 2061 47 47 553.83% September 11, 2062 50 50 50
CU, Inc., (MTN)6.80% August 13, 2019 94 119 1185.18% November 21, 2035 141 141 169
CU, Inc., Note6.15% November 22, 2017 328 351 387
Daimler Canada Finance, Inc.3.02% January 07, 2015 94 94 962.33% September 14, 2015 100 100 101
Eagle Credit Card Trust3.47% December 17, 2015 141 141 147
Empire Life Insurance6.73% May 20, 2019(1) 141 155 149
Enbridge Gas Distribution, Inc., (MTN)4.04% November 23, 2020 94 94 1034.95% November 22, 2050 85 85 103
Enbridge Gas Distribution, Inc., Note,(MTN)4.77% December 17, 2021 47 54 546.90% November 15, 2032 129 143 1835.21% February 25, 2036 269 272 325
The accompanying notes are an integral part of the financial statements. 134

BlackRock Canada ex-BBB Universe Bond Index Fund
Statement of Investment Portfolio — As at December 31, 2012
Security
Par
value
Average
cost
Fair
value
(in 000s) (in $000s) (in $000s)
Corporate (continued)Enbridge Pipelines, Inc., Note, (MTN)
5.08% December 19, 2036 235 258 280Enbridge, Inc.
4.53% March 09, 2020 469 470 5193.19% December 05, 2022 100 100 99
Enbridge, Inc., (MTN)7.20% June 18, 2032 328 403 4594.24% August 27, 2042 100 100 101
Enersource Corp.4.52% April 29, 2021 141 141 1595.30% April 29, 2041 94 94 116
Fifth Avenue, LP4.71% August 05, 2021 230 230 246
FortisAlberta, Inc.5.40% April 21, 2036 188 201 2323.98% October 23, 2052 30 30 31
FortisAlberta, Inc., (MTN)5.85% April 15, 2038 100 132 132
Gaz Metro, Inc., Guaranteed Note5.45% July 12, 2021 235 234 281
GE Capital Canada Funding Co.2.95% February 10, 2014 235 235 238
GE Capital Canada Funding Co.,(MTN)4.40% June 01, 2014 141 141 1464.24% June 08, 2015 235 235 2483.35% November 23, 2016 235 235 2445.53% August 17, 2017 422 438 4783.55% June 11, 2019 100 100 1044.60% January 26, 2022 188 188 2075.73% October 22, 2037 297 282 366
GE Capital Canada Funding Co.,Note, (MTN)4.65% February 11, 2015 166 162 1754.55% January 17, 2017 235 233 255
Genworth MI Canada, Inc.4.59% December 15, 2015 47 47 48
Glacier Credit Card Trust3.16% November 20, 2015 94 94 972.39% April 20, 2020 100 100 100
Golden Credit Card Trust3.51% May 15, 2016 463 463 486
Great-West Lifeco Finance Delaware,LP II7.13% June 26, 2068(1) 141 160 168
Great-West Lifeco Finance Delaware,LP, Subordinated Note5.69% June 21, 2067(1) 181 191 199
Great-West Lifeco, Inc.4.65% August 13, 2020 188 188 209
Great-West Lifeco, Inc., Note6.67% March 21, 2033 141 154 180
Great-West Lifeco, Inc., SeniorUnsecured Note6.14% March 21, 2018 85 85 99
Security
Par
value
Average
cost
Fair
value
(in 000s) (in $000s) (in $000s)
Corporate (continued)Greater Toronto Airports Authority
3.04% September 21, 2022 100 100 101Greater Toronto Airports Authority,
(MTN)4.85% June 01, 2017 211 211 2355.26% April 17, 2018 469 500 5397.10% June 04, 2031 235 285 3356.47% February 02, 2034 235 273 3215.63% June 07, 2040 117 117 1525.30% February 25, 2041 164 164 205
Halifax International Airport Authority4.89% November 15, 2050 41 41 49
Honda Canada Finance, Inc.2.28% December 11, 2017 100 100 100
Hospital Infrastructure Partners NOHPartnership5.44% January 31, 2045 141 141 166
HSBC Bank of Canada3.86% May 21, 2015 235 235 2462.57% November 23, 2015 200 200 2032.90% January 13, 2017 235 235 2413.56% October 04, 2017 188 188 1984.80% April 10, 2022(1) 135 135 146
Hydro One, Inc., (MTN)2.95% September 11, 2015 281 280 2905.18% October 18, 2017 469 511 5343.20% January 13, 2022 194 195 2005.36% May 20, 2036 436 422 5386.03% March 03, 2039 94 104 1285.49% July 16, 2040 94 94 1214.39% September 26, 2041 94 94 1035.00% October 19, 2046 94 95 115
IGM Financial, Inc.7.35% April 08, 2019 117 117 1446.00% December 10, 2040 94 94 109
Industrial Alliance Capital Trust, Note5.13% June 30, 2019(1) 100 104 103
Integrated Team Solutions SJHCPartnership5.95% November 30, 2042 94 102 115
John Deere Canada Funding, Inc.,(MTN)2.25% October 18, 2017 50 50 50
John Deere Credit, Inc., (MTN)1.85% January 24, 2014 47 47 472.25% October 14, 2014 94 94 95
Lower Mattagami Energy, LP2.23% October 23, 2017 50 50 504.18% April 23, 2052 100 100 104
Manufacturers Life Insurance Co.4.21% November 18, 2021(1) 235 235 2464.17% June 01, 2022(1) 100 100 105
Manulife Financial Capital Trust II7.41% December 31, 2108(1) 322 368 376
Manulife Financial Corp., (MTN)4.90% June 02, 2014 235 235 2444.08% August 20, 2015 328 328 3435.51% June 26, 2018 81 81 91
The accompanying notes are an integral part of the financial statements. 135
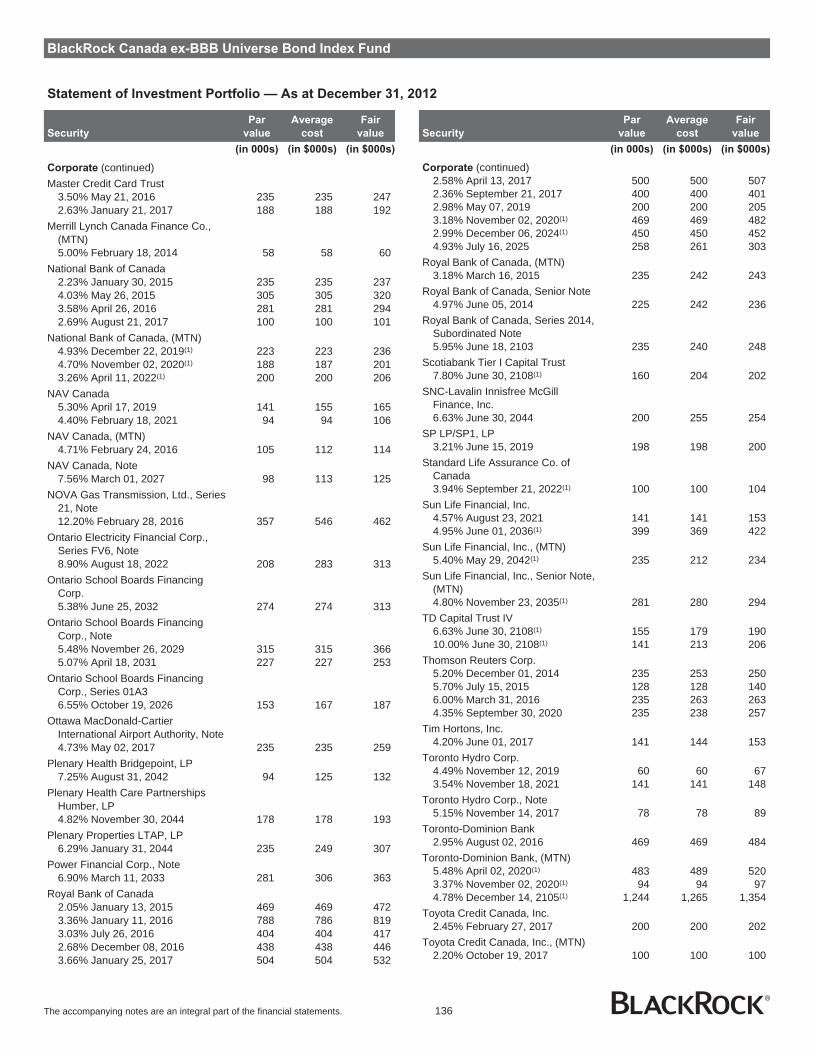
BlackRock Canada ex-BBB Universe Bond Index Fund
Statement of Investment Portfolio — As at December 31, 2012
Security
Par
value
Average
cost
Fair
value
(in 000s) (in $000s) (in $000s)
Corporate (continued)Master Credit Card Trust
3.50% May 21, 2016 235 235 2472.63% January 21, 2017 188 188 192
Merrill Lynch Canada Finance Co.,(MTN)5.00% February 18, 2014 58 58 60
National Bank of Canada2.23% January 30, 2015 235 235 2374.03% May 26, 2015 305 305 3203.58% April 26, 2016 281 281 2942.69% August 21, 2017 100 100 101
National Bank of Canada, (MTN)4.93% December 22, 2019(1) 223 223 2364.70% November 02, 2020(1) 188 187 2013.26% April 11, 2022(1) 200 200 206
NAV Canada5.30% April 17, 2019 141 155 1654.40% February 18, 2021 94 94 106
NAV Canada, (MTN)4.71% February 24, 2016 105 112 114
NAV Canada, Note7.56% March 01, 2027 98 113 125
NOVA Gas Transmission, Ltd., Series21, Note12.20% February 28, 2016 357 546 462
Ontario Electricity Financial Corp.,Series FV6, Note8.90% August 18, 2022 208 283 313
Ontario School Boards FinancingCorp.5.38% June 25, 2032 274 274 313
Ontario School Boards FinancingCorp., Note5.48% November 26, 2029 315 315 3665.07% April 18, 2031 227 227 253
Ontario School Boards FinancingCorp., Series 01A36.55% October 19, 2026 153 167 187
Ottawa MacDonald-CartierInternational Airport Authority, Note4.73% May 02, 2017 235 235 259
Plenary Health Bridgepoint, LP7.25% August 31, 2042 94 125 132
Plenary Health Care PartnershipsHumber, LP4.82% November 30, 2044 178 178 193
Plenary Properties LTAP, LP6.29% January 31, 2044 235 249 307
Power Financial Corp., Note6.90% March 11, 2033 281 306 363
Royal Bank of Canada2.05% January 13, 2015 469 469 4723.36% January 11, 2016 788 786 8193.03% July 26, 2016 404 404 4172.68% December 08, 2016 438 438 4463.66% January 25, 2017 504 504 532
Security
Par
value
Average
cost
Fair
value
(in 000s) (in $000s) (in $000s)
Corporate (continued)2.58% April 13, 2017 500 500 5072.36% September 21, 2017 400 400 4012.98% May 07, 2019 200 200 2053.18% November 02, 2020(1) 469 469 4822.99% December 06, 2024(1) 450 450 4524.93% July 16, 2025 258 261 303
Royal Bank of Canada, (MTN)3.18% March 16, 2015 235 242 243
Royal Bank of Canada, Senior Note4.97% June 05, 2014 225 242 236
Royal Bank of Canada, Series 2014,Subordinated Note5.95% June 18, 2103 235 240 248
Scotiabank Tier I Capital Trust7.80% June 30, 2108(1) 160 204 202
SNC-Lavalin Innisfree McGillFinance, Inc.6.63% June 30, 2044 200 255 254
SP LP/SP1, LP3.21% June 15, 2019 198 198 200
Standard Life Assurance Co. ofCanada3.94% September 21, 2022(1) 100 100 104
Sun Life Financial, Inc.4.57% August 23, 2021 141 141 1534.95% June 01, 2036(1) 399 369 422
Sun Life Financial, Inc., (MTN)5.40% May 29, 2042(1) 235 212 234
Sun Life Financial, Inc., Senior Note,(MTN)4.80% November 23, 2035(1) 281 280 294
TD Capital Trust IV6.63% June 30, 2108(1) 155 179 19010.00% June 30, 2108(1) 141 213 206
Thomson Reuters Corp.5.20% December 01, 2014 235 253 2505.70% July 15, 2015 128 128 1406.00% March 31, 2016 235 263 2634.35% September 30, 2020 235 238 257
Tim Hortons, Inc.4.20% June 01, 2017 141 144 153
Toronto Hydro Corp.4.49% November 12, 2019 60 60 673.54% November 18, 2021 141 141 148
Toronto Hydro Corp., Note5.15% November 14, 2017 78 78 89
Toronto-Dominion Bank2.95% August 02, 2016 469 469 484
Toronto-Dominion Bank, (MTN)5.48% April 02, 2020(1) 483 489 5203.37% November 02, 2020(1) 94 94 974.78% December 14, 2105(1) 1,244 1,265 1,354
Toyota Credit Canada, Inc.2.45% February 27, 2017 200 200 202
Toyota Credit Canada, Inc., (MTN)2.20% October 19, 2017 100 100 100
The accompanying notes are an integral part of the financial statements. 136

BlackRock Canada ex-BBB Universe Bond Index Fund
Statement of Investment Portfolio — As at December 31, 2012
Security
Par
value
Average
cost
Fair
value
(in 000s) (in $000s) (in $000s)
Corporate (continued)TransCanada PipeLines, Ltd.
8.05% February 17, 2039 235 255 383TransCanada PipeLines, Ltd., (MTN)
4.65% October 03, 2016 328 328 3583.65% November 15, 2021 188 188 2004.55% November 15, 2041 94 93 103
TransCanada PipeLines, Ltd., Note,(MTN)7.90% April 15, 2027 235 330 339
Vancouver International AirportAuthority7.43% December 07, 2026(1) 100 142 143
VW Credit Canada, Inc.2.50% June 01, 2015 100 100 1012.90% June 01, 2017 100 100 102
Wells Fargo Canada Corp., (MTN)2.94% July 25, 2019 300 300 303
Wells Fargo Financial Canada Corp.3.97% November 03, 2014 228 228 237
Wells Fargo Financial Canada Corp.,(MTN)4.38% June 30, 2015 225 216 2383.70% March 30, 2016 135 135 1412.77% February 09, 2017 404 404 411
Winnipeg Airport Authority, Inc.4.57% November 20, 2019 100 112 112
Total Corporate 53,903 57,465
Total Fixed Income Investments 232,150 246,387
Total Investments 232,150 246,387
Other Assets and Liabilities — 0.6% 1,453
Net Assets 247,840
(1) Variable rate security. Rate shown is as at report date.
Portfolio Concentration
(as a percentage of Net Assets)
Portfolio by Category
As at
December 31, 2012
As at
December 31, 2011
(%) (%)
Federal Non-Agency 31.0 32.5Federal Agency 12.8 13.5Government Guaranteed - 0.7Municipal 2.3 2.1Provincial 30.1 28.4Corporate 23.2 22.2Other Assets and Liabilities 0.6 0.6
The accompanying notes are an integral part of the financial statements. 137

BlackRock Canada Real Return Bond Index Fund
Statement of Net Assets — As at December 31
2012 2011
Assets
Investments - at fair value (Note 2) $ 912,628,751 $ 792,497,547Cash 2,247,924 294,607Interest receivable 1,640,944 1,401,522Accounts receivable from issue of units 3,175,700 225,000
919,693,319 794,418,676
Liabilities
Operating expenses payable 25,019 23,459Payables for redemption of units 7,178 -Payables for investment purchases 4,750,740 -
4,782,937 23,459
Net Assets $ 914,910,382 $ 794,395,217
Net Assets per Class
Class A $ 389,091,995 $ 424,202,197Class D 525,818,387 370,193,020
$ 914,910,382 $ 794,395,217
Number of Units Issued and Outstanding (Note 8)
Class A 11,539,430 12,940,287Class D 33,633,128 24,355,188
Net Assets per Unit
Class A $ 33.72 $ 32.78Class D $ 15.63 $ 15.20
Investments at Cost $ 777,284,841 $ 644,789,052
Approved by BlackRock Asset Management Canada Limited,Manager of the Funds
Eric Léveillé, Director Noel Archard, Director
The accompanying notes are an integral part of the financial statements. 138
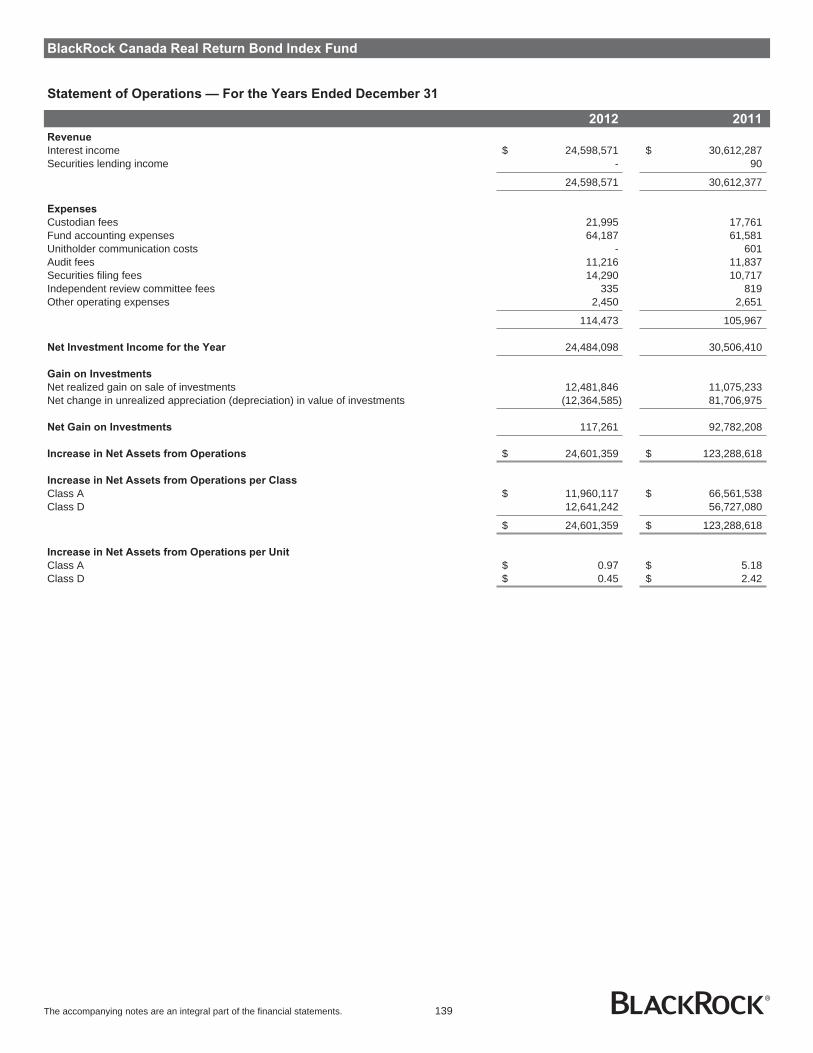
BlackRock Canada Real Return Bond Index Fund
Statement of Operations — For the Years Ended December 31
2012 2011
Revenue
Interest income $ 24,598,571 $ 30,612,287Securities lending income - 90
24,598,571 30,612,377
Expenses
Custodian fees 21,995 17,761Fund accounting expenses 64,187 61,581Unitholder communication costs - 601Audit fees 11,216 11,837Securities filing fees 14,290 10,717Independent review committee fees 335 819Other operating expenses 2,450 2,651
114,473 105,967
Net Investment Income for the Year 24,484,098 30,506,410
Gain on Investments
Net realized gain on sale of investments 12,481,846 11,075,233Net change in unrealized appreciation (depreciation) in value of investments (12,364,585) 81,706,975
Net Gain on Investments 117,261 92,782,208
Increase in Net Assets from Operations $ 24,601,359 $ 123,288,618
Increase in Net Assets from Operations per Class
Class A $ 11,960,117 $ 66,561,538Class D 12,641,242 56,727,080
$ 24,601,359 $ 123,288,618
Increase in Net Assets from Operations per Unit
Class A $ 0.97 $ 5.18Class D $ 0.45 $ 2.42
The accompanying notes are an integral part of the financial statements. 139

BlackRock Canada Real Return Bond Index Fund
Statement of Changes in Net Assets — For the Years Ended December 31
2012 2011 2012 2011 2012 2011
Fund Class A Class D
Net Assets - Beginning of Year
$794,395,217 $604,301,254 $424,202,197 $330,717,935 $370,193,020 $273,583,319
Increase in Net Assets from Operations 24,601,359 123,288,618 11,960,117 66,561,538 12,641,242 56,727,080
Capital Transactions
Proceeds from issue of units 169,673,385 192,368,376 5,041,108 120,686,447 164,632,277 71,681,929Reinvestment of distributions 36,966,460 41,581,639 16,267,783 22,534,498 20,698,677 19,047,141Redemption of units (73,759,579) (125,563,031) (52,111,427) (93,763,723) (21,648,152) (31,799,308)
Net capital transactions 132,880,266 108,386,984 (30,802,536) 49,457,222 163,682,802 58,929,762
Distributions
From net investment income (24,484,614) (30,506,406) (10,941,071) (16,618,716) (13,543,543) (13,887,690)From capital gains (12,481,846) (11,075,233) (5,326,712) (5,915,782) (7,155,134) (5,159,451)
Total distributions (36,966,460) (41,581,639) (16,267,783) (22,534,498) (20,698,677) (19,047,141)
Increase (Decrease) in Net Assets for the Year 120,515,165 190,093,963 (35,110,202) 93,484,262 155,625,367 96,609,701
Net Assets - End of Year $914,910,382 $794,395,217 $389,091,995 $424,202,197 $525,818,387 $370,193,020
The accompanying notes are an integral part of the financial statements. 140
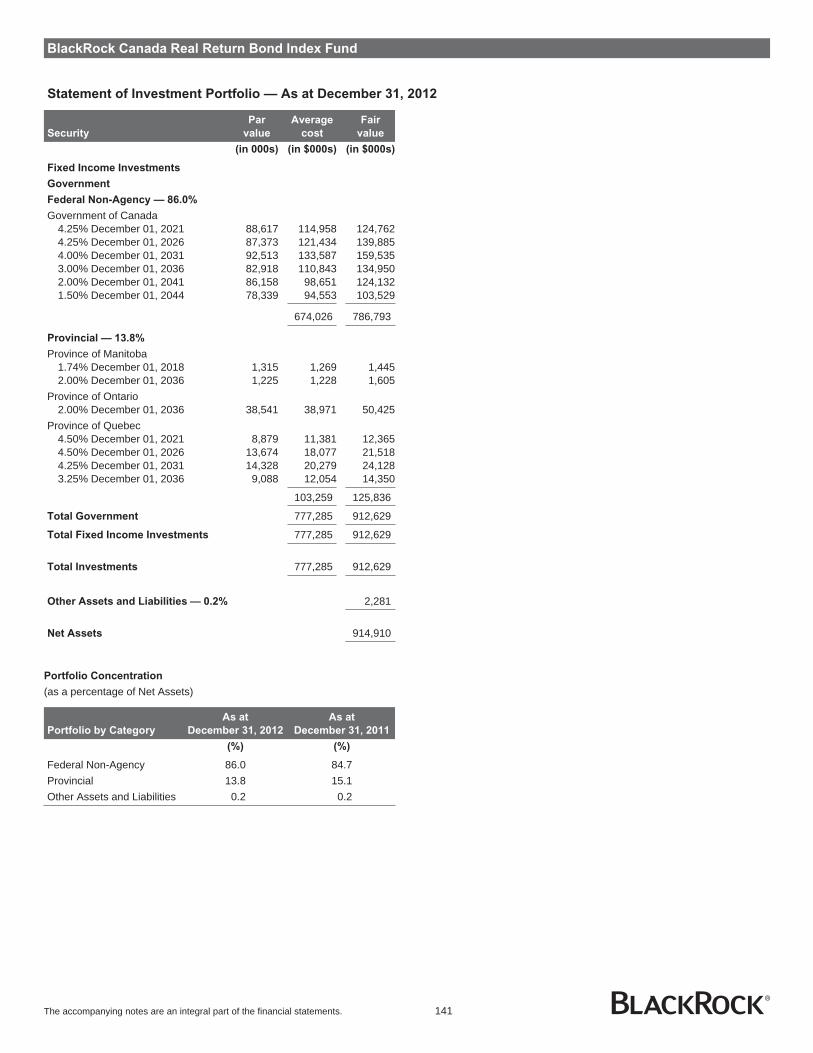
BlackRock Canada Real Return Bond Index Fund
Statement of Investment Portfolio — As at December 31, 2012
Security
Par
value
Average
cost
Fair
value
(in 000s) (in $000s) (in $000s)
Fixed Income Investments
Government
Federal Non-Agency — 86.0%
Government of Canada4.25% December 01, 2021 88,617 114,958 124,7624.25% December 01, 2026 87,373 121,434 139,8854.00% December 01, 2031 92,513 133,587 159,5353.00% December 01, 2036 82,918 110,843 134,9502.00% December 01, 2041 86,158 98,651 124,1321.50% December 01, 2044 78,339 94,553 103,529
674,026 786,793
Provincial — 13.8%
Province of Manitoba1.74% December 01, 2018 1,315 1,269 1,4452.00% December 01, 2036 1,225 1,228 1,605
Province of Ontario2.00% December 01, 2036 38,541 38,971 50,425
Province of Quebec4.50% December 01, 2021 8,879 11,381 12,3654.50% December 01, 2026 13,674 18,077 21,5184.25% December 01, 2031 14,328 20,279 24,1283.25% December 01, 2036 9,088 12,054 14,350
103,259 125,836
Total Government 777,285 912,629
Total Fixed Income Investments 777,285 912,629
Total Investments 777,285 912,629
Other Assets and Liabilities — 0.2% 2,281
Net Assets 914,910
Portfolio Concentration
(as a percentage of Net Assets)
Portfolio by Category
As at
December 31, 2012
As at
December 31, 2011
(%) (%)
Federal Non-Agency 86.0 84.7Provincial 13.8 15.1Other Assets and Liabilities 0.2 0.2
The accompanying notes are an integral part of the financial statements. 141

BlackRock Canada Long Bond Index Fund
Statement of Net Assets — As at December 31
2012 2011
Assets
Investments - at fair value (Note 2) $ 9,273,510,310 $ 7,356,149,212Cash 50,500,510 4,230,694Interest receivable 57,649,309 50,155,023Securities lending income receivable 2,823 7,824Accounts receivable from issue of units 146,764,614 117,951,739Accounts receivable for investment sales - 816,605,963
9,528,427,566 8,345,100,455
Liabilities
Operating expenses payable 122,427 111,105Payables for redemption of units 1,689,956 823,500,057Payables for investment purchases 108,171,737 94,347,685
109,984,120 917,958,847
Net Assets $ 9,418,443,446 $ 7,427,141,608
Net Assets per Class
Class A $ 8,369,929,439 $ 6,793,788,830Class D 1,048,514,007 633,352,778
$ 9,418,443,446 $ 7,427,141,608
Number of Units Issued and Outstanding (Note 8)
Class A 288,391,872 245,320,775Class D 67,959,570 43,010,772
Net Assets per Unit
Class A $ 29.02 $ 27.69Class D $ 15.43 $ 14.73
Investments at Cost $ 8,349,258,897 $ 6,318,043,301
Approved by BlackRock Asset Management Canada Limited,Manager of the Funds
Eric Léveillé, Director Noel Archard, Director
The accompanying notes are an integral part of the financial statements. 142
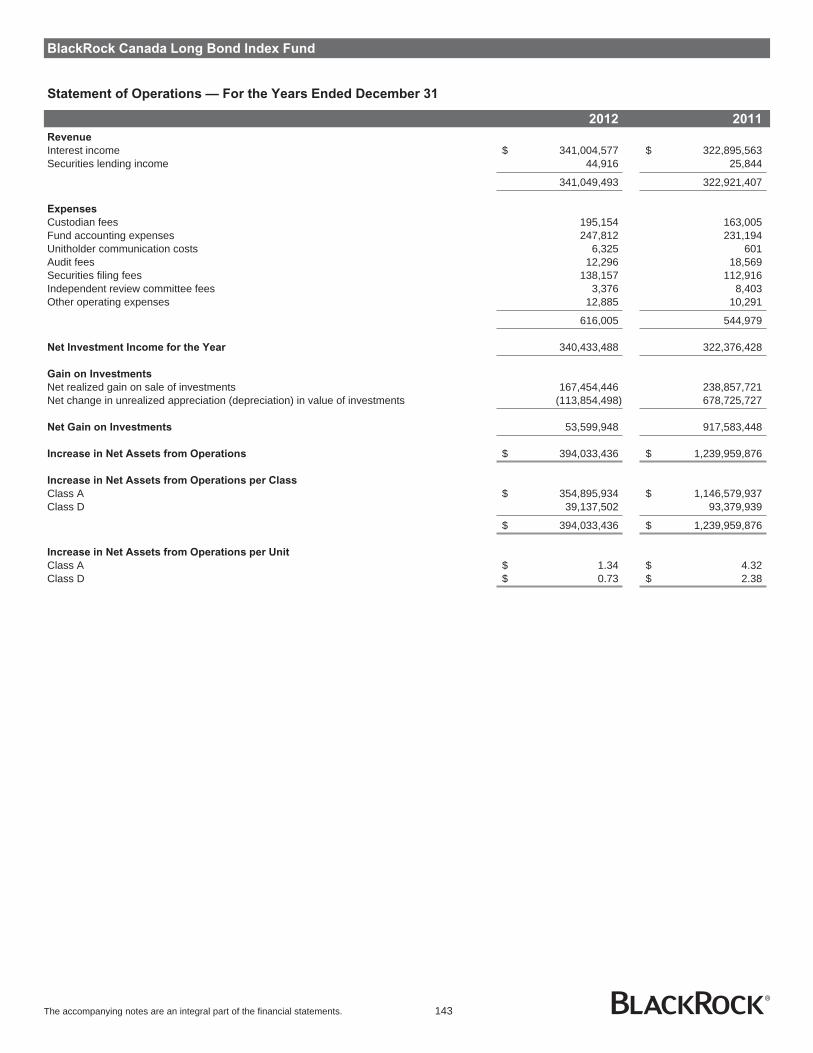
BlackRock Canada Long Bond Index Fund
Statement of Operations — For the Years Ended December 31
2012 2011
Revenue
Interest income $ 341,004,577 $ 322,895,563Securities lending income 44,916 25,844
341,049,493 322,921,407
Expenses
Custodian fees 195,154 163,005Fund accounting expenses 247,812 231,194Unitholder communication costs 6,325 601Audit fees 12,296 18,569Securities filing fees 138,157 112,916Independent review committee fees 3,376 8,403Other operating expenses 12,885 10,291
616,005 544,979
Net Investment Income for the Year 340,433,488 322,376,428
Gain on Investments
Net realized gain on sale of investments 167,454,446 238,857,721Net change in unrealized appreciation (depreciation) in value of investments (113,854,498) 678,725,727
Net Gain on Investments 53,599,948 917,583,448
Increase in Net Assets from Operations $ 394,033,436 $ 1,239,959,876
Increase in Net Assets from Operations per Class
Class A $ 354,895,934 $ 1,146,579,937Class D 39,137,502 93,379,939
$ 394,033,436 $ 1,239,959,876
Increase in Net Assets from Operations per Unit
Class A $ 1.34 $ 4.32Class D $ 0.73 $ 2.38
The accompanying notes are an integral part of the financial statements. 143

BlackRock Canada Long Bond Index Fund
Statement of Changes in Net Assets — For the Years Ended December 31
2012 2011 2012 2011 2012 2011
Fund Class A Class D
Net Assets - Beginning of Year $ 7,427,141,608 $ 6,635,136,830 $ 6,793,788,830 $ 6,212,513,402 $ 633,352,778 $ 422,623,428
Increase in Net Assets from Operations 394,033,436 1,239,959,876 354,895,934 1,146,579,937 39,137,502 93,379,939
Capital Transactions
Proceeds from issue of units 2,276,891,201 1,899,322,442 1,852,214,058 1,704,340,134 424,677,143 194,982,308Reinvestment of distributions 638,590,408 446,266,727 582,921,916 414,117,592 55,668,492 32,149,135Redemption of units (679,622,799) (2,347,277,540) (630,969,383) (2,269,644,643) (48,653,416) (77,632,897)
Net capital transactions 2,235,858,810 (1,688,371) 1,804,166,591 (151,186,917) 431,692,219 149,498,546
Distributions
From net investment income (340,443,228) (322,369,775) (305,176,438) (298,441,508) (35,266,790) (23,928,267)From capital gains (183,424,751) (106,886,179) (163,023,049) (98,665,311) (20,401,702) (8,220,868)From capital gains redemption in kind (Note 9) (114,722,429) (17,010,773) (114,722,429) (17,010,773) - -
Total distributions (638,590,408) (446,266,727) (582,921,916) (414,117,592) (55,668,492) (32,149,135)
Increase in Net Assets for the Year 1,991,301,838 792,004,778 1,576,140,609 581,275,428 415,161,229 210,729,350
Net Assets - End of Year $ 9,418,443,446 $ 7,427,141,608 $ 8,369,929,439 $ 6,793,788,830 $ 1,048,514,007 $ 633,352,778
The accompanying notes are an integral part of the financial statements. 144

BlackRock Canada Long Bond Index Fund
Statement of Investment Portfolio — As at December 31, 2012
Security
Par
value
Average
cost
Fair
value
(in 000s) (in $000s) (in $000s)
Fixed Income Investments
Government Federal
Non-Agency — 27.7%
Government of Canada8.00% June 01, 2023 72,201 107,555 113,9721.50% June 01, 2023 118,039 114,104 113,5949.00% June 01, 2025 59,201 95,104 104,6638.00% June 01, 2027 83,184 128,235 143,7835.75% June 01, 2029 278,514 368,825 413,8175.75% June 01, 2033 299,337 403,031 464,8315.00% June 01, 2037 334,040 428,473 494,3014.00% June 01, 2041 402,015 500,387 537,3913.50% December 01, 2045 175,776 213,493 221,477
2,359,207 2,607,829
Federal Agency — 1.5%
Asian Development Bank, SeriesMPLE, Senior Unsecured Note4.65% February 16, 2027 16,359 17,167 19,095
Canada Post Corp.4.08% July 16, 2025 13,450 13,960 15,6594.36% July 16, 2040 13,826 14,729 17,360
Inter-American Development Bank,Note4.40% January 26, 2026 27,979 27,682 31,828
Royal Office Finance LP, Series A,Note5.21% November 12, 2037 32,451 33,643 38,497
South Coast British ColumbiaTransportation Authority4.65% June 20, 2041 5,000 5,660 5,7383.85% February 09, 2052 6,750 6,907 6,827
119,748 135,004
Municipal — 1.6%
Alberta Capital Finance Authority,(MTN)4.45% December 15, 2025 8,000 9,415 9,278
City of Montreal6.00% June 01, 2043 14,892 16,432 20,238
City of Ottawa4.60% July 14, 2042 9,003 9,971 10,228
City of Toronto5.20% June 01, 2040 17,838 18,637 21,8924.70% June 10, 2041 16,311 16,686 18,696
City of Vancouver3.70% October 18, 2052 4,230 4,201 4,173
City of Winnipeg5.20% July 17, 2036 4,700 5,671 5,637
Municipal Finance Authority ofBritish Columbia5.35% December 02, 2024 1,391 1,671 1,6774.98% April 06, 2025 1,318 1,318 1,4844.95% December 01, 2027 15,574 16,169 18,268
Peel Regional Municipality5.10% June 29, 2040 12,489 12,854 15,2123.85% October 30, 2042 10,500 10,479 10,614
Security
Par
value
Average
cost
Fair
value
(in 000s) (in $000s) (in $000s)
Municipal (continued)Regional Municipality of Halton
4.05% October 11, 2041 1,486 1,498 1,543Regional Municipality of York
4.00% May 31, 2032 8,650 8,766 8,9034.15% November 18, 2041 3,250 3,440 3,415
137,208 151,258
Provincial — 50.7%
Centre Hospitalier de L’universite deMontreal4.45% October 01, 2049 1,350 1,350 1,443
City of Toronto3.80% December 13, 2042 8,900 8,870 8,863
Financement-Quebec5.25% June 01, 2034 45,121 49,904 55,707
Hydro Quebec6.00% August 15, 2031 10,606 12,860 14,2535.00% February 15, 2050 67,235 81,692 88,325
Hydro Quebec, (MTN)6.00% February 15, 2040 33,192 40,046 47,100
Hydro Quebec, Series 19, Note6.50% February 15, 2035 65,492 85,908 94,480
Hydro Quebec, Series JM, Note5.00% February 15, 2045 39,607 42,764 50,882
Ontario Electricity Financial Corp.,Note8.25% June 22, 2026 33,326 49,940 51,769
OPB Finance Trust3.89% July 04, 2042 4,000 3,997 4,062
Province of Alberta4.50% December 01, 2040 17,284 18,277 21,307
Province of Alberta Canada, (MTN)2.90% September 20, 2029 13,000 12,804 12,765
Province of British Columbia8.00% September 08, 2023 13,106 18,103 19,3629.00% August 23, 2024 4,359 6,456 6,9716.15% November 19, 2027 10,500 14,196 14,3305.70% June 18, 2029 67,834 77,797 90,0966.35% June 18, 2031 40,193 50,689 57,4315.40% June 18, 2035 16,524 20,158 21,8824.70% June 18, 2037 38,095 39,345 46,6384.30% June 18, 2042 92,246 99,101 109,385
Province of British Columbia,Unsecured Note3.20% June 18, 2044 16,800 16,635 16,542
Province of British Columbia, (MTN)5.62% August 17, 2028(1) 450 556 5844.95% June 18, 2040 51,855 55,507 66,746
Province of Manitoba7.75% December 22, 2025 5,427 6,663 8,12110.50% March 05, 2031 3,360 5,392 6,6575.70% March 05, 2037 20,029 23,125 27,6274.60% March 05, 2038 24,462 24,765 29,4594.65% March 05, 2040 20,506 20,530 25,1074.10% March 05, 2041 27,201 26,790 30,916
The accompanying notes are an integral part of the financial statements. 145
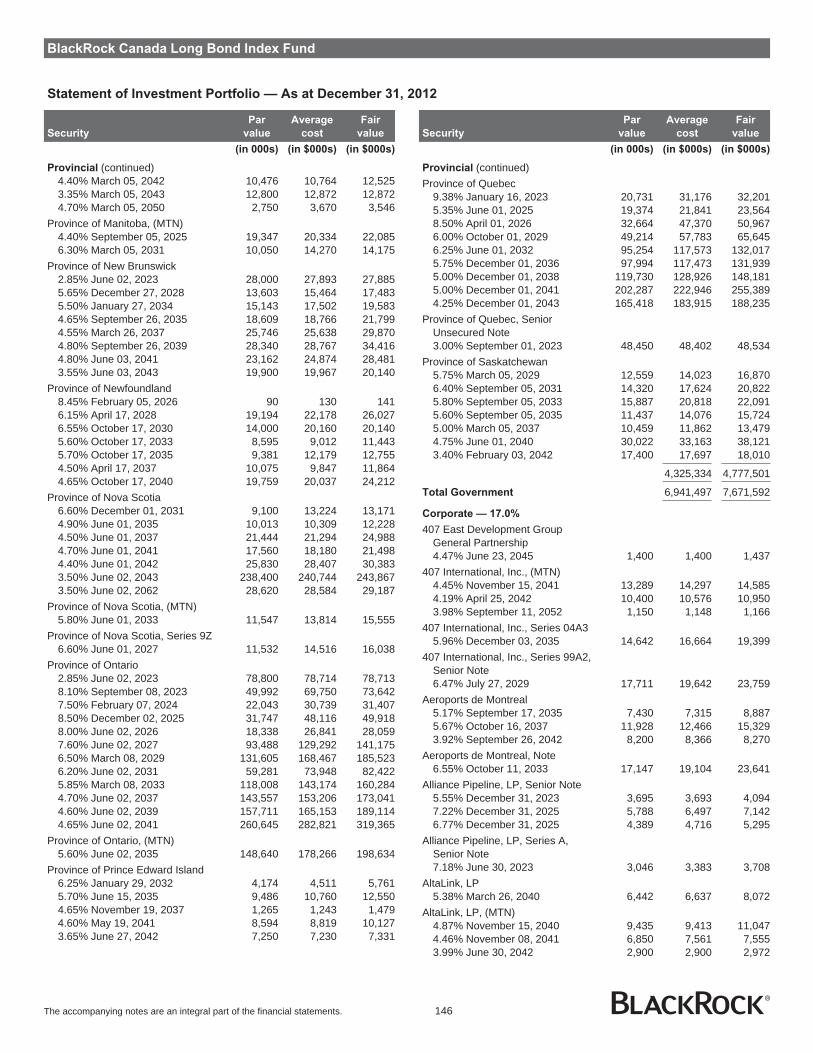
BlackRock Canada Long Bond Index Fund
Statement of Investment Portfolio — As at December 31, 2012
Security
Par
value
Average
cost
Fair
value
(in 000s) (in $000s) (in $000s)
Provincial (continued)4.40% March 05, 2042 10,476 10,764 12,5253.35% March 05, 2043 12,800 12,872 12,8724.70% March 05, 2050 2,750 3,670 3,546
Province of Manitoba, (MTN)4.40% September 05, 2025 19,347 20,334 22,0856.30% March 05, 2031 10,050 14,270 14,175
Province of New Brunswick2.85% June 02, 2023 28,000 27,893 27,8855.65% December 27, 2028 13,603 15,464 17,4835.50% January 27, 2034 15,143 17,502 19,5834.65% September 26, 2035 18,609 18,766 21,7994.55% March 26, 2037 25,746 25,638 29,8704.80% September 26, 2039 28,340 28,767 34,4164.80% June 03, 2041 23,162 24,874 28,4813.55% June 03, 2043 19,900 19,967 20,140
Province of Newfoundland8.45% February 05, 2026 90 130 1416.15% April 17, 2028 19,194 22,178 26,0276.55% October 17, 2030 14,000 20,160 20,1405.60% October 17, 2033 8,595 9,012 11,4435.70% October 17, 2035 9,381 12,179 12,7554.50% April 17, 2037 10,075 9,847 11,8644.65% October 17, 2040 19,759 20,037 24,212
Province of Nova Scotia6.60% December 01, 2031 9,100 13,224 13,1714.90% June 01, 2035 10,013 10,309 12,2284.50% June 01, 2037 21,444 21,294 24,9884.70% June 01, 2041 17,560 18,180 21,4984.40% June 01, 2042 25,830 28,407 30,3833.50% June 02, 2043 238,400 240,744 243,8673.50% June 02, 2062 28,620 28,584 29,187
Province of Nova Scotia, (MTN)5.80% June 01, 2033 11,547 13,814 15,555
Province of Nova Scotia, Series 9Z6.60% June 01, 2027 11,532 14,516 16,038
Province of Ontario2.85% June 02, 2023 78,800 78,714 78,7138.10% September 08, 2023 49,992 69,750 73,6427.50% February 07, 2024 22,043 30,739 31,4078.50% December 02, 2025 31,747 48,116 49,9188.00% June 02, 2026 18,338 26,841 28,0597.60% June 02, 2027 93,488 129,292 141,1756.50% March 08, 2029 131,605 168,467 185,5236.20% June 02, 2031 59,281 73,948 82,4225.85% March 08, 2033 118,008 143,174 160,2844.70% June 02, 2037 143,557 153,206 173,0414.60% June 02, 2039 157,711 165,153 189,1144.65% June 02, 2041 260,645 282,821 319,365
Province of Ontario, (MTN)5.60% June 02, 2035 148,640 178,266 198,634
Province of Prince Edward Island6.25% January 29, 2032 4,174 4,511 5,7615.70% June 15, 2035 9,486 10,760 12,5504.65% November 19, 2037 1,265 1,243 1,4794.60% May 19, 2041 8,594 8,819 10,1273.65% June 27, 2042 7,250 7,230 7,331
Security
Par
value
Average
cost
Fair
value
(in 000s) (in $000s) (in $000s)
Provincial (continued)Province of Quebec
9.38% January 16, 2023 20,731 31,176 32,2015.35% June 01, 2025 19,374 21,841 23,5648.50% April 01, 2026 32,664 47,370 50,9676.00% October 01, 2029 49,214 57,783 65,6456.25% June 01, 2032 95,254 117,573 132,0175.75% December 01, 2036 97,994 117,473 131,9395.00% December 01, 2038 119,730 128,926 148,1815.00% December 01, 2041 202,287 222,946 255,3894.25% December 01, 2043 165,418 183,915 188,235
Province of Quebec, SeniorUnsecured Note3.00% September 01, 2023 48,450 48,402 48,534
Province of Saskatchewan5.75% March 05, 2029 12,559 14,023 16,8706.40% September 05, 2031 14,320 17,624 20,8225.80% September 05, 2033 15,887 20,818 22,0915.60% September 05, 2035 11,437 14,076 15,7245.00% March 05, 2037 10,459 11,862 13,4794.75% June 01, 2040 30,022 33,163 38,1213.40% February 03, 2042 17,400 17,697 18,010
4,325,334 4,777,501
Total Government 6,941,497 7,671,592
Corporate — 17.0%
407 East Development GroupGeneral Partnership4.47% June 23, 2045 1,400 1,400 1,437
407 International, Inc., (MTN)4.45% November 15, 2041 13,289 14,297 14,5854.19% April 25, 2042 10,400 10,576 10,9503.98% September 11, 2052 1,150 1,148 1,166
407 International, Inc., Series 04A35.96% December 03, 2035 14,642 16,664 19,399
407 International, Inc., Series 99A2,Senior Note6.47% July 27, 2029 17,711 19,642 23,759
Aeroports de Montreal5.17% September 17, 2035 7,430 7,315 8,8875.67% October 16, 2037 11,928 12,466 15,3293.92% September 26, 2042 8,200 8,366 8,270
Aeroports de Montreal, Note6.55% October 11, 2033 17,147 19,104 23,641
Alliance Pipeline, LP, Senior Note5.55% December 31, 2023 3,695 3,693 4,0947.22% December 31, 2025 5,788 6,497 7,1426.77% December 31, 2025 4,389 4,716 5,295
Alliance Pipeline, LP, Series A,Senior Note7.18% June 30, 2023 3,046 3,383 3,708
AltaLink, LP5.38% March 26, 2040 6,442 6,637 8,072
AltaLink, LP, (MTN)4.87% November 15, 2040 9,435 9,413 11,0474.46% November 08, 2041 6,850 7,561 7,5553.99% June 30, 2042 2,900 2,900 2,972
The accompanying notes are an integral part of the financial statements. 146
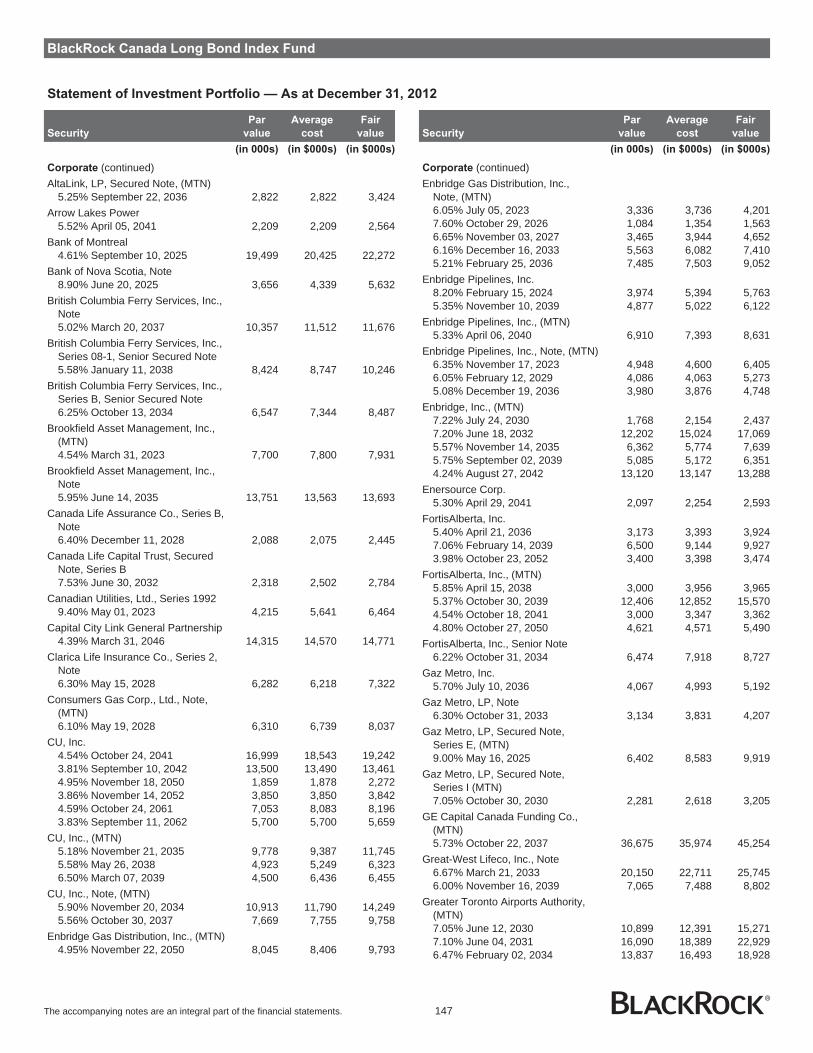
BlackRock Canada Long Bond Index Fund
Statement of Investment Portfolio — As at December 31, 2012
Security
Par
value
Average
cost
Fair
value
(in 000s) (in $000s) (in $000s)
Corporate (continued)AltaLink, LP, Secured Note, (MTN)
5.25% September 22, 2036 2,822 2,822 3,424Arrow Lakes Power
5.52% April 05, 2041 2,209 2,209 2,564Bank of Montreal
4.61% September 10, 2025 19,499 20,425 22,272Bank of Nova Scotia, Note
8.90% June 20, 2025 3,656 4,339 5,632British Columbia Ferry Services, Inc.,
Note5.02% March 20, 2037 10,357 11,512 11,676
British Columbia Ferry Services, Inc.,Series 08-1, Senior Secured Note5.58% January 11, 2038 8,424 8,747 10,246
British Columbia Ferry Services, Inc.,Series B, Senior Secured Note6.25% October 13, 2034 6,547 7,344 8,487
Brookfield Asset Management, Inc.,(MTN)4.54% March 31, 2023 7,700 7,800 7,931
Brookfield Asset Management, Inc.,Note5.95% June 14, 2035 13,751 13,563 13,693
Canada Life Assurance Co., Series B,Note6.40% December 11, 2028 2,088 2,075 2,445
Canada Life Capital Trust, SecuredNote, Series B7.53% June 30, 2032 2,318 2,502 2,784
Canadian Utilities, Ltd., Series 19929.40% May 01, 2023 4,215 5,641 6,464
Capital City Link General Partnership4.39% March 31, 2046 14,315 14,570 14,771
Clarica Life Insurance Co., Series 2,Note6.30% May 15, 2028 6,282 6,218 7,322
Consumers Gas Corp., Ltd., Note,(MTN)6.10% May 19, 2028 6,310 6,739 8,037
CU, Inc.4.54% October 24, 2041 16,999 18,543 19,2423.81% September 10, 2042 13,500 13,490 13,4614.95% November 18, 2050 1,859 1,878 2,2723.86% November 14, 2052 3,850 3,850 3,8424.59% October 24, 2061 7,053 8,083 8,1963.83% September 11, 2062 5,700 5,700 5,659
CU, Inc., (MTN)5.18% November 21, 2035 9,778 9,387 11,7455.58% May 26, 2038 4,923 5,249 6,3236.50% March 07, 2039 4,500 6,436 6,455
CU, Inc., Note, (MTN)5.90% November 20, 2034 10,913 11,790 14,2495.56% October 30, 2037 7,669 7,755 9,758
Enbridge Gas Distribution, Inc., (MTN)4.95% November 22, 2050 8,045 8,406 9,793
Security
Par
value
Average
cost
Fair
value
(in 000s) (in $000s) (in $000s)
Corporate (continued)Enbridge Gas Distribution, Inc.,
Note, (MTN)6.05% July 05, 2023 3,336 3,736 4,2017.60% October 29, 2026 1,084 1,354 1,5636.65% November 03, 2027 3,465 3,944 4,6526.16% December 16, 2033 5,563 6,082 7,4105.21% February 25, 2036 7,485 7,503 9,052
Enbridge Pipelines, Inc.8.20% February 15, 2024 3,974 5,394 5,7635.35% November 10, 2039 4,877 5,022 6,122
Enbridge Pipelines, Inc., (MTN)5.33% April 06, 2040 6,910 7,393 8,631
Enbridge Pipelines, Inc., Note, (MTN)6.35% November 17, 2023 4,948 4,600 6,4056.05% February 12, 2029 4,086 4,063 5,2735.08% December 19, 2036 3,980 3,876 4,748
Enbridge, Inc., (MTN)7.22% July 24, 2030 1,768 2,154 2,4377.20% June 18, 2032 12,202 15,024 17,0695.57% November 14, 2035 6,362 5,774 7,6395.75% September 02, 2039 5,085 5,172 6,3514.24% August 27, 2042 13,120 13,147 13,288
Enersource Corp.5.30% April 29, 2041 2,097 2,254 2,593
FortisAlberta, Inc.5.40% April 21, 2036 3,173 3,393 3,9247.06% February 14, 2039 6,500 9,144 9,9273.98% October 23, 2052 3,400 3,398 3,474
FortisAlberta, Inc., (MTN)5.85% April 15, 2038 3,000 3,956 3,9655.37% October 30, 2039 12,406 12,852 15,5704.54% October 18, 2041 3,000 3,347 3,3624.80% October 27, 2050 4,621 4,571 5,490
FortisAlberta, Inc., Senior Note6.22% October 31, 2034 6,474 7,918 8,727
Gaz Metro, Inc.5.70% July 10, 2036 4,067 4,993 5,192
Gaz Metro, LP, Note6.30% October 31, 2033 3,134 3,831 4,207
Gaz Metro, LP, Secured Note,Series E, (MTN)9.00% May 16, 2025 6,402 8,583 9,919
Gaz Metro, LP, Secured Note,Series I (MTN)7.05% October 30, 2030 2,281 2,618 3,205
GE Capital Canada Funding Co.,(MTN)5.73% October 22, 2037 36,675 35,974 45,254
Great-West Lifeco, Inc., Note6.67% March 21, 2033 20,150 22,711 25,7456.00% November 16, 2039 7,065 7,488 8,802
Greater Toronto Airports Authority,(MTN)7.05% June 12, 2030 10,899 12,391 15,2717.10% June 04, 2031 16,090 18,389 22,9296.47% February 02, 2034 13,837 16,493 18,928
The accompanying notes are an integral part of the financial statements. 147

BlackRock Canada Long Bond Index Fund
Statement of Investment Portfolio — As at December 31, 2012
Security
Par
value
Average
cost
Fair
value
(in 000s) (in $000s) (in $000s)
Corporate (continued)5.63% June 07, 2040 15,735 16,691 20,4255.30% February 25, 2041 25,809 27,662 30,867
Greater Toronto Airports Authority,Note6.45% December 03, 2027 10,436 11,044 13,705
Greater Toronto Airports Authority,Note, (MTN)6.45% July 30, 2029 15,498 16,800 19,3516.98% October 15, 2032 14,454 16,801 20,607
Halifax International Airport Authority5.50% July 19, 2041 4,801 4,742 6,1004.89% November 15, 2050 4,440 4,662 5,276
Hospital Infrastructure Partners NOHPartnership5.44% January 31, 2045 16,099 17,028 18,939
Hydro One, Inc., (MTN)6.35% January 31, 2034 18,193 21,381 24,8185.36% May 20, 2036 34,288 35,661 42,3244.89% March 13, 2037 5,700 6,642 6,6656.03% March 03, 2039 4,580 5,649 6,2485.49% July 16, 2040 17,971 19,753 23,0414.39% September 26, 2041 8,716 9,302 9,5825.00% October 19, 2046 8,254 9,509 10,1004.00% December 22, 2051 5,970 5,971 6,1683.79% July 31, 2062 8,500 8,475 8,417
Hydro One, Inc., Note7.35% June 03, 2030 18,725 22,597 27,136
Hydro One, Inc., Note, (MTN)6.93% June 01, 2032 3,824 4,621 5,447
IGM Financial, Inc.6.65% December 13, 2027 3,500 4,160 4,2056.00% December 10, 2040 5,122 5,219 5,916
IGM Financial, Inc., Note7.45% May 09, 2031 4,074 4,487 5,2567.00% December 31, 2032 4,950 6,082 6,1847.11% March 07, 2033 9,754 11,862 12,341
Integrated Team Solutions SJHCPartnership5.95% November 30, 2042 5,821 6,235 7,092
Lower Mattagami Energy, LP5.14% May 18, 2041 4,219 4,277 5,0604.18% April 23, 2052 6,000 6,367 6,236
NAV Canada, Note7.56% March 01, 2027 12,671 15,242 16,2857.40% June 01, 2027 7,071 8,392 10,246
Newfoundland & Labrador Hydro,Note5.70% July 14, 2033 1,669 1,956 2,238
Northwestconnect Group5.95% April 30, 2041 9,952 10,481 12,290
NOVA Gas Transmission, Ltd., (MTN)8.88% May 27, 2026 2,003 2,144 3,023
NOVA Gas Transmission, Ltd., Note9.90% December 16, 2024 5,618 7,304 8,9898.46% June 05, 2026 1,120 1,548 1,642
Security
Par
value
Average
cost
Fair
value
(in 000s) (in $000s) (in $000s)
Corporate (continued)NOVA Gas Transmission, Ltd.,
Note, (MTN)6.30% May 27, 2030 5,210 5,691 6,574
Ontario Electricity Financial Corp.,Note9.00% May 26, 2025 4,500 6,884 7,2128.50% May 26, 2025 8,991 11,941 13,940
Ontario Infrastructure Projects Corp.,Note4.70% June 01, 2037 6,011 6,019 6,774
Ontario School Boards FinancingCorp.5.80% November 07, 2028 4,515 4,821 5,3114.79% August 08, 2030 378 404 4155.38% June 25, 2032 5,064 5,121 5,788
Ontario School Boards FinancingCorp., Note7.20% June 09, 2025 637 806 8005.48% November 26, 2029 9,372 9,517 10,8865.07% April 18, 2031 3,796 3,796 4,237
Ontario School Boards FinancingCorp., Series 01A36.55% October 19, 2026 4,690 5,255 5,731
Plenary Health Bridgepoint, LP7.25% August 31, 2042 7,900 10,502 11,119
Plenary Health Care PartnershipsHumber, LP4.90% May 31, 2039 7,070 7,268 7,7124.82% November 30, 2044 5,922 5,950 6,427
Plenary Health Hamilton, LP5.80% May 31, 2043 6,981 7,842 8,193
Plenary Properties LTAP, LP6.29% January 31, 2044 27,080 32,739 35,407
Power Corp. Canada8.57% April 22, 2039 6,745 9,083 10,224
Power Financial Corp., Note6.90% March 11, 2033 10,084 12,280 13,042
Powerstream, Inc.3.96% July 30, 2042 3,650 3,650 3,676
Royal Bank of Canada4.93% July 16, 2025 24,732 26,178 29,007
Scotiabank Capital Trust, Series 06-15.65% December 31, 2056(1) 20,474 21,133 24,824
SNC-Lavalin Innisfree McGillFinance, Inc.6.63% June 30, 2044 24,187 29,026 30,671
Sun Life Capital Trust, Series B,Secured Note7.09% June 30, 2052 5,561 6,410 6,445
Sun Life Financial, Inc., (MTN)5.40% May 29, 2042(1) 13,747 13,193 13,671
TD Capital Trust IV10.00% June 30, 2108(1) 13,789 14,569 20,099
The accompanying notes are an integral part of the financial statements. 148
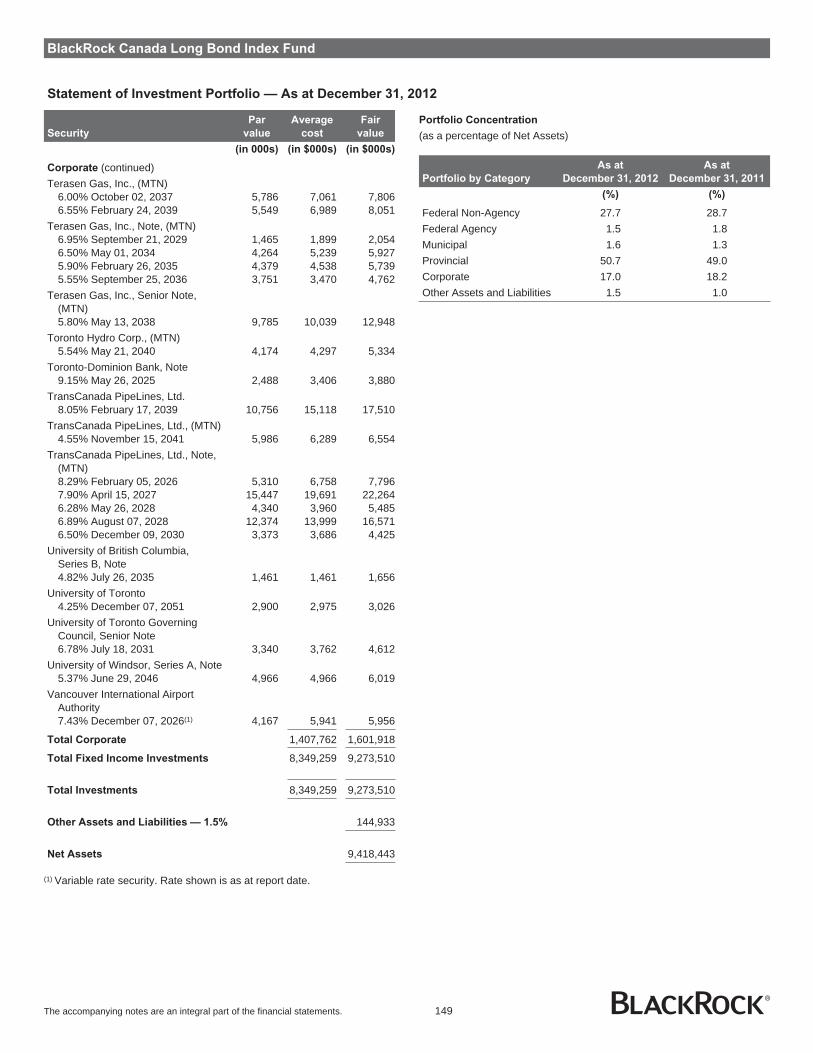
BlackRock Canada Long Bond Index Fund
Statement of Investment Portfolio — As at December 31, 2012
Security
Par
value
Average
cost
Fair
value
(in 000s) (in $000s) (in $000s)
Corporate (continued)Terasen Gas, Inc., (MTN)
6.00% October 02, 2037 5,786 7,061 7,8066.55% February 24, 2039 5,549 6,989 8,051
Terasen Gas, Inc., Note, (MTN)6.95% September 21, 2029 1,465 1,899 2,0546.50% May 01, 2034 4,264 5,239 5,9275.90% February 26, 2035 4,379 4,538 5,7395.55% September 25, 2036 3,751 3,470 4,762
Terasen Gas, Inc., Senior Note,(MTN)5.80% May 13, 2038 9,785 10,039 12,948
Toronto Hydro Corp., (MTN)5.54% May 21, 2040 4,174 4,297 5,334
Toronto-Dominion Bank, Note9.15% May 26, 2025 2,488 3,406 3,880
TransCanada PipeLines, Ltd.8.05% February 17, 2039 10,756 15,118 17,510
TransCanada PipeLines, Ltd., (MTN)4.55% November 15, 2041 5,986 6,289 6,554
TransCanada PipeLines, Ltd., Note,(MTN)8.29% February 05, 2026 5,310 6,758 7,7967.90% April 15, 2027 15,447 19,691 22,2646.28% May 26, 2028 4,340 3,960 5,4856.89% August 07, 2028 12,374 13,999 16,5716.50% December 09, 2030 3,373 3,686 4,425
University of British Columbia,Series B, Note4.82% July 26, 2035 1,461 1,461 1,656
University of Toronto4.25% December 07, 2051 2,900 2,975 3,026
University of Toronto GoverningCouncil, Senior Note6.78% July 18, 2031 3,340 3,762 4,612
University of Windsor, Series A, Note5.37% June 29, 2046 4,966 4,966 6,019
Vancouver International AirportAuthority7.43% December 07, 2026(1) 4,167 5,941 5,956
Total Corporate 1,407,762 1,601,918
Total Fixed Income Investments 8,349,259 9,273,510
Total Investments 8,349,259 9,273,510
Other Assets and Liabilities — 1.5% 144,933
Net Assets 9,418,443
(1) Variable rate security. Rate shown is as at report date.
Portfolio Concentration
(as a percentage of Net Assets)
Portfolio by Category
As at
December 31, 2012
As at
December 31, 2011
(%) (%)
Federal Non-Agency 27.7 28.7Federal Agency 1.5 1.8Municipal 1.6 1.3Provincial 50.7 49.0Corporate 17.0 18.2Other Assets and Liabilities 1.5 1.0
The accompanying notes are an integral part of the financial statements. 149
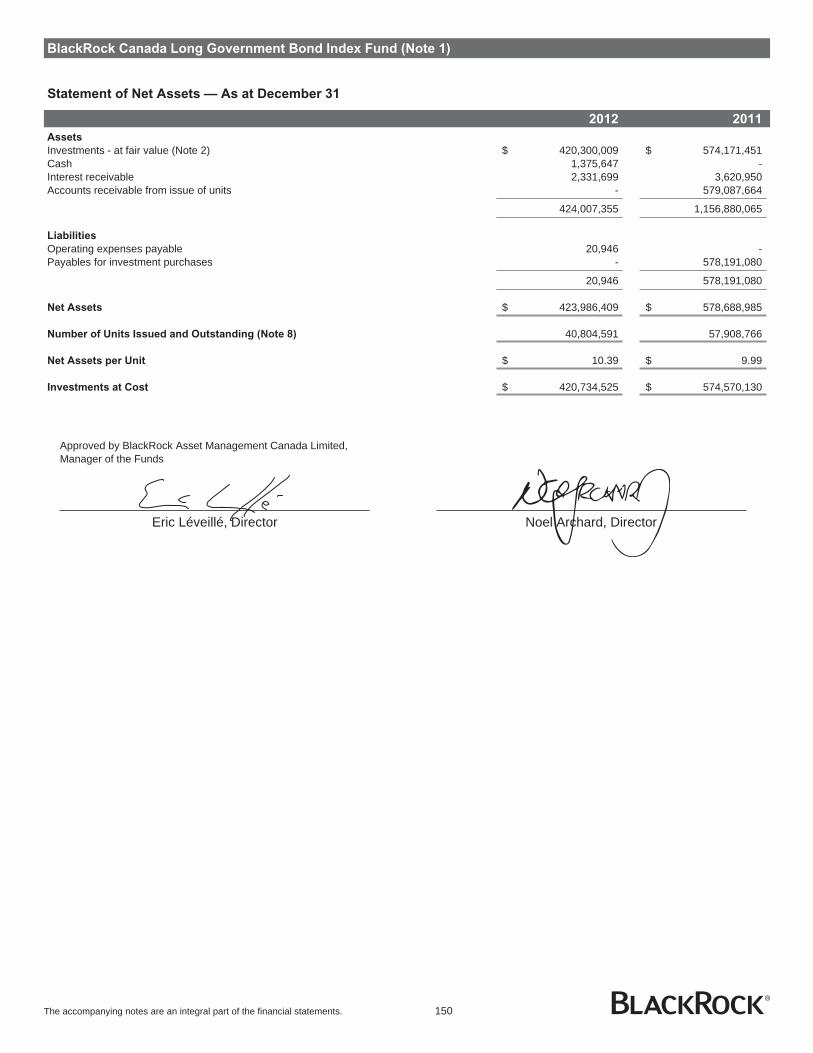
BlackRock Canada Long Government Bond Index Fund (Note 1)
Statement of Net Assets — As at December 31
2012 2011
Assets
Investments - at fair value (Note 2) $ 420,300,009 $ 574,171,451Cash 1,375,647 -Interest receivable 2,331,699 3,620,950Accounts receivable from issue of units - 579,087,664
424,007,355 1,156,880,065
Liabilities
Operating expenses payable 20,946 -Payables for investment purchases - 578,191,080
20,946 578,191,080
Net Assets $ 423,986,409 $ 578,688,985
Number of Units Issued and Outstanding (Note 8) 40,804,591 57,908,766
Net Assets per Unit $ 10.39 $ 9.99
Investments at Cost $ 420,734,525 $ 574,570,130
Approved by BlackRock Asset Management Canada Limited,Manager of the Funds
Eric Léveillé, Director Noel Archard, Director
The accompanying notes are an integral part of the financial statements. 150

BlackRock Canada Long Government Bond Index Fund (Note 1)
Statement of Operations — For the Periods Ended December 31
2012 2011
Revenue
Interest income $ 19,296,649 $ -
19,296,649 -
Expenses
Custodian fees 16,470 -Fund accounting expenses 54,525 -Unitholder communication costs 316 -Audit fees 12,459 -Securities filing fees 7,619 -Independent review committee fees 147 -Other operating expenses 2,226 -
93,762 -
Net Investment Income for the Period 19,202,887 -
Loss on Investments
Net realized loss on sale of investments (1,667,786) -Net change in unrealized depreciation in value of investments (35,837) (398,679)
Net Loss on Investments (1,703,623) (398,679)
Increase (Decrease) in Net Assets from Operations $ 17,499,264 $ (398,679)
Increase (Decrease) in Net Assets from Operations per Unit $ 0.36 $ (0.01)
Statement of Changes in Net Assets — For the Periods Ended December 31
2012 2011
Net Assets - Beginning of Period $ 578,688,985 $ -
Increase (Decrease) in Net Assets from Operations 17,499,264 (398,679)
Capital Transactions
Proceeds from issue of units - 579,087,664Reinvestment of distributions 19,203,691 -Redemption of units (172,201,840) -
Net capital transactions (152,998,149) 579,087,664
Distributions
From net investment income (19,203,691) -
Total distributions (19,203,691) -
Increase (Decrease) in Net Assets for the Period (154,702,576) 578,688,985
Net Assets - End of Period $ 423,986,409 $ 578,688,985
The accompanying notes are an integral part of the financial statements. 151

BlackRock Canada Long Government Bond Index Fund
Statement of Investment Portfolio — As at December 31, 2012
Security
Par
value
Average
cost
Fair
value
(in 000s) (in $000s) (in $000s)
Fixed Income Investments
Government Federal
Non-Agency — 33.3%
Government of Canada8.00% June 01, 2023 3,970 6,349 6,2671.50% June 01, 2023 6,137 5,940 5,9069.00% June 01, 2025 3,148 5,631 5,5658.00% June 01, 2027 4,501 7,848 7,7805.75% June 01, 2029 15,080 22,325 22,4065.75% June 01, 2033 16,202 24,997 25,1605.00% June 01, 2037 18,103 26,559 26,7884.00% June 01, 2041 21,716 28,761 29,0293.50% December 01, 2045 9,604 11,965 12,101
140,375 141,002
Federal Agency — 1.9%
Asian Development Bank, SeriesMPLE, Senior Unsecured Note4.65% February 16, 2027 844 980 985
Canada Post Corp.4.08% July 16, 2025 1,034 1,199 1,2044.36% July 16, 2040 818 1,022 1,027
Inter-American Development Bank,Note4.40% January 26, 2026 1,525 1,731 1,735
Royal Office Finance LP, Series A,Note5.21% November 12, 2037 2,022 2,415 2,399
South Coast British ColumbiaTransportation Authority4.65% June 20, 2041 400 453 4593.85% February 09, 2052 200 205 202
8,005 8,011
Municipal — 2.1%
Alberta Capital Finance Authority,(MTN)4.45% December 15, 2025 500 580 580
City of Montreal6.00% June 01, 2043 1,078 1,468 1,465
City of Ottawa4.60% July 14, 2042 530 588 602
City of Toronto5.20% June 01, 2040 1,200 1,479 1,4734.70% June 10, 2041 1,061 1,220 1,216
City of Vancouver3.70% October 18, 2052 200 199 197
City of Winnipeg5.20% July 17, 2036 300 361 360
Municipal Finance Authority of BritishColumbia5.35% December 02, 2024 150 180 1814.98% April 06, 2025 94 108 1064.95% December 01, 2027 558 661 654
Peel Regional Municipality5.10% June 29, 2040 872 1,068 1,0623.85% October 30, 2042 450 448 455
Security
Par
value
Average
cost
Fair
value
(in 000s) (in $000s) (in $000s)
Municipal (continued)Regional Municipality of Halton
4.05% October 11, 2041 250 252 259Regional Municipality of York
4.00% May 31, 2032 600 616 618
9,228 9,228
Provincial — 60.2%
Centre Hospitalier de L’universite deMontreal4.45% October 01, 2049 128 137 137
Financement-Quebec5.25% June 01, 2034 2,409 2,999 2,974
Hydro Quebec6.00% August 15, 2031 903 1,224 1,2145.00% February 15, 2050 3,662 4,824 4,811
Hydro Quebec, (MTN)6.00% February 15, 2040 1,807 2,594 2,564
Hydro Quebec, Series 19, Note6.50% February 15, 2035 3,386 4,949 4,885
Hydro Quebec, Series JM, Note5.00% February 15, 2045 2,041 2,639 2,622
OPB Finance Trust3.89% July 04, 2042 650 650 660
Province of Alberta4.50% December 01, 2040 1,045 1,282 1,288
Province of Alberta Canada, (MTN)2.90% September 20, 2029 600 587 589
Province of British Columbia8.00% September 08, 2023 544 814 8049.00% August 23, 2024 412 670 6596.15% November 19, 2027 400 547 5465.70% June 18, 2029 3,850 5,110 5,1146.35% June 18, 2031 2,065 2,956 2,9515.40% June 18, 2035 784 1,037 1,0384.70% June 18, 2037 2,054 2,509 2,5154.30% June 18, 2042 4,946 5,856 5,865
Province of British Columbia,Unsecured Note3.20% June 18, 2044 900 891 886
Province of British Columbia, (MTN)5.62% August 17, 2028(1) 43 56 564.95% June 18, 2040 2,850 3,662 3,668
Province of Manitoba7.75% December 22, 2025 513 781 76810.50% March 05, 2031 218 437 4325.70% March 05, 2037 958 1,324 1,3214.60% March 05, 2038 1,378 1,659 1,6594.65% March 05, 2040 1,073 1,313 1,3144.10% March 05, 2041 1,445 1,638 1,6424.40% March 05, 2042 746 886 8923.35% March 05, 2043 700 702 704
Province of Manitoba, (MTN)4.40% September 05, 2025 856 981 9776.30% March 05, 2031 525 746 741
The accompanying notes are an integral part of the financial statements. 152
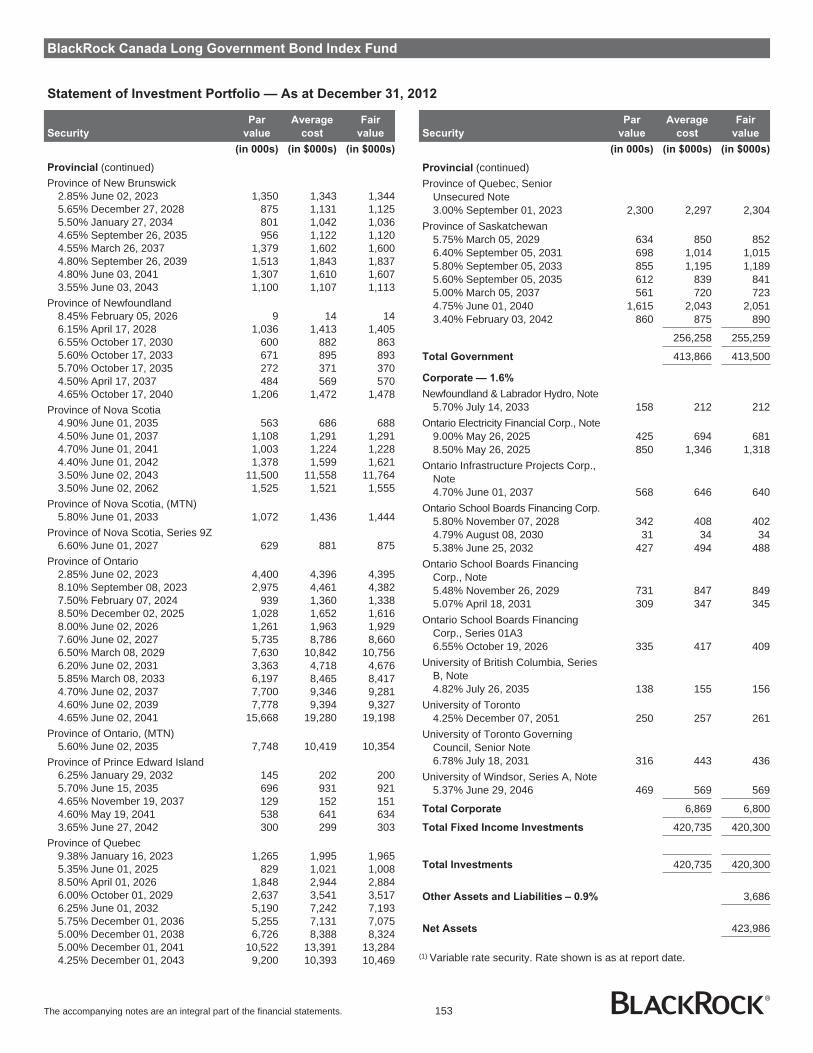
BlackRock Canada Long Government Bond Index Fund
Statement of Investment Portfolio — As at December 31, 2012
Security
Par
value
Average
cost
Fair
value
(in 000s) (in $000s) (in $000s)
Provincial (continued)Province of New Brunswick
2.85% June 02, 2023 1,350 1,343 1,3445.65% December 27, 2028 875 1,131 1,1255.50% January 27, 2034 801 1,042 1,0364.65% September 26, 2035 956 1,122 1,1204.55% March 26, 2037 1,379 1,602 1,6004.80% September 26, 2039 1,513 1,843 1,8374.80% June 03, 2041 1,307 1,610 1,6073.55% June 03, 2043 1,100 1,107 1,113
Province of Newfoundland8.45% February 05, 2026 9 14 146.15% April 17, 2028 1,036 1,413 1,4056.55% October 17, 2030 600 882 8635.60% October 17, 2033 671 895 8935.70% October 17, 2035 272 371 3704.50% April 17, 2037 484 569 5704.65% October 17, 2040 1,206 1,472 1,478
Province of Nova Scotia4.90% June 01, 2035 563 686 6884.50% June 01, 2037 1,108 1,291 1,2914.70% June 01, 2041 1,003 1,224 1,2284.40% June 01, 2042 1,378 1,599 1,6213.50% June 02, 2043 11,500 11,558 11,7643.50% June 02, 2062 1,525 1,521 1,555
Province of Nova Scotia, (MTN)5.80% June 01, 2033 1,072 1,436 1,444
Province of Nova Scotia, Series 9Z6.60% June 01, 2027 629 881 875
Province of Ontario2.85% June 02, 2023 4,400 4,396 4,3958.10% September 08, 2023 2,975 4,461 4,3827.50% February 07, 2024 939 1,360 1,3388.50% December 02, 2025 1,028 1,652 1,6168.00% June 02, 2026 1,261 1,963 1,9297.60% June 02, 2027 5,735 8,786 8,6606.50% March 08, 2029 7,630 10,842 10,7566.20% June 02, 2031 3,363 4,718 4,6765.85% March 08, 2033 6,197 8,465 8,4174.70% June 02, 2037 7,700 9,346 9,2814.60% June 02, 2039 7,778 9,394 9,3274.65% June 02, 2041 15,668 19,280 19,198
Province of Ontario, (MTN)5.60% June 02, 2035 7,748 10,419 10,354
Province of Prince Edward Island6.25% January 29, 2032 145 202 2005.70% June 15, 2035 696 931 9214.65% November 19, 2037 129 152 1514.60% May 19, 2041 538 641 6343.65% June 27, 2042 300 299 303
Province of Quebec9.38% January 16, 2023 1,265 1,995 1,9655.35% June 01, 2025 829 1,021 1,0088.50% April 01, 2026 1,848 2,944 2,8846.00% October 01, 2029 2,637 3,541 3,5176.25% June 01, 2032 5,190 7,242 7,1935.75% December 01, 2036 5,255 7,131 7,0755.00% December 01, 2038 6,726 8,388 8,3245.00% December 01, 2041 10,522 13,391 13,2844.25% December 01, 2043 9,200 10,393 10,469
Security
Par
value
Average
cost
Fair
value
(in 000s) (in $000s) (in $000s)
Provincial (continued)Province of Quebec, Senior
Unsecured Note3.00% September 01, 2023 2,300 2,297 2,304
Province of Saskatchewan5.75% March 05, 2029 634 850 8526.40% September 05, 2031 698 1,014 1,0155.80% September 05, 2033 855 1,195 1,1895.60% September 05, 2035 612 839 8415.00% March 05, 2037 561 720 7234.75% June 01, 2040 1,615 2,043 2,0513.40% February 03, 2042 860 875 890
256,258 255,259
Total Government 413,866 413,500
Corporate — 1.6%
Newfoundland & Labrador Hydro, Note5.70% July 14, 2033 158 212 212
Ontario Electricity Financial Corp., Note9.00% May 26, 2025 425 694 6818.50% May 26, 2025 850 1,346 1,318
Ontario Infrastructure Projects Corp.,Note4.70% June 01, 2037 568 646 640
Ontario School Boards Financing Corp.5.80% November 07, 2028 342 408 4024.79% August 08, 2030 31 34 345.38% June 25, 2032 427 494 488
Ontario School Boards FinancingCorp., Note5.48% November 26, 2029 731 847 8495.07% April 18, 2031 309 347 345
Ontario School Boards FinancingCorp., Series 01A36.55% October 19, 2026 335 417 409
University of British Columbia, SeriesB, Note4.82% July 26, 2035 138 155 156
University of Toronto4.25% December 07, 2051 250 257 261
University of Toronto GoverningCouncil, Senior Note6.78% July 18, 2031 316 443 436
University of Windsor, Series A, Note5.37% June 29, 2046 469 569 569
Total Corporate 6,869 6,800
Total Fixed Income Investments 420,735 420,300
Total Investments 420,735 420,300
Other Assets and Liabilities – 0.9% 3,686
Net Assets 423,986
(1) Variable rate security. Rate shown is as at report date.
The accompanying notes are an integral part of the financial statements. 153
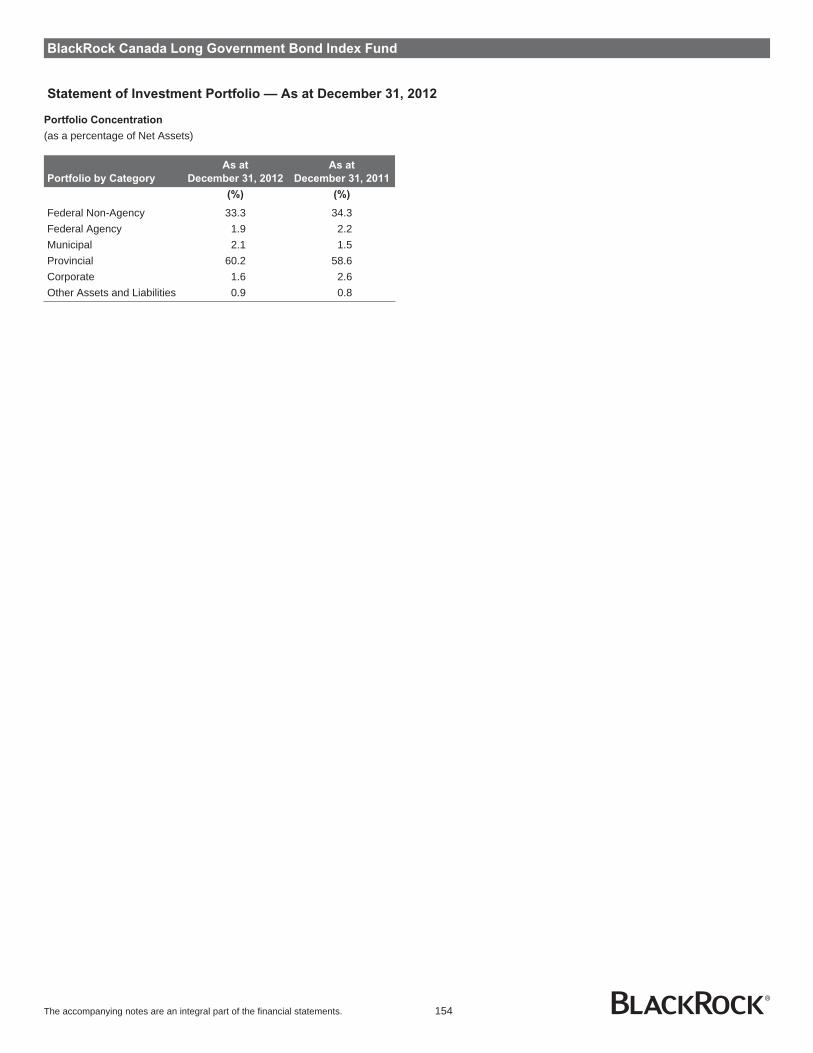
BlackRock Canada Long Government Bond Index Fund
Statement of Investment Portfolio — As at December 31, 2012
Portfolio Concentration
(as a percentage of Net Assets)
Portfolio by Category
As at
December 31, 2012
As at
December 31, 2011
(%) (%)
Federal Non-Agency 33.3 34.3Federal Agency 1.9 2.2Municipal 2.1 1.5Provincial 60.2 58.6Corporate 1.6 2.6Other Assets and Liabilities 0.9 0.8
The accompanying notes are an integral part of the financial statements. 154
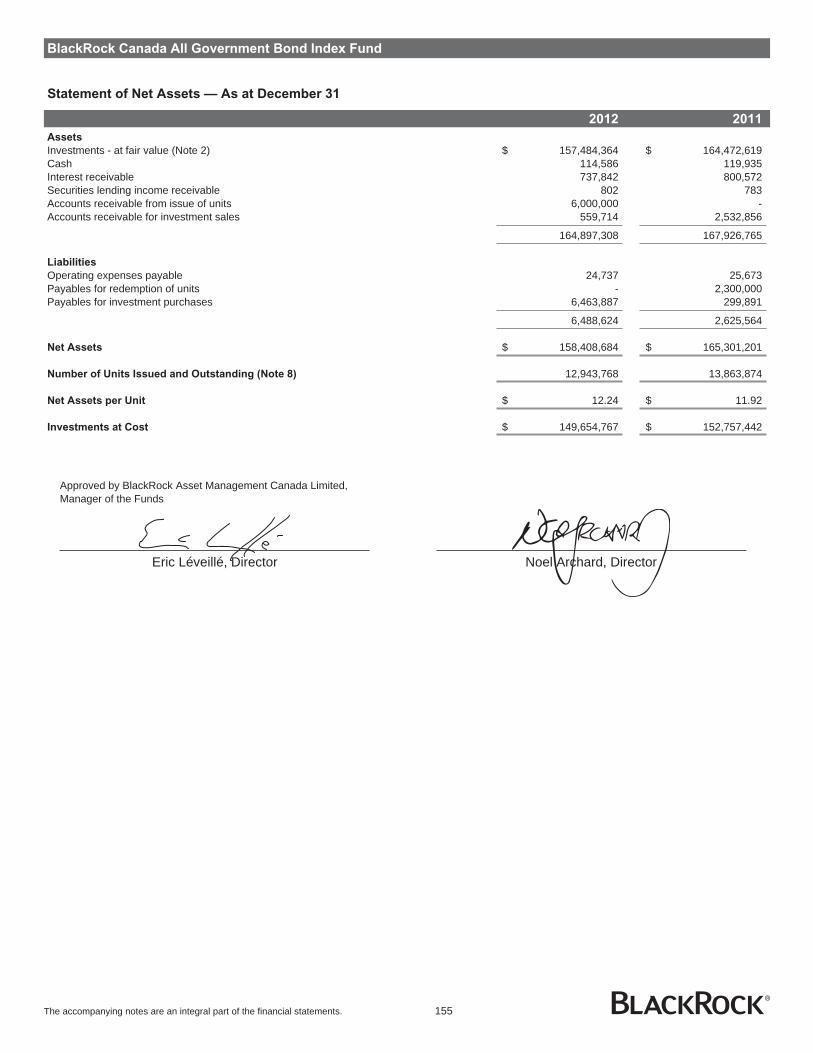
BlackRock Canada All Government Bond Index Fund
Statement of Net Assets — As at December 31
2012 2011
Assets
Investments - at fair value (Note 2) $ 157,484,364 $ 164,472,619Cash 114,586 119,935Interest receivable 737,842 800,572Securities lending income receivable 802 783Accounts receivable from issue of units 6,000,000 -Accounts receivable for investment sales 559,714 2,532,856
164,897,308 167,926,765
Liabilities
Operating expenses payable 24,737 25,673Payables for redemption of units - 2,300,000Payables for investment purchases 6,463,887 299,891
6,488,624 2,625,564
Net Assets $ 158,408,684 $ 165,301,201
Number of Units Issued and Outstanding (Note 8) 12,943,768 13,863,874
Net Assets per Unit $ 12.24 $ 11.92
Investments at Cost $ 149,654,767 $ 152,757,442
Approved by BlackRock Asset Management Canada Limited,Manager of the Funds
Eric Léveillé, Director Noel Archard, Director
The accompanying notes are an integral part of the financial statements. 155
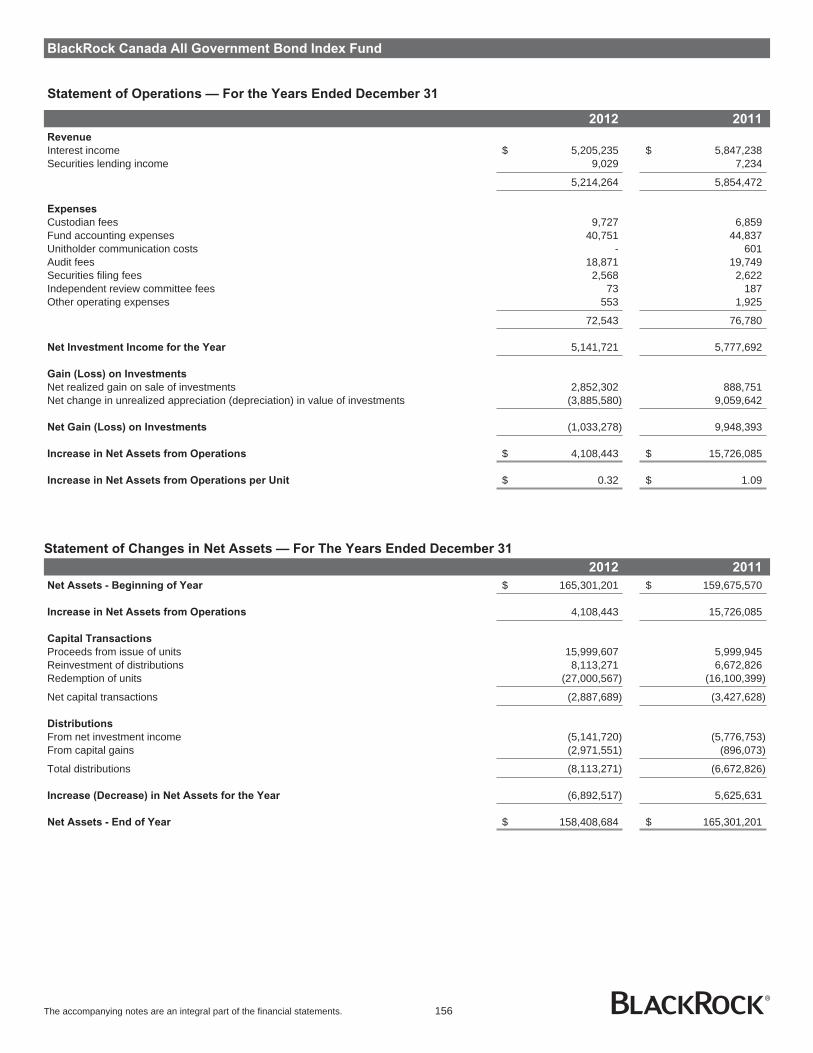
BlackRock Canada All Government Bond Index Fund
Statement of Operations — For the Years Ended December 31
2012 2011
Revenue
Interest income $ 5,205,235 $ 5,847,238Securities lending income 9,029 7,234
5,214,264 5,854,472
Expenses
Custodian fees 9,727 6,859Fund accounting expenses 40,751 44,837Unitholder communication costs - 601Audit fees 18,871 19,749Securities filing fees 2,568 2,622Independent review committee fees 73 187Other operating expenses 553 1,925
72,543 76,780
Net Investment Income for the Year 5,141,721 5,777,692
Gain (Loss) on Investments
Net realized gain on sale of investments 2,852,302 888,751Net change in unrealized appreciation (depreciation) in value of investments (3,885,580) 9,059,642
Net Gain (Loss) on Investments (1,033,278) 9,948,393
Increase in Net Assets from Operations $ 4,108,443 $ 15,726,085
Increase in Net Assets from Operations per Unit $ 0.32 $ 1.09
Statement of Changes in Net Assets — For The Years Ended December 31
2012 2011
Net Assets - Beginning of Year $ 165,301,201 $ 159,675,570
Increase in Net Assets from Operations 4,108,443 15,726,085
Capital Transactions
Proceeds from issue of units 15,999,607 5,999,945Reinvestment of distributions 8,113,271 6,672,826Redemption of units (27,000,567) (16,100,399)
Net capital transactions (2,887,689) (3,427,628)
Distributions
From net investment income (5,141,720) (5,776,753)From capital gains (2,971,551) (896,073)
Total distributions (8,113,271) (6,672,826)
Increase (Decrease) in Net Assets for the Year (6,892,517) 5,625,631
Net Assets - End of Year $ 158,408,684 $ 165,301,201
The accompanying notes are an integral part of the financial statements. 156
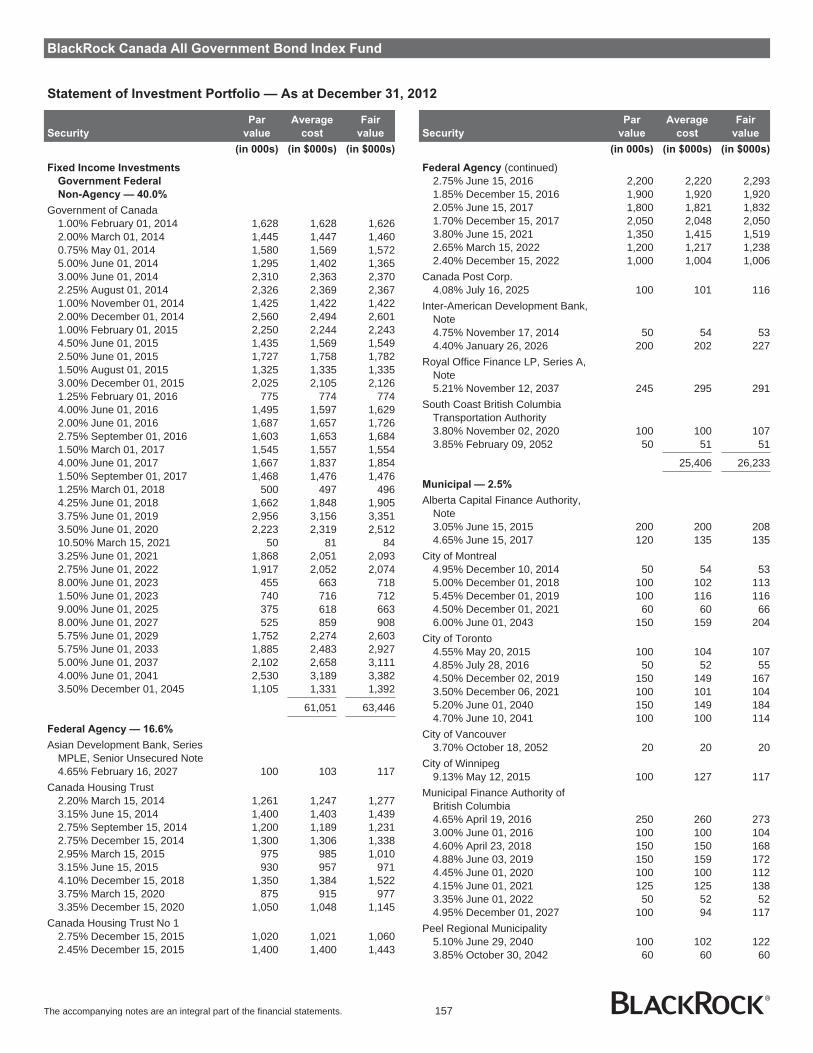
BlackRock Canada All Government Bond Index Fund
Statement of Investment Portfolio — As at December 31, 2012
Security
Par
value
Average
cost
Fair
value
(in 000s) (in $000s) (in $000s)
Fixed Income Investments
Government Federal
Non-Agency — 40.0%
Government of Canada1.00% February 01, 2014 1,628 1,628 1,6262.00% March 01, 2014 1,445 1,447 1,4600.75% May 01, 2014 1,580 1,569 1,5725.00% June 01, 2014 1,295 1,402 1,3653.00% June 01, 2014 2,310 2,363 2,3702.25% August 01, 2014 2,326 2,369 2,3671.00% November 01, 2014 1,425 1,422 1,4222.00% December 01, 2014 2,560 2,494 2,6011.00% February 01, 2015 2,250 2,244 2,2434.50% June 01, 2015 1,435 1,569 1,5492.50% June 01, 2015 1,727 1,758 1,7821.50% August 01, 2015 1,325 1,335 1,3353.00% December 01, 2015 2,025 2,105 2,1261.25% February 01, 2016 775 774 7744.00% June 01, 2016 1,495 1,597 1,6292.00% June 01, 2016 1,687 1,657 1,7262.75% September 01, 2016 1,603 1,653 1,6841.50% March 01, 2017 1,545 1,557 1,5544.00% June 01, 2017 1,667 1,837 1,8541.50% September 01, 2017 1,468 1,476 1,4761.25% March 01, 2018 500 497 4964.25% June 01, 2018 1,662 1,848 1,9053.75% June 01, 2019 2,956 3,156 3,3513.50% June 01, 2020 2,223 2,319 2,51210.50% March 15, 2021 50 81 843.25% June 01, 2021 1,868 2,051 2,0932.75% June 01, 2022 1,917 2,052 2,0748.00% June 01, 2023 455 663 7181.50% June 01, 2023 740 716 7129.00% June 01, 2025 375 618 6638.00% June 01, 2027 525 859 9085.75% June 01, 2029 1,752 2,274 2,6035.75% June 01, 2033 1,885 2,483 2,9275.00% June 01, 2037 2,102 2,658 3,1114.00% June 01, 2041 2,530 3,189 3,3823.50% December 01, 2045 1,105 1,331 1,392
61,051 63,446
Federal Agency — 16.6%
Asian Development Bank, SeriesMPLE, Senior Unsecured Note4.65% February 16, 2027 100 103 117
Canada Housing Trust2.20% March 15, 2014 1,261 1,247 1,2773.15% June 15, 2014 1,400 1,403 1,4392.75% September 15, 2014 1,200 1,189 1,2312.75% December 15, 2014 1,300 1,306 1,3382.95% March 15, 2015 975 985 1,0103.15% June 15, 2015 930 957 9714.10% December 15, 2018 1,350 1,384 1,5223.75% March 15, 2020 875 915 9773.35% December 15, 2020 1,050 1,048 1,145
Canada Housing Trust No 12.75% December 15, 2015 1,020 1,021 1,0602.45% December 15, 2015 1,400 1,400 1,443
Security
Par
value
Average
cost
Fair
value
(in 000s) (in $000s) (in $000s)
Federal Agency (continued)2.75% June 15, 2016 2,200 2,220 2,2931.85% December 15, 2016 1,900 1,920 1,9202.05% June 15, 2017 1,800 1,821 1,8321.70% December 15, 2017 2,050 2,048 2,0503.80% June 15, 2021 1,350 1,415 1,5192.65% March 15, 2022 1,200 1,217 1,2382.40% December 15, 2022 1,000 1,004 1,006
Canada Post Corp.4.08% July 16, 2025 100 101 116
Inter-American Development Bank,Note4.75% November 17, 2014 50 54 534.40% January 26, 2026 200 202 227
Royal Office Finance LP, Series A,Note5.21% November 12, 2037 245 295 291
South Coast British ColumbiaTransportation Authority3.80% November 02, 2020 100 100 1073.85% February 09, 2052 50 51 51
25,406 26,233
Municipal — 2.5%
Alberta Capital Finance Authority,Note3.05% June 15, 2015 200 200 2084.65% June 15, 2017 120 135 135
City of Montreal4.95% December 10, 2014 50 54 535.00% December 01, 2018 100 102 1135.45% December 01, 2019 100 116 1164.50% December 01, 2021 60 60 666.00% June 01, 2043 150 159 204
City of Toronto4.55% May 20, 2015 100 104 1074.85% July 28, 2016 50 52 554.50% December 02, 2019 150 149 1673.50% December 06, 2021 100 101 1045.20% June 01, 2040 150 149 1844.70% June 10, 2041 100 100 114
City of Vancouver3.70% October 18, 2052 20 20 20
City of Winnipeg9.13% May 12, 2015 100 127 117
Municipal Finance Authority ofBritish Columbia4.65% April 19, 2016 250 260 2733.00% June 01, 2016 100 100 1044.60% April 23, 2018 150 150 1684.88% June 03, 2019 150 159 1724.45% June 01, 2020 100 100 1124.15% June 01, 2021 125 125 1383.35% June 01, 2022 50 52 524.95% December 01, 2027 100 94 117
Peel Regional Municipality5.10% June 29, 2040 100 102 1223.85% October 30, 2042 60 60 60
The accompanying notes are an integral part of the financial statements. 157

BlackRock Canada All Government Bond Index Fund
Statement of Investment Portfolio — As at December 31, 2012
Security
Par
value
Average
cost
Fair
value
(in 000s) (in $000s) (in $000s)
Municipal (continued)PSP Capital, Inc.
2.94% December 03, 2015 200 200 2072.26% February 16, 2017 95 95 96
Regional Municipality of Halton4.05% October 11, 2041 50 50 52
Regional Municipality of York7.25% June 19, 2017 100 118 1214.50% June 30, 2020 100 100 1124.00% June 30, 2021 100 105 1084.00% May 31, 2032 50 51 51
Ville Montreal5.00% December 01, 2017 50 56 56
3,605 3,884
Provincial — 39.7%
Centre Hospitalier de L’universitede Montreal4.45% October 01, 2049 100 100 107
City of Toronto3.80% December 13, 2042 100 100 100
Financement-Quebec4.25% March 01, 2014 250 263 2593.25% June 01, 2014 300 308 3084.25% December 01, 2015 250 266 2693.50% December 01, 2016 270 280 2873.50% December 01, 2017 290 294 3102.40% December 01, 2018 300 301 3032.45% December 01, 2019 270 270 2705.25% June 01, 2034 250 270 309
Hydro Quebec9.63% July 15, 2022 200 291 3125.00% February 15, 2050 375 463 493
Hydro Quebec, (MTN)6.00% February 15, 2040 200 232 284
Hydro Quebec, Series 19, Note6.50% February 15, 2035 410 508 591
Hydro Quebec, Series HL, Note11.00% August 15, 2020 400 621 633
Hydro Quebec, Series JM, Note5.00% February 15, 2045 250 256 321
Ontario Electricity Financial Corp.,Note8.25% June 22, 2026 300 472 466
OPB Finance Trust3.89% July 04, 2042 75 75 76
Province of Alberta2.75% December 01, 2014 150 149 1541.85% September 01, 2016 200 200 2021.75% June 15, 2017 200 200 2004.00% December 01, 2019 250 256 2802.55% December 15, 2022 250 250 2504.50% December 01, 2040 125 122 154
Province of Alberta1.70% December 15, 2017 100 100 100
Province of Alberta Canada, (MTN)2.90% September 20, 2029 75 74 74
Security
Par
value
Average
cost
Fair
value
(in 000s) (in $000s) (in $000s)
Provincial (continued)Province of British Columbia
5.30% June 18, 2014 100 109 1064.25% June 18, 2014 300 317 3134.70% December 01, 2017 125 144 1425.30% June 17, 2019 50 55 594.10% December 18, 2019 250 245 2803.70% December 18, 2020 315 314 3469.95% May 15, 2021 100 151 1563.25% December 18, 2021 300 308 3182.70% December 18, 2022 200 200 2018.00% September 08, 2023 60 89 899.00% August 23, 2024 100 150 1605.70% June 18, 2029 500 556 6646.35% June 18, 2031 250 321 3575.40% June 18, 2035 100 113 1324.70% June 18, 2037 240 257 2944.30% June 18, 2042 575 601 682
Province of British Columbia,Unsecured Note3.20% June 18, 2044 100 99 98
Province of British Columbia, (MTN)4.65% December 18, 2018 300 314 3454.95% June 18, 2040 325 335 418
Province of Manitoba4.80% December 03, 2014 150 161 1605.20% December 03, 2015 100 114 1114.30% March 01, 2016 100 111 1092.05% December 01, 2016 120 121 1221.85% June 01, 2017 100 100 1004.15% June 03, 2020 200 220 2243.85% December 01, 2021 100 107 1105.70% March 05, 2037 125 169 1724.60% March 05, 2038 160 155 1934.65% March 05, 2040 100 97 1224.10% March 05, 2041 200 191 2274.40% March 05, 2042 50 57 603.35% March 05, 2043 100 99 101
Province of Manitoba4.75% February 11, 2020 100 116 116
Province of Manitoba, (MTN)6.50% September 22, 2017 100 117 1215.50% November 15, 2018 100 119 1194.40% September 05, 2025 150 151 1716.30% March 05, 2031 100 138 141
Province of New Brunswick4.50% February 04, 2015 150 160 1604.30% December 03, 2015 200 211 2164.70% July 21, 2016 200 218 2214.45% March 26, 2018 250 258 2804.40% June 03, 2019 200 226 2254.50% June 02, 2020 275 282 3133.35% December 03, 2021 201 204 2122.85% June 02, 2023 100 100 1005.65% December 27, 2028 80 103 1035.50% January 27, 2034 100 129 1294.65% September 26, 2035 120 124 1414.55% March 26, 2037 170 170 1974.80% September 26, 2039 175 171 213
The accompanying notes are an integral part of the financial statements. 158

BlackRock Canada All Government Bond Index Fund
Statement of Investment Portfolio — As at December 31, 2012
Security
Par
value
Average
cost
Fair
value
(in 000s) (in $000s) (in $000s)
Provincial (continued)4.80% June 03, 2041 150 184 1843.55% June 03, 2043 50 50 51
Province of Newfoundland10.95% April 15, 2021 100 158 1628.45% February 05, 2026 100 145 1576.15% April 17, 2028 100 121 1366.55% October 17, 2030 100 144 1444.50% April 17, 2037 115 115 1354.65% October 17, 2040 100 97 123
Province of Nova Scotia1.90% September 08, 2017 945 943 9464.15% November 25, 2019 200 199 2234.10% June 01, 2021 200 200 2236.60% December 01, 2031 50 72 724.90% June 01, 2035 50 60 614.50% June 01, 2037 150 139 1754.70% June 01, 2041 100 101 1224.40% June 01, 2042 170 190 2003.50% June 02, 2043 1,575 1,590 1,6113.50% June 02, 2062 175 174 178
Province of Nova Scotia, (MTN)5.80% June 01, 2033 100 135 135
Province of Nova Scotia, Series 9Z6.60% June 01, 2027 100 140 139
Province of Ontario5.00% March 08, 2014 1,250 1,350 1,3053.25% September 08, 2014 640 654 6614.50% March 08, 2015 500 531 5333.15% September 08, 2015 451 470 4714.40% March 08, 2016 550 578 5983.20% September 08, 2016 200 199 2114.30% March 08, 2017 950 986 1,0464.20% March 08, 2018 700 716 7764.40% June 02, 2019 1,450 1,532 1,6364.20% June 02, 2020 1,550 1,573 1,7374.00% June 02, 2021 1,650 1,716 1,8263.15% June 02, 2022 1,975 2,014 2,0442.85% June 02, 2023 500 499 4998.10% September 08, 2023 250 335 3687.50% February 07, 2024 200 287 2858.50% December 02, 2025 350 509 5507.60% June 02, 2027 650 878 9826.50% March 08, 2029 800 987 1,1286.20% June 02, 2031 375 467 5215.85% March 08, 2033 725 890 9854.70% June 02, 2037 1,025 1,080 1,2364.60% June 02, 2039 940 960 1,1274.65% June 02, 2041 1,600 1,731 1,960
Province of Ontario, (MTN)5.50% June 02, 2018 130 153 1534.85% June 02, 2020 100 117 1165.60% June 02, 2035 950 1,112 1,270
Province of Ontario, Series HC9.50% July 13, 2022 150 219 233
Province of Prince Edward Island4.25% September 24, 2019 100 100 1124.65% November 19, 2037 100 98 1173.65% June 27, 2042 50 50 51
Security
Par
value
Average
cost
Fair
value
(in 000s) (in $000s) (in $000s)
Provincial (continued)Province of Quebec
5.50% December 01, 2014 396 433 4275.00% December 01, 2015 600 654 6594.50% December 01, 2016 540 568 5964.50% December 01, 2017 800 844 8954.50% December 01, 2019 850 896 9644.50% December 01, 2020 1,075 1,137 1,2234.25% December 01, 2021 1,200 1,275 1,3423.50% December 01, 2022 1,175 1,219 1,2385.35% June 01, 2025 100 122 1228.50% April 01, 2026 300 422 4686.00% October 01, 2029 300 341 4006.25% June 01, 2032 690 870 9565.75% December 01, 2036 625 744 8415.00% December 01, 2038 750 818 9285.00% December 01, 2041 1,258 1,367 1,5884.25% December 01, 2043 1,015 1,132 1,155
Province of Quebec, SeniorUnsecured Note3.00% September 01, 2023 300 300 301
Province of Quebec, (MTN)4.50% December 01, 2018 700 717 790
Province of Saskatchewan3.90% July 28, 2020 100 100 1125.75% March 05, 2029 75 100 1016.40% September 05, 2031 100 119 1455.80% September 05, 2033 100 138 1395.60% September 05, 2035 75 102 1035.00% March 05, 2037 70 90 904.75% June 01, 2040 200 203 2543.40% February 03, 2042 100 102 103
58,659 62,915
Total Government 148,721 156,478
Corporate — 0.6%
Cadillac Fairview Finance Trust3.24% January 25, 2016 300 300 3123.64% May 09, 2018 150 150 1604.31% January 25, 2021 300 300 336
CDP Financial, Inc.4.60% July 15, 2020 175 184 198
Total Corporate 934 1,006
Total Fixed Income Investments 149,655 157,484
Total Investments 149,655 157,484
Other Assets and Liabilities – 0.6% 925
Net Assets 158,409
The accompanying notes are an integral part of the financial statements. 159
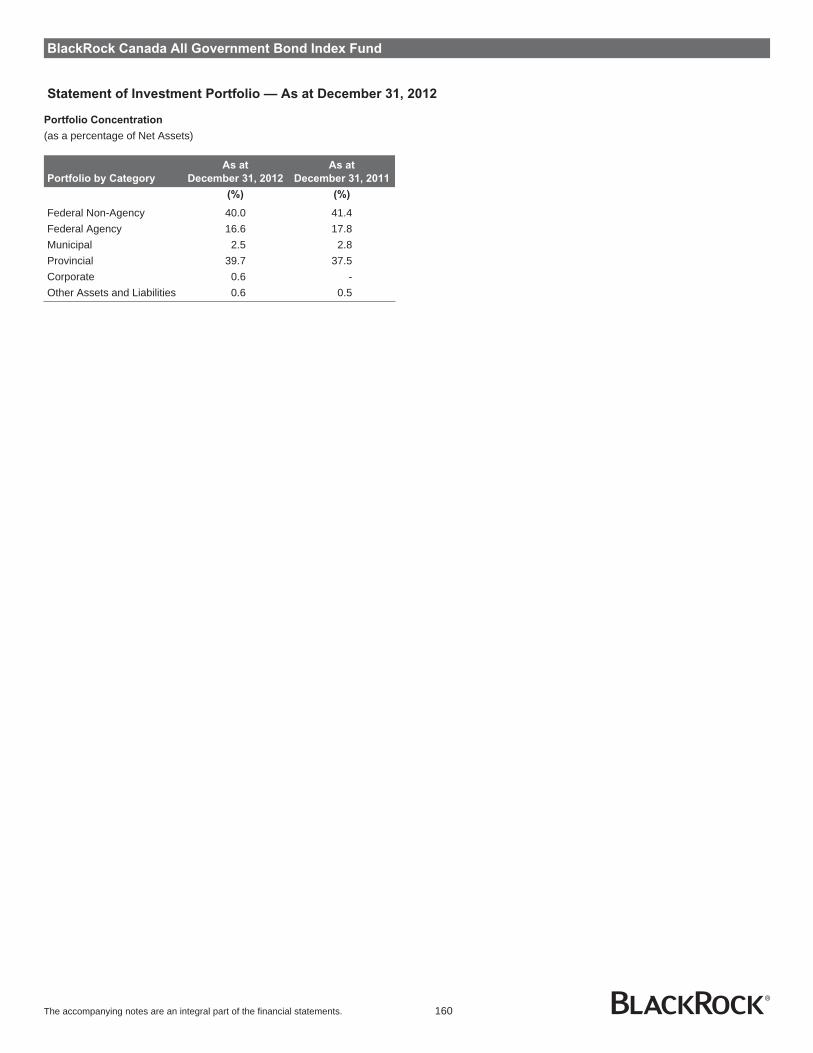
BlackRock Canada All Government Bond Index Fund
Statement of Investment Portfolio — As at December 31, 2012
Portfolio Concentration
(as a percentage of Net Assets)
Portfolio by Category
As at
December 31, 2012
As at
December 31, 2011
(%) (%)
Federal Non-Agency 40.0 41.4Federal Agency 16.6 17.8Municipal 2.5 2.8Provincial 39.7 37.5Corporate 0.6 -Other Assets and Liabilities 0.6 0.5
The accompanying notes are an integral part of the financial statements. 160

BlackRock Canada Credit-Screened Bond Index Fund
Statement of Net Assets — As at December 31
2012 2011
Assets
Investments - at fair value (Note 2) $ 287,495,494 $ 159,333,440Cash 1,971,035 90,824Interest receivable 2,601,501 2,119,829Securities lending income receivable 202 138Accounts receivable from issue of units 2,000,000 -
294,068,232 161,544,231
Liabilities
Operating expenses payable 25,917 24,613Payables for investment purchases 828,280 440,719
854,197 465,332
Net Assets $ 293,214,035 $ 161,078,899
Number of Units Issued and Outstanding (Note 8) 23,028,512 13,441,927
Net Assets per Unit $ 12.73 $ 11.98
Investments at Cost $ 281,466,695 $ 152,675,997
Approved by BlackRock Asset Management Canada Limited,Manager of the Funds
Eric Léveillé, Director Noel Archard, Director
The accompanying notes are an integral part of the financial statements. 161

BlackRock Canada Credit-Screened Bond Index Fund
Statement of Operations — For the Years Ended December 31
2012 2011
Revenue
Interest income $ 12,404,908 $ 8,008,348Securities lending income 2,294 544
12,407,202 8,008,892
Expenses
Custodian fees 10,776 4,788Fund accounting expenses 43,894 44,734Unitholder communication costs - 601Audit fees 18,917 19,744Securities filing fees 4,785 2,546Independent review committee fees 112 181Other operating expenses 1,123 1,907
79,607 74,501
Net Investment Income for the Year 12,327,595 7,934,391
Gain on Investments
Net realized gain on sale of investments 4,968,397 732,860Net change in unrealized appreciation (depreciation) in value of investments (628,644) 4,474,837
Net Gain on Investments 4,339,753 5,207,697
Increase in Net Assets from Operations $ 16,667,348 $ 13,142,088
Increase in Net Assets from Operations per Unit $ 0.73 $ 0.96
Statement of Changes in Net Assets — For the Years Ended December 31
2012 2011
Net Assets - Beginning of Year $ 161,078,899 $ 158,937,726
Increase in Net Assets from Operations 16,667,348 13,142,088
Capital Transactions
Proceeds from issue of units 225,268,922 2,999,781Reinvestment of distributions 17,297,832 8,670,779Redemption of units (109,801,134) (14,000,696)
Net capital transactions 132,765,620 (2,330,136)
Distributions
From net investment income (12,327,823) (7,934,045)From capital gains (4,970,009) (736,734)
Total distributions (17,297,832) (8,670,779)
Increase in Net Assets for the Year 132,135,136 2,141,173
Net Assets - End of Year $ 293,214,035 $ 161,078,899
The accompanying notes are an integral part of the financial statements. 162
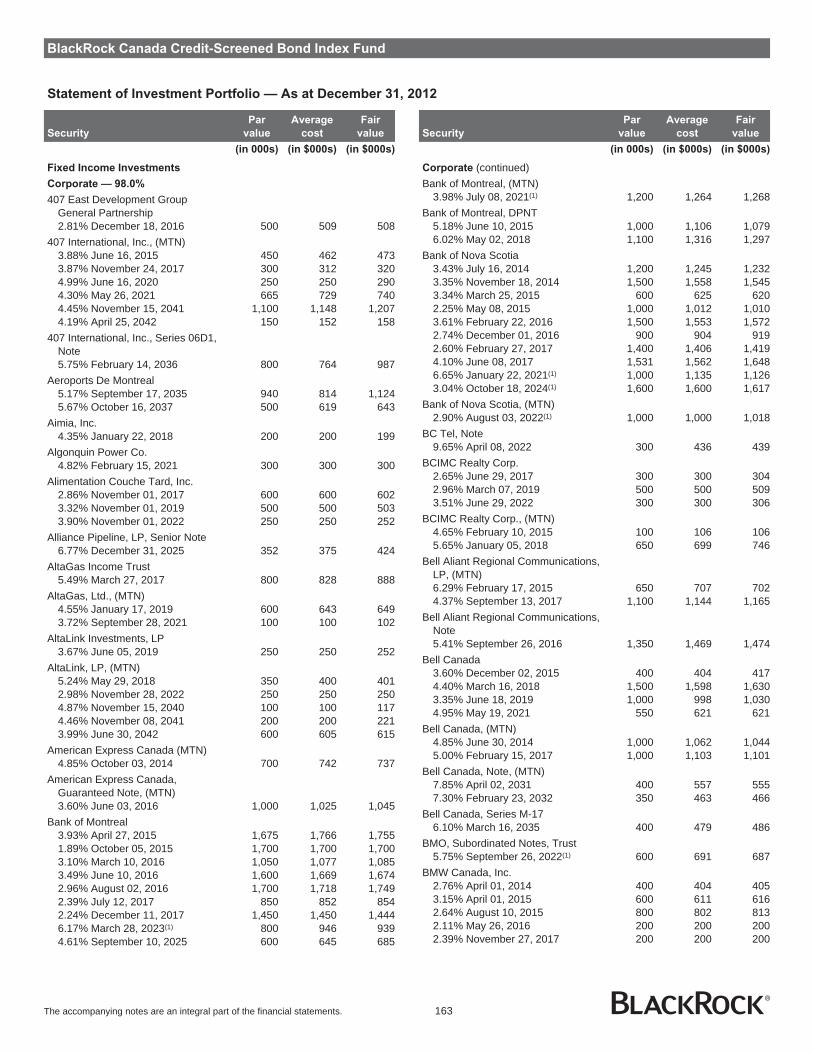
BlackRock Canada Credit-Screened Bond Index Fund
Statement of Investment Portfolio — As at December 31, 2012
Security
Par
value
Average
cost
Fair
value
(in 000s) (in $000s) (in $000s)
Fixed Income Investments
Corporate — 98.0%
407 East Development GroupGeneral Partnership2.81% December 18, 2016 500 509 508
407 International, Inc., (MTN)3.88% June 16, 2015 450 462 4733.87% November 24, 2017 300 312 3204.99% June 16, 2020 250 250 2904.30% May 26, 2021 665 729 7404.45% November 15, 2041 1,100 1,148 1,2074.19% April 25, 2042 150 152 158
407 International, Inc., Series 06D1,Note5.75% February 14, 2036 800 764 987
Aeroports De Montreal5.17% September 17, 2035 940 814 1,1245.67% October 16, 2037 500 619 643
Aimia, Inc.4.35% January 22, 2018 200 200 199
Algonquin Power Co.4.82% February 15, 2021 300 300 300
Alimentation Couche Tard, Inc.2.86% November 01, 2017 600 600 6023.32% November 01, 2019 500 500 5033.90% November 01, 2022 250 250 252
Alliance Pipeline, LP, Senior Note6.77% December 31, 2025 352 375 424
AltaGas Income Trust5.49% March 27, 2017 800 828 888
AltaGas, Ltd., (MTN)4.55% January 17, 2019 600 643 6493.72% September 28, 2021 100 100 102
AltaLink Investments, LP3.67% June 05, 2019 250 250 252
AltaLink, LP, (MTN)5.24% May 29, 2018 350 400 4012.98% November 28, 2022 250 250 2504.87% November 15, 2040 100 100 1174.46% November 08, 2041 200 200 2213.99% June 30, 2042 600 605 615
American Express Canada (MTN)4.85% October 03, 2014 700 742 737
American Express Canada,Guaranteed Note, (MTN)3.60% June 03, 2016 1,000 1,025 1,045
Bank of Montreal3.93% April 27, 2015 1,675 1,766 1,7551.89% October 05, 2015 1,700 1,700 1,7003.10% March 10, 2016 1,050 1,077 1,0853.49% June 10, 2016 1,600 1,669 1,6742.96% August 02, 2016 1,700 1,718 1,7492.39% July 12, 2017 850 852 8542.24% December 11, 2017 1,450 1,450 1,4446.17% March 28, 2023(1) 800 946 9394.61% September 10, 2025 600 645 685
Security
Par
value
Average
cost
Fair
value
(in 000s) (in $000s) (in $000s)
Corporate (continued)Bank of Montreal, (MTN)
3.98% July 08, 2021(1) 1,200 1,264 1,268Bank of Montreal, DPNT
5.18% June 10, 2015 1,000 1,106 1,0796.02% May 02, 2018 1,100 1,316 1,297
Bank of Nova Scotia3.43% July 16, 2014 1,200 1,245 1,2323.35% November 18, 2014 1,500 1,558 1,5453.34% March 25, 2015 600 625 6202.25% May 08, 2015 1,000 1,012 1,0103.61% February 22, 2016 1,500 1,553 1,5722.74% December 01, 2016 900 904 9192.60% February 27, 2017 1,400 1,406 1,4194.10% June 08, 2017 1,531 1,562 1,6486.65% January 22, 2021(1) 1,000 1,135 1,1263.04% October 18, 2024(1) 1,600 1,600 1,617
Bank of Nova Scotia, (MTN)2.90% August 03, 2022(1) 1,000 1,000 1,018
BC Tel, Note9.65% April 08, 2022 300 436 439
BCIMC Realty Corp.2.65% June 29, 2017 300 300 3042.96% March 07, 2019 500 500 5093.51% June 29, 2022 300 300 306
BCIMC Realty Corp., (MTN)4.65% February 10, 2015 100 106 1065.65% January 05, 2018 650 699 746
Bell Aliant Regional Communications,LP, (MTN)6.29% February 17, 2015 650 707 7024.37% September 13, 2017 1,100 1,144 1,165
Bell Aliant Regional Communications,Note5.41% September 26, 2016 1,350 1,469 1,474
Bell Canada3.60% December 02, 2015 400 404 4174.40% March 16, 2018 1,500 1,598 1,6303.35% June 18, 2019 1,000 998 1,0304.95% May 19, 2021 550 621 621
Bell Canada, (MTN)4.85% June 30, 2014 1,000 1,062 1,0445.00% February 15, 2017 1,000 1,103 1,101
Bell Canada, Note, (MTN)7.85% April 02, 2031 400 557 5557.30% February 23, 2032 350 463 466
Bell Canada, Series M-176.10% March 16, 2035 400 479 486
BMO, Subordinated Notes, Trust5.75% September 26, 2022(1) 600 691 687
BMW Canada, Inc.2.76% April 01, 2014 400 404 4053.15% April 01, 2015 600 611 6162.64% August 10, 2015 800 802 8132.11% May 26, 2016 200 200 2002.39% November 27, 2017 200 200 200
The accompanying notes are an integral part of the financial statements. 163
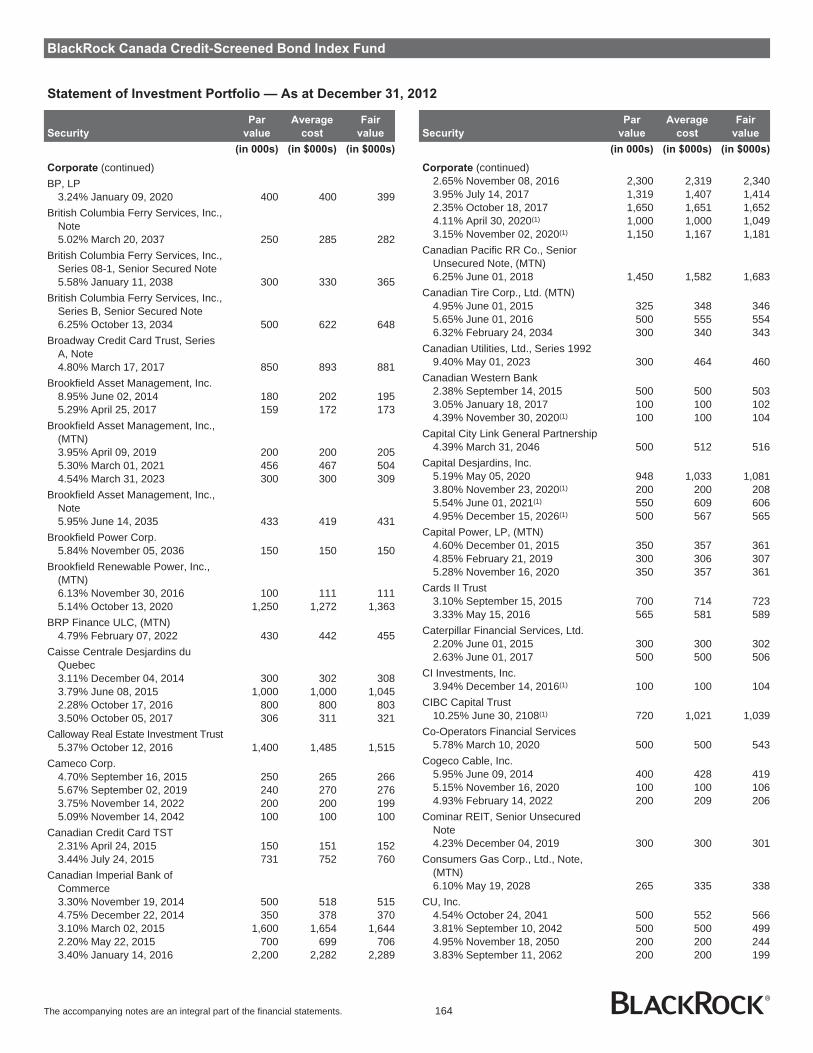
BlackRock Canada Credit-Screened Bond Index Fund
Statement of Investment Portfolio — As at December 31, 2012
Security
Par
value
Average
cost
Fair
value
(in 000s) (in $000s) (in $000s)
Corporate (continued)BP, LP
3.24% January 09, 2020 400 400 399British Columbia Ferry Services, Inc.,
Note5.02% March 20, 2037 250 285 282
British Columbia Ferry Services, Inc.,Series 08-1, Senior Secured Note5.58% January 11, 2038 300 330 365
British Columbia Ferry Services, Inc.,Series B, Senior Secured Note6.25% October 13, 2034 500 622 648
Broadway Credit Card Trust, SeriesA, Note4.80% March 17, 2017 850 893 881
Brookfield Asset Management, Inc.8.95% June 02, 2014 180 202 1955.29% April 25, 2017 159 172 173
Brookfield Asset Management, Inc.,(MTN)3.95% April 09, 2019 200 200 2055.30% March 01, 2021 456 467 5044.54% March 31, 2023 300 300 309
Brookfield Asset Management, Inc.,Note5.95% June 14, 2035 433 419 431
Brookfield Power Corp.5.84% November 05, 2036 150 150 150
Brookfield Renewable Power, Inc.,(MTN)6.13% November 30, 2016 100 111 1115.14% October 13, 2020 1,250 1,272 1,363
BRP Finance ULC, (MTN)4.79% February 07, 2022 430 442 455
Caisse Centrale Desjardins duQuebec3.11% December 04, 2014 300 302 3083.79% June 08, 2015 1,000 1,000 1,0452.28% October 17, 2016 800 800 8033.50% October 05, 2017 306 311 321
Calloway Real Estate Investment Trust5.37% October 12, 2016 1,400 1,485 1,515
Cameco Corp.4.70% September 16, 2015 250 265 2665.67% September 02, 2019 240 270 2763.75% November 14, 2022 200 200 1995.09% November 14, 2042 100 100 100
Canadian Credit Card TST2.31% April 24, 2015 150 151 1523.44% July 24, 2015 731 752 760
Canadian Imperial Bank ofCommerce3.30% November 19, 2014 500 518 5154.75% December 22, 2014 350 378 3703.10% March 02, 2015 1,600 1,654 1,6442.20% May 22, 2015 700 699 7063.40% January 14, 2016 2,200 2,282 2,289
Security
Par
value
Average
cost
Fair
value
(in 000s) (in $000s) (in $000s)
Corporate (continued)2.65% November 08, 2016 2,300 2,319 2,3403.95% July 14, 2017 1,319 1,407 1,4142.35% October 18, 2017 1,650 1,651 1,6524.11% April 30, 2020(1) 1,000 1,000 1,0493.15% November 02, 2020(1) 1,150 1,167 1,181
Canadian Pacific RR Co., SeniorUnsecured Note, (MTN)6.25% June 01, 2018 1,450 1,582 1,683
Canadian Tire Corp., Ltd. (MTN)4.95% June 01, 2015 325 348 3465.65% June 01, 2016 500 555 5546.32% February 24, 2034 300 340 343
Canadian Utilities, Ltd., Series 19929.40% May 01, 2023 300 464 460
Canadian Western Bank2.38% September 14, 2015 500 500 5033.05% January 18, 2017 100 100 1024.39% November 30, 2020(1) 100 100 104
Capital City Link General Partnership4.39% March 31, 2046 500 512 516
Capital Desjardins, Inc.5.19% May 05, 2020 948 1,033 1,0813.80% November 23, 2020(1) 200 200 2085.54% June 01, 2021(1) 550 609 6064.95% December 15, 2026(1) 500 567 565
Capital Power, LP, (MTN)4.60% December 01, 2015 350 357 3614.85% February 21, 2019 300 306 3075.28% November 16, 2020 350 357 361
Cards II Trust3.10% September 15, 2015 700 714 7233.33% May 15, 2016 565 581 589
Caterpillar Financial Services, Ltd.2.20% June 01, 2015 300 300 3022.63% June 01, 2017 500 500 506
CI Investments, Inc.3.94% December 14, 2016(1) 100 100 104
CIBC Capital Trust10.25% June 30, 2108(1) 720 1,021 1,039
Co-Operators Financial Services5.78% March 10, 2020 500 500 543
Cogeco Cable, Inc.5.95% June 09, 2014 400 428 4195.15% November 16, 2020 100 100 1064.93% February 14, 2022 200 209 206
Cominar REIT, Senior UnsecuredNote4.23% December 04, 2019 300 300 301
Consumers Gas Corp., Ltd., Note,(MTN)6.10% May 19, 2028 265 335 338
CU, Inc.4.54% October 24, 2041 500 552 5663.81% September 10, 2042 500 500 4994.95% November 18, 2050 200 200 2443.83% September 11, 2062 200 200 199
The accompanying notes are an integral part of the financial statements. 164
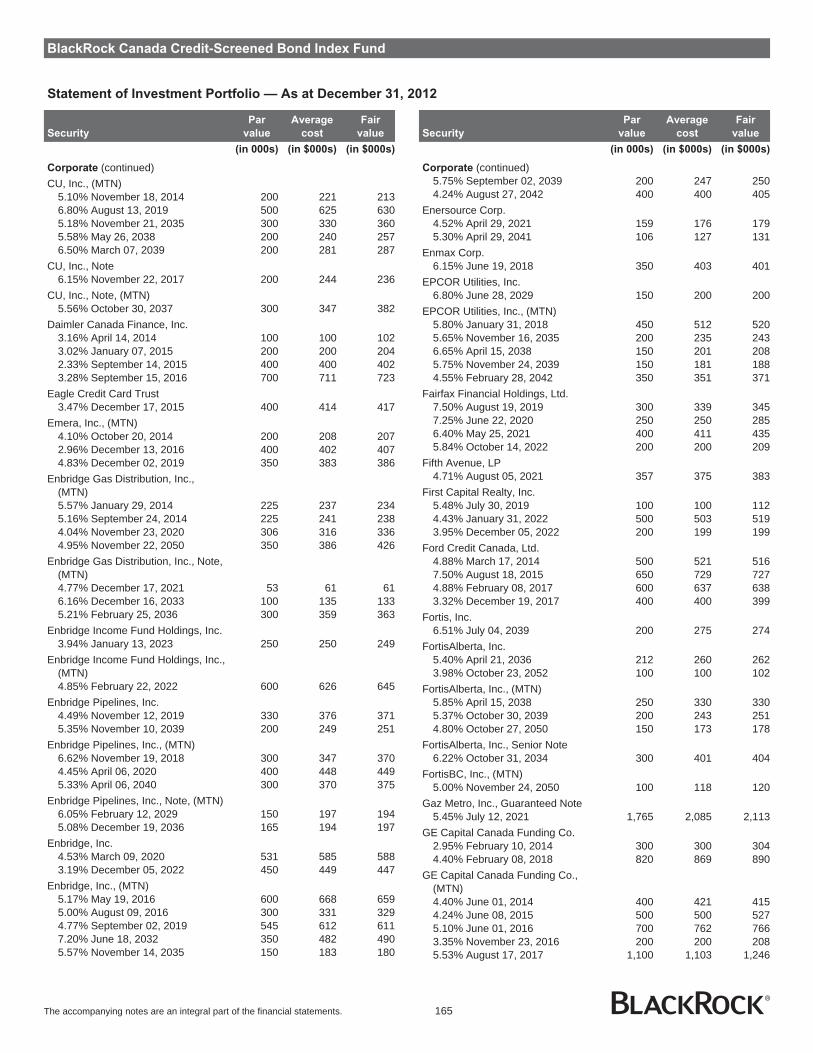
BlackRock Canada Credit-Screened Bond Index Fund
Statement of Investment Portfolio — As at December 31, 2012
Security
Par
value
Average
cost
Fair
value
(in 000s) (in $000s) (in $000s)
Corporate (continued)CU, Inc., (MTN)
5.10% November 18, 2014 200 221 2136.80% August 13, 2019 500 625 6305.18% November 21, 2035 300 330 3605.58% May 26, 2038 200 240 2576.50% March 07, 2039 200 281 287
CU, Inc., Note6.15% November 22, 2017 200 244 236
CU, Inc., Note, (MTN)5.56% October 30, 2037 300 347 382
Daimler Canada Finance, Inc.3.16% April 14, 2014 100 100 1023.02% January 07, 2015 200 200 2042.33% September 14, 2015 400 400 4023.28% September 15, 2016 700 711 723
Eagle Credit Card Trust3.47% December 17, 2015 400 414 417
Emera, Inc., (MTN)4.10% October 20, 2014 200 208 2072.96% December 13, 2016 400 402 4074.83% December 02, 2019 350 383 386
Enbridge Gas Distribution, Inc.,(MTN)5.57% January 29, 2014 225 237 2345.16% September 24, 2014 225 241 2384.04% November 23, 2020 306 316 3364.95% November 22, 2050 350 386 426
Enbridge Gas Distribution, Inc., Note,(MTN)4.77% December 17, 2021 53 61 616.16% December 16, 2033 100 135 1335.21% February 25, 2036 300 359 363
Enbridge Income Fund Holdings, Inc.3.94% January 13, 2023 250 250 249
Enbridge Income Fund Holdings, Inc.,(MTN)4.85% February 22, 2022 600 626 645
Enbridge Pipelines, Inc.4.49% November 12, 2019 330 376 3715.35% November 10, 2039 200 249 251
Enbridge Pipelines, Inc., (MTN)6.62% November 19, 2018 300 347 3704.45% April 06, 2020 400 448 4495.33% April 06, 2040 300 370 375
Enbridge Pipelines, Inc., Note, (MTN)6.05% February 12, 2029 150 197 1945.08% December 19, 2036 165 194 197
Enbridge, Inc.4.53% March 09, 2020 531 585 5883.19% December 05, 2022 450 449 447
Enbridge, Inc., (MTN)5.17% May 19, 2016 600 668 6595.00% August 09, 2016 300 331 3294.77% September 02, 2019 545 612 6117.20% June 18, 2032 350 482 4905.57% November 14, 2035 150 183 180
Security
Par
value
Average
cost
Fair
value
(in 000s) (in $000s) (in $000s)
Corporate (continued)5.75% September 02, 2039 200 247 2504.24% August 27, 2042 400 400 405
Enersource Corp.4.52% April 29, 2021 159 176 1795.30% April 29, 2041 106 127 131
Enmax Corp.6.15% June 19, 2018 350 403 401
EPCOR Utilities, Inc.6.80% June 28, 2029 150 200 200
EPCOR Utilities, Inc., (MTN)5.80% January 31, 2018 450 512 5205.65% November 16, 2035 200 235 2436.65% April 15, 2038 150 201 2085.75% November 24, 2039 150 181 1884.55% February 28, 2042 350 351 371
Fairfax Financial Holdings, Ltd.7.50% August 19, 2019 300 339 3457.25% June 22, 2020 250 250 2856.40% May 25, 2021 400 411 4355.84% October 14, 2022 200 200 209
Fifth Avenue, LP4.71% August 05, 2021 357 375 383
First Capital Realty, Inc.5.48% July 30, 2019 100 100 1124.43% January 31, 2022 500 503 5193.95% December 05, 2022 200 199 199
Ford Credit Canada, Ltd.4.88% March 17, 2014 500 521 5167.50% August 18, 2015 650 729 7274.88% February 08, 2017 600 637 6383.32% December 19, 2017 400 400 399
Fortis, Inc.6.51% July 04, 2039 200 275 274
FortisAlberta, Inc.5.40% April 21, 2036 212 260 2623.98% October 23, 2052 100 100 102
FortisAlberta, Inc., (MTN)5.85% April 15, 2038 250 330 3305.37% October 30, 2039 200 243 2514.80% October 27, 2050 150 173 178
FortisAlberta, Inc., Senior Note6.22% October 31, 2034 300 401 404
FortisBC, Inc., (MTN)5.00% November 24, 2050 100 118 120
Gaz Metro, Inc., Guaranteed Note5.45% July 12, 2021 1,765 2,085 2,113
GE Capital Canada Funding Co.2.95% February 10, 2014 300 300 3044.40% February 08, 2018 820 869 890
GE Capital Canada Funding Co.,(MTN)4.40% June 01, 2014 400 421 4154.24% June 08, 2015 500 500 5275.10% June 01, 2016 700 762 7663.35% November 23, 2016 200 200 2085.53% August 17, 2017 1,100 1,103 1,246
The accompanying notes are an integral part of the financial statements. 165
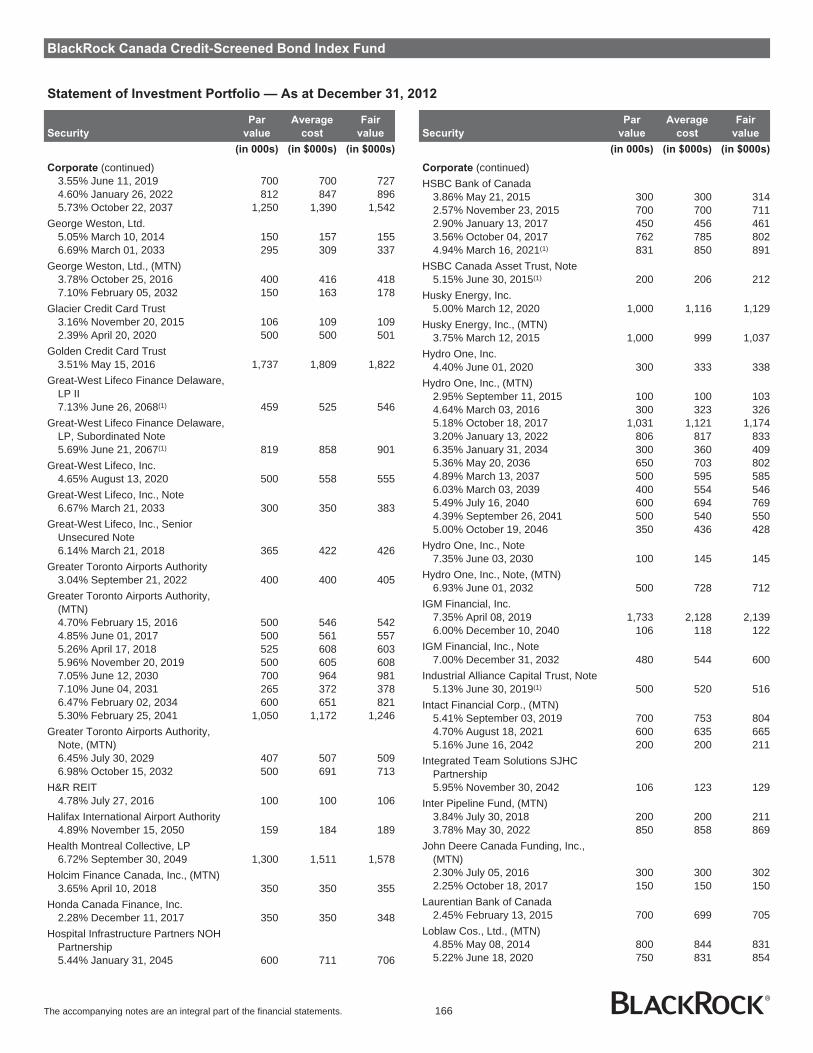
BlackRock Canada Credit-Screened Bond Index Fund
Statement of Investment Portfolio — As at December 31, 2012
Security
Par
value
Average
cost
Fair
value
(in 000s) (in $000s) (in $000s)
Corporate (continued)3.55% June 11, 2019 700 700 7274.60% January 26, 2022 812 847 8965.73% October 22, 2037 1,250 1,390 1,542
George Weston, Ltd.5.05% March 10, 2014 150 157 1556.69% March 01, 2033 295 309 337
George Weston, Ltd., (MTN)3.78% October 25, 2016 400 416 4187.10% February 05, 2032 150 163 178
Glacier Credit Card Trust3.16% November 20, 2015 106 109 1092.39% April 20, 2020 500 500 501
Golden Credit Card Trust3.51% May 15, 2016 1,737 1,809 1,822
Great-West Lifeco Finance Delaware,LP II7.13% June 26, 2068(1) 459 525 546
Great-West Lifeco Finance Delaware,LP, Subordinated Note5.69% June 21, 2067(1) 819 858 901
Great-West Lifeco, Inc.4.65% August 13, 2020 500 558 555
Great-West Lifeco, Inc., Note6.67% March 21, 2033 300 350 383
Great-West Lifeco, Inc., SeniorUnsecured Note6.14% March 21, 2018 365 422 426
Greater Toronto Airports Authority3.04% September 21, 2022 400 400 405
Greater Toronto Airports Authority,(MTN)4.70% February 15, 2016 500 546 5424.85% June 01, 2017 500 561 5575.26% April 17, 2018 525 608 6035.96% November 20, 2019 500 605 6087.05% June 12, 2030 700 964 9817.10% June 04, 2031 265 372 3786.47% February 02, 2034 600 651 8215.30% February 25, 2041 1,050 1,172 1,246
Greater Toronto Airports Authority,Note, (MTN)6.45% July 30, 2029 407 507 5096.98% October 15, 2032 500 691 713
H&R REIT4.78% July 27, 2016 100 100 106
Halifax International Airport Authority4.89% November 15, 2050 159 184 189
Health Montreal Collective, LP6.72% September 30, 2049 1,300 1,511 1,578
Holcim Finance Canada, Inc., (MTN)3.65% April 10, 2018 350 350 355
Honda Canada Finance, Inc.2.28% December 11, 2017 350 350 348
Hospital Infrastructure Partners NOHPartnership5.44% January 31, 2045 600 711 706
Security
Par
value
Average
cost
Fair
value
(in 000s) (in $000s) (in $000s)
Corporate (continued)HSBC Bank of Canada
3.86% May 21, 2015 300 300 3142.57% November 23, 2015 700 700 7112.90% January 13, 2017 450 456 4613.56% October 04, 2017 762 785 8024.94% March 16, 2021(1) 831 850 891
HSBC Canada Asset Trust, Note5.15% June 30, 2015(1) 200 206 212
Husky Energy, Inc.5.00% March 12, 2020 1,000 1,116 1,129
Husky Energy, Inc., (MTN)3.75% March 12, 2015 1,000 999 1,037
Hydro One, Inc.4.40% June 01, 2020 300 333 338
Hydro One, Inc., (MTN)2.95% September 11, 2015 100 100 1034.64% March 03, 2016 300 323 3265.18% October 18, 2017 1,031 1,121 1,1743.20% January 13, 2022 806 817 8336.35% January 31, 2034 300 360 4095.36% May 20, 2036 650 703 8024.89% March 13, 2037 500 595 5856.03% March 03, 2039 400 554 5465.49% July 16, 2040 600 694 7694.39% September 26, 2041 500 540 5505.00% October 19, 2046 350 436 428
Hydro One, Inc., Note7.35% June 03, 2030 100 145 145
Hydro One, Inc., Note, (MTN)6.93% June 01, 2032 500 728 712
IGM Financial, Inc.7.35% April 08, 2019 1,733 2,128 2,1396.00% December 10, 2040 106 118 122
IGM Financial, Inc., Note7.00% December 31, 2032 480 544 600
Industrial Alliance Capital Trust, Note5.13% June 30, 2019(1) 500 520 516
Intact Financial Corp., (MTN)5.41% September 03, 2019 700 753 8044.70% August 18, 2021 600 635 6655.16% June 16, 2042 200 200 211
Integrated Team Solutions SJHCPartnership5.95% November 30, 2042 106 123 129
Inter Pipeline Fund, (MTN)3.84% July 30, 2018 200 200 2113.78% May 30, 2022 850 858 869
John Deere Canada Funding, Inc.,(MTN)2.30% July 05, 2016 300 300 3022.25% October 18, 2017 150 150 150
Laurentian Bank of Canada2.45% February 13, 2015 700 699 705
Loblaw Cos., Ltd., (MTN)4.85% May 08, 2014 800 844 8315.22% June 18, 2020 750 831 854
The accompanying notes are an integral part of the financial statements. 166

BlackRock Canada Credit-Screened Bond Index Fund
Statement of Investment Portfolio — As at December 31, 2012
Security
Par
value
Average
cost
Fair
value
(in 000s) (in $000s) (in $000s)
Corporate (continued)6.85% March 01, 2032 225 273 2696.54% February 17, 2033 350 369 4075.90% January 18, 2036 600 657 653
Lower Mattagami Energy, LP2.23% October 23, 2017 200 200 2004.33% May 18, 2021 250 281 2785.14% May 18, 2041 200 241 240
Manufacturers Life Insurance Co.4.21% November 18, 2021(1) 500 505 5234.17% June 01, 2022(1) 500 502 524
Manulife Financial Capital Trust II7.41% December 31, 2108(1) 1,078 1,192 1,260
Manulife Financial Corp.7.77% April 08, 2019 400 484 500
Manulife Financial Corp., (MTN)4.90% June 02, 2014 800 841 8325.16% June 26, 2015 600 636 6414.08% August 20, 2015 800 815 8365.51% June 26, 2018 519 559 582
Master Credit Card Trust3.50% May 21, 2016 765 793 8032.63% January 21, 2017 1,112 1,124 1,133
Merrill Lynch Canada Finance Co.,(MTN)5.00% February 18, 2014 200 207 206
Metro, Inc., (MTN)5.97% October 15, 2035 550 608 625
National Bank of Canada2.23% January 30, 2015 600 604 6053.15% February 11, 2015 550 566 5654.03% May 26, 2015 500 500 5253.58% April 26, 2016 800 835 8372.70% December 15, 2016 820 832 835
National Bank of Canada, (MTN)4.93% December 22, 2019(1) 660 686 6984.70% November 02, 2020(1) 500 508 5353.26% April 11, 2022(1) 500 500 515
NAV Canada4.40% February 18, 2021 306 340 345
NAV Canada, (MTN)4.71% February 24, 2016 130 142 141
NAV Canada, Note7.56% March 01, 2027 1,125 1,473 1,4467.40% June 01, 2027 300 424 435
NBC Asset Trust7.24% June 30, 2018(1) 500 598 599
NOVA Gas Transmission, Ltd., Series21, Note12.20% February 28, 2016 1,400 1,984 1,812
Nova Scotia Power, Inc., (MTN)5.61% June 15, 2040 400 494 5074.15% March 06, 2042 200 200 205
Nova Scotia Power, Inc., Series S,Note, (MTN)6.95% August 25, 2033 200 278 282
Security
Par
value
Average
cost
Fair
value
(in 000s) (in $000s) (in $000s)
Corporate (continued)Ottawa MacDonald-Cartier
International Airport Authority, Note4.73% May 02, 2017 265 295 292
Pembina Pipeline Corp. (MTN)4.89% March 29, 2021 300 300 3313.77% October 24, 2022 500 500 504
Plenary Health Bridgepoint, LP7.25% August 31, 2042 150 199 211
Plenary Health Care PartnershipsHumber, LP4.90% May 31, 2039 300 325 3274.82% November 30, 2044 200 200 217
Plenary Health Hamilton, LP5.80% May 31, 2043 500 601 587
Plenary Properties LTAP, LP6.29% January 31, 2044 700 867 915
Power Corp. Canada7.57% April 22, 2019 890 988 1,106
Power Financial Corp., Note6.90% March 11, 2033 319 383 413
RBC Capital Trust4.87% December 31, 2015 500 537 538
RBC Capital Trust Securities, Series2018, Note6.82% June 30, 2018(1) 500 603 600
Reliance, LP4.57% March 15, 2017 200 200 2025.19% March 15, 2019 300 300 302
RioCan Real Estate Investment Trust4.50% January 21, 2016 200 211 2113.80% March 01, 2017 200 208 2073.85% June 28, 2019 200 201 2053.72% December 13, 2021 200 200 199
RioCan Real Estate Investment Trust,(MTN)5.65% March 31, 2015 200 215 214
Rogers Communications, Inc.5.80% May 26, 2016 900 972 1,0013.00% June 06, 2017 400 400 4085.38% November 04, 2019 520 588 5944.70% September 29, 2020 900 966 9935.34% March 22, 2021 1,300 1,429 1,4884.00% June 06, 2022 600 598 6256.68% November 04, 2039 550 683 6926.11% August 25, 2040 775 847 910
Rogers Communications, Inc., (MTN)6.56% March 22, 2041 400 474 498
Royal Bank of Canada3.27% November 10, 2014 500 518 5154.71% December 22, 2014 500 535 5292.05% January 13, 2015 1,150 1,153 1,1573.36% January 11, 2016 1,750 1,795 1,8193.03% July 26, 2016 800 809 8252.68% December 08, 2016 1,500 1,513 1,5283.66% January 25, 2017 1,600 1,593 1,6892.58% April 13, 2017 1,300 1,320 1,318
The accompanying notes are an integral part of the financial statements. 167
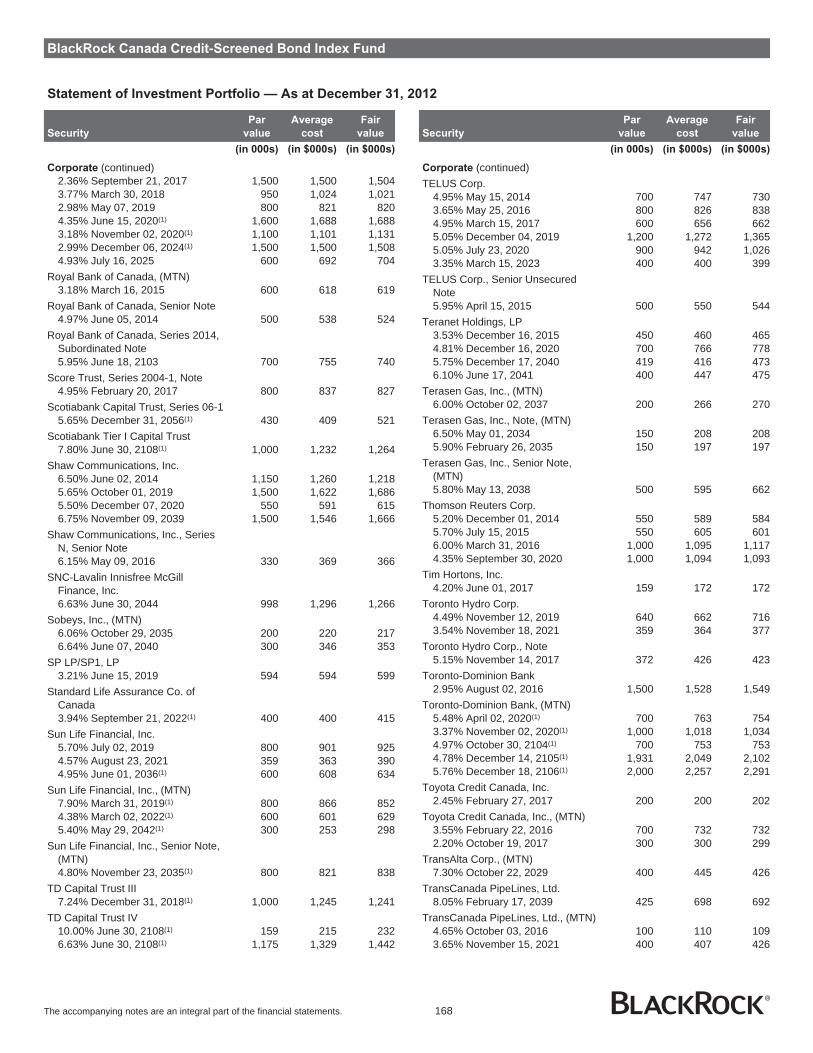
BlackRock Canada Credit-Screened Bond Index Fund
Statement of Investment Portfolio — As at December 31, 2012
Security
Par
value
Average
cost
Fair
value
(in 000s) (in $000s) (in $000s)
Corporate (continued)2.36% September 21, 2017 1,500 1,500 1,5043.77% March 30, 2018 950 1,024 1,0212.98% May 07, 2019 800 821 8204.35% June 15, 2020(1) 1,600 1,688 1,6883.18% November 02, 2020(1) 1,100 1,101 1,1312.99% December 06, 2024(1) 1,500 1,500 1,5084.93% July 16, 2025 600 692 704
Royal Bank of Canada, (MTN)3.18% March 16, 2015 600 618 619
Royal Bank of Canada, Senior Note4.97% June 05, 2014 500 538 524
Royal Bank of Canada, Series 2014,Subordinated Note5.95% June 18, 2103 700 755 740
Score Trust, Series 2004-1, Note4.95% February 20, 2017 800 837 827
Scotiabank Capital Trust, Series 06-15.65% December 31, 2056(1) 430 409 521
Scotiabank Tier I Capital Trust7.80% June 30, 2108(1) 1,000 1,232 1,264
Shaw Communications, Inc.6.50% June 02, 2014 1,150 1,260 1,2185.65% October 01, 2019 1,500 1,622 1,6865.50% December 07, 2020 550 591 6156.75% November 09, 2039 1,500 1,546 1,666
Shaw Communications, Inc., SeriesN, Senior Note6.15% May 09, 2016 330 369 366
SNC-Lavalin Innisfree McGillFinance, Inc.6.63% June 30, 2044 998 1,296 1,266
Sobeys, Inc., (MTN)6.06% October 29, 2035 200 220 2176.64% June 07, 2040 300 346 353
SP LP/SP1, LP3.21% June 15, 2019 594 594 599
Standard Life Assurance Co. ofCanada3.94% September 21, 2022(1) 400 400 415
Sun Life Financial, Inc.5.70% July 02, 2019 800 901 9254.57% August 23, 2021 359 363 3904.95% June 01, 2036(1) 600 608 634
Sun Life Financial, Inc., (MTN)7.90% March 31, 2019(1) 800 866 8524.38% March 02, 2022(1) 600 601 6295.40% May 29, 2042(1) 300 253 298
Sun Life Financial, Inc., Senior Note,(MTN)4.80% November 23, 2035(1) 800 821 838
TD Capital Trust III7.24% December 31, 2018(1) 1,000 1,245 1,241
TD Capital Trust IV10.00% June 30, 2108(1) 159 215 2326.63% June 30, 2108(1) 1,175 1,329 1,442
Security
Par
value
Average
cost
Fair
value
(in 000s) (in $000s) (in $000s)
Corporate (continued)TELUS Corp.
4.95% May 15, 2014 700 747 7303.65% May 25, 2016 800 826 8384.95% March 15, 2017 600 656 6625.05% December 04, 2019 1,200 1,272 1,3655.05% July 23, 2020 900 942 1,0263.35% March 15, 2023 400 400 399
TELUS Corp., Senior UnsecuredNote5.95% April 15, 2015 500 550 544
Teranet Holdings, LP3.53% December 16, 2015 450 460 4654.81% December 16, 2020 700 766 7785.75% December 17, 2040 419 416 4736.10% June 17, 2041 400 447 475
Terasen Gas, Inc., (MTN)6.00% October 02, 2037 200 266 270
Terasen Gas, Inc., Note, (MTN)6.50% May 01, 2034 150 208 2085.90% February 26, 2035 150 197 197
Terasen Gas, Inc., Senior Note,(MTN)5.80% May 13, 2038 500 595 662
Thomson Reuters Corp.5.20% December 01, 2014 550 589 5845.70% July 15, 2015 550 605 6016.00% March 31, 2016 1,000 1,095 1,1174.35% September 30, 2020 1,000 1,094 1,093
Tim Hortons, Inc.4.20% June 01, 2017 159 172 172
Toronto Hydro Corp.4.49% November 12, 2019 640 662 7163.54% November 18, 2021 359 364 377
Toronto Hydro Corp., Note5.15% November 14, 2017 372 426 423
Toronto-Dominion Bank2.95% August 02, 2016 1,500 1,528 1,549
Toronto-Dominion Bank, (MTN)5.48% April 02, 2020(1) 700 763 7543.37% November 02, 2020(1) 1,000 1,018 1,0344.97% October 30, 2104(1) 700 753 7534.78% December 14, 2105(1) 1,931 2,049 2,1025.76% December 18, 2106(1) 2,000 2,257 2,291
Toyota Credit Canada, Inc.2.45% February 27, 2017 200 200 202
Toyota Credit Canada, Inc., (MTN)3.55% February 22, 2016 700 732 7322.20% October 19, 2017 300 300 299
TransAlta Corp., (MTN)7.30% October 22, 2029 400 445 426
TransCanada PipeLines, Ltd.8.05% February 17, 2039 425 698 692
TransCanada PipeLines, Ltd., (MTN)4.65% October 03, 2016 100 110 1093.65% November 15, 2021 400 407 426
The accompanying notes are an integral part of the financial statements. 168
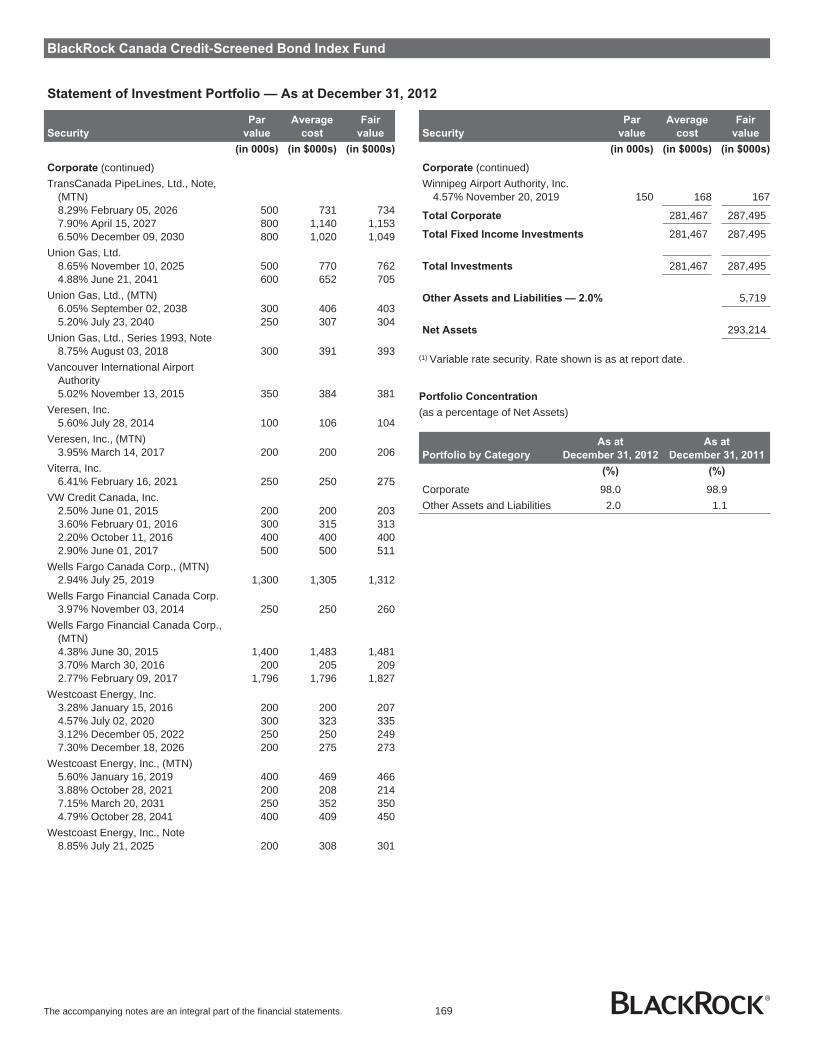
BlackRock Canada Credit-Screened Bond Index Fund
Statement of Investment Portfolio — As at December 31, 2012
Security
Par
value
Average
cost
Fair
value
(in 000s) (in $000s) (in $000s)
Corporate (continued)TransCanada PipeLines, Ltd., Note,
(MTN)8.29% February 05, 2026 500 731 7347.90% April 15, 2027 800 1,140 1,1536.50% December 09, 2030 800 1,020 1,049
Union Gas, Ltd.8.65% November 10, 2025 500 770 7624.88% June 21, 2041 600 652 705
Union Gas, Ltd., (MTN)6.05% September 02, 2038 300 406 4035.20% July 23, 2040 250 307 304
Union Gas, Ltd., Series 1993, Note8.75% August 03, 2018 300 391 393
Vancouver International AirportAuthority5.02% November 13, 2015 350 384 381
Veresen, Inc.5.60% July 28, 2014 100 106 104
Veresen, Inc., (MTN)3.95% March 14, 2017 200 200 206
Viterra, Inc.6.41% February 16, 2021 250 250 275
VW Credit Canada, Inc.2.50% June 01, 2015 200 200 2033.60% February 01, 2016 300 315 3132.20% October 11, 2016 400 400 4002.90% June 01, 2017 500 500 511
Wells Fargo Canada Corp., (MTN)2.94% July 25, 2019 1,300 1,305 1,312
Wells Fargo Financial Canada Corp.3.97% November 03, 2014 250 250 260
Wells Fargo Financial Canada Corp.,(MTN)4.38% June 30, 2015 1,400 1,483 1,4813.70% March 30, 2016 200 205 2092.77% February 09, 2017 1,796 1,796 1,827
Westcoast Energy, Inc.3.28% January 15, 2016 200 200 2074.57% July 02, 2020 300 323 3353.12% December 05, 2022 250 250 2497.30% December 18, 2026 200 275 273
Westcoast Energy, Inc., (MTN)5.60% January 16, 2019 400 469 4663.88% October 28, 2021 200 208 2147.15% March 20, 2031 250 352 3504.79% October 28, 2041 400 409 450
Westcoast Energy, Inc., Note8.85% July 21, 2025 200 308 301
Security
Par
value
Average
cost
Fair
value
(in 000s) (in $000s) (in $000s)
Corporate (continued)Winnipeg Airport Authority, Inc.
4.57% November 20, 2019 150 168 167
Total Corporate 281,467 287,495
Total Fixed Income Investments 281,467 287,495
Total Investments 281,467 287,495
Other Assets and Liabilities — 2.0% 5,719
Net Assets 293,214
(1) Variable rate security. Rate shown is as at report date.
Portfolio Concentration
(as a percentage of Net Assets)
Portfolio by Category
As at
December 31, 2012
As at
December 31, 2011
(%) (%)
Corporate 98.0 98.9Other Assets and Liabilities 2.0 1.1
The accompanying notes are an integral part of the financial statements. 169
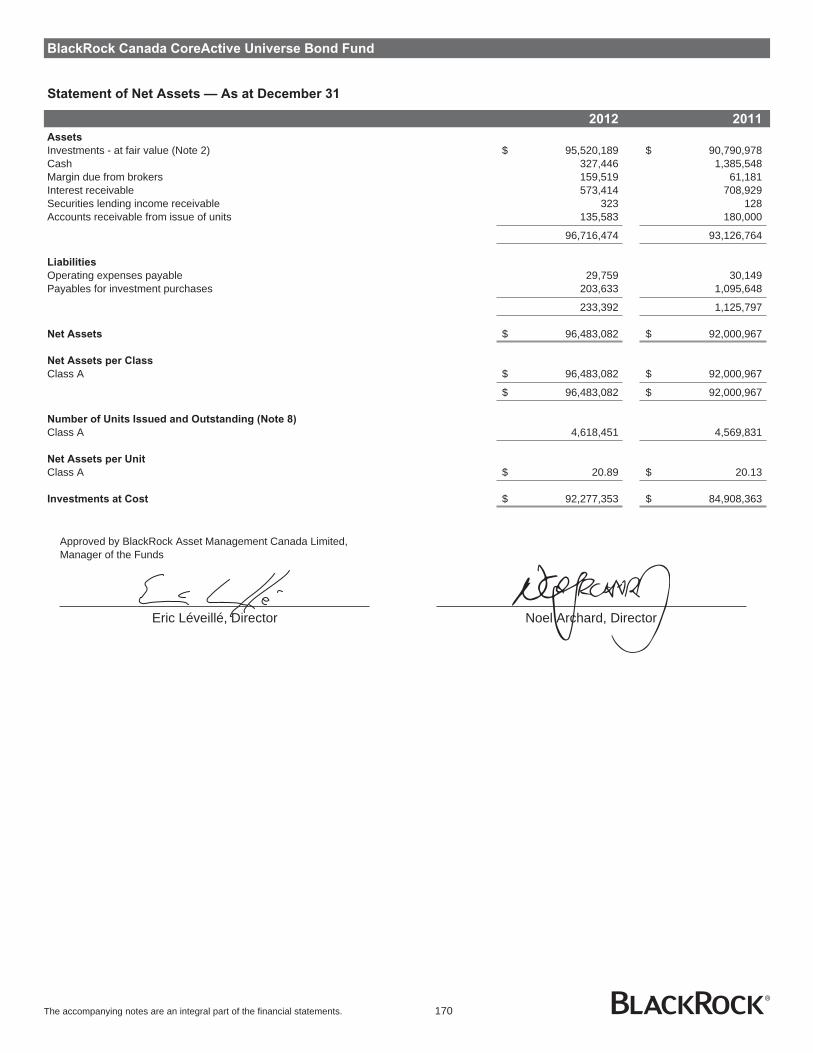
BlackRock Canada CoreActive Universe Bond Fund
Statement of Net Assets — As at December 31
2012 2011
Assets
Investments - at fair value (Note 2) $ 95,520,189 $ 90,790,978Cash 327,446 1,385,548Margin due from brokers 159,519 61,181Interest receivable 573,414 708,929Securities lending income receivable 323 128Accounts receivable from issue of units 135,583 180,000
96,716,474 93,126,764
Liabilities
Operating expenses payable 29,759 30,149Payables for investment purchases 203,633 1,095,648
233,392 1,125,797
Net Assets $ 96,483,082 $ 92,000,967
Net Assets per Class
Class A $ 96,483,082 $ 92,000,967
$ 96,483,082 $ 92,000,967
Number of Units Issued and Outstanding (Note 8)
Class A 4,618,451 4,569,831
Net Assets per Unit
Class A $ 20.89 $ 20.13
Investments at Cost $ 92,277,353 $ 84,908,363
Approved by BlackRock Asset Management Canada Limited,Manager of the Funds
Eric Léveillé, Director Noel Archard, Director
The accompanying notes are an integral part of the financial statements. 170
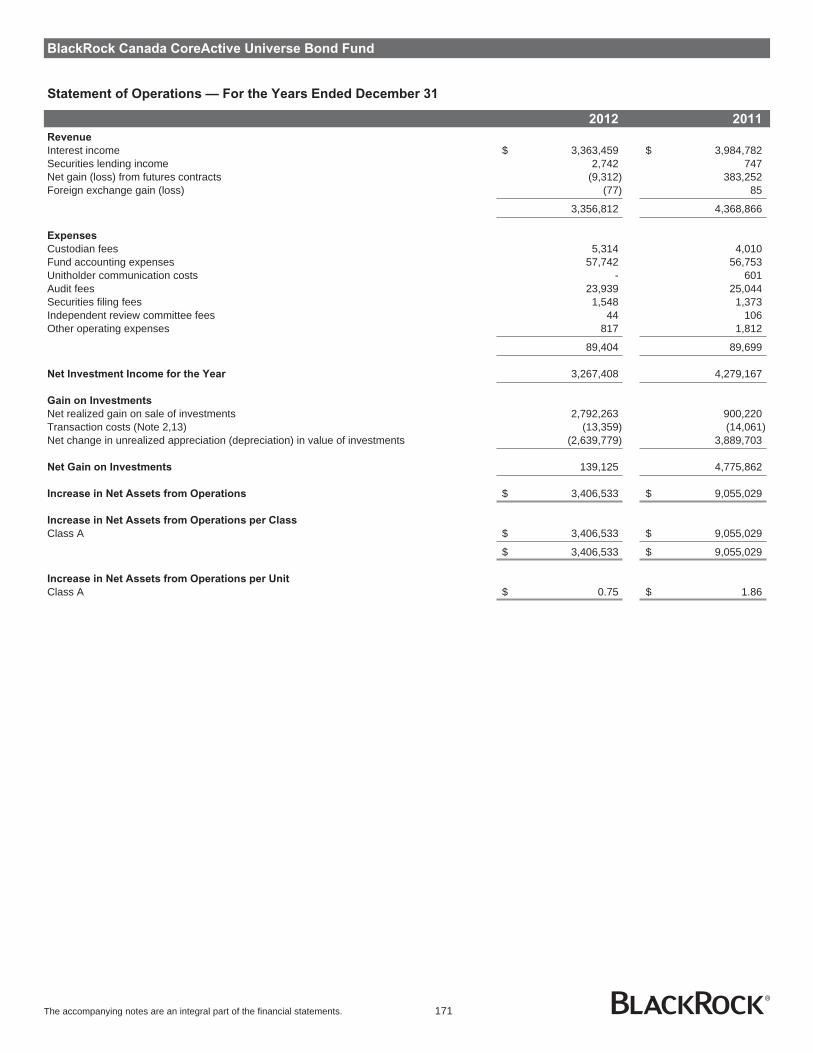
BlackRock Canada CoreActive Universe Bond Fund
Statement of Operations — For the Years Ended December 31
2012 2011
Revenue
Interest income $ 3,363,459 $ 3,984,782Securities lending income 2,742 747Net gain (loss) from futures contracts (9,312) 383,252Foreign exchange gain (loss) (77) 85
3,356,812 4,368,866
Expenses
Custodian fees 5,314 4,010Fund accounting expenses 57,742 56,753Unitholder communication costs - 601Audit fees 23,939 25,044Securities filing fees 1,548 1,373Independent review committee fees 44 106Other operating expenses 817 1,812
89,404 89,699
Net Investment Income for the Year 3,267,408 4,279,167
Gain on Investments
Net realized gain on sale of investments 2,792,263 900,220Transaction costs (Note 2,13) (13,359) (14,061)Net change in unrealized appreciation (depreciation) in value of investments (2,639,779) 3,889,703
Net Gain on Investments 139,125 4,775,862
Increase in Net Assets from Operations $ 3,406,533 $ 9,055,029
Increase in Net Assets from Operations per Class
Class A $ 3,406,533 $ 9,055,029
$ 3,406,533 $ 9,055,029
Increase in Net Assets from Operations per Unit
Class A $ 0.75 $ 1.86
The accompanying notes are an integral part of the financial statements. 171

BlackRock Canada CoreActive Universe Bond Fund
Statement of Changes in Net Assets — For the Years Ended December 31
2012 2011 2012 2011
Fund Class A
Net Assets - Beginning of Year $ 92,000,967 $ 92,745,951 $ 92,000,967 $ 92,745,951
Increase in Net Assets from Operations 3,406,533 9,055,029 3,406,533 9,055,029
Capital Transactions
Proceeds from issue of units 4,088,305 6,088,623 4,088,305 6,088,623Reinvestment of distributions 3,257,828 4,158,367 3,257,828 4,158,367Redemption of units (3,012,723) (15,888,636) (3,012,723) (15,888,636)
Net capital transactions 4,333,410 (5,641,646) 4,333,410 (5,641,646)
Distributions
From net investment income (3,257,828) (4,158,367) (3,257,828) (4,158,367)
Total distributions (3,257,828) (4,158,367) (3,257,828) (4,158,367)
Increase (Decrease) in Net Assets for the Year 4,482,115 (744,984) 4,482,115 (744,984)
Net Assets - End of Year $ 96,483,082 $ 92,000,967 $ 96,483,082 $ 92,000,967
The accompanying notes are an integral part of the financial statements. 172
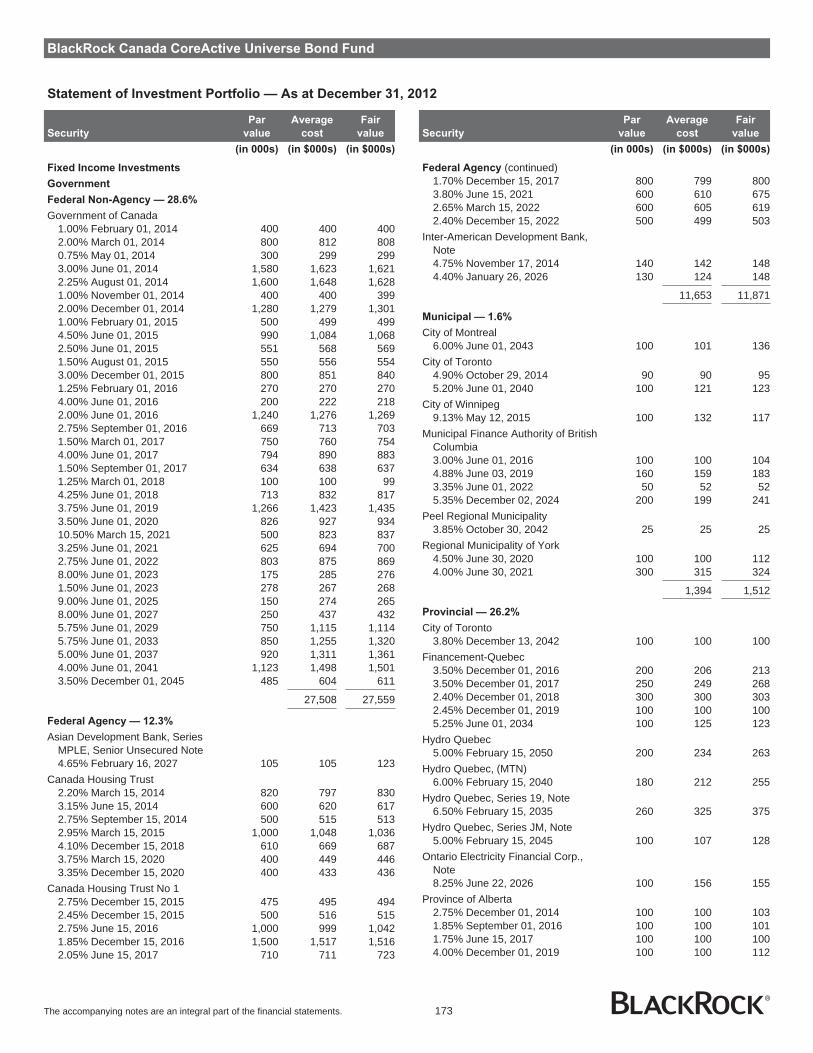
BlackRock Canada CoreActive Universe Bond Fund
Statement of Investment Portfolio — As at December 31, 2012
Security
Par
value
Average
cost
Fair
value
(in 000s) (in $000s) (in $000s)
Fixed Income Investments
Government
Federal Non-Agency — 28.6%
Government of Canada1.00% February 01, 2014 400 400 4002.00% March 01, 2014 800 812 8080.75% May 01, 2014 300 299 2993.00% June 01, 2014 1,580 1,623 1,6212.25% August 01, 2014 1,600 1,648 1,6281.00% November 01, 2014 400 400 3992.00% December 01, 2014 1,280 1,279 1,3011.00% February 01, 2015 500 499 4994.50% June 01, 2015 990 1,084 1,0682.50% June 01, 2015 551 568 5691.50% August 01, 2015 550 556 5543.00% December 01, 2015 800 851 8401.25% February 01, 2016 270 270 2704.00% June 01, 2016 200 222 2182.00% June 01, 2016 1,240 1,276 1,2692.75% September 01, 2016 669 713 7031.50% March 01, 2017 750 760 7544.00% June 01, 2017 794 890 8831.50% September 01, 2017 634 638 6371.25% March 01, 2018 100 100 994.25% June 01, 2018 713 832 8173.75% June 01, 2019 1,266 1,423 1,4353.50% June 01, 2020 826 927 93410.50% March 15, 2021 500 823 8373.25% June 01, 2021 625 694 7002.75% June 01, 2022 803 875 8698.00% June 01, 2023 175 285 2761.50% June 01, 2023 278 267 2689.00% June 01, 2025 150 274 2658.00% June 01, 2027 250 437 4325.75% June 01, 2029 750 1,115 1,1145.75% June 01, 2033 850 1,255 1,3205.00% June 01, 2037 920 1,311 1,3614.00% June 01, 2041 1,123 1,498 1,5013.50% December 01, 2045 485 604 611
27,508 27,559
Federal Agency — 12.3%
Asian Development Bank, SeriesMPLE, Senior Unsecured Note4.65% February 16, 2027 105 105 123
Canada Housing Trust2.20% March 15, 2014 820 797 8303.15% June 15, 2014 600 620 6172.75% September 15, 2014 500 515 5132.95% March 15, 2015 1,000 1,048 1,0364.10% December 15, 2018 610 669 6873.75% March 15, 2020 400 449 4463.35% December 15, 2020 400 433 436
Canada Housing Trust No 12.75% December 15, 2015 475 495 4942.45% December 15, 2015 500 516 5152.75% June 15, 2016 1,000 999 1,0421.85% December 15, 2016 1,500 1,517 1,5162.05% June 15, 2017 710 711 723
Security
Par
value
Average
cost
Fair
value
(in 000s) (in $000s) (in $000s)
Federal Agency (continued)1.70% December 15, 2017 800 799 8003.80% June 15, 2021 600 610 6752.65% March 15, 2022 600 605 6192.40% December 15, 2022 500 499 503
Inter-American Development Bank,Note4.75% November 17, 2014 140 142 1484.40% January 26, 2026 130 124 148
11,653 11,871
Municipal — 1.6%
City of Montreal6.00% June 01, 2043 100 101 136
City of Toronto4.90% October 29, 2014 90 90 955.20% June 01, 2040 100 121 123
City of Winnipeg9.13% May 12, 2015 100 132 117
Municipal Finance Authority of BritishColumbia3.00% June 01, 2016 100 100 1044.88% June 03, 2019 160 159 1833.35% June 01, 2022 50 52 525.35% December 02, 2024 200 199 241
Peel Regional Municipality3.85% October 30, 2042 25 25 25
Regional Municipality of York4.50% June 30, 2020 100 100 1124.00% June 30, 2021 300 315 324
1,394 1,512
Provincial — 26.2%
City of Toronto3.80% December 13, 2042 100 100 100
Financement-Quebec3.50% December 01, 2016 200 206 2133.50% December 01, 2017 250 249 2682.40% December 01, 2018 300 300 3032.45% December 01, 2019 100 100 1005.25% June 01, 2034 100 125 123
Hydro Quebec5.00% February 15, 2050 200 234 263
Hydro Quebec, (MTN)6.00% February 15, 2040 180 212 255
Hydro Quebec, Series 19, Note6.50% February 15, 2035 260 325 375
Hydro Quebec, Series JM, Note5.00% February 15, 2045 100 107 128
Ontario Electricity Financial Corp.,Note8.25% June 22, 2026 100 156 155
Province of Alberta2.75% December 01, 2014 100 100 1031.85% September 01, 2016 100 100 1011.75% June 15, 2017 100 100 1004.00% December 01, 2019 100 100 112
The accompanying notes are an integral part of the financial statements. 173

BlackRock Canada CoreActive Universe Bond Fund
Statement of Investment Portfolio — As at December 31, 2012
Security
Par
value
Average
cost
Fair
value
(in 000s) (in $000s) (in $000s)
Provincial (continued)2.55% December 15, 2022 150 150 1504.50% December 01, 2040 50 63 62
Province of British Columbia4.10% December 18, 2019 125 132 1403.70% December 18, 2020 244 243 2683.25% December 18, 2021 200 199 2122.70% December 18, 2022 100 100 1005.70% June 18, 2029 200 242 2666.35% June 18, 2031 100 141 1434.70% June 18, 2037 50 60 614.30% June 18, 2042 200 244 237
Province of British Columbia, (MTN)4.65% December 18, 2018 300 312 3454.95% June 18, 2040 200 200 257
Province of Manitoba5.20% December 03, 2015 200 204 2214.15% June 03, 2020 100 112 1124.60% March 05, 2038 160 153 1934.65% March 05, 2040 150 180 1844.10% March 05, 2041 100 95 114
Province of Manitoba, (MTN)4.40% September 05, 2025 100 99 114
Province of New Brunswick4.50% February 04, 2015 50 53 534.70% July 21, 2016 100 111 1104.45% March 26, 2018 50 56 564.40% June 03, 2019 200 203 2253.35% December 03, 2021 201 204 2125.65% December 27, 2028 40 43 515.50% January 27, 2034 40 51 524.65% September 26, 2035 50 58 594.55% March 26, 2037 70 81 814.80% September 26, 2039 100 95 1213.55% June 03, 2043 100 100 101
Province of Newfoundland5.25% June 04, 2014 100 106 1066.15% April 17, 2028 50 69 686.55% October 17, 2030 25 37 364.50% April 17, 2037 50 60 594.65% October 17, 2040 50 63 61
Province of Nova Scotia4.60% August 18, 2016 50 50 551.90% September 08, 2017 900 897 9014.15% November 25, 2019 100 112 1124.10% June 01, 2021 50 56 564.50% June 01, 2037 100 93 1174.40% June 01, 2042 200 232 2353.50% June 02, 2043 700 711 716
Province of Nova Scotia, (MTN)5.80% June 01, 2033 50 69 67
Province of Nova Scotia, Series 9Z6.60% June 01, 2027 50 69 70
Province of Ontario5.00% March 08, 2014 470 503 4914.50% March 08, 2015 200 214 2133.15% September 08, 2015 230 237 2404.40% March 08, 2016 200 219 217
Security
Par
value
Average
cost
Fair
value
(in 000s) (in $000s) (in $000s)
Provincial (continued)4.40% June 02, 2019 700 792 7904.20% June 02, 2020 600 673 6734.00% June 02, 2021 500 509 5533.15% June 02, 2022 900 906 9312.85% June 02, 2023 100 100 1008.10% September 08, 2023 310 438 4577.60% June 02, 2027 290 399 4386.50% March 08, 2029 350 496 4936.20% June 02, 2031 150 210 2095.85% March 08, 2033 380 464 5164.70% June 02, 2037 400 473 4824.60% June 02, 2039 400 480 4804.65% June 02, 2041 800 955 980
Province of Ontario, (MTN)5.60% June 02, 2035 375 499 501
Province of Prince Edward Island4.25% September 24, 2019 100 100 1124.60% May 19, 2041 50 50 59
Province of Quebec5.50% December 01, 2014 400 440 4315.00% December 01, 2015 380 417 4174.50% December 01, 2017 500 531 5604.50% December 01, 2019 500 517 5674.50% December 01, 2020 350 401 3984.25% December 01, 2021 475 536 5313.50% December 01, 2022 450 465 4748.50% April 01, 2026 100 156 1566.00% October 01, 2029 140 189 1876.25% June 01, 2032 250 351 3475.75% December 01, 2036 200 274 2695.00% December 01, 2038 250 310 3095.00% December 01, 2041 593 642 7494.25% December 01, 2043 450 510 512
Province of Quebec, SeniorUnsecured Note3.00% September 01, 2023 100 100 100
Province of Quebec, (MTN)4.50% December 01, 2018 260 265 294
Province of Saskatchewan3.90% July 28, 2020 25 28 285.75% March 05, 2029 30 40 406.40% September 05, 2031 60 68 875.80% September 05, 2033 40 55 565.60% September 05, 2035 30 41 415.00% March 05, 2037 30 38 394.75% June 01, 2040 100 125 127
24,338 25,312
Total Government 64,893 66,254
Corporate — 30.3%
407 International, Inc., (MTN)3.88% June 16, 2015 100 100 1054.99% June 16, 2020 150 150 1744.45% November 15, 2041 100 100 1104.19% April 25, 2042 100 100 105
407 International, Inc., Series 06D1,Note5.75% February 14, 2036 190 190 234
The accompanying notes are an integral part of the financial statements. 174

BlackRock Canada CoreActive Universe Bond Fund
Statement of Investment Portfolio — As at December 31, 2012
Security
Par
value
Average
cost
Fair
value
(in 000s) (in $000s) (in $000s)
Corporate (continued)Aeroports de Montreal
5.17% September 17, 2035 180 180 215Alliance Pipeline, LP, Senior Note
5.55% December 31, 2023 213 212 237AltaGas, Ltd., (MTN)
4.55% January 17, 2019 200 200 216AltaLink, LP, (MTN)
4.46% November 08, 2041 150 150 165American Express Canada,
Guaranteed Note, (MTN)3.60% June 03, 2016 100 100 105
Bank of Montreal1.89% October 05, 2015 100 100 1003.10% March 10, 2016 300 300 3103.49% June 10, 2016 200 200 2092.96% August 02, 2016 700 711 7202.39% July 12, 2017 300 300 3022.24% December 11, 2017 100 100 1004.61% September 10, 2025 300 303 343
Bank of Nova Scotia3.61% February 22, 2016 500 500 5242.60% February 27, 2017 100 100 1016.65% January 22, 2021(1) 200 224 2253.04% October 18, 2024(1) 100 100 101
Bank of Nova Scotia, (MTN)2.90% August 03, 2022(1) 150 150 153
BCIMC Realty Corp.2.65% June 29, 2017 100 100 1012.96% March 07, 2019 300 300 3053.51% June 29, 2022 100 100 102
Bell Aliant Regional Communications,LP, (MTN)6.29% February 17, 2015 150 150 1624.88% April 26, 2018 200 200 216
Bell Aliant Regional Communications,Note5.41% September 26, 2016 150 150 164
Bell Canada4.40% March 16, 2018 200 200 2173.35% June 18, 2019 100 100 103
Brookfield Asset Management, Inc.,(MTN)5.30% March 01, 2021 50 50 55
Brookfield Renewable Power, Inc.,(MTN)6.13% November 30, 2016 129 144 1435.14% October 13, 2020 257 262 280
Cadillac Fairview Finance Trust3.24% January 25, 2016 200 200 2083.64% May 09, 2018 300 300 3204.31% January 25, 2021 200 200 224
Caisse Centrale Desjardins duQuebec3.50% October 05, 2017 200 200 210
Canadian Credit Card TST3.44% July 24, 2015 200 200 208
Security
Par
value
Average
cost
Fair
value
(in 000s) (in $000s) (in $000s)
Corporate (continued)Canadian Imperial Bank of
Commerce2.20% May 22, 2015 100 100 1013.40% January 14, 2016 200 204 2082.65% November 08, 2016 400 400 4072.35% October 18, 2017 100 100 1003.15% November 02, 2020(1) 100 100 103
Canadian Natural Resources, Ltd.,(MTN)3.05% June 19, 2019 100 100 101
Canadian Western Bank4.39% November 30, 2020(1) 100 100 1053.46% December 17, 2024(1) 50 50 50
Capital Desjardins, Inc.5.19% May 05, 2020 250 250 2853.80% November 23, 2020(1) 50 50 52
Capital Power, LP, (MTN)4.60% December 01, 2015 64 64 66
Cards II Trust3.10% September 15, 2015 200 200 207
Caterpillar Financial Services, Ltd.2.20% June 01, 2015 100 100 1012.63% June 01, 2017 100 100 101
CDP Financial, Inc.4.60% July 15, 2020 500 511 567
CI Investments, Inc.3.94% December 14, 2016(1) 100 100 104
CIBC Capital Trust10.25% June 30, 2108(1) 50 50 72
Co-Operators Financial Services5.78% March 10, 2020 350 350 380
CU, Inc.3.81% September 10, 2042 100 100 1004.95% November 18, 2050 200 200 2443.83% September 11, 2062 100 100 99
CU, Inc., Note, (MTN)5.90% November 20, 2034 310 282 405
Enbridge, Inc.3.19% December 05, 2022 50 50 50
Enbridge, Inc., (MTN)4.24% August 27, 2042 50 50 51
EPCOR Utilities, Inc., (MTN)4.55% February 28, 2042 100 100 106
Fairfax Financial Holdings, Ltd.6.40% May 25, 2021 200 199 218
Fifth Avenue, LP4.71% August 05, 2021 98 98 105
GE Capital Canada Funding Co.2.95% February 10, 2014 500 499 507
GE Capital Canada Funding Co.,(MTN)4.24% June 08, 2015 250 250 264
George Weston, Ltd., (MTN)3.78% October 25, 2016 100 100 105
Glacier Credit Card Trust2.39% April 20, 2020 50 50 50
The accompanying notes are an integral part of the financial statements. 175

BlackRock Canada CoreActive Universe Bond Fund
Statement of Investment Portfolio — As at December 31, 2012
Security
Par
value
Average
cost
Fair
value
(in 000s) (in $000s) (in $000s)
Corporate (continued)Golden Credit Card Trust
3.51% May 15, 2016 50 53 52Great-West Lifeco, Inc.
4.65% August 13, 2020 100 100 111Greater Toronto Airports Authority,
(MTN)5.00% June 01, 2015 250 248 2695.63% June 07, 2040 50 65 655.30% February 25, 2041 100 100 125
Health Montreal Collective, LP6.72% September 30, 2049 300 300 364
Holcim Finance Canada, Inc., (MTN)3.65% April 10, 2018 50 50 51
Honda Canada Finance, Inc.2.28% December 11, 2017 25 25 25
HSBC Bank of Canada3.86% May 21, 2015 300 300 3142.57% November 23, 2015 100 100 1022.90% January 13, 2017 200 200 2053.56% October 04, 2017 200 200 2114.94% March 16, 2021(1) 250 259 268
Husky Energy, Inc., (MTN)3.75% March 12, 2015 400 400 415
Hydro One, Inc., (MTN)2.95% September 11, 2015 100 100 1033.20% January 13, 2022 100 101 1035.49% July 16, 2040 100 100 128
Hydro One, Inc., Note7.35% June 03, 2030 450 559 652
Intact Financial Corp., (MTN)5.41% September 03, 2019 250 250 2874.70% August 18, 2021 100 100 111
Inter Pipeline Fund, (MTN)3.84% July 30, 2018 200 200 2113.78% May 30, 2022 100 100 102
Loblaw Cos., Ltd., (MTN)5.90% January 18, 2036 50 55 54
Lower Mattagami Energy, LP2.23% October 23, 2017 50 50 50
Manitoba Telecom Services, Inc.,(MTN)6.15% June 10, 2014 125 125 132
Manufacturers Life Insurance Co.4.17% June 01, 2022(1) 100 100 105
Manulife Financial Corp., (MTN)4.08% August 20, 2015 300 300 313
Master Credit Card Trust2.63% January 21, 2017 100 100 102
Metro, Inc., (MTN)5.97% October 15, 2035 310 282 352
National Bank of Canada2.23% January 30, 2015 200 200 2023.58% April 26, 2016 100 100 1052.69% August 21, 2017 100 100 101
Security
Par
value
Average
cost
Fair
value
(in 000s) (in $000s) (in $000s)
Corporate (continued)National Bank of Canada, (MTN)
4.93% December 22, 2019(1) 410 411 4343.26% April 11, 2022(1) 100 100 103
NAV Canada, (MTN)4.71% February 24, 2016 260 268 283
Newfoundland & Labrador Hydro,Series X, Note10.25% July 14, 2017 90 129 123
NOVA Gas Transmission, Ltd.,Series 21, Note12.20% February 28, 2016 137 217 177
Nova Scotia Power, Inc., (MTN)4.15% March 06, 2042 100 100 102
Nova Scotia PowerCorp., Note,(MTNF)8.85% May 19, 2025 101 136 151
OMERS Realty CTT4.05% May 05, 2014 110 110 114
Ontario School Boards FinancingCorp.5.80% November 07, 2028 323 337 380
Ontario School Boards FinancingCorp., Note7.20% June 09, 2025 261 319 3275.48% November 26, 2029 178 178 207
Pembina Pipeline Corp. (MTN)4.89% March 29, 2021 200 200 221
Plenary Health Care PartnershipsHumber, LP4.82% November 30, 2044 100 100 109
Reliance, LP4.57% March 15, 2017 50 50 505.19% March 15, 2019 50 50 50
RioCan Real Estate Investment Trust3.72% December 13, 2021 50 50 50
Rogers Communications, Inc.5.80% May 26, 2016 160 160 1783.00% June 06, 2017 100 100 1024.70% September 29, 2020 100 100 1105.34% March 22, 2021 100 100 1144.00% June 06, 2022 100 99 1046.11% August 25, 2040 150 150 176
Royal Bank of Canada2.05% January 13, 2015 200 200 2013.03% July 26, 2016 500 500 5162.68% December 08, 2016 200 200 2042.58% April 13, 2017 250 250 2532.36% September 21, 2017 150 150 1502.99% December 06, 2024(1) 100 100 101
Scotiabank Tier I Capital Trust7.80% June 30, 2108(1) 100 100 126
Shaw Communications, Inc.6.50% June 02, 2014 150 149 1595.65% October 01, 2019 200 199 2255.50% December 07, 2020 100 100 1126.75% November 09, 2039 100 98 111
The accompanying notes are an integral part of the financial statements. 176

BlackRock Canada CoreActive Universe Bond Fund
Statement of Investment Portfolio — As at December 31, 2012
Security
Par
value
Average
cost
Fair
value
(in 000s) (in $000s) (in $000s)
Corporate (continued)SP LP/SP1, LP
3.21% June 15, 2019 99 99 100Sun Life Financial, Inc.
4.57% August 23, 2021 100 100 109TELUS Corp.
4.95% May 15, 2014 130 130 1363.65% May 25, 2016 100 100 1055.05% July 23, 2020 100 100 114
Teranet Holdings, LP3.53% December 16, 2015 250 250 2595.75% December 17, 2040 213 213 241
Thomson Reuters Corp.6.00% March 31, 2016 180 179 201
Toronto Hydro Corp.4.49% November 12, 2019 200 200 224
Toronto-Dominion Bank2.95% August 02, 2016 500 500 516
Toronto-Dominion Bank, (MTN)3.37% November 02, 2020(1) 50 50 524.78% December 14, 2105(1) 195 207 212
Toyota Credit Canada, Inc., (MTN)2.20% October 19, 2017 100 100 100
TransCanada PipeLines, Ltd., (MTN)3.65% November 15, 2021 200 200 2134.55% November 15, 2041 100 99 109
Union Gas, Ltd.4.88% June 21, 2041 200 200 235
University of British Columbia,Series B, Note4.82% July 26, 2035 130 130 147
Veresen, Inc.5.60% July 28, 2014 100 106 104
VW Credit Canada, Inc.2.50% June 01, 2015 100 100 1012.90% June 01, 2017 100 100 102
Wells Fargo Canada Corp., (MTN)2.94% July 25, 2019 100 100 101
Wells Fargo Financial Canada Corp.3.97% November 03, 2014 250 250 260
Wells Fargo Financial Canada Corp.,(MTN)2.77% February 09, 2017 300 300 305
Westcoast Energy, Inc.3.28% January 15, 2016 100 100 1034.57% July 02, 2020 100 100 1123.12% December 05, 2022 50 50 50
Security
Par
value
Average
cost
Fair
value
(in 000s) (in $000s) (in $000s)
Corporate (continued)Winnipeg Airport Authority, Inc.
4.57% November 20, 2019 50 56 56
Total Corporate 27,384 29,266
Total Fixed Income Investments 92,277 95,520
Total Investments 92,277 95,520
Other Assets and Liabilities — 1.0% 963
Net Assets 96,483
(1) Variable rate security. Rate shown is as at report date.
Portfolio Concentration
(as a percentage of Net Assets)
Portfolio by Category
As at
December 31, 2012
As at
December 31, 2011
(%) (%)
Federal Non-Agency 28.6 17.1Federal Agency 12.3 11.9Municipal 1.6 2.9Provincial 26.2 26.5Corporate 30.3 40.3Other Assets and Liabilities 1.0 1.3
Open futures contracts held by the Fund as at December 31, 2012 areshown in Note 4.
The accompanying notes are an integral part of the financial statements. 177
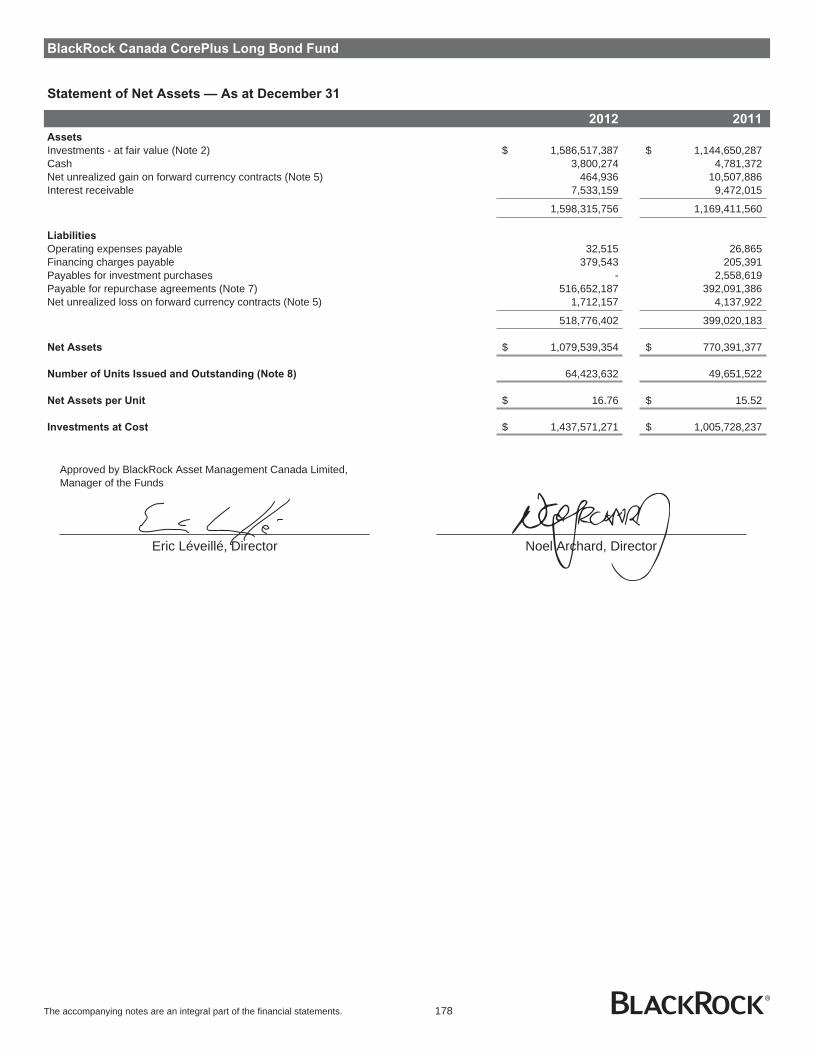
BlackRock Canada CorePlus Long Bond Fund
Statement of Net Assets — As at December 31
2012 2011
Assets
Investments - at fair value (Note 2) $ 1,586,517,387 $ 1,144,650,287Cash 3,800,274 4,781,372Net unrealized gain on forward currency contracts (Note 5) 464,936 10,507,886Interest receivable 7,533,159 9,472,015
1,598,315,756 1,169,411,560
Liabilities
Operating expenses payable 32,515 26,865Financing charges payable 379,543 205,391Payables for investment purchases - 2,558,619Payable for repurchase agreements (Note 7) 516,652,187 392,091,386Net unrealized loss on forward currency contracts (Note 5) 1,712,157 4,137,922
518,776,402 399,020,183
Net Assets $ 1,079,539,354 $ 770,391,377
Number of Units Issued and Outstanding (Note 8) 64,423,632 49,651,522
Net Assets per Unit $ 16.76 $ 15.52
Investments at Cost $ 1,437,571,271 $ 1,005,728,237
Approved by BlackRock Asset Management Canada Limited,Manager of the Funds
Eric Léveillé, Director Noel Archard, Director
The accompanying notes are an integral part of the financial statements. 178
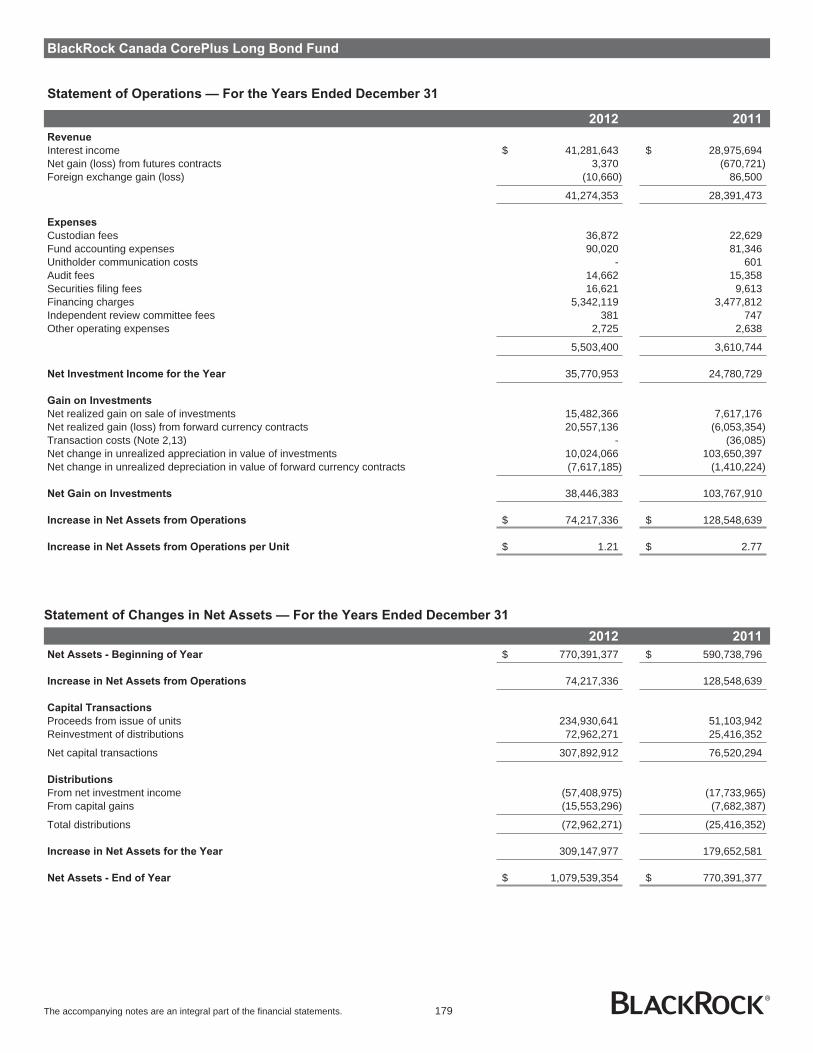
BlackRock Canada CorePlus Long Bond Fund
Statement of Operations — For the Years Ended December 31
2012 2011
Revenue
Interest income $ 41,281,643 $ 28,975,694Net gain (loss) from futures contracts 3,370 (670,721)Foreign exchange gain (loss) (10,660) 86,500
41,274,353 28,391,473
Expenses
Custodian fees 36,872 22,629Fund accounting expenses 90,020 81,346Unitholder communication costs - 601Audit fees 14,662 15,358Securities filing fees 16,621 9,613Financing charges 5,342,119 3,477,812Independent review committee fees 381 747Other operating expenses 2,725 2,638
5,503,400 3,610,744
Net Investment Income for the Year 35,770,953 24,780,729
Gain on Investments
Net realized gain on sale of investments 15,482,366 7,617,176Net realized gain (loss) from forward currency contracts 20,557,136 (6,053,354)Transaction costs (Note 2,13) - (36,085)Net change in unrealized appreciation in value of investments 10,024,066 103,650,397Net change in unrealized depreciation in value of forward currency contracts (7,617,185) (1,410,224)
Net Gain on Investments 38,446,383 103,767,910
Increase in Net Assets from Operations $ 74,217,336 $ 128,548,639
Increase in Net Assets from Operations per Unit $ 1.21 $ 2.77
Statement of Changes in Net Assets — For the Years Ended December 31
2012 2011
Net Assets - Beginning of Year $ 770,391,377 $ 590,738,796
Increase in Net Assets from Operations 74,217,336 128,548,639
Capital Transactions
Proceeds from issue of units 234,930,641 51,103,942Reinvestment of distributions 72,962,271 25,416,352
Net capital transactions 307,892,912 76,520,294
Distributions
From net investment income (57,408,975) (17,733,965)From capital gains (15,553,296) (7,682,387)
Total distributions (72,962,271) (25,416,352)
Increase in Net Assets for the Year 309,147,977 179,652,581
Net Assets - End of Year $ 1,079,539,354 $ 770,391,377
The accompanying notes are an integral part of the financial statements. 179
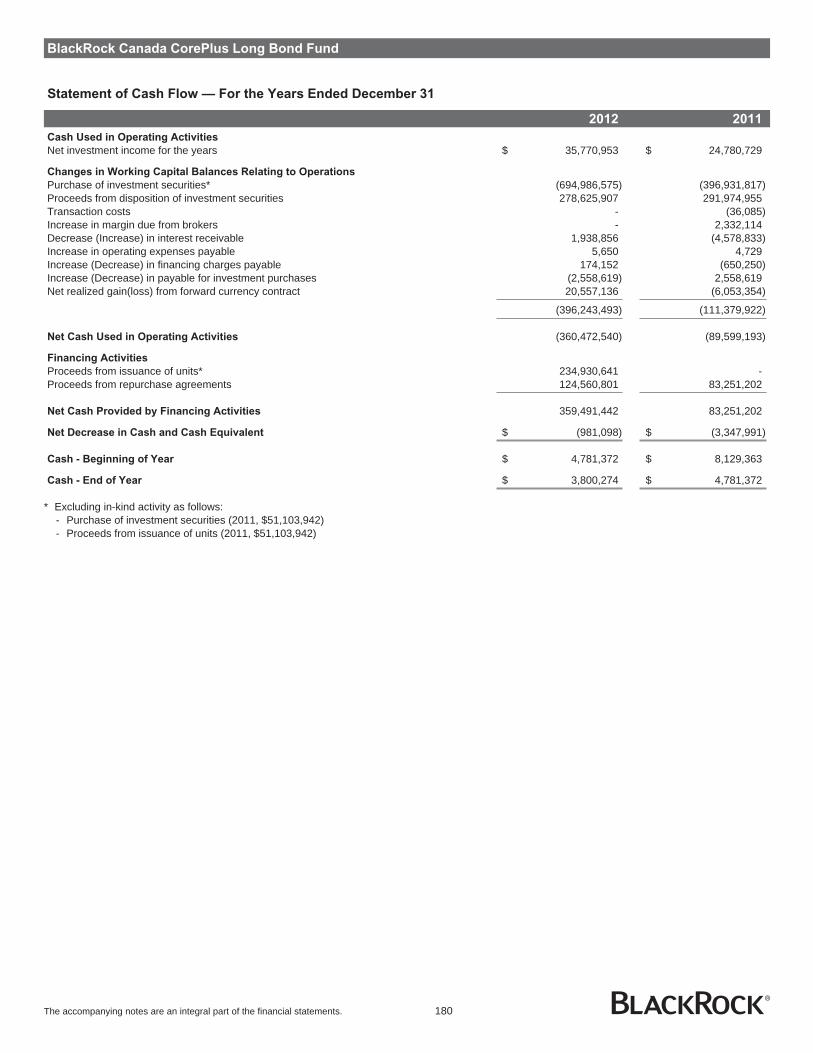
BlackRock Canada CorePlus Long Bond Fund
Statement of Cash Flow — For the Years Ended December 31
2012 2011
Cash Used in Operating Activities
Net investment income for the years $ 35,770,953 $ 24,780,729
Changes in Working Capital Balances Relating to Operations
Purchase of investment securities* (694,986,575) (396,931,817)Proceeds from disposition of investment securities 278,625,907 291,974,955Transaction costs - (36,085)Increase in margin due from brokers - 2,332,114Decrease (Increase) in interest receivable 1,938,856 (4,578,833)Increase in operating expenses payable 5,650 4,729Increase (Decrease) in financing charges payable 174,152 (650,250)Increase (Decrease) in payable for investment purchases (2,558,619) 2,558,619Net realized gain(loss) from forward currency contract 20,557,136 (6,053,354)
(396,243,493) (111,379,922)
Net Cash Used in Operating Activities (360,472,540) (89,599,193)
Financing Activities
Proceeds from issuance of units* 234,930,641 -Proceeds from repurchase agreements 124,560,801 83,251,202
Net Cash Provided by Financing Activities 359,491,442 83,251,202
Net Decrease in Cash and Cash Equivalent $ (981,098) $ (3,347,991)
Cash - Beginning of Year $ 4,781,372 $ 8,129,363
Cash - End of Year $ 3,800,274 $ 4,781,372
* Excluding in-kind activity as follows:- Purchase of investment securities (2011, $51,103,942)- Proceeds from issuance of units (2011, $51,103,942)
The accompanying notes are an integral part of the financial statements. 180
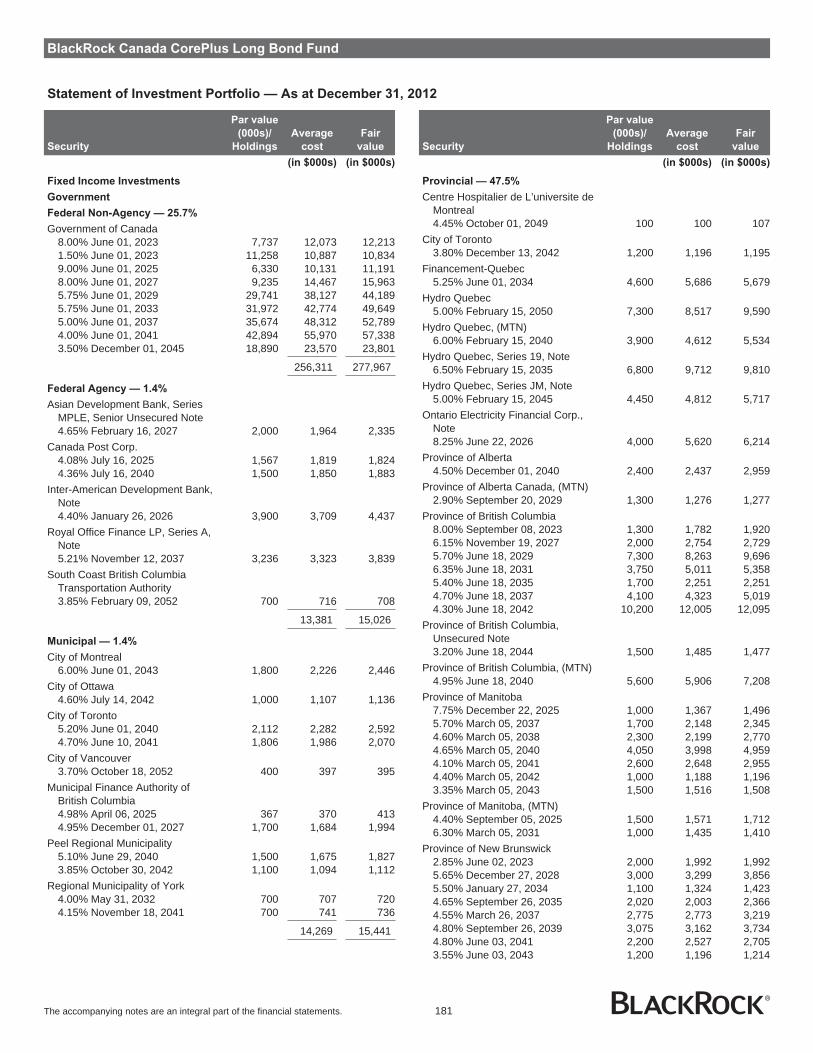
BlackRock Canada CorePlus Long Bond Fund
Statement of Investment Portfolio — As at December 31, 2012
Security
Par value
(000s)/
Holdings
Average
cost
Fair
value
(in $000s) (in $000s)
Fixed Income Investments
Government
Federal Non-Agency — 25.7%
Government of Canada8.00% June 01, 2023 7,737 12,073 12,2131.50% June 01, 2023 11,258 10,887 10,8349.00% June 01, 2025 6,330 10,131 11,1918.00% June 01, 2027 9,235 14,467 15,9635.75% June 01, 2029 29,741 38,127 44,1895.75% June 01, 2033 31,972 42,774 49,6495.00% June 01, 2037 35,674 48,312 52,7894.00% June 01, 2041 42,894 55,970 57,3383.50% December 01, 2045 18,890 23,570 23,801
256,311 277,967
Federal Agency — 1.4%
Asian Development Bank, SeriesMPLE, Senior Unsecured Note4.65% February 16, 2027 2,000 1,964 2,335
Canada Post Corp.4.08% July 16, 2025 1,567 1,819 1,8244.36% July 16, 2040 1,500 1,850 1,883
Inter-American Development Bank,Note4.40% January 26, 2026 3,900 3,709 4,437
Royal Office Finance LP, Series A,Note5.21% November 12, 2037 3,236 3,323 3,839
South Coast British ColumbiaTransportation Authority3.85% February 09, 2052 700 716 708
13,381 15,026
Municipal — 1.4%
City of Montreal6.00% June 01, 2043 1,800 2,226 2,446
City of Ottawa4.60% July 14, 2042 1,000 1,107 1,136
City of Toronto5.20% June 01, 2040 2,112 2,282 2,5924.70% June 10, 2041 1,806 1,986 2,070
City of Vancouver3.70% October 18, 2052 400 397 395
Municipal Finance Authority ofBritish Columbia4.98% April 06, 2025 367 370 4134.95% December 01, 2027 1,700 1,684 1,994
Peel Regional Municipality5.10% June 29, 2040 1,500 1,675 1,8273.85% October 30, 2042 1,100 1,094 1,112
Regional Municipality of York4.00% May 31, 2032 700 707 7204.15% November 18, 2041 700 741 736
14,269 15,441
Security
Par value
(000s)/
Holdings
Average
cost
Fair
value
(in $000s) (in $000s)
Provincial — 47.5%
Centre Hospitalier de L’universite deMontreal4.45% October 01, 2049 100 100 107
City of Toronto3.80% December 13, 2042 1,200 1,196 1,195
Financement-Quebec5.25% June 01, 2034 4,600 5,686 5,679
Hydro Quebec5.00% February 15, 2050 7,300 8,517 9,590
Hydro Quebec, (MTN)6.00% February 15, 2040 3,900 4,612 5,534
Hydro Quebec, Series 19, Note6.50% February 15, 2035 6,800 9,712 9,810
Hydro Quebec, Series JM, Note5.00% February 15, 2045 4,450 4,812 5,717
Ontario Electricity Financial Corp.,Note8.25% June 22, 2026 4,000 5,620 6,214
Province of Alberta4.50% December 01, 2040 2,400 2,437 2,959
Province of Alberta Canada, (MTN)2.90% September 20, 2029 1,300 1,276 1,277
Province of British Columbia8.00% September 08, 2023 1,300 1,782 1,9206.15% November 19, 2027 2,000 2,754 2,7295.70% June 18, 2029 7,300 8,263 9,6966.35% June 18, 2031 3,750 5,011 5,3585.40% June 18, 2035 1,700 2,251 2,2514.70% June 18, 2037 4,100 4,323 5,0194.30% June 18, 2042 10,200 12,005 12,095
Province of British Columbia,Unsecured Note3.20% June 18, 2044 1,500 1,485 1,477
Province of British Columbia, (MTN)4.95% June 18, 2040 5,600 5,906 7,208
Province of Manitoba7.75% December 22, 2025 1,000 1,367 1,4965.70% March 05, 2037 1,700 2,148 2,3454.60% March 05, 2038 2,300 2,199 2,7704.65% March 05, 2040 4,050 3,998 4,9594.10% March 05, 2041 2,600 2,648 2,9554.40% March 05, 2042 1,000 1,188 1,1963.35% March 05, 2043 1,500 1,516 1,508
Province of Manitoba, (MTN)4.40% September 05, 2025 1,500 1,571 1,7126.30% March 05, 2031 1,000 1,435 1,410
Province of New Brunswick2.85% June 02, 2023 2,000 1,992 1,9925.65% December 27, 2028 3,000 3,299 3,8565.50% January 27, 2034 1,100 1,324 1,4234.65% September 26, 2035 2,020 2,003 2,3664.55% March 26, 2037 2,775 2,773 3,2194.80% September 26, 2039 3,075 3,162 3,7344.80% June 03, 2041 2,200 2,527 2,7053.55% June 03, 2043 1,200 1,196 1,214
The accompanying notes are an integral part of the financial statements. 181

BlackRock Canada CorePlus Long Bond Fund
Statement of Investment Portfolio — As at December 31, 2012
Security
Par value
(000s)/
Holdings
Average
cost
Fair
value
(in $000s) (in $000s)
Provincial (continued)Province of Newfoundland
8.45% February 05, 2026 800 1,154 1,2546.15% April 17, 2028 3,350 3,918 4,5436.55% October 17, 2030 1,000 1,447 1,4395.60% October 17, 2033 1,000 1,118 1,3314.50% April 17, 2037 500 589 5894.65% October 17, 2040 2,500 2,545 3,063
Province of Nova Scotia6.60% December 01, 2031 800 1,155 1,1584.50% June 01, 2037 3,490 3,318 4,0674.70% June 01, 2041 2,000 2,427 2,4494.40% June 01, 2042 2,700 3,154 3,1763.50% June 02, 2043 25,650 25,884 26,2383.50% June 02, 2062 2,950 2,999 3,008
Province of Nova Scotia, (MTN)5.80% June 01, 2033 1,200 1,613 1,617
Province of Nova Scotia, Series 9Z6.60% June 01, 2027 970 1,199 1,349
Province of Ontario2.85% June 02, 2023 7,500 7,496 7,4928.10% September 08, 2023 6,600 9,145 9,7227.50% February 07, 2024 2,500 3,639 3,5628.50% December 02, 2025 4,000 6,158 6,2907.60% June 02, 2027 10,850 15,135 16,3846.50% March 08, 2029 14,500 18,912 20,4416.20% June 02, 2031 6,800 9,528 9,4545.85% March 08, 2033 12,870 15,492 17,4814.70% June 02, 2037 15,300 16,924 18,4424.60% June 02, 2039 16,801 17,152 20,1464.65% June 02, 2041 28,600 32,695 35,043
Province of Ontario, (MTN)5.60% June 02, 2035 15,070 18,109 20,139
Province of Prince Edward Island6.25% January 29, 2032 600 724 8285.70% June 15, 2035 600 682 7944.65% November 19, 2037 506 511 5914.60% May 19, 2041 953 955 1,1233.65% June 27, 2042 600 598 607
Province of Quebec9.38% January 16, 2023 3,000 4,479 4,6605.35% June 01, 2025 2,000 2,475 2,4328.50% April 01, 2026 2,000 3,166 3,1216.00% October 01, 2029 6,750 7,683 9,0046.25% June 01, 2032 11,160 13,604 15,4675.75% December 01, 2036 10,500 13,335 14,1375.00% December 01, 2038 13,150 13,849 16,2755.00% December 01, 2041 21,368 24,317 26,9774.25% December 01, 2043 17,300 19,251 19,686
Province of Quebec, SeniorUnsecured Note3.00% September 01, 2023 4,400 4,394 4,408
Province of Saskatchewan5.75% March 05, 2029 1,250 1,413 1,6796.40% September 05, 2031 1,900 2,591 2,7635.80% September 05, 2033 1,700 2,403 2,3645.60% September 05, 2035 1,000 1,399 1,375
Security
Par value
(000s)/
Holdings
Average
cost
Fair
value
(in $000s) (in $000s)
Provincial (continued)5.00% March 05, 2037 1,100 1,441 1,4184.75% June 01, 2040 3,550 3,574 4,5083.40% February 03, 2042 1,500 1,537 1,553
471,380 512,342
Total Government 755,341 820,776
Corporate — 22.4%
407 International, Inc., (MTN)4.45% November 15, 2041 2,453 2,636 2,6924.19% April 25, 2042 500 499 5263.98% September 11, 2052 300 300 304
407 International, Inc., Series 04A35.96% December 03, 2035 2,500 2,912 3,312
407 International, Inc., Series 06D1,Note5.75% February 14, 2036 1,100 1,340 1,357
407 International, Inc., Series 99A2,Senior Note6.47% July 27, 2029 2,225 2,575 2,985
Aeroports de Montreal5.17% September 17, 2035 2,200 2,172 2,6325.67% October 16, 2037 200 209 2575.47% April 16, 2040 1,480 1,491 1,876
Alliance Pipeline, LP, Senior Note5.55% December 31, 2023 526 545 583
Alliance Pipeline, LP, Series A,Senior Note7.18% June 30, 2023 1,762 2,068 2,145
AltaLink, LP5.38% March 26, 2040 500 500 627
AltaLink, LP, (MTN)4.87% November 15, 2040 206 221 2414.46% November 08, 2041 900 952 9933.99% June 30, 2042 600 600 615
AltaLink, LP, Secured Note, (MTN)5.25% September 22, 2036 1,000 963 1,213
Arrow Lakes Power5.52% April 05, 2041 300 300 348
Bank of Montreal4.61% September 10, 2025 1,800 1,953 2,056
Bell Aliant RegionalCommunications, (MTN)6.17% February 26, 2037 475 414 483
Bell Canada6.55% May 01, 2029 2,500 2,589 3,093
Bell Canada, Note, (MTN)7.85% April 02, 2031 1,000 1,330 1,3897.30% February 23, 2032 2,300 2,327 3,065
Bell Canada, Series M-176.10% March 16, 2035 2,100 2,015 2,553
British Columbia Ferry Services,Inc., Note5.02% March 20, 2037 700 782 789
The accompanying notes are an integral part of the financial statements. 182

BlackRock Canada CorePlus Long Bond Fund
Statement of Investment Portfolio — As at December 31, 2012
Security
Par value
(000s)/
Holdings
Average
cost
Fair
value
(in $000s) (in $000s)
Corporate (continued)British Columbia Ferry Services,
Inc., Series 08-1, Senior SecuredNote5.58% January 11, 2038 400 400 487
British Columbia Ferry Services,Inc., Series B, Senior SecuredNote6.25% October 13, 2034 1,100 1,226 1,426
Brookfield Asset Management, Inc.,(MTN)4.54% March 31, 2023 1,000 1,000 1,030
Brookfield Asset Management, Inc.,Note5.95% June 14, 2035 1,000 979 996
Brookfield Power Corp.5.84% November 05, 2036 2,000 1,931 1,997
Cameco Corp.5.09% November 14, 2042 500 500 498
Canadian Pacific RR Co., (MTN)6.45% November 17, 2039 1,500 1,576 1,844
Canadian Tire Corp., Ltd. (MTN)6.32% February 24, 2034 1,000 1,104 1,145
Capital City Link GeneralPartnership4.39% March 31, 2046 1,500 1,532 1,548
CIBC Capital Trust10.25% June 30, 2108(1) 1,600 2,028 2,310
Consumers Gas Corp., Ltd., Note,(MTN)6.10% May 19, 2028 300 378 382
CU, Inc.4.54% October 24, 2041 1,700 1,851 1,9243.81% September 10, 2042 1,200 1,200 1,1974.95% November 18, 2050 200 200 2444.59% October 24, 2061 200 200 2323.83% September 11, 2062 600 600 596
CU, Inc., (MTN)6.22% March 06, 2024 500 500 6405.58% May 26, 2038 400 493 5145.56% May 26, 2028 3,400 3,515 4,1896.50% March 07, 2039 1,500 2,145 2,152
CU, Inc., Note, (MTN)5.56% October 30, 2037 500 516 636
Enbridge Gas Distribution, Inc.,(MTN)4.95% November 22, 2050 900 1,025 1,096
Enbridge Gas Distribution, Inc.,Note, (MTN)6.16% December 16, 2033 500 679 6665.21% February 25, 2036 1,600 1,565 1,935
Enbridge Pipelines, Inc.5.35% November 10, 2039 1,700 1,709 2,134
Enbridge Pipelines, Inc., Note,(MTN)6.05% February 12, 2029 300 329 387
Security
Par value
(000s)/
Holdings
Average
cost
Fair
value
(in $000s) (in $000s)
Corporate (continued)Enbridge, Inc., (MTN)
7.20% June 18, 2032 2,000 2,761 2,7985.57% November 14, 2035 2,000 1,864 2,4015.75% September 02, 2039 1,000 999 1,2494.24% August 27, 2042 1,200 1,199 1,215
Enersource Corp.5.30% April 29, 2041 100 100 124
EPCOR Utilities, Inc., (MTN)5.75% November 24, 2039 1,000 1,095 1,2514.55% February 28, 2042 1,900 2,011 2,016
Finning International, Inc., (MTN)5.08% June 13, 2042 500 500 520
FortisAlberta, Inc.7.06% February 14, 2039 1,000 1,529 1,5273.98% October 23, 2052 400 400 409
FortisAlberta, Inc., (MTN)5.37% October 30, 2039 500 496 6284.54% October 18, 2041 1,000 1,116 1,121
FortisAlberta, Inc., Senior Note6.22% October 31, 2034 1,000 1,121 1,348
FortisBC, Inc., (MTN)6.10% June 02, 2039 1,500 1,562 2,0195.00% November 24, 2050 100 100 120
Gaz Metro, LP, Secured Note,Series E, (MTN)9.00% May 16, 2025 250 385 387
Gaz Metro, LP, Secured Note,Series I (MTN)7.05% October 30, 2030 1,000 1,410 1,405
GE Capital Canada Funding Co.,(MTN)5.73% October 22, 2037 5,200 5,103 6,416
George Weston, Ltd., (MTN)7.10% February 05, 2032 1,612 1,812 1,913
Great-West Lifeco, Inc., Note6.67% March 21, 2033 3,019 3,417 3,857
Greater Toronto Airports Authority,(MTN)7.05% June 12, 2030 1,000 1,359 1,4017.10% June 04, 2031 1,570 2,132 2,2376.47% February 02, 2034 4,500 5,150 6,1565.63% June 07, 2040 1,000 1,306 1,2985.30% February 25, 2041 3,600 3,947 4,237
Greater Toronto Airports Authority,Note6.45% December 03, 2027 1,000 1,335 1,313
Greater Toronto Airports Authority,Note, (MTN)6.45% July 30, 2029 2,444 2,705 3,052
Halifax International Airport Authority4.89% November 15, 2050 300 300 356
Health Montreal Collective, LP6.72% September 30, 2049 5,850 6,398 7,103
The accompanying notes are an integral part of the financial statements. 183
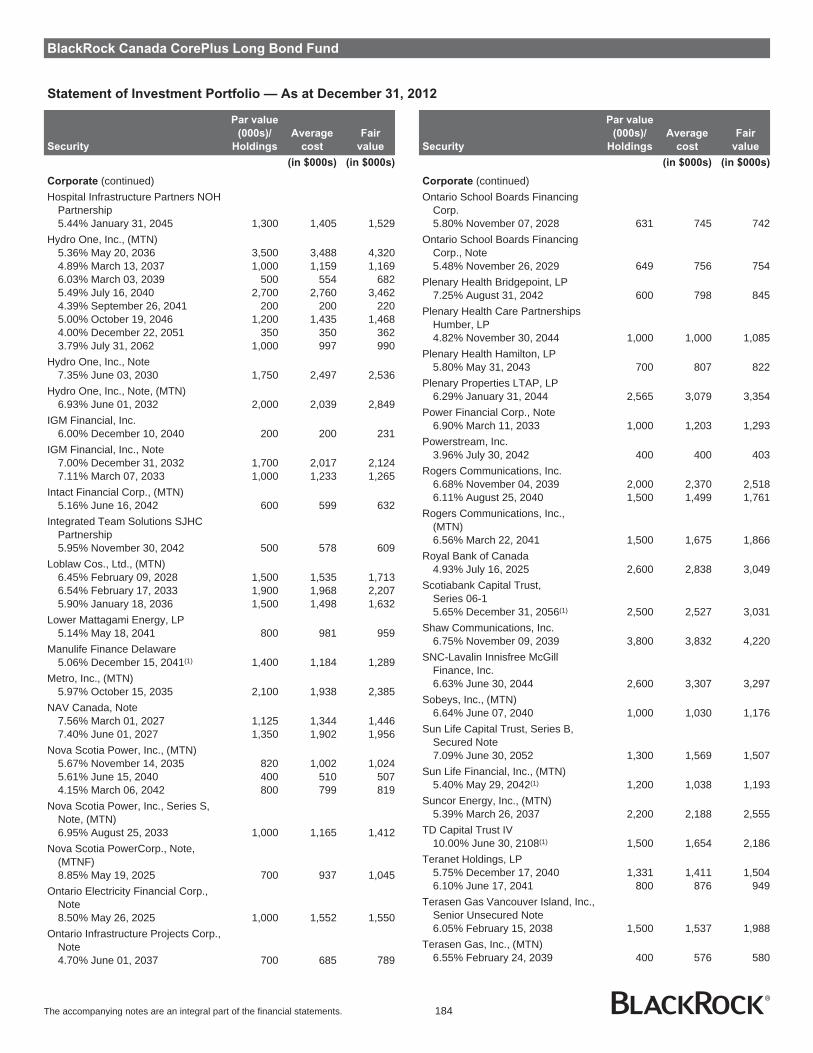
BlackRock Canada CorePlus Long Bond Fund
Statement of Investment Portfolio — As at December 31, 2012
Security
Par value
(000s)/
Holdings
Average
cost
Fair
value
(in $000s) (in $000s)
Corporate (continued)Hospital Infrastructure Partners NOH
Partnership5.44% January 31, 2045 1,300 1,405 1,529
Hydro One, Inc., (MTN)5.36% May 20, 2036 3,500 3,488 4,3204.89% March 13, 2037 1,000 1,159 1,1696.03% March 03, 2039 500 554 6825.49% July 16, 2040 2,700 2,760 3,4624.39% September 26, 2041 200 200 2205.00% October 19, 2046 1,200 1,435 1,4684.00% December 22, 2051 350 350 3623.79% July 31, 2062 1,000 997 990
Hydro One, Inc., Note7.35% June 03, 2030 1,750 2,497 2,536
Hydro One, Inc., Note, (MTN)6.93% June 01, 2032 2,000 2,039 2,849
IGM Financial, Inc.6.00% December 10, 2040 200 200 231
IGM Financial, Inc., Note7.00% December 31, 2032 1,700 2,017 2,1247.11% March 07, 2033 1,000 1,233 1,265
Intact Financial Corp., (MTN)5.16% June 16, 2042 600 599 632
Integrated Team Solutions SJHCPartnership5.95% November 30, 2042 500 578 609
Loblaw Cos., Ltd., (MTN)6.45% February 09, 2028 1,500 1,535 1,7136.54% February 17, 2033 1,900 1,968 2,2075.90% January 18, 2036 1,500 1,498 1,632
Lower Mattagami Energy, LP5.14% May 18, 2041 800 981 959
Manulife Finance Delaware5.06% December 15, 2041(1) 1,400 1,184 1,289
Metro, Inc., (MTN)5.97% October 15, 2035 2,100 1,938 2,385
NAV Canada, Note7.56% March 01, 2027 1,125 1,344 1,4467.40% June 01, 2027 1,350 1,902 1,956
Nova Scotia Power, Inc., (MTN)5.67% November 14, 2035 820 1,002 1,0245.61% June 15, 2040 400 510 5074.15% March 06, 2042 800 799 819
Nova Scotia Power, Inc., Series S,Note, (MTN)6.95% August 25, 2033 1,000 1,165 1,412
Nova Scotia PowerCorp., Note,(MTNF)8.85% May 19, 2025 700 937 1,045
Ontario Electricity Financial Corp.,Note8.50% May 26, 2025 1,000 1,552 1,550
Ontario Infrastructure Projects Corp.,Note4.70% June 01, 2037 700 685 789
Security
Par value
(000s)/
Holdings
Average
cost
Fair
value
(in $000s) (in $000s)
Corporate (continued)Ontario School Boards Financing
Corp.5.80% November 07, 2028 631 745 742
Ontario School Boards FinancingCorp., Note5.48% November 26, 2029 649 756 754
Plenary Health Bridgepoint, LP7.25% August 31, 2042 600 798 845
Plenary Health Care PartnershipsHumber, LP4.82% November 30, 2044 1,000 1,000 1,085
Plenary Health Hamilton, LP5.80% May 31, 2043 700 807 822
Plenary Properties LTAP, LP6.29% January 31, 2044 2,565 3,079 3,354
Power Financial Corp., Note6.90% March 11, 2033 1,000 1,203 1,293
Powerstream, Inc.3.96% July 30, 2042 400 400 403
Rogers Communications, Inc.6.68% November 04, 2039 2,000 2,370 2,5186.11% August 25, 2040 1,500 1,499 1,761
Rogers Communications, Inc.,(MTN)6.56% March 22, 2041 1,500 1,675 1,866
Royal Bank of Canada4.93% July 16, 2025 2,600 2,838 3,049
Scotiabank Capital Trust,Series 06-15.65% December 31, 2056(1) 2,500 2,527 3,031
Shaw Communications, Inc.6.75% November 09, 2039 3,800 3,832 4,220
SNC-Lavalin Innisfree McGillFinance, Inc.6.63% June 30, 2044 2,600 3,307 3,297
Sobeys, Inc., (MTN)6.64% June 07, 2040 1,000 1,030 1,176
Sun Life Capital Trust, Series B,Secured Note7.09% June 30, 2052 1,300 1,569 1,507
Sun Life Financial, Inc., (MTN)5.40% May 29, 2042(1) 1,200 1,038 1,193
Suncor Energy, Inc., (MTN)5.39% March 26, 2037 2,200 2,188 2,555
TD Capital Trust IV10.00% June 30, 2108(1) 1,500 1,654 2,186
Teranet Holdings, LP5.75% December 17, 2040 1,331 1,411 1,5046.10% June 17, 2041 800 876 949
Terasen Gas Vancouver Island, Inc.,Senior Unsecured Note6.05% February 15, 2038 1,500 1,537 1,988
Terasen Gas, Inc., (MTN)6.55% February 24, 2039 400 576 580
The accompanying notes are an integral part of the financial statements. 184

BlackRock Canada CorePlus Long Bond Fund
Statement of Investment Portfolio — As at December 31, 2012
Security
Par value
(000s)/
Holdings
Average
cost
Fair
value
(in $000s) (in $000s)
Corporate (continued)Terasen Gas, Inc., Note, (MTN)
6.50% May 01, 2034 2,000 2,328 2,7805.55% September 25, 2036 1,000 973 1,270
Toronto Hydro Corp., (MTN)5.54% May 21, 2040 1,000 1,297 1,278
TransAlta Corp., (MTN)7.30% October 22, 2029 300 319 320
TransAlta Corp., Note, (MTN)6.90% November 15, 2030(1) 1,000 1,071 1,028
TransCanada PipeLines, Ltd.8.05% February 17, 2039 3,300 4,575 5,372
TransCanada PipeLines, Ltd., (MTN)4.55% November 15, 2041 100 99 110
TransCanada PipeLines, Ltd., Note,(MTN)8.29% February 05, 2026 1,376 2,036 2,0207.31% January 15, 2027 1,226 1,472 1,6776.28% May 26, 2028 1,700 1,838 2,1486.89% August 07, 2028 800 820 1,071
Union Gas, Ltd.8.65% November 10, 2025 500 694 7624.88% June 21, 2041 500 547 587
Union Gas, Ltd., (MTN)6.05% September 02, 2038 600 813 8065.20% July 23, 2040 1,200 1,236 1,461
University of Toronto4.25% December 07, 2051 350 359 365
Vancouver International AirportAuthority7.43% December 07, 2026(1) 500 710 715
Westcoast Energy, Inc., (MTN)4.79% October 28, 2041 200 200 225
Westcoast Energy, Inc., Note8.85% July 21, 2025 1,000 1,378 1,503
Total Corporate 216,477 241,573
Total Fixed Income Investments 971,818 1,062,349
Foreign Investments — 48.6%
U.S. LIBOR GlobalAlpha Bond FundLtd.* 407,945 465,753 524,168
Total Foreign Investments 465,753 524,168
Total Investments 1,437,571 1,586,517
Other Assets and Liabilities — (47.0)% (506,978)
Net Assets 1,079,539
(1) Variable rate security. Rate shown is as at report date.
Portfolio Concentration
(as a percentage of Net Assets)
Portfolio by Category
As at
December 31, 2012
As at
December 31, 2011
(%) (%)
Federal Non-Agency 25.7 23.7Federal Agency 1.4 2.1Municipal 1.4 0.8Provincial 47.5 48.6Corporate 22.4 22.6Foreign Investments 48.6 50.8Repurchase Agreements (47.9) (50.9)Other Assets and Liabilities 0.9 2.3
Open forward currency contracts and repurchase agreements held by theFund as at December 31, 2012 are shown in Notes 5 and 7respectively.
* The U.S. LIBOR GlobalAlpha Bond Fund Ltd. is a Cayman Islandsexempted company that achieves its investment objective by investingin the BlackRock Fixed Income GlobalAlpha Master Fund Ltd. (“FIGA”)and Strategic Short Duration Bond Fund Ltd. (“SSD”), each anexempted company incorporated under the laws of the Cayman Islands.FIGA seeks to invest in a diversified portfolio of long and short fixedincome securities across global markets and SSD seeks to invest in adiversified portfolio of debt securities and other credit-relatedinstruments in various global markets. The following portfolioconcentration is as a percentage of Net Assets of the U.S. LIBORGlobalAlpha Bond Fund Ltd.
Portfolio by Category
As at
December 31, 2012
As at
December 31, 2011
(%) (%)
FIGA 37.0 37.0SSD 61.8 62.8Other Assets and Liabilities 1.2 0.2
The accompanying notes are an integral part of the financial statements. 185
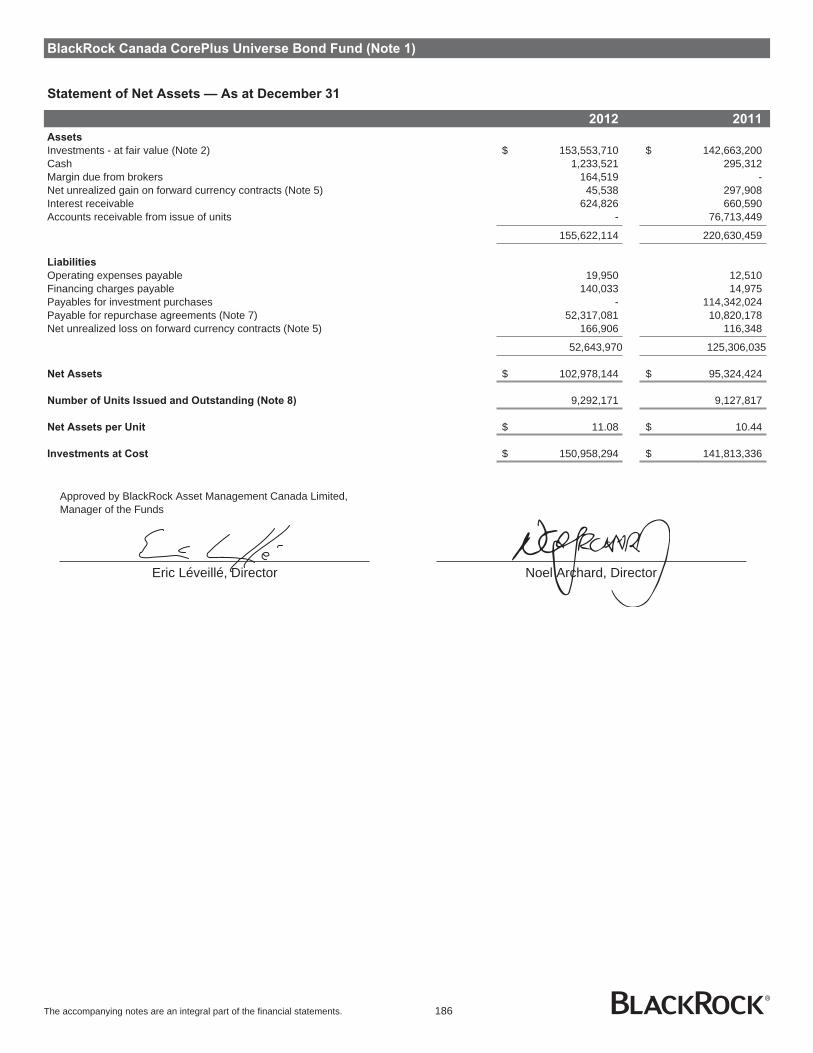
BlackRock Canada CorePlus Universe Bond Fund (Note 1)
Statement of Net Assets — As at December 31
2012 2011
Assets
Investments - at fair value (Note 2) $ 153,553,710 $ 142,663,200Cash 1,233,521 295,312Margin due from brokers 164,519 -Net unrealized gain on forward currency contracts (Note 5) 45,538 297,908Interest receivable 624,826 660,590Accounts receivable from issue of units - 76,713,449
155,622,114 220,630,459
Liabilities
Operating expenses payable 19,950 12,510Financing charges payable 140,033 14,975Payables for investment purchases - 114,342,024Payable for repurchase agreements (Note 7) 52,317,081 10,820,178Net unrealized loss on forward currency contracts (Note 5) 166,906 116,348
52,643,970 125,306,035
Net Assets $ 102,978,144 $ 95,324,424
Number of Units Issued and Outstanding (Note 8) 9,292,171 9,127,817
Net Assets per Unit $ 11.08 $ 10.44
Investments at Cost $ 150,958,294 $ 141,813,336
Approved by BlackRock Asset Management Canada Limited,Manager of the Funds
Eric Léveillé, Director Noel Archard, Director
The accompanying notes are an integral part of the financial statements. 186

BlackRock Canada CorePlus Universe Bond Fund (Note 1)
Statement of Operations — For the Periods Ended December 31
2012 2011
Revenue
Interest income $ 3,801,690 $ 123,476Net gain from futures contracts 94,492 -Foreign exchange gain 348,917 -
4,245,099 123,476
Expenses
Custodian fees 6,345 774Fund accounting expenses 60,774 8,543Unitholder communication costs 15 3Audit fees 16,003 9,040Securities filing fees 1,640 21Financing charges 552,306 20,716Independent review committee fees 30 16Other operating expenses 1,743 2
638,856 39,115
Net Investment Income for the Period 3,606,243 84,361
Gain on Investments
Net realized loss on sale of investments (299,586) (16,088)Net realized gain (loss) from forward currency contracts 1,164,107 (412,766)Transaction costs (Note 2,13) (8,789) -Net change in unrealized appreciation in value of investments 1,745,552 849,864Net change in unrealized appreciation (depreciation) in value of forward currency contracts (302,928) 181,560
Net Gain on Investments 2,298,356 602,570
Increase in Net Assets from Operations $ 5,904,599 $ 686,931
Increase in Net Assets from Operations per Unit $ 0.64 $ 0.39
Statement of Changes in Net Assets — For the Periods Ended December 31
2012 2011
Net Assets - Beginning of Period $ 95,324,424 $ -
Increase in Net Assets from Operations 5,904,599 686,931
Capital Transactions
Proceeds from issue of units 2,149,403 94,637,493Reinvestment of distributions 4,575,305 -Redemption of units (400,282) -
Net capital transactions 6,324,426 94,637,493
Distributions
From net investment income (4,575,305) -
Total distributions (4,575,305) -
Increase in Net Assets for the Period 7,653,720 95,324,424
Net Assets - End of Period $ 102,978,144 $ 95,324,424
The accompanying notes are an integral part of the financial statements. 187
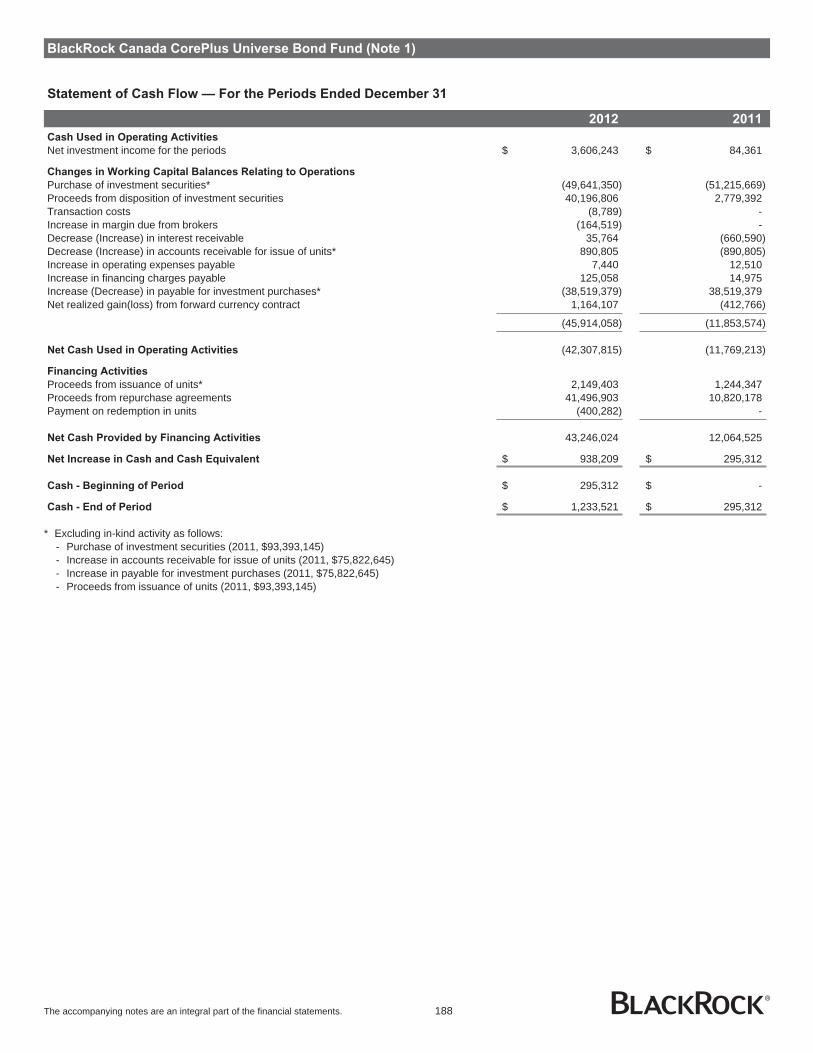
BlackRock Canada CorePlus Universe Bond Fund (Note 1)
Statement of Cash Flow — For the Periods Ended December 31
2012 2011
Cash Used in Operating Activities
Net investment income for the periods $ 3,606,243 $ 84,361
Changes in Working Capital Balances Relating to Operations
Purchase of investment securities* (49,641,350) (51,215,669)Proceeds from disposition of investment securities 40,196,806 2,779,392Transaction costs (8,789) -Increase in margin due from brokers (164,519) -Decrease (Increase) in interest receivable 35,764 (660,590)Decrease (Increase) in accounts receivable for issue of units* 890,805 (890,805)Increase in operating expenses payable 7,440 12,510Increase in financing charges payable 125,058 14,975Increase (Decrease) in payable for investment purchases* (38,519,379) 38,519,379Net realized gain(loss) from forward currency contract 1,164,107 (412,766)
(45,914,058) (11,853,574)
Net Cash Used in Operating Activities (42,307,815) (11,769,213)
Financing Activities
Proceeds from issuance of units* 2,149,403 1,244,347Proceeds from repurchase agreements 41,496,903 10,820,178Payment on redemption in units (400,282) -
Net Cash Provided by Financing Activities 43,246,024 12,064,525
Net Increase in Cash and Cash Equivalent $ 938,209 $ 295,312
Cash - Beginning of Period $ 295,312 $ -
Cash - End of Period $ 1,233,521 $ 295,312
* Excluding in-kind activity as follows:- Purchase of investment securities (2011, $93,393,145)- Increase in accounts receivable for issue of units (2011, $75,822,645)- Increase in payable for investment purchases (2011, $75,822,645)- Proceeds from issuance of units (2011, $93,393,145)
The accompanying notes are an integral part of the financial statements. 188
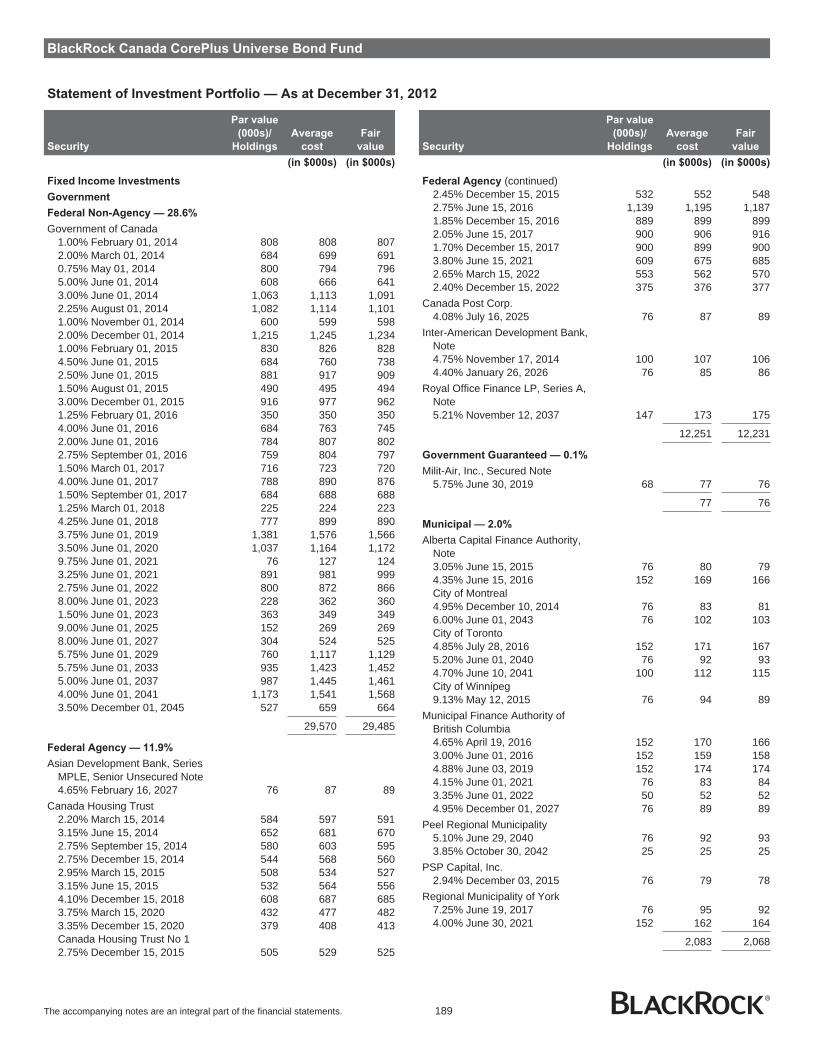
BlackRock Canada CorePlus Universe Bond Fund
Statement of Investment Portfolio — As at December 31, 2012
Security
Par value
(000s)/
Holdings
Average
cost
Fair
value
(in $000s) (in $000s)
Fixed Income Investments
Government
Federal Non-Agency — 28.6%
Government of Canada1.00% February 01, 2014 808 808 8072.00% March 01, 2014 684 699 6910.75% May 01, 2014 800 794 7965.00% June 01, 2014 608 666 6413.00% June 01, 2014 1,063 1,113 1,0912.25% August 01, 2014 1,082 1,114 1,1011.00% November 01, 2014 600 599 5982.00% December 01, 2014 1,215 1,245 1,2341.00% February 01, 2015 830 826 8284.50% June 01, 2015 684 760 7382.50% June 01, 2015 881 917 9091.50% August 01, 2015 490 495 4943.00% December 01, 2015 916 977 9621.25% February 01, 2016 350 350 3504.00% June 01, 2016 684 763 7452.00% June 01, 2016 784 807 8022.75% September 01, 2016 759 804 7971.50% March 01, 2017 716 723 7204.00% June 01, 2017 788 890 8761.50% September 01, 2017 684 688 6881.25% March 01, 2018 225 224 2234.25% June 01, 2018 777 899 8903.75% June 01, 2019 1,381 1,576 1,5663.50% June 01, 2020 1,037 1,164 1,1729.75% June 01, 2021 76 127 1243.25% June 01, 2021 891 981 9992.75% June 01, 2022 800 872 8668.00% June 01, 2023 228 362 3601.50% June 01, 2023 363 349 3499.00% June 01, 2025 152 269 2698.00% June 01, 2027 304 524 5255.75% June 01, 2029 760 1,117 1,1295.75% June 01, 2033 935 1,423 1,4525.00% June 01, 2037 987 1,445 1,4614.00% June 01, 2041 1,173 1,541 1,5683.50% December 01, 2045 527 659 664
29,570 29,485
Federal Agency — 11.9%
Asian Development Bank, SeriesMPLE, Senior Unsecured Note4.65% February 16, 2027 76 87 89
Canada Housing Trust2.20% March 15, 2014 584 597 5913.15% June 15, 2014 652 681 6702.75% September 15, 2014 580 603 5952.75% December 15, 2014 544 568 5602.95% March 15, 2015 508 534 5273.15% June 15, 2015 532 564 5564.10% December 15, 2018 608 687 6853.75% March 15, 2020 432 477 4823.35% December 15, 2020 379 408 413Canada Housing Trust No 12.75% December 15, 2015 505 529 525
Security
Par value
(000s)/
Holdings
Average
cost
Fair
value
(in $000s) (in $000s)
Federal Agency (continued)2.45% December 15, 2015 532 552 5482.75% June 15, 2016 1,139 1,195 1,1871.85% December 15, 2016 889 899 8992.05% June 15, 2017 900 906 9161.70% December 15, 2017 900 899 9003.80% June 15, 2021 609 675 6852.65% March 15, 2022 553 562 5702.40% December 15, 2022 375 376 377
Canada Post Corp.4.08% July 16, 2025 76 87 89
Inter-American Development Bank,Note4.75% November 17, 2014 100 107 1064.40% January 26, 2026 76 85 86
Royal Office Finance LP, Series A,Note5.21% November 12, 2037 147 173 175
12,251 12,231
Government Guaranteed — 0.1%
Milit-Air, Inc., Secured Note5.75% June 30, 2019 68 77 76
77 76
Municipal — 2.0%
Alberta Capital Finance Authority,Note3.05% June 15, 2015 76 80 794.35% June 15, 2016 152 169 166City of Montreal4.95% December 10, 2014 76 83 816.00% June 01, 2043 76 102 103City of Toronto4.85% July 28, 2016 152 171 1675.20% June 01, 2040 76 92 934.70% June 10, 2041 100 112 115City of Winnipeg9.13% May 12, 2015 76 94 89
Municipal Finance Authority ofBritish Columbia4.65% April 19, 2016 152 170 1663.00% June 01, 2016 152 159 1584.88% June 03, 2019 152 174 1744.15% June 01, 2021 76 83 843.35% June 01, 2022 50 52 524.95% December 01, 2027 76 89 89
Peel Regional Municipality5.10% June 29, 2040 76 92 933.85% October 30, 2042 25 25 25
PSP Capital, Inc.2.94% December 03, 2015 76 79 78
Regional Municipality of York7.25% June 19, 2017 76 95 924.00% June 30, 2021 152 162 164
2,083 2,068
The accompanying notes are an integral part of the financial statements. 189

BlackRock Canada CorePlus Universe Bond Fund
Statement of Investment Portfolio — As at December 31, 2012
Security
Par value
(000s)/
Holdings
Average
cost
Fair
value
(in $000s) (in $000s)
Provincial — 27.1%
City of Toronto3.80% December 13, 2042 50 50 50
Financement-Quebec4.25% March 01, 2014 76 81 793.25% June 01, 2014 76 79 784.25% December 01, 2015 76 83 823.50% December 01, 2016 76 82 813.50% December 01, 2017 228 244 2442.40% December 01, 2018 300 300 3032.45% December 01, 2019 300 300 3005.25% June 01, 2034 152 186 188
Hydro Quebec9.63% July 15, 2022 76 120 1185.00% February 15, 2050 202 263 265
Hydro Quebec, (MTN)6.00% February 15, 2040 152 214 216
Hydro Quebec, Series 19, Note6.50% February 15, 2035 152 219 219
Hydro Quebec, Series HL, Note11.00% August 15, 2020 153 248 242
Hydro Quebec, Series JM, Note5.00% February 15, 2045 152 193 195
Ontario Electricity Financial Corp.,Note8.25% June 22, 2026 152 238 236
Province of Alberta2.75% December 01, 2014 100 103 1031.85% September 01, 2016 76 77 771.75% June 15, 2017 100 100 1004.00% December 01, 2019 76 84 852.55% December 15, 2022 100 100 1004.50% December 01, 2040 76 92 94
Province of British Columbia7.50% June 09, 2014 76 87 834.25% June 18, 2014 76 82 794.70% December 01, 2017 76 87 864.10% December 18, 2019 152 168 1713.70% December 18, 2020 152 163 1679.95% May 15, 2021 76 120 1183.25% December 18, 2021 76 78 802.70% December 18, 2022 100 100 1008.00% September 08, 2023 76 113 1125.70% June 18, 2029 126 165 1676.35% June 18, 2031 228 322 3264.70% June 18, 2037 152 182 1864.30% June 18, 2042 252 292 299
Province of British Columbia,Unsecured Note3.20% June 18, 2044 50 49 49
Province of British Columbia, (MTN)4.65% December 18, 2018 152 174 1754.95% June 18, 2040 152 192 196
Province of Manitoba4.80% December 03, 2014 76 84 814.30% March 01, 2016 76 84 82
Security
Par value
(000s)/
Holdings
Average
cost
Fair
value
(in $000s) (in $000s)
Provincial (continued)1.85% June 01, 2017 100 100 1004.15% June 03, 2020 100 112 1127.75% December 22, 2025 76 115 1145.70% March 05, 2037 76 103 1054.60% March 05, 2038 76 90 924.65% March 05, 2040 76 91 934.10% March 05, 2041 76 84 863.35% March 05, 2043 50 51 50
Province of Manitoba, (MTN)6.50% September 22, 2017 76 94 924.40% September 05, 2025 52 59 596.30% March 05, 2031 50 71 71
Province of New Brunswick4.30% December 03, 2015 76 84 826.00% December 27, 2017 76 92 914.45% March 26, 2018 76 86 854.40% June 03, 2019 76 85 864.50% June 02, 2020 152 171 1733.35% December 03, 2021 176 181 1854.65% September 26, 2035 76 88 894.55% March 26, 2037 76 87 884.80% September 26, 2039 152 182 1853.55% June 03, 2043 100 100 101
Province of Newfoundland5.25% June 04, 2014 76 83 805.60% October 17, 2033 76 100 1014.65% October 17, 2040 152 182 186
Province of Nova Scotia1.90% September 08, 2017 400 399 4014.15% November 25, 2019 75 84 844.10% June 01, 2021 76 83 854.50% June 01, 2037 152 173 1774.70% June 01, 2041 76 91 934.40% June 01, 2042 176 204 2073.50% June 02, 2043 650 660 665
Province of Nova Scotia, Series 9Z6.60% June 01, 2027 30 41 42
Province of Ontario5.00% March 08, 2014 408 441 4263.25% September 08, 2014 228 239 2354.50% March 08, 2015 228 250 2433.15% September 08, 2015 128 135 1344.40% March 08, 2016 228 253 2483.20% September 08, 2016 52 55 554.30% March 08, 2017 456 509 5024.20% March 08, 2018 152 169 1694.40% June 02, 2019 656 740 7404.20% June 02, 2020 532 590 5964.00% June 02, 2021 810 886 8963.15% June 02, 2022 903 922 9342.85% June 02, 2023 210 209 2108.10% September 08, 2023 116 172 1718.50% December 02, 2025 76 121 1207.60% June 02, 2027 254 385 3846.50% March 08, 2029 380 533 5366.20% June 02, 2031 252 349 3505.85% March 08, 2033 328 444 446
The accompanying notes are an integral part of the financial statements. 190
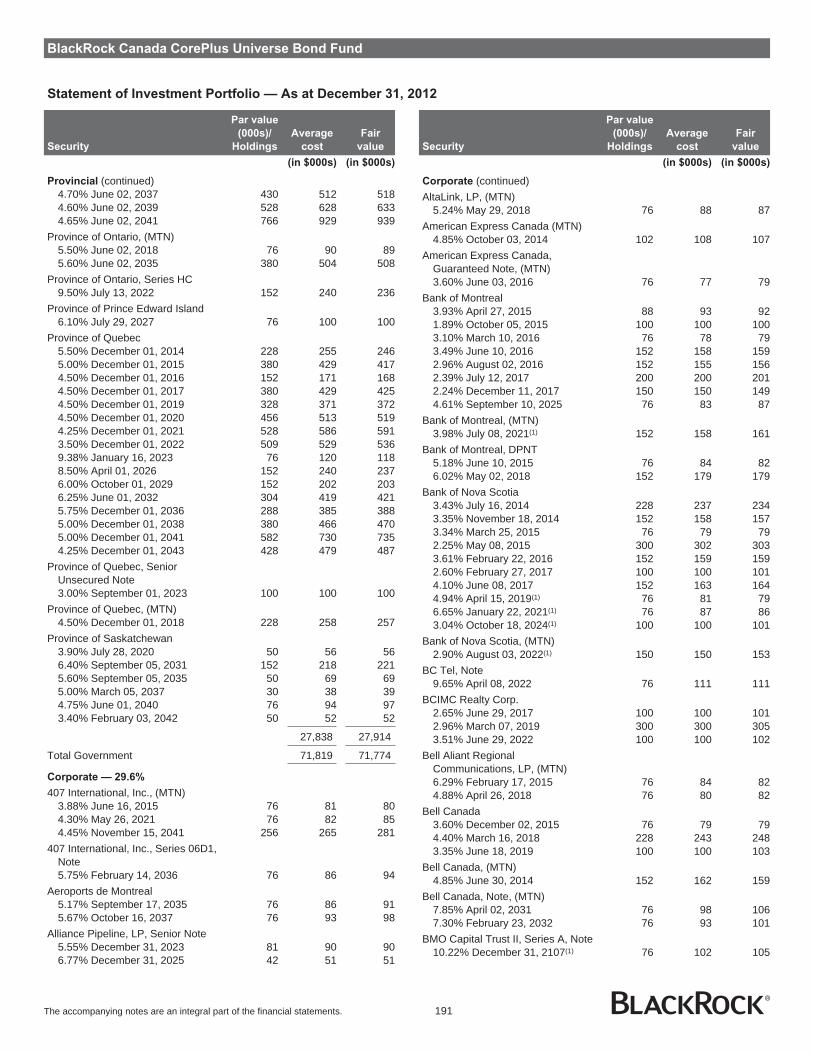
BlackRock Canada CorePlus Universe Bond Fund
Statement of Investment Portfolio — As at December 31, 2012
Security
Par value
(000s)/
Holdings
Average
cost
Fair
value
(in $000s) (in $000s)
Provincial (continued)4.70% June 02, 2037 430 512 5184.60% June 02, 2039 528 628 6334.65% June 02, 2041 766 929 939
Province of Ontario, (MTN)5.50% June 02, 2018 76 90 895.60% June 02, 2035 380 504 508
Province of Ontario, Series HC9.50% July 13, 2022 152 240 236
Province of Prince Edward Island6.10% July 29, 2027 76 100 100
Province of Quebec5.50% December 01, 2014 228 255 2465.00% December 01, 2015 380 429 4174.50% December 01, 2016 152 171 1684.50% December 01, 2017 380 429 4254.50% December 01, 2019 328 371 3724.50% December 01, 2020 456 513 5194.25% December 01, 2021 528 586 5913.50% December 01, 2022 509 529 5369.38% January 16, 2023 76 120 1188.50% April 01, 2026 152 240 2376.00% October 01, 2029 152 202 2036.25% June 01, 2032 304 419 4215.75% December 01, 2036 288 385 3885.00% December 01, 2038 380 466 4705.00% December 01, 2041 582 730 7354.25% December 01, 2043 428 479 487
Province of Quebec, SeniorUnsecured Note3.00% September 01, 2023 100 100 100
Province of Quebec, (MTN)4.50% December 01, 2018 228 258 257
Province of Saskatchewan3.90% July 28, 2020 50 56 566.40% September 05, 2031 152 218 2215.60% September 05, 2035 50 69 695.00% March 05, 2037 30 38 394.75% June 01, 2040 76 94 973.40% February 03, 2042 50 52 52
27,838 27,914
Total Government 71,819 71,774
Corporate — 29.6%
407 International, Inc., (MTN)3.88% June 16, 2015 76 81 804.30% May 26, 2021 76 82 854.45% November 15, 2041 256 265 281
407 International, Inc., Series 06D1,Note5.75% February 14, 2036 76 86 94
Aeroports de Montreal5.17% September 17, 2035 76 86 915.67% October 16, 2037 76 93 98
Alliance Pipeline, LP, Senior Note5.55% December 31, 2023 81 90 906.77% December 31, 2025 42 51 51
Security
Par value
(000s)/
Holdings
Average
cost
Fair
value
(in $000s) (in $000s)
Corporate (continued)AltaLink, LP, (MTN)
5.24% May 29, 2018 76 88 87American Express Canada (MTN)
4.85% October 03, 2014 102 108 107American Express Canada,
Guaranteed Note, (MTN)3.60% June 03, 2016 76 77 79
Bank of Montreal3.93% April 27, 2015 88 93 921.89% October 05, 2015 100 100 1003.10% March 10, 2016 76 78 793.49% June 10, 2016 152 158 1592.96% August 02, 2016 152 155 1562.39% July 12, 2017 200 200 2012.24% December 11, 2017 150 150 1494.61% September 10, 2025 76 83 87
Bank of Montreal, (MTN)3.98% July 08, 2021(1) 152 158 161
Bank of Montreal, DPNT5.18% June 10, 2015 76 84 826.02% May 02, 2018 152 179 179
Bank of Nova Scotia3.43% July 16, 2014 228 237 2343.35% November 18, 2014 152 158 1573.34% March 25, 2015 76 79 792.25% May 08, 2015 300 302 3033.61% February 22, 2016 152 159 1592.60% February 27, 2017 100 100 1014.10% June 08, 2017 152 163 1644.94% April 15, 2019(1) 76 81 796.65% January 22, 2021(1) 76 87 863.04% October 18, 2024(1) 100 100 101
Bank of Nova Scotia, (MTN)2.90% August 03, 2022(1) 150 150 153
BC Tel, Note9.65% April 08, 2022 76 111 111
BCIMC Realty Corp.2.65% June 29, 2017 100 100 1012.96% March 07, 2019 300 300 3053.51% June 29, 2022 100 100 102
Bell Aliant RegionalCommunications, LP, (MTN)6.29% February 17, 2015 76 84 824.88% April 26, 2018 76 80 82
Bell Canada3.60% December 02, 2015 76 79 794.40% March 16, 2018 228 243 2483.35% June 18, 2019 100 100 103
Bell Canada, (MTN)4.85% June 30, 2014 152 162 159
Bell Canada, Note, (MTN)7.85% April 02, 2031 76 98 1067.30% February 23, 2032 76 93 101
BMO Capital Trust II, Series A, Note10.22% December 31, 2107(1) 76 102 105
The accompanying notes are an integral part of the financial statements. 191
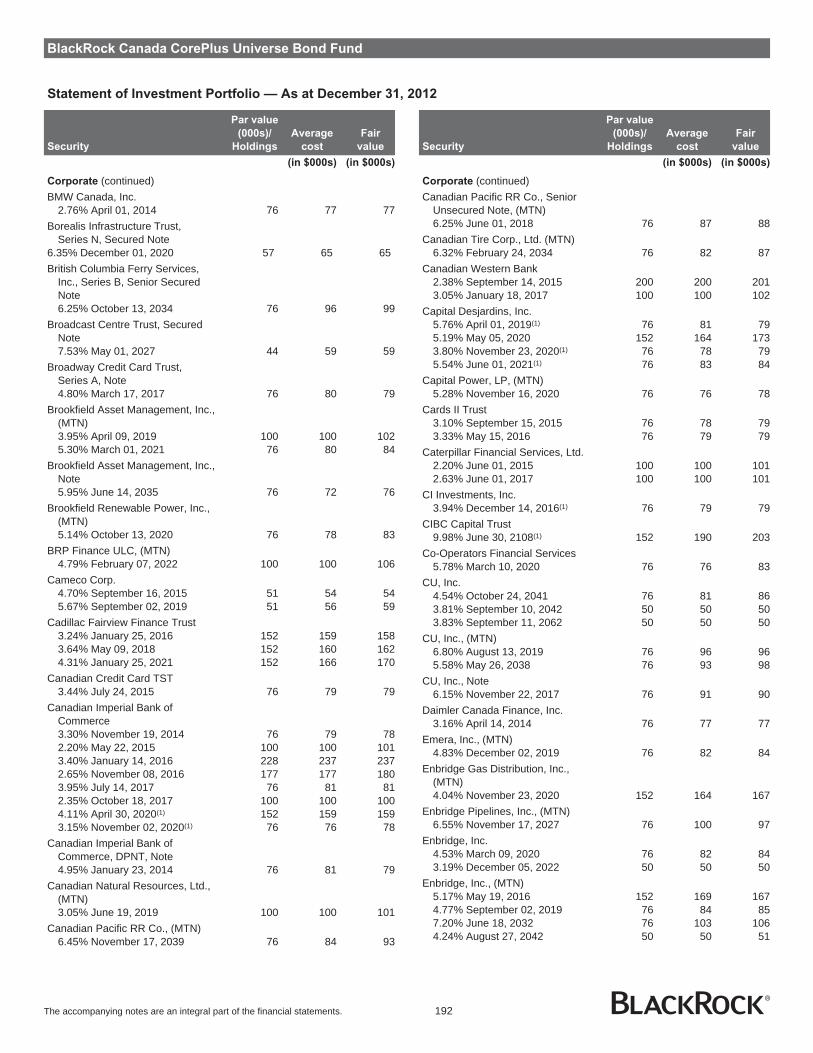
BlackRock Canada CorePlus Universe Bond Fund
Statement of Investment Portfolio — As at December 31, 2012
Security
Par value
(000s)/
Holdings
Average
cost
Fair
value
(in $000s) (in $000s)
Corporate (continued)BMW Canada, Inc.
2.76% April 01, 2014 76 77 77Borealis Infrastructure Trust,
Series N, Secured Note6.35% December 01, 2020 57 65 65British Columbia Ferry Services,
Inc., Series B, Senior SecuredNote6.25% October 13, 2034 76 96 99
Broadcast Centre Trust, SecuredNote7.53% May 01, 2027 44 59 59
Broadway Credit Card Trust,Series A, Note4.80% March 17, 2017 76 80 79
Brookfield Asset Management, Inc.,(MTN)3.95% April 09, 2019 100 100 1025.30% March 01, 2021 76 80 84
Brookfield Asset Management, Inc.,Note5.95% June 14, 2035 76 72 76
Brookfield Renewable Power, Inc.,(MTN)5.14% October 13, 2020 76 78 83
BRP Finance ULC, (MTN)4.79% February 07, 2022 100 100 106
Cameco Corp.4.70% September 16, 2015 51 54 545.67% September 02, 2019 51 56 59
Cadillac Fairview Finance Trust3.24% January 25, 2016 152 159 1583.64% May 09, 2018 152 160 1624.31% January 25, 2021 152 166 170
Canadian Credit Card TST3.44% July 24, 2015 76 79 79
Canadian Imperial Bank ofCommerce3.30% November 19, 2014 76 79 782.20% May 22, 2015 100 100 1013.40% January 14, 2016 228 237 2372.65% November 08, 2016 177 177 1803.95% July 14, 2017 76 81 812.35% October 18, 2017 100 100 1004.11% April 30, 2020(1) 152 159 1593.15% November 02, 2020(1) 76 76 78
Canadian Imperial Bank ofCommerce, DPNT, Note4.95% January 23, 2014 76 81 79
Canadian Natural Resources, Ltd.,(MTN)3.05% June 19, 2019 100 100 101
Canadian Pacific RR Co., (MTN)6.45% November 17, 2039 76 84 93
Security
Par value
(000s)/
Holdings
Average
cost
Fair
value
(in $000s) (in $000s)
Corporate (continued)Canadian Pacific RR Co., Senior
Unsecured Note, (MTN)6.25% June 01, 2018 76 87 88
Canadian Tire Corp., Ltd. (MTN)6.32% February 24, 2034 76 82 87
Canadian Western Bank2.38% September 14, 2015 200 200 2013.05% January 18, 2017 100 100 102
Capital Desjardins, Inc.5.76% April 01, 2019(1) 76 81 795.19% May 05, 2020 152 164 1733.80% November 23, 2020(1) 76 78 795.54% June 01, 2021(1) 76 83 84
Capital Power, LP, (MTN)5.28% November 16, 2020 76 76 78
Cards II Trust3.10% September 15, 2015 76 78 793.33% May 15, 2016 76 79 79
Caterpillar Financial Services, Ltd.2.20% June 01, 2015 100 100 1012.63% June 01, 2017 100 100 101
CI Investments, Inc.3.94% December 14, 2016(1) 76 79 79
CIBC Capital Trust9.98% June 30, 2108(1) 152 190 203
Co-Operators Financial Services5.78% March 10, 2020 76 76 83
CU, Inc.4.54% October 24, 2041 76 81 863.81% September 10, 2042 50 50 503.83% September 11, 2062 50 50 50
CU, Inc., (MTN)6.80% August 13, 2019 76 96 965.58% May 26, 2038 76 93 98
CU, Inc., Note6.15% November 22, 2017 76 91 90
Daimler Canada Finance, Inc.3.16% April 14, 2014 76 77 77
Emera, Inc., (MTN)4.83% December 02, 2019 76 82 84
Enbridge Gas Distribution, Inc.,(MTN)4.04% November 23, 2020 152 164 167
Enbridge Pipelines, Inc., (MTN)6.55% November 17, 2027 76 100 97
Enbridge, Inc.4.53% March 09, 2020 76 82 843.19% December 05, 2022 50 50 50
Enbridge, Inc., (MTN)5.17% May 19, 2016 152 169 1674.77% September 02, 2019 76 84 857.20% June 18, 2032 76 103 1064.24% August 27, 2042 50 50 51
The accompanying notes are an integral part of the financial statements. 192
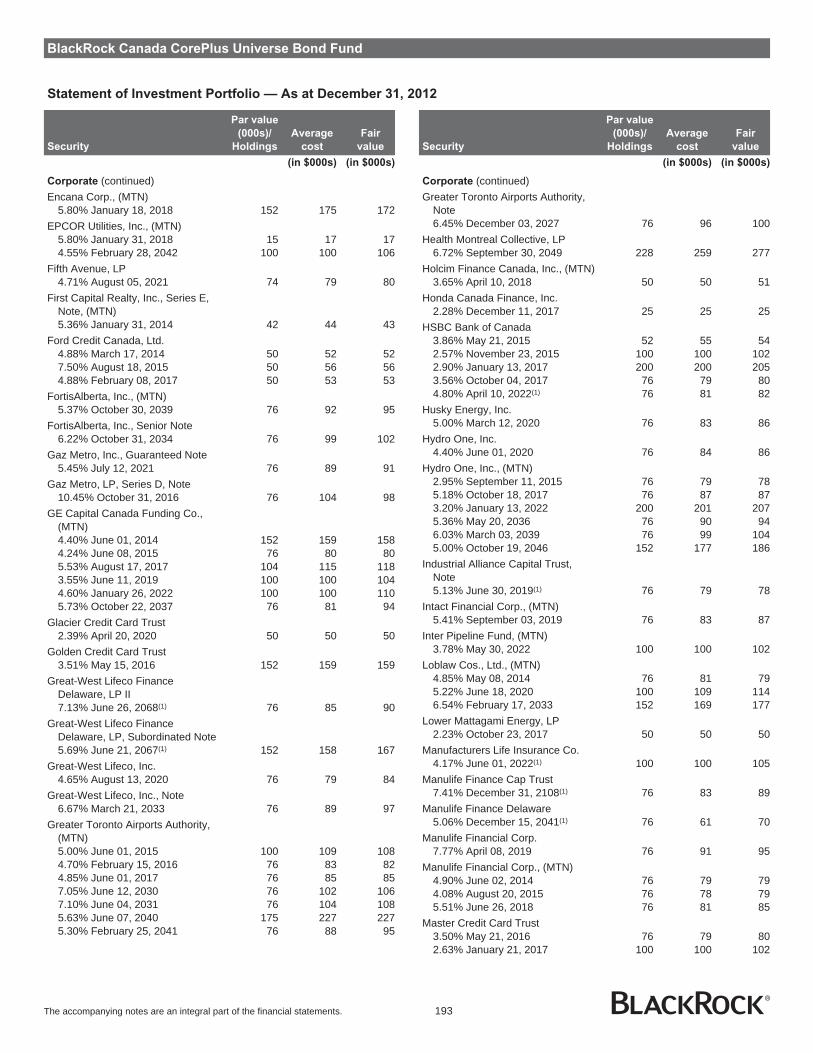
BlackRock Canada CorePlus Universe Bond Fund
Statement of Investment Portfolio — As at December 31, 2012
Security
Par value
(000s)/
Holdings
Average
cost
Fair
value
(in $000s) (in $000s)
Corporate (continued)Encana Corp., (MTN)
5.80% January 18, 2018 152 175 172EPCOR Utilities, Inc., (MTN)
5.80% January 31, 2018 15 17 174.55% February 28, 2042 100 100 106
Fifth Avenue, LP4.71% August 05, 2021 74 79 80
First Capital Realty, Inc., Series E,Note, (MTN)5.36% January 31, 2014 42 44 43
Ford Credit Canada, Ltd.4.88% March 17, 2014 50 52 527.50% August 18, 2015 50 56 564.88% February 08, 2017 50 53 53
FortisAlberta, Inc., (MTN)5.37% October 30, 2039 76 92 95
FortisAlberta, Inc., Senior Note6.22% October 31, 2034 76 99 102
Gaz Metro, Inc., Guaranteed Note5.45% July 12, 2021 76 89 91
Gaz Metro, LP, Series D, Note10.45% October 31, 2016 76 104 98
GE Capital Canada Funding Co.,(MTN)4.40% June 01, 2014 152 159 1584.24% June 08, 2015 76 80 805.53% August 17, 2017 104 115 1183.55% June 11, 2019 100 100 1044.60% January 26, 2022 100 100 1105.73% October 22, 2037 76 81 94
Glacier Credit Card Trust2.39% April 20, 2020 50 50 50
Golden Credit Card Trust3.51% May 15, 2016 152 159 159
Great-West Lifeco FinanceDelaware, LP II7.13% June 26, 2068(1) 76 85 90
Great-West Lifeco FinanceDelaware, LP, Subordinated Note5.69% June 21, 2067(1) 152 158 167
Great-West Lifeco, Inc.4.65% August 13, 2020 76 79 84
Great-West Lifeco, Inc., Note6.67% March 21, 2033 76 89 97
Greater Toronto Airports Authority,(MTN)5.00% June 01, 2015 100 109 1084.70% February 15, 2016 76 83 824.85% June 01, 2017 76 85 857.05% June 12, 2030 76 102 1067.10% June 04, 2031 76 104 1085.63% June 07, 2040 175 227 2275.30% February 25, 2041 76 88 95
Security
Par value
(000s)/
Holdings
Average
cost
Fair
value
(in $000s) (in $000s)
Corporate (continued)Greater Toronto Airports Authority,
Note6.45% December 03, 2027 76 96 100
Health Montreal Collective, LP6.72% September 30, 2049 228 259 277
Holcim Finance Canada, Inc., (MTN)3.65% April 10, 2018 50 50 51
Honda Canada Finance, Inc.2.28% December 11, 2017 25 25 25
HSBC Bank of Canada3.86% May 21, 2015 52 55 542.57% November 23, 2015 100 100 1022.90% January 13, 2017 200 200 2053.56% October 04, 2017 76 79 804.80% April 10, 2022(1) 76 81 82
Husky Energy, Inc.5.00% March 12, 2020 76 83 86
Hydro One, Inc.4.40% June 01, 2020 76 84 86
Hydro One, Inc., (MTN)2.95% September 11, 2015 76 79 785.18% October 18, 2017 76 87 873.20% January 13, 2022 200 201 2075.36% May 20, 2036 76 90 946.03% March 03, 2039 76 99 1045.00% October 19, 2046 152 177 186
Industrial Alliance Capital Trust,Note5.13% June 30, 2019(1) 76 79 78
Intact Financial Corp., (MTN)5.41% September 03, 2019 76 83 87
Inter Pipeline Fund, (MTN)3.78% May 30, 2022 100 100 102
Loblaw Cos., Ltd., (MTN)4.85% May 08, 2014 76 81 795.22% June 18, 2020 100 109 1146.54% February 17, 2033 152 169 177
Lower Mattagami Energy, LP2.23% October 23, 2017 50 50 50
Manufacturers Life Insurance Co.4.17% June 01, 2022(1) 100 100 105
Manulife Finance Cap Trust7.41% December 31, 2108(1) 76 83 89
Manulife Finance Delaware5.06% December 15, 2041(1) 76 61 70
Manulife Financial Corp.7.77% April 08, 2019 76 91 95
Manulife Financial Corp., (MTN)4.90% June 02, 2014 76 79 794.08% August 20, 2015 76 78 795.51% June 26, 2018 76 81 85
Master Credit Card Trust3.50% May 21, 2016 76 79 802.63% January 21, 2017 100 100 102
The accompanying notes are an integral part of the financial statements. 193
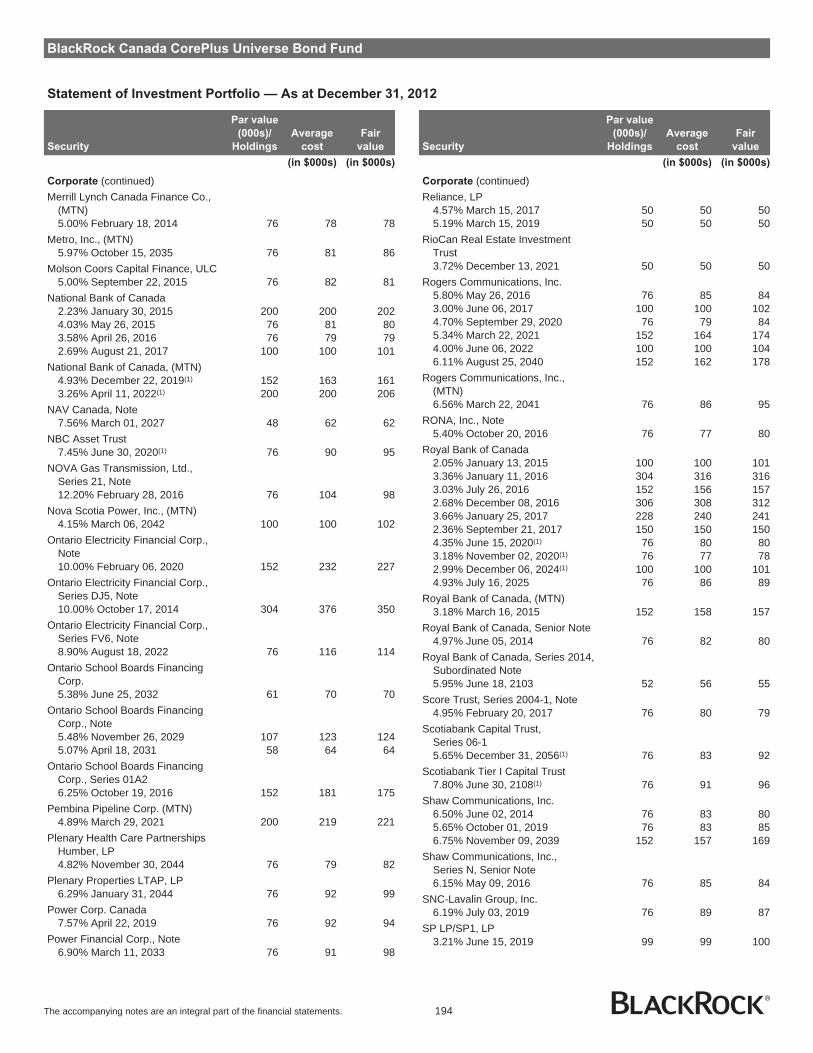
BlackRock Canada CorePlus Universe Bond Fund
Statement of Investment Portfolio — As at December 31, 2012
Security
Par value
(000s)/
Holdings
Average
cost
Fair
value
(in $000s) (in $000s)
Corporate (continued)Merrill Lynch Canada Finance Co.,
(MTN)5.00% February 18, 2014 76 78 78
Metro, Inc., (MTN)5.97% October 15, 2035 76 81 86
Molson Coors Capital Finance, ULC5.00% September 22, 2015 76 82 81
National Bank of Canada2.23% January 30, 2015 200 200 2024.03% May 26, 2015 76 81 803.58% April 26, 2016 76 79 792.69% August 21, 2017 100 100 101
National Bank of Canada, (MTN)4.93% December 22, 2019(1) 152 163 1613.26% April 11, 2022(1) 200 200 206
NAV Canada, Note7.56% March 01, 2027 48 62 62
NBC Asset Trust7.45% June 30, 2020(1) 76 90 95
NOVA Gas Transmission, Ltd.,Series 21, Note12.20% February 28, 2016 76 104 98
Nova Scotia Power, Inc., (MTN)4.15% March 06, 2042 100 100 102
Ontario Electricity Financial Corp.,Note10.00% February 06, 2020 152 232 227
Ontario Electricity Financial Corp.,Series DJ5, Note10.00% October 17, 2014 304 376 350
Ontario Electricity Financial Corp.,Series FV6, Note8.90% August 18, 2022 76 116 114
Ontario School Boards FinancingCorp.5.38% June 25, 2032 61 70 70
Ontario School Boards FinancingCorp., Note5.48% November 26, 2029 107 123 1245.07% April 18, 2031 58 64 64
Ontario School Boards FinancingCorp., Series 01A26.25% October 19, 2016 152 181 175
Pembina Pipeline Corp. (MTN)4.89% March 29, 2021 200 219 221
Plenary Health Care PartnershipsHumber, LP4.82% November 30, 2044 76 79 82
Plenary Properties LTAP, LP6.29% January 31, 2044 76 92 99
Power Corp. Canada7.57% April 22, 2019 76 92 94
Power Financial Corp., Note6.90% March 11, 2033 76 91 98
Security
Par value
(000s)/
Holdings
Average
cost
Fair
value
(in $000s) (in $000s)
Corporate (continued)Reliance, LP
4.57% March 15, 2017 50 50 505.19% March 15, 2019 50 50 50
RioCan Real Estate InvestmentTrust3.72% December 13, 2021 50 50 50
Rogers Communications, Inc.5.80% May 26, 2016 76 85 843.00% June 06, 2017 100 100 1024.70% September 29, 2020 76 79 845.34% March 22, 2021 152 164 1744.00% June 06, 2022 100 100 1046.11% August 25, 2040 152 162 178
Rogers Communications, Inc.,(MTN)6.56% March 22, 2041 76 86 95
RONA, Inc., Note5.40% October 20, 2016 76 77 80
Royal Bank of Canada2.05% January 13, 2015 100 100 1013.36% January 11, 2016 304 316 3163.03% July 26, 2016 152 156 1572.68% December 08, 2016 306 308 3123.66% January 25, 2017 228 240 2412.36% September 21, 2017 150 150 1504.35% June 15, 2020(1) 76 80 803.18% November 02, 2020(1) 76 77 782.99% December 06, 2024(1) 100 100 1014.93% July 16, 2025 76 86 89
Royal Bank of Canada, (MTN)3.18% March 16, 2015 152 158 157
Royal Bank of Canada, Senior Note4.97% June 05, 2014 76 82 80
Royal Bank of Canada, Series 2014,Subordinated Note5.95% June 18, 2103 52 56 55
Score Trust, Series 2004-1, Note4.95% February 20, 2017 76 80 79
Scotiabank Capital Trust,Series 06-15.65% December 31, 2056(1) 76 83 92
Scotiabank Tier I Capital Trust7.80% June 30, 2108(1) 76 91 96
Shaw Communications, Inc.6.50% June 02, 2014 76 83 805.65% October 01, 2019 76 83 856.75% November 09, 2039 152 157 169
Shaw Communications, Inc.,Series N, Senior Note6.15% May 09, 2016 76 85 84
SNC-Lavalin Group, Inc.6.19% July 03, 2019 76 89 87
SP LP/SP1, LP3.21% June 15, 2019 99 99 100
The accompanying notes are an integral part of the financial statements. 194

BlackRock Canada CorePlus Universe Bond Fund
Statement of Investment Portfolio — As at December 31, 2012
Security
Par value
(000s)/
Holdings
Average
cost
Fair
value
(in $000s) (in $000s)
Corporate (continued)Sun Life Financial, Inc.
4.57% August 23, 2021 76 76 834.95% June 01, 2036(1) 152 156 161
Sun Life Financial, Inc., (MTN)5.40% May 29, 2042(1) 76 69 76
Sun Life Financial, Inc.,Senior Note, (MTN)4.80% November 23, 2035(1) 76 78 80
Suncor Energy, Inc., (MTN)5.39% March 26, 2037 76 83 88
TD Capital Trust IV9.52% June 30, 2108(1) 76 100 1046.63% June 30, 2108(1) 76 86 93
TELUS Corp.4.95% May 15, 2014 76 81 794.95% March 15, 2017 76 83 845.05% December 04, 2019 76 83 865.05% July 23, 2020 76 83 87
TELUS Corp., Senior UnsecuredNote5.95% April 15, 2015 76 84 83
Teranet Holdings, LP3.53% December 16, 2015 76 79 794.81% December 16, 2020 76 81 855.75% December 17, 2040 76 79 86
Terasen Gas, Inc., Senior Note,(MTN)5.80% May 13, 2038 152 193 201
Thomson Reuters Corp.5.20% December 01, 2014 76 83 815.70% July 15, 2015 76 85 836.00% March 31, 2016 76 86 85
Toronto Hydro Corp., Note5.15% November 14, 2017 76 87 86
Toronto-Dominion Bank2.95% August 02, 2016 228 233 235
Toronto-Dominion Bank, (MTN)5.48% April 02, 2020(1) 152 166 1643.37% November 02, 2020(1) 76 77 795.83% July 09, 2023(1) 76 87 894.97% October 30, 2104(1) 152 163 1644.78% December 14, 2105(1) 127 136 138
Toronto-Dominion Bank, Note10.05% August 04, 2014 76 91 85
Toyota Credit Canada, Inc.2.45% February 27, 2017 100 100 101
TransAlta Corp., (MTN)7.30% October 22, 2029 76 85 81
TransCanada PipeLines, Ltd., (MTN)4.65% October 03, 2016 76 84 833.65% November 15, 2021 127 129 1354.55% November 15, 2041 127 131 139
TransCanada PipeLines, Ltd., Note,(MTN)7.90% April 15, 2027 76 108 110
Security
Par value
(000s)/
Holdings
Average
cost
Fair
value
(in $000s) (in $000s)
Corporate (continued)Union Gas, Ltd., (MTN)
5.20% July 23, 2040 75 92 91Union Gas, Ltd., Series 1992, Note
9.70% November 06, 2017 76 104 100Union Gas, Ltd., Series 1993, Note
8.75% August 03, 2018 76 102 100VW Credit Canada, Inc.
2.50% June 01, 2015 100 100 1012.90% June 01, 2017 100 100 102
Wells Fargo Canada Corp., (MTN)2.94% July 25, 2019 100 100 101
Wells Fargo Financial Canada Corp.3.97% November 03, 2014 76 79 79
Wells Fargo Financial Canada Corp.,(MTN)4.38% June 30, 2015 76 81 803.70% March 30, 2016 76 79 802.77% February 09, 2017 500 500 509
Westcoast Energy, Inc.3.28% January 15, 2016 76 79 793.12% December 05, 2022 100 100 99
Westcoast Energy, Inc., (MTN)7.15% March 20, 2031 76 103 107
Winnipeg Airport Authority, Inc.4.57% November 20, 2019 50 56 56
Total Corporate 29,941 30,449
Total Fixed Income Investments 101,760 102,223
Foreign Investments — 49.8%
U.S. LIBOR GlobalAlpha Bond FundLtd.* 39,949 49,198 51,331
Total Foreign Investments 49,198 51,331
Total Investments 150,958 153,554
Other Assets and Liabilities — (49.1)% (50,576)
Net Assets 102,978
(1) Variable rate security. Rate shown is as at report date.
The accompanying notes are an integral part of the financial statements. 195

BlackRock Canada CorePlus Universe Bond Fund
Statement of Investment Portfolio — As at December 31, 2012
Portfolio Concentration
(as a percentage of Net Assets)
Portfolio by Category
As at
December 31, 2012
As at
December 31, 2011
(%) (%)
Federal Non-Agency 28.6 30.1Federal Agency 11.9 12.7Government Guaranteed 0.1 0.1Municipal 2.0 1.7Provincial 27.1 26.3Corporate 29.6 27.6Foreign Investments 49.8 51.2Repurchase Agreements (50.8) (11.4)Other Assets and Liabilities 1.7 (38.3)
Open futures contracts, forward currency contracts, and repurchaseagreements held by the Fund as at December 31, 2012 are shown inNotes 4, 5, and 7 respectively.
* The U.S. LIBOR GlobalAlpha Bond Fund Ltd. is a Cayman Islandsexempted company that achieves its investment objective by investingin the BlackRock Fixed Income GlobalAlpha Master Fund Ltd. (“FIGA”)and Strategic Short Duration Bond Fund Ltd. (“SSD”), each anexempted company incorporated under the laws of the Cayman Islands.FIGA seeks to invest in a diversified portfolio of long and short fixedincome securities across global markets and SSD seeks to invest in adiversified portfolio of debt securities and other credit-relatedinstruments in various global markets. The following portfolioconcentration is as a percentage of Net Assets of the U.S. LIBORGlobalAlpha Bond Fund Ltd.
Portfolio by Category
As at
December 31, 2012
As at
December 31, 2011
(%) (%)
FIGA 37.0 37.0SSD 61.8 62.8Other Assets and Liabilities 1.2 0.2
The accompanying notes are an integral part of the financial statements. 196

BlackRock Canada Levered Long Bond Index Fund (Note 1)
Statement of Net Assets — As at December 31
2012 2011
Assets
Investments - at fair value (Note 2) $ 44,940,474 $ 32,093,859Cash 300,428 90,891Cash collateral 11,250,142 7,683,429Unrealized gain on swaps (Note 6) 553,246 2,257,978
57,044,290 42,126,157
Liabilities
Operating expenses payable 15,124 11,596
15,124 11,596
Net Assets $ 57,029,166 $ 42,114,561
Number of Units Issued and Outstanding (Note 8) 4,837,744 3,848,139
Net Assets per Unit $ 11.79 $ 10.94
Investments at Cost $ 45,431,617 $ 31,701,071
Approved by BlackRock Asset Management Canada Limited,Manager of the Funds
Eric Léveillé, Director Noel Archard, Director
The accompanying notes are an integral part of the financial statements. 197
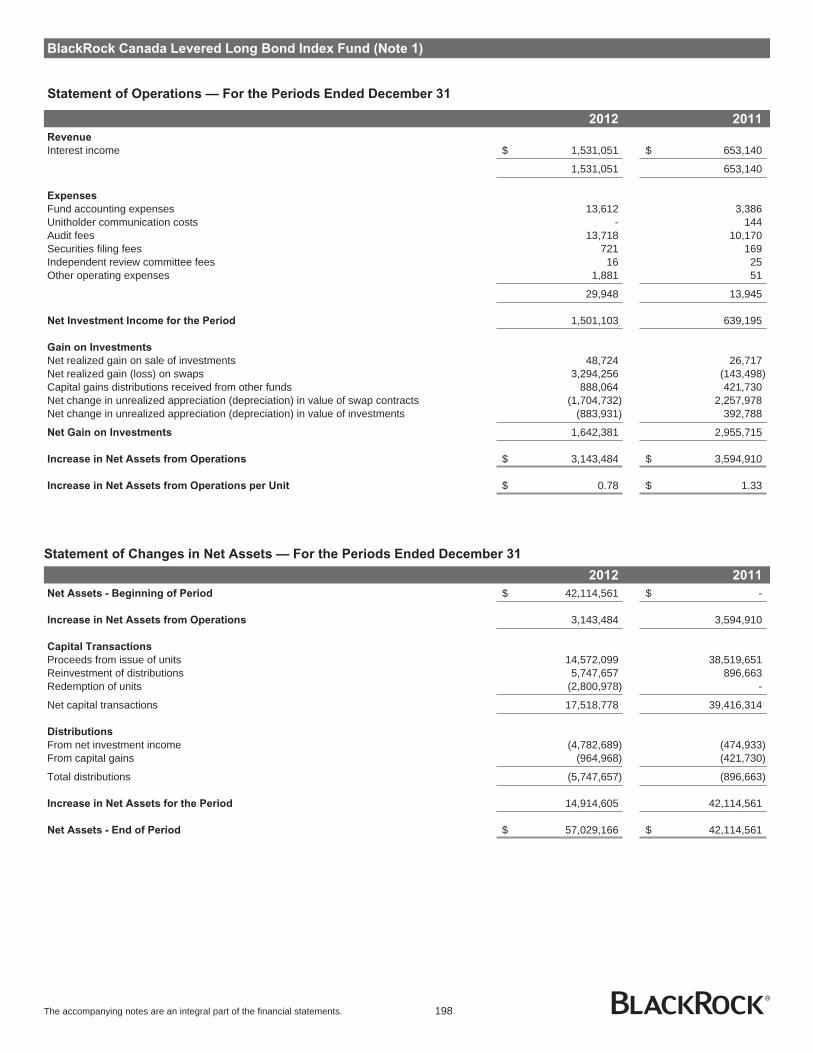
BlackRock Canada Levered Long Bond Index Fund (Note 1)
Statement of Operations — For the Periods Ended December 31
2012 2011
Revenue
Interest income $ 1,531,051 $ 653,140
1,531,051 653,140
Expenses
Fund accounting expenses 13,612 3,386Unitholder communication costs - 144Audit fees 13,718 10,170Securities filing fees 721 169Independent review committee fees 16 25Other operating expenses 1,881 51
29,948 13,945
Net Investment Income for the Period 1,501,103 639,195
Gain on Investments
Net realized gain on sale of investments 48,724 26,717Net realized gain (loss) on swaps 3,294,256 (143,498)Capital gains distributions received from other funds 888,064 421,730Net change in unrealized appreciation (depreciation) in value of swap contracts (1,704,732) 2,257,978Net change in unrealized appreciation (depreciation) in value of investments (883,931) 392,788
Net Gain on Investments 1,642,381 2,955,715
Increase in Net Assets from Operations $ 3,143,484 $ 3,594,910
Increase in Net Assets from Operations per Unit $ 0.78 $ 1.33
Statement of Changes in Net Assets — For the Periods Ended December 31
2012 2011
Net Assets - Beginning of Period $ 42,114,561 $ -
Increase in Net Assets from Operations 3,143,484 3,594,910
Capital Transactions
Proceeds from issue of units 14,572,099 38,519,651Reinvestment of distributions 5,747,657 896,663Redemption of units (2,800,978) -
Net capital transactions 17,518,778 39,416,314
Distributions
From net investment income (4,782,689) (474,933)From capital gains (964,968) (421,730)
Total distributions (5,747,657) (896,663)
Increase in Net Assets for the Period 14,914,605 42,114,561
Net Assets - End of Period $ 57,029,166 $ 42,114,561
The accompanying notes are an integral part of the financial statements. 198

BlackRock Canada Levered Long Bond Index Fund
Statement of Investment Portfolio — As at December 31, 2012
Security Holdings
Average
cost
Fair
value
(in $000s) (in $000s)
Canadian Fixed Income Index
Equivalents — 78.8%
BlackRock Canada Long Bond IndexClass A 1,547,016 45,432 44,940
Total Canadian Fixed Income
Index Equivalents 45,432 44,940
Total Investments 45,432 44,940
Other Assets and Liabilities — 21.2% 12,089
Net Assets 57,029
Portfolio Concentration
(as a percentage of Net Assets)
Portfolio by Category
As at
December 31, 2012
As at
December 31, 2011
(%) (%)
Canadian Fixed IncomeIndex Equivalents 78.8 76.2
Swap referenced toCanadian Fixed IncomeIndex Equivalents 1.0 5.4
Other Assets and Liabilities 20.2 18.4
Open swap contracts held by the Fund as at December 31, 2012 areshown in Note 6.
The accompanying notes are an integral part of the financial statements. 199

BlackRock Canada Levered Real Return Bond Index Fund (Note 1)
Statement of Net Assets — As at December 31
2012 2011
Assets
Investments - at fair value (Note 2) $ 32,576,201 $ 33,624,417Cash 195,911 508,491Cash collateral 8,183,966 6,562,948Unrealized gain on swaps (Note 6) 231,778 3,517,931
41,187,856 44,213,787
Liabilities
Operating expenses payable 15,012 11,591
15,012 11,591
Net Assets $ 41,172,844 $ 44,202,196
Number of Units Issued and Outstanding (Note 8) 3,452,114 3,847,558
Net Assets per Unit $ 11.93 $ 11.49
Investments at Cost $ 31,801,395 $ 32,325,898
Approved by BlackRock Asset Management Canada Limited,Manager of the Funds
Eric Léveillé, Director Noel Archard, Director
The accompanying notes are an integral part of the financial statements. 200

BlackRock Canada Levered Real Return Bond Index Fund (Note 1)
Statement of Operations — For the Periods Ended December 31
2012 2011
Revenue
Interest income $ 912,805 $ 558,008
912,805 558,008
Expenses
Fund accounting expenses 13,612 3,387Unitholder communication costs - 144Audit fees 13,718 10,170Securities filing fees 632 163Independent review committee fees 17 27Other operating expenses 1,871 50
29,850 13,941
Net Investment Income for the Period 882,955 544,067
Gain on Investments
Net realized gain on sale of investments 144,233 -Net realized gain (loss) on swaps 4,023,004 (143,489)Capital gains distributions received from other funds 445,409 468,404Net change in unrealized appreciation (depreciation) in value of swap contracts (3,286,153) 3,517,931Net change in unrealized appreciation (depreciation) in value of investments (523,713) 1,298,519
Net Gain on Investments 802,780 5,141,365
Increase in Net Assets from Operations $ 1,685,735 $ 5,685,432
Increase in Net Assets from Operations per Unit $ 0.46 $ 2.10
Statement of Changes in Net Assets — For the Periods Ended December 31
2012 2011
Net Assets - Beginning of Period $ 44,202,196 $ -
Increase in Net Assets from Operations 1,685,735 5,685,432
Capital Transactions
Proceeds from issue of units - 38,516,764Reinvestment of distributions 5,492,016 848,222Redemption of units (4,715,087) -
Net capital transactions 776,929 39,364,986
Distributions
From net investment income (4,902,373) (379,819)From capital gains (589,643) (468,403)
Total distributions (5,492,016) (848,222)
Increase (Decrease) in Net Assets for the Period (3,029,352) 44,202,196
Net Assets - End of Period $ 41,172,844 $ 44,202,196
The accompanying notes are an integral part of the financial statements. 201

BlackRock Canada Levered Real Return Bond Index Fund
Statement of Investment Portfolio — As at December 31, 2012
Security Holdings
Average
cost
Fair
value
(in $000s) (in $000s)
Canadian Fixed Income Index
Equivalents — 79.1%
BlackRock Canada Real ReturnBond Index Class A 964,905 31,801 32,576
Total Canadian Fixed Income
Index Equivalents 31,801 32,576
Total Investments 31,801 32,576
Other Assets and Liabilities — 20.9% 8,597
Net Assets 41,173
Portfolio Concentration
(as a percentage of Net Assets)
Portfolio by Category
As at
December 31, 2012
As at
December 31, 2011
(%) (%)
Canadian Fixed IncomeIndex Equivalents 79.1 76.1
Swap referenced toCanadian Fixed IncomeIndex Equivalents 0.6 8.0
Other Assets and Liabilities 20.3 15.9
Open swap contracts held by the Fund as at December 31, 2012 areshown in Note 6.
The accompanying notes are an integral part of the financial statements. 202

BlackRock Balanced Moderate Index DC Fund
Statement of Net Assets — As at December 31
2012 2011
Assets
Investments - at fair value (Note 2) $ 1,085,395,662 $ 916,746,654Cash 1,965,334 2,172,282Securities lending income receivable 61 1,946Dividends receivable 111,754 97,152Accounts receivable from issue of units 1,242,628 826,285
1,088,715,439 919,844,319
Liabilities
Operating expenses payable 17,208 15,599Payables for redemption of units 67,585 290,377Payables for investment purchases 1,186,000 966,335
1,270,793 1,272,311
Net Assets $ 1,087,444,646 $ 918,572,008
Number of Units Issued and Outstanding (Note 8) 54,119,720 49,665,021
Net Assets per Unit $ 20.09 $ 18.50
Investments at Cost $ 1,004,413,427 $ 874,390,270
Approved by BlackRock Asset Management Canada Limited,Manager of the Funds
Eric Léveillé, Director Noel Archard, Director
The accompanying notes are an integral part of the financial statements. 203

BlackRock Balanced Moderate Index DC Fund
Statement of Operations — For the Years Ended December 31
2012 2011
Revenue
Dividend income $ 17,078,611 $ 13,794,921Interest income 14,399,875 14,532,726Securities lending income 18,863 11,795Foreign exchange gain (loss) (1,956) 2,996Withholding taxes (271,457) (249,346)
31,223,936 28,093,092
Expenses
Custodian fees 227 166Fund accounting expenses 5,737 6,208Unitholder communication costs - 601Audit fees 9,585 10,210Securities filing fees 16,696 13,386Independent review committee fees 412 1,019Other operating expenses 2,734 3,039
35,391 34,629
Net Investment Income for the Year 31,188,545 28,058,463
Gain (Loss) on Investments
Net realized gain on sale of investments 5,605,998 7,464,171Capital gains distributions received from other funds 6,044,112 3,455,761Transaction costs (Note 2,13) (5,946) (7,379)Net change in unrealized appreciation (depreciation) in value of investments 38,625,851 (20,530,170)
Net Gain (Loss) on Investments 50,270,015 (9,617,617)
Increase in Net Assets from Operations $ 81,458,560 $ 18,440,846
Increase in Net Assets from Operations per Unit $ 1.59 $ 0.38
Statement of Changes in Net Assets — For the Years Ended December 31
2012 2011
Net Assets - Beginning of Year $ 918,572,008 $ 837,174,017
Increase in Net Assets from Operations 81,458,560 18,440,846
Capital Transactions
Proceeds from issue of units 197,142,577 163,047,247Reinvestment of distributions 30,735,590 27,088,056Redemption of units (109,728,499) (100,090,102)
Net capital transactions 118,149,668 90,045,201
Distributions
From net investment income (30,735,590) (27,088,056)
Total distributions (30,735,590) (27,088,056)
Increase in Net Assets for the Year 168,872,638 81,397,991
Net Assets - End of Year $ 1,087,444,646 $ 918,572,008
The accompanying notes are an integral part of the financial statements. 204

BlackRock Balanced Moderate Index DC Fund
Statement of Investment Portfolio — As at December 31, 2012
Security Holdings
Average
cost
Fair
value
(in $000s) (in $000s)
Canadian Equity Index
Equivalents — 22.5%
BlackRock Canadian Equity IndexClass D 9,127,270 205,613 217,781
iShares S&P/TSX Capped REITIndex Fund 1,578,835 19,425 27,030
Total Canadian Equity Index
Equivalents 225,038 244,811
Canadian Fixed Income Index
Equivalents — 39.4%
BlackRock Canada Real ReturnBond Index Class D 6,852,574 93,806 107,267
BlackRock Canada Universe BondIndex Class D 13,644,322 313,935 321,270
Total Canadian Fixed Income
Index Equivalents 407,741 428,537
Foreign Index
Equivalents — 37.9%
BlackRock CDN MSCI EAFE EquityIndex Class D 14,683,666 141,716 148,652
BlackRock CDN US Equity IndexClass D 21,298,752 155,593 183,472
iShares Dow Jones U.S. RealEstate Index Fund 420,740 23,884 27,126
iShares MSCI Emerging MarketsIndex Fund 1,192,933 50,457 52,798
Total Foreign Index Equivalents 371,650 412,048
Transaction Costs (Note 2) (16)
Total Investments 1,004,413 1,085,396
Other Assets and Liabilities — 0.2% 2,049
Net Assets 1,087,445
Portfolio Concentration
(as a percentage of Net Assets)
Portfolio by Category
As at
December 31, 2012
As at
December 31, 2011
(%) (%)
Canadian Equity IndexEquivalents 22.5 22.5
Canadian Fixed IncomeIndex Equivalents 39.4 40.2
Foreign Index Equivalents 37.9 37.1Other Assets and Liabilities 0.2 0.2
The accompanying notes are an integral part of the financial statements. 205

BlackRock Balanced Conservative Index DC Fund
Statement of Net Assets — As at December 31
2012 2011
Assets
Investments - at fair value (Note 2) $ 596,013,244 $ 489,253,101Cash 676,645 930,118Securities lending income receivable 186 2Dividends receivable 59,780 49,521Accounts receivable from issue of units 54,957 61,899
596,804,812 490,294,641
Liabilities
Operating expenses payable 13,869 13,282Payables for redemption of units 434,447 70,774
448,316 84,056
Net Assets $ 596,356,496 $ 490,210,585
Number of Units Issued and Outstanding (Note 8) 31,033,126 27,336,843
Net Assets per Unit $ 19.22 $ 17.93
Investments at Cost $ 556,644,827 $ 461,043,449
Approved by BlackRock Asset Management Canada Limited,Manager of the Funds
Eric Léveillé, Director Noel Archard, Director
The accompanying notes are an integral part of the financial statements. 206
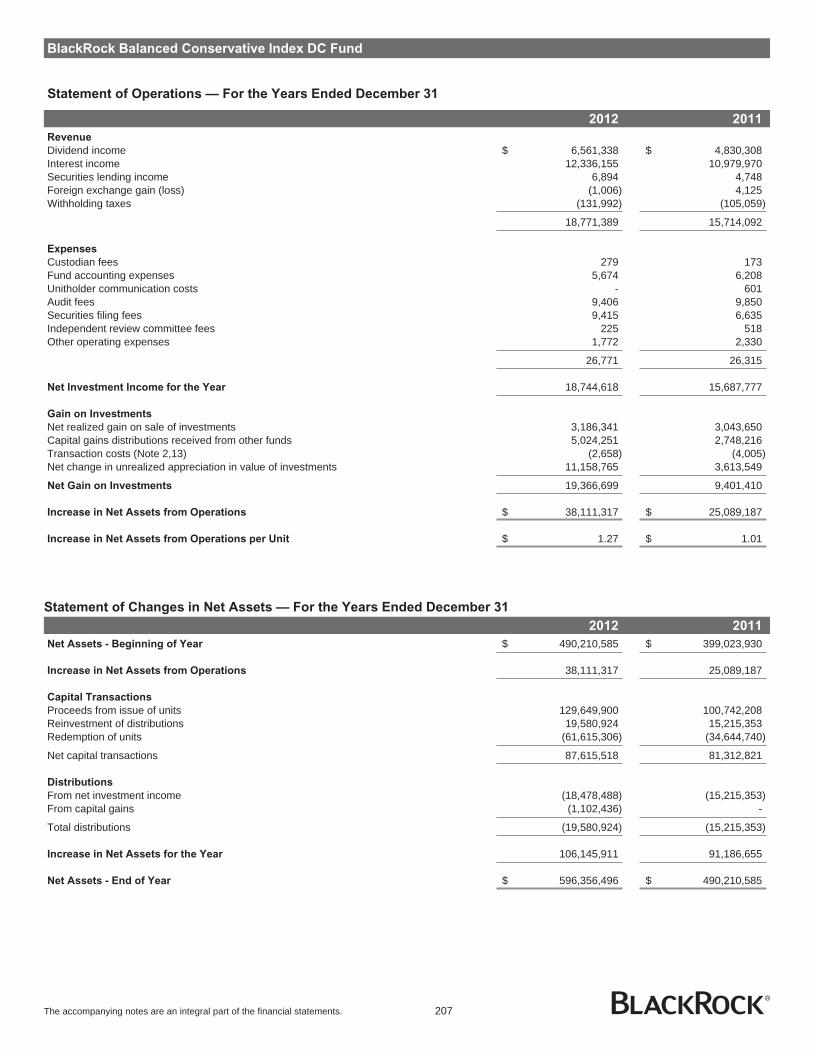
BlackRock Balanced Conservative Index DC Fund
Statement of Operations — For the Years Ended December 31
2012 2011
Revenue
Dividend income $ 6,561,338 $ 4,830,308Interest income 12,336,155 10,979,970Securities lending income 6,894 4,748Foreign exchange gain (loss) (1,006) 4,125Withholding taxes (131,992) (105,059)
18,771,389 15,714,092
Expenses
Custodian fees 279 173Fund accounting expenses 5,674 6,208Unitholder communication costs - 601Audit fees 9,406 9,850Securities filing fees 9,415 6,635Independent review committee fees 225 518Other operating expenses 1,772 2,330
26,771 26,315
Net Investment Income for the Year 18,744,618 15,687,777
Gain on Investments
Net realized gain on sale of investments 3,186,341 3,043,650Capital gains distributions received from other funds 5,024,251 2,748,216Transaction costs (Note 2,13) (2,658) (4,005)Net change in unrealized appreciation in value of investments 11,158,765 3,613,549
Net Gain on Investments 19,366,699 9,401,410
Increase in Net Assets from Operations $ 38,111,317 $ 25,089,187
Increase in Net Assets from Operations per Unit $ 1.27 $ 1.01
Statement of Changes in Net Assets — For the Years Ended December 31
2012 2011
Net Assets - Beginning of Year $ 490,210,585 $ 399,023,930
Increase in Net Assets from Operations 38,111,317 25,089,187
Capital Transactions
Proceeds from issue of units 129,649,900 100,742,208Reinvestment of distributions 19,580,924 15,215,353Redemption of units (61,615,306) (34,644,740)
Net capital transactions 87,615,518 81,312,821
Distributions
From net investment income (18,478,488) (15,215,353)From capital gains (1,102,436) -
Total distributions (19,580,924) (15,215,353)
Increase in Net Assets for the Year 106,145,911 91,186,655
Net Assets - End of Year $ 596,356,496 $ 490,210,585
The accompanying notes are an integral part of the financial statements. 207

BlackRock Balanced Conservative Index DC Fund
Statement of Investment Portfolio — As at December 31, 2012
Security Holdings
Average
cost
Fair
value
(in $000s) (in $000s)
Canadian Equity Index
Equivalents — 12.6%
BlackRock Canadian Equity IndexClass D 2,512,323 56,749 59,945
iShares S&P/TSX Capped REITIndex Fund 876,226 10,187 15,001
Total Canadian Equity Index
Equivalents 66,936 74,946
Canadian Fixed Income Index
Equivalents — 59.6%
BlackRock Canada Real ReturnBond Index Class D 5,702,332 78,721 89,262
BlackRock Canada Universe BondIndex Class D 11,311,020 262,153 266,330
Total Canadian Fixed Income
Index Equivalents 340,874 355,592
Foreign Index Equivalents — 27.7%
BlackRock CDN MSCI EAFEEquity Index Class D 5,756,487 55,170 58,276
BlackRock CDN US Equity IndexClass D 8,310,748 61,922 71,591
iShares Dow Jones U.S. RealEstate Index Fund 225,533 11,734 14,540
iShares MSCI Emerging MarketsIndex Fund 476,015 20,012 21,068
Total Foreign Index Equivalents 148,838 165,475
Transaction Costs (Note 2) (3)
Total Investments 556,645 596,013
Other Assets and Liabilities — 0.1% 343
Net Assets 596,356
Portfolio Concentration
(as a percentage of Net Assets)
Portfolio by Category
As at
December 31, 2012
As at
December 31, 2011
(%) (%)
Canadian Equity IndexEquivalents 12.6 12.6
Canadian Fixed IncomeIndex Equivalents 59.6 59.9
Foreign Index Equivalents 27.7 27.3Other Assets and Liabilities 0.1 0.2
The accompanying notes are an integral part of the financial statements. 208

BlackRock Balanced Aggressive Index DC Fund
Statement of Net Assets — As at December 31
2012 2011
Assets
Investments - at fair value (Note 2) $ 267,069,595 $ 223,745,144Cash 514,185 424,313Securities lending income receivable 84 487Dividends receivable 28,414 21,825Accounts receivable from issue of units 128,806 46,187
267,741,084 224,237,956
Liabilities
Operating expenses payable 11,541 11,901Payables for redemption of units 70,741 60,838Payables for investment purchases 95,544 -
177,826 72,739
Net Assets $ 267,563,258 $ 224,165,217
Number of Units Issued and Outstanding (Note 8) 13,509,000 12,456,344
Net Assets per Unit $ 19.81 $ 18.00
Investments at Cost $ 246,755,723 $ 218,085,097
Approved by BlackRock Asset Management Canada Limited,Manager of the Funds
Eric Léveillé, Director Noel Archard, Director
The accompanying notes are an integral part of the financial statements. 209

BlackRock Balanced Aggressive Index DC Fund
Statement of Operations — For the Years Ended December 31
2012 2011
Revenue
Dividend income $ 5,525,898 $ 4,443,530Interest income 1,751,024 1,776,196Securities lending income 2,810 1,784Foreign exchange loss (1,877) (380)Withholding taxes (74,322) (68,819)
7,203,533 6,152,311
Expenses
Custodian fees 285 218Fund accounting expenses 5,685 6,208Unitholder communication costs - 601Audit fees 9,277 9,683Securities filing fees 4,090 3,234Independent review committee fees 104 245Other operating expenses 1,097 1,985
20,538 22,174
Net Investment Income for the Year 7,182,995 6,130,137
Gain (Loss) on Investments
Net realized gain on sale of investments 771,830 930,743Capital gains distributions received from other funds 740,223 424,952Transaction costs (Note 2,13) (1,271) (1,757)Net change in unrealized appreciation (depreciation) in value of investments 14,653,825 (11,106,811)
Net Gain (Loss) on Investments 16,164,607 (9,752,873)
Increase (Decrease) in Net Assets from Operations $ 23,347,602 $ (3,622,736)
Increase (Decrease) in Net Assets from Operations per Unit $ 1.82 $ (0.31)
Statement of Changes in Net Assets — For the Years Ended December 31
2012 2011
Net Assets - Beginning of Year $ 224,165,217 $ 206,416,389
Increase (Decrease) in Net Assets from Operations 23,347,602 (3,622,736)
Capital Transactions
Proceeds from issue of units 41,660,456 38,616,497Reinvestment of distributions 7,068,899 5,899,103Redemption of units (21,610,017) (17,244,933)
Net capital transactions 27,119,338 27,270,667
Distributions
From net investment income (7,068,899) (5,899,103)
Total distributions (7,068,899) (5,899,103)
Increase in Net Assets for the Year 43,398,041 17,748,828
Net Assets - End of Year $ 267,563,258 $ 224,165,217
The accompanying notes are an integral part of the financial statements. 210
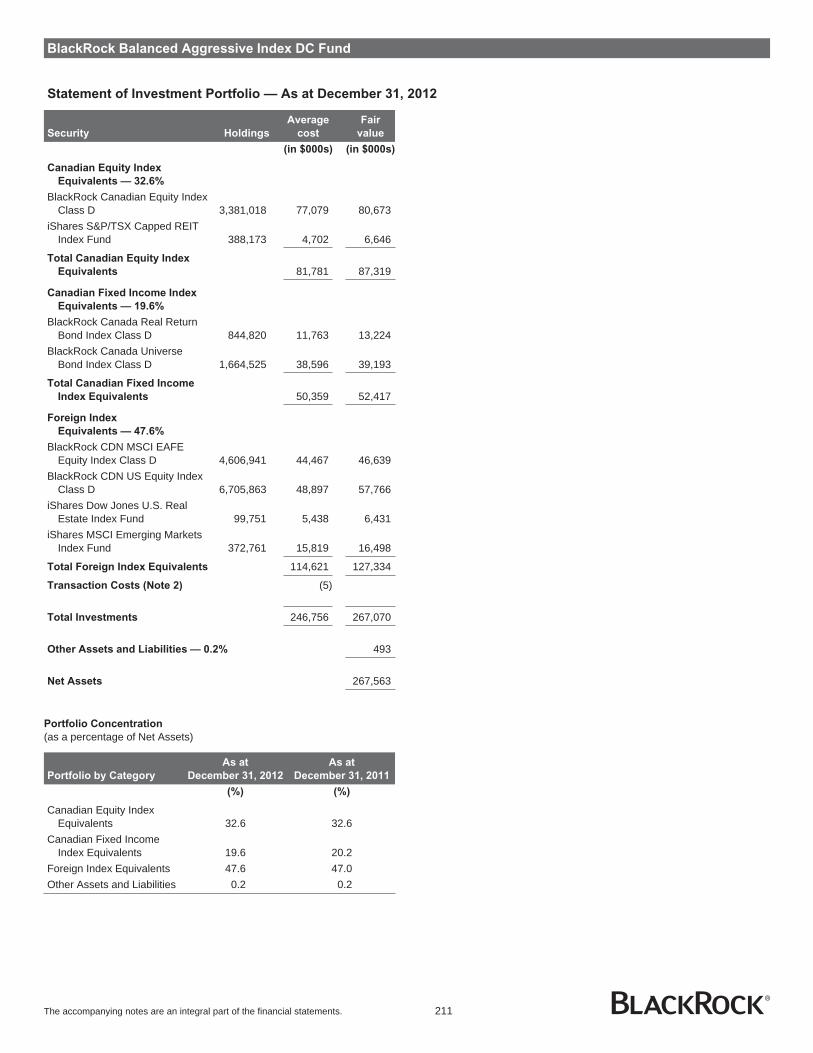
BlackRock Balanced Aggressive Index DC Fund
Statement of Investment Portfolio — As at December 31, 2012
Security Holdings
Average
cost
Fair
value
(in $000s) (in $000s)
Canadian Equity Index
Equivalents — 32.6%
BlackRock Canadian Equity IndexClass D 3,381,018 77,079 80,673
iShares S&P/TSX Capped REITIndex Fund 388,173 4,702 6,646
Total Canadian Equity Index
Equivalents 81,781 87,319
Canadian Fixed Income Index
Equivalents — 19.6%
BlackRock Canada Real ReturnBond Index Class D 844,820 11,763 13,224
BlackRock Canada UniverseBond Index Class D 1,664,525 38,596 39,193
Total Canadian Fixed Income
Index Equivalents 50,359 52,417
Foreign Index
Equivalents — 47.6%
BlackRock CDN MSCI EAFEEquity Index Class D 4,606,941 44,467 46,639
BlackRock CDN US Equity IndexClass D 6,705,863 48,897 57,766
iShares Dow Jones U.S. RealEstate Index Fund 99,751 5,438 6,431
iShares MSCI Emerging MarketsIndex Fund 372,761 15,819 16,498
Total Foreign Index Equivalents 114,621 127,334
Transaction Costs (Note 2) (5)
Total Investments 246,756 267,070
Other Assets and Liabilities — 0.2% 493
Net Assets 267,563
Portfolio Concentration
(as a percentage of Net Assets)
Portfolio by Category
As at
December 31, 2012
As at
December 31, 2011
(%) (%)
Canadian Equity IndexEquivalents 32.6 32.6
Canadian Fixed IncomeIndex Equivalents 19.6 20.2
Foreign Index Equivalents 47.6 47.0Other Assets and Liabilities 0.2 0.2
The accompanying notes are an integral part of the financial statements. 211
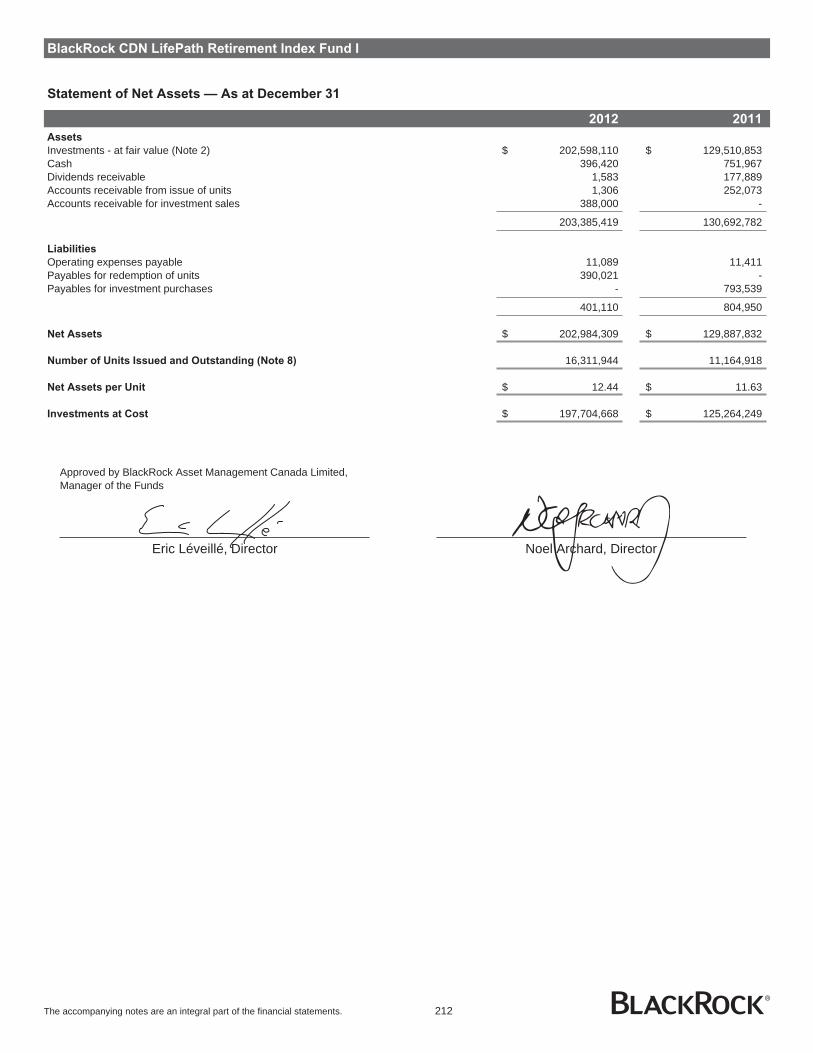
BlackRock CDN LifePath Retirement Index Fund I
Statement of Net Assets — As at December 31
2012 2011
Assets
Investments - at fair value (Note 2) $ 202,598,110 $ 129,510,853Cash 396,420 751,967Dividends receivable 1,583 177,889Accounts receivable from issue of units 1,306 252,073Accounts receivable for investment sales 388,000 -
203,385,419 130,692,782
Liabilities
Operating expenses payable 11,089 11,411Payables for redemption of units 390,021 -Payables for investment purchases - 793,539
401,110 804,950
Net Assets $ 202,984,309 $ 129,887,832
Number of Units Issued and Outstanding (Note 8) 16,311,944 11,164,918
Net Assets per Unit $ 12.44 $ 11.63
Investments at Cost $ 197,704,668 $ 125,264,249
Approved by BlackRock Asset Management Canada Limited,Manager of the Funds
Eric Léveillé, Director Noel Archard, Director
The accompanying notes are an integral part of the financial statements. 212
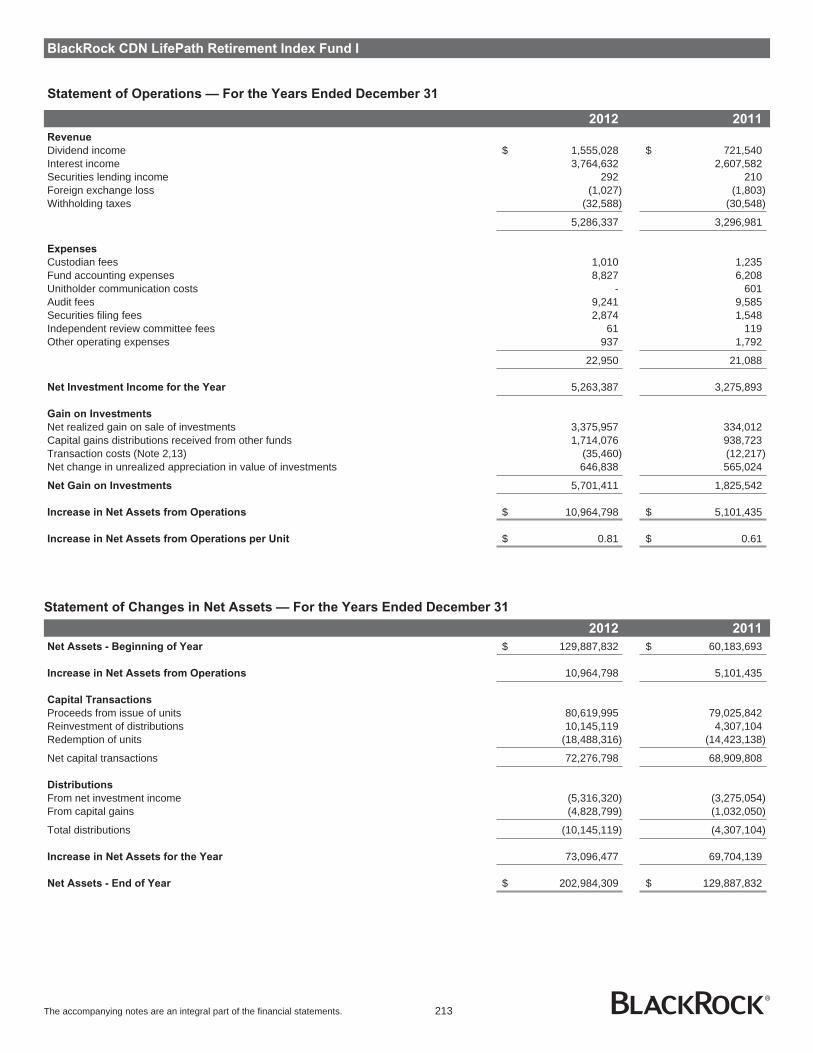
BlackRock CDN LifePath Retirement Index Fund I
Statement of Operations — For the Years Ended December 31
2012 2011
Revenue
Dividend income $ 1,555,028 $ 721,540Interest income 3,764,632 2,607,582Securities lending income 292 210Foreign exchange loss (1,027) (1,803)Withholding taxes (32,588) (30,548)
5,286,337 3,296,981
Expenses
Custodian fees 1,010 1,235Fund accounting expenses 8,827 6,208Unitholder communication costs - 601Audit fees 9,241 9,585Securities filing fees 2,874 1,548Independent review committee fees 61 119Other operating expenses 937 1,792
22,950 21,088
Net Investment Income for the Year 5,263,387 3,275,893
Gain on Investments
Net realized gain on sale of investments 3,375,957 334,012Capital gains distributions received from other funds 1,714,076 938,723Transaction costs (Note 2,13) (35,460) (12,217)Net change in unrealized appreciation in value of investments 646,838 565,024
Net Gain on Investments 5,701,411 1,825,542
Increase in Net Assets from Operations $ 10,964,798 $ 5,101,435
Increase in Net Assets from Operations per Unit $ 0.81 $ 0.61
Statement of Changes in Net Assets — For the Years Ended December 31
2012 2011
Net Assets - Beginning of Year $ 129,887,832 $ 60,183,693
Increase in Net Assets from Operations 10,964,798 5,101,435
Capital Transactions
Proceeds from issue of units 80,619,995 79,025,842Reinvestment of distributions 10,145,119 4,307,104Redemption of units (18,488,316) (14,423,138)
Net capital transactions 72,276,798 68,909,808
Distributions
From net investment income (5,316,320) (3,275,054)From capital gains (4,828,799) (1,032,050)
Total distributions (10,145,119) (4,307,104)
Increase in Net Assets for the Year 73,096,477 69,704,139
Net Assets - End of Year $ 202,984,309 $ 129,887,832
The accompanying notes are an integral part of the financial statements. 213

BlackRock CDN LifePath Retirement Index Fund I
Statement of Investment Portfolio — As at December 31, 2012
Security Holdings
Average
cost
Fair
value
(in $000s) (in $000s)
Canadian Equity Index
Equivalents — 13.9%
BlackRock Canadian Equity IndexClass D 638,110 14,969 15,226
BlackRock CDN Global DevelopedReal Estate Index Class D 962,428 9,706 10,255
BlackRock CDN GlobalInfrastructure Equity IndexClass D 261,106 2,647 2,733
Total Canadian Equity Index
Equivalents 27,322 28,214
Canadian Fixed Income Index
Equivalents — 59.5%
BlackRock Canada Real ReturnBond Index Class D 1,870,348 27,552 29,278
BlackRock Canada Universe BondIndex Class D 3,887,012 91,283 91,524
Total Canadian Fixed Income
Index Equivalents 118,835 120,802
Foreign Index
Equivalents — 26.4%
BlackRock CDN MSCI EAFE EquityIndex Class D 1,609,422 15,413 16,293
BlackRock CDN US Equity IndexClass D 2,262,444 19,061 19,489
iShares GSCI Commodity Trust 318,310 10,303 10,361iShares MSCI Emerging Markets
Index Fund 131,378 5,372 5,814iShares Russell 2000 Index Fund 19,333 1,420 1,625
Total Foreign Index Equivalents 51,569 53,582
Transaction Costs (Note 2) (21)
Total Investments 197,705 202,598
Other Assets and Liabilities — 0.2% 386
Net Assets 202,984
Portfolio Concentration
(as a percentage of Net Assets)
Portfolio by Category
As at
December 31, 2012
As at
December 31, 2011
(%) (%)
Canadian Equity IndexEquivalents 13.9 10.6
Canadian Fixed IncomeIndex Equivalents 59.5 59.9
Foreign IndexEquivalents 26.4 29.2
Other Assets andLiabilities 0.2 0.3
The accompanying notes are an integral part of the financial statements. 214
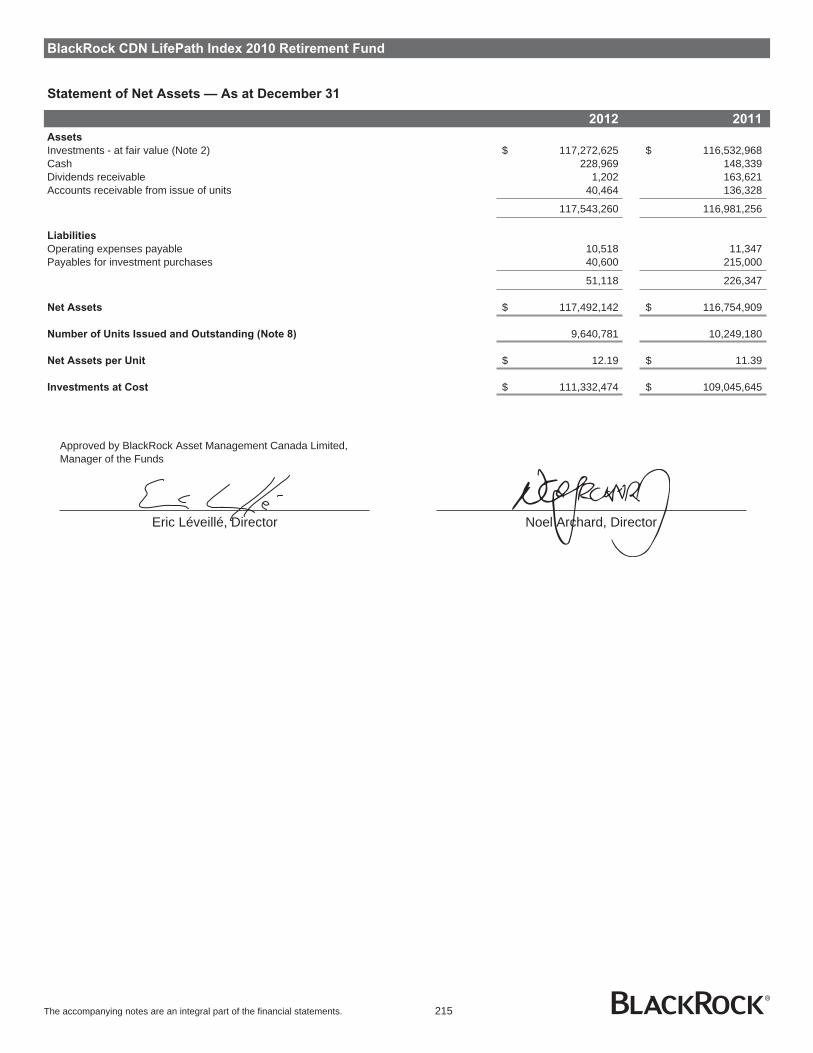
BlackRock CDN LifePath Index 2010 Retirement Fund
Statement of Net Assets — As at December 31
2012 2011
Assets
Investments - at fair value (Note 2) $ 117,272,625 $ 116,532,968Cash 228,969 148,339Dividends receivable 1,202 163,621Accounts receivable from issue of units 40,464 136,328
117,543,260 116,981,256
Liabilities
Operating expenses payable 10,518 11,347Payables for investment purchases 40,600 215,000
51,118 226,347
Net Assets $ 117,492,142 $ 116,754,909
Number of Units Issued and Outstanding (Note 8) 9,640,781 10,249,180
Net Assets per Unit $ 12.19 $ 11.39
Investments at Cost $ 111,332,474 $ 109,045,645
Approved by BlackRock Asset Management Canada Limited,Manager of the Funds
Eric Léveillé, Director Noel Archard, Director
The accompanying notes are an integral part of the financial statements. 215
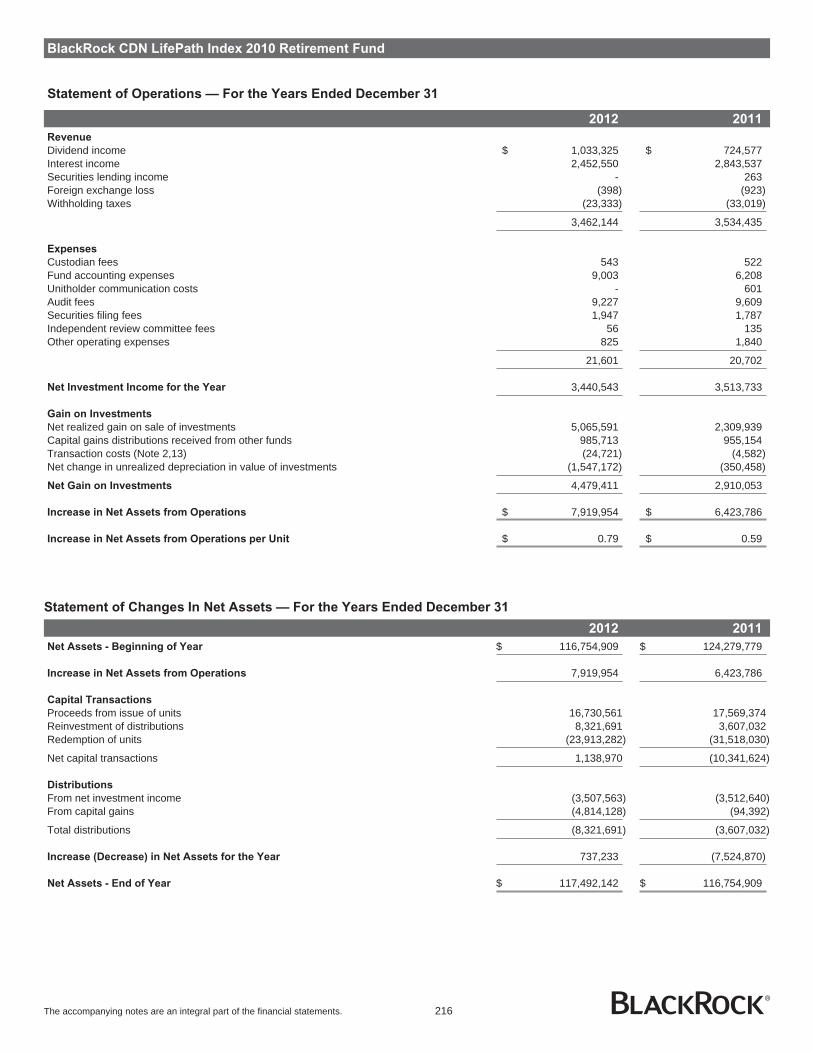
BlackRock CDN LifePath Index 2010 Retirement Fund
Statement of Operations — For the Years Ended December 31
2012 2011
Revenue
Dividend income $ 1,033,325 $ 724,577Interest income 2,452,550 2,843,537Securities lending income - 263Foreign exchange loss (398) (923)Withholding taxes (23,333) (33,019)
3,462,144 3,534,435
Expenses
Custodian fees 543 522Fund accounting expenses 9,003 6,208Unitholder communication costs - 601Audit fees 9,227 9,609Securities filing fees 1,947 1,787Independent review committee fees 56 135Other operating expenses 825 1,840
21,601 20,702
Net Investment Income for the Year 3,440,543 3,513,733
Gain on Investments
Net realized gain on sale of investments 5,065,591 2,309,939Capital gains distributions received from other funds 985,713 955,154Transaction costs (Note 2,13) (24,721) (4,582)Net change in unrealized depreciation in value of investments (1,547,172) (350,458)
Net Gain on Investments 4,479,411 2,910,053
Increase in Net Assets from Operations $ 7,919,954 $ 6,423,786
Increase in Net Assets from Operations per Unit $ 0.79 $ 0.59
Statement of Changes In Net Assets — For the Years Ended December 31
2012 2011
Net Assets - Beginning of Year $ 116,754,909 $ 124,279,779
Increase in Net Assets from Operations 7,919,954 6,423,786
Capital Transactions
Proceeds from issue of units 16,730,561 17,569,374Reinvestment of distributions 8,321,691 3,607,032Redemption of units (23,913,282) (31,518,030)
Net capital transactions 1,138,970 (10,341,624)
Distributions
From net investment income (3,507,563) (3,512,640)From capital gains (4,814,128) (94,392)
Total distributions (8,321,691) (3,607,032)
Increase (Decrease) in Net Assets for the Year 737,233 (7,524,870)
Net Assets - End of Year $ 117,492,142 $ 116,754,909
The accompanying notes are an integral part of the financial statements. 216
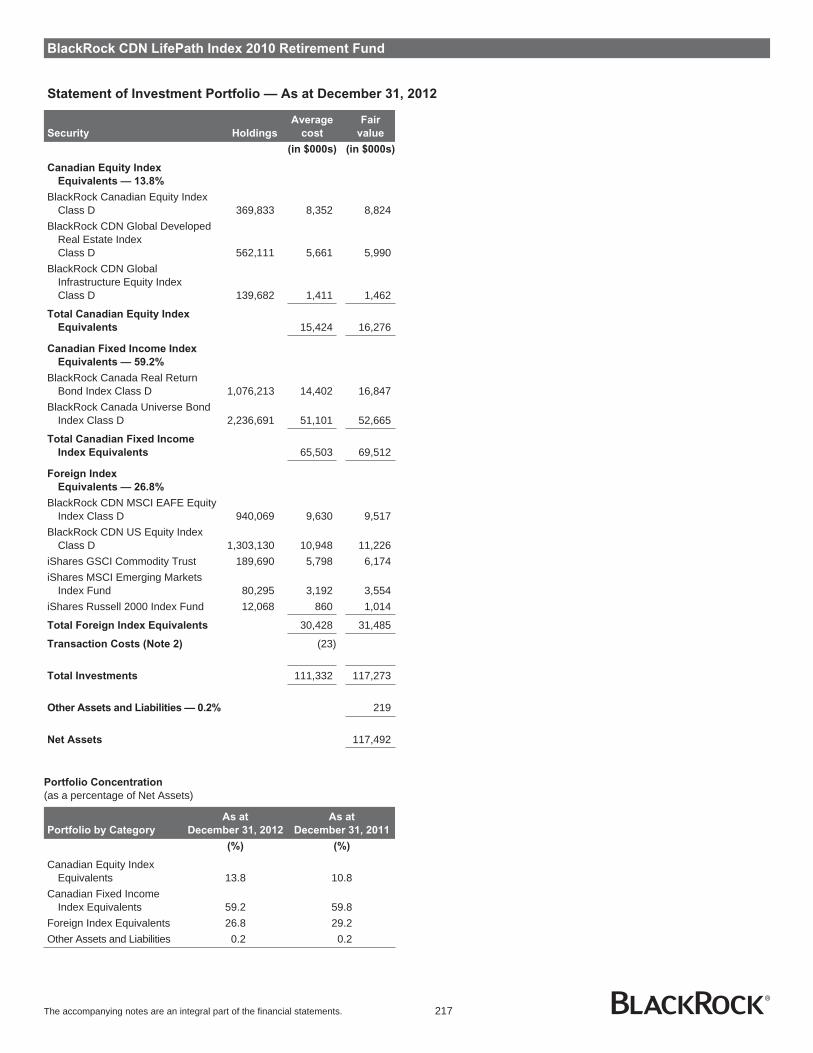
BlackRock CDN LifePath Index 2010 Retirement Fund
Statement of Investment Portfolio — As at December 31, 2012
Security Holdings
Average
cost
Fair
value
(in $000s) (in $000s)
Canadian Equity Index
Equivalents — 13.8%
BlackRock Canadian Equity IndexClass D 369,833 8,352 8,824
BlackRock CDN Global DevelopedReal Estate IndexClass D 562,111 5,661 5,990
BlackRock CDN GlobalInfrastructure Equity IndexClass D 139,682 1,411 1,462
Total Canadian Equity Index
Equivalents 15,424 16,276
Canadian Fixed Income Index
Equivalents — 59.2%
BlackRock Canada Real ReturnBond Index Class D 1,076,213 14,402 16,847
BlackRock Canada Universe BondIndex Class D 2,236,691 51,101 52,665
Total Canadian Fixed Income
Index Equivalents 65,503 69,512
Foreign Index
Equivalents — 26.8%
BlackRock CDN MSCI EAFE EquityIndex Class D 940,069 9,630 9,517
BlackRock CDN US Equity IndexClass D 1,303,130 10,948 11,226
iShares GSCI Commodity Trust 189,690 5,798 6,174iShares MSCI Emerging Markets
Index Fund 80,295 3,192 3,554iShares Russell 2000 Index Fund 12,068 860 1,014
Total Foreign Index Equivalents 30,428 31,485
Transaction Costs (Note 2) (23)
Total Investments 111,332 117,273
Other Assets and Liabilities — 0.2% 219
Net Assets 117,492
Portfolio Concentration
(as a percentage of Net Assets)
Portfolio by Category
As at
December 31, 2012
As at
December 31, 2011
(%) (%)
Canadian Equity IndexEquivalents 13.8 10.8
Canadian Fixed IncomeIndex Equivalents 59.2 59.8
Foreign Index Equivalents 26.8 29.2Other Assets and Liabilities 0.2 0.2
The accompanying notes are an integral part of the financial statements. 217

BlackRock CDN LifePath 2015 Index Fund
Statement of Net Assets — As at December 31
2012 2011
Assets
Investments - at fair value (Note 2) $ 515,711,235 $ 360,073,692Cash 1,002,947 2,177,953Dividends receivable 4,804 520,430Accounts receivable from issue of units 662,664 232,697Accounts receivable for investment sales 4,880,000 1,250,000
522,261,650 364,254,772
Liabilities
Operating expenses payable 13,362 12,611Payables for redemption of units 90,230 -Payables for investment purchases 5,454,058 3,459,619
5,557,650 3,472,230
Net Assets $ 516,704,000 $ 360,782,542
Number of Units Issued and Outstanding (Note 8) 43,480,529 32,731,212
Net Assets per Unit $ 11.88 $ 11.02
Investments at Cost $ 496,739,495 $ 343,106,376
Approved by BlackRock Asset Management Canada Limited,Manager of the Funds
Eric Léveillé, Director Noel Archard, Director
The accompanying notes are an integral part of the financial statements. 218

BlackRock CDN LifePath 2015 Index Fund
Statement of Operations — For the Years Ended December 31
2012 2011
Revenue
Dividend income $ 5,140,076 $ 3,036,206Interest income 8,220,971 6,212,251Securities lending income 1,345 746Foreign exchange loss (4,285) (1,785)Withholding taxes (109,278) (127,540)
13,248,829 9,119,878
Expenses
Custodian fees 1,207 1,381Fund accounting expenses 8,789 6,208Unitholder communication costs - 601Audit fees 9,346 9,737Securities filing fees 7,426 4,539Independent review committee fees 159 350Other operating expenses 1,513 2,085
28,440 24,901
Net Investment Income for the Year 13,220,389 9,094,977
Gain on Investments
Net realized gain on sale of investments 13,127,659 773,095Capital gains distributions received from other funds 3,746,794 2,393,168Transaction costs (Note 2,13) (94,659) (28,015)Net change in unrealized appreciation (depreciation) in value of investments 2,004,424 (2,232,662)
Net Gain on Investments 18,784,218 905,586
Increase in Net Assets from Operations $ 32,004,607 $ 10,000,563
Increase in Net Assets from Operations per Unit $ 0.86 $ 0.38
Statement of Changes in Net Assets — For the Years Ended December 31
2012 2011
Net Assets - Beginning of Year $ 360,782,542 $ 206,173,801
Increase in Net Assets from Operations 32,004,607 10,000,563
Capital Transactions
Proceeds from issue of units 153,968,245 163,922,444Reinvestment of distributions 29,452,938 12,378,896Redemption of units (30,051,394) (19,314,266)
Net capital transactions 153,369,789 156,987,074
Distributions
From net investment income (13,367,526) (9,093,752)From capital gains (16,085,412) (3,285,144)
Total distributions (29,452,938) (12,378,896)
Increase in Net Assets for the Year 155,921,458 154,608,741
Net Assets - End of Year $ 516,704,000 $ 360,782,542
The accompanying notes are an integral part of the financial statements. 219
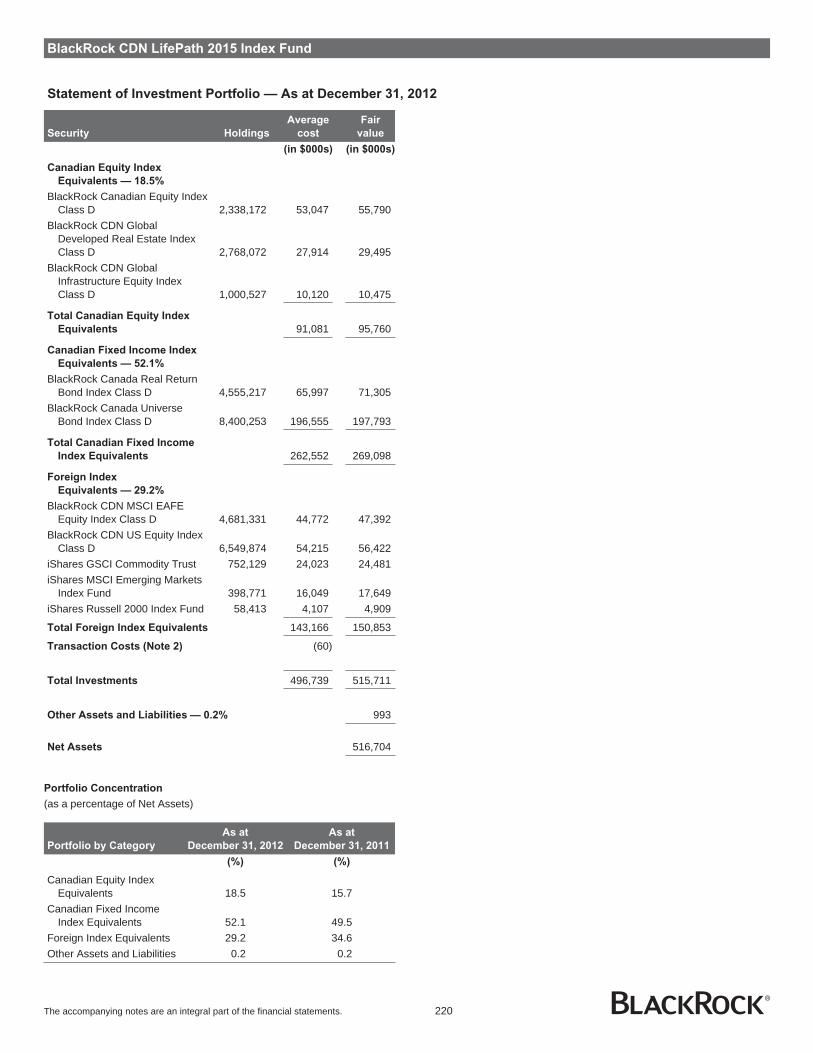
BlackRock CDN LifePath 2015 Index Fund
Statement of Investment Portfolio — As at December 31, 2012
Security Holdings
Average
cost
Fair
value
(in $000s) (in $000s)
Canadian Equity Index
Equivalents — 18.5%
BlackRock Canadian Equity IndexClass D 2,338,172 53,047 55,790
BlackRock CDN GlobalDeveloped Real Estate IndexClass D 2,768,072 27,914 29,495
BlackRock CDN GlobalInfrastructure Equity IndexClass D 1,000,527 10,120 10,475
Total Canadian Equity Index
Equivalents 91,081 95,760
Canadian Fixed Income Index
Equivalents — 52.1%
BlackRock Canada Real ReturnBond Index Class D 4,555,217 65,997 71,305
BlackRock Canada UniverseBond Index Class D 8,400,253 196,555 197,793
Total Canadian Fixed Income
Index Equivalents 262,552 269,098
Foreign Index
Equivalents — 29.2%
BlackRock CDN MSCI EAFEEquity Index Class D 4,681,331 44,772 47,392
BlackRock CDN US Equity IndexClass D 6,549,874 54,215 56,422
iShares GSCI Commodity Trust 752,129 24,023 24,481iShares MSCI Emerging Markets
Index Fund 398,771 16,049 17,649iShares Russell 2000 Index Fund 58,413 4,107 4,909
Total Foreign Index Equivalents 143,166 150,853
Transaction Costs (Note 2) (60)
Total Investments 496,739 515,711
Other Assets and Liabilities — 0.2% 993
Net Assets 516,704
Portfolio Concentration
(as a percentage of Net Assets)
Portfolio by Category
As at
December 31, 2012
As at
December 31, 2011
(%) (%)
Canadian Equity IndexEquivalents 18.5 15.7
Canadian Fixed IncomeIndex Equivalents 52.1 49.5
Foreign Index Equivalents 29.2 34.6Other Assets and Liabilities 0.2 0.2
The accompanying notes are an integral part of the financial statements. 220
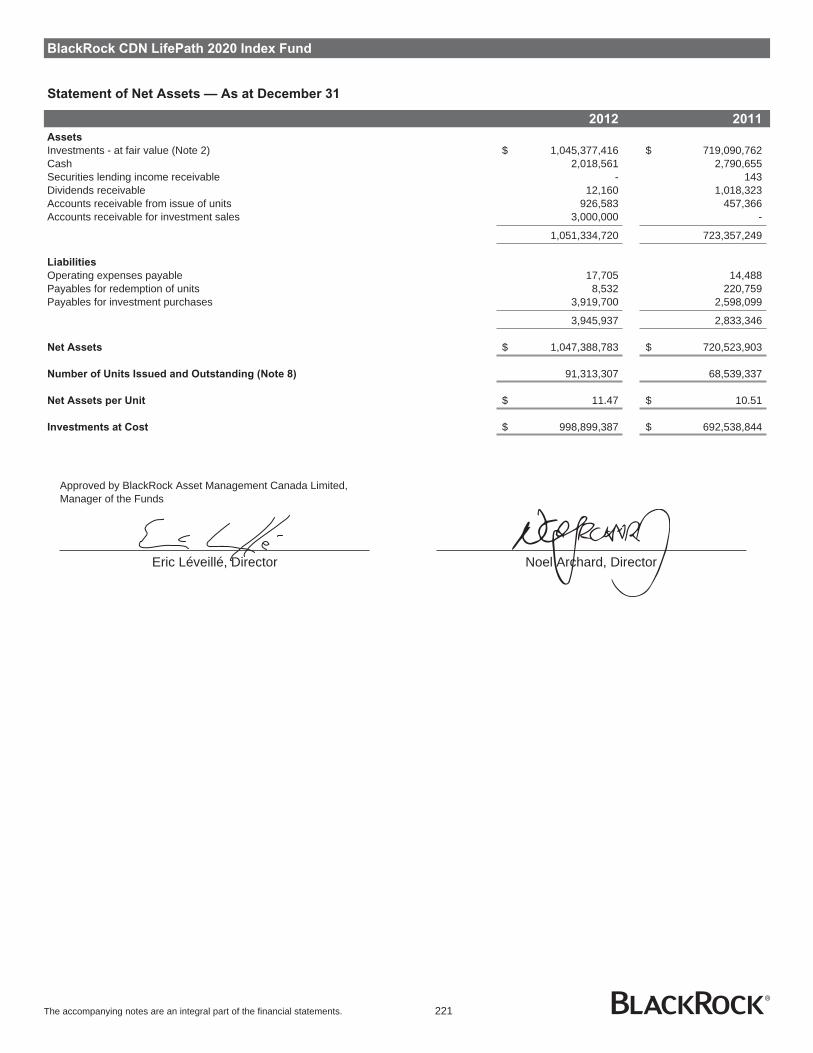
BlackRock CDN LifePath 2020 Index Fund
Statement of Net Assets — As at December 31
2012 2011
Assets
Investments - at fair value (Note 2) $ 1,045,377,416 $ 719,090,762Cash 2,018,561 2,790,655Securities lending income receivable - 143Dividends receivable 12,160 1,018,323Accounts receivable from issue of units 926,583 457,366Accounts receivable for investment sales 3,000,000 -
1,051,334,720 723,357,249
Liabilities
Operating expenses payable 17,705 14,488Payables for redemption of units 8,532 220,759Payables for investment purchases 3,919,700 2,598,099
3,945,937 2,833,346
Net Assets $ 1,047,388,783 $ 720,523,903
Number of Units Issued and Outstanding (Note 8) 91,313,307 68,539,337
Net Assets per Unit $ 11.47 $ 10.51
Investments at Cost $ 998,899,387 $ 692,538,844
Approved by BlackRock Asset Management Canada Limited,Manager of the Funds
Eric Léveillé, Director Noel Archard, Director
The accompanying notes are an integral part of the financial statements. 221
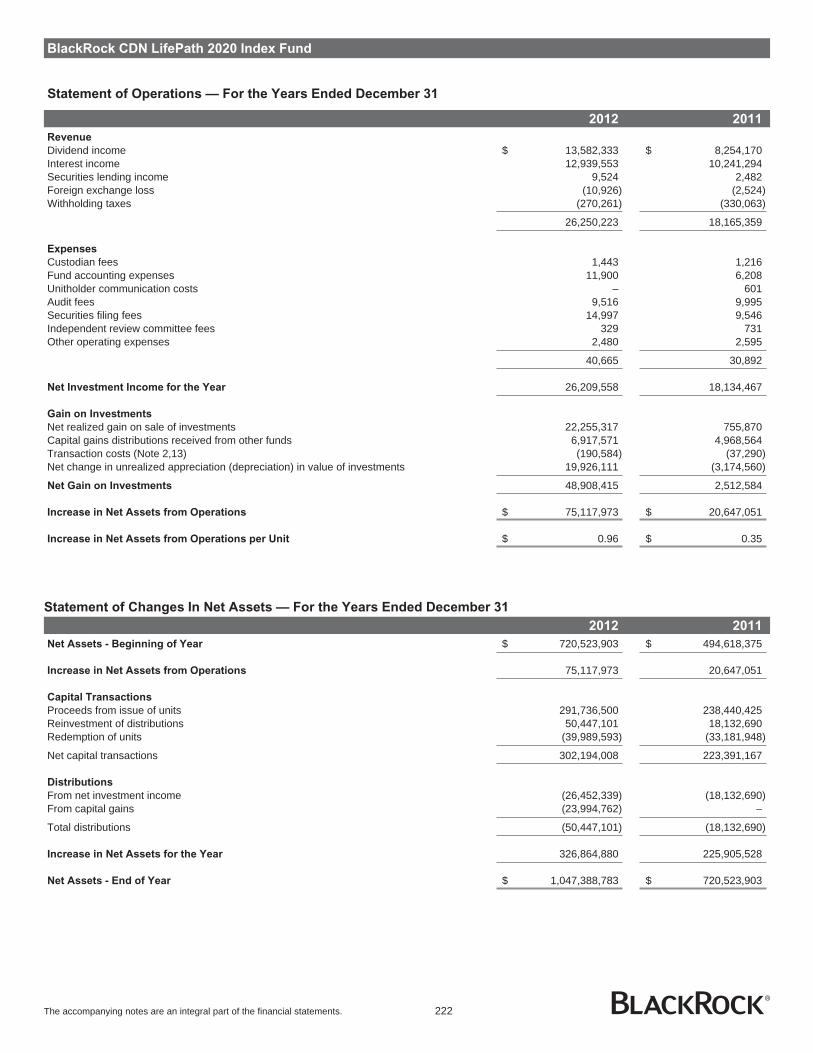
BlackRock CDN LifePath 2020 Index Fund
Statement of Operations — For the Years Ended December 31
2012 2011
Revenue
Dividend income $ 13,582,333 $ 8,254,170Interest income 12,939,553 10,241,294Securities lending income 9,524 2,482Foreign exchange loss (10,926) (2,524)Withholding taxes (270,261) (330,063)
26,250,223 18,165,359
Expenses
Custodian fees 1,443 1,216Fund accounting expenses 11,900 6,208Unitholder communication costs – 601Audit fees 9,516 9,995Securities filing fees 14,997 9,546Independent review committee fees 329 731Other operating expenses 2,480 2,595
40,665 30,892
Net Investment Income for the Year 26,209,558 18,134,467
Gain on Investments
Net realized gain on sale of investments 22,255,317 755,870Capital gains distributions received from other funds 6,917,571 4,968,564Transaction costs (Note 2,13) (190,584) (37,290)Net change in unrealized appreciation (depreciation) in value of investments 19,926,111 (3,174,560)
Net Gain on Investments 48,908,415 2,512,584
Increase in Net Assets from Operations $ 75,117,973 $ 20,647,051
Increase in Net Assets from Operations per Unit $ 0.96 $ 0.35
Statement of Changes In Net Assets — For the Years Ended December 31
2012 2011
Net Assets - Beginning of Year $ 720,523,903 $ 494,618,375
Increase in Net Assets from Operations 75,117,973 20,647,051
Capital Transactions
Proceeds from issue of units 291,736,500 238,440,425Reinvestment of distributions 50,447,101 18,132,690Redemption of units (39,989,593) (33,181,948)
Net capital transactions 302,194,008 223,391,167
Distributions
From net investment income (26,452,339) (18,132,690)From capital gains (23,994,762) –
Total distributions (50,447,101) (18,132,690)
Increase in Net Assets for the Year 326,864,880 225,905,528
Net Assets - End of Year $ 1,047,388,783 $ 720,523,903
The accompanying notes are an integral part of the financial statements. 222
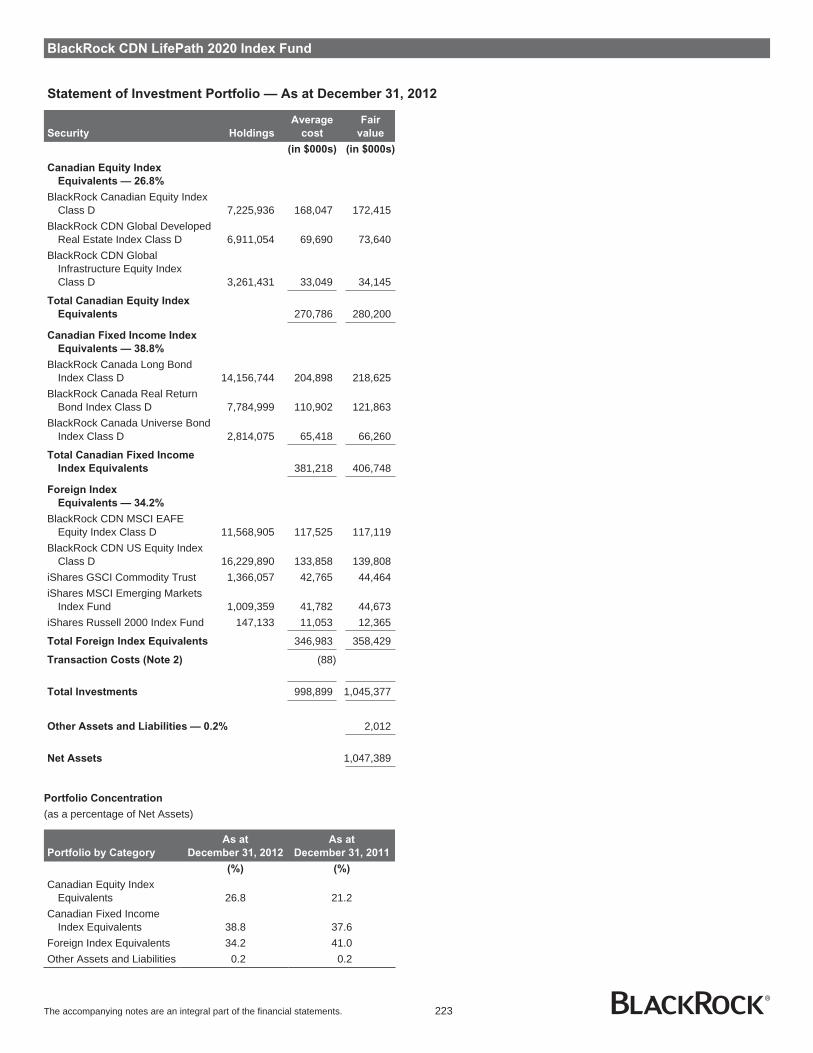
BlackRock CDN LifePath 2020 Index Fund
Statement of Investment Portfolio — As at December 31, 2012
Security Holdings
Average
cost
Fair
value
(in $000s) (in $000s)
Canadian Equity Index
Equivalents — 26.8%
BlackRock Canadian Equity IndexClass D 7,225,936 168,047 172,415
BlackRock CDN Global DevelopedReal Estate Index Class D 6,911,054 69,690 73,640
BlackRock CDN GlobalInfrastructure Equity IndexClass D 3,261,431 33,049 34,145
Total Canadian Equity Index
Equivalents 270,786 280,200
Canadian Fixed Income Index
Equivalents — 38.8%
BlackRock Canada Long BondIndex Class D 14,156,744 204,898 218,625
BlackRock Canada Real ReturnBond Index Class D 7,784,999 110,902 121,863
BlackRock Canada Universe BondIndex Class D 2,814,075 65,418 66,260
Total Canadian Fixed Income
Index Equivalents 381,218 406,748
Foreign Index
Equivalents — 34.2%
BlackRock CDN MSCI EAFEEquity Index Class D 11,568,905 117,525 117,119
BlackRock CDN US Equity IndexClass D 16,229,890 133,858 139,808
iShares GSCI Commodity Trust 1,366,057 42,765 44,464iShares MSCI Emerging Markets
Index Fund 1,009,359 41,782 44,673iShares Russell 2000 Index Fund 147,133 11,053 12,365
Total Foreign Index Equivalents 346,983 358,429
Transaction Costs (Note 2) (88)
Total Investments 998,899 1,045,377
Other Assets and Liabilities — 0.2% 2,012
Net Assets 1,047,389
Portfolio Concentration
(as a percentage of Net Assets)
Portfolio by Category
As at
December 31, 2012
As at
December 31, 2011
(%) (%)
Canadian Equity IndexEquivalents 26.8 21.2
Canadian Fixed IncomeIndex Equivalents 38.8 37.6
Foreign Index Equivalents 34.2 41.0Other Assets and Liabilities 0.2 0.2
The accompanying notes are an integral part of the financial statements. 223

BlackRock CDN LifePath 2025 Index Fund
Statement of Net Assets — As at December 31
2012 2011
Assets
Investments - at fair value (Note 2) $ 809,855,894 $ 471,902,344Cash 1,557,506 4,500,660Securities lending income receivable - 43Dividends receivable 10,394 611,131Accounts receivable from issue of units 783,851 1,265,720Accounts receivable for investment sales 4,000,000 -
816,207,645 478,279,898
Liabilities
Operating expenses payable 15,406 13,178Payables for investment purchases 4,787,746 5,549,004
4,803,152 5,562,182
Net Assets $ 811,404,493 $ 472,717,716
Number of Units Issued and Outstanding (Note 8) 71,753,741 45,967,392
Net Assets per Unit $ 11.31 $ 10.28
Investments at Cost $ 771,374,929 $ 451,798,769
Approved by BlackRock Asset Management Canada Limited,Manager of the Funds
Eric Léveillé, Director Noel Archard, Director
The accompanying notes are an integral part of the financial statements. 224

BlackRock CDN LifePath 2025 Index Fund
Statement of Operations — For the Years Ended December 31
2012 2011
Revenue
Dividend income $ 11,470,590 $ 6,130,629Interest income 7,852,960 4,941,839Securities lending income 3,659 1,290Foreign exchange loss (12,855) (3,870)Withholding taxes (222,240) (234,063)
19,092,114 10,835,825
Expenses
Custodian fees 1,591 1,757Fund accounting expenses 8,799 6,208Unitholder communication costs - 601Audit fees 9,410 9,793Securities filing fees 11,024 5,808Independent review committee fees 222 450Other operating expenses 1,960 2,203
33,006 26,820
Net Investment Income for the Year 19,059,108 10,809,005
Gain (Loss) on Investments
Net realized gain on sale of investments 16,722,408 462,357Capital gains distributions received from other funds 4,621,524 2,736,935Transaction costs (Note 2,13) (143,104) (36,532)Net change in unrealized appreciation (depreciation) in value of investments 18,377,390 (7,302,880)
Net Gain (Loss) on Investments 39,578,218 (4,140,120)
Increase in Net Assets from Operations $ 58,637,326 $ 6,668,885
Increase in Net Assets from Operations per Unit $ 1.03 $ 0.19
Statement of Changes in Net Assets — For the Years Ended December 31
2012 2011
Net Assets - Beginning of Year $ 472,717,716 $ 256,858,209
Increase in Net Assets from Operations 58,637,326 6,668,885
Capital Transactions
Proceeds from issue of units 316,280,975 218,422,190Reinvestment of distributions 40,023,113 13,760,658Redemption of units (36,231,524) (9,231,568)
Net capital transactions 320,072,564 222,951,280
Distributions
From net investment income (19,135,340) (10,806,093)From capital gains (20,887,773) (2,954,565)
Total distributions (40,023,113) (13,760,658)
Increase in Net Assets for the Year 338,686,777 215,859,507
Net Assets - End of Year $ 811,404,493 $ 472,717,716
The accompanying notes are an integral part of the financial statements. 225
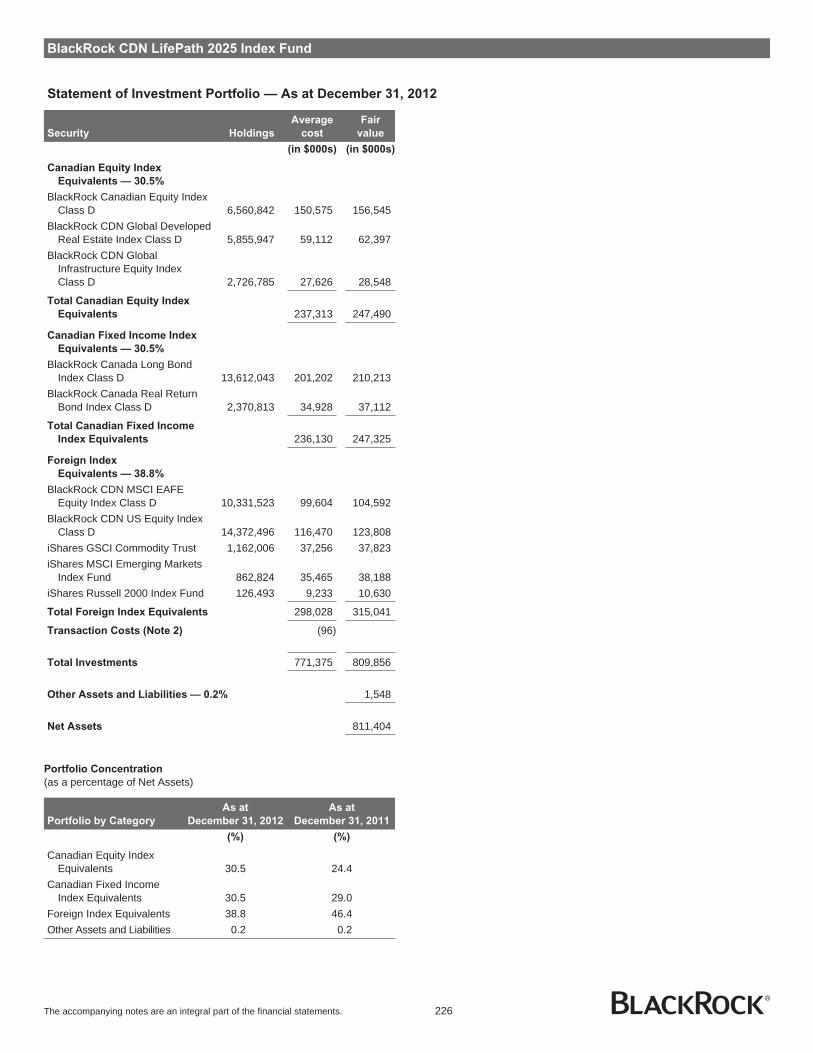
BlackRock CDN LifePath 2025 Index Fund
Statement of Investment Portfolio — As at December 31, 2012
Security Holdings
Average
cost
Fair
value
(in $000s) (in $000s)
Canadian Equity Index
Equivalents — 30.5%
BlackRock Canadian Equity IndexClass D 6,560,842 150,575 156,545
BlackRock CDN Global DevelopedReal Estate Index Class D 5,855,947 59,112 62,397
BlackRock CDN GlobalInfrastructure Equity IndexClass D 2,726,785 27,626 28,548
Total Canadian Equity Index
Equivalents 237,313 247,490
Canadian Fixed Income Index
Equivalents — 30.5%
BlackRock Canada Long BondIndex Class D 13,612,043 201,202 210,213
BlackRock Canada Real ReturnBond Index Class D 2,370,813 34,928 37,112
Total Canadian Fixed Income
Index Equivalents 236,130 247,325
Foreign Index
Equivalents — 38.8%
BlackRock CDN MSCI EAFEEquity Index Class D 10,331,523 99,604 104,592
BlackRock CDN US Equity IndexClass D 14,372,496 116,470 123,808
iShares GSCI Commodity Trust 1,162,006 37,256 37,823iShares MSCI Emerging Markets
Index Fund 862,824 35,465 38,188iShares Russell 2000 Index Fund 126,493 9,233 10,630
Total Foreign Index Equivalents 298,028 315,041
Transaction Costs (Note 2) (96)
Total Investments 771,375 809,856
Other Assets and Liabilities — 0.2% 1,548
Net Assets 811,404
Portfolio Concentration
(as a percentage of Net Assets)
Portfolio by Category
As at
December 31, 2012
As at
December 31, 2011
(%) (%)
Canadian Equity IndexEquivalents 30.5 24.4
Canadian Fixed IncomeIndex Equivalents 30.5 29.0
Foreign Index Equivalents 38.8 46.4Other Assets and Liabilities 0.2 0.2
The accompanying notes are an integral part of the financial statements. 226

BlackRock CDN LifePath 2030 Index Fund
Statement of Net Assets — As at December 31
2012 2011
Assets
Investments - at fair value (Note 2) $ 809,263,109 $ 514,229,972Cash 1,547,738 2,876,728Securities lending income receivable - 706Dividends receivable 11,380 580,178Accounts receivable from issue of units 1,109,314 1,070,845Accounts receivable for investment sales 3,950,000 2,250,000
815,881,541 521,008,429
Liabilities
Operating expenses payable 15,402 13,395Payables for redemption of units 9,713 -Payables for investment purchases 5,055,392 5,730,440
5,080,507 5,743,835
Net Assets $ 810,801,034 $ 515,264,594
Number of Units Issued and Outstanding (Note 8) 75,451,453 53,010,297
Net Assets per Unit $ 10.75 $ 9.72
Investments at Cost $ 779,142,079 $ 510,456,160
Approved by BlackRock Asset Management Canada Limited,Manager of the Funds
Eric Léveillé, Director Noel Archard, Director
The accompanying notes are an integral part of the financial statements. 227

BlackRock CDN LifePath 2030 Index Fund
Statement of Operations — For the Years Ended December 31
2012 2011
Revenue
Dividend income $ 13,601,201 $ 8,236,095Interest income 5,857,483 3,773,098Securities lending income 730 2,469Foreign exchange loss (9,813) (4,211)Withholding taxes (253,023) (305,427)
19,196,578 11,702,024
Expenses
Custodian fees 1,359 1,352Fund accounting expenses 8,942 6,208Unitholder communication costs - 601Audit fees 9,424 9,846Securities filing fees 11,313 6,702Independent review committee fees 241 514Other operating expenses 2,007 2,307
33,286 27,530
Net Investment Income for the Year 19,163,292 11,674,494
Gain (Loss) on Investments
Net realized gain on sale of investments 15,807,677 417,452Capital gains distributions received from other funds 3,472,742 2,370,056Transaction costs (Note 2,13) (129,641) (27,955)Net change in unrealized appreciation (depreciation) in value of investments 26,347,218 (16,609,622)
Net Gain (Loss) on Investments 45,497,996 (13,850,069)
Increase (Decrease) in Net Assets from Operations $ 64,661,288 $ (2,175,575)
Increase (Decrease) in Net Assets from Operations per Unit $ 1.03 $ (0.05)
Statement of Changes in Net Assets — For the Years Ended December 31
2012 2011
Net Assets - Beginning of Year $ 515,264,594 $ 338,311,860
Increase (Decrease) in Net Assets from Operations 64,661,288 (2,175,575)
Capital Transactions
Proceeds from issue of units 270,971,669 195,819,482Reinvestment of distributions 36,348,156 11,672,161Redemption of units (40,096,517) (16,691,173)
Net capital transactions 267,223,308 190,800,470
Distributions
From net investment income (19,201,263) (11,672,161)From capital gains (17,146,893) -
Total distributions (36,348,156) (11,672,161)
Increase in Net Assets for the Year 295,536,440 176,952,734
Net Assets - End of Year $ 810,801,034 $ 515,264,594
The accompanying notes are an integral part of the financial statements. 228
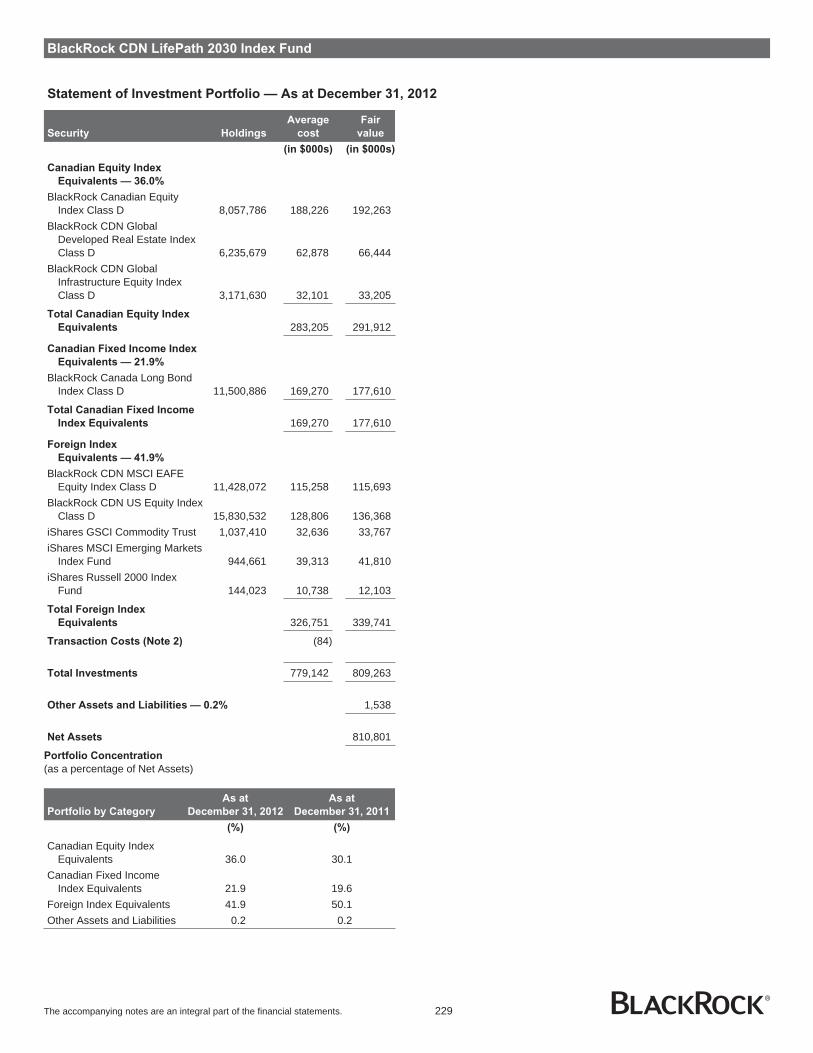
BlackRock CDN LifePath 2030 Index Fund
Statement of Investment Portfolio — As at December 31, 2012
Security Holdings
Average
cost
Fair
value
(in $000s) (in $000s)
Canadian Equity Index
Equivalents — 36.0%
BlackRock Canadian EquityIndex Class D 8,057,786 188,226 192,263
BlackRock CDN GlobalDeveloped Real Estate IndexClass D 6,235,679 62,878 66,444
BlackRock CDN GlobalInfrastructure Equity IndexClass D 3,171,630 32,101 33,205
Total Canadian Equity Index
Equivalents 283,205 291,912
Canadian Fixed Income Index
Equivalents — 21.9%
BlackRock Canada Long BondIndex Class D 11,500,886 169,270 177,610
Total Canadian Fixed Income
Index Equivalents 169,270 177,610
Foreign Index
Equivalents — 41.9%
BlackRock CDN MSCI EAFEEquity Index Class D 11,428,072 115,258 115,693
BlackRock CDN US Equity IndexClass D 15,830,532 128,806 136,368
iShares GSCI Commodity Trust 1,037,410 32,636 33,767iShares MSCI Emerging Markets
Index Fund 944,661 39,313 41,810iShares Russell 2000 Index
Fund 144,023 10,738 12,103
Total Foreign Index
Equivalents 326,751 339,741
Transaction Costs (Note 2) (84)
Total Investments 779,142 809,263
Other Assets and Liabilities — 0.2% 1,538
Net Assets 810,801
Portfolio Concentration
(as a percentage of Net Assets)
Portfolio by Category
As at
December 31, 2012
As at
December 31, 2011
(%) (%)
Canadian Equity IndexEquivalents 36.0 30.1
Canadian Fixed IncomeIndex Equivalents 21.9 19.6
Foreign Index Equivalents 41.9 50.1Other Assets and Liabilities 0.2 0.2
The accompanying notes are an integral part of the financial statements. 229

BlackRock CDN LifePath 2035 Index Fund
Statement of Net Assets — As at December 31
2012 2011
Assets
Investments - at fair value (Note 2) $ 490,926,336 $ 277,006,931Cash 974,263 1,740,375Dividends receivable 7,171 257,706Accounts receivable from issue of units 822,427 681,060Accounts receivable for investment sales 1,600,000 1,736,000
494,330,197 281,422,072
Liabilities
Operating expenses payable 13,218 12,189Payables for redemption of units 46 126,489Payables for investment purchases 2,438,155 3,732,203
2,451,419 3,870,881
Net Assets $ 491,878,778 $ 277,551,191
Number of Units Issued and Outstanding (Note 8) 47,080,185 29,501,547
Net Assets per Unit $ 10.45 $ 9.41
Investments at Cost $ 468,633,699 $ 272,959,609
Approved by BlackRock Asset Management Canada Limited,Manager of the Funds
Eric Léveillé, Director Noel Archard, Director
The accompanying notes are an integral part of the financial statements. 230

BlackRock CDN LifePath 2035 Index Fund
Statement of Operations — For the Years Ended December 31
2012 2011
Revenue
Dividend income $ 9,020,460 $ 5,362,109Interest income 2,257,824 1,140,220Securities lending income 2,480 856Foreign exchange loss (4,893) (3,483)Withholding taxes (164,903) (174,530)
11,110,968 6,325,172
Expenses
Custodian fees 1,544 1,342Fund accounting expenses 8,842 6,208Unitholder communication costs - 601Audit fees 9,318 9,672Securities filing fees 6,636 3,377Independent review committee fees 135 262Other operating expenses 1,406 1,970
27,881 23,432
Net Investment Income for the Year 11,083,087 6,301,740
Gain (Loss) on Investments
Net realized gain on sale of investments 8,576,828 164,806Capital gains distributions received from other funds 1,398,184 415,211Transaction costs (Note 2,13) (74,206) (18,656)Net change in unrealized appreciation (depreciation) in value of investments 18,245,315 (12,695,722)
Net Gain (Loss) on Investments 28,146,121 (12,134,361)
Increase (Decrease) in Net Assets from Operations $ 39,229,208 $ (5,832,621)
Increase (Decrease) in Net Assets from Operations per Unit $ 1.05 $ (0.27)
Statement of Changes in Net Assets — For the Years Ended December 31
2012 2011
Net Assets - Beginning of Year $ 277,551,191 $ 147,973,109
Increase (Decrease) in Net Assets from Operations 39,229,208 (5,832,621)
Capital Transactions
Proceeds from issue of units 193,213,339 140,852,908Reinvestment of distributions 20,973,420 6,786,217Redemption of units (18,114,960) (5,442,205)
Net capital transactions 196,071,799 142,196,920
Distributions
From net investment income (11,052,951) (5,822,029)From capital gains (9,920,469) (964,188)
Total distributions (20,973,420) (6,786,217)
Increase in Net Assets for the Year 214,327,587 129,578,082
Net Assets - End of Year $ 491,878,778 $ 277,551,191
The accompanying notes are an integral part of the financial statements. 231
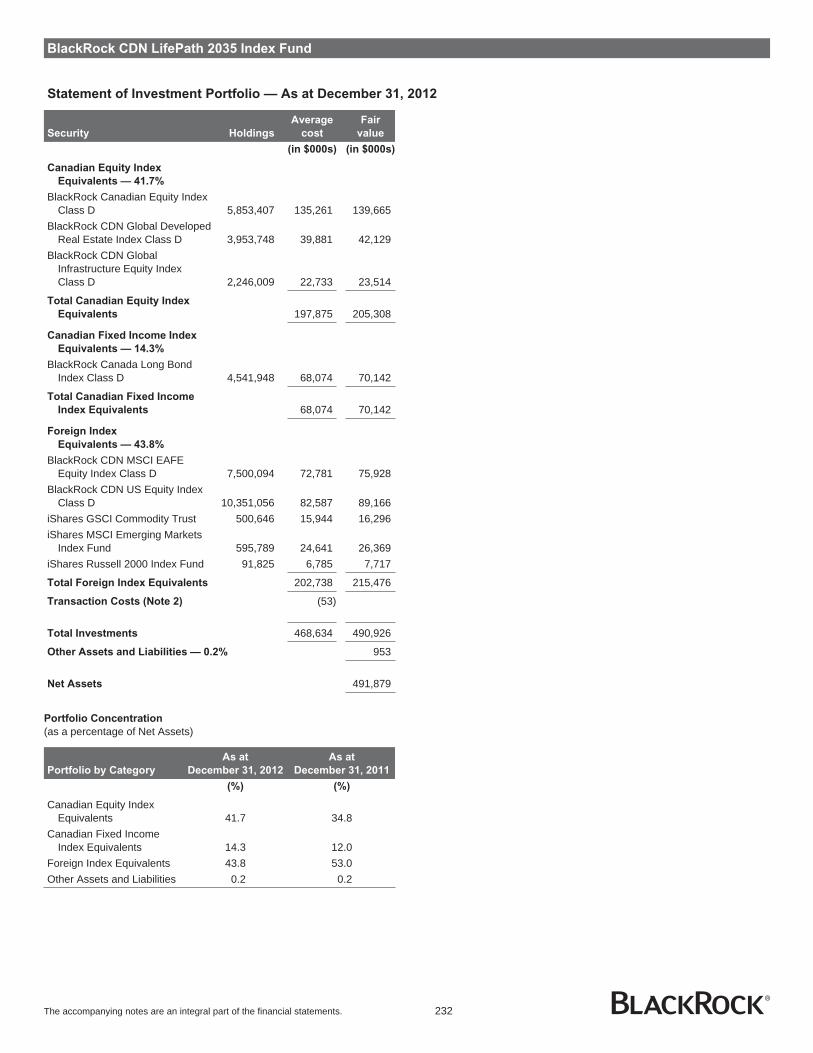
BlackRock CDN LifePath 2035 Index Fund
Statement of Investment Portfolio — As at December 31, 2012
Security Holdings
Average
cost
Fair
value
(in $000s) (in $000s)
Canadian Equity Index
Equivalents — 41.7%
BlackRock Canadian Equity IndexClass D 5,853,407 135,261 139,665
BlackRock CDN Global DevelopedReal Estate Index Class D 3,953,748 39,881 42,129
BlackRock CDN GlobalInfrastructure Equity IndexClass D 2,246,009 22,733 23,514
Total Canadian Equity Index
Equivalents 197,875 205,308
Canadian Fixed Income Index
Equivalents — 14.3%
BlackRock Canada Long BondIndex Class D 4,541,948 68,074 70,142
Total Canadian Fixed Income
Index Equivalents 68,074 70,142
Foreign Index
Equivalents — 43.8%
BlackRock CDN MSCI EAFEEquity Index Class D 7,500,094 72,781 75,928
BlackRock CDN US Equity IndexClass D 10,351,056 82,587 89,166
iShares GSCI Commodity Trust 500,646 15,944 16,296iShares MSCI Emerging Markets
Index Fund 595,789 24,641 26,369iShares Russell 2000 Index Fund 91,825 6,785 7,717
Total Foreign Index Equivalents 202,738 215,476
Transaction Costs (Note 2) (53)
Total Investments 468,634 490,926
Other Assets and Liabilities — 0.2% 953
Net Assets 491,879
Portfolio Concentration
(as a percentage of Net Assets)
Portfolio by Category
As at
December 31, 2012
As at
December 31, 2011
(%) (%)
Canadian Equity IndexEquivalents 41.7 34.8
Canadian Fixed IncomeIndex Equivalents 14.3 12.0
Foreign Index Equivalents 43.8 53.0Other Assets and Liabilities 0.2 0.2
The accompanying notes are an integral part of the financial statements. 232

BlackRock CDN LifePath 2040 Index Fund
Statement of Net Assets — As at December 31
2012 2011
Assets
Investments - at fair value (Note 2) $ 428,631,543 $ 265,429,372Cash 814,981 1,118,839Dividends receivable 6,715 190,476Accounts receivable from issue of units 745,788 658,780Accounts receivable for investment sales 1,300,000 2,361,896
431,499,027 269,759,363
Liabilities
Operating expenses payable 12,739 12,151Payables for redemption of units 103,300 11,411Payables for investment purchases 1,944,017 3,791,396
2,060,056 3,814,958
Net Assets $ 429,438,971 $ 265,944,405
Number of Units Issued and Outstanding (Note 8) 42,117,731 29,072,170
Net Assets per Unit $ 10.20 $ 9.15
Investments at Cost $ 410,786,173 $ 265,893,113
Approved by BlackRock Asset Management Canada Limited,Manager of the Funds
Eric Léveillé, Director Noel Archard, Director
The accompanying notes are an integral part of the financial statements. 233
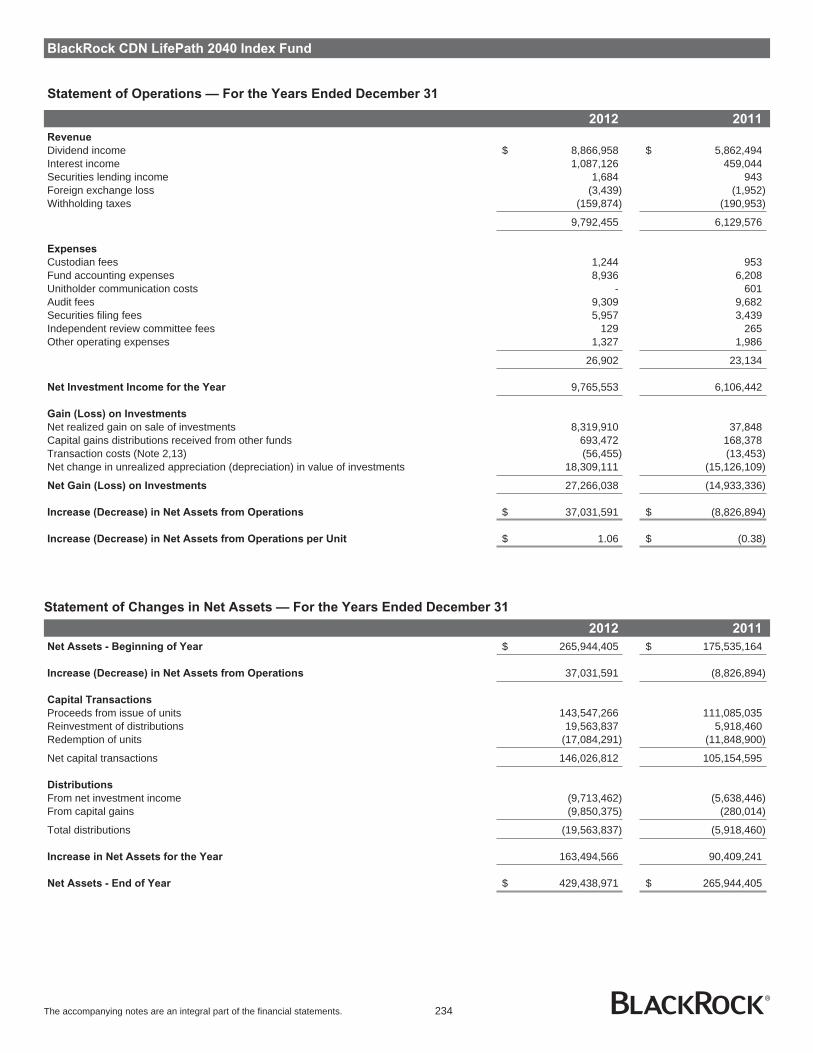
BlackRock CDN LifePath 2040 Index Fund
Statement of Operations — For the Years Ended December 31
2012 2011
Revenue
Dividend income $ 8,866,958 $ 5,862,494Interest income 1,087,126 459,044Securities lending income 1,684 943Foreign exchange loss (3,439) (1,952)Withholding taxes (159,874) (190,953)
9,792,455 6,129,576
Expenses
Custodian fees 1,244 953Fund accounting expenses 8,936 6,208Unitholder communication costs - 601Audit fees 9,309 9,682Securities filing fees 5,957 3,439Independent review committee fees 129 265Other operating expenses 1,327 1,986
26,902 23,134
Net Investment Income for the Year 9,765,553 6,106,442
Gain (Loss) on Investments
Net realized gain on sale of investments 8,319,910 37,848Capital gains distributions received from other funds 693,472 168,378Transaction costs (Note 2,13) (56,455) (13,453)Net change in unrealized appreciation (depreciation) in value of investments 18,309,111 (15,126,109)
Net Gain (Loss) on Investments 27,266,038 (14,933,336)
Increase (Decrease) in Net Assets from Operations $ 37,031,591 $ (8,826,894)
Increase (Decrease) in Net Assets from Operations per Unit $ 1.06 $ (0.38)
Statement of Changes in Net Assets — For the Years Ended December 31
2012 2011
Net Assets - Beginning of Year $ 265,944,405 $ 175,535,164
Increase (Decrease) in Net Assets from Operations 37,031,591 (8,826,894)
Capital Transactions
Proceeds from issue of units 143,547,266 111,085,035Reinvestment of distributions 19,563,837 5,918,460Redemption of units (17,084,291) (11,848,900)
Net capital transactions 146,026,812 105,154,595
Distributions
From net investment income (9,713,462) (5,638,446)From capital gains (9,850,375) (280,014)
Total distributions (19,563,837) (5,918,460)
Increase in Net Assets for the Year 163,494,566 90,409,241
Net Assets - End of Year $ 429,438,971 $ 265,944,405
The accompanying notes are an integral part of the financial statements. 234

BlackRock CDN LifePath 2040 Index Fund
Statement of Investment Portfolio — As at December 31, 2012
Security Holdings
Average
cost
Fair
value
(in $000s) (in $000s)
Canadian Equity Index
Equivalents — 46.7%
BlackRock Canadian Equity IndexClass D 5,881,314 136,267 140,331
BlackRock CDN Global DevelopedReal Estate Index Class D 3,493,513 35,220 37,225
BlackRock CDN GlobalInfrastructure Equity IndexClass D 2,187,130 22,140 22,898
Total Canadian Equity Index
Equivalents 193,627 200,454
Canadian Fixed Income Index
Equivalents — 8.0%
BlackRock Canada Long Bond IndexClass D 2,229,181 33,649 34,426
Total Canadian Fixed Income
Index Equivalents 33,649 34,426
Foreign Index Equivalents — 45.1%
BlackRock CDN MSCI EAFE EquityIndex Class D 6,944,560 69,493 70,304
BlackRock CDN US Equity IndexClass D 9,617,615 76,422 82,848
iShares GSCI Commodity Trust 274,280 8,464 8,928iShares MSCI Emerging Markets
Index Fund 557,377 23,088 24,669iShares Russell 2000 Index Fund 83,334 6,088 7,003
Total Foreign Index Equivalents 183,555 193,752
Transaction Costs (Note 2) (45)
Total Investments 410,786 428,632
Other Assets and Liabilities — 0.2% 807
Net Assets 429,439
Portfolio Concentration
(as a percentage of Net Assets)
Portfolio by Category
As at
December 31, 2012
As at
December 31, 2011
(%) (%)
Canadian Equity IndexEquivalents 46.7 39.6
Canadian Fixed IncomeIndex Equivalents 8.0 5.6
Foreign Index Equivalents 45.1 54.6Other Assets and Liabilities 0.2 0.2
The accompanying notes are an integral part of the financial statements. 235
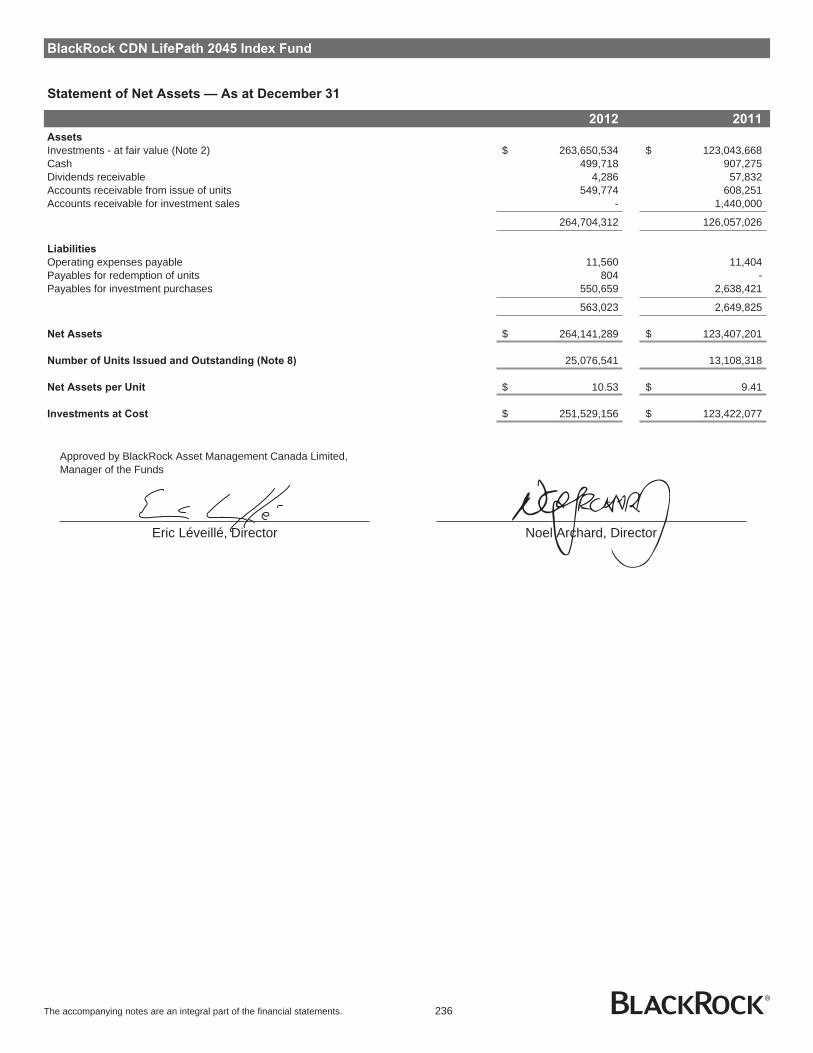
BlackRock CDN LifePath 2045 Index Fund
Statement of Net Assets — As at December 31
2012 2011
Assets
Investments - at fair value (Note 2) $ 263,650,534 $ 123,043,668Cash 499,718 907,275Dividends receivable 4,286 57,832Accounts receivable from issue of units 549,774 608,251Accounts receivable for investment sales - 1,440,000
264,704,312 126,057,026
Liabilities
Operating expenses payable 11,560 11,404Payables for redemption of units 804 -Payables for investment purchases 550,659 2,638,421
563,023 2,649,825
Net Assets $ 264,141,289 $ 123,407,201
Number of Units Issued and Outstanding (Note 8) 25,076,541 13,108,318
Net Assets per Unit $ 10.53 $ 9.41
Investments at Cost $ 251,529,156 $ 123,422,077
Approved by BlackRock Asset Management Canada Limited,Manager of the Funds
Eric Léveillé, Director Noel Archard, Director
The accompanying notes are an integral part of the financial statements. 236
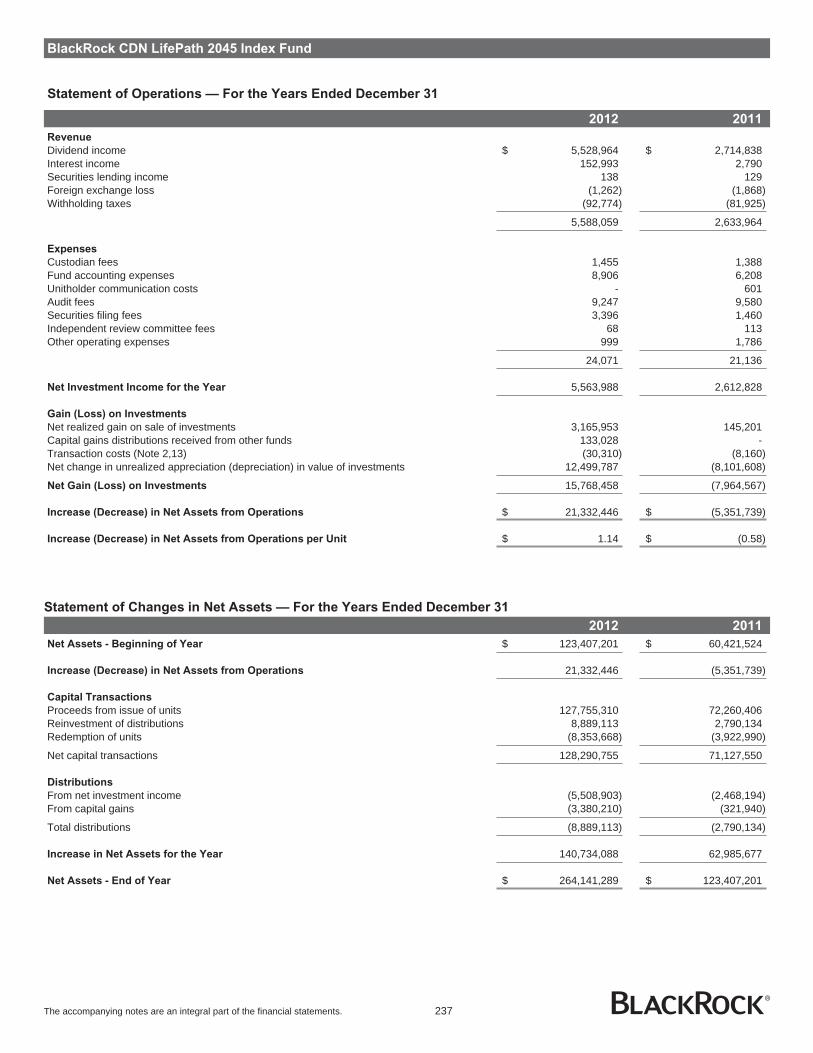
BlackRock CDN LifePath 2045 Index Fund
Statement of Operations — For the Years Ended December 31
2012 2011
Revenue
Dividend income $ 5,528,964 $ 2,714,838Interest income 152,993 2,790Securities lending income 138 129Foreign exchange loss (1,262) (1,868)Withholding taxes (92,774) (81,925)
5,588,059 2,633,964
Expenses
Custodian fees 1,455 1,388Fund accounting expenses 8,906 6,208Unitholder communication costs - 601Audit fees 9,247 9,580Securities filing fees 3,396 1,460Independent review committee fees 68 113Other operating expenses 999 1,786
24,071 21,136
Net Investment Income for the Year 5,563,988 2,612,828
Gain (Loss) on Investments
Net realized gain on sale of investments 3,165,953 145,201Capital gains distributions received from other funds 133,028 -Transaction costs (Note 2,13) (30,310) (8,160)Net change in unrealized appreciation (depreciation) in value of investments 12,499,787 (8,101,608)
Net Gain (Loss) on Investments 15,768,458 (7,964,567)
Increase (Decrease) in Net Assets from Operations $ 21,332,446 $ (5,351,739)
Increase (Decrease) in Net Assets from Operations per Unit $ 1.14 $ (0.58)
Statement of Changes in Net Assets — For the Years Ended December 31
2012 2011
Net Assets - Beginning of Year $ 123,407,201 $ 60,421,524
Increase (Decrease) in Net Assets from Operations 21,332,446 (5,351,739)
Capital Transactions
Proceeds from issue of units 127,755,310 72,260,406Reinvestment of distributions 8,889,113 2,790,134Redemption of units (8,353,668) (3,922,990)
Net capital transactions 128,290,755 71,127,550
Distributions
From net investment income (5,508,903) (2,468,194)From capital gains (3,380,210) (321,940)
Total distributions (8,889,113) (2,790,134)
Increase in Net Assets for the Year 140,734,088 62,985,677
Net Assets - End of Year $ 264,141,289 $ 123,407,201
The accompanying notes are an integral part of the financial statements. 237
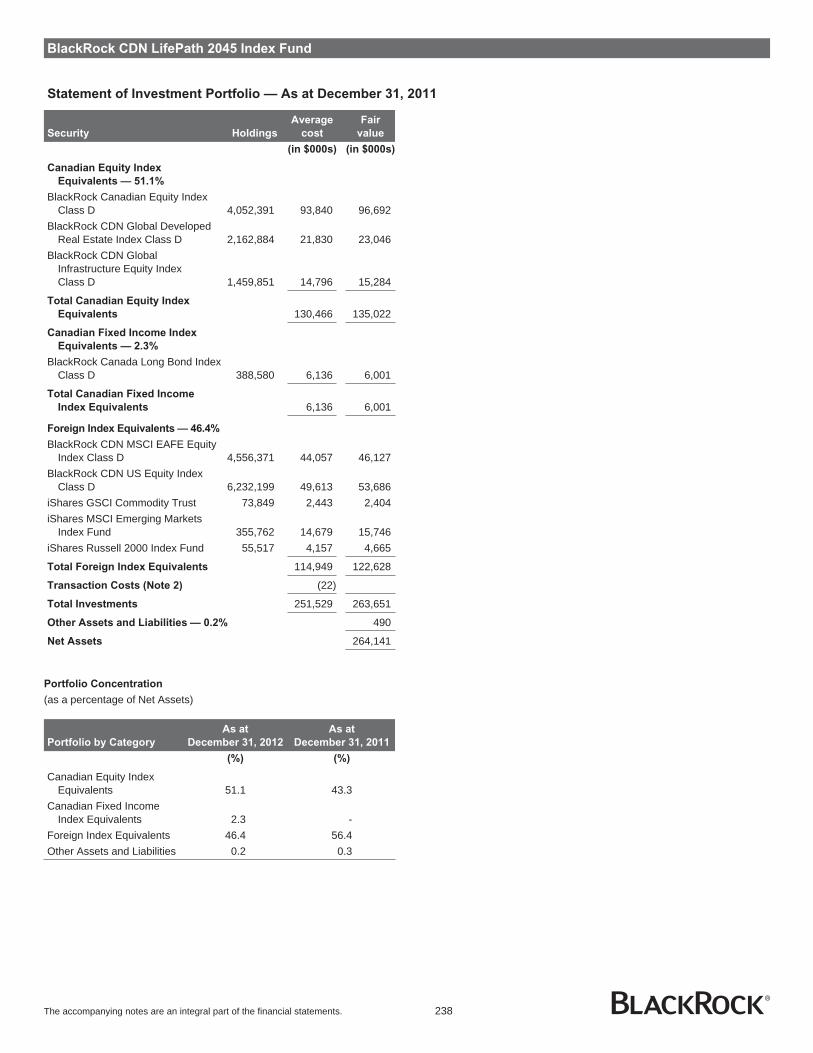
BlackRock CDN LifePath 2045 Index Fund
Statement of Investment Portfolio — As at December 31, 2011
Security Holdings
Average
cost
Fair
value
(in $000s) (in $000s)
Canadian Equity Index
Equivalents — 51.1%
BlackRock Canadian Equity IndexClass D 4,052,391 93,840 96,692
BlackRock CDN Global DevelopedReal Estate Index Class D 2,162,884 21,830 23,046
BlackRock CDN GlobalInfrastructure Equity IndexClass D 1,459,851 14,796 15,284
Total Canadian Equity Index
Equivalents 130,466 135,022
Canadian Fixed Income Index
Equivalents — 2.3%
BlackRock Canada Long Bond IndexClass D 388,580 6,136 6,001
Total Canadian Fixed Income
Index Equivalents 6,136 6,001
Foreign Index Equivalents — 46.4%
BlackRock CDN MSCI EAFE EquityIndex Class D 4,556,371 44,057 46,127
BlackRock CDN US Equity IndexClass D 6,232,199 49,613 53,686
iShares GSCI Commodity Trust 73,849 2,443 2,404iShares MSCI Emerging Markets
Index Fund 355,762 14,679 15,746iShares Russell 2000 Index Fund 55,517 4,157 4,665
Total Foreign Index Equivalents 114,949 122,628
Transaction Costs (Note 2) (22)
Total Investments 251,529 263,651
Other Assets and Liabilities — 0.2% 490
Net Assets 264,141
Portfolio Concentration
(as a percentage of Net Assets)
Portfolio by Category
As at
December 31, 2012
As at
December 31, 2011
(%) (%)
Canadian Equity IndexEquivalents 51.1 43.3
Canadian Fixed IncomeIndex Equivalents 2.3 -
Foreign Index Equivalents 46.4 56.4Other Assets and Liabilities 0.2 0.3
The accompanying notes are an integral part of the financial statements. 238
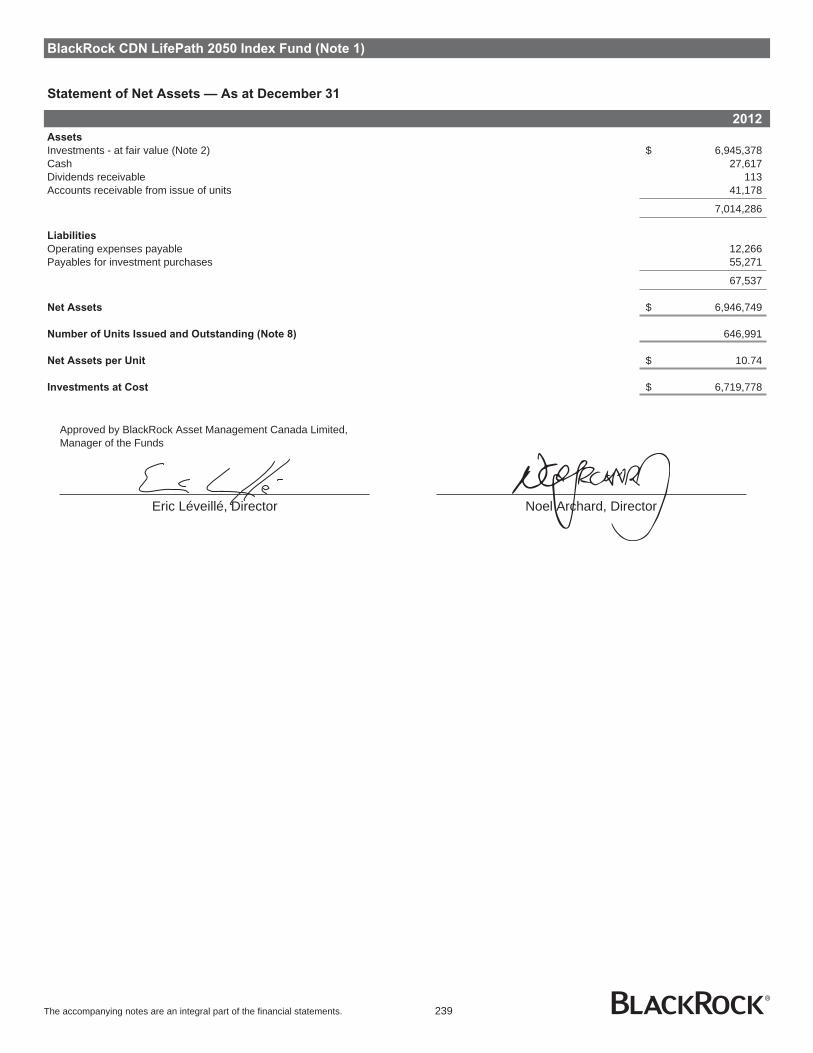
BlackRock CDN LifePath 2050 Index Fund (Note 1)
Statement of Net Assets — As at December 31
2012
Assets
Investments - at fair value (Note 2) $ 6,945,378Cash 27,617Dividends receivable 113Accounts receivable from issue of units 41,178
7,014,286
Liabilities
Operating expenses payable 12,266Payables for investment purchases 55,271
67,537
Net Assets $ 6,946,749
Number of Units Issued and Outstanding (Note 8) 646,991
Net Assets per Unit $ 10.74
Investments at Cost $ 6,719,778
Approved by BlackRock Asset Management Canada Limited,Manager of the Funds
Eric Léveillé, Director Noel Archard, Director
The accompanying notes are an integral part of the financial statements. 239

BlackRock CDN LifePath 2050 Index Fund (Note 1)
Statement of Operations — For the Period Ended December 31
2012
Revenue
Dividend income $ 79,891Foreign exchange loss (81)Withholding taxes (519)
79,291
Expenses
Custodian fees 580Fund accounting expenses 2,628Unitholder communication costs 251Audit fees 11,246Securities filing fees 52Other operating expenses 1
14,758
Net Investment Income for the Period 64,533
Gain on Investments
Net realized gain on sale of investments 2,929Capital gains distributions received from other funds 524Transaction costs (Note 2,13) (171)Net change in unrealized appreciation in value of investments 225,600
Net Gain on Investments 228,882
Increase in Net Assets from Operations $ 293,415
Increase in Net Assets from Operations per Unit $ 0.77
Statement of Changes in Net Assets — For the Period Ended December 31
2012
Net Assets - Beginning of Period $ -
Increase in Net Assets from Operations 293,415
Capital Transactions
Proceeds from issue of units 6,684,734Reinvestment of distributions 68,000Redemption of units (31,400)
Net capital transactions 6,721,334
Distributions
From net investment income (64,547)From capital gains (3,453)
Total distributions (68,000)
Increase in Net Assets for the Period 6,946,749
Net Assets - End of Period $ 6,946,749
The accompanying notes are an integral part of the financial statements. 240

BlackRock CDN LifePath 2050 Index Fund
Statement of Investment Portfolio — As at December 31, 2012
Security Holdings
Average
cost
Fair
value
(in $000s) (in $000s)
Canadian Equity Index
Equivalents — 52.8%
BlackRock Canadian Equity IndexClass D 112,440 2,620 2,683
BlackRock CDN Global DevelopedReal Estate Index Class D 54,644 554 582
BlackRock CDN Global InfrastructureEquity Index Class D 38,289 389 401
Total Canadian Equity Index
Equivalents 3,563 3,666
Foreign Index Equivalents — 47.2%
BlackRock CDN MSCI EAFE EquityIndex Class D 123,153 1,179 1,247
BlackRock CDN US Equity IndexClass D 168,643 1,440 1,453
iShares GSCI Commodity Trust 794 26 26iShares MSCI Emerging Markets
Index Fund 9,661 391 427iShares Russell 2000 Index Fund 1,505 121 126
Total Foreign Index Equivalents 3,157 3,279
Total Investments 6,720 6,945
Other Assets and Liabilities — 0.0% 2
Net Assets 6,947
Portfolio Concentration
(as a percentage of Net Assets)
Portfolio by Category
As at
December 31, 2012
(%)
Canadian Equity Index Equivalents 52.8Foreign Index Equivalents 47.2Other Assets and Liabilities -
The accompanying notes are an integral part of the financial statements. 241

BlackRock Balanced Active Fund
Statement of Net Assets — As at December 31
2012 2011
Assets
Investments - at fair value (Note 2) $ 35,050,014 $ 32,015,118Cash 40,335 26,492Dividends receivable 3,268 3,428Accounts receivable for investment sales 107,823 188,163
35,201,440 32,233,201
Liabilities
Operating expenses payable 9,830 10,891Payables for investment purchases 135,583 180,000
145,413 190,891
Net Assets $ 35,056,027 $ 32,042,310
Number of Units Issued and Outstanding (Note 8) 1,300,090 1,300,090
Net Assets per Unit $ 26.96 $ 24.65
Investments at Cost $ 33,947,467 $ 33,004,339
Approved by BlackRock Asset Management Canada Limited,Manager of the Funds
Eric Léveillé, Director Noel Archard, Director
The accompanying notes are an integral part of the financial statements. 242

BlackRock Balanced Active Fund
Statement of Operations — For the Years Ended December 31
2012 2011
Revenue
Dividend income $ 316,425 $ 271,680Interest income 365,295 445,044Foreign exchange loss (910) (1,594)Withholding taxes (9,216) (8,962)
671,594 706,168
Expenses
Custodian fees 28 77Fund accounting expenses 6,157 6,208Unitholder communication costs - 601Audit fees 9,192 9,543Securities filing fees 560 518Independent review committee fees 21 23Other operating expenses 639 1,707
16,597 18,677
Net Investment Income for the Year 654,997 687,491
Gain (Loss) on Investments
Net realized gain on sale of investments 107,861 39,141Capital gains distributions received from other funds 159,265 316,566Transaction costs (Note 2,13) (174) (784)Net change in unrealized appreciation (depreciation) in value of investments 2,091,768 (483,896)
Net Gain (Loss) on Investments 2,358,720 (128,973)
Increase in Net Assets from Operations $ 3,013,717 $ 558,518
Increase in Net Assets from Operations per Unit $ 2.32 $ 0.39
Statement of Changes in Net Assets — For the Years Ended December 31
2012 2011
Net Assets - Beginning of Year $ 32,042,310 $ 43,887,794
Increase in Net Assets from Operations 3,013,717 558,518
Capital Transactions
Reinvestment of distributions 642,333 637,749Redemption of units - (12,404,002)
Net capital transactions 642,333 (11,766,253)
Distributions
From net investment income (642,333) (637,749)
Total distributions (642,333) (637,749)
Increase (Decrease) in Net Assets for the Year 3,013,717 (11,845,484)
Net Assets - End of Year $ 35,056,027 $ 32,042,310
The accompanying notes are an integral part of the financial statements. 243

BlackRock Balanced Active Fund
Statement of Investment Portfolio — As at December 31, 2012
Security Holdings
Average
cost
Fair
value
(in $000s) (in $000s)
Canadian Equity Index
Equivalents — 2.2%
iShares S&P/TSX Capped REITIndex Fund 44,890 482 769
Total Canadian Equity Index
Equivalents 482 769
Canadian Equity
Investments — 23.8%
BlackRock Active Canadian EquityFund 250,328 8,254 8,346
Total Canadian Equity
Investments 8,254 8,346
Canadian Fixed Income
Investments — 33.2%
BlackRock Canada CoreActiveUniverse Bond Class A 556,432 12,243 11,635
Total Canadian Fixed Income
Investments 12,243 11,635
Foreign Index Equivalents — 7.7%
iShares Dow Jones U.S. Real EstateIndex Fund 13,670 743 881
iShares MSCI Emerging MarketsIndex Fund 41,450 1,714 1,834
Total Foreign Index Equivalents 2,457 2,715
Foreign Investments — 33.1%
Alpha Tilts Fund B 111,244 3,960 4,908BlackRock CDN Global Market
Selection Class A 31,565 1,820 1,601International Alpha Tilts Fund B 234,153 4,732 5,076
Total Foreign Investments 10,512 11,585
Transaction Costs (Note 2) (1)
Total Investments 33,947 35,050
Other Assets and Liabilities — 0.0% 6
Net Assets 35,056
Portfolio Concentration
(as a percentage of Net Assets)
Portfolio by Category
As at
December 31, 2012
As at
December 31, 2011
(%) (%)
Canadian Equity IndexEquivalents 2.2 2.6
Canadian EquityInvestments 23.8 23.9
Canadian Fixed IncomeInvestments 33.2 33.4
Foreign Index Equivalents 7.7 6.8Foreign Investments 33.1 33.2Other Assets and Liabilities - 0.1
The accompanying notes are an integral part of the financial statements. 244
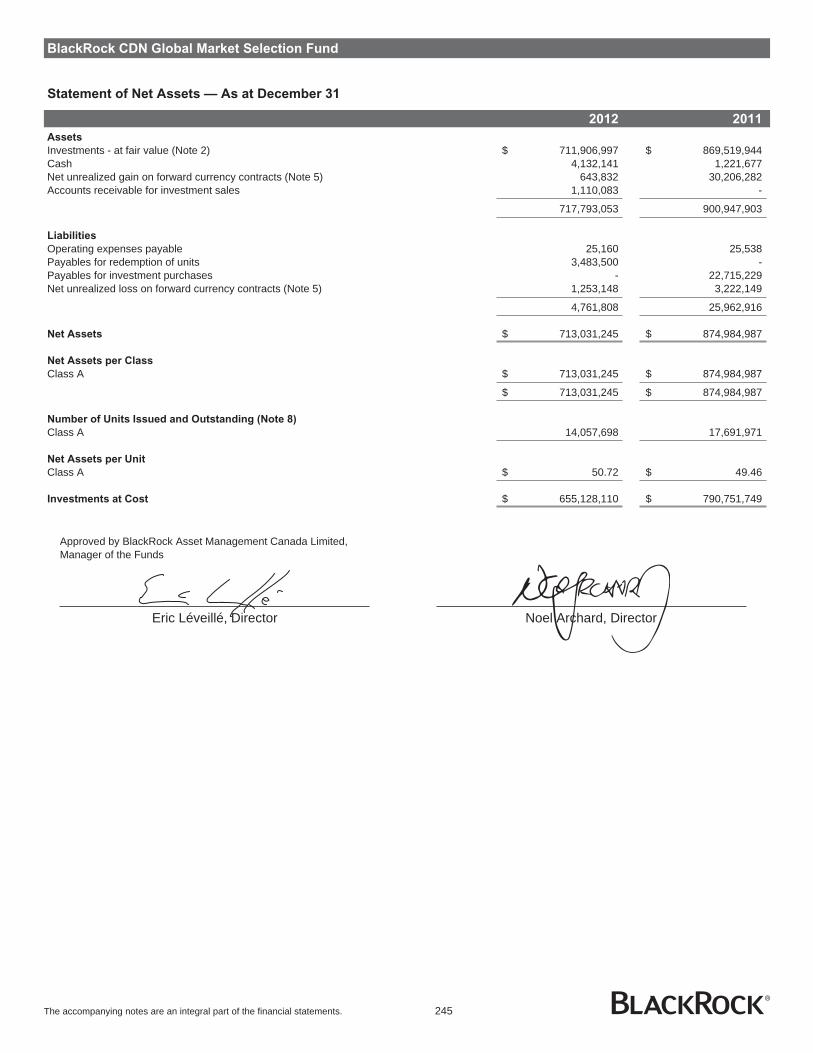
BlackRock CDN Global Market Selection Fund
Statement of Net Assets — As at December 31
2012 2011
Assets
Investments - at fair value (Note 2) $ 711,906,997 $ 869,519,944Cash 4,132,141 1,221,677Net unrealized gain on forward currency contracts (Note 5) 643,832 30,206,282Accounts receivable for investment sales 1,110,083 -
717,793,053 900,947,903
Liabilities
Operating expenses payable 25,160 25,538Payables for redemption of units 3,483,500 -Payables for investment purchases - 22,715,229Net unrealized loss on forward currency contracts (Note 5) 1,253,148 3,222,149
4,761,808 25,962,916
Net Assets $ 713,031,245 $ 874,984,987
Net Assets per Class
Class A $ 713,031,245 $ 874,984,987
$ 713,031,245 $ 874,984,987
Number of Units Issued and Outstanding (Note 8)
Class A 14,057,698 17,691,971
Net Assets per Unit
Class A $ 50.72 $ 49.46
Investments at Cost $ 655,128,110 $ 790,751,749
Approved by BlackRock Asset Management Canada Limited,Manager of the Funds
Eric Léveillé, Director Noel Archard, Director
The accompanying notes are an integral part of the financial statements. 245

BlackRock CDN Global Market Selection Fund
Statement of Operations — For the Years Ended December 31
2012 2011
Revenue
Interest income $ 2,289 $ 11,217Foreign exchange gain (loss) (20,751) 353,630
(18,462) 364,847
Expenses
Custodian fees 492 470Fund accounting expenses 10,933 13,303Unitholder communication costs - 601Audit fees 19,096 20,319Securities filing fees 12,434 13,188Independent review committee fees 352 981Other operating expenses 2,207 3,028
45,514 51,890
Net Investment Income for the Year (63,976) 312,957
Gain (Loss) on Investments
Net realized gain on sale of investments 28,979,254 8,376,601Net realized gain (loss) from forward currency contracts 50,863,752 (21,623,690)Net change in unrealized depreciation in value of investments (21,989,308) (35,635,702)Net change in unrealized appreciation (depreciation) in value of forward currency contracts (27,593,449) 7,756,690
Net Gain (Loss) on Investments 30,260,249 (41,126,101)
Increase (Decrease) in Net Assets from Operations $ 30,196,273 $ (40,813,144)
Increase (Decrease) in Net Assets from Operations per Class
Class A $ 30,196,273 $ (40,813,144)
$ 30,196,273 $ (40,813,144)
Increase (Decrease) in Net Assets from Operations per Unit
Class A $ 2.01 $ (2.38)
The accompanying notes are an integral part of the financial statements. 246

BlackRock CDN Global Market Selection Fund
Statement of Changes in Net Assets — For the Years Ended December 31
2012 2011 2012 2011
Fund Class A
Net Assets - Beginning of Year $ 874,984,987 $ 841,551,038 $ 874,984,987 $ 841,551,038
Increase (Decrease) in Net Assets from Operations 30,196,273 (40,813,144) 30,196,273 (40,813,144)
Capital Transactions
Proceeds from issue of units 12,164,354 76,695,726 12,164,354 76,695,726Reinvestment of distributions 18,026,348 - 18,026,348 -Redemption of units (204,314,369) (2,448,633) (204,314,369) (2,448,633)
Net capital transactions (174,123,667) 74,247,093 (174,123,667) 74,247,093
Distributions
From capital gains (18,026,348) - (18,026,348) -
Total distributions (18,026,348) - (18,026,348) -
Increase (Decrease) in Net Assets for the Year (161,953,742) 33,433,949 (161,953,742) 33,433,949
Net Assets - End of Year $ 713,031,245 $ 874,984,987 $ 713,031,245 $ 874,984,987
The accompanying notes are an integral part of the financial statements. 247

BlackRock CDN Global Market Selection Fund
Statement of Investment Portfolio — As at December 31, 2012
Security Holdings
Average
cost
Fair
value
(in $000s) (in $000s)
Foreign Investments — 99.8%
Global Ascent Ltd.* 476,982 655,128 711,907
Total Foreign Investments 655,128 711,907
Total Investments 655,128 711,907
Other Assets and Liabilities — 0.2% 1,124
Net Assets 713,031
Open forward currency contracts held by the Fund as at December 31,2012 are shown in Note 5.
Portfolio Concentration
(as a percentage of Net Assets)
Portfolio by Category
As at
December 31,
2012
As at
December 31,
2011
(%) (%)
Foreign Investments 99.8 99.4Other Assets and
Liabilities 0.2 0.6
*The Global Ascent Ltd. is a Cayman Islands exempted company with thefollowing portfolio concentration as a percentage of Net Assets.
Portfolio by Category
As at
December 31,
2012
As at
December 31,
2011
(%) (%)
Asset-BackedSecurities 0.15 0.98
Certificate of Deposit 1.67 -Commercial Mortgage-
Backed Securities 0.03 1.55Commercial Paper 12.70 -Corporate Debt
Securities 0.98 5.19Global Equities-Long 62.26 71.61U.S. Government
Agency Securities 2.63 2.08Repurchase
Agreements 29.28 23.84Global Equities-Short (78.63) (74.94)Other Derivatives
Assets1 11.02 3.71Other Derivatives
Liabilities1 (11.40) (3.48)Other Assets and
Liabilities 69.31 69.46
1 Other Derivatives Assets and Other Derivatives Liabilities consist of contractsfor differences, futures contracts, forward currency contracts, interest rateswap contracts, total return swap contracts, credit default swap contracts,variance swap contracts and options.
The accompanying notes are an integral part of the financial statements. 248

BlackRock CDN Short Term Index Fund
Statement of Net Assets — As at December 31
2012 2011
Assets
Investments - at fair value* (Note 2) $ 177,540,253 $ 51,897,513Cash 380,981 13,075Interest receivable 105,288 30,590Accounts receivable from issue of units 576,271 92,330
178,602,793 52,033,508
Liabilities
Operating expenses payable 16,422 15,158Payables for redemption of units 147,505 180,049
163,927 195,207
Net Assets $ 178,438,866 $ 51,838,301
Net Assets per Class
Class A $ 147,731,952 $ 19,079,177Class D 30,706,914 32,759,124
$ 178,438,866 $ 51,838,301
Number of Units Issued and Outstanding (Note 8)
Class A 9,348,822 1,219,628Class D 2,316,105 2,495,982
Net Assets per Unit
Class A $ 15.80 $ 15.64Class D $ 13.26 $ 13.12
Investments at Cost* $ 177,376,417 $ 51,888,454
*Includes short-term investments
Approved by BlackRock Asset Management Canada Limited,Manager of the Funds
Eric Léveillé, Director Noel Archard, Director
The accompanying notes are an integral part of the financial statements. 249
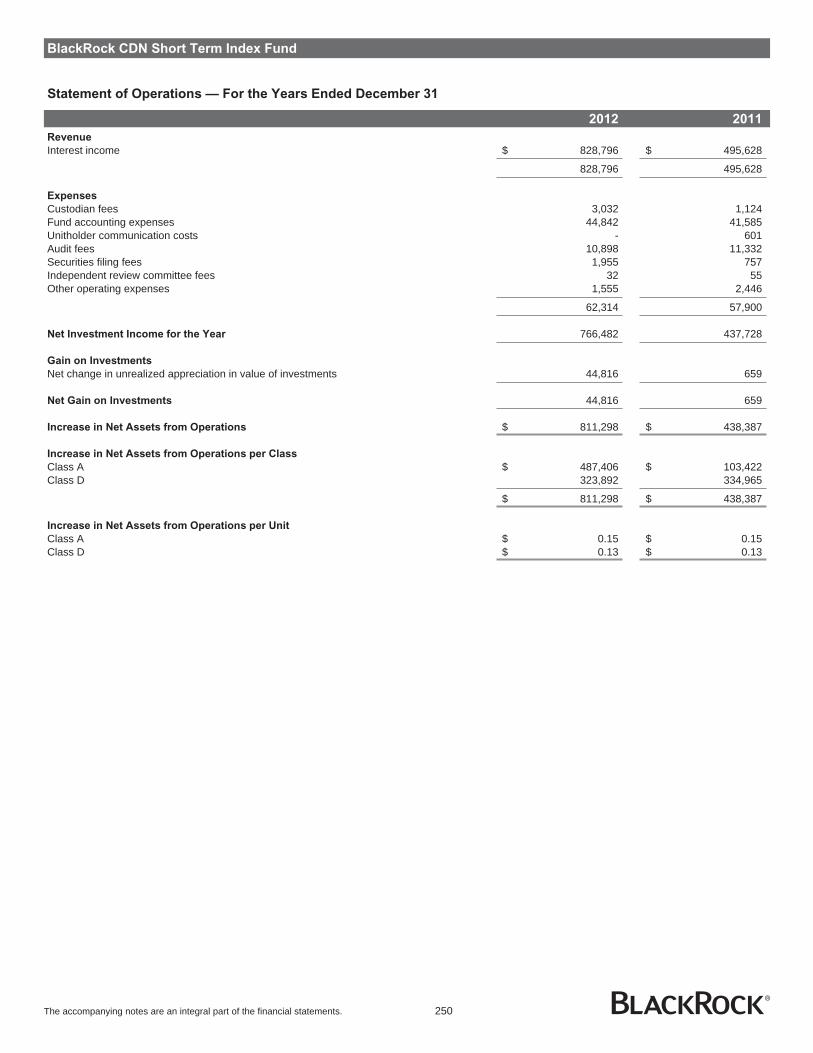
BlackRock CDN Short Term Index Fund
Statement of Operations — For the Years Ended December 31
2012 2011
Revenue
Interest income $ 828,796 $ 495,628
828,796 495,628
Expenses
Custodian fees 3,032 1,124Fund accounting expenses 44,842 41,585Unitholder communication costs - 601Audit fees 10,898 11,332Securities filing fees 1,955 757Independent review committee fees 32 55Other operating expenses 1,555 2,446
62,314 57,900
Net Investment Income for the Year 766,482 437,728
Gain on Investments
Net change in unrealized appreciation in value of investments 44,816 659
Net Gain on Investments 44,816 659
Increase in Net Assets from Operations $ 811,298 $ 438,387
Increase in Net Assets from Operations per Class
Class A $ 487,406 $ 103,422Class D 323,892 334,965
$ 811,298 $ 438,387
Increase in Net Assets from Operations per Unit
Class A $ 0.15 $ 0.15Class D $ 0.13 $ 0.13
The accompanying notes are an integral part of the financial statements. 250
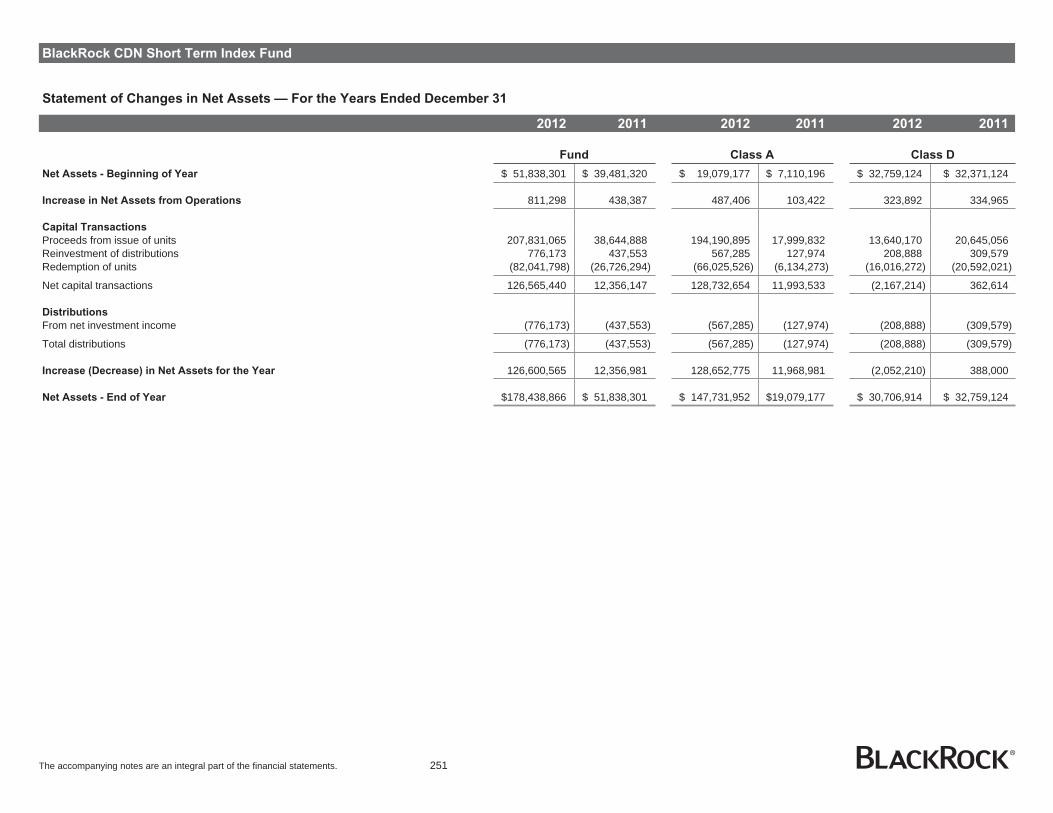
BlackRock CDN Short Term Index Fund
Statement of Changes in Net Assets — For the Years Ended December 31
2012 2011 2012 2011 2012 2011
Fund Class A Class D
Net Assets - Beginning of Year $ 51,838,301 $ 39,481,320 $ 19,079,177 $ 7,110,196 $ 32,759,124 $ 32,371,124
Increase in Net Assets from Operations 811,298 438,387 487,406 103,422 323,892 334,965
Capital Transactions
Proceeds from issue of units 207,831,065 38,644,888 194,190,895 17,999,832 13,640,170 20,645,056Reinvestment of distributions 776,173 437,553 567,285 127,974 208,888 309,579Redemption of units (82,041,798) (26,726,294) (66,025,526) (6,134,273) (16,016,272) (20,592,021)
Net capital transactions 126,565,440 12,356,147 128,732,654 11,993,533 (2,167,214) 362,614
Distributions
From net investment income (776,173) (437,553) (567,285) (127,974) (208,888) (309,579)
Total distributions (776,173) (437,553) (567,285) (127,974) (208,888) (309,579)
Increase (Decrease) in Net Assets for the Year 126,600,565 12,356,981 128,652,775 11,968,981 (2,052,210) 388,000
Net Assets - End of Year $178,438,866 $ 51,838,301 $ 147,731,952 $19,079,177 $ 30,706,914 $ 32,759,124
The accompanying notes are an integral part of the financial statements. 251

BlackRock CDN Short Term Index Fund
Statement of Investment Portfolio — As at December 31, 2012
Security
Par
value
Average
cost
Fair
value
(in 000s) (in $000s) (in $000s)
Short Term Investments
Fixed Income Equivalents
Provincial — 12.4%
Province of Alberta 0.99%February 04, 2013 7,000 6,983 6,993
Province of Brit 1.02% February 06,2013 6,990 6,975 6,983
Province of Saskatchewan1.00% January 03, 2013 5,000 4,994 5,0001.00% January 04, 2013 3,150 3,146 3,150
22,098 22,126
Total Fixed Income Equivalents 22,098 22,126
Federal Non-Agency
Government Guaranteed — 63.6%
Canadian Treasury Bill0.95% January 14, 2013 13,300 13,292 13,2960.98% January 31, 2013 18,000 17,954 17,9850.97% February 14, 2013 18,200 18,152 18,1780.96% February 28, 2013 17,550 17,503 17,5220.97% March 14, 2013 17,800 17,742 17,7670.98% March 28, 2013 18,200 18,136 18,161
CPPIB Capital, Inc.1.05% January 03, 2013 3,500 3,493 3,500
Ontario Infrastructure & Lands Corp.1.07% February 01, 2013 3,500 3,494 3,497
PSP Capital Inc.1.06% February 01, 2013 3,500 3,495 3,497
113,261 113,403
Commercial Paper — 13.4%
Bank du Montreal 1.07% January 14,2013 3,700 3,697 3,699
Bank of Nova Scotia1.12% January 10, 2013 3,400 3,397 3,399
CIBC1.09% January 08, 2013 3,500 3,497 3,499
OMERS Finance Trust1.11% January 02, 2013 3,500 3,498 3,500
Financiere CDP, Inc.1.04% February 15, 2013 3,000 2,994 2,996
Royal Bank du Canada1.08% January 16, 2013 3,500 3,497 3,498
Toronto Dominion Bank1.08% January 22, 2013 3,400 3,397 3,398
23,977 23,989
Total Federal Non-Agency 137,238 137,392
Total Short Term Investments 159,336 159,518
Security
Par
value
Average
cost
Fair
value
(in 000s) (in $000s) (in $000s)
Fixed Income Investments
Government
Federal Non-Agency — 10.1%
Government of Canada1.75% March 01, 2013 18,000 18,040 18,022
18,040 18,022
Total Government 18,040 18,022
Total Fixed Income Investments 18,040 18,022
Total Investments 177,376 177,540
Other Assets and Liabilities — 0.5% 899
Net Assets 178,439
Portfolio Concentration
(as a percentage of Net Assets)
Portfolio by Category
As at
December 31, 2012
As at
December 31, 2011
(%) (%)
Provincial 12.4 15.4Government Guaranteed 63.6 52.0Commercial Paper 13.4 2.4Corporate - 30.3Federal Non-Agency 10.1 -Other Assets and Liabilities 0.5 (0.1)
The accompanying notes are an integral part of the financial statements. 252

BlackRock CDN MSCI EAFE Equity Index Fund
Statement of Net Assets — As at December 31
2012 2011
Assets
Investments - at fair value (Note 2) $ 2,844,715,579 $ 2,096,122,949Cash 28,389,779 18,007,052Margin due from brokers 5,308,728 3,262,562Securities lending income receivable 60,778 24,214Dividends receivable 3,495,458 4,102,011Tax reclaim on dividends receivable 3,074,096 2,220,226Accounts receivable from issue of units 21,034,888 25,474,784Accounts receivable for investment sales 59,892 40,512
2,906,139,198 2,149,254,310
Liabilities
Operating expenses payable 96,590 88,237Payables for redemption of units 12,967,203 4,862,130Payables for investment purchases 23,064,428 32,453,699
36,128,221 37,404,066
Net Assets $ 2,870,010,977 $ 2,111,850,244
Net Assets per Class
Class A $ 1,200,166,548 $ 1,015,050,654Class D 1,669,844,429 1,096,799,590
$ 2,870,010,977 $ 2,111,850,244
Number of Units Issued and Outstanding (Note 8)
Class A 118,665,161 115,409,382Class D 165,143,979 124,738,873
Net Assets per Unit
Class A $ 10.11 $ 8.80Class D $ 10.11 $ 8.79
Investments at Cost $ 2,902,018,066 $ 2,456,253,039
Approved by BlackRock Asset Management Canada Limited,Manager of the Funds
Eric Léveillé, Director Noel Archard, Director
The accompanying notes are an integral part of the financial statements. 253
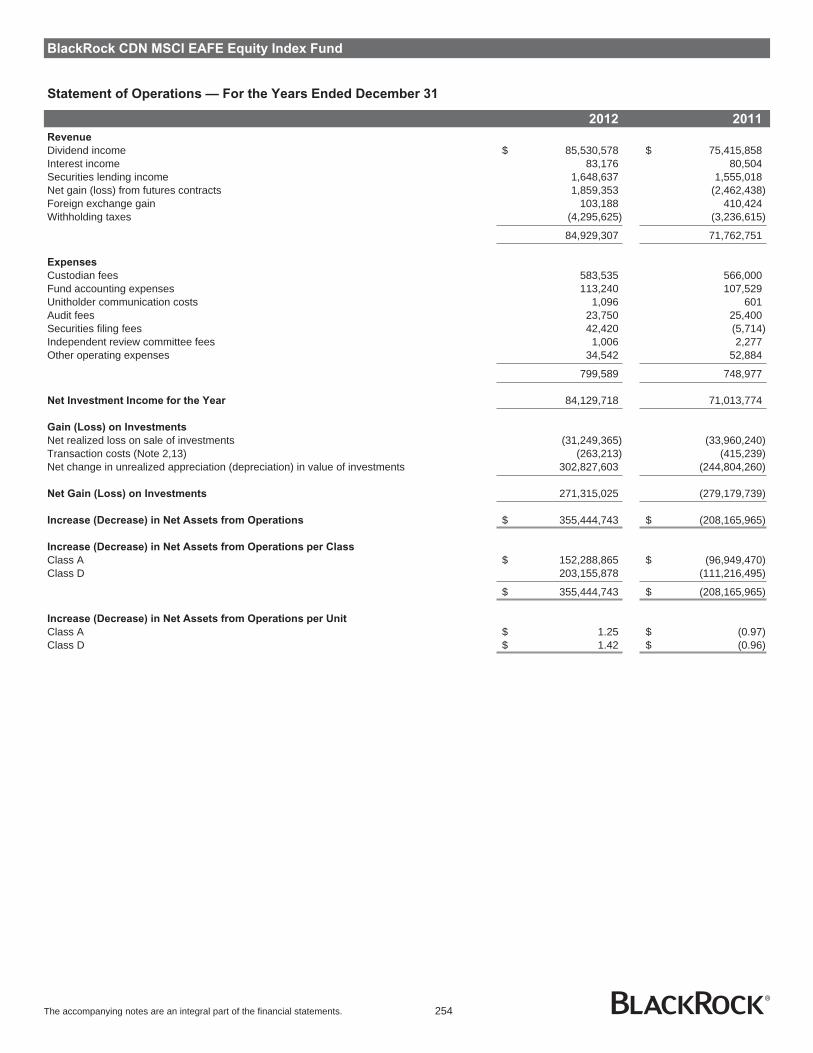
BlackRock CDN MSCI EAFE Equity Index Fund
Statement of Operations — For the Years Ended December 31
2012 2011
Revenue
Dividend income $ 85,530,578 $ 75,415,858Interest income 83,176 80,504Securities lending income 1,648,637 1,555,018Net gain (loss) from futures contracts 1,859,353 (2,462,438)Foreign exchange gain 103,188 410,424Withholding taxes (4,295,625) (3,236,615)
84,929,307 71,762,751
Expenses
Custodian fees 583,535 566,000Fund accounting expenses 113,240 107,529Unitholder communication costs 1,096 601Audit fees 23,750 25,400Securities filing fees 42,420 (5,714)Independent review committee fees 1,006 2,277Other operating expenses 34,542 52,884
799,589 748,977
Net Investment Income for the Year 84,129,718 71,013,774
Gain (Loss) on Investments
Net realized loss on sale of investments (31,249,365) (33,960,240)Transaction costs (Note 2,13) (263,213) (415,239)Net change in unrealized appreciation (depreciation) in value of investments 302,827,603 (244,804,260)
Net Gain (Loss) on Investments 271,315,025 (279,179,739)
Increase (Decrease) in Net Assets from Operations $ 355,444,743 $ (208,165,965)
Increase (Decrease) in Net Assets from Operations per Class
Class A $ 152,288,865 $ (96,949,470)Class D 203,155,878 (111,216,495)
$ 355,444,743 $ (208,165,965)
Increase (Decrease) in Net Assets from Operations per Unit
Class A $ 1.25 $ (0.97)Class D $ 1.42 $ (0.96)
The accompanying notes are an integral part of the financial statements. 254

BlackRock CDN MSCI EAFE Equity Index Fund
Statement of Changes in Net Assets — For the Years Ended December 31
2012 2011 2012 2011 2012 2011
Fund Class A Class D
Net Assets - Beginning of Year $2,111,850,244 $1,991,072,204 $1,015,050,654 $1,000,080,116 $1,096,799,590 $ 990,992,088
Increase (Decrease) in Net Assets from Operations 355,444,743 (208,165,965) 152,288,865 (96,949,470) 203,155,878 (111,216,495)
Capital Transactions
Proceeds from issue of units 974,418,076 936,648,818 456,829,532 501,052,678 517,588,544 435,596,140Reinvestment of distributions 88,512,825 68,308,660 41,686,353 31,102,476 46,826,472 37,206,184Redemption of units (571,702,086) (607,704,813) (424,002,503) (389,132,670) (147,699,583) (218,572,143)
Net capital transactions 491,228,815 397,252,665 74,513,382 143,022,484 416,715,433 254,230,181
Distributions
From net investment income (83,979,202) (68,308,660) (37,152,730) (31,102,476) (46,826,472) (37,206,184)From capital gains redemption in kind (Note 9) (4,533,623) - (4,533,623) - - -
Total distributions (88,512,825) (68,308,660) (41,686,353) (31,102,476) (46,826,472) (37,206,184)
Increase in Net Assets for the Year 758,160,733 120,778,040 185,115,894 14,970,538 573,044,839 105,807,502
Net Assets - End of Year $2,870,010,977 $2,111,850,244 $1,200,166,548 $1,015,050,654 $1,669,844,429 $1,096,799,590
The accompanying notes are an integral part of the financial statements. 255
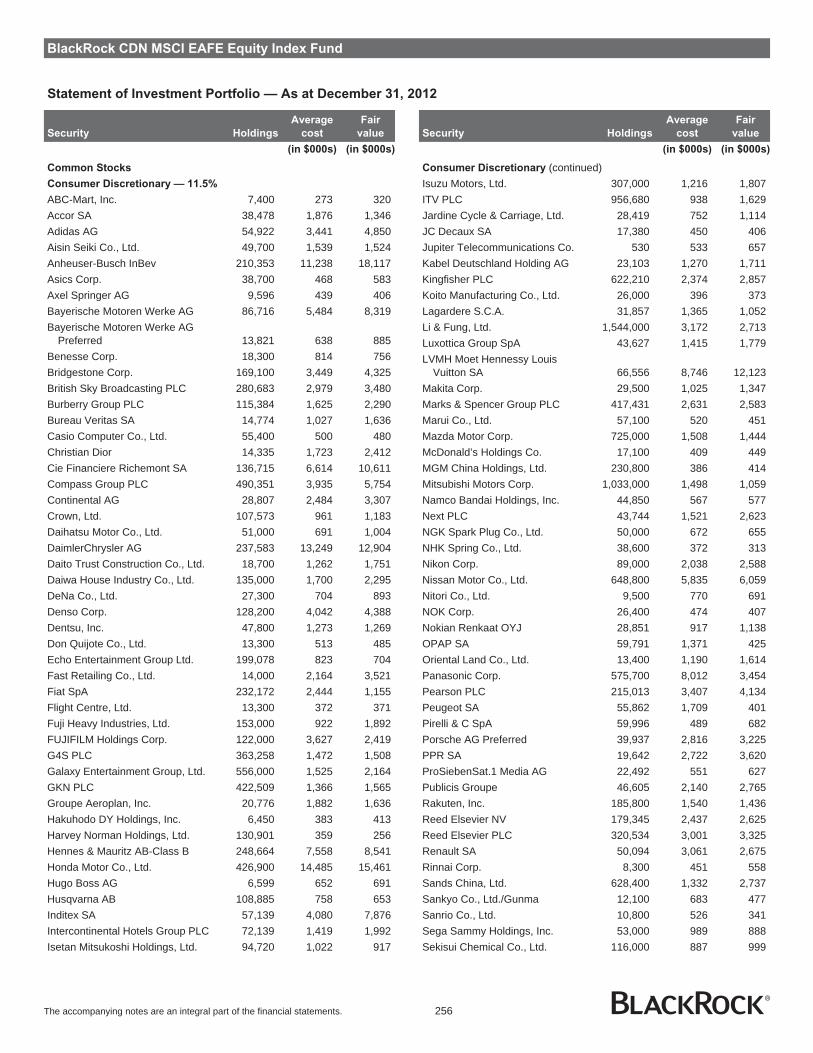
BlackRock CDN MSCI EAFE Equity Index Fund
Statement of Investment Portfolio — As at December 31, 2012
Security Holdings
Average
cost
Fair
value
(in $000s) (in $000s)
Common Stocks
Consumer Discretionary — 11.5%
ABC-Mart, Inc. 7,400 273 320Accor SA 38,478 1,876 1,346Adidas AG 54,922 3,441 4,850Aisin Seiki Co., Ltd. 49,700 1,539 1,524Anheuser-Busch InBev 210,353 11,238 18,117Asics Corp. 38,700 468 583Axel Springer AG 9,596 439 406Bayerische Motoren Werke AG 86,716 5,484 8,319Bayerische Motoren Werke AG
Preferred 13,821 638 885Benesse Corp. 18,300 814 756Bridgestone Corp. 169,100 3,449 4,325British Sky Broadcasting PLC 280,683 2,979 3,480Burberry Group PLC 115,384 1,625 2,290Bureau Veritas SA 14,774 1,027 1,636Casio Computer Co., Ltd. 55,400 500 480Christian Dior 14,335 1,723 2,412Cie Financiere Richemont SA 136,715 6,614 10,611Compass Group PLC 490,351 3,935 5,754Continental AG 28,807 2,484 3,307Crown, Ltd. 107,573 961 1,183Daihatsu Motor Co., Ltd. 51,000 691 1,004DaimlerChrysler AG 237,583 13,249 12,904Daito Trust Construction Co., Ltd. 18,700 1,262 1,751Daiwa House Industry Co., Ltd. 135,000 1,700 2,295DeNa Co., Ltd. 27,300 704 893Denso Corp. 128,200 4,042 4,388Dentsu, Inc. 47,800 1,273 1,269Don Quijote Co., Ltd. 13,300 513 485Echo Entertainment Group Ltd. 199,078 823 704Fast Retailing Co., Ltd. 14,000 2,164 3,521Fiat SpA 232,172 2,444 1,155Flight Centre, Ltd. 13,300 372 371Fuji Heavy Industries, Ltd. 153,000 922 1,892FUJIFILM Holdings Corp. 122,000 3,627 2,419G4S PLC 363,258 1,472 1,508Galaxy Entertainment Group, Ltd. 556,000 1,525 2,164GKN PLC 422,509 1,366 1,565Groupe Aeroplan, Inc. 20,776 1,882 1,636Hakuhodo DY Holdings, Inc. 6,450 383 413Harvey Norman Holdings, Ltd. 130,901 359 256Hennes & Mauritz AB-Class B 248,664 7,558 8,541Honda Motor Co., Ltd. 426,900 14,485 15,461Hugo Boss AG 6,599 652 691Husqvarna AB 108,885 758 653Inditex SA 57,139 4,080 7,876Intercontinental Hotels Group PLC 72,139 1,419 1,992Isetan Mitsukoshi Holdings, Ltd. 94,720 1,022 917
Security Holdings
Average
cost
Fair
value
(in $000s) (in $000s)
Consumer Discretionary (continued)Isuzu Motors, Ltd. 307,000 1,216 1,807ITV PLC 956,680 938 1,629Jardine Cycle & Carriage, Ltd. 28,419 752 1,114JC Decaux SA 17,380 450 406Jupiter Telecommunications Co. 530 533 657Kabel Deutschland Holding AG 23,103 1,270 1,711Kingfisher PLC 622,210 2,374 2,857Koito Manufacturing Co., Ltd. 26,000 396 373Lagardere S.C.A. 31,857 1,365 1,052Li & Fung, Ltd. 1,544,000 3,172 2,713Luxottica Group SpA 43,627 1,415 1,779LVMH Moet Hennessy Louis
Vuitton SA 66,556 8,746 12,123Makita Corp. 29,500 1,025 1,347Marks & Spencer Group PLC 417,431 2,631 2,583Marui Co., Ltd. 57,100 520 451Mazda Motor Corp. 725,000 1,508 1,444McDonald’s Holdings Co. 17,100 409 449MGM China Holdings, Ltd. 230,800 386 414Mitsubishi Motors Corp. 1,033,000 1,498 1,059Namco Bandai Holdings, Inc. 44,850 567 577Next PLC 43,744 1,521 2,623NGK Spark Plug Co., Ltd. 50,000 672 655NHK Spring Co., Ltd. 38,600 372 313Nikon Corp. 89,000 2,038 2,588Nissan Motor Co., Ltd. 648,800 5,835 6,059Nitori Co., Ltd. 9,500 770 691NOK Corp. 26,400 474 407Nokian Renkaat OYJ 28,851 917 1,138OPAP SA 59,791 1,371 425Oriental Land Co., Ltd. 13,400 1,190 1,614Panasonic Corp. 575,700 8,012 3,454Pearson PLC 215,013 3,407 4,134Peugeot SA 55,862 1,709 401Pirelli & C SpA 59,996 489 682Porsche AG Preferred 39,937 2,816 3,225PPR SA 19,642 2,722 3,620ProSiebenSat.1 Media AG 22,492 551 627Publicis Groupe 46,605 2,140 2,765Rakuten, Inc. 185,800 1,540 1,436Reed Elsevier NV 179,345 2,437 2,625Reed Elsevier PLC 320,534 3,001 3,325Renault SA 50,094 3,061 2,675Rinnai Corp. 8,300 451 558Sands China, Ltd. 628,400 1,332 2,737Sankyo Co., Ltd./Gunma 12,100 683 477Sanrio Co., Ltd. 10,800 526 341Sega Sammy Holdings, Inc. 53,000 989 888Sekisui Chemical Co., Ltd. 116,000 887 999
The accompanying notes are an integral part of the financial statements. 256

BlackRock CDN MSCI EAFE Equity Index Fund
Statement of Investment Portfolio — As at December 31, 2012
Security Holdings
Average
cost
Fair
value
(in $000s) (in $000s)
Consumer Discretionary (continued)Sekisui House, Ltd. 142,000 1,431 1,539Shangri-La Asia, Ltd. 419,333 885 827Sharp Corp. 271,000 3,015 946Shimamura Co., Ltd. 5,600 545 540Shimano, Inc. 19,300 937 1,220Singapore Press Holdings, Ltd. 312,707 921 1,025SJM Holdings, Ltd. 496,000 886 1,143Sky City Entertainment Group, Ltd. 150,193 404 463Sodexho Alliance SA 24,942 1,643 2,085Sony Corp. 265,600 7,811 2,927Stanley Electric Co., Ltd. 35,100 631 492Sumitomo Rubber Industries, Inc. 41,900 454 498Suzuki Motor Corp. 95,300 2,228 2,460Swatch Group AG 8,073 2,594 4,049Swatch Group AG-Class B 11,722 714 1,003Tabcorp Holdings, Ltd. 194,824 1,231 612Takashimaya Co., Ltd. 71,000 620 500Tatts Group, Ltd. 354,007 900 1,102Toho Co., Ltd./Tokyo 31,800 561 556Toyoda Gosei Co., Ltd. 15,600 380 312Toyota Boshoku Corp. 15,500 286 177Toyota Industries Corp. 42,900 1,318 1,347Toyota Motor Corp. 722,400 30,748 33,276TUI Travel PLC 117,154 405 536USS Co., Ltd. 5,910 466 612Vivendi SA 341,487 9,286 7,596Volkswagen AG 7,695 1,376 1,647Volkswagen AG Preferred 37,877 4,934 8,580Whitbread PLC 47,366 1,240 1,871Wolters Kluwer NV 77,826 1,633 1,581WPP PLC 331,238 3,631 4,755Wynn Macau, Ltd. 411,200 838 1,101Yamada Denki Co., Ltd. 23,610 1,573 903Yamaha Corp. 41,300 576 431Yamaha Motor Co., Ltd. 74,500 1,117 812Yamato Kogyo Co., Ltd. 10,200 340 295Yue Yuen Industrial Holdings 198,500 631 659
294,527 329,813
Consumer Staples — 10.5%
Aeon Co., Ltd. 160,100 2,133 1,816Ajinomoto Co., Inc. 167,000 1,907 2,198Aryzta AG 23,010 1,073 1,173Asahi Breweries, Ltd. 101,100 1,980 2,139Associated British Foods PLC 93,865 1,582 2,373Barry Callebaut AG 441 414 422Beiersdorf AG 26,600 1,666 2,156British American Tobacco PLC 508,989 19,798 25,699Calbee, Inc. 3,900 316 273Carlsberg A/S-Class B 27,806 2,293 2,708
Security Holdings
Average
cost
Fair
value
(in $000s) (in $000s)
Consumer Staples (continued)Carrefour SA 157,423 6,565 3,996Casino Guichard Perrachon SA 14,394 1,283 1,362Coca Cola Hellenic Bottling Co. SA 51,977 1,201 1,183Coca-Cola Amatil, Ltd. 149,384 1,608 2,077Coca-Cola West Japan Co., Ltd. 15,200 288 233Colruyt SA 20,488 967 1,008Danone 151,786 9,603 9,921D.E Master Blenders 1753 155,953 1,788 1,781Delhaize Group 27,454 1,844 1,090Diageo PLC 656,435 13,099 18,975Distribuidora Internacional de
Alimentacion SA 165,613 792 1,044Familymart Co., Ltd. 14,800 556 605Golden Agri-Resources, Ltd. 1,793,432 898 943Groupe Danone 98,000 685 389Heineken Holding NV 26,347 1,160 1,430Heineken NV 60,815 3,045 4,016Henkel KGaA 33,948 1,600 2,302Henkel KGaA Preferred 46,342 2,485 3,775Imperial Tobacco Group PLC 260,433 9,092 9,994J Front Retailing Co., Ltd. 128,600 726 705J Sainsbury PLC 325,246 1,846 1,816Japan Tobacco, Inc. 236,700 5,101 6,651Jeronimo Martins SGPS SA 58,064 694 1,113Kao Corp. 136,900 3,687 3,546Kerry Group PLC-Class A 39,440 1,437 2,058Kesko OYJ-Class B 17,285 630 561Kikkoman Corp. 45,000 545 636Kirin Holdings Co., Ltd. 230,000 3,219 2,680Koninklijke Ahold NV 262,480 3,458 3,492L’Oreal SA 63,170 6,899 8,691Lawson, Inc. 15,800 841 1,068Lindt & Spruengli AG 222 631 717Lindt & Spruengli AG-PC 26 810 976Meiji Holdings Co., Ltd. 16,360 723 705Metcash, Ltd. 234,781 916 806Metro AG 35,005 1,774 963Nestle SA 844,602 43,084 54,757Nippon Meat Packers, Inc. 43,000 562 591Nisshin Seifun Group, Inc. 52,500 657 651Nissin Food Products Co., Ltd. 15,800 579 594Olam International, Ltd. 420,432 742 531Pernod-Ricard 55,809 5,084 6,386Reckitt Benckiser Group PLC 170,457 8,940 10,693Remy Cointreau SA 5,557 578 599SABMiller PLC 250,565 7,765 11,442Seven & I Holdings Co., Ltd. 196,520 5,584 5,515Shiseido Co., Ltd. 94,300 1,791 1,320Suedzucker AG 22,126 679 900
The accompanying notes are an integral part of the financial statements. 257

BlackRock CDN MSCI EAFE Equity Index Fund
Statement of Investment Portfolio — As at December 31, 2012
Security Holdings
Average
cost
Fair
value
(in $000s) (in $000s)
Consumer Staples (continued)Swedish Match AB 54,547 1,450 1,822Tate & Lyle PLC 121,184 1,310 1,492Tesco PLC 2,106,039 13,603 11,453TNT Express NV 86,988 963 963Toyo Suisan Kaisha, Ltd. 23,000 570 609Treasury Wine Estates, Ltd. 176,734 915 855Uni-Charm Corp. 29,200 1,075 1,510Unilever NV 426,646 13,328 16,110Unilever PLC 336,148 10,463 12,867William Morrison Supermarkets 603,695 2,937 2,569Wilmar International, Ltd. 500,000 2,119 1,357Woolworths, Ltd. 322,757 8,192 9,782Yakult Honsha Co., Ltd. 25,600 770 1,111Yamazaki Baking Co., Ltd. 31,000 382 343
259,780 301,087
Energy — 7.4%
Aker Solutions ASA 43,204 665 872BG Group PLC 889,826 17,342 14,568BP PLC 4,987,088 44,148 34,284Caltex Australia, Ltd. 34,123 444 677Cosmo Oil Company, Ltd. 137,000 409 301ENI SpA 666,275 16,883 16,041Fugro NV 18,155 1,134 1,057Galp Energia SGPS SA-Class B 72,466 1,142 1,118Idemitsu Kosan Co., Ltd. 5,800 543 498Inpex Holdings, Inc. 577 3,730 3,037Japan Petroleum Exploration Co. 7,100 385 247JX Holdings, Inc. 585,330 3,580 3,249Lundin Petroleum AB 57,697 1,455 1,319Neste Oil OYJ 34,828 674 446OMV AG 38,147 1,661 1,370Origin Energy, Ltd. 283,976 3,776 3,411Repsol SA 211,527 - 128Repsol YPF SA 214,858 5,932 4,315Royal Dutch Shell PLC-Class A 973,202 33,055 33,409Royal Dutch Shell PLC-Class B 688,995 23,454 24,238Saipem 69,009 2,833 2,654Santos, Ltd. 249,153 3,277 2,859SeaDrill, Ltd. 91,505 2,659 3,328Showa Shell Sekiyu KK 44,000 413 247Statoil ASA 292,295 7,529 7,269Subsea 7 SA 75,156 1,808 1,776Technip SA 26,878 2,294 3,061Tenaris SA 123,071 2,169 2,516TonenGeneral Sekiyu KK 71,000 738 609Total SA 557,503 33,562 28,542Transocean, Ltd. 93,855 5,726 4,118Tullow Oil PLC 237,593 4,556 4,830Whitehaven Coal, Ltd. 127,961 625 463
Security Holdings
Average
cost
Fair
value
(in $000s) (in $000s)
Energy (continued)Woodside Petroleum, Ltd. 171,803 6,851 6,017WorleyParsons, Ltd. 53,019 1,340 1,280
236,792 214,154
Financials — 24.3%
3i Group PLC 254,686 1,384 895Aberdeen Asset Management PLC 221,135 870 1,312Acom Co., Ltd. 9,360 253 266Admiral Group PLC 54,084 1,027 1,015Aegon NV 459,277 3,591 2,891Aeon Credit Service Co., Ltd. 17,200 266 344Aeon Mall Co., Ltd. 19,700 483 480Ageas 61,168 4,564 1,781AIA Group, Ltd. 2,838,800 9,383 11,032Allianz AG 119,246 15,564 16,374AMP, Ltd. 752,261 3,940 3,740Anglo Irish Bank Co. PLC 364,155 14,992 11,160Aozora Bank, Ltd. 152,000 319 462Ascendas REIT 504,042 775 974Assicurazioni Generali SpA 305,817 7,347 5,512ASX, Ltd. 45,341 1,433 1,462Aviva PLC 767,516 5,602 4,632AXA SA 463,053 10,154 8,109Baloise Holding AG 12,591 1,103 1,072Banca Monte dei Paschi di
Siena SpA 1,732,163 1,468 513Banco Bilbao Vizcaya Argentaria SA 1,427,097 16,965 12,932Banco de Sabadell SA 727,158 2,752 1,876Banco Espirito Santo SA 550,694 1,143 645Banco Popolare Scarl 463,273 2,242 764Banco Popular Espanol SA 1,365,685 2,756 1,045Banco Santander Central
Hispano SA 2,703,202 29,699 21,291Bank Hapoalim BM 283,586 1,118 1,206Bank Leumi Le-Israel BM 334,741 1,315 1,127Bank of East Asia, Ltd. 350,520 1,369 1,337Bank of Kyoto, Ltd. (The) 82,000 778 686Bank of Yokohama, Ltd. 316,000 1,763 1,452Bankia SA 251,360 1,118 129Banque Cantonale Vaudoise 727 384 383Barclays PLC 3,044,949 15,426 12,915Bendigo Bank, Ltd. 104,549 921 919BGP Holdings PLC 1,121,589 - -BNP Paribas 262,689 17,968 14,656BOC Hong Kong Holdings, Ltd. 977,500 2,504 3,020British Land Co. PLC 218,771 2,024 1,990CapitaCommercial Trust-REIT 546,000 722 748Capitaland, Ltd. 681,305 1,853 2,055CapitaMall Trust-REIT 629,700 886 1,093Capitamalls Asia, Ltd. 352,000 569 555
The accompanying notes are an integral part of the financial statements. 258
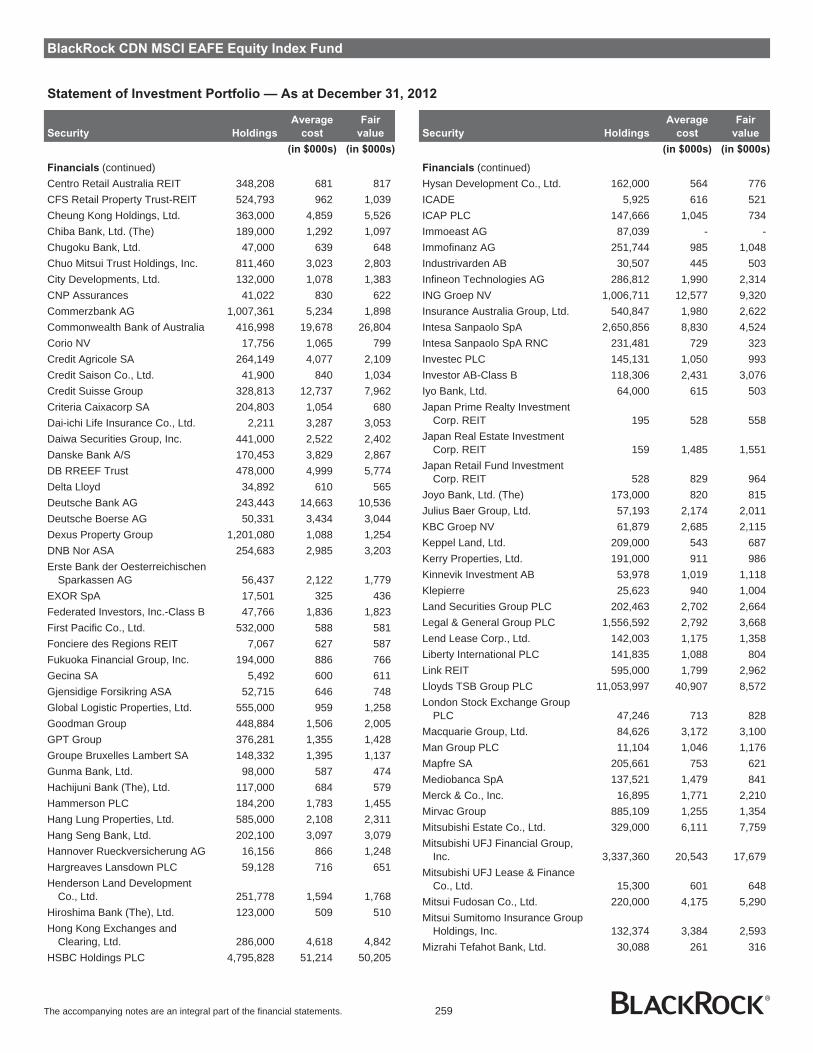
BlackRock CDN MSCI EAFE Equity Index Fund
Statement of Investment Portfolio — As at December 31, 2012
Security Holdings
Average
cost
Fair
value
(in $000s) (in $000s)
Financials (continued)Centro Retail Australia REIT 348,208 681 817CFS Retail Property Trust-REIT 524,793 962 1,039Cheung Kong Holdings, Ltd. 363,000 4,859 5,526Chiba Bank, Ltd. (The) 189,000 1,292 1,097Chugoku Bank, Ltd. 47,000 639 648Chuo Mitsui Trust Holdings, Inc. 811,460 3,023 2,803City Developments, Ltd. 132,000 1,078 1,383CNP Assurances 41,022 830 622Commerzbank AG 1,007,361 5,234 1,898Commonwealth Bank of Australia 416,998 19,678 26,804Corio NV 17,756 1,065 799Credit Agricole SA 264,149 4,077 2,109Credit Saison Co., Ltd. 41,900 840 1,034Credit Suisse Group 328,813 12,737 7,962Criteria Caixacorp SA 204,803 1,054 680Dai-ichi Life Insurance Co., Ltd. 2,211 3,287 3,053Daiwa Securities Group, Inc. 441,000 2,522 2,402Danske Bank A/S 170,453 3,829 2,867DB RREEF Trust 478,000 4,999 5,774Delta Lloyd 34,892 610 565Deutsche Bank AG 243,443 14,663 10,536Deutsche Boerse AG 50,331 3,434 3,044Dexus Property Group 1,201,080 1,088 1,254DNB Nor ASA 254,683 2,985 3,203Erste Bank der Oesterreichischen
Sparkassen AG 56,437 2,122 1,779EXOR SpA 17,501 325 436Federated Investors, Inc.-Class B 47,766 1,836 1,823First Pacific Co., Ltd. 532,000 588 581Fonciere des Regions REIT 7,067 627 587Fukuoka Financial Group, Inc. 194,000 886 766Gecina SA 5,492 600 611Gjensidige Forsikring ASA 52,715 646 748Global Logistic Properties, Ltd. 555,000 959 1,258Goodman Group 448,884 1,506 2,005GPT Group 376,281 1,355 1,428Groupe Bruxelles Lambert SA 148,332 1,395 1,137Gunma Bank, Ltd. 98,000 587 474Hachijuni Bank (The), Ltd. 117,000 684 579Hammerson PLC 184,200 1,783 1,455Hang Lung Properties, Ltd. 585,000 2,108 2,311Hang Seng Bank, Ltd. 202,100 3,097 3,079Hannover Rueckversicherung AG 16,156 866 1,248Hargreaves Lansdown PLC 59,128 716 651Henderson Land Development
Co., Ltd. 251,778 1,594 1,768Hiroshima Bank (The), Ltd. 123,000 509 510Hong Kong Exchanges and
Clearing, Ltd. 286,000 4,618 4,842HSBC Holdings PLC 4,795,828 51,214 50,205
Security Holdings
Average
cost
Fair
value
(in $000s) (in $000s)
Financials (continued)Hysan Development Co., Ltd. 162,000 564 776ICADE 5,925 616 521ICAP PLC 147,666 1,045 734Immoeast AG 87,039 - -Immofinanz AG 251,744 985 1,048Industrivarden AB 30,507 445 503Infineon Technologies AG 286,812 1,990 2,314ING Groep NV 1,006,711 12,577 9,320Insurance Australia Group, Ltd. 540,847 1,980 2,622Intesa Sanpaolo SpA 2,650,856 8,830 4,524Intesa Sanpaolo SpA RNC 231,481 729 323Investec PLC 145,131 1,050 993Investor AB-Class B 118,306 2,431 3,076Iyo Bank, Ltd. 64,000 615 503Japan Prime Realty Investment
Corp. REIT 195 528 558Japan Real Estate Investment
Corp. REIT 159 1,485 1,551Japan Retail Fund Investment
Corp. REIT 528 829 964Joyo Bank, Ltd. (The) 173,000 820 815Julius Baer Group, Ltd. 57,193 2,174 2,011KBC Groep NV 61,879 2,685 2,115Keppel Land, Ltd. 209,000 543 687Kerry Properties, Ltd. 191,000 911 986Kinnevik Investment AB 53,978 1,019 1,118Klepierre 25,623 940 1,004Land Securities Group PLC 202,463 2,702 2,664Legal & General Group PLC 1,556,592 2,792 3,668Lend Lease Corp., Ltd. 142,003 1,175 1,358Liberty International PLC 141,835 1,088 804Link REIT 595,000 1,799 2,962Lloyds TSB Group PLC 11,053,997 40,907 8,572London Stock Exchange Group
PLC 47,246 713 828Macquarie Group, Ltd. 84,626 3,172 3,100Man Group PLC 11,104 1,046 1,176Mapfre SA 205,661 753 621Mediobanca SpA 137,521 1,479 841Merck & Co., Inc. 16,895 1,771 2,210Mirvac Group 885,109 1,255 1,354Mitsubishi Estate Co., Ltd. 329,000 6,111 7,759Mitsubishi UFJ Financial Group,
Inc. 3,337,360 20,543 17,679Mitsubishi UFJ Lease & Finance
Co., Ltd. 15,300 601 648Mitsui Fudosan Co., Ltd. 220,000 4,175 5,290Mitsui Sumitomo Insurance Group
Holdings, Inc. 132,374 3,384 2,593Mizrahi Tefahot Bank, Ltd. 30,088 261 316
The accompanying notes are an integral part of the financial statements. 259
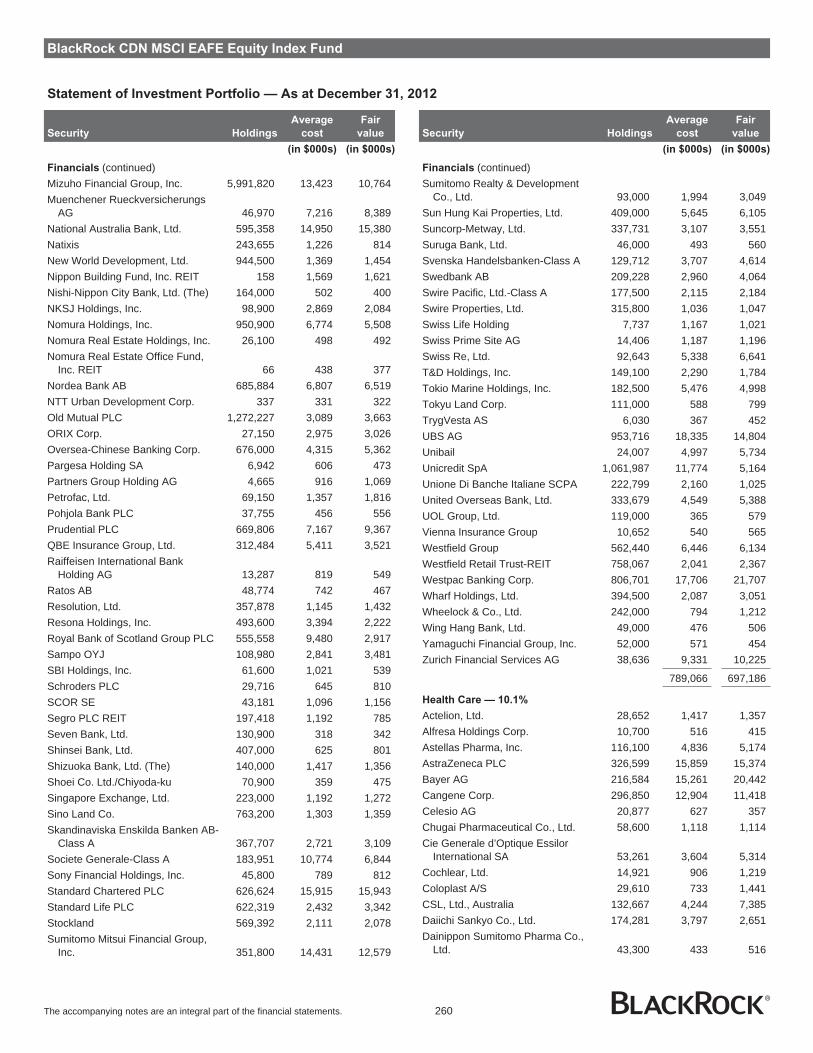
BlackRock CDN MSCI EAFE Equity Index Fund
Statement of Investment Portfolio — As at December 31, 2012
Security Holdings
Average
cost
Fair
value
(in $000s) (in $000s)
Financials (continued)Mizuho Financial Group, Inc. 5,991,820 13,423 10,764Muenchener Rueckversicherungs
AG 46,970 7,216 8,389National Australia Bank, Ltd. 595,358 14,950 15,380Natixis 243,655 1,226 814New World Development, Ltd. 944,500 1,369 1,454Nippon Building Fund, Inc. REIT 158 1,569 1,621Nishi-Nippon City Bank, Ltd. (The) 164,000 502 400NKSJ Holdings, Inc. 98,900 2,869 2,084Nomura Holdings, Inc. 950,900 6,774 5,508Nomura Real Estate Holdings, Inc. 26,100 498 492Nomura Real Estate Office Fund,
Inc. REIT 66 438 377Nordea Bank AB 685,884 6,807 6,519NTT Urban Development Corp. 337 331 322Old Mutual PLC 1,272,227 3,089 3,663ORIX Corp. 27,150 2,975 3,026Oversea-Chinese Banking Corp. 676,000 4,315 5,362Pargesa Holding SA 6,942 606 473Partners Group Holding AG 4,665 916 1,069Petrofac, Ltd. 69,150 1,357 1,816Pohjola Bank PLC 37,755 456 556Prudential PLC 669,806 7,167 9,367QBE Insurance Group, Ltd. 312,484 5,411 3,521Raiffeisen International Bank
Holding AG 13,287 819 549Ratos AB 48,774 742 467Resolution, Ltd. 357,878 1,145 1,432Resona Holdings, Inc. 493,600 3,394 2,222Royal Bank of Scotland Group PLC 555,558 9,480 2,917Sampo OYJ 108,980 2,841 3,481SBI Holdings, Inc. 61,600 1,021 539Schroders PLC 29,716 645 810SCOR SE 43,181 1,096 1,156Segro PLC REIT 197,418 1,192 785Seven Bank, Ltd. 130,900 318 342Shinsei Bank, Ltd. 407,000 625 801Shizuoka Bank, Ltd. (The) 140,000 1,417 1,356Shoei Co. Ltd./Chiyoda-ku 70,900 359 475Singapore Exchange, Ltd. 223,000 1,192 1,272Sino Land Co. 763,200 1,303 1,359Skandinaviska Enskilda Banken AB-
Class A 367,707 2,721 3,109Societe Generale-Class A 183,951 10,774 6,844Sony Financial Holdings, Inc. 45,800 789 812Standard Chartered PLC 626,624 15,915 15,943Standard Life PLC 622,319 2,432 3,342Stockland 569,392 2,111 2,078Sumitomo Mitsui Financial Group,
Inc. 351,800 14,431 12,579
Security Holdings
Average
cost
Fair
value
(in $000s) (in $000s)
Financials (continued)Sumitomo Realty & Development
Co., Ltd. 93,000 1,994 3,049Sun Hung Kai Properties, Ltd. 409,000 5,645 6,105Suncorp-Metway, Ltd. 337,731 3,107 3,551Suruga Bank, Ltd. 46,000 493 560Svenska Handelsbanken-Class A 129,712 3,707 4,614Swedbank AB 209,228 2,960 4,064Swire Pacific, Ltd.-Class A 177,500 2,115 2,184Swire Properties, Ltd. 315,800 1,036 1,047Swiss Life Holding 7,737 1,167 1,021Swiss Prime Site AG 14,406 1,187 1,196Swiss Re, Ltd. 92,643 5,338 6,641T&D Holdings, Inc. 149,100 2,290 1,784Tokio Marine Holdings, Inc. 182,500 5,476 4,998Tokyu Land Corp. 111,000 588 799TrygVesta AS 6,030 367 452UBS AG 953,716 18,335 14,804Unibail 24,007 4,997 5,734Unicredit SpA 1,061,987 11,774 5,164Unione Di Banche Italiane SCPA 222,799 2,160 1,025United Overseas Bank, Ltd. 333,679 4,549 5,388UOL Group, Ltd. 119,000 365 579Vienna Insurance Group 10,652 540 565Westfield Group 562,440 6,446 6,134Westfield Retail Trust-REIT 758,067 2,041 2,367Westpac Banking Corp. 806,701 17,706 21,707Wharf Holdings, Ltd. 394,500 2,087 3,051Wheelock & Co., Ltd. 242,000 794 1,212Wing Hang Bank, Ltd. 49,000 476 506Yamaguchi Financial Group, Inc. 52,000 571 454Zurich Financial Services AG 38,636 9,331 10,225
789,066 697,186
Health Care — 10.1%
Actelion, Ltd. 28,652 1,417 1,357Alfresa Holdings Corp. 10,700 516 415Astellas Pharma, Inc. 116,100 4,836 5,174AstraZeneca PLC 326,599 15,859 15,374Bayer AG 216,584 15,261 20,442Cangene Corp. 296,850 12,904 11,418Celesio AG 20,877 627 357Chugai Pharmaceutical Co., Ltd. 58,600 1,118 1,114Cie Generale d’Optique Essilor
International SA 53,261 3,604 5,314Cochlear, Ltd. 14,921 906 1,219Coloplast A/S 29,610 733 1,441CSL, Ltd., Australia 132,667 4,244 7,385Daiichi Sankyo Co., Ltd. 174,281 3,797 2,651Dainippon Sumitomo Pharma Co.,
Ltd. 43,300 433 516
The accompanying notes are an integral part of the financial statements. 260
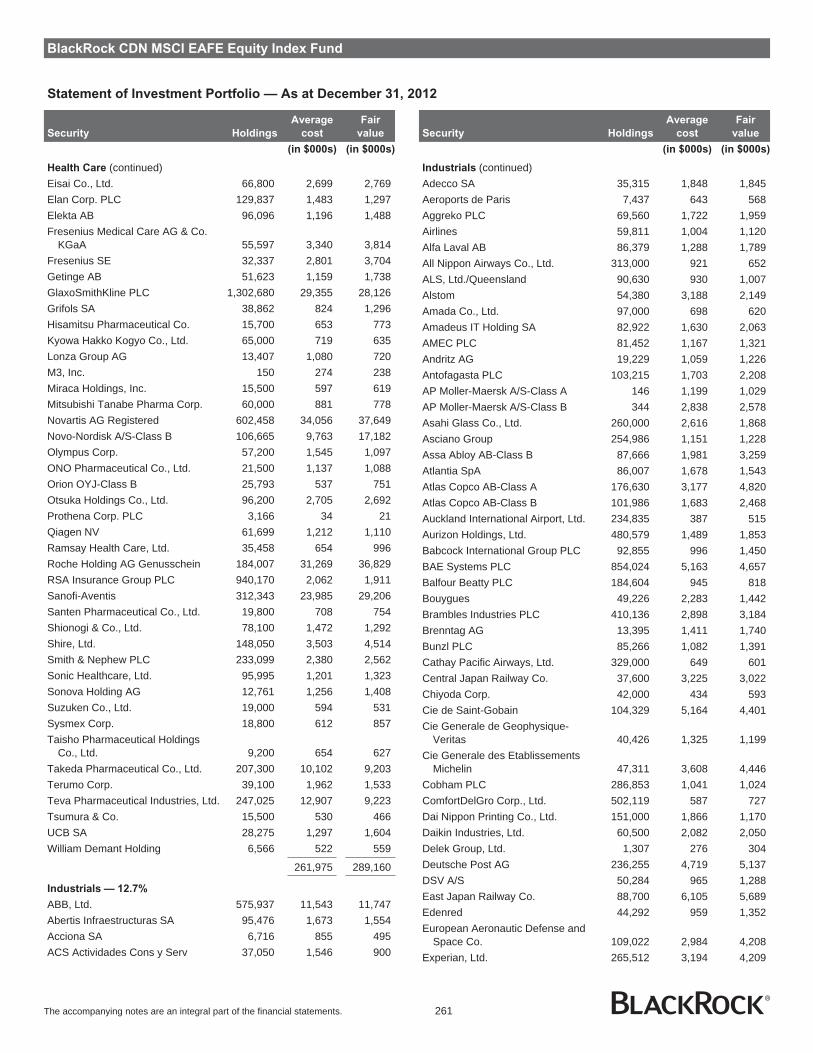
BlackRock CDN MSCI EAFE Equity Index Fund
Statement of Investment Portfolio — As at December 31, 2012
Security Holdings
Average
cost
Fair
value
(in $000s) (in $000s)
Health Care (continued)Eisai Co., Ltd. 66,800 2,699 2,769Elan Corp. PLC 129,837 1,483 1,297Elekta AB 96,096 1,196 1,488Fresenius Medical Care AG & Co.
KGaA 55,597 3,340 3,814Fresenius SE 32,337 2,801 3,704Getinge AB 51,623 1,159 1,738GlaxoSmithKline PLC 1,302,680 29,355 28,126Grifols SA 38,862 824 1,296Hisamitsu Pharmaceutical Co. 15,700 653 773Kyowa Hakko Kogyo Co., Ltd. 65,000 719 635Lonza Group AG 13,407 1,080 720M3, Inc. 150 274 238Miraca Holdings, Inc. 15,500 597 619Mitsubishi Tanabe Pharma Corp. 60,000 881 778Novartis AG Registered 602,458 34,056 37,649Novo-Nordisk A/S-Class B 106,665 9,763 17,182Olympus Corp. 57,200 1,545 1,097ONO Pharmaceutical Co., Ltd. 21,500 1,137 1,088Orion OYJ-Class B 25,793 537 751Otsuka Holdings Co., Ltd. 96,200 2,705 2,692Prothena Corp. PLC 3,166 34 21Qiagen NV 61,699 1,212 1,110Ramsay Health Care, Ltd. 35,458 654 996Roche Holding AG Genusschein 184,007 31,269 36,829RSA Insurance Group PLC 940,170 2,062 1,911Sanofi-Aventis 312,343 23,985 29,206Santen Pharmaceutical Co., Ltd. 19,800 708 754Shionogi & Co., Ltd. 78,100 1,472 1,292Shire, Ltd. 148,050 3,503 4,514Smith & Nephew PLC 233,099 2,380 2,562Sonic Healthcare, Ltd. 95,995 1,201 1,323Sonova Holding AG 12,761 1,256 1,408Suzuken Co., Ltd. 19,000 594 531Sysmex Corp. 18,800 612 857Taisho Pharmaceutical Holdings
Co., Ltd. 9,200 654 627Takeda Pharmaceutical Co., Ltd. 207,300 10,102 9,203Terumo Corp. 39,100 1,962 1,533Teva Pharmaceutical Industries, Ltd. 247,025 12,907 9,223Tsumura & Co. 15,500 530 466UCB SA 28,275 1,297 1,604William Demant Holding 6,566 522 559
261,975 289,160
Industrials — 12.7%
ABB, Ltd. 575,937 11,543 11,747Abertis Infraestructuras SA 95,476 1,673 1,554Acciona SA 6,716 855 495ACS Actividades Cons y Serv 37,050 1,546 900
Security Holdings
Average
cost
Fair
value
(in $000s) (in $000s)
Industrials (continued)Adecco SA 35,315 1,848 1,845Aeroports de Paris 7,437 643 568Aggreko PLC 69,560 1,722 1,959Airlines 59,811 1,004 1,120Alfa Laval AB 86,379 1,288 1,789All Nippon Airways Co., Ltd. 313,000 921 652ALS, Ltd./Queensland 90,630 930 1,007Alstom 54,380 3,188 2,149Amada Co., Ltd. 97,000 698 620Amadeus IT Holding SA 82,922 1,630 2,063AMEC PLC 81,452 1,167 1,321Andritz AG 19,229 1,059 1,226Antofagasta PLC 103,215 1,703 2,208AP Moller-Maersk A/S-Class A 146 1,199 1,029AP Moller-Maersk A/S-Class B 344 2,838 2,578Asahi Glass Co., Ltd. 260,000 2,616 1,868Asciano Group 254,986 1,151 1,228Assa Abloy AB-Class B 87,666 1,981 3,259Atlantia SpA 86,007 1,678 1,543Atlas Copco AB-Class A 176,630 3,177 4,820Atlas Copco AB-Class B 101,986 1,683 2,468Auckland International Airport, Ltd. 234,835 387 515Aurizon Holdings, Ltd. 480,579 1,489 1,853Babcock International Group PLC 92,855 996 1,450BAE Systems PLC 854,024 5,163 4,657Balfour Beatty PLC 184,604 945 818Bouygues 49,226 2,283 1,442Brambles Industries PLC 410,136 2,898 3,184Brenntag AG 13,395 1,411 1,740Bunzl PLC 85,266 1,082 1,391Cathay Pacific Airways, Ltd. 329,000 649 601Central Japan Railway Co. 37,600 3,225 3,022Chiyoda Corp. 42,000 434 593Cie de Saint-Gobain 104,329 5,164 4,401Cie Generale de Geophysique-
Veritas 40,426 1,325 1,199Cie Generale des Etablissements
Michelin 47,311 3,608 4,446Cobham PLC 286,853 1,041 1,024ComfortDelGro Corp., Ltd. 502,119 587 727Dai Nippon Printing Co., Ltd. 151,000 1,866 1,170Daikin Industries, Ltd. 60,500 2,082 2,050Delek Group, Ltd. 1,307 276 304Deutsche Post AG 236,255 4,719 5,137DSV A/S 50,284 965 1,288East Japan Railway Co. 88,700 6,105 5,689Edenred 44,292 959 1,352European Aeronautic Defense and
Space Co. 109,022 2,984 4,208Experian, Ltd. 265,512 3,194 4,209
The accompanying notes are an integral part of the financial statements. 261

BlackRock CDN MSCI EAFE Equity Index Fund
Statement of Investment Portfolio — As at December 31, 2012
Security Holdings
Average
cost
Fair
value
(in $000s) (in $000s)
Industrials (continued)Fanuc, Ltd. 50,100 6,242 9,179Ferrovial SA 105,074 1,240 1,542Fiat Industrial SpA 223,624 2,500 2,422Finmeccanica SpA 105,343 1,465 602Fraport AG 10,248 614 590Fraser and Neave, Ltd. 245,745 1,038 1,939Fuji Electric Holdings Co., Ltd. 158,000 456 384Furukawa Electric Co., Ltd. (The) 178,000 706 394GEA Group AG 45,166 1,226 1,451Geberit AG 9,643 1,698 2,112Genting International PLC 1,627,600 1,548 1,831Hankyu Holdings, Inc. 295,000 1,489 1,512Hexagon AB 61,487 1,141 1,535Hino Motors, Ltd. 67,000 370 596Hitachi Construction Machinery
Co., Ltd. 27,300 602 563Hitachi High-Technologies Corp. 16,200 360 331Hochtief AG 8,640 565 496Hopewell Holdings, Ltd. 148,000 485 629Hutchison Port Holdings Trust-UNIT 1,374,000 1,163 1,074Hutchison Whampoa, Ltd. 556,000 5,086 5,775IHI Corp. 335,000 729 853IMI PLC 84,552 1,195 1,496Independent Tankers Corp., Ltd. 1 - -International Consolidated Airlines
Group SA 248,658 904 721Intertek Group PLC 42,087 1,311 2,108Invensys PLC 212,581 942 1,118Itochu Corp. 391,200 3,636 4,081Japan Airlines Co., Ltd. 16,059 732 684Japan Steel Works, Ltd. (The) 86,000 824 552JGC Corp. 54,000 1,247 1,663JS Group Corp. 68,700 1,384 1,517JTEKT Corp. 57,500 758 538Kajima Corp. 214,000 693 700Kamigumi Co., Ltd. 64,000 543 506Kawasaki Heavy Industries, Ltd. 379,000 1,122 1,013Keihin Electric Express Railway
Co., Ltd. 124,000 1,029 1,091Keio Corp. 153,000 1,001 1,131Keisei Electric Railway Co., Ltd. 74,000 519 620Keppel Corp., Ltd. 373,900 2,531 3,350Kinden Corp. 39,000 320 251Kintetsu Corp. 418,000 1,586 1,699Komatsu, Ltd. 244,200 5,633 6,136Kone OYJ 41,210 1,886 3,019Koninklijke Boskalis Westminster NV 20,369 883 909Koninklijke Vopak NV 18,269 865 1,274Kubota Corp. 290,000 2,570 3,289Kuehne & Nagel International AG 13,893 1,445 1,662
Security Holdings
Average
cost
Fair
value
(in $000s) (in $000s)
Industrials (continued)Kurita Water Industries, Ltd. 30,000 852 653Legrand SA 61,898 2,082 2,586Leighton Holdings, Ltd. 38,477 1,064 710Marubeni Corp. 437,000 2,767 3,080Medipal Holdings Corp. 37,200 505 408Meggitt PLC 202,127 1,233 1,250Melrose Industries PLC 315,686 1,136 1,142Metso OYJ 33,408 1,260 1,405Mitsubishi Corp. 369,200 8,663 6,994Mitsubishi Electric Corp. 503,000 4,464 4,223Mitsubishi Heavy Industries, Ltd. 796,000 3,448 3,795Mitsubishi Logistics Corp. 32,000 388 454Mitsui & Co., Ltd. 457,600 7,304 6,756Mitsui OSK Lines, Ltd. 292,000 1,919 851MTR Corp. 374,000 1,263 1,463Nabtesco Corp. 27,800 569 611NGK Insulators, Ltd. 68,000 1,166 795Nippon Express Co., Ltd. 230,000 1,036 938Nippon Yusen KK 437,000 1,780 1,006Noble Group, Ltd. 1,031,326 1,269 971NSK, Ltd. 112,000 821 784NWS Holdings, Ltd. 388,500 607 648Obayashi Corp. 172,000 823 959Odakyu Electric Railway Co., Ltd. 161,000 1,404 1,665Orient Overseas International, Ltd. 58,000 340 373Orkla ASA 198,613 1,861 1,720Otsuka Corp. 3,900 315 292Park24 Co., Ltd. 23,700 397 373Qantas Airways, Ltd. 291,030 623 448Randstad Holdings NV 31,903 1,287 1,158Rexel SA 27,662 505 558Rolls Royce Holdings PLC 491,757 4,786 6,944Ryanair Holdings PLC 4,042 20 25Ryanair Holdings PLC,
Sponsored ADR 5,948 201 203Safran SA 59,917 1,771 2,556Sandvik AB 261,041 3,494 4,135Scania AB-Class B 82,587 1,339 1,698Schindler Holding AG 12,497 1,126 1,793Schindler Holding AG-REG 5,401 489 759Schneider Electric SA 137,647 8,028 9,898Secom Co., Ltd. 54,400 2,648 2,713Securitas AB-Class B 79,355 904 686SembCorp Industries, Ltd. 258,736 837 1,107SembCorp Marine, Ltd. 223,581 673 838Serco Group PLC 129,884 1,081 1,125SGS SA 1,426 2,200 3,143Shimadzu Corp. 61,000 532 411Shimizu Corp. 162,000 713 603
The accompanying notes are an integral part of the financial statements. 262
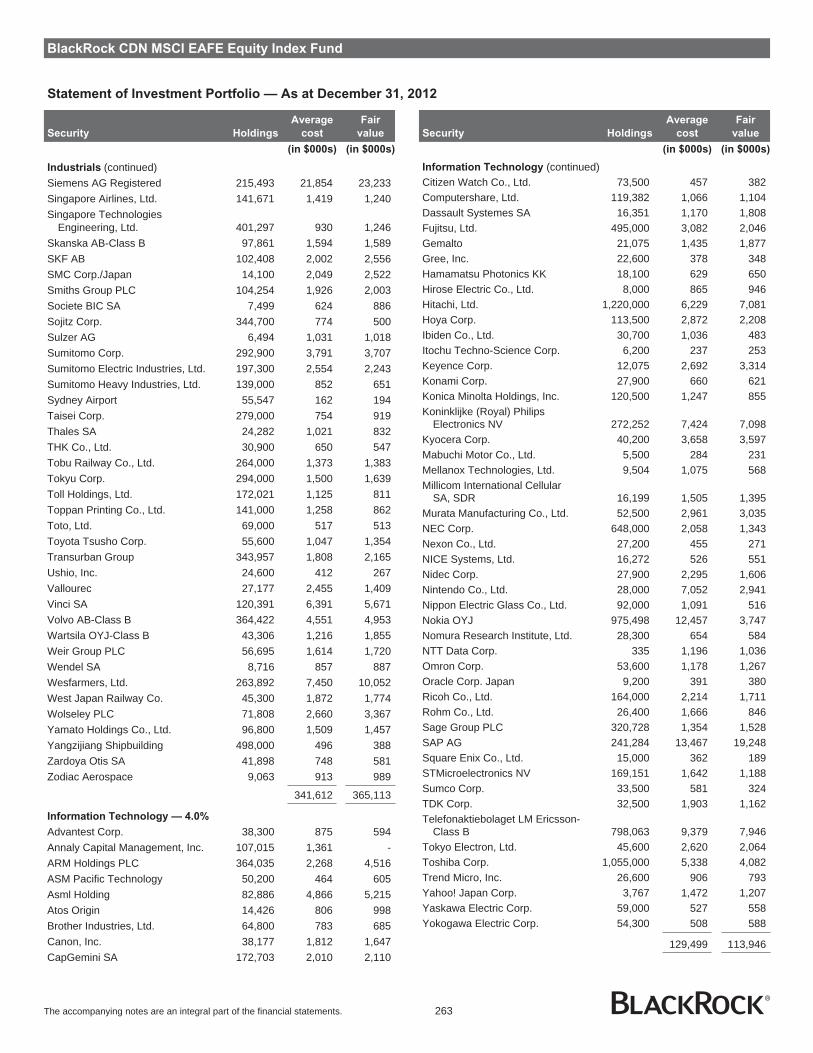
BlackRock CDN MSCI EAFE Equity Index Fund
Statement of Investment Portfolio — As at December 31, 2012
Security Holdings
Average
cost
Fair
value
(in $000s) (in $000s)
Industrials (continued)Siemens AG Registered 215,493 21,854 23,233Singapore Airlines, Ltd. 141,671 1,419 1,240Singapore Technologies
Engineering, Ltd. 401,297 930 1,246Skanska AB-Class B 97,861 1,594 1,589SKF AB 102,408 2,002 2,556SMC Corp./Japan 14,100 2,049 2,522Smiths Group PLC 104,254 1,926 2,003Societe BIC SA 7,499 624 886Sojitz Corp. 344,700 774 500Sulzer AG 6,494 1,031 1,018Sumitomo Corp. 292,900 3,791 3,707Sumitomo Electric Industries, Ltd. 197,300 2,554 2,243Sumitomo Heavy Industries, Ltd. 139,000 852 651Sydney Airport 55,547 162 194Taisei Corp. 279,000 754 919Thales SA 24,282 1,021 832THK Co., Ltd. 30,900 650 547Tobu Railway Co., Ltd. 264,000 1,373 1,383Tokyu Corp. 294,000 1,500 1,639Toll Holdings, Ltd. 172,021 1,125 811Toppan Printing Co., Ltd. 141,000 1,258 862Toto, Ltd. 69,000 517 513Toyota Tsusho Corp. 55,600 1,047 1,354Transurban Group 343,957 1,808 2,165Ushio, Inc. 24,600 412 267Vallourec 27,177 2,455 1,409Vinci SA 120,391 6,391 5,671Volvo AB-Class B 364,422 4,551 4,953Wartsila OYJ-Class B 43,306 1,216 1,855Weir Group PLC 56,695 1,614 1,720Wendel SA 8,716 857 887Wesfarmers, Ltd. 263,892 7,450 10,052West Japan Railway Co. 45,300 1,872 1,774Wolseley PLC 71,808 2,660 3,367Yamato Holdings Co., Ltd. 96,800 1,509 1,457Yangzijiang Shipbuilding 498,000 496 388Zardoya Otis SA 41,898 748 581Zodiac Aerospace 9,063 913 989
341,612 365,113
Information Technology — 4.0%
Advantest Corp. 38,300 875 594Annaly Capital Management, Inc. 107,015 1,361 -ARM Holdings PLC 364,035 2,268 4,516ASM Pacific Technology 50,200 464 605Asml Holding 82,886 4,866 5,215Atos Origin 14,426 806 998Brother Industries, Ltd. 64,800 783 685Canon, Inc. 38,177 1,812 1,647CapGemini SA 172,703 2,010 2,110
Security Holdings
Average
cost
Fair
value
(in $000s) (in $000s)
Information Technology (continued)Citizen Watch Co., Ltd. 73,500 457 382Computershare, Ltd. 119,382 1,066 1,104Dassault Systemes SA 16,351 1,170 1,808Fujitsu, Ltd. 495,000 3,082 2,046Gemalto 21,075 1,435 1,877Gree, Inc. 22,600 378 348Hamamatsu Photonics KK 18,100 629 650Hirose Electric Co., Ltd. 8,000 865 946Hitachi, Ltd. 1,220,000 6,229 7,081Hoya Corp. 113,500 2,872 2,208Ibiden Co., Ltd. 30,700 1,036 483Itochu Techno-Science Corp. 6,200 237 253Keyence Corp. 12,075 2,692 3,314Konami Corp. 27,900 660 621Konica Minolta Holdings, Inc. 120,500 1,247 855Koninklijke (Royal) Philips
Electronics NV 272,252 7,424 7,098Kyocera Corp. 40,200 3,658 3,597Mabuchi Motor Co., Ltd. 5,500 284 231Mellanox Technologies, Ltd. 9,504 1,075 568Millicom International Cellular
SA, SDR 16,199 1,505 1,395Murata Manufacturing Co., Ltd. 52,500 2,961 3,035NEC Corp. 648,000 2,058 1,343Nexon Co., Ltd. 27,200 455 271NICE Systems, Ltd. 16,272 526 551Nidec Corp. 27,900 2,295 1,606Nintendo Co., Ltd. 28,000 7,052 2,941Nippon Electric Glass Co., Ltd. 92,000 1,091 516Nokia OYJ 975,498 12,457 3,747Nomura Research Institute, Ltd. 28,300 654 584NTT Data Corp. 335 1,196 1,036Omron Corp. 53,600 1,178 1,267Oracle Corp. Japan 9,200 391 380Ricoh Co., Ltd. 164,000 2,214 1,711Rohm Co., Ltd. 26,400 1,666 846Sage Group PLC 320,728 1,354 1,528SAP AG 241,284 13,467 19,248Square Enix Co., Ltd. 15,000 362 189STMicroelectronics NV 169,151 1,642 1,188Sumco Corp. 33,500 581 324TDK Corp. 32,500 1,903 1,162Telefonaktiebolaget LM Ericsson-
Class B 798,063 9,379 7,946Tokyo Electron, Ltd. 45,600 2,620 2,064Toshiba Corp. 1,055,000 5,338 4,082Trend Micro, Inc. 26,600 906 793Yahoo! Japan Corp. 3,767 1,472 1,207Yaskawa Electric Corp. 59,000 527 558Yokogawa Electric Corp. 54,300 508 588
129,499 113,946
The accompanying notes are an integral part of the financial statements. 263

BlackRock CDN MSCI EAFE Equity Index Fund
Statement of Investment Portfolio — As at December 31, 2012
Security Holdings
Average
cost
Fair
value
(in $000s) (in $000s)
Materials — 10.3%
Air Liquide 81,832 8,624 10,205Akzo Nobel NV 62,430 3,678 4,064Alumina, Ltd. 654,601 1,113 609Amcor, Ltd. 314,962 2,000 2,627ArcelorMittal 243,725 8,705 4,127Arkema SA 16,036 1,511 1,667Asahi Kasei Corp. 335,000 1,927 1,956Aurizon Mines, Ltd. 711,347 15,076 18,391BASF SE 240,557 15,832 22,509BHP Billiton PLC 553,168 16,725 19,066BHP Billiton, Ltd. 844,519 29,720 32,389Boliden AB 71,444 996 1,334Boral, Ltd. 204,776 943 921CRH PLC 188,795 4,542 3,775Croda International PLC 35,244 1,264 1,355Daicel Chemical Industries, Ltd. 82,000 536 533Daido Steel Co., Ltd. 73,000 420 364Denki Kagaku Kogyo KK 110,000 456 370EMS-Chemie Holding AG 2,003 469 466Eurasian Natural Resources 61,332 930 282Evraz PLC 93,812 428 392Fletcher Building, Ltd. 180,555 1,063 1,240Fortescue Metals Group, Ltd. 362,211 1,722 1,734Fresnillo PLC 46,605 834 1,392GDF Suez 334,537 13,395 6,833Givaudan 2,173 1,964 2,276Glencore International PLC 995,184 6,400 5,654Heidelbergcement AG 37,173 2,254 2,229Hitachi Chemical Co., Ltd. 26,700 532 397Hitachi Metals, Ltd. 40,000 482 336Holcim, Ltd. 59,507 4,104 4,324Iluka Resources, Ltd. 109,995 1,731 1,026Imerys SA 8,787 547 554Incitec Pivot, Ltd. 424,705 1,627 1,414Israel Chemicals, Ltd. 115,168 1,399 1,371Israel Corp., Ltd. 640 481 427James Hardie Industries NV 116,178 780 1,095JFE Holdings, Inc. 129,700 4,017 2,393Johnson Matthey PLC 54,082 1,656 2,077JSR Corp. 47,700 958 899K+S AG 45,439 2,722 2,077Kaneka Corp. 67,000 494 336Kansai Paint Co., Ltd. 55,000 487 586Kazakhmys PLC 56,594 1,092 711Kobe Steel, Ltd. 669,000 1,348 840Koninklijke DSM 40,305 1,967 2,417Kuraray Co., Ltd. 90,900 1,157 1,177Lafarge SA 49,457 3,407 3,126Lanxess AG 22,127 1,583 1,925
Security Holdings
Average
cost
Fair
value
(in $000s) (in $000s)
Materials (continued)Linde AG 48,453 6,472 8,390Maruichi Steel Tube, Ltd. 10,900 256 248Mitsubishi Chemical Holdings Corp. 353,000 1,986 1,728Mitsubishi Gas Chemical Co., Inc. 107,000 691 644Mitsubishi Materials Corp. 295,000 990 989Mitsui Chemicals, Inc. 235,000 822 603Newcrest Mining, Ltd. 200,141 6,373 4,589Nippon Paper Group, Inc. 27,800 695 380Nippon Steel Corp. 1,997,340 7,342 4,830Nitto Denko Corp. 43,500 1,907 2,109Norsk Hydro ASA 245,403 2,035 1,218Novozymes AS 64,999 1,550 1,821Oji Paper Co., Ltd. 215,000 1,029 733Olam International, Ltd. 131,595 - -Orica, Ltd. 95,020 2,199 2,462OZ Minerals, Ltd. 79,343 1,130 550Prysmian SpA 54,070 985 1,065Randgold Resources, Ltd. 22,793 2,008 2,191Rexam PLC 225,383 1,349 1,590Rio Tinto PLC 351,083 19,451 19,948Rio Tinto, Ltd. 114,300 7,579 7,799Salzgitter AG 10,699 896 555Shin-Etsu Chemical Co., Ltd. 108,100 6,071 6,511Showa Denko KK 396,000 843 593Sika AG 564 1,001 1,294Sims Group, Ltd. 44,888 796 429Solvay SA 15,672 1,806 2,250Stora Enso OYJ-Class R 142,945 1,301 983Sumitomo Chemical Co., Ltd. 392,000 1,914 1,210Sumitomo Metal Mining Co., Ltd. 140,000 2,068 1,944Svenska Cellulosa AB-Class B 152,906 2,276 3,300Syngenta AG 24,390 6,760 9,726Taiheiyo Cement Corp. 305,000 659 825Taiyo Nippon Sanso Corp. 62,000 519 353Teijin, Ltd. 254,000 935 620ThyssenKrupp AG 101,002 3,352 2,362Toray Industries, Inc. 384,000 2,453 2,326Toyo Seikan Kaisha, Ltd. 41,500 693 550Ube Industries, Ltd. 256,000 750 607Umicore 29,379 1,158 1,608UPM-Kymmene OYJ 135,368 2,033 1,564Vedanta Resources PLC 26,730 860 500Voestalpine AG 29,632 1,159 1,075Xstrata PLC 552,499 9,402 9,452Yara International ASA 48,782 2,119 2,384
294,771 295,176
Telecommunication
Services — 4.7%
Belgacom SA 39,792 1,473 1,157Bezeq Israeli Telecommunication
Corp., Ltd. 485,966 1,046 554
The accompanying notes are an integral part of the financial statements. 264

BlackRock CDN MSCI EAFE Equity Index Fund
Statement of Investment Portfolio — As at December 31, 2012
Security Holdings
Average
cost
Fair
value
(in $000s) (in $000s)
Telecommunication Services (continued)BT Group PLC 2,064,797 6,562 7,723Deutsche Telekom AG 735,661 10,684 8,312Elisa OYJ-Class A 35,714 793 783Eurazeo 7,457 480 352Eutelsat Communications 34,959 1,197 1,151France Telecom SA 485,633 11,057 5,304HKT Trust / HKT, Ltd. 625,000 593 605Iliad SA 6,044 724 1,028Inmarsat PLC 115,009 1,158 1,082KDDI Corp. 70,400 4,474 4,929Koninklijke KPN 269,555 3,644 1,314Nippon Telegraph & Telephone
Corp. 114,300 5,505 4,771NTT DoCoMo, Inc. 3,987 6,792 5,693PCCW, Ltd. 1,129,000 411 493Portugal Telecom SGPS SA 167,955 1,591 823SES 80,756 1,981 2,295Singapore Telecommunications,
Ltd. 2,082,572 5,023 5,602Softbank Corp. 248,100 7,277 8,957Starhub, Ltd. 169,000 367 519Swisscom AG 6,074 2,358 2,602TDC A/S 133,220 1,079 938Tele2 AB-Class B 82,044 1,393 1,470Telecom Corp. of New
Zealand, Ltd. 476,241 1,042 884Telecom Italia SpA 2,455,512 4,063 2,202Telecom Italia SpA-RNC 1,561,321 2,095 1,225Telefonica SA 1,072,755 23,356 14,223Telekom Austria AG 61,312 932 460Telenet Group Holding 14,145 600 659Telenor ASA 183,424 2,783 3,676TeliaSonera AB 563,045 3,991 3,797Telstra Corp., Ltd. 1,140,624 3,885 5,153United Internet AG 23,770 398 508Vodafone Group PLC 12,879,032 34,611 32,184Ziggo 32,324 1,008 1,046
156,426 134,474
Utilities — 3.6%
AGL Energy, Ltd. 142,798 1,981 2,267Air Water, Inc. 38,000 482 481APA Group 220,939 1,186 1,258Centrica PLC 1,361,036 6,652 7,349Cheung Kong Infrastructure
Holdings, Ltd. 132,000 651 804Chubu Electric Power Co., Inc. 170,400 3,773 2,245Chugoku Electric Power Co. 78,500 1,534 1,221CLP Holdings, Ltd. 469,000 3,777 3,904Contact Energy, Ltd. 88,924 391 376
Security Holdings
Average
cost
Fair
value
(in $000s) (in $000s)
Utilities (continued)E.ON AG 473,509 16,964 8,752EDF SA 62,692 3,309 1,148EDP-Energias de Portugal SA 495,217 1,909 1,483Electric Power Development Co. 29,220 931 689Electricite de France 62,006 1,296 1,617Enagas 48,661 1,100 1,021Enel Green Power SpA 446,390 960 823Enel SpA 1,730,987 10,105 7,131Fortum OYJ 116,253 3,153 2,158Gas Natural SDG SA 89,996 1,685 1,589Hokkaido Electric Power Co., Inc. 50,100 959 602Hokuriku Electric Power Co. 45,900 993 540Hong Kong & China Gas 1,364,317 2,674 3,689Hongkong Electric Holdings, Ltd. 366,000 2,439 3,103Iberdrola SA 1,039,525 8,542 5,622Kansai Electric Power Co. (The), Inc. 194,400 4,105 2,024Kyushu Electric Power Co., Inc. 113,200 2,172 1,280National Grid PLC 952,810 9,756 10,834Osaka Gas Co., Ltd. 496,000 1,939 1,788Red Electrica de Espana 28,069 1,443 1,365RWE AG 128,173 9,076 5,252RWE AG Preferred 10,750 634 401Scottish & Southern Energy PLC 246,760 5,310 5,659Severn Trent PLC 63,801 1,492 1,625Shikoku Electric Power Co. 42,000 1,146 663Snam SpA 437,384 2,211 2,018SP Ausnet 453,281 421 520Suez Environnement SA 72,965 1,495 869Terna SpA 342,959 1,322 1,361Toho Gas Co., Ltd. 110,000 624 585Tohoku Electric Power Co., Inc. 119,900 2,167 1,109Tokyo Electric Power Co. (The), Inc. 391,500 7,001 924Tokyo Gas Co., Ltd. 648,000 2,990 2,940United Utilities Group PLC 180,122 2,038 1,961Veolia Environnement SA 89,831 2,895 1,080Verbund-Oesterreichische
Elektrizitaetswirtschafts AG-Class A 19,209 686 477
138,369 104,607
Total Common Stocks 2,902,817 2,844,716
Transaction Costs (Note 2) (799)
Total Investments 2,902,018 2,844,716
Other Assets and Liabilities — 0.9% 25,295
Net Assets 2,870,011
The accompanying notes are an integral part of the financial statements. 265

BlackRock CDN MSCI EAFE Equity Index Fund
Statement of Investment Portfolio — As at December 31, 2012
Portfolio Concentration
(as a percentage of Net Assets)
Portfolio by Category
As at
December 31, 2012
As at
December 31, 2011
(%) (%)
Consumer Discretionary 11.5 10.8Consumer Staples 10.5 10.7Energy 7.4 9.0Financials 24.3 21.3Health Care 10.1 10.4Industrials 12.7 12.6Information Technology 4.0 4.2Materials 10.3 10.4Telecommunication
Services 4.7 5.7Utilities 3.6 4.2Other Assets and Liabilities 0.9 0.7
Open futures contracts held by the Fund as at December 31, 2012 areshown in Note 4.
The accompanying notes are an integral part of the financial statements. 266

BlackRock CDN MSCI EAFE Index Hedged Fund
Statement of Net Assets — As at December 31
2012 2011
Assets
Investments - at fair value (Note 2) $ 191,584,556 $ 395,006,493Cash 8,559 10,111Net unrealized gain on forward currency contracts (Note 5) 2,529,407 28,858,651Accounts receivable from issue of units 17,482,600 1,589,876
211,605,122 425,465,131
Liabilities
Operating expenses payable 16,286 18,084Payables for redemption of units 1,194,295 546,524Payables for investment purchases 16,125,605 11,497,239Net unrealized loss on forward currency contracts (Note 5) 2,744,481 17,469,591
20,080,667 29,531,438
Net Assets $ 191,524,455 $ 395,933,693
Number of Units Issued and Outstanding (Note 8) 17,384,198 42,310,162
Net Assets per Unit $ 11.02 $ 9.36
Investments at Cost $ 195,155,167 $ 458,429,410
Approved by BlackRock Asset Management Canada Limited,Manager of the Funds
Eric Léveillé, Director Noel Archard, Director
The accompanying notes are an integral part of the financial statements. 267

BlackRock CDN MSCI EAFE Index Hedged Fund
Statement of Operations — For the Years Ended December 31
2012 2011
Revenue
Dividend income $ 4,963,215 $ 12,285,642Interest income 360 579
4,963,575 12,286,221
Expenses
Custodian fees 2,885 2,488Fund accounting expenses 11,649 13,303Unitholder communication costs - 601Audit fees 13,882 14,539Securities filing fees 3,548 5,530Independent review committee fees 124 396Other operating expenses 1,097 2,225
33,185 39,082
Net Investment Income for the Year 4,930,390 12,247,139
Gain (Loss) on Investments
Net realized loss on sale of investments (48,833,002) (4,031,077)Net realized gain (loss) from forward currency contracts 18,584,100 (15,701,806)Net change in unrealized appreciation (depreciation) in value of investments 59,852,306 (45,106,137)Net change in unrealized appreciation (depreciation) in value of forward currency contracts (11,604,134) 5,979,056
Net Gain (Loss) on Investments 17,999,270 (58,859,964)
Increase (Decrease) in Net Assets from Operations $ 22,929,660 $ (46,612,825)
Increase (Decrease) in Net Assets from Operations per Unit $ 0.88 $ (1.27)
Statement of Changes in Net Assets — For the Years Ended December 31
2012 2011
Net Assets - Beginning of Year $ 395,933,693 $ 384,981,710
Increase (Decrease) in Net Assets from Operations 22,929,660 (46,612,825)
Capital Transactions
Proceeds from issue of units 54,582,238 157,361,273Reinvestment of distributions 4,930,493 12,247,055Redemption of units (281,921,136) (99,796,465)
Net capital transactions (222,408,405) 69,811,863
Distributions
From net investment income (4,930,493) (12,247,055)
Total distributions (4,930,493) (12,247,055)
Increase (Decrease) in Net Assets for the Year (204,409,238) 10,951,983
Net Assets - End of Year $ 191,524,455 $ 395,933,693
The accompanying notes are an integral part of the financial statements. 268

BlackRock CDN MSCI EAFE Index Hedged Fund
Statement of Investment Portfolio — As at December 31, 2012
Security Holdings
Average
cost
Fair
value
(in $000s) (in $000s)
Foreign Index
Equivalents — 100.0%
BlackRock CDN MSCI EAFEEquity Index Class A 18,920,999 195,155 191,585
Total Foreign Index Equivalents 195,155 191,585
Total Investments 195,155 191,585
Other Assets and Liabilities — 0.0% (61)
Net Assets 191,524
Portfolio Concentration
(as a percentage of Net Assets)
Portfolio by Category
As at
December 31, 2012
As at
December 31, 2011
(%) (%)
Foreign Index Equivalents 100.0 99.8Other Assets and Liabilities - 0.2
Open forward currency contracts held by the Fund as at December 31,2012 are shown in Note 5.
The accompanying notes are an integral part of the financial statements. 269

BlackRock CDN MSCI ACWI ex-Canada Index Fund
Statement of Net Assets — As at December 31
2012 2011
Assets
Investments - at fair value (Note 2) $ 369,997,565 $ 130,114,562Cash 675,139 260,270Dividends receivable 13,990 –Accounts receivable from issue of units 21,563 4,488
370,708,257 130,379,320
Liabilities
Operating expenses payable 12,216 11,421Payables for redemption of units 137,920 70,098
150,136 81,519
Net Assets $ 370,558,121 $ 130,297,801
Number of Units Issued and Outstanding (Note 8) 39,683,201 15,930,393
Net Assets per Unit $ 9.34 $ 8.18
Investments at Cost $ 354,403,127 $ 139,507,448
Approved by BlackRock Asset Management Canada Limited,Manager of the Funds
Eric Léveillé, Director Noel Archard, Director
The accompanying notes are an integral part of the financial statements. 270
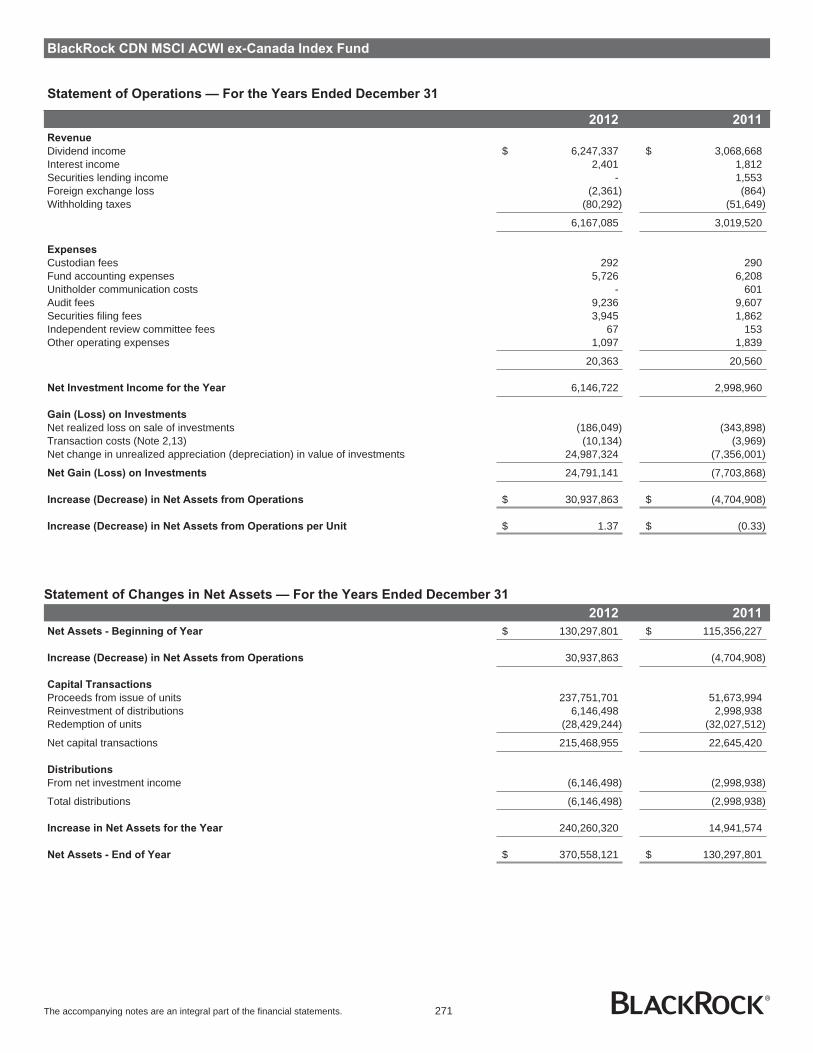
BlackRock CDN MSCI ACWI ex-Canada Index Fund
Statement of Operations — For the Years Ended December 31
2012 2011
Revenue
Dividend income $ 6,247,337 $ 3,068,668Interest income 2,401 1,812Securities lending income - 1,553Foreign exchange loss (2,361) (864)Withholding taxes (80,292) (51,649)
6,167,085 3,019,520
Expenses
Custodian fees 292 290Fund accounting expenses 5,726 6,208Unitholder communication costs - 601Audit fees 9,236 9,607Securities filing fees 3,945 1,862Independent review committee fees 67 153Other operating expenses 1,097 1,839
20,363 20,560
Net Investment Income for the Year 6,146,722 2,998,960
Gain (Loss) on Investments
Net realized loss on sale of investments (186,049) (343,898)Transaction costs (Note 2,13) (10,134) (3,969)Net change in unrealized appreciation (depreciation) in value of investments 24,987,324 (7,356,001)
Net Gain (Loss) on Investments 24,791,141 (7,703,868)
Increase (Decrease) in Net Assets from Operations $ 30,937,863 $ (4,704,908)
Increase (Decrease) in Net Assets from Operations per Unit $ 1.37 $ (0.33)
Statement of Changes in Net Assets — For the Years Ended December 31
2012 2011
Net Assets - Beginning of Year $ 130,297,801 $ 115,356,227
Increase (Decrease) in Net Assets from Operations 30,937,863 (4,704,908)
Capital Transactions
Proceeds from issue of units 237,751,701 51,673,994Reinvestment of distributions 6,146,498 2,998,938Redemption of units (28,429,244) (32,027,512)
Net capital transactions 215,468,955 22,645,420
Distributions
From net investment income (6,146,498) (2,998,938)
Total distributions (6,146,498) (2,998,938)
Increase in Net Assets for the Year 240,260,320 14,941,574
Net Assets - End of Year $ 370,558,121 $ 130,297,801
The accompanying notes are an integral part of the financial statements. 271

BlackRock CDN MSCI ACWI ex-Canada Index Fund
Statement of Investment Portfolio — As at December 31, 2012
Security Holdings
Average
cost
Fair
value
(in $000s) (in $000s)
Foreign Index Equivalents — 99.8%
BlackRock CDN MSCI EAFEEquity Index Class D 14,084,701 139,619 142,588
BlackRock CDN US Equity IndexClass D 20,432,545 167,036 176,011
iShares MSCI Emerging MarketsIndex Fund 1,161,327 47,763 51,399
Total Foreign Index Equivalents 354,418 369,998
Transaction Costs (Note 2) (15)
Total Investments 354,403 369,998
Other Assets and Liabilities — 0.2% 560
Net Assets 370,558
Portfolio Concentration
(as a percentage of Net Assets)
Portfolio by Category
As at
December 31, 2012
As at
December 31, 2011
(%) (%)
Foreign Index Equivalents 99.8 99.9Other Assets and Liabilities 0.2 0.1
The accompanying notes are an integral part of the financial statements. 272

BlackRock CDN MSCI Emerging Markets Index Fund
Statement of Net Assets — As at December 31
2012 2011
Assets
Investments - at fair value (Note 2) $ 370,628,310 $ 265,712,543Cash 1,431,740 397,061Margin due from brokers 423,078 91,715Dividends receivable 433,427 228,966Tax reclaim on dividends receivable 18,427 7,221Accounts receivable from issue of units 188,529 1,468,109
373,123,511 267,905,615
Liabilities
Operating expenses payable 82,826 38,748Payables for redemption of units 190,000 -Payables for investment purchases - 1,488,905
272,826 1,527,653
Net Assets $ 372,850,685 $ 266,377,962
Net Assets per Class
Class A $ 372,850,685 $ 266,377,962
$ 372,850,685 $ 266,377,962
Number of Units Issued and Outstanding (Note 8)
Class A 36,013,636 29,701,499
Net Assets per Unit
Class A $ 10.35 $ 8.97
Investments at Cost $ 365,319,727 $ 300,661,346
Approved by BlackRock Asset Management Canada Limited,Manager of the Funds
Eric Léveillé, Director Noel Archard, Director
The accompanying notes are an integral part of the financial statements. 273
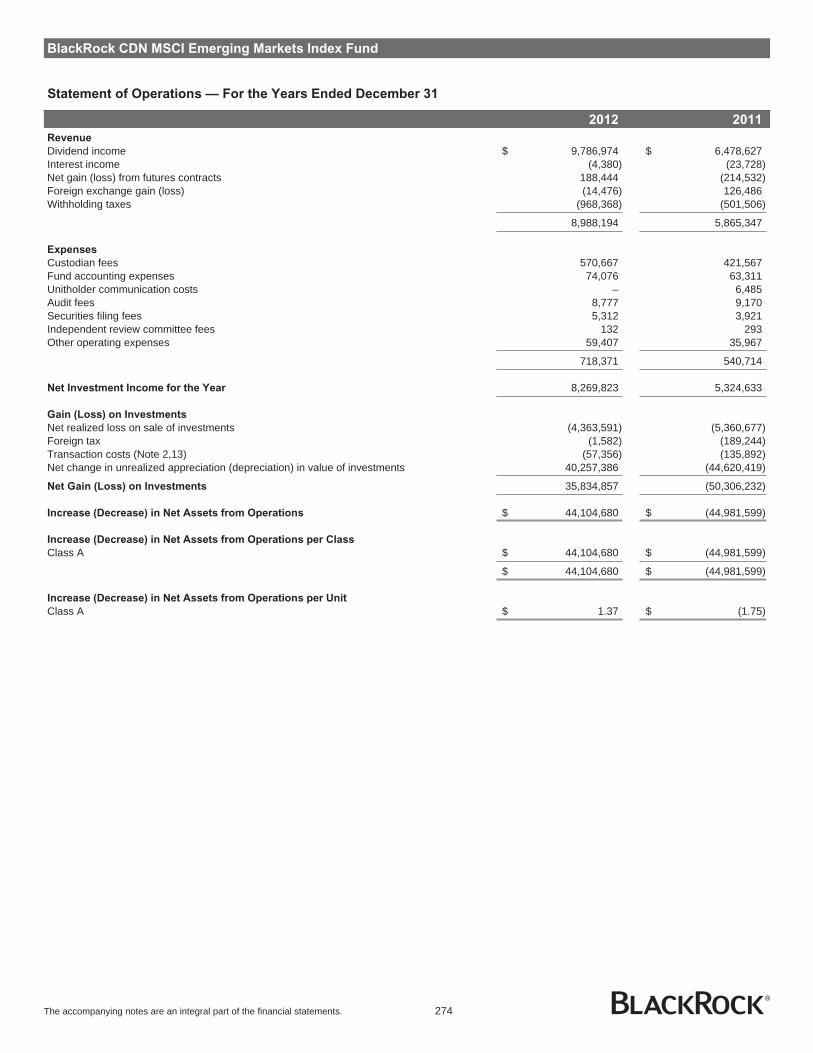
BlackRock CDN MSCI Emerging Markets Index Fund
Statement of Operations — For the Years Ended December 31
2012 2011
Revenue
Dividend income $ 9,786,974 $ 6,478,627Interest income (4,380) (23,728)Net gain (loss) from futures contracts 188,444 (214,532)Foreign exchange gain (loss) (14,476) 126,486Withholding taxes (968,368) (501,506)
8,988,194 5,865,347
Expenses
Custodian fees 570,667 421,567Fund accounting expenses 74,076 63,311Unitholder communication costs – 6,485Audit fees 8,777 9,170Securities filing fees 5,312 3,921Independent review committee fees 132 293Other operating expenses 59,407 35,967
718,371 540,714
Net Investment Income for the Year 8,269,823 5,324,633
Gain (Loss) on Investments
Net realized loss on sale of investments (4,363,591) (5,360,677)Foreign tax (1,582) (189,244)Transaction costs (Note 2,13) (57,356) (135,892)Net change in unrealized appreciation (depreciation) in value of investments 40,257,386 (44,620,419)
Net Gain (Loss) on Investments 35,834,857 (50,306,232)
Increase (Decrease) in Net Assets from Operations $ 44,104,680 $ (44,981,599)
Increase (Decrease) in Net Assets from Operations per Class
Class A $ 44,104,680 $ (44,981,599)
$ 44,104,680 $ (44,981,599)
Increase (Decrease) in Net Assets from Operations per Unit
Class A $ 1.37 $ (1.75)
The accompanying notes are an integral part of the financial statements. 274
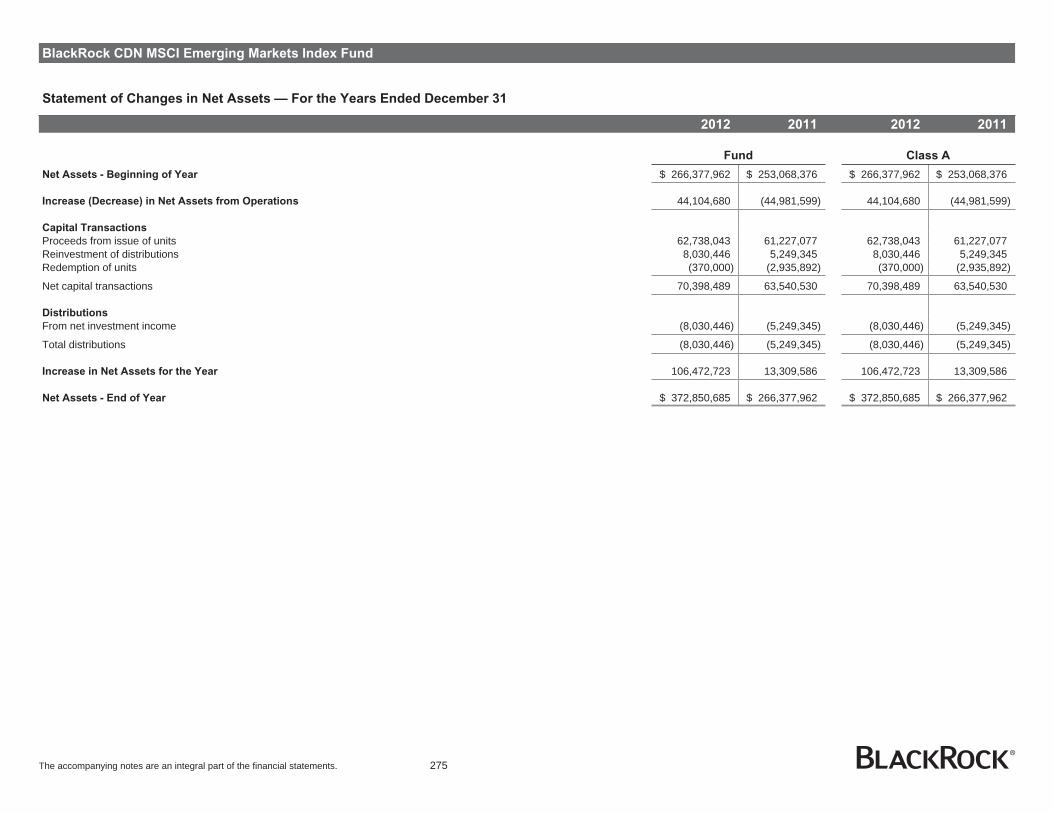
BlackRock CDN MSCI Emerging Markets Index Fund
Statement of Changes in Net Assets — For the Years Ended December 31
2012 2011 2012 2011
Fund Class A
Net Assets - Beginning of Year $ 266,377,962 $ 253,068,376 $ 266,377,962 $ 253,068,376
Increase (Decrease) in Net Assets from Operations 44,104,680 (44,981,599) 44,104,680 (44,981,599)
Capital Transactions
Proceeds from issue of units 62,738,043 61,227,077 62,738,043 61,227,077Reinvestment of distributions 8,030,446 5,249,345 8,030,446 5,249,345Redemption of units (370,000) (2,935,892) (370,000) (2,935,892)
Net capital transactions 70,398,489 63,540,530 70,398,489 63,540,530
Distributions
From net investment income (8,030,446) (5,249,345) (8,030,446) (5,249,345)
Total distributions (8,030,446) (5,249,345) (8,030,446) (5,249,345)
Increase in Net Assets for the Year 106,472,723 13,309,586 106,472,723 13,309,586
Net Assets - End of Year $ 372,850,685 $ 266,377,962 $ 372,850,685 $ 266,377,962
The accompanying notes are an integral part of the financial statements. 275

BlackRock CDN MSCI Emerging Markets Index Fund
Statement of Investment Portfolio — As at December 31, 2012
Security Holdings
Average
cost
Fair
value
(in $000s) (in $000s)
Common Stocks
Consumer Discretionary — 8.0%
Anhanguera EducacionalParticipacoes SA 12,000 250 199
Anta Sports Products, Ltd. 88,000 151 77Arcelik 22,937 114 148Astra International Tbk PT 1,955,500 1,342 1,515AviChina Industry & Technology
Co., Ltd. 200,000 114 87Bajaj Auto, Ltd. 8,115 254 314BEC World PCL 81,300 104 106BEC World PCL NVDR 15,200 30 35Belle International Holdings, Ltd. 448,000 863 961Berjaya Sports Toto Bhd. 64,000 89 92Bosideng International Holdings, Ltd. 270,000 113 79Brilliance China Automotive
Holdings, Ltd. 240,000 242 295BYD Co., Ltd. 49,500 234 147Cheil Worldwide, Inc. 9,070 177 182Cheng Shin Rubber Industry
Co., Ltd. 177,460 368 458China Motor Corp. 51,000 48 48Cia Hering 13,800 265 280Cyfrowy Polsat SA 18,447 92 97Cyrela Brazil Realty SA
Empreendimentos e Participacoes 28,200 346 245Dah Chong Hong Holdings, Ltd. 79,000 100 83Daphne International Holdings, Ltd. 88,000 107 120Dongfeng Motor Group Co., Ltd. 264,000 475 403E-Mart Co., Ltd. 2,014 460 446El Puerto De Liverpool SAB de CV 17,800 132 187Far Eastern Department Stores
Co., Ltd. 92,160 123 95Ford Otomotiv Sanayi 6,948 60 83Formosa International Hotels Corp. 3,300 43 44Formosa Taffeta Co., Ltd. 77,000 74 74Foschini Group, Ltd. 19,766 246 327Geely Automobile Holdings, Ltd. 375,000 164 176Genting Bhd. 197,500 646 591Genting Malaysia Bhd. 286,700 319 330Giant Manufacturing Co., Ltd. 28,000 111 159Global Mediacom Tbk PT 622,000 160 149Golden Eagle Retail Group, Ltd. 68,000 177 166GOME Electrical Appliances
Holdings, Ltd. 960,000 319 113Great Wall Motor Co., Ltd. 100,750 168 313Grupo Televisa SA 248,600 1,066 1,301Guangzhou Automobile Group
Co., Ltd. 216,000 281 190Haier Electronics Group Co., Ltd. 80,000 77 116Hankook Tire Co., Ltd. 7,179 325 314Hero Honda Motors, Ltd. 3,934 149 136
Security Holdings
Average
cost
Fair
value
(in $000s) (in $000s)
Consumer Discretionary (continued)Hotai Motor Co., Ltd. 24,000 138 191Hyundai Department Store Co., Ltd. 1,445 182 213Hyundai Mobis 6,581 1,638 1,760Hyundai Motor Co. 14,892 2,400 3,026Hyundai Motor Co. 2nd Preferred 3,636 204 253Hyundai Motor Co. Preferred 2,256 119 145Hyundai Wia Corp. 1,491 209 239Imperial Holdings, Ltd. 17,261 294 395Intime Department Store Group
Co., Ltd. 97,000 153 113Jollibee Foods Corp. 40,060 83 99Kangwon Land, Inc. 9,300 216 253Kia Motors Corp. 25,458 1,199 1,338Kroton Educacional SA 7,400 146 166LG Electronics, Inc. 10,281 785 704Lojas Americanas SA 12,000 100 104Lojas Americanas SA Preferred 39,218 286 347Lojas Renner SA 11,900 415 459Lotte Shopping Co., Ltd. 983 390 343Mahindra & Mahindra, Ltd. 29,686 456 503Mando Corp. 1,230 172 146Maruti Suzuki India, Ltd. 3,451 92 95Massmart Holdings, Ltd. 10,439 214 234Media Nusantara Citra Tbk PT 392,500 108 100Merida Industry Co., Ltd. 19,000 77 84Mr Price Group, Ltd. 23,078 301 379MRV Engenharia e Participacoes SA 30,200 257 173Nan Kang Rubber Tire Co., Ltd. 56,164 73 68Naspers, Ltd. 37,811 1,901 2,410Neo Holdings Co., Ltd. 662 - -Parkson Holdings Bhd. 60,087 108 95Parkson Retail Group, Ltd. 133,000 206 107PDG Realty SA Empreendimentos e
Participacoes 113,400 579 182Pou Chen Corp. 215,000 169 225Ruentex Industries, Ltd. 46,385 87 115SACI Falabella 46,773 450 479Steinhoff International Holdings, Ltd. 114,991 347 370Tata Motors, Ltd. 73,238 356 421Titan Industries, Ltd. 19,956 91 103Tofas Turk Otomobil Fabrikasi 11,764 71 69Truworths International, Ltd. 42,408 428 533Turkiye Sise ve Cam Fabrikalari 45,117 87 74UMW Holdings Bhd. 50,600 122 197Woolworths Holdings, Ltd. 72,879 318 604Woongjin Coway Co., Ltd. 5,280 196 214Yulon Motor Co., Ltd. 84,000 165 158Zee Entertainment Ent., Ltd. 45,142 128 181Zhongsheng Group Holdings, Ltd. 57,500 98 86
27,592 29,834
The accompanying notes are an integral part of the financial statements. 276

BlackRock CDN MSCI Emerging Markets Index Fund
Statement of Investment Portfolio — As at December 31, 2012
Security Holdings
Average
cost
Fair
value
(in $000s) (in $000s)
Consumer Staples — 8.7%
Alliance Global Group, Inc. 407,600 115 165Almacenes Exito SA 19,453 259 387Amorepacific Corp. 310 311 350Amorepacific Group 267 104 116Anadolu Efes Biracilik ve Malt
Sanayii AS 20,093 285 287Astra Agro Lestari Tbk PT 39,500 97 80BIM Birlesik Magazalar 10,278 357 500BRF-Brasil Foods SA 63,200 1,029 1,297British American Tobacco
Malaysia Bhd. 11,000 172 218Centros Comerciales
Sudamericanos SA 96,646 649 521Charoen Pokphand Foods PCL 210,500 186 223Charoen Pokphand Foods PCL
NVDR 88,600 92 97Charoen Pokphand Indonesia
Tbk PT 713,460 180 264China Agri-Industries Holdings, Ltd. 197,000 198 110China Foods, Ltd. 78,000 78 72China Mengniu Dairy Co., Ltd. 120,000 371 338China Resources Ent., Ltd. 118,000 487 424Cia Brasileira de Distribuicao Grupo
Pao de Acucar 9,534 376 419Cia Cervecerias Unidas SA 10,764 129 167Cia de Bebidas das Americas 13,600 498 554Cia de Bebidas das Americas
Preferred 72,758 2,133 3,028CJ CheilJedang Corp. 768 176 254Coca-Cola Femsa SAB de CV 41,800 432 615Coca-Cola Icecek 6,126 85 125Controladora Comercial Mexicana
SAB de CV-UNIT 36,200 112 125Cosan SA Industria e Comercio 11,700 181 237CP ALL PCL 280,600 197 338CP ALL PCL NVDR 144,400 145 215Dabur India, Ltd. 38,848 92 91Embotelladora Andina SA 17,810 114 113Embotelladoras Arca SAB de CV 31,358 146 231Eurocash SA 6,627 79 96Felda Global Ventures Holdings Bhd. 108,800 188 162Fomento Economico Mexicano SAB
de CV-UNIT 187,800 1,174 1,862Genting Plantations Bhd. 20,500 55 59Godrej Consumer Products, Ltd. 11,286 123 148Grupo Bimbo SAB de CV 159,000 330 407Grupo Modelo SAB de CV 61,200 377 544Gudang Garam Tbk PT 46,000 251 267Hengan International Group Co., Ltd. 71,500 670 641Hindustan Unilever, Ltd. 83,502 567 796Hypermarcas SA 33,400 376 270
Security Holdings
Average
cost
Fair
value
(in $000s) (in $000s)
Consumer Staples (continued)Indofood Sukses Makmur Tbk PT 426,000 254 257IOI Corp. Bhd. 310,800 553 505ITC, Ltd. 211,932 905 1,106JBS SA 38,800 136 113Kernel Holding SA 5,041 116 108Kimberly-Clark de Mexico SAB de
CV-Class A 150,200 317 381KT&G Corp. 10,595 646 795Kuala Lumpur Kepong Bhd. 46,400 300 357LG Household & Health Care, Ltd. 906 366 554Lotte Confectionery Co., Ltd. 68 89 102Magnit OJSC–GDR 25,130 676 1,003Natura Cosmeticos SA 16,700 440 476Orion Corp. 345 207 352Pick n Pay Stores, Ltd. 23,791 146 124PPB Group Bhd. 45,600 255 172President Chain Store Corp. 56,000 309 299Raia Drogasil SA 19,300 153 217San Miguel Corp. 44,745 128 113Shinsegae Co., Ltd. 657 499 134Shoprite Holdings, Ltd. 41,341 632 992Siam Makro PCL 9,000 142 131Souza Cruz SA 37,000 410 554Spar Group, Ltd. 16,642 240 246Standard Foods Corp. 23,560 66 64Sun Art Retail Group, Ltd. 230,500 330 351Tiger Brands, Ltd. 15,704 445 599Tingyi Cayman Islands Holding
Corp. 188,000 529 516Tsingtao Brewery Co., Ltd. 28,000 159 164Uni-President China Holdings, Ltd. 105,000 100 111Uni-President Enterprises Corp. 399,730 530 731Unilever Indonesia Tbk PT 147,500 289 317United Breweries, Ltd. 6,208 91 106United Spirits, Ltd. 8,347 181 297Universal Robina Corp. 84,200 106 169Vina Concha y Toro SA 39,685 95 77Wal-Mart de Mexico SAB de CV 514,200 1,375 1,663Want Want China Holdings, Ltd. 575,000 537 789Wumart Stores, Inc. 49,000 115 104
26,843 32,362
Energy — 12.3%
Adaro Energy Tbk PT 1,391,000 343 227AK Transneft OAO 150 215 333Banpu PCL 2,150 50 28Banpu PCL NVDR 8,550 115 114Bharat Heavy Electricals, Ltd. 56,650 457 240Bharat Petroleum Corp., Ltd. 16,614 109 108Bumi Armada Bhd. 114,900 148 147
The accompanying notes are an integral part of the financial statements. 277

BlackRock CDN MSCI Emerging Markets Index Fund
Statement of Investment Portfolio — As at December 31, 2012
Security Holdings
Average
cost
Fair
value
(in $000s) (in $000s)
Energy (continued)Bumi Resources Tbk PT 1,370,500 341 84Cairn India, Ltd. 46,141 280 269China Coal Energy Co., Ltd. 396,000 568 426China Oilfield Services, Ltd. 152,000 250 311China Petroleum & Chemical Corp. 1,620,000 1,502 1,827China Shenhua Energy Co., Ltd. 328,500 1,387 1,429CNOOC, Ltd. 1,725,000 3,512 3,718Coal India, Ltd. 48,793 370 319Ecopetrol SA 476,603 1,102 1,450Formosa Petrochemical Corp. 110,000 312 324Gazprom OAO 1,028,866 5,713 4,819Glow Energy PCL 45,000 75 113Grupa Lotos SA 6,109 64 83GS Holdings 4,935 275 330Indo Tambangraya Megah PT 39,500 196 167Inner Mongolia Yitai Coal Co. 57,800 350 327IRPC PCL 924,900 138 124IRPC PCL NVDR 65,400 9 9Kunlun Energy Co., Ltd. 310,000 482 644Lukoil OAO 49,290 2,855 3,214MOL Hungarian Oil and Gas PLC 4,040 377 323NovaTek OAO 8,803 908 1,041OGX Petroleo e Gas
Participacoes SA 125,100 1,254 265Oil & Natural Gas Corp., Ltd. 74,361 442 361PetroChina Co., Ltd. 2,038,000 2,523 2,864Petroleo Brasileiro SA 287,600 4,561 2,729Petroleo Brasileiro SA Preferred 405,700 5,816 3,849Petronas Dagangan Bhd. 23,800 108 182Polski Koncern Naftowy Orlen 30,972 425 515Polskie Gornictwo Naftowe i
Gazownictwo SA 171,883 213 287PTT Exploration & Production PCL 103,913 537 551PTT Exploration & Production
PCL NVDR 31,013 159 165PTT PCL 66,600 676 713PTT PCL NVDR 16,200 174 175Reliance Industries, Ltd. 125,247 2,435 1,905Rosneft Oil Co. 122,883 854 1,082S-Oil Corp. 4,348 342 421Sapurakencana Petroleum Bhd. 221,300 156 224Sasol, Ltd. 52,950 2,392 2,253SK Energy Co., Ltd. 5,806 814 940Surgutneftegas OJSC 691,000 648 604Surgutneftegas OJSC Preferred 670,700 338 435Tambang Batubara Bukit Asam
Tbk PT 81,000 168 126Tatneft 136,823 716 972Thai Oil PCL 61,200 123 130Thai Oil PCL NVDR 18,200 38 40
Security Holdings
Average
cost
Fair
value
(in $000s) (in $000s)
Energy (continued)TMK OAO 5,638 91 85Tupras Turkiye Petrol Rafinerileri 12,104 293 346Ultrapar Participacoes SA 31,600 556 707Yanzhou Coal Mining Co., Ltd. 190,000 475 312
49,830 45,786
Financials — 26.3%
ABSA Group, Ltd. 25,683 483 493African Bank Investments, Ltd. 69,957 340 263Agile Property Holdings, Ltd. 138,000 183 193Agricultural Bank of China, Ltd. 2,078,000 1,011 1,025Akbank TAS 173,834 791 852Alliance Financial Group Bhd. 95,700 108 136AMMB Holdings Bhd. 160,100 323 348Asya Katilim Bankasi 48,453 89 59Attijariwafa Bank 2,955 123 107Axis Bank, Ltd. 22,035 606 542Ayala Corp. 17,178 138 215Ayala Land, Inc. 531,900 222 340Banco Bradesco SA 55,400 843 914Banco Bradesco SA Preferred 184,641 3,470 3,158Banco Davivienda SA 7,500 94 98Banco de Chile 1,789,687 246 277Banco de Credito e Inversiones 3,028 188 210Banco do Brasil SA 55,400 946 690Banco do Estado do Rio Grande
do Sul 17,900 184 135Banco Santander Brasil SA-UNIT 73,400 846 533Banco Santander Chile 6,370,037 527 447BanColombia SA 22,157 350 375BanColombia SA Preferred 31,407 501 520Bangkok Bank PCL 81,200 437 552Bangkok Bank PCL NVDR 53,500 281 340Bank Central Asia Tbk PT 1,179,000 929 1,102Bank Danamon Indonesia Tbk PT 320,500 208 185Bank Handlowy w Warszawie SA 3,204 89 101Bank Mandiri Tbk PT 902,000 691 750Bank Millennium SA 39,518 63 56Bank Negara Indonesia Persero
Tbk PT 713,626 327 273Bank of Ayudhya PCL 142,000 109 149Bank of Ayudhya PCL NVDR 92,800 92 98Bank of Baroda 7,936 103 125Bank of China, Ltd. 7,268,700 3,448 3,240Bank of Communications Co., Ltd. 676,600 623 507Bank of India 11,854 92 74Bank of the Philippine Islands 67,720 92 154Bank Pekao SA 11,416 629 625Bank Rakyat Indonesia Persero
Tbk PT 1,062,000 699 757
The accompanying notes are an integral part of the financial statements. 278

BlackRock CDN MSCI Emerging Markets Index Fund
Statement of Investment Portfolio — As at December 31, 2012
Security Holdings
Average
cost
Fair
value
(in $000s) (in $000s)
Financials (continued)BDO Unibank, Inc. 138,412 185 244BM&FBOVESPA SA 172,200 1,277 1,172BR Malls Participacoes SA 39,500 409 517BR Properties SA 18,100 214 221BRE Bank SA 1,440 134 151BS Financial Group, Inc. 16,000 209 196Canara Bank 8,550 103 80Capital Securities Corp. 155,000 58 59Cathay Financial Holding Co., Ltd. 683,450 762 737Central Pattana PCL 64,600 169 171CETIP SA-Balcao Organizado de
Ativos e Derivativos 19,823 287 245Chailease Holding Co., Ltd. 64,000 129 146Chang Hwa Commercial Bank 423,010 240 231China Citic Bank Corp., Ltd. 719,000 452 425China Construction Bank Corp. 6,966,000 5,569 5,566China Development Financial
Holding Corp. 1,187,000 338 309China Everbright, Ltd. 82,000 177 157China Life Insurance Co., Ltd. 180,589 171 162China Life Insurance Co., Ltd.–H
Shares 718,000 2,690 2,338China Merchants Bank Co., Ltd. 377,500 918 828China Minsheng Banking Corp., Ltd. 503,000 463 578China Overseas Land &
Investment, Ltd. 394,000 863 1,169China Pacific Insurance Group
Co., Ltd. 228,200 818 840China Resources Land, Ltd. 196,000 386 527China Taiping Insurance Holdings
Co., Ltd. 83,600 235 169China Vanke Co., Ltd. 125,800 163 202Chinatrust Financial Holding
Co., Ltd. 1,080,137 611 633Chongqing Rural Commercial Bank 236,000 139 129CIMB Group Holdings Bhd. 466,700 1,241 1,159Citic Securities Co., Ltd. 103,000 207 259Commercial International Bank
Egypt SAE 54,808 344 293Compartamos SAB de CV 103,900 195 146Corp. Financiera Colombiana SA 7,453 140 153Corpbanca 9,891,186 150 132Country Garden Holdings Co. 445,482 170 232Credicorp, Ltd. 6,552 763 955Daewoo Securities Co., Ltd. 16,126 229 179DGB Financial Group Inc. 11,560 151 155Discovery Holdings, Ltd. 28,849 164 211DLF, Ltd. 39,334 188 168Dongbu Insurance Co., Ltd. 4,100 149 172Douja Promotion Groupe Addoha SA 12,416 145 92E.sun Financial Holding Co., Ltd. 370,750 177 206
Security Holdings
Average
cost
Fair
value
(in $000s) (in $000s)
Financials (continued)Egyptian Financial Group-Hermes
Holding 32,409 118 56Egyptian Kuwaiti Holding Co. 67,907 98 86Emlak Konut Gayrimenkul Yatirim
Ortakligi REIT 61,209 99 106Evergrande Real Estate Group, Ltd. 514,000 262 280Far East Horizon, Ltd. 127,000 104 101Farglory Land Development Co., Ltd. 34,000 63 61First Financial Holding Co., Ltd. 627,800 377 381FirstRand, Ltd. 299,556 892 1,083Franshion Properties China, Ltd. 310,000 93 111Fubon Financial Holding Co., Ltd. 549,320 605 661Growthpoint Properties, Ltd.–UNIT 159,884 413 460Grupo Aval Acciones y Valores 134,520 91 98Grupo de Inversiones
Suramericana SA 22,646 456 485Grupo de Inversiones Suramericana
SA Preferred 6,149 117 133Grupo Financiero Banorte SAB
de CV 179,800 782 1,149Grupo Financiero Inbursa SA 193,300 429 581Grupo Financiero Santander Mexico
SAB de CV 144,600 417 462Guangzhou R&F Properties Co., Ltd. 86,800 115 144Haci Omer Sabanci Holding A.S. 78,848 355 428Haitong Securities Co., Ltd. 84,000 109 142Hana Financial Group, Inc. 18,580 587 599HDFC Bank, Ltd. 147,922 1,518 1,835Highwealth Construction Corp. 32,000 70 60Hong Leong Bank Bhd. 54,660 184 262Hong Leong Financial Group Bhd. 20,800 70 89Housing Development Finance Corp. 141,206 2,055 2,125Hua Nan Financial Holdings
Co., Ltd. 499,932 284 287Hyundai Marine & Fire Insurance
Co., Ltd. 6,000 181 185Hyundai Securities Co. 11,230 130 94ICICI Bank, Ltd. 41,220 906 853Industrial & Commercial Bank of
China 6,286,000 4,593 4,441Industrial Bank of Korea 15,800 210 173Infrastructure Development Finance
Co., Ltd. 102,329 306 322Investec, Ltd. 22,520 173 153Itau Unibanco Holding SA Preferred 220,400 4,718 3,579Itausa-Investimentos Itau SA 244,797 1,557 1,154Kasikornbank PCL 113,200 489 713Kasikornbank PCL NVDR 67,000 292 422KB Financial Group, Inc. 35,444 1,490 1,249Komercni Banka 1,487 313 312Korea Exchange Bank 25,210 249 178
The accompanying notes are an integral part of the financial statements. 279

BlackRock CDN MSCI Emerging Markets Index Fund
Statement of Investment Portfolio — As at December 31, 2012
Security Holdings
Average
cost
Fair
value
(in $000s) (in $000s)
Financials (continued)Korea Investment Holdings Co., Ltd. 3,700 118 146Korea Life Insurance Co., Ltd. 16,560 108 120Kotak Mahindra Bank, Ltd. 27,977 283 330Krung Thai Bank PCL 274,750 145 132Krung Thai Bank PCL NVDR 66,375 39 42Liberty Holdings, Ltd. 11,291 119 146LIC Housing Finance, Ltd. 29,630 144 157Longfor Properties Co., Ltd. 131,000 179 254LSR Group-GDR 20,489 137 84Malayan Banking Bhd. 399,400 1,147 1,181Mega Financial Holding Co., Ltd. 775,230 555 599Metropolitan Bank & Trust 22,159 39 55Mirae Asset Securities Co., Ltd. 2,339 105 77MMI Holdings, Ltd. 98,860 241 256Multiplan Empreendimentos
Imobiliarios SA 7,400 168 217National Societe Generale
Bank SAE 10,709 66 59Nedbank Group, Ltd. 19,624 390 433OTP Bank PLC 21,672 456 404PICC Property & Casualty Co., Ltd. 257,600 362 359Ping An Insurance Group Co. of
China, Ltd. 181,500 1,743 1,512Poly Hong Kong Investments, Ltd. 191,000 170 149Porto Seguro SA 11,100 145 125Power Finance Corp., Ltd. 25,568 82 96Powszechna Kasa Oszczednosci
Bank Polski SA 72,479 945 858Powszechny Zaklad
Ubezpieczen SA 5,425 670 760Public Bank Bhd. 102,400 439 542Redefine Properties, Ltd.–UNIT 267,642 302 294Reliance Capital, Ltd. 9,505 106 83Remgro, Ltd. 41,815 649 775RHB Capital Bhd. 60,200 153 150RMB Holdings, Ltd. 68,186 320 326RMI Holdings 66,228 130 160Ruentex Development Co., Ltd. 56,112 66 115Rural Electrification Corp., Ltd. 28,029 136 128Samsung Card Co. 4,054 203 138Samsung Fire & Marine Insurance
Co., Ltd. 3,434 627 695Samsung Life Insurance Co., Ltd. 5,795 508 508Samsung Securities Co., Ltd. 5,907 320 293Sanlam, Ltd. 172,418 660 906Sberbank of Russia 1,042,462 3,099 3,157Sberbank of Russia Preferred 96,707 216 212Shimao Property Holdings, Ltd. 135,000 210 253Shin Kong Financial Holding
Co., Ltd. 570,000 170 160
Security Holdings
Average
cost
Fair
value
(in $000s) (in $000s)
Financials (continued)Shinhan Financial Group Co., Ltd. 36,250 1,504 1,306Shriram Transport Finance
Co., Ltd. 11,991 167 164Shui On Land, Ltd. 252,500 119 122Siam Commercial Bank PCL 122,700 419 715Siam Commercial Bank
PCL NVDR 48,400 242 285Sino-Ocean Land Holdings, Ltd. 274,500 169 203Sinopac Financial Holdings Co.,
Ltd. 583,337 198 249SM Prime Holdings, Inc. 671,600 159 269Soho China, Ltd. 204,500 153 163Standard Bank Group, Ltd. 115,383 1,675 1,608State Bank of India 12,980 581 563Sul America SA-UNIT 10,764 111 93Taishin Financial Holding Co., Ltd. 635,147 237 250Taiwan Business Bank 276,240 82 83Taiwan Cooperative Financial
Holding 479,244 285 268Talaat Moustafa Group 96,237 102 66Turkiye Garanti Bankasi 223,245 1,101 1,151Turkiye Halk Bankasi 60,345 526 587Turkiye Is Bankasi 152,214 549 523Turkiye Vakiflar Bankasi Tao 72,408 190 186UEM Land Holdings Bhd. 144,200 117 98Unitech, Ltd. 127,851 102 81VTB Bank OJSC 252,746,000 720 441Woori Finance Holdings Co., Ltd. 35,040 411 383Woori Investment & Securities
Co., Ltd. 12,347 169 136Yapi ve Kredi Bankasi 84,994 254 246Yuanta Financial Holding Co., Ltd. 774,000 401 397Yuexiu Property Co., Ltd. 492,000 119 155
98,208 98,062
Health Care — 1.3%
Amil Participacoes SA 12,500 134 187Aspen Pharmacare Holdings, Ltd. 28,598 391 567Bangkok Dusit Medical Services
PCL 29,000 105 107Celltrion, Inc. 11,625 203 282Cipla, Ltd. 33,348 225 252Diagnosticos da America SA 22,200 263 141Divi’s Laboratories, Ltd. 3,742 81 75Dr Reddy’s Laboratories, Ltd. 9,835 337 327IHH Healthcare Bhd. 194,600 203 214Kalbe Farma Tbk PT 2,174,485 180 234Life Healthcare Group
Holdings, Ltd. 90,552 254 355Lupin, Ltd. 14,257 134 159Netcare, Ltd. 82,947 168 190
The accompanying notes are an integral part of the financial statements. 280

BlackRock CDN MSCI Emerging Markets Index Fund
Statement of Investment Portfolio — As at December 31, 2012
Security Holdings
Average
cost
Fair
value
(in $000s) (in $000s)
Health Care (continued)Odontoprev SA 26,200 136 137Piramal Healthcare, Ltd. 6,952 64 66Qualicorp SA 13,600 133 140Ranbaxy Laboratories, Ltd. 11,894 121 110Scinopharm Taiwan, Ltd. 25,000 54 60Shandong Weigao Group Medical
Polymer Co., Ltd. 160,000 204 158Shanghai Pharmaceuticals Holding
Co., Ltd. 59,000 110 112Sihuan Pharmaceutical Holdings
Group, Ltd. 186,000 98 81Sinopharm Group Co. 76,400 264 238Sun Pharmaceutical Industries, Ltd. 30,054 309 404Yuhan Corp. 785 109 126
4,280 4,722
Industrials — 6.4%
Aboitiz Equity Ventures, Inc. 186,650 189 239Adani Enterprises, Ltd. 21,572 256 108Aditya Birla Nuvo, Ltd. 3,333 63 66Air China, Ltd. 174,000 202 146AirAsia Bhd. 124,800 110 111Airports of Thailand PCL 40,100 122 127Airtac International Group 9,000 52 52Alfa SAB de CV 274,400 293 577All America Latina Logistica SA 44,100 362 178Arteris SA 11,700 100 106Aveng, Ltd. 39,375 207 139Barloworld, Ltd. 21,179 211 217Beijing Capital International Airport
Co., Ltd. 180,000 100 128Beijing Ent. Holdings, Ltd. 50,000 320 324Bidvest Group, Ltd. 28,501 617 719China Airlines, Ltd. 242,554 108 100China Communications Construction
Co., Ltd. 427,000 374 410China COSCO Holdings Co., Ltd. 250,000 233 122China International Marine
Containers Group Co., Ltd. 57,200 97 87China Merchants Holdings
International Co., Ltd. 108,000 390 344China Railway Construction
Corp., Ltd. 190,500 210 215China Railway Group, Ltd. 386,000 245 225China Shipping Container Lines
Co., Ltd. 362,000 117 103China Shipping Development
Co., Ltd. 130,000 149 74China Southern Airlines Co., Ltd. 182,000 123 91China State Construction
International Holdings, Ltd. 170,000 174 203
Security Holdings
Average
cost
Fair
value
(in $000s) (in $000s)
Industrials (continued)Cia de Concessoes Rodoviarias 85,300 601 805Citic Pacific, Ltd. 127,000 278 188CJ Corp. 1,397 107 154COSCO Pacific, Ltd. 164,000 244 232CSR Corp., Ltd. 190,000 175 165CTCI Corp. 54,000 113 106Daelim Industrial Co., Ltd. 2,679 231 217Daewoo Engineering & Construction
Co., Ltd. 9,910 97 92Daewoo International Corp. 4,510 154 166Daewoo Shipbuilding & Marine
Engineering Co., Ltd. 9,400 234 237DMCI Holdings, Inc. 80,000 111 105Dongfang Electric Corp., Ltd. 33,800 138 68Doosan Corp. 662 82 79Doosan Heavy Industries and
Construction Co., Ltd. 4,631 293 194Doosan Infracore Co., Ltd. 9,540 199 151EcoRodovias Infraestrutura e
Logistica SA 16,200 133 136Embraer SA 53,700 371 376Empresas COPEC SA 43,977 780 618Enka Insaat ve Sanayi 35,651 102 105Eva Airways Corp. 160,000 92 93Evergreen Marine Corp. Taiwan, Ltd. 164,000 86 98Far Eastern New Century Corp. 292,620 324 332Gamuda Bhd. 152,800 183 179Glovis Co., Ltd. 1,268 204 261Grupo Aeroportuario del Pacifico
SAB de CV 29,900 113 168Grupo Aeroportuario del Sureste
SAB de CV 20,200 208 227Grupo Carso SAB de CV 56,400 267 270GS Engineering & Construction
Corp. 3,519 292 188Hiwin Technologies Corp. 16,700 132 122Hyundai Development Co. 5,310 144 107Hyundai Engineering & Construction
Co., Ltd. 6,451 397 419Hyundai Heavy Industries Co., Ltd. 4,039 1,216 909Hyundai Merchant Marine Co., Ltd. 4,333 141 95Hyundai Mipo Dockyard 1,050 155 124IJM Corp. Bhd. 108,500 198 175International Container Terminal
Services, Inc. 74,200 98 132Jaiprakash Associates, Ltd. 93,627 172 168Jasa Marga Persero Tbk PT 197,500 113 111Jiangsu Expressway Co., Ltd. 114,000 118 116KCC Corp. 398 116 110KOC Holding 61,382 258 316Korea Aerospace Industries, Ltd. 3,360 118 81
The accompanying notes are an integral part of the financial statements. 281
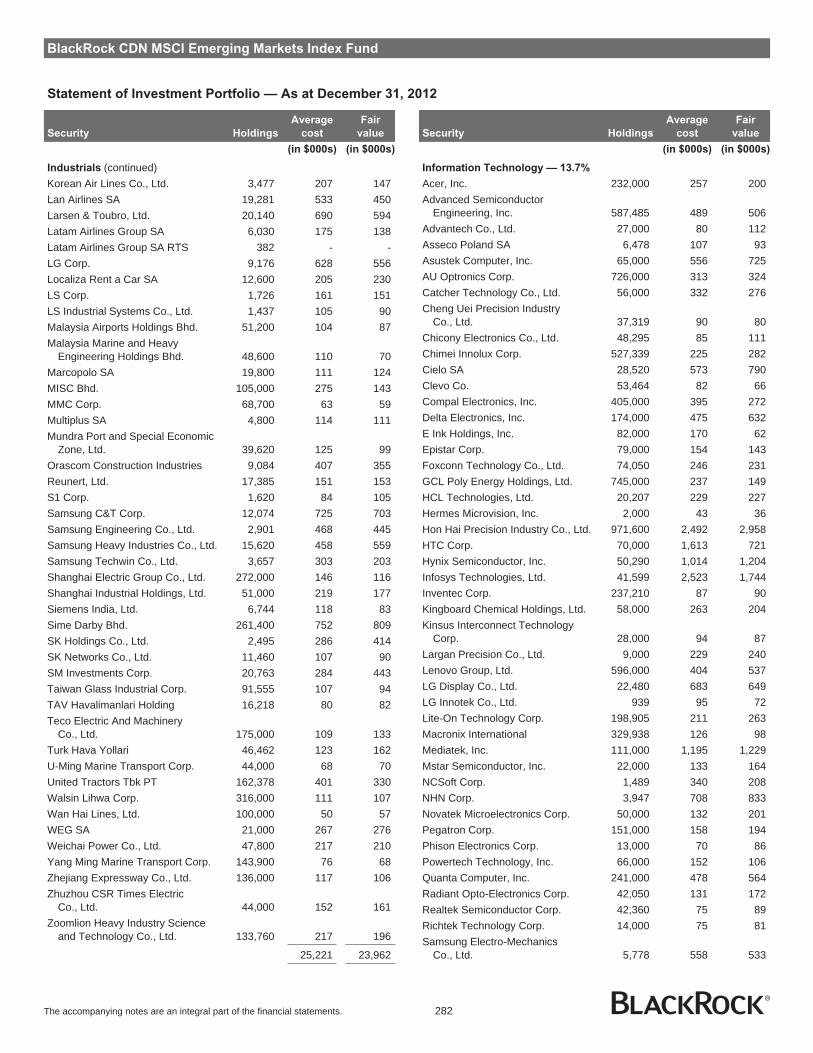
BlackRock CDN MSCI Emerging Markets Index Fund
Statement of Investment Portfolio — As at December 31, 2012
Security Holdings
Average
cost
Fair
value
(in $000s) (in $000s)
Industrials (continued)Korean Air Lines Co., Ltd. 3,477 207 147Lan Airlines SA 19,281 533 450Larsen & Toubro, Ltd. 20,140 690 594Latam Airlines Group SA 6,030 175 138Latam Airlines Group SA RTS 382 - -LG Corp. 9,176 628 556Localiza Rent a Car SA 12,600 205 230LS Corp. 1,726 161 151LS Industrial Systems Co., Ltd. 1,437 105 90Malaysia Airports Holdings Bhd. 51,200 104 87Malaysia Marine and Heavy
Engineering Holdings Bhd. 48,600 110 70Marcopolo SA 19,800 111 124MISC Bhd. 105,000 275 143MMC Corp. 68,700 63 59Multiplus SA 4,800 114 111Mundra Port and Special Economic
Zone, Ltd. 39,620 125 99Orascom Construction Industries 9,084 407 355Reunert, Ltd. 17,385 151 153S1 Corp. 1,620 84 105Samsung C&T Corp. 12,074 725 703Samsung Engineering Co., Ltd. 2,901 468 445Samsung Heavy Industries Co., Ltd. 15,620 458 559Samsung Techwin Co., Ltd. 3,657 303 203Shanghai Electric Group Co., Ltd. 272,000 146 116Shanghai Industrial Holdings, Ltd. 51,000 219 177Siemens India, Ltd. 6,744 118 83Sime Darby Bhd. 261,400 752 809SK Holdings Co., Ltd. 2,495 286 414SK Networks Co., Ltd. 11,460 107 90SM Investments Corp. 20,763 284 443Taiwan Glass Industrial Corp. 91,555 107 94TAV Havalimanlari Holding 16,218 80 82Teco Electric And Machinery
Co., Ltd. 175,000 109 133Turk Hava Yollari 46,462 123 162U-Ming Marine Transport Corp. 44,000 68 70United Tractors Tbk PT 162,378 401 330Walsin Lihwa Corp. 316,000 111 107Wan Hai Lines, Ltd. 100,000 50 57WEG SA 21,000 267 276Weichai Power Co., Ltd. 47,800 217 210Yang Ming Marine Transport Corp. 143,900 76 68Zhejiang Expressway Co., Ltd. 136,000 117 106Zhuzhou CSR Times Electric
Co., Ltd. 44,000 152 161Zoomlion Heavy Industry Science
and Technology Co., Ltd. 133,760 217 196
25,221 23,962
Security Holdings
Average
cost
Fair
value
(in $000s) (in $000s)
Information Technology — 13.7%
Acer, Inc. 232,000 257 200Advanced Semiconductor
Engineering, Inc. 587,485 489 506Advantech Co., Ltd. 27,000 80 112Asseco Poland SA 6,478 107 93Asustek Computer, Inc. 65,000 556 725AU Optronics Corp. 726,000 313 324Catcher Technology Co., Ltd. 56,000 332 276Cheng Uei Precision Industry
Co., Ltd. 37,319 90 80Chicony Electronics Co., Ltd. 48,295 85 111Chimei Innolux Corp. 527,339 225 282Cielo SA 28,520 573 790Clevo Co. 53,464 82 66Compal Electronics, Inc. 405,000 395 272Delta Electronics, Inc. 174,000 475 632E Ink Holdings, Inc. 82,000 170 62Epistar Corp. 79,000 154 143Foxconn Technology Co., Ltd. 74,050 246 231GCL Poly Energy Holdings, Ltd. 745,000 237 149HCL Technologies, Ltd. 20,207 229 227Hermes Microvision, Inc. 2,000 43 36Hon Hai Precision Industry Co., Ltd. 971,600 2,492 2,958HTC Corp. 70,000 1,613 721Hynix Semiconductor, Inc. 50,290 1,014 1,204Infosys Technologies, Ltd. 41,599 2,523 1,744Inventec Corp. 237,210 87 90Kingboard Chemical Holdings, Ltd. 58,000 263 204Kinsus Interconnect Technology
Corp. 28,000 94 87Largan Precision Co., Ltd. 9,000 229 240Lenovo Group, Ltd. 596,000 404 537LG Display Co., Ltd. 22,480 683 649LG Innotek Co., Ltd. 939 95 72Lite-On Technology Corp. 198,905 211 263Macronix International 329,938 126 98Mediatek, Inc. 111,000 1,195 1,229Mstar Semiconductor, Inc. 22,000 133 164NCSoft Corp. 1,489 340 208NHN Corp. 3,947 708 833Novatek Microelectronics Corp. 50,000 132 201Pegatron Corp. 151,000 158 194Phison Electronics Corp. 13,000 70 86Powertech Technology, Inc. 66,000 152 106Quanta Computer, Inc. 241,000 478 564Radiant Opto-Electronics Corp. 42,050 131 172Realtek Semiconductor Corp. 42,360 75 89Richtek Technology Corp. 14,000 75 81Samsung Electro-Mechanics
Co., Ltd. 5,778 558 533
The accompanying notes are an integral part of the financial statements. 282

BlackRock CDN MSCI Emerging Markets Index Fund
Statement of Investment Portfolio — As at December 31, 2012
Security Holdings
Average
cost
Fair
value
(in $000s) (in $000s)
Information Technology (continued)Samsung Electronics Co., Ltd. 10,668 8,289 15,091Samsung Electronics Co., Ltd.
Preferred 1,985 1,044 1,571Samsung SDI Co., Ltd. 3,305 464 464Satyam Computer Services, Ltd. 64,256 105 124Siliconware Precision Industries Co. 286,000 278 304Simplo Technology Co., Ltd. 28,100 168 140SK C&C Co., Ltd. 2,187 195 209Synnex Technology International
Corp. 122,000 292 223Taiwan Semiconductor
Manufacturing Co., Ltd. 2,377,000 5,802 7,898Tata Consultancy Services, Ltd. 45,361 1,104 1,041Tencent Holdings, Ltd. 98,000 2,296 3,125Totvs SA 11,100 216 218TPK Holding Co., Ltd. 21,254 299 374Transcend Information, Inc. 19,000 43 52Tripod Technology Corp. 41,000 110 88Unimicron Technology Corp. 120,000 166 127United Microelectronics Corp. 1,189,000 456 477Wintek Corp. 166,000 125 88Wipro, Ltd. 47,521 426 340Wistron Corp. 201,600 234 208WPG Holdings, Ltd. 137,000 185 178Zhen Ding Technology Holding, Ltd. 17,650 54 43ZTE Corp. 59,800 169 100
41,697 51,127
Materials — 11.7%
ACC, Ltd. 4,940 117 128African Rainbow Minerals, Ltd. 10,376 256 228Alpek SAB de CV 39,700 107 106Aluminum Corp. of China, Ltd. 382,000 301 173Ambuja Cements, Ltd. 60,761 197 223Angang Steel Co., Ltd. 110,000 126 80Anglo Platinum, Ltd. 6,515 566 339AngloGold Ashanti, Ltd. 36,977 1,656 1,135Anhui Conch Cement Co., Ltd. 119,000 384 431ArcelorMittal South Africa, Ltd. 17,424 171 74Asia Cement Corp. 186,920 208 239Asian Paints, Ltd. 2,752 187 221Assore, Ltd. 3,427 122 162BBMG Corp. 110,500 141 100Bradespar SA 21,900 485 349Braskem SA 14,800 147 92CAP SA 7,215 331 239Cementos Argos SA 38,927 221 220Cemex SAB de CV–UNIT 1,023,858 752 998Cheil Industries, Inc. 4,338 396 380China BlueChemical, Ltd. 174,000 132 116
Security Holdings
Average
cost
Fair
value
(in $000s) (in $000s)
Materials (continued)China National Building Material
Co., Ltd. 278,000 355 405China Petrochemical Development
Corp. 153,925 168 95China Resources Cement
Holdings, Ltd. 184,000 148 120China Shanshui Cement Group, Ltd. 172,000 148 125China Steel Corp. 1,106,640 1,075 1,036Cia de Minas Buenaventura SA-ADR 18,446 823 660Cia Siderurgica Nacional SA 70,400 967 405Duratex SA 24,100 196 172Empresas CMPC SA 107,705 527 394Eregli Demir ve Celik
Fabrikalari TAS 90,300 185 123Eternal Chemical Co., Ltd. 63,000 50 54Exxaro Resources, Ltd. 12,084 240 240Feng Hsin Iron & Steel Co. 39,000 72 69Fibria Celulose SA 24,000 308 263Formosa Chemicals & Fibre Corp. 302,000 825 776Formosa Plastics Corp. 385,000 1,063 1,036Fosun International, Ltd. 157,500 117 100Fushan International Energy
Group, Ltd. 298,000 168 109Gerdau SA 83,000 946 724Gold Fields, Ltd. 70,479 1,106 852Grupo Argos SA 28,055 313 330Grupo Argos SA Preferred 12,404 122 145Grupo Mexico SAB de CV 369,498 1,160 1,321Hanwha Chemical Corp. 8,240 210 141Hanwha Corp. 4,340 160 138Harmony Gold Mining Co., Ltd. 38,249 439 327Hindalco Industries, Ltd. 101,941 374 248Honam Petrochemical Corp. 1,655 379 378Huabao International Holdings, Ltd. 202,000 240 99Hyosung Corp. 2,209 190 151Hyundai Hysco 3,170 141 134Hyundai Steel Co. 5,355 523 436Impala Platinum Holdings, Ltd. 51,873 1,288 1,010Indocement Tunggal Prakarsa
Tbk PT 142,500 283 330Indorama Ventures PCL 134,167 205 110Indorama Ventures PCL NVDR 10,900 9 9Industrias CH Sab De Cv 16,300 103 122Industrias Penoles SAB de CV 13,440 478 666Jastrzebska Spolka Weglowa SA 3,338 134 99Jiangxi Copper Co., Ltd. 135,000 352 353Jindal Steel & Power, Ltd. 36,304 464 305JSW Steel, Ltd. 7,273 133 107KGHM Polska Miedz SA 13,528 609 825Klabin SA 44,200 154 273
The accompanying notes are an integral part of the financial statements. 283

BlackRock CDN MSCI Emerging Markets Index Fund
Statement of Investment Portfolio — As at December 31, 2012
Security Holdings
Average
cost
Fair
value
(in $000s) (in $000s)
Materials (continued)Korea Kumho Petrochemical 1,342 236 162Korea Zinc Co., Ltd. 820 236 308Koza Altin Isletmeleri 3,783 62 91Kumba Iron Ore, Ltd. 7,787 450 513Lafarge Malayan Cement Bhd. 36,600 92 112LCY Chemical Corp. 49,011 80 60Lee & Man Paper
Manufacturing, Ltd. 189,000 124 118LG Chem, Ltd. 4,480 1,411 1,375LG Chem, Ltd. Preferred 768 106 72Mechel-ADR 14,625 220 101Metalurgica Gerdau SA 26,600 380 295Mexichem SAB de CV 99,868 387 550Minera Frisco SAB de CV 60,600 193 251Minmetals Resources, Ltd. 164,000 105 68MMC Norilsk Nickel 4,607 862 841Nan Ya Plastics Corp. 455,000 1,006 874Nine Dragons Paper Holdings, Ltd. 158,000 191 142Northam Platinum, Ltd. 21,798 115 95Novolipetsk Steel OJSC–GDR 6,559 206 132OCI Co., Ltd. 1,531 398 236Oriental Union Chemical Corp. 54,000 67 64Petronas Chemicals Group Bhd. 270,700 529 555POSCO 6,315 2,561 2,047PPC, Ltd. 48,012 202 192PTT Global Chemical PCL 93,793 171 206PTT Global Chemical PCL NVDR 67,300 131 153Sappi, Ltd. 52,081 235 186Semen Gresik Persero Tbk PT 286,000 319 467Sesa Goa, Ltd. 33,201 193 118Severstal OAO 16,065 227 193Siam Cement PCL 29,000 353 442Siam Cement PCL NVDR 12,700 140 182Sinopec Shanghai Petrochemical
Co., Ltd. 236,000 99 83Sociedad Quimica y Minera de
Chile SA 8,717 470 495Southern Copper Corp. 16,400 584 618Sterlite Industries India, Ltd. 129,819 416 281Synthos SA 51,754 96 90Taiwan Cement Corp. 303,000 348 404Taiwan Fertilizer Co., Ltd. 71,000 198 184Tata Steel, Ltd. 29,613 342 231TSRC Corp. 53,400 116 108Tung Ho Steel Enterprise Corp. 74,000 73 75Ultratech Cement, Ltd. 3,519 88 130Uralkali 127,639 940 977Usinas Siderurgicas de Minas Gerais
SA Preferred 36,800 377 229Vale SA 126,400 3,549 2,598
Security Holdings
Average
cost
Fair
value
(in $000s) (in $000s)
Materials (continued)Vale SA Preferred 193,500 4,937 3,845Yingde Gases 89,500 94 90Zhaojin Mining Industry Co., Ltd. 82,000 163 127Zijin Mining Group Co., Ltd. 590,000 314 230
50,145 43,844
Telecommunication Services — 7.7%
Advanced Info Service PCL 70,100 231 436Advanced Info Service PCL NVDR 44,800 296 305America Movil SAB de CV 3,762,600 4,932 4,296Axiata Group Bhd. 246,800 392 530Bharti Airtel, Ltd. 55,075 393 317China Communications Services
Corp., Ltd. 239,200 130 138China Mobile, Ltd. 582,000 5,985 6,748China Telecom Corp., Ltd. 1,340,000 739 740China Unicom Hong Kong, Ltd. 454,000 718 723Chunghwa Telecom Co., Ltd. 368,000 1,211 1,190DiGi.Com Bhd. 300,800 290 514ENTEL Chile SA 11,507 206 235Far Eastone Telecommunications
Co., Ltd. 154,000 254 390Globe Telecom, Inc. 3,240 69 86Idea Cellular, Ltd. 63,738 119 120Indosat Tbk PT 134,500 85 89KT Corp.-ADR 2,248 44 37KT Corp. 1,800 65 59LG Uplus Corp. 22,430 140 162Magyar Telekom
Telecommunications PLC 45,221 127 76Maroc Telecom 8,637 151 107Maxis Bhd. 217,700 410 471Megafon OAO–GDR 8,528 188 198Mobile Telesystems OJSC–ADR 49,914 999 926MTN Group, Ltd. 163,849 2,969 3,407Oi SA 22,396 153 99Oi SA Preferred 80,919 499 325Orascom Telecom Holding SAE 253,095 198 158Philippine Long Distance
Telephone Co. 4,180 245 256Reliance Communications, Ltd. 50,046 101 69Rostelecom OJSC 113,670 676 445Sistema JSFC–GDR 11,646 267 234SK Telecom Co., Ltd. 735 99 104SK Telecom Co., Ltd.-ADR 1,969 35 31Taiwan Mobile Co., Ltd. 161,200 478 586Telecom Egypt 34,291 98 75Telefonica Brasil SA 28,755 809 685Telefonica O2 Czech Republic 10,912 229 184Telekom Malaysia Bhd. 104,200 135 204
The accompanying notes are an integral part of the financial statements. 284

BlackRock CDN MSCI Emerging Markets Index Fund
Statement of Investment Portfolio — As at December 31, 2012
Security Holdings
Average
cost
Fair
value
(in $000s) (in $000s)
Telecommunication Services (continued)Telekomunikacja Polska SA 70,965 394 281Telekomunikasi Indonesia Tbk PT 974,000 932 896Tim Participacoes SA 81,779 386 326Turk Telekomunikasyon 50,677 217 195Turkcell Iletisim Hizmet 74,373 468 477Vodacom Group, Ltd. 35,917 379 523XL Axiata Tbk PT 255,500 163 148
28,104 28,601
Utilities — 3.3%
Aboitiz Power Corp. 178,900 137 160AES Gener SA 235,649 135 150AES Tiete SA 9,700 128 111Aguas Andinas SA 229,665 141 161Centrais Eletricas Brasileiras SA 27,600 308 85Centrais Eletricas Brasileiras SA
Preferred 21,000 309 107CEZ 15,608 669 551China Gas Holdings, Ltd. 308,000 155 241China Longyuan Power Group
Corp. 207,000 187 142China Resources Gas Group, Ltd. 84,000 143 172China Resources Power Holdings
Co., Ltd. 186,000 375 471Cia de Saneamento Basico do
Estado de Sao Paulo 10,900 285 459Cia de Saneamento de Minas
Gerais-COPASA 5,600 124 119Cia Energetica de Minas Gerais 46,425 643 508Cia Energetica de Sao Paulo 15,300 243 144Cia Paranaense de Energia 9,900 226 152Colbun SA 762,192 214 208CPFL Energia SA 23,600 289 245Datang International Power
Generation Co., Ltd. 288,000 108 109E.CL SA 52,478 144 122EDP-Energias do Brasil SA 23,800 175 144Eletropaulo Metropolitana
Eletricidade de Sao Paulo SA 9,300 165 76Empresa Nacional de
Electricidad SA 316,753 572 510Enea SA 10,140 75 51Energy Development Corp. 714,700 96 116Enersis SA 1,261,181 567 456ENN Energy Holdings, Ltd. 74,000 242 320Federal Grid Co. Unified Energy
System JSC 30,185,800 336 198Federal Hydrogenerating Co. JSC 12,414,300 559 297GAIL India, Ltd. 36,749 343 237Glow Energy PCL 4,400 10 11Guangdong Investment, Ltd. 242,000 136 189Huaneng Power International, Inc. 310,000 182 284IDGC Holding JSC 1,794,400 170 115
Security Holdings
Average
cost
Fair
value
(in $000s) (in $000s)
Utilities (continued)Inter Rao Ues OAO 189,335,400 216 153Interconexion Electrica SA 37,226 265 201Isagen SA ESP 81,388 116 115Korea Electric Power Corp. 24,780 609 701Korea Gas Corp. 2,230 95 156Light SA 6,300 93 68MPX Energia SA 14,100 82 75NTPC, Ltd. 55,710 211 157Perusahaan Gas Negara PT 1,055,000 471 488Petronas Gas Bhd. 57,400 238 365PGE Polska Grupa Energetyczna
SA 72,355 516 424Power Grid Corp. of India, Ltd. 107,396 240 222Reliance Infrastructure, Ltd. 10,246 133 97Reliance Power, Ltd. 54,004 130 93Tata Power Co., Ltd. 94,301 242 191Tauron Polska Energia SA 101,829 199 154Tenaga Nasional Bhd. 265,100 590 596Tractebel Energia SA 15,900 254 257YTL Corp. 466,233 231 281YTL Power International Bhd. 221,900 159 113
13,681 12,328
Total Common Stocks 365,601 370,628
Transaction Costs (Note 2) (281)
Total Investments 365,320 370,628
Other Assets and Liabilities — 0.6% 2,223
Net Assets 372,851
Portfolio Concentration
(as a percentage of Net Assets)
Portfolio by Category
As at
December 31,
2012
As at
December 31,
2011
(%) (%)
Consumer Discretionary 8.0 8.2Consumer Staples 8.7 7.9Energy 12.3 14.0Financials 26.3 23.6Health Care 1.3 1.0Industrials 6.4 6.3Information Technology 13.7 13.0Materials 11.7 13.2Telecommunication Services 7.7 8.5Utilities 3.3 3.7Foreign Index Equivalents - 0.4Other Assets and Liabilities 0.6 0.2
Open futures contracts held by the Fund as at December 31, 2012 areshown in Note 4.
The accompanying notes are an integral part of the financial statements. 285
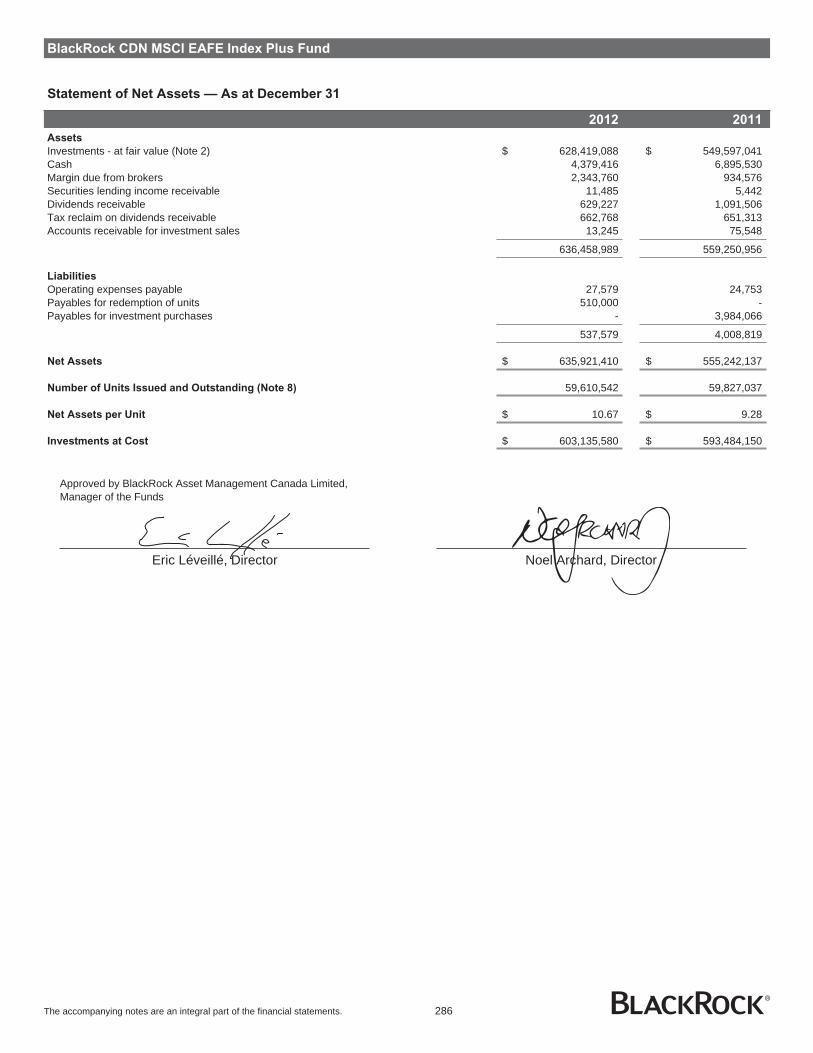
BlackRock CDN MSCI EAFE Index Plus Fund
Statement of Net Assets — As at December 31
2012 2011
Assets
Investments - at fair value (Note 2) $ 628,419,088 $ 549,597,041Cash 4,379,416 6,895,530Margin due from brokers 2,343,760 934,576Securities lending income receivable 11,485 5,442Dividends receivable 629,227 1,091,506Tax reclaim on dividends receivable 662,768 651,313Accounts receivable for investment sales 13,245 75,548
636,458,989 559,250,956
Liabilities
Operating expenses payable 27,579 24,753Payables for redemption of units 510,000 -Payables for investment purchases - 3,984,066
537,579 4,008,819
Net Assets $ 635,921,410 $ 555,242,137
Number of Units Issued and Outstanding (Note 8) 59,610,542 59,827,037
Net Assets per Unit $ 10.67 $ 9.28
Investments at Cost $ 603,135,580 $ 593,484,150
Approved by BlackRock Asset Management Canada Limited,Manager of the Funds
Eric Léveillé, Director Noel Archard, Director
The accompanying notes are an integral part of the financial statements. 286

BlackRock CDN MSCI EAFE Index Plus Fund
Statement of Operations — For the Years Ended December 31
2012 2011
Revenue
Dividend income $ 20,179,274 $ 22,160,548Interest income 13,746 19,433Securities lending income 308,450 287,809Net gain (loss) from futures contracts 1,144,656 (1,527,295)Foreign exchange gain (loss) (383,418) 252,446Withholding taxes (1,097,867) (1,038,511)
20,164,841 20,154,430
Expenses
Custodian fees 177,584 149,588Fund accounting expenses 73,314 71,791Unitholder communication costs - 601Audit fees 9,418 9,996Securities filing fees 9,830 8,958Independent review committee fees 248 634Other operating expenses 24,101 29,728
294,495 271,296
Net Investment Income for the Year 19,870,346 19,883,134
Gain (Loss) on Investments
Net realized loss on sale of investments (5,935,942) (1,631,252)Transaction costs (Note 2,13) (89,428) (129,698)Net change in unrealized appreciation (depreciation) in value of investments 69,170,617 (82,539,140)
Net Gain (Loss) on Investments 63,145,247 (84,300,090)
Increase (Decrease) in Net Assets from Operations $ 83,015,593 $ (64,416,956)
Increase (Decrease) in Net Assets from Operations per Unit $ 1.40 $ (1.09)
Statement of Changes in Net Assets — For the Years Ended December 31
2012 2011
Net Assets - Beginning of Year $ 555,242,137 $ 503,659,396
Increase (Decrease) in Net Assets from Operations 83,015,593 (64,416,956)
Capital Transactions
Proceeds from issue of units 19,174,043 115,999,697Reinvestment of distributions 20,014,863 19,128,543Redemption of units (21,510,363) -
Net capital transactions 17,678,543 135,128,240
Distributions
From net investment income (20,014,863) (19,121,539)From capital gains - (7,004)
Total distributions (20,014,863) (19,128,543)
Increase in Net Assets for the Year 80,679,273 51,582,741
Net Assets - End of Year $ 635,921,410 $ 555,242,137
The accompanying notes are an integral part of the financial statements. 287

BlackRock CDN MSCI EAFE Index Plus Fund
Statement of Investment Portfolio — As at December 31, 2012
Security Holdings
Average
cost
Fair
value
(in $000s) (in $000s)
Common Stocks
Consumer Discretionary — 11.6%
ABC-Mart, Inc. 1,600 60 69Accor SA 8,390 401 294Adidas AG 12,030 689 1,062Aegis Group PLC 156,800 583 596Aisin Seiki Co., Ltd. 11,100 348 340Anheuser-Busch InBev 46,379 2,524 3,995Asics Corp. 8,900 95 134Axel Springer AG 2,208 107 93Bayerische Motoren Werke AG 19,065 1,097 1,829Bayerische Motoren Werke AG
Preferred 3,011 121 193Benesse Corp. 3,900 181 161Bridgestone Corp. 37,400 676 957British Sky Broadcasting PLC 62,478 646 775Burberry Group PLC 25,526 340 507Bureau Veritas SA 3,177 200 352Carnival Corp. 11,058 429 405Casio Computer Co., Ltd. 13,400 102 116Christian Dior 3,134 361 527Cie Financiere Richemont SA 30,159 1,296 2,341Compass Group PLC 108,884 1,004 1,278Continental AG 3,595 344 413Crown, Ltd. 22,821 176 251Daihatsu Motor Co., Ltd. 11,000 130 217DaimlerChrysler AG 52,361 2,983 2,844Daito Trust Construction Co., Ltd. 4,200 242 393Daiwa House Industry Co., Ltd. 29,000 318 493DeNa Co., Ltd. 6,000 175 196Denso Corp. 28,000 860 958Dentsu, Inc. 10,200 290 271Don Quijote Co., Ltd. 3,100 126 113Echo Entertainment Group Ltd. 42,253 184 149Fast Retailing Co., Ltd. 3,100 488 780Fiat SpA 49,594 541 247Flight Centre, Ltd. 3,079 86 86Fuji Heavy Industries, Ltd. 34,000 214 421FUJIFILM Holdings Corp. 26,700 882 529G4S PLC 79,744 331 331Galaxy Entertainment Group, Ltd. 121,000 324 471GKN PLC 93,301 308 346Groupe Aeroplan, Inc. 4,571 378 360Hakuhodo DY Holdings, Inc. 1,390 79 89Harvey Norman Holdings, Ltd. 27,963 90 55Hennes & Mauritz AB-Class B 54,922 1,775 1,886Honda Motor Co., Ltd. 94,100 3,281 3,408Hugo Boss AG 1,402 139 147Husqvarna AB 24,606 180 148
Security Holdings
Average
cost
Fair
value
(in $000s) (in $000s)
Consumer Discretionary (continued)Inditex SA 12,581 898 1,734Intercontinental Hotels Group PLC 15,694 304 433Isetan Mitsukoshi Holdings, Ltd. 21,100 230 204Isuzu Motors, Ltd. 69,000 299 406ITV PLC 210,989 258 359Jardine Cycle & Carriage, Ltd. 6,000 139 235JC Decaux SA 3,762 104 88Jupiter Telecommunications Co. 118 120 146Kabel Deutschland Holding AG 5,228 278 387Kingfisher PLC 137,258 562 630Koito Manufacturing Co., Ltd. 6,000 96 86Lagardere S.C.A. 6,800 268 225Li & Fung, Ltd. 336,000 977 590Luxottica Group SpA 9,442 318 385LVMH Moet Hennessy Louis
Vuitton SA 14,669 1,895 2,672Makita Corp. 6,300 208 288Marks & Spencer Group PLC 93,038 516 576Marui Co., Ltd. 13,100 105 103Mazda Motor Corp. 145,000 210 289McDonald’s Holdings Co. 3,900 91 102MGM China Holdings, Ltd. 54,000 90 97Mitsubishi Motors Corp. 226,000 306 232Namco Bandai Holdings, Inc. 11,400 117 147Next PLC 14,810 635 888NGK Spark Plug Co., Ltd. 10,000 137 131NHK Spring Co., Ltd. 9,000 90 73Nikon Corp. 19,800 459 576Nissan Motor Co., Ltd. 143,200 1,222 1,337Nitori Co., Ltd. 2,050 171 149NOK Corp. 5,800 101 89Nokian Renkaat OYJ 6,297 183 248OPAP SA 12,989 227 92Oriental Land Co., Ltd. 2,900 339 349Panasonic Corp. 126,900 1,715 761Pearson PLC 46,919 733 902Peugeot SA 12,956 338 93Pirelli & C SpA 13,785 101 157Porsche AG Preferred 8,844 502 714PPR SA 4,407 624 812ProSiebenSat.1 Media AG 4,976 142 139Publicis Groupe 10,159 492 603Puma AG Rudolf Dassler Sport 1,042 308 307Rakuten, Inc. 42,000 335 325Reed Elsevier NV 39,528 482 579Reed Elsevier PLC 69,886 568 725Renault SA 11,111 524 593Rinnai Corp. 1,800 97 121Sands China, Ltd. 138,000 396 601
The accompanying notes are an integral part of the financial statements. 288

BlackRock CDN MSCI EAFE Index Plus Fund
Statement of Investment Portfolio — As at December 31, 2012
Security Holdings
Average
cost
Fair
value
(in $000s) (in $000s)
Consumer Discretionary (continued)Sankyo Co., Ltd./Gunma 3,100 150 122Sanrio Co., Ltd. 2,450 131 77Sega Sammy Holdings, Inc. 11,900 178 199Sekisui Chemical Co., Ltd. 25,000 175 215Sekisui House, Ltd. 31,000 293 336Shangri-La Asia, Ltd. 89,166 181 176Sharp Corp. 57,000 662 199Shimamura Co., Ltd. 1,300 128 125Shimano, Inc. 4,200 195 266Singapore Press Holdings, Ltd. 83,000 244 272SJM Holdings, Ltd. 110,000 184 254Sky City Entertainment Group, Ltd. 33,899 80 104Sodexho Alliance SA 5,443 349 455Sony Corp. 57,800 1,858 637Stanley Electric Co., Ltd. 8,400 160 118Sumitomo Rubber Industries, Inc. 10,000 100 119Suzuki Motor Corp. 21,100 467 545Swatch Group AG 1,779 590 892Swatch Group AG-Class B 2,500 149 214Tabcorp Holdings, Ltd. 41,165 233 129Takashimaya Co., Ltd. 15,000 131 106Tatts Group, Ltd. 77,668 179 242Toho Co., Ltd./Tokyo 6,700 113 117Toyoda Gosei Co., Ltd. 3,600 96 72Toyota Boshoku Corp. 3,800 65 43Toyota Industries Corp. 9,300 270 292Toyota Motor Corp. 158,700 6,219 7,310TUI Travel PLC 27,072 93 124USS Co., Ltd. 1,310 103 136Vivendi SA 75,053 1,807 1,670Volkswagen AG 1,690 178 362Volkswagen AG Preferred 8,331 1,299 1,887Whitbread PLC 10,156 263 401Wolters Kluwer NV 17,254 364 350WPP PLC 72,466 788 1,040Wynn Macau, Ltd. 88,800 174 238Yamada Denki Co., Ltd. 4,950 357 189Yamaha Corp. 8,800 105 92Yamaha Motor Co., Ltd. 15,600 238 170Yamato Kogyo Co., Ltd. 2,400 72 69Yue Yuen Industrial Holdings 41,000 137 136
65,052 73,904
Consumer Staples — 10.5%
Aeon Co., Ltd. 34,600 401 392Ajinomoto Co., Inc. 37,000 366 487Aryzta AG 4,906 201 250Asahi Breweries, Ltd. 21,800 511 461Associated British Foods PLC 20,617 354 521Barry Callebaut AG 103 96 99
Security Holdings
Average
cost
Fair
value
(in $000s) (in $000s)
Consumer Staples (continued)Beiersdorf AG 5,847 340 474British American Tobacco PLC 112,250 4,029 5,667Calbee, Inc. 900 82 63Carlsberg A/S-Class B 6,170 538 601Carrefour SA 34,718 1,539 881Casino Guichard Perrachon SA 3,254 288 308Coca Cola Hellenic Bottling Co. SA 11,474 277 261Coca-Cola Amatil, Ltd. 32,910 358 458Coca-Cola West Japan Co., Ltd. 3,300 58 51Colruyt SA 4,385 216 216Danone 33,407 1,974 2,184D.E Master Blenders 1753 33,988 424 388Delhaize Group 5,792 473 230Diageo PLC 144,742 2,737 4,184Distribuidora Internacional de
Alimentacion SA 34,865 164 220Familymart Co., Ltd. 3,600 127 147Golden Agri-Resources, Ltd. 402,000 187 211Groupe Danone 19,000 132 75Heineken Holding NV 5,733 238 311Heineken NV 13,245 636 875Henkel KGaA 7,484 349 507Henkel KGaA Preferred 10,281 561 838Imperial Tobacco Group PLC 65,553 2,118 2,516J Front Retailing Co., Ltd. 27,000 150 148J Sainsbury PLC 71,079 357 397Japan Tobacco, Inc. 51,800 930 1,455Jeronimo Martins SGPS SA 12,646 142 242Kao Corp. 30,300 756 785Kerry Group PLC-Class A 8,497 275 443Kesko OYJ-Class B 3,665 139 119Kikkoman Corp. 10,000 113 141Kirin Holdings Co., Ltd. 50,000 696 583Koninklijke Ahold NV 60,124 807 800L’Oreal SA 13,917 1,487 1,915Lawson, Inc. 3,500 249 237Lindt & Spruengli AG 50 120 162Lindt & Spruengli AG-PC 6 175 225Meiji Holdings Co., Ltd. 3,800 154 164Metcash, Ltd. 49,552 191 170Metro AG 7,397 237 204Nestle SA 186,311 9,651 12,079Nippon Meat Packers, Inc. 10,000 132 137Nisshin Seifun Group, Inc. 10,500 131 130Nissin Food Products Co., Ltd. 3,500 126 132Olam International, Ltd. 93,000 181 117Pernod-Ricard 12,214 1,082 1,397Reckitt Benckiser Group PLC 37,610 1,980 2,359Remy Cointreau SA 1,264 138 136
The accompanying notes are an integral part of the financial statements. 289

BlackRock CDN MSCI EAFE Index Plus Fund
Statement of Investment Portfolio — As at December 31, 2012
Security Holdings
Average
cost
Fair
value
(in $000s) (in $000s)
Consumer Staples (continued)SABMiller PLC 55,222 1,779 2,522Seven & I Holdings Co., Ltd. 43,400 1,113 1,218Shiseido Co., Ltd. 20,900 435 293Suedzucker AG 4,639 116 189Swedish Match AB 12,283 305 410Tate & Lyle PLC 26,602 294 327Tesco PLC 464,122 2,954 2,524TNT Express NV 18,533 228 205Toyo Suisan Kaisha, Ltd. 5,000 117 132Treasury Wine Estates, Ltd. 37,341 195 181Uni-Charm Corp. 6,500 239 336Unilever NV 140,823 4,390 5,318Unilever PLC 25,132 743 962William Morrison Supermarkets 209,763 908 893Wilmar International, Ltd. 109,000 507 296Woolworths, Ltd. 71,118 1,790 2,156Yakult Honsha Co., Ltd. 5,600 156 243Yamazaki Baking Co., Ltd. 7,000 90 77
56,532 66,835
Energy — 7.5%
Aker Solutions ASA 9,483 135 191BG Group PLC 196,164 3,554 3,211Bourbon SA 11,002 308 300BP PLC 1,099,948 8,695 7,562Caltex Australia, Ltd. 7,424 85 147Cosmo Oil Company, Ltd. 32,000 90 70ENI SpA 146,884 3,235 3,536Fugro NV 3,949 250 230Galp Energia SGPS SA-Class B 15,403 252 238Idemitsu Kosan Co., Ltd. 1,200 100 103Inpex Holdings, Inc. 127 683 668Japan Petroleum Exploration Co. 1,600 75 56JX Holdings, Inc. 129,900 765 721Lundin Petroleum AB 12,544 323 287Neste Oil OYJ 7,618 124 98OMV AG 8,375 316 301Origin Energy, Ltd. 62,527 908 751Repsol SA 47,049 - 29Repsol YPF SA 47,049 1,177 945Royal Dutch Shell PLC-Class A 214,643 6,607 7,368Royal Dutch Shell PLC-Class B 152,022 4,559 5,348Saipem 15,291 602 588Santos, Ltd. 54,610 702 627SeaDrill, Ltd. 20,234 547 736Showa Shell Sekiyu KK 10,200 80 57Statoil ASA 64,187 1,493 1,596Subsea 7 SA 16,278 377 385Technip SA 5,848 455 666Tenaris SA 27,261 564 557
Security Holdings
Average
cost
Fair
value
(in $000s) (in $000s)
Energy (continued)TonenGeneral Sekiyu KK 16,000 152 137Total SA 122,950 6,600 6,295Transocean, Ltd. 20,705 1,367 909Tullow Oil PLC 52,248 1,000 1,062Whitehaven Coal, Ltd. 25,515 144 92Woodside Petroleum, Ltd. 38,008 1,539 1,331WorleyParsons, Ltd. 11,705 283 283
48,146 47,481
Financials — 24.0%
3i Group PLC 56,660 186 199Aberdeen Asset Management PLC 48,646 188 289Acom Co., Ltd. 2,300 67 65Admiral Group PLC 11,676 249 219Aegon NV 101,090 665 636Aeon Credit Service Co., Ltd. 4,700 57 94Aeon Mall Co., Ltd. 4,300 98 105Ageas 13,393 383 390AIA Group, Ltd. 772,759 2,620 3,003Allianz AG 26,288 3,053 3,610AMP, Ltd. 167,110 868 831Anglo Irish Bank Co. PLC 80,243 3,355 2,459Aozora Bank, Ltd. 31,000 80 94Ascendas REIT 108,000 163 209Assicurazioni Generali SpA 67,147 1,385 1,210ASX, Ltd. 9,940 310 321Aviva PLC 167,473 946 1,011AXA SA 84,372 1,606 1,477Baloise Holding AG 2,705 224 230Banca Monte dei Paschi di
Siena SpA 365,141 285 108Banco Bilbao Vizcaya Argentaria SA 314,531 3,472 2,850Banco de Sabadell SA 160,946 568 415Banco Espirito Santo SA 113,276 213 133Banco Popolare Scarl 98,122 408 162Banco Popular Espanol SA 306,924 538 235Banco Santander Central Hispano
SA 596,056 6,620 4,695Bank Hapoalim BM 59,008 247 251Bank Leumi Le-Israel BM 72,952 305 246Bank of East Asia, Ltd. 79,400 309 303Bank of Kyoto, Ltd. (The) 18,000 159 150Bank of Yokohama, Ltd. 71,000 360 326Bankia SA 56,148 260 29Banque Cantonale Vaudoise 171 90 90Barclays PLC 656,166 3,195 2,783Bendigo Bank, Ltd. 22,201 191 195BNP Paribas 57,907 3,853 3,231BOC Hong Kong Holdings, Ltd. 214,500 558 663British Land Co. PLC 49,252 362 448
The accompanying notes are an integral part of the financial statements. 290
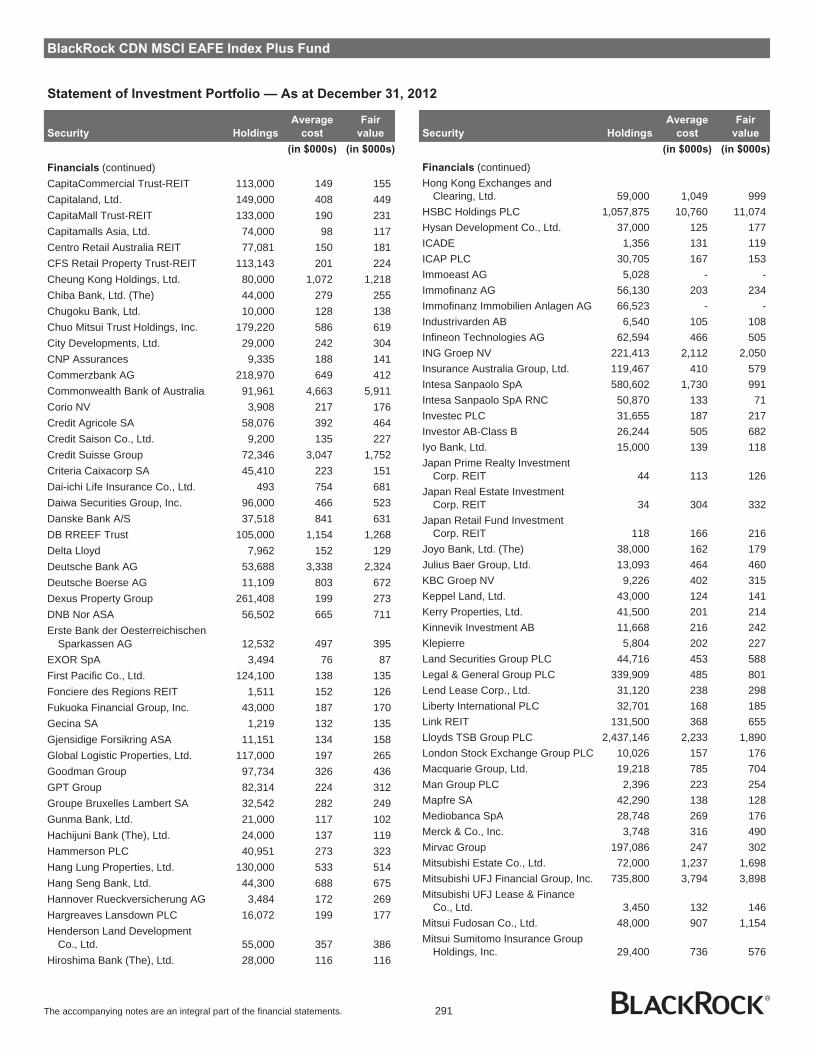
BlackRock CDN MSCI EAFE Index Plus Fund
Statement of Investment Portfolio — As at December 31, 2012
Security Holdings
Average
cost
Fair
value
(in $000s) (in $000s)
Financials (continued)CapitaCommercial Trust-REIT 113,000 149 155Capitaland, Ltd. 149,000 408 449CapitaMall Trust-REIT 133,000 190 231Capitamalls Asia, Ltd. 74,000 98 117Centro Retail Australia REIT 77,081 150 181CFS Retail Property Trust-REIT 113,143 201 224Cheung Kong Holdings, Ltd. 80,000 1,072 1,218Chiba Bank, Ltd. (The) 44,000 279 255Chugoku Bank, Ltd. 10,000 128 138Chuo Mitsui Trust Holdings, Inc. 179,220 586 619City Developments, Ltd. 29,000 242 304CNP Assurances 9,335 188 141Commerzbank AG 218,970 649 412Commonwealth Bank of Australia 91,961 4,663 5,911Corio NV 3,908 217 176Credit Agricole SA 58,076 392 464Credit Saison Co., Ltd. 9,200 135 227Credit Suisse Group 72,346 3,047 1,752Criteria Caixacorp SA 45,410 223 151Dai-ichi Life Insurance Co., Ltd. 493 754 681Daiwa Securities Group, Inc. 96,000 466 523Danske Bank A/S 37,518 841 631DB RREEF Trust 105,000 1,154 1,268Delta Lloyd 7,962 152 129Deutsche Bank AG 53,688 3,338 2,324Deutsche Boerse AG 11,109 803 672Dexus Property Group 261,408 199 273DNB Nor ASA 56,502 665 711Erste Bank der Oesterreichischen
Sparkassen AG 12,532 497 395EXOR SpA 3,494 76 87First Pacific Co., Ltd. 124,100 138 135Fonciere des Regions REIT 1,511 152 126Fukuoka Financial Group, Inc. 43,000 187 170Gecina SA 1,219 132 135Gjensidige Forsikring ASA 11,151 134 158Global Logistic Properties, Ltd. 117,000 197 265Goodman Group 97,734 326 436GPT Group 82,314 224 312Groupe Bruxelles Lambert SA 32,542 282 249Gunma Bank, Ltd. 21,000 117 102Hachijuni Bank (The), Ltd. 24,000 137 119Hammerson PLC 40,951 273 323Hang Lung Properties, Ltd. 130,000 533 514Hang Seng Bank, Ltd. 44,300 688 675Hannover Rueckversicherung AG 3,484 172 269Hargreaves Lansdown PLC 16,072 199 177Henderson Land Development
Co., Ltd. 55,000 357 386Hiroshima Bank (The), Ltd. 28,000 116 116
Security Holdings
Average
cost
Fair
value
(in $000s) (in $000s)
Financials (continued)Hong Kong Exchanges and
Clearing, Ltd. 59,000 1,049 999HSBC Holdings PLC 1,057,875 10,760 11,074Hysan Development Co., Ltd. 37,000 125 177ICADE 1,356 131 119ICAP PLC 30,705 167 153Immoeast AG 5,028 - -Immofinanz AG 56,130 203 234Immofinanz Immobilien Anlagen AG 66,523 - -Industrivarden AB 6,540 105 108Infineon Technologies AG 62,594 466 505ING Groep NV 221,413 2,112 2,050Insurance Australia Group, Ltd. 119,467 410 579Intesa Sanpaolo SpA 580,602 1,730 991Intesa Sanpaolo SpA RNC 50,870 133 71Investec PLC 31,655 187 217Investor AB-Class B 26,244 505 682Iyo Bank, Ltd. 15,000 139 118Japan Prime Realty Investment
Corp. REIT 44 113 126Japan Real Estate Investment
Corp. REIT 34 304 332Japan Retail Fund Investment
Corp. REIT 118 166 216Joyo Bank, Ltd. (The) 38,000 162 179Julius Baer Group, Ltd. 13,093 464 460KBC Groep NV 9,226 402 315Keppel Land, Ltd. 43,000 124 141Kerry Properties, Ltd. 41,500 201 214Kinnevik Investment AB 11,668 216 242Klepierre 5,804 202 227Land Securities Group PLC 44,716 453 588Legal & General Group PLC 339,909 485 801Lend Lease Corp., Ltd. 31,120 238 298Liberty International PLC 32,701 168 185Link REIT 131,500 368 655Lloyds TSB Group PLC 2,437,146 2,233 1,890London Stock Exchange Group PLC 10,026 157 176Macquarie Group, Ltd. 19,218 785 704Man Group PLC 2,396 223 254Mapfre SA 42,290 138 128Mediobanca SpA 28,748 269 176Merck & Co., Inc. 3,748 316 490Mirvac Group 197,086 247 302Mitsubishi Estate Co., Ltd. 72,000 1,237 1,698Mitsubishi UFJ Financial Group, Inc. 735,800 3,794 3,898Mitsubishi UFJ Lease & Finance
Co., Ltd. 3,450 132 146Mitsui Fudosan Co., Ltd. 48,000 907 1,154Mitsui Sumitomo Insurance Group
Holdings, Inc. 29,400 736 576
The accompanying notes are an integral part of the financial statements. 291
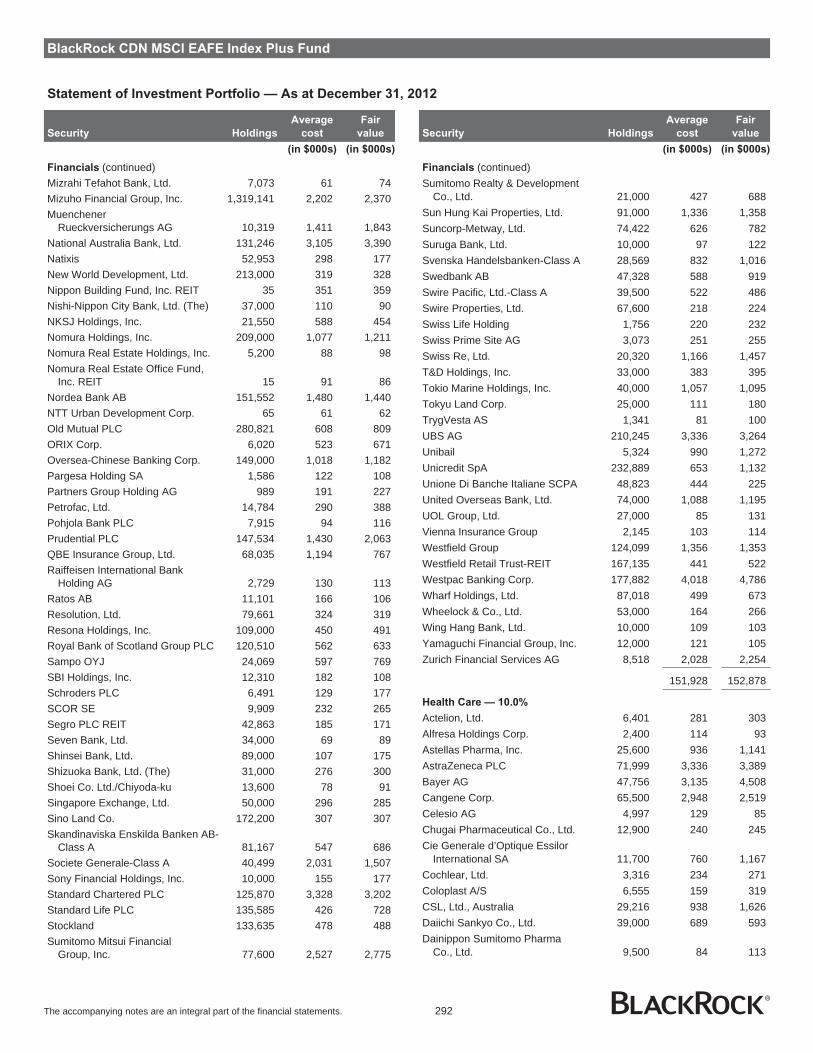
BlackRock CDN MSCI EAFE Index Plus Fund
Statement of Investment Portfolio — As at December 31, 2012
Security Holdings
Average
cost
Fair
value
(in $000s) (in $000s)
Financials (continued)Mizrahi Tefahot Bank, Ltd. 7,073 61 74Mizuho Financial Group, Inc. 1,319,141 2,202 2,370Muenchener
Rueckversicherungs AG 10,319 1,411 1,843National Australia Bank, Ltd. 131,246 3,105 3,390Natixis 52,953 298 177New World Development, Ltd. 213,000 319 328Nippon Building Fund, Inc. REIT 35 351 359Nishi-Nippon City Bank, Ltd. (The) 37,000 110 90NKSJ Holdings, Inc. 21,550 588 454Nomura Holdings, Inc. 209,000 1,077 1,211Nomura Real Estate Holdings, Inc. 5,200 88 98Nomura Real Estate Office Fund,
Inc. REIT 15 91 86Nordea Bank AB 151,552 1,480 1,440NTT Urban Development Corp. 65 61 62Old Mutual PLC 280,821 608 809ORIX Corp. 6,020 523 671Oversea-Chinese Banking Corp. 149,000 1,018 1,182Pargesa Holding SA 1,586 122 108Partners Group Holding AG 989 191 227Petrofac, Ltd. 14,784 290 388Pohjola Bank PLC 7,915 94 116Prudential PLC 147,534 1,430 2,063QBE Insurance Group, Ltd. 68,035 1,194 767Raiffeisen International Bank
Holding AG 2,729 130 113Ratos AB 11,101 166 106Resolution, Ltd. 79,661 324 319Resona Holdings, Inc. 109,000 450 491Royal Bank of Scotland Group PLC 120,510 562 633Sampo OYJ 24,069 597 769SBI Holdings, Inc. 12,310 182 108Schroders PLC 6,491 129 177SCOR SE 9,909 232 265Segro PLC REIT 42,863 185 171Seven Bank, Ltd. 34,000 69 89Shinsei Bank, Ltd. 89,000 107 175Shizuoka Bank, Ltd. (The) 31,000 276 300Shoei Co. Ltd./Chiyoda-ku 13,600 78 91Singapore Exchange, Ltd. 50,000 296 285Sino Land Co. 172,200 307 307Skandinaviska Enskilda Banken AB-
Class A 81,167 547 686Societe Generale-Class A 40,499 2,031 1,507Sony Financial Holdings, Inc. 10,000 155 177Standard Chartered PLC 125,870 3,328 3,202Standard Life PLC 135,585 426 728Stockland 133,635 478 488Sumitomo Mitsui Financial
Group, Inc. 77,600 2,527 2,775
Security Holdings
Average
cost
Fair
value
(in $000s) (in $000s)
Financials (continued)Sumitomo Realty & Development
Co., Ltd. 21,000 427 688Sun Hung Kai Properties, Ltd. 91,000 1,336 1,358Suncorp-Metway, Ltd. 74,422 626 782Suruga Bank, Ltd. 10,000 97 122Svenska Handelsbanken-Class A 28,569 832 1,016Swedbank AB 47,328 588 919Swire Pacific, Ltd.-Class A 39,500 522 486Swire Properties, Ltd. 67,600 218 224Swiss Life Holding 1,756 220 232Swiss Prime Site AG 3,073 251 255Swiss Re, Ltd. 20,320 1,166 1,457T&D Holdings, Inc. 33,000 383 395Tokio Marine Holdings, Inc. 40,000 1,057 1,095Tokyu Land Corp. 25,000 111 180TrygVesta AS 1,341 81 100UBS AG 210,245 3,336 3,264Unibail 5,324 990 1,272Unicredit SpA 232,889 653 1,132Unione Di Banche Italiane SCPA 48,823 444 225United Overseas Bank, Ltd. 74,000 1,088 1,195UOL Group, Ltd. 27,000 85 131Vienna Insurance Group 2,145 103 114Westfield Group 124,099 1,356 1,353Westfield Retail Trust-REIT 167,135 441 522Westpac Banking Corp. 177,882 4,018 4,786Wharf Holdings, Ltd. 87,018 499 673Wheelock & Co., Ltd. 53,000 164 266Wing Hang Bank, Ltd. 10,000 109 103Yamaguchi Financial Group, Inc. 12,000 121 105Zurich Financial Services AG 8,518 2,028 2,254
151,928 152,878
Health Care — 10.0%
Actelion, Ltd. 6,401 281 303Alfresa Holdings Corp. 2,400 114 93Astellas Pharma, Inc. 25,600 936 1,141AstraZeneca PLC 71,999 3,336 3,389Bayer AG 47,756 3,135 4,508Cangene Corp. 65,500 2,948 2,519Celesio AG 4,997 129 85Chugai Pharmaceutical Co., Ltd. 12,900 240 245Cie Generale d’Optique Essilor
International SA 11,700 760 1,167Cochlear, Ltd. 3,316 234 271Coloplast A/S 6,555 159 319CSL, Ltd., Australia 29,216 938 1,626Daiichi Sankyo Co., Ltd. 39,000 689 593Dainippon Sumitomo Pharma
Co., Ltd. 9,500 84 113
The accompanying notes are an integral part of the financial statements. 292

BlackRock CDN MSCI EAFE Index Plus Fund
Statement of Investment Portfolio — As at December 31, 2012
Security Holdings
Average
cost
Fair
value
(in $000s) (in $000s)
Health Care (continued)Eisai Co., Ltd. 14,500 514 601Elan Corp. PLC 29,159 208 291Elekta AB 20,844 254 323Fresenius Medical Care AG & Co.
KGaA 12,209 731 838Fresenius SE 7,130 557 817Getinge AB 11,360 263 383GlaxoSmithKline PLC 287,428 5,482 6,206Grifols SA-ADR 12,301 146 317Hisamitsu Pharmaceutical Co. 3,600 142 177Kyowa Hakko Kogyo Co., Ltd. 15,000 160 147Lonza Group AG 3,101 222 166M3, Inc. 37 68 59Miraca Holdings, Inc. 3,300 120 132Mitsubishi Tanabe Pharma Corp. 13,100 192 170Novartis AG Registered 132,881 7,120 8,304Novo-Nordisk A/S-Class B 23,517 2,183 3,788Olympus Corp. 12,600 351 242ONO Pharmaceutical Co., Ltd. 4,700 212 238Orion OYJ-Class B 5,542 110 161Otsuka Holdings Co., Ltd. 20,800 571 582Prothena Corp. PLC 711 8 5Qiagen NV 13,487 287 243Ramsay Health Care, Ltd. 7,627 121 214Roche Holding AG Genusschein 40,585 6,277 8,123RSA Insurance Group PLC 205,698 399 418Sanofi-Aventis 68,884 4,756 6,441Santen Pharmaceutical Co., Ltd. 4,300 149 164Shionogi & Co., Ltd. 17,100 323 283Shire, Ltd. 32,346 769 986Smith & Nephew PLC 51,404 527 565Sonic Healthcare, Ltd. 21,206 247 292Sonova Holding AG 2,861 343 316Suzuken Co., Ltd. 4,100 142 115Sysmex Corp. 4,200 130 192Taisho Pharmaceutical Holdings
Co., Ltd. 2,100 144 143Takeda Pharmaceutical Co., Ltd. 45,600 2,066 2,024Terumo Corp. 8,900 461 349Teva Pharmaceutical Industries, Ltd. 54,197 3,033 2,023Tsumura & Co. 3,300 100 99UCB SA 6,234 239 354William Demant Holding 1,505 113 128
54,223 63,791
Industrials — 12.8%
ABB, Ltd. 127,018 2,592 2,591Abertis Infraestructuras SA 20,849 344 339Acciona SA 1,497 137 110ACS Actividades Cons y Serv 8,132 355 197
Security Holdings
Average
cost
Fair
value
(in $000s) (in $000s)
Industrials (continued)Adecco SA 7,580 435 396Aeroports de Paris 1,688 135 129Aggreko PLC 15,348 369 432Airlines 13,237 219 248Alfa Laval AB 19,536 316 405All Nippon Airways Co., Ltd. 65,203 160 136ALS, Ltd./Queensland 19,335 197 215Alstom 11,890 441 470Amada Co., Ltd. 20,000 137 128Amadeus IT Holding SA 17,945 340 447AMEC PLC 37,781 576 613Andritz AG 4,125 211 263Antofagasta PLC 22,778 370 487AP Moller-Maersk A/S-Class A 31 260 218AP Moller-Maersk A/S-Class B 76 655 570Asahi Glass Co., Ltd. 59,000 653 424Asciano Group 55,609 261 268Assa Abloy AB-Class B 19,128 453 711Atlantia SpA 18,961 359 340Atlas Copco AB-Class A 38,609 692 1,054Atlas Copco AB-Class B 22,430 369 543Auckland International Airport, Ltd. 50,956 77 112Aurizon Holdings, Ltd. 104,221 300 402Babcock International Group PLC 20,608 202 322BAE Systems PLC 188,131 995 1,026Balfour Beatty PLC 39,847 172 177Bouygues 10,648 495 312Brambles Industries PLC 90,022 581 699Brenntag AG 2,957 327 384Bunzl PLC 19,155 244 312Cathay Pacific Airways, Ltd. 69,000 146 126Central Japan Railway Co. 8,500 703 683Chiyoda Corp. 9,000 86 127Cie de Saint-Gobain 23,096 1,092 974Cie Generale de Geophysique-
Veritas 9,599 255 285Cie Generale des Etablissements
Michelin 10,566 776 993Cobham PLC 61,944 198 221ComfortDelGro Corp., Ltd. 110,000 126 159Dai Nippon Printing Co., Ltd. 32,000 421 248Daikin Industries, Ltd. 13,600 483 461Delek Group, Ltd. 245 55 57Deutsche Post AG 52,400 961 1,139DSV A/S 10,873 202 279East Japan Railway Co. 19,300 1,312 1,238Edenred 9,645 199 294European Aeronautic Defense and
Space Co. 23,893 638 922Experian, Ltd. 58,386 608 926
The accompanying notes are an integral part of the financial statements. 293

BlackRock CDN MSCI EAFE Index Plus Fund
Statement of Investment Portfolio — As at December 31, 2012
Security Holdings
Average
cost
Fair
value
(in $000s) (in $000s)
Industrials (continued)Fanuc, Ltd. 11,100 1,397 2,034Ferrovial SA 22,858 211 335Fiat Industrial SpA 49,551 592 537Finmeccanica SpA 23,804 284 136Fraport AG 2,134 116 123Fraser and Neave, Ltd. 53,000 214 418Fuji Electric Holdings Co., Ltd. 30,000 89 73Furukawa Electric Co., Ltd. (The) 38,000 171 84GEA Group AG 10,017 246 322Geberit AG 2,200 400 482Genting International PLC 353,000 340 397Hankyu Holdings, Inc. 65,000 320 333Hexagon AB 13,465 229 336Hino Motors, Ltd. 15,000 79 133Hitachi Construction Machinery
Co., Ltd. 6,300 137 130Hitachi High-Technologies Corp. 3,600 79 73Hochtief AG 1,751 132 100Hopewell Holdings, Ltd. 31,500 98 134Hutchison Port Holdings Trust-UNIT 303,522 257 237Hutchison Whampoa, Ltd. 123,000 977 1,277IHI Corp. 78,000 150 198IMI PLC 18,871 280 334International Consolidated Airlines
Group SA 54,937 237 159Intertek Group PLC 9,239 269 463Invensys PLC 47,928 221 252Itochu Corp. 86,600 804 904Japan Airlines Co., Ltd. 3,400 160 145Japan Steel Works, Ltd. (The) 18,000 186 115JGC Corp. 12,000 234 370JS Group Corp. 15,400 323 340JTEKT Corp. 12,900 148 121Kajima Corp. 47,000 119 154Kamigumi Co., Ltd. 14,000 115 111Kawasaki Heavy Industries, Ltd. 83,000 246 222Keihin Electric Express Railway
Co., Ltd. 27,000 239 238Keio Corp. 34,000 229 251Keisei Electric Railway Co., Ltd. 16,000 104 134Keppel Corp., Ltd. 82,200 553 736Kinden Corp. 7,000 63 45Kintetsu Corp. 95,000 313 386Komatsu, Ltd. 53,700 1,188 1,349Kone OYJ 8,958 415 656Koninklijke Boskalis Westminster NV 4,340 176 194Koninklijke Vopak NV 4,037 181 281Kubota Corp. 63,000 633 715Kuehne & Nagel International AG 3,135 353 375Kurita Water Industries, Ltd. 6,600 189 144
Security Holdings
Average
cost
Fair
value
(in $000s) (in $000s)
Industrials (continued)Legrand SA 13,716 457 573Leighton Holdings, Ltd. 8,703 259 161Marubeni Corp. 95,000 604 670Medipal Holdings Corp. 8,400 100 92Meggitt PLC 44,770 276 277Melrose Industries PLC 69,330 263 251Metso OYJ 7,388 289 311Mitsubishi Corp. 80,800 1,764 1,531Mitsubishi Electric Corp. 111,000 1,018 932Mitsubishi Heavy Industries, Ltd. 175,000 686 834Mitsubishi Logistics Corp. 7,000 89 99Mitsui & Co., Ltd. 99,900 1,556 1,475Mitsui OSK Lines, Ltd. 65,000 445 189MTR Corp. 83,000 302 325Nabtesco Corp. 5,800 115 127NGK Insulators, Ltd. 16,000 285 187Nippon Express Co., Ltd. 49,000 223 200Nippon Yusen KK 92,000 353 212Noble Group, Ltd. 221,727 330 209NSK, Ltd. 25,000 199 175NWS Holdings, Ltd. 79,000 105 132Obayashi Corp. 38,000 168 212Odakyu Electric Railway Co., Ltd. 36,000 321 372Orient Overseas International, Ltd. 12,500 102 80Orkla ASA 43,663 365 378Otsuka Corp. 900 60 67Park24 Co., Ltd. 5,600 96 88Qantas Airways, Ltd. 65,073 152 100Randstad Holdings NV 6,963 330 253Rexel SA 6,092 112 123Rolls Royce Holdings PLC 107,679 1,145 1,521Ryanair Holdings PLC,
Sponsored ADR 1,952 54 67Safran SA 13,295 454 567Sandvik AB 57,870 825 917Scania AB-Class B 18,308 331 376Schindler Holding AG 2,786 259 400Schindler Holding AG-REG 1,263 117 177Schneider Electric SA 30,328 1,826 2,181Secom Co., Ltd. 12,100 594 603Securitas AB-Class B 18,179 184 157SembCorp Industries, Ltd. 57,000 186 244SembCorp Marine, Ltd. 49,000 162 184Serco Group PLC 28,471 268 247SGS SA 314 458 692Shimadzu Corp. 13,000 104 88Shimizu Corp. 34,000 134 126Siemens AG Registered 47,519 4,921 5,123Singapore Airlines, Ltd. 32,000 352 280
The accompanying notes are an integral part of the financial statements. 294
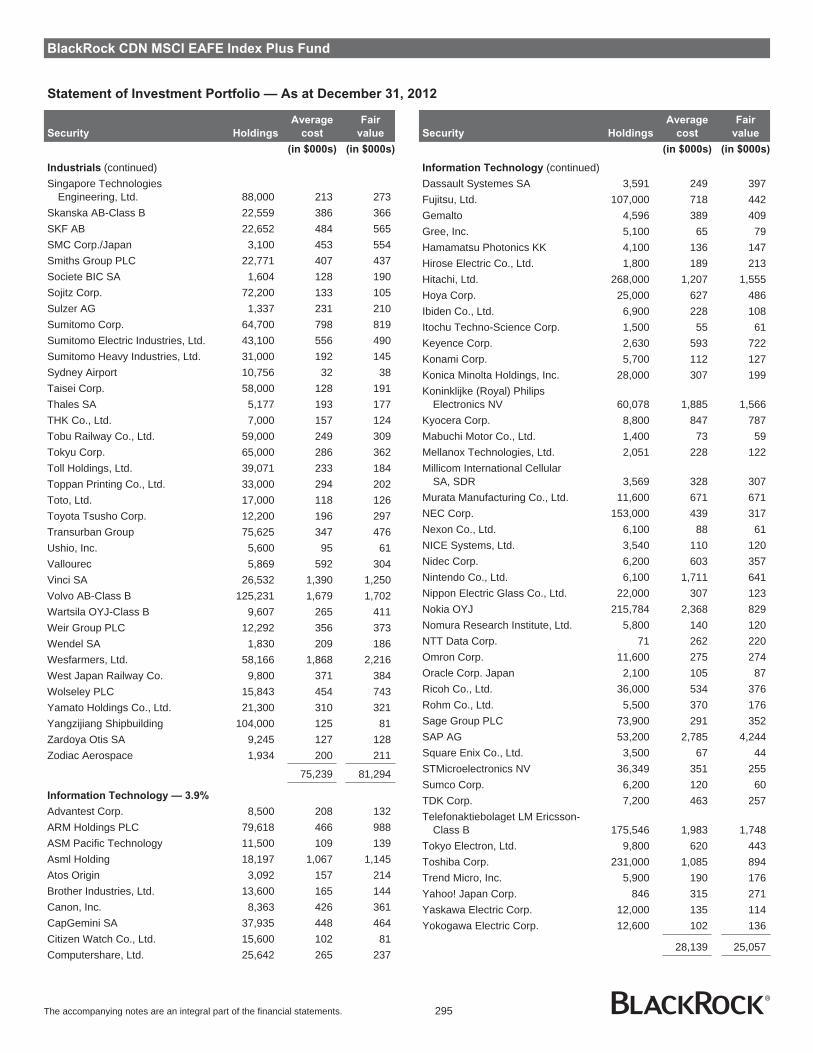
BlackRock CDN MSCI EAFE Index Plus Fund
Statement of Investment Portfolio — As at December 31, 2012
Security Holdings
Average
cost
Fair
value
(in $000s) (in $000s)
Industrials (continued)Singapore Technologies
Engineering, Ltd. 88,000 213 273Skanska AB-Class B 22,559 386 366SKF AB 22,652 484 565SMC Corp./Japan 3,100 453 554Smiths Group PLC 22,771 407 437Societe BIC SA 1,604 128 190Sojitz Corp. 72,200 133 105Sulzer AG 1,337 231 210Sumitomo Corp. 64,700 798 819Sumitomo Electric Industries, Ltd. 43,100 556 490Sumitomo Heavy Industries, Ltd. 31,000 192 145Sydney Airport 10,756 32 38Taisei Corp. 58,000 128 191Thales SA 5,177 193 177THK Co., Ltd. 7,000 157 124Tobu Railway Co., Ltd. 59,000 249 309Tokyu Corp. 65,000 286 362Toll Holdings, Ltd. 39,071 233 184Toppan Printing Co., Ltd. 33,000 294 202Toto, Ltd. 17,000 118 126Toyota Tsusho Corp. 12,200 196 297Transurban Group 75,625 347 476Ushio, Inc. 5,600 95 61Vallourec 5,869 592 304Vinci SA 26,532 1,390 1,250Volvo AB-Class B 125,231 1,679 1,702Wartsila OYJ-Class B 9,607 265 411Weir Group PLC 12,292 356 373Wendel SA 1,830 209 186Wesfarmers, Ltd. 58,166 1,868 2,216West Japan Railway Co. 9,800 371 384Wolseley PLC 15,843 454 743Yamato Holdings Co., Ltd. 21,300 310 321Yangzijiang Shipbuilding 104,000 125 81Zardoya Otis SA 9,245 127 128Zodiac Aerospace 1,934 200 211
75,239 81,294
Information Technology — 3.9%
Advantest Corp. 8,500 208 132ARM Holdings PLC 79,618 466 988ASM Pacific Technology 11,500 109 139Asml Holding 18,197 1,067 1,145Atos Origin 3,092 157 214Brother Industries, Ltd. 13,600 165 144Canon, Inc. 8,363 426 361CapGemini SA 37,935 448 464Citizen Watch Co., Ltd. 15,600 102 81Computershare, Ltd. 25,642 265 237
Security Holdings
Average
cost
Fair
value
(in $000s) (in $000s)
Information Technology (continued)Dassault Systemes SA 3,591 249 397Fujitsu, Ltd. 107,000 718 442Gemalto 4,596 389 409Gree, Inc. 5,100 65 79Hamamatsu Photonics KK 4,100 136 147Hirose Electric Co., Ltd. 1,800 189 213Hitachi, Ltd. 268,000 1,207 1,555Hoya Corp. 25,000 627 486Ibiden Co., Ltd. 6,900 228 108Itochu Techno-Science Corp. 1,500 55 61Keyence Corp. 2,630 593 722Konami Corp. 5,700 112 127Konica Minolta Holdings, Inc. 28,000 307 199Koninklijke (Royal) Philips
Electronics NV 60,078 1,885 1,566Kyocera Corp. 8,800 847 787Mabuchi Motor Co., Ltd. 1,400 73 59Mellanox Technologies, Ltd. 2,051 228 122Millicom International Cellular
SA, SDR 3,569 328 307Murata Manufacturing Co., Ltd. 11,600 671 671NEC Corp. 153,000 439 317Nexon Co., Ltd. 6,100 88 61NICE Systems, Ltd. 3,540 110 120Nidec Corp. 6,200 603 357Nintendo Co., Ltd. 6,100 1,711 641Nippon Electric Glass Co., Ltd. 22,000 307 123Nokia OYJ 215,784 2,368 829Nomura Research Institute, Ltd. 5,800 140 120NTT Data Corp. 71 262 220Omron Corp. 11,600 275 274Oracle Corp. Japan 2,100 105 87Ricoh Co., Ltd. 36,000 534 376Rohm Co., Ltd. 5,500 370 176Sage Group PLC 73,900 291 352SAP AG 53,200 2,785 4,244Square Enix Co., Ltd. 3,500 67 44STMicroelectronics NV 36,349 351 255Sumco Corp. 6,200 120 60TDK Corp. 7,200 463 257Telefonaktiebolaget LM Ericsson-
Class B 175,546 1,983 1,748Tokyo Electron, Ltd. 9,800 620 443Toshiba Corp. 231,000 1,085 894Trend Micro, Inc. 5,900 190 176Yahoo! Japan Corp. 846 315 271Yaskawa Electric Corp. 12,000 135 114Yokogawa Electric Corp. 12,600 102 136
28,139 25,057
The accompanying notes are an integral part of the financial statements. 295

BlackRock CDN MSCI EAFE Index Plus Fund
Statement of Investment Portfolio — As at December 31, 2012
Security Holdings
Average
cost
Fair
value
(in $000s) (in $000s)
Materials — 10.2%
Air Liquide 18,045 1,847 2,250Akzo Nobel NV 13,715 797 893Alumina, Ltd. 133,974 217 125Amcor, Ltd. 69,914 435 583ArcelorMittal 53,846 1,811 912Arkema SA 3,605 297 375Asahi Kasei Corp. 73,000 428 426Aurizon Mines, Ltd. 156,838 3,417 4,055BASF SE 53,044 3,415 4,963BHP Billiton PLC 121,960 3,918 4,204BHP Billiton, Ltd. 186,256 7,019 7,143Boliden AB 15,660 217 292Boral, Ltd. 42,505 198 191CRH PLC 41,424 978 828Croda International PLC 7,694 267 296Daicel Chemical Industries, Ltd. 17,000 121 110Daido Steel Co., Ltd. 16,000 80 80Denki Kagaku Kogyo KK 27,000 131 91EMS-Chemie Holding AG 768 187 179Eurasian Natural Resources 14,092 88 65Evraz PLC 18,980 91 79Fletcher Building, Ltd. 39,852 240 274Fortescue Metals Group, Ltd. 79,393 371 380Fresnillo PLC 10,209 212 305GDF Suez 73,788 2,508 1,507Givaudan 480 443 503Glencore International PLC 219,107 1,229 1,245Heidelbergcement AG 8,136 472 488Hitachi Chemical Co., Ltd. 5,700 121 85Hitachi Metals, Ltd. 9,000 100 76Holcim, Ltd. 13,196 937 959Iluka Resources, Ltd. 23,509 381 219Imerys SA 1,890 113 119Incitec Pivot, Ltd. 94,726 295 315Israel Chemicals, Ltd. 25,382 324 302Israel Corp., Ltd. 124 103 83James Hardie Industries NV 25,160 167 237JFE Holdings, Inc. 28,200 913 520Johnson Matthey PLC 11,802 339 453JSR Corp. 10,500 208 198K+S AG 9,899 636 453Kaneka Corp. 16,000 103 80Kansai Paint Co., Ltd. 13,000 115 138Kazakhmys PLC 12,304 246 155Kobe Steel, Ltd. 143,000 319 180Koninklijke DSM 8,911 424 534Kuraray Co., Ltd. 19,800 262 256Lafarge SA 10,794 687 682Lanxess AG 4,794 396 417
Security Holdings
Average
cost
Fair
value
(in $000s) (in $000s)
Materials (continued)Linde AG 10,698 1,412 1,852Maruichi Steel Tube, Ltd. 2,800 58 64Mitsubishi Chemical Holdings Corp. 79,000 434 387Mitsubishi Gas Chemical Co., Inc. 22,000 131 133Mitsubishi Materials Corp. 64,000 189 214Mitsui Chemicals, Inc. 50,000 156 128Newcrest Mining, Ltd. 43,960 1,475 1,008Nippon Paper Group, Inc. 5,600 161 77Nippon Steel Corp. 440,060 1,319 1,064Nitto Denko Corp. 9,500 386 461Norsk Hydro ASA 54,372 354 270Novozymes AS 13,832 344 387Oji Paper Co., Ltd. 49,000 241 167Olam International, Ltd. 29,109 - -Orica, Ltd. 20,923 512 542OZ Minerals, Ltd. 18,689 217 129Prysmian SpA 11,710 207 231Randgold Resources, Ltd. 5,051 452 486Rexam PLC 50,091 249 354Rio Tinto PLC 77,458 4,231 4,401Rio Tinto, Ltd. 25,076 1,696 1,711Salzgitter AG 2,178 156 113Shin-Etsu Chemical Co., Ltd. 23,600 1,311 1,421Showa Denko KK 83,000 177 124Sika AG 123 237 282Sims Group, Ltd. 9,621 175 92Solvay SA 3,416 397 490Stora Enso OYJ-Class R 33,337 287 229Sumitomo Chemical Co., Ltd. 88,000 412 272Sumitomo Metal Mining Co., Ltd. 30,000 454 417Svenska Cellulosa AB-Class B 33,296 463 719Syngenta AG 5,382 1,443 2,146Taiheiyo Cement Corp. 63,000 134 171Taiyo Nippon Sanso Corp. 15,000 131 85Teijin, Ltd. 54,000 185 132ThyssenKrupp AG 22,238 690 520Toray Industries, Inc. 85,000 498 515Toyo Seikan Kaisha, Ltd. 8,400 145 111Ube Industries, Ltd. 58,000 155 138Umicore 6,459 247 354UPM-Kymmene OYJ 30,509 470 352Vedanta Resources PLC 6,940 100 130Voestalpine AG 6,316 222 229Xstrata PLC 120,955 1,988 2,069Yara International ASA 10,805 426 528
63,750 65,008
Telecommunication Services — 4.7%
Belgacom SA 8,580 296 249Bezeq Israeli Telecommunication
Corp., Ltd. 108,737 248 124
The accompanying notes are an integral part of the financial statements. 296
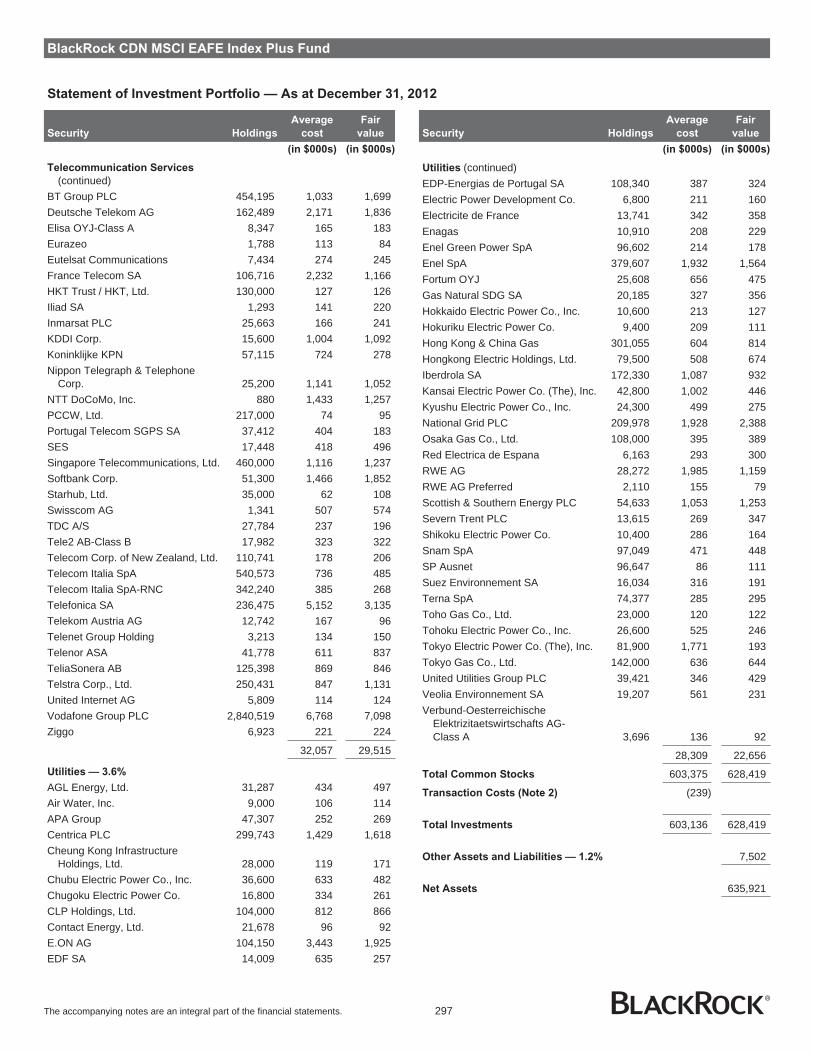
BlackRock CDN MSCI EAFE Index Plus Fund
Statement of Investment Portfolio — As at December 31, 2012
Security Holdings
Average
cost
Fair
value
(in $000s) (in $000s)
Telecommunication Services
(continued)BT Group PLC 454,195 1,033 1,699Deutsche Telekom AG 162,489 2,171 1,836Elisa OYJ-Class A 8,347 165 183Eurazeo 1,788 113 84Eutelsat Communications 7,434 274 245France Telecom SA 106,716 2,232 1,166HKT Trust / HKT, Ltd. 130,000 127 126Iliad SA 1,293 141 220Inmarsat PLC 25,663 166 241KDDI Corp. 15,600 1,004 1,092Koninklijke KPN 57,115 724 278Nippon Telegraph & Telephone
Corp. 25,200 1,141 1,052NTT DoCoMo, Inc. 880 1,433 1,257PCCW, Ltd. 217,000 74 95Portugal Telecom SGPS SA 37,412 404 183SES 17,448 418 496Singapore Telecommunications, Ltd. 460,000 1,116 1,237Softbank Corp. 51,300 1,466 1,852Starhub, Ltd. 35,000 62 108Swisscom AG 1,341 507 574TDC A/S 27,784 237 196Tele2 AB-Class B 17,982 323 322Telecom Corp. of New Zealand, Ltd. 110,741 178 206Telecom Italia SpA 540,573 736 485Telecom Italia SpA-RNC 342,240 385 268Telefonica SA 236,475 5,152 3,135Telekom Austria AG 12,742 167 96Telenet Group Holding 3,213 134 150Telenor ASA 41,778 611 837TeliaSonera AB 125,398 869 846Telstra Corp., Ltd. 250,431 847 1,131United Internet AG 5,809 114 124Vodafone Group PLC 2,840,519 6,768 7,098Ziggo 6,923 221 224
32,057 29,515
Utilities — 3.6%
AGL Energy, Ltd. 31,287 434 497Air Water, Inc. 9,000 106 114APA Group 47,307 252 269Centrica PLC 299,743 1,429 1,618Cheung Kong Infrastructure
Holdings, Ltd. 28,000 119 171Chubu Electric Power Co., Inc. 36,600 633 482Chugoku Electric Power Co. 16,800 334 261CLP Holdings, Ltd. 104,000 812 866Contact Energy, Ltd. 21,678 96 92E.ON AG 104,150 3,443 1,925EDF SA 14,009 635 257
Security Holdings
Average
cost
Fair
value
(in $000s) (in $000s)
Utilities (continued)EDP-Energias de Portugal SA 108,340 387 324Electric Power Development Co. 6,800 211 160Electricite de France 13,741 342 358Enagas 10,910 208 229Enel Green Power SpA 96,602 214 178Enel SpA 379,607 1,932 1,564Fortum OYJ 25,608 656 475Gas Natural SDG SA 20,185 327 356Hokkaido Electric Power Co., Inc. 10,600 213 127Hokuriku Electric Power Co. 9,400 209 111Hong Kong & China Gas 301,055 604 814Hongkong Electric Holdings, Ltd. 79,500 508 674Iberdrola SA 172,330 1,087 932Kansai Electric Power Co. (The), Inc. 42,800 1,002 446Kyushu Electric Power Co., Inc. 24,300 499 275National Grid PLC 209,978 1,928 2,388Osaka Gas Co., Ltd. 108,000 395 389Red Electrica de Espana 6,163 293 300RWE AG 28,272 1,985 1,159RWE AG Preferred 2,110 155 79Scottish & Southern Energy PLC 54,633 1,053 1,253Severn Trent PLC 13,615 269 347Shikoku Electric Power Co. 10,400 286 164Snam SpA 97,049 471 448SP Ausnet 96,647 86 111Suez Environnement SA 16,034 316 191Terna SpA 74,377 285 295Toho Gas Co., Ltd. 23,000 120 122Tohoku Electric Power Co., Inc. 26,600 525 246Tokyo Electric Power Co. (The), Inc. 81,900 1,771 193Tokyo Gas Co., Ltd. 142,000 636 644United Utilities Group PLC 39,421 346 429Veolia Environnement SA 19,207 561 231Verbund-Oesterreichische
Elektrizitaetswirtschafts AG-Class A 3,696 136 92
28,309 22,656
Total Common Stocks 603,375 628,419
Transaction Costs (Note 2) (239)
Total Investments 603,136 628,419
Other Assets and Liabilities — 1.2% 7,502
Net Assets 635,921
The accompanying notes are an integral part of the financial statements. 297
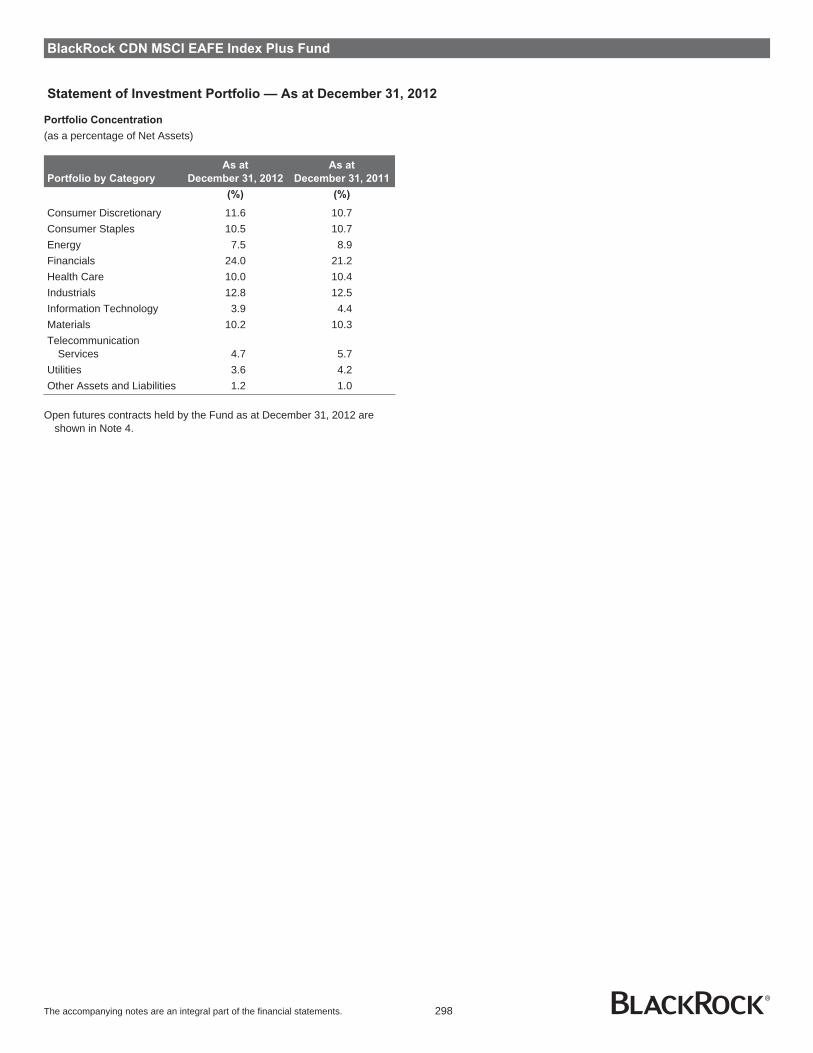
BlackRock CDN MSCI EAFE Index Plus Fund
Statement of Investment Portfolio — As at December 31, 2012
Portfolio Concentration
(as a percentage of Net Assets)
Portfolio by Category
As at
December 31, 2012
As at
December 31, 2011
(%) (%)
Consumer Discretionary 11.6 10.7Consumer Staples 10.5 10.7Energy 7.5 8.9Financials 24.0 21.2Health Care 10.0 10.4Industrials 12.8 12.5Information Technology 3.9 4.4Materials 10.2 10.3Telecommunication
Services 4.7 5.7Utilities 3.6 4.2Other Assets and Liabilities 1.2 1.0
Open futures contracts held by the Fund as at December 31, 2012 areshown in Note 4.
The accompanying notes are an integral part of the financial statements. 298
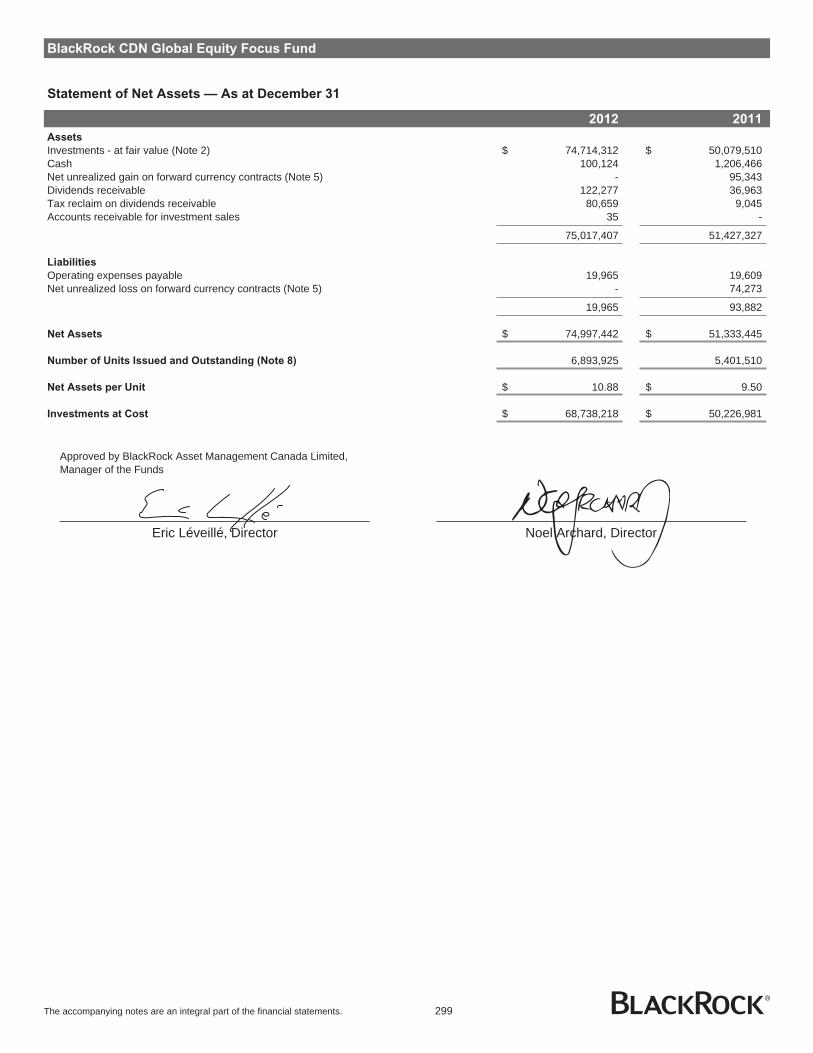
BlackRock CDN Global Equity Focus Fund
Statement of Net Assets — As at December 31
2012 2011
Assets
Investments - at fair value (Note 2) $ 74,714,312 $ 50,079,510Cash 100,124 1,206,466Net unrealized gain on forward currency contracts (Note 5) - 95,343Dividends receivable 122,277 36,963Tax reclaim on dividends receivable 80,659 9,045Accounts receivable for investment sales 35 -
75,017,407 51,427,327
Liabilities
Operating expenses payable 19,965 19,609Net unrealized loss on forward currency contracts (Note 5) - 74,273
19,965 93,882
Net Assets $ 74,997,442 $ 51,333,445
Number of Units Issued and Outstanding (Note 8) 6,893,925 5,401,510
Net Assets per Unit $ 10.88 $ 9.50
Investments at Cost $ 68,738,218 $ 50,226,981
Approved by BlackRock Asset Management Canada Limited,Manager of the Funds
Eric Léveillé, Director Noel Archard, Director
The accompanying notes are an integral part of the financial statements. 299

BlackRock CDN Global Equity Focus Fund
Statement of Operations — For the Years Ended December 31
2012 2011
Revenue
Dividend income $ 1,824,342 $ 353,155Interest income 957 36Net realized gain (loss) from forward currency contracts (38,686) 158,948Foreign exchange gain 9,300 138,878Withholding taxes (175,226) (37,043)
1,620,687 613,974
Expenses
Custodian fees 24,672 19,313Fund accounting expenses 60,401 57,784Unitholder communication costs - 855Audit fees 13,407 13,704Securities filing fees 1,181 420Independent review committee fees 27 42Other operating expenses 3,338 5,237
103,026 97,355
Net Investment Income for the Year 1,517,661 516,619
Gain (Loss) on Investments
Net realized gain (loss) on sale of investments 1,693,004 (1,012,526)Foreign tax - (22,539)Transaction costs (Note 2,13) (180,497) (66,066)Net change in unrealized appreciation (depreciation) in value of investments 6,123,565 (471,993)Net change in unrealized appreciation (depreciation) in value of forward currency contracts (21,070) 8,146
Net Gain (Loss) on Investments 7,615,002 (1,564,978)
Increase (Decrease) in Net Assets from Operations $ 9,132,663 $ (1,048,359)
Increase (Decrease) in Net Assets from Operations per Unit $ 1.34 $ (0.46)
Statement of Changes in Net Assets — For the Years Ended December 31
2012 2011
Net Assets - Beginning of Year $ 51,333,445 $ 10,816,046
Increase (Decrease) in Net Assets from Operations 9,132,663 (1,048,359)
Capital Transactions
Proceeds from issue of units 15,170,963 41,565,758Reinvestment of distributions 1,892,469 479,234Redemption of units (639,629) -
Net capital transactions 16,423,803 42,044,992
Distributions
From net investment income (1,355,915) (479,234)From capital gains (536,554) -
Total distributions (1,892,469) (479,234)
Increase in Net Assets for the Year 23,663,997 40,517,399
Net Assets - End of Year $ 74,997,442 $ 51,333,445
The accompanying notes are an integral part of the financial statements. 300

BlackRock CDN Global Equity Focus Fund
Statement of Investment Portfolio — As at December 31, 2012
Security Holdings
Average
cost
Fair
value
(in $000s) (in $000s)
Common Stocks
Consumer Discretionary — 22.4%
Anheuser-Busch InBev 19,569 1,374 1,685AutoZone, Inc. 3,375 1,180 1,191Coach, Inc. 27,613 1,537 1,527Comcast Corp.-Class A 80,243 2,273 2,987DIRECTV 44,992 2,063 2,248Discovery Communications-Class A 23,989 1,230 1,516Newell Rubbermaid, Inc. 68,461 1,255 1,518Nissan Motor Co., Ltd. 116,600 1,077 1,089Swatch Group AG 3,037 1,236 1,523Time Warner, Inc. 31,577 1,468 1,504
14,693 16,788
Consumer Staples — 8.6%
Imperial Tobacco Group PLC 94,858 3,419 3,640Philip Morris International, Inc. 16,352 1,370 1,362Reckitt Benckiser Group PLC 23,217 1,233 1,456
6,022 6,458
Energy — 5.2%
Royal Dutch Shell PLC-Class B 77,083 2,696 2,712Schlumberger, Ltd. 16,560 1,158 1,142
3,854 3,854
Financials — 11.3%
Bank Rakyat Indonesia Persero TbkPT 1,543,500 1,122 1,100
Berkshire Hathaway, Inc.-Class B 21,717 1,803 1,941BNP Paribas 10,786 408 602ICICI Bank, Ltd.-ADR 23,485 812 1,020JPMorgan Chase & Co. 35,842 1,273 1,570Progressive Corp. (The) 54,157 1,223 1,138Sberbank of Russia-ADR 90,014 954 1,126
7,595 8,497
Health Care — 10.5%
Edwards Lifesciences Corp. 9,231 786 829Pfizer, Inc. 106,238 2,145 2,654Roche Holding AG Genusschein 11,937 2,091 2,389Sanofi-Aventis 21,625 1,548 2,022
6,570 7,894
Industrials — 12.0%
Assa Abloy AB-Class B 39,981 1,312 1,486Atlas Copco AB-Class A 46,696 1,133 1,274Expeditors International of
Washington, Inc. 24,591 933 968Fanuc, Ltd. 6,500 1,132 1,191Masco Corp. 74,720 1,143 1,240Stanley Black & Decker, Inc. 20,769 1,375 1,530United Technologies Corp. 16,372 1,242 1,337
8,270 9,026
Security Holdings
Average
cost
Fair
value
(in $000s) (in $000s)
Information Technology — 16.2%
Agilent Technologies, Inc. 38,503 1,539 1,570Asml Holding 17,173 1,007 1,081Cognizant Technology Solutions
Corp.-Class A 18,910 1,302 1,394EMC Corp., Massachusetts 62,635 1,680 1,578Lam Research Corp. 38,912 1,319 1,399Mercadolibre, Inc. 17,053 1,291 1,338Samsung Electronics Co., Ltd. 525 727 743Texas Instruments, Inc. 39,698 1,175 1,223Veeco Instruments, Inc. 23,380 710 687Xilinx, Inc. 31,840 1,043 1,138
11,793 12,151
Materials — 7.1%
Ecolab, Inc. 18,559 1,219 1,329Linde AG 8,156 1,274 1,412Praxair, Inc. 14,578 1,550 1,588Rio Tinto PLC 17,397 969 988
5,012 5,317
Telecommunication Services — 6.3%
Rogers Communications, Inc.-Class B 24,592 929 1,110Vodafone Group PLC 1,448,199 4,044 3,619
4,973 4,729
Total Common Stocks 68,782 74,714
Transaction Costs (Note 2) (44)
Total Investments 68,738 74,714
Other Assets and Liabilities — 0.4% 283
Net Assets 74,997
Portfolio Concentration
(as a percentage of Net Assets)
Portfolio by Category
As at
December 31, 2012
As at
December 31, 2011
(%) (%)
Consumer Discretionary 22.4 17.2Consumer Staples 8.6 11.1Energy 5.2 4.7Financials 11.3 8.7Health Care 10.5 21.8Industrials 12.0 10.2Information Technology 16.2 13.5Materials 7.1 5.1Telecommunication Services 6.3 5.3Other Assets and Liabilities 0.4 2.4
The accompanying notes are an integral part of the financial statements. 301
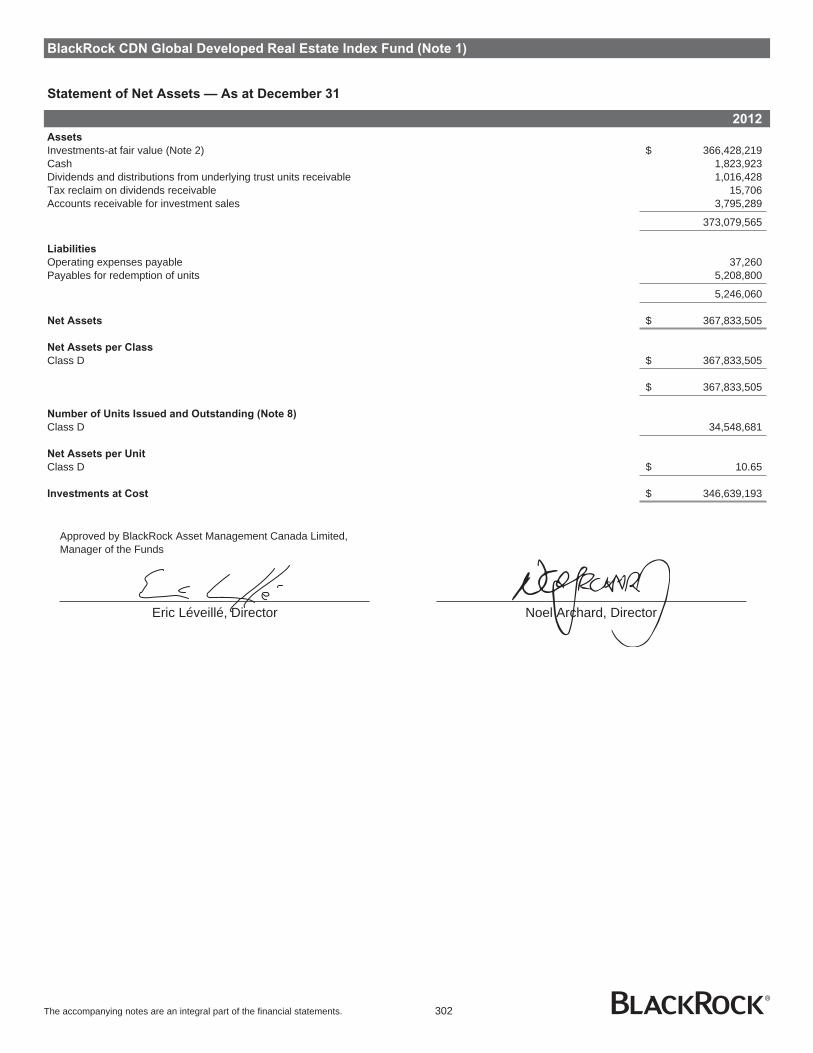
BlackRock CDN Global Developed Real Estate Index Fund (Note 1)
Statement of Net Assets — As at December 31
2012
Assets
Investments-at fair value (Note 2) $ 366,428,219Cash 1,823,923Dividends and distributions from underlying trust units receivable 1,016,428Tax reclaim on dividends receivable 15,706Accounts receivable for investment sales 3,795,289
373,079,565
Liabilities
Operating expenses payable 37,260Payables for redemption of units 5,208,800
5,246,060
Net Assets $ 367,833,505
Net Assets per Class
Class D $ 367,833,505
$ 367,833,505
Number of Units Issued and Outstanding (Note 8)
Class D 34,548,681
Net Assets per Unit
Class D $ 10.65
Investments at Cost $ 346,639,193
Approved by BlackRock Asset Management Canada Limited,Manager of the Funds
Eric Léveillé, Director Noel Archard, Director
The accompanying notes are an integral part of the financial statements. 302

BlackRock CDN Global Developed Real Estate Index Fund (Note 1)
Statement of Operations — For the Period Ended December 31
2012
Revenue
Dividend income and distributions from underlying trust units $ 4,182,615Interest income 2,608Foreign exchange loss (27,908)Withholding taxes (1,046,122)
3,111,193
Expenses
Custodian fees 134,361Fund accounting expenses 27,415Unitholder communication costs 261Audit fees 11,246Securities filing fees 3,376Independent review committee fees 29Other operating expenses 10,202
186,890
Net Investment Income for the Period 2,924,303
Gain on Investments
Net realized gain on sale of investments 319,285Transaction costs (Note 2,13) (171,533)Net change in unrealized appreciation in value of investments 19,789,026
Net Gain on Investments 19,936,778
Increase in Net Assets from Operations $ 22,861,081
Increase in Net Assets from Operations per Class
Class D $ 22,861,081
$ 22,861,081
Increase in Net Assets from Operations per Unit
Class D $ 0.78
Statement of Changes in Net Assets — For the Period Ended December 31
2012 2012
Fund Class D
Net Assets - Beginning of Period $ - $ -
Increase in Net Assets from Operations 22,861,081 22,861,081
Capital Transactions
Proceeds from issue of units 361,806,627 361,806,627Reinvestment of distributions 3,087,260 3,087,260Redemption of units (16,834,203) (16,834,203)
Net capital transactions 348,059,684 348,059,684
Distributions
From net investment income (2,907,143) (2,907,143)From capital gains (180,117) (180,117)
Total distributions (3,087,260) (3,087,260)
Increase in Net Assets for the Period 367,833,505 367,833,505
Net Assets - End of Period $ 367,833,505 $ 367,833,505
The accompanying notes are an integral part of the financial statements. 303

BlackRock CDN Global Developed Real Estate Index Fund
Statement of Investment Portfolio — As at December 31, 2012
Security Holdings
Average
cost
Fair
value
(in $000s) (in $000s)
Common Stocks and Income Trusts
Financials — 99.6%
Acadia Realty Trust-REIT 17,845 431 445Activia Properties, Inc. REIT 77 460 481Advance Residence Investment
Corp. REIT 310 611 632Aeon Mall Co., Ltd. 33,500 815 816Affine SA REIT 1,562 22 26Agile Property Holdings, Ltd. 510,000 601 713Agree Realty Corp. REIT 4,178 100 111Alexander’s, Inc. REIT 752 325 248Alexandria Real Estate Equities, Inc.
REIT 23,236 1,692 1,602Allied Properties Real Estate
Investment Trust-REIT 21,872 653 721Allreal Holding AG 2,998 435 460Alstria Office REIT-AG 30,060 338 366American Assets Trust, Inc.-REIT 14,272 369 397American Campus Communities, Inc.
REIT 38,164 1,756 1,752American Realty Capital Trust, Inc.-
REIT 58,033 650 666ANF Immobilier REIT 3,927 161 124Apartment Investment &
Management Co. REIT-Class A 53,115 1,403 1,431Artis Real Estate Investment Trust-
REIT 40,185 653 628Ascendas REIT 816,000 1,509 1,576Ashford Hospitality Trust, Inc.-REIT 25,355 197 265Associated Estates Realty Corp.
REIT 18,714 278 300AvalonBay Communities, Inc. REIT 41,649 5,835 5,621Azrieli Group 13,436 286 347Befimmo S.C.A. Sicafi REIT 6,925 412 444Beni Stabili SpA REIT 362,864 170 212Big Yellow Group PLC REIT 49,375 247 277BioMed Realty Trust, Inc.-REIT 56,192 1,044 1,082Boardwalk REIT 17,450 1,111 1,122Boston Properties, Inc. REIT 54,550 6,003 5,747Brandywine Realty Trust-REIT 52,267 622 633BRE Properties, Inc. REIT 27,992 1,405 1,416British Land Co. PLC 322,380 2,730 2,932Brookfield Properties Co. 136,765 2,306 2,309BWP Trust-REIT 193,012 398 431CA Immobilien Anlagen AG 32,986 342 454Calloway REIT 39,031 1,142 1,128Camden Property Trust-REIT 30,396 2,069 2,065Campus Crest Communities, Inc.
REIT 14,615 155 178Canadian Apartment Properties REIT 36,336 880 900Canadian REIT 24,733 1,037 1,069CapitaCommercial Trust-REIT 772,000 864 1,057
Security Holdings
Average
cost
Fair
value
(in $000s) (in $000s)
Financials (continued)Capital & Counties Properties PLC 275,112 941 1,078Capitaland, Ltd. 1,155,000 2,849 3,484CapitaMall Trust-REIT 943,000 1,504 1,637Capitamalls Asia, Ltd. 568,000 762 896CapLease, Inc. REIT 25,975 120 144Castellum AB 61,198 827 865CBL & Associates Properties, Inc.
REIT 58,639 1,192 1,238CDL Hospitality Trusts-REIT 263,000 427 403Cedar Shopping Centers, Inc. REIT 25,519 132 134Centro Retail Australia REIT 521,201 1,131 1,223CFS Retail Property Trust-REIT 771,823 1,592 1,528Champion REIT 1,051,000 472 497Charter Hall Retail REIT 116,979 427 455Chartwell Seniors Housing REIT 62,327 617 677Chesapeake Lodging Trust-REIT 14,718 263 306City Developments, Ltd. 249,000 2,349 2,608Citycon OYJ 90,938 279 307Cofinimmo REIT 5,477 602 644Colonia Real Estate AG REIT 668 3 4Colonial Properties Trust-REIT 31,982 697 681Cominar REIT 45,092 1,080 1,017Commonwealth Property Office
Fund REIT 870,394 967 918CommonWealth REIT 30,429 520 480Conwert Immobilien Invest SE 31,532 355 404Corio NV 26,341 1,148 1,185Corporate Office Properties REIT 29,572 677 735Country Garden Holdings Co. 1,335,000 514 696Cousins Properties, Inc. REIT 38,307 295 318Crombie Real Estate Investment
Trust-REIT 18,016 268 266Cubesmart REIT 46,052 563 668Daejan Holdings PLC 1,892 90 92Daiwahouse Residential Investment
Corp. REIT 56 452 435DCT Industrial Trust, Inc.-REIT 97,654 603 630DDR Corp. REIT 112,843 1,671 1,757Derwent London PLC REIT 37,106 1,158 1,265Deutsche Euroshop AG 19,501 732 811Deutsche Wohnen AG 54,727 937 1,005Development Securities PLC 44,168 102 102Dexus Property Group 1,757,828 1,807 1,835DiamondRock Hospitality Co. REIT 71,486 673 641DIC Asset AG 13,504 121 129Digital Realty Trust, Inc.-REIT 44,945 3,369 3,035Douglas Emmett, Inc. REIT 38,281 886 888Duke Realty Corp. REIT 99,865 1,405 1,379Dundee International Real Estate
Investment Trust-REIT 23,483 261 255
The accompanying notes are an integral part of the financial statements. 304

BlackRock CDN Global Developed Real Estate Index Fund
Statement of Investment Portfolio — As at December 31, 2012
Security Holdings
Average
cost
Fair
value
(in $000s) (in $000s)
Financials (continued)Dundee REIT 35,180 1,323 1,316DuPont Fabros Technology, Inc.
REIT 23,187 603 558EastGroup Properties, Inc. REIT 10,759 566 576Education Realty Trust, Inc.-REIT 41,189 461 436EPR Properties REIT 16,897 757 775Equity Lifestyle Properties, Inc. REIT 15,095 1,057 1,012Equity One, Inc. REIT 22,059 468 461Equity Residential REIT 118,151 7,134 6,663Essex Property Trust, Inc.-REIT 13,232 2,014 1,933Eurocommercial Properties REIT 14,944 522 590Excel Trust, Inc.-REIT 14,404 184 182Extendicare Inc. 32,390 250 248Extra Space Storage, Inc. REIT 39,622 1,310 1,435F&C Commercial Property Trust, Ltd. 200,902 333 336Fabege AB 60,766 543 612Fastighets AB Balder 43,727 212 248Federal Realty Investment Trust-
REIT 23,555 2,510 2,440FelCor Lodging Trust, Inc.-REIT 47,044 223 219First Capital Realty, Inc. 28,732 537 540First Industrial Realty Trust, Inc.-
REIT 36,525 465 512First Potomac Realty Trust-REIT 18,289 213 225Fonciere des Regions REIT 10,581 774 879Forest City Enterprises-Class A 54,895 801 882Franklin Street Properties Corp.
REIT 30,322 318 372Frontier Real Estate Investment
Corp. REIT 81 769 703Gagfah SA 29,258 302 343Gecina SA 6,643 635 738General Growth Properties, Inc.
REIT 170,912 3,149 3,380Getty Realty Corp. REIT 9,018 163 162Glimcher Realty Trust-REIT 51,433 520 568Global Logistic Properties, Ltd. 836,000 1,571 1,894Goodman Group 584,960 2,378 2,612Government Properties Income
Trust-REIT 15,060 339 359GPT Group 643,846 2,329 2,443Grainger PLC 149,342 225 283Granite Real Estate, Inc. 17,180 615 648Great Portland Estates PLC REIT 123,454 856 976GSW Immobilien AG 18,713 700 784H&R REIT 70,360 1,739 1,696Hamborner REIT AG 17,324 150 171Hammerson PLC 257,371 1,886 2,033Hang Lung Properties, Ltd. 814,000 2,879 3,215Hansteen Holdings PLC REIT 238,454 277 309HCP, Inc. 164,871 7,537 7,414Health Care, Inc. REIT 94,315 5,613 5,756Healthcare Realty Trust, Inc.-REIT 31,885 756 762Helical Bar PLC 42,362 134 158Henderson Land Development Co.,
Ltd. 438,000 2,696 3,075Hersha Hospitality Trust-REIT 73,576 355 366Highwoods Properties, Inc. REIT 22,382 744 745Home Properties, Inc. REIT 18,683 1,182 1,141
Security Holdings
Average
cost
Fair
value
(in $000s) (in $000s)
Financials (continued)Hongkong Land Holdings, Ltd. 642,000 3,913 4,462Hospitality Properties Trust-REIT 45,079 1,072 1,050Host Hotels & Resorts, Inc. REIT 261,933 3,914 4,087Hudson Pacific Properties, Inc. REIT 13,446 245 282Hufvudstaden AB 55,468 674 696Hysan Development Co., Ltd. 290,000 1,254 1,390ICADE 7,589 600 667Immobiliare Grande Distribuzione
REIT 52,541 50 57Industrial & Infrastructure Fund
Investment Corp. REIT 52 397 387Inland Real Estate Corp. REIT 33,480 268 279Innvest Real Estate Investment
Trust-REIT 36,709 181 152Intervest Offices & Warehouses
REIT 2,988 73 78Investa Office Fund REIT 223,638 681 687Investors Real Estate Trust-REIT 33,558 267 292IRP Property Investments, Ltd. 46,081 48 45IVG Immobilien AG 61,116 145 153Japan Excellent, Inc. REIT 66 389 369Japan Prime Realty Investment
Corp. REIT 308 829 882Japan Real Estate Investment Corp.
REIT 215 2,054 2,097Japan Retail Fund Investment Corp.
REIT 768 1,310 1,403Kenedix Realty Investment Corp.
REIT 105 345 364Keppel Land, Ltd. 282,000 788 926Kerry Properties, Ltd. 260,500 1,239 1,345Killam Properties, Inc. 18,983 247 236Kilroy Realty Corp. REIT 27,269 1,260 1,287Kimco Realty Corp. REIT 147,881 2,880 2,845Kite Realty Group Trust-REIT 29,630 151 165Kiwi Income Property Trust-REIT 365,167 325 342Klepierre 35,334 1,180 1,385Klovern AB 48,238 177 189Kungsleden AB 51,411 295 279Land Securities Group PLC 283,620 3,555 3,732LaSalle Hotel Properties REIT 31,133 808 787Leasinvest Real Estate SCA REIT 618 51 54Lexington Realty Trust-REIT 62,483 561 650Liberty International PLC 237,729 1,229 1,347Liberty Property Trust-REIT 42,812 1,536 1,525Link REIT 832,000 3,716 4,142London & Stamford Property PLC
REIT 202,099 366 353LTC Properties, Inc. REIT 11,072 381 387Macerich Co., REIT 49,868 2,859 2,893Mack-Cali Realty Corp. REIT 32,113 854 835Mapletree Commercial Trust-REIT 519,000 459 514Mapletree Industrial Trust-REIT 454,000 481 501Mapletree Logistics Trust-REIT 667,000 557 617Medical Properties Trust, Inc.-REIT 49,254 486 587Mercialys SA REIT 17,020 341 383Mid-America Apartment
Communities, Inc. REIT 15,394 1,035 992Mirvac Group 1,241,405 1,798 1,899
The accompanying notes are an integral part of the financial statements. 305
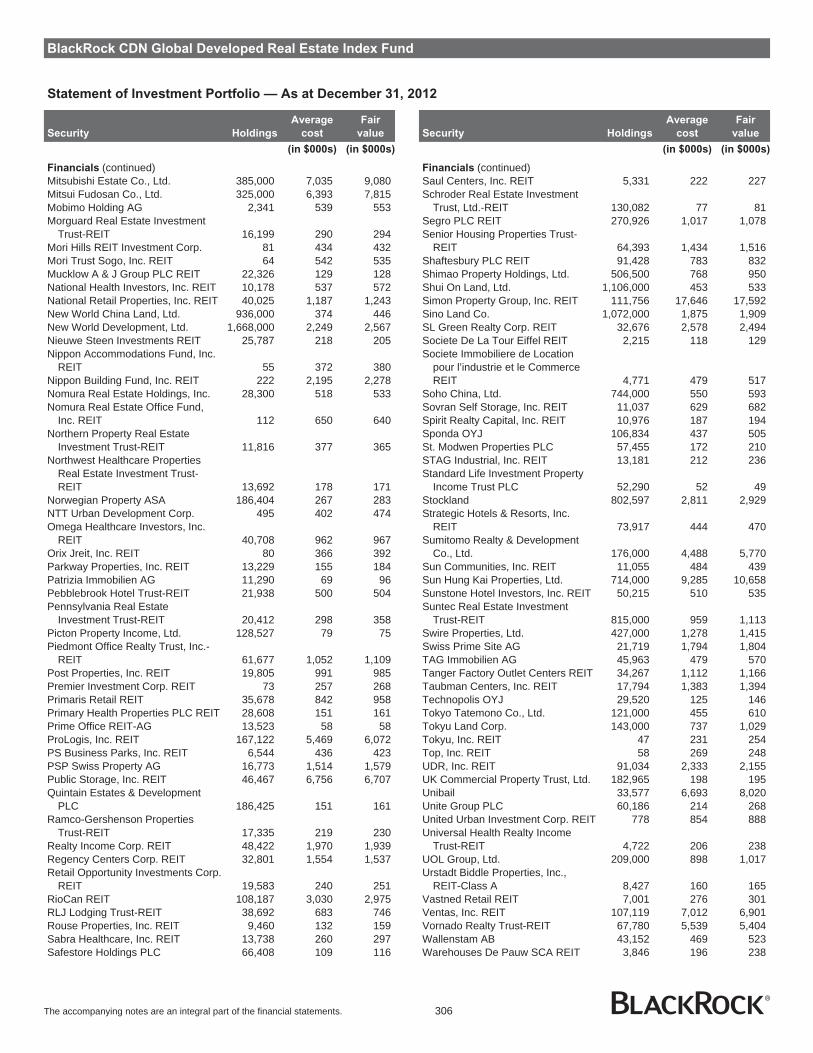
BlackRock CDN Global Developed Real Estate Index Fund
Statement of Investment Portfolio — As at December 31, 2012
Security Holdings
Average
cost
Fair
value
(in $000s) (in $000s)
Financials (continued)Mitsubishi Estate Co., Ltd. 385,000 7,035 9,080Mitsui Fudosan Co., Ltd. 325,000 6,393 7,815Mobimo Holding AG 2,341 539 553Morguard Real Estate Investment
Trust-REIT 16,199 290 294Mori Hills REIT Investment Corp. 81 434 432Mori Trust Sogo, Inc. REIT 64 542 535Mucklow A & J Group PLC REIT 22,326 129 128National Health Investors, Inc. REIT 10,178 537 572National Retail Properties, Inc. REIT 40,025 1,187 1,243New World China Land, Ltd. 936,000 374 446New World Development, Ltd. 1,668,000 2,249 2,567Nieuwe Steen Investments REIT 25,787 218 205Nippon Accommodations Fund, Inc.
REIT 55 372 380Nippon Building Fund, Inc. REIT 222 2,195 2,278Nomura Real Estate Holdings, Inc. 28,300 518 533Nomura Real Estate Office Fund,
Inc. REIT 112 650 640Northern Property Real Estate
Investment Trust-REIT 11,816 377 365Northwest Healthcare Properties
Real Estate Investment Trust-REIT 13,692 178 171
Norwegian Property ASA 186,404 267 283NTT Urban Development Corp. 495 402 474Omega Healthcare Investors, Inc.
REIT 40,708 962 967Orix Jreit, Inc. REIT 80 366 392Parkway Properties, Inc. REIT 13,229 155 184Patrizia Immobilien AG 11,290 69 96Pebblebrook Hotel Trust-REIT 21,938 500 504Pennsylvania Real Estate
Investment Trust-REIT 20,412 298 358Picton Property Income, Ltd. 128,527 79 75Piedmont Office Realty Trust, Inc.-
REIT 61,677 1,052 1,109Post Properties, Inc. REIT 19,805 991 985Premier Investment Corp. REIT 73 257 268Primaris Retail REIT 35,678 842 958Primary Health Properties PLC REIT 28,608 151 161Prime Office REIT-AG 13,523 58 58ProLogis, Inc. REIT 167,122 5,469 6,072PS Business Parks, Inc. REIT 6,544 436 423PSP Swiss Property AG 16,773 1,514 1,579Public Storage, Inc. REIT 46,467 6,756 6,707Quintain Estates & Development
PLC 186,425 151 161Ramco-Gershenson Properties
Trust-REIT 17,335 219 230Realty Income Corp. REIT 48,422 1,970 1,939Regency Centers Corp. REIT 32,801 1,554 1,537Retail Opportunity Investments Corp.
REIT 19,583 240 251RioCan REIT 108,187 3,030 2,975RLJ Lodging Trust-REIT 38,692 683 746Rouse Properties, Inc. REIT 9,460 132 159Sabra Healthcare, Inc. REIT 13,738 260 297Safestore Holdings PLC 66,408 109 116
Security Holdings
Average
cost
Fair
value
(in $000s) (in $000s)
Financials (continued)Saul Centers, Inc. REIT 5,331 222 227Schroder Real Estate Investment
Trust, Ltd.-REIT 130,082 77 81Segro PLC REIT 270,926 1,017 1,078Senior Housing Properties Trust-
REIT 64,393 1,434 1,516Shaftesbury PLC REIT 91,428 783 832Shimao Property Holdings, Ltd. 506,500 768 950Shui On Land, Ltd. 1,106,000 453 533Simon Property Group, Inc. REIT 111,756 17,646 17,592Sino Land Co. 1,072,000 1,875 1,909SL Green Realty Corp. REIT 32,676 2,578 2,494Societe De La Tour Eiffel REIT 2,215 118 129Societe Immobiliere de Location
pour l’industrie et le CommerceREIT 4,771 479 517
Soho China, Ltd. 744,000 550 593Sovran Self Storage, Inc. REIT 11,037 629 682Spirit Realty Capital, Inc. REIT 10,976 187 194Sponda OYJ 106,834 437 505St. Modwen Properties PLC 57,455 172 210STAG Industrial, Inc. REIT 13,181 212 236Standard Life Investment Property
Income Trust PLC 52,290 52 49Stockland 802,597 2,811 2,929Strategic Hotels & Resorts, Inc.
REIT 73,917 444 470Sumitomo Realty & Development
Co., Ltd. 176,000 4,488 5,770Sun Communities, Inc. REIT 11,055 484 439Sun Hung Kai Properties, Ltd. 714,000 9,285 10,658Sunstone Hotel Investors, Inc. REIT 50,215 510 535Suntec Real Estate Investment
Trust-REIT 815,000 959 1,113Swire Properties, Ltd. 427,000 1,278 1,415Swiss Prime Site AG 21,719 1,794 1,804TAG Immobilien AG 45,963 479 570Tanger Factory Outlet Centers REIT 34,267 1,112 1,166Taubman Centers, Inc. REIT 17,794 1,383 1,394Technopolis OYJ 29,520 125 146Tokyo Tatemono Co., Ltd. 121,000 455 610Tokyu Land Corp. 143,000 737 1,029Tokyu, Inc. REIT 47 231 254Top, Inc. REIT 58 269 248UDR, Inc. REIT 91,034 2,333 2,155UK Commercial Property Trust, Ltd. 182,965 198 195Unibail 33,577 6,693 8,020Unite Group PLC 60,186 214 268United Urban Investment Corp. REIT 778 854 888Universal Health Realty Income
Trust-REIT 4,722 206 238UOL Group, Ltd. 209,000 898 1,017Urstadt Biddle Properties, Inc.,
REIT-Class A 8,427 160 165Vastned Retail REIT 7,001 276 301Ventas, Inc. REIT 107,119 7,012 6,901Vornado Realty Trust-REIT 67,780 5,539 5,404Wallenstam AB 43,152 469 523Warehouses De Pauw SCA REIT 3,846 196 238
The accompanying notes are an integral part of the financial statements. 306

BlackRock CDN Global Developed Real Estate Index Fund
Statement of Investment Portfolio — As at December 31, 2012
Security Holdings
Average
cost
Fair
value
(in $000s) (in $000s)
Financials (continued)Washington Real Estate Investment
Trust-REIT 24,137 635 629Weingarten Realty Investors REIT 44,124 1,194 1,177Wereldhave Belgium REIT 956 93 101Wereldhave REIT 8,062 430 508Westfield Group 840,049 8,821 9,161Westfield Retail Trust-REIT 1,112,604 3,528 3,473Wharf Holdings, Ltd. 552,000 3,350 4,269Wihlborgs Fastigheter AB 29,139 425 450Wing Tai Holdings, Ltd. 219,000 256 333Winthrop Realty Trust-REIT 9,171 106 101Workspace Group PLC REIT 54,613 220 267Yanlord Land Group, Ltd. 218,000 216 269
346,802 366,428
Total Common Stocks and Income
Trusts 346,802 366,428
Transaction Costs (Note 2) (163)
Total Investments 346,639 366,428
Other Assets and Liabilities — 0.4% 1,406
Net Assets 367,834
Portfolio Concentration
(as a percentage of Net Assets)
Portfolio by Category
As at
December 31, 2012
(%)
Financials 99.6Other Assets and Liabilities 0.4
The accompanying notes are an integral part of the financial statements. 307
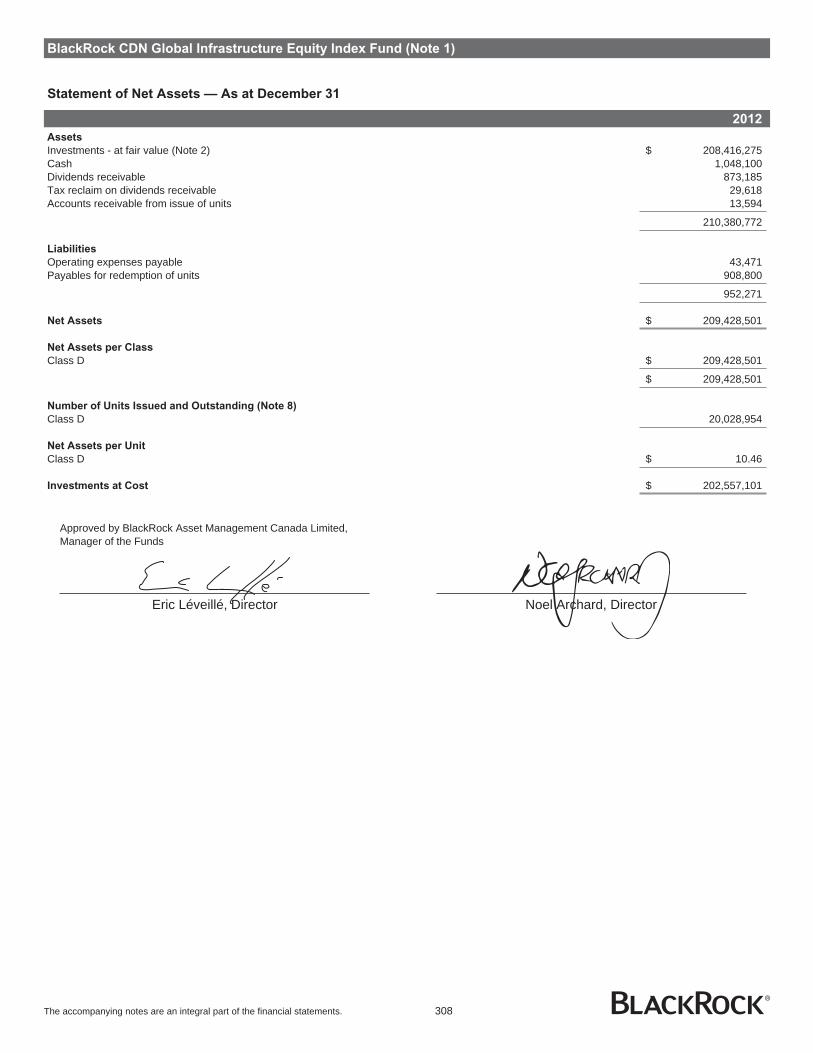
BlackRock CDN Global Infrastructure Equity Index Fund (Note 1)
Statement of Net Assets — As at December 31
2012
Assets
Investments - at fair value (Note 2) $ 208,416,275Cash 1,048,100Dividends receivable 873,185Tax reclaim on dividends receivable 29,618Accounts receivable from issue of units 13,594
210,380,772
Liabilities
Operating expenses payable 43,471Payables for redemption of units 908,800
952,271
Net Assets $ 209,428,501
Net Assets per Class
Class D $ 209,428,501
$ 209,428,501
Number of Units Issued and Outstanding (Note 8)
Class D 20,028,954
Net Assets per Unit
Class D $ 10.46
Investments at Cost $ 202,557,101
Approved by BlackRock Asset Management Canada Limited,Manager of the Funds
Eric Léveillé, Director Noel Archard, Director
The accompanying notes are an integral part of the financial statements. 308
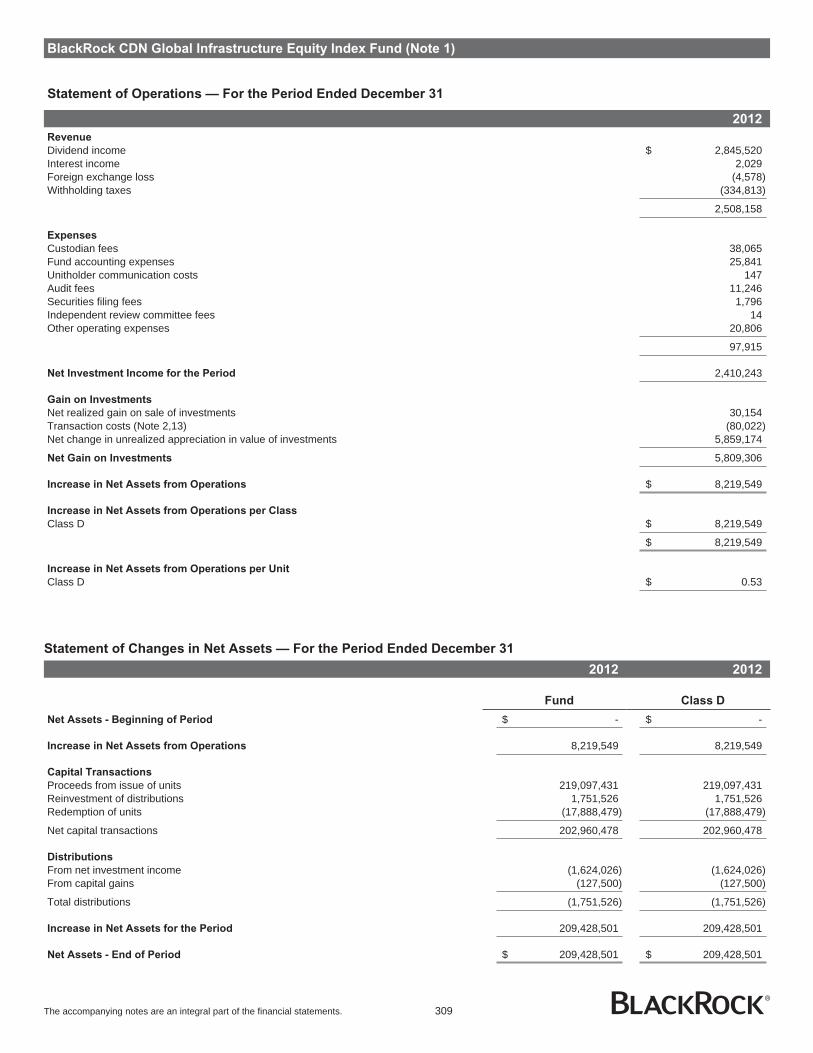
BlackRock CDN Global Infrastructure Equity Index Fund (Note 1)
Statement of Operations — For the Period Ended December 31
2012
Revenue
Dividend income $ 2,845,520Interest income 2,029Foreign exchange loss (4,578)Withholding taxes (334,813)
2,508,158
Expenses
Custodian fees 38,065Fund accounting expenses 25,841Unitholder communication costs 147Audit fees 11,246Securities filing fees 1,796Independent review committee fees 14Other operating expenses 20,806
97,915
Net Investment Income for the Period 2,410,243
Gain on Investments
Net realized gain on sale of investments 30,154Transaction costs (Note 2,13) (80,022)Net change in unrealized appreciation in value of investments 5,859,174
Net Gain on Investments 5,809,306
Increase in Net Assets from Operations $ 8,219,549
Increase in Net Assets from Operations per Class
Class D $ 8,219,549
$ 8,219,549
Increase in Net Assets from Operations per Unit
Class D $ 0.53
Statement of Changes in Net Assets — For the Period Ended December 31
2012 2012
Fund Class D
Net Assets - Beginning of Period $ - $ -
Increase in Net Assets from Operations 8,219,549 8,219,549
Capital Transactions
Proceeds from issue of units 219,097,431 219,097,431Reinvestment of distributions 1,751,526 1,751,526Redemption of units (17,888,479) (17,888,479)
Net capital transactions 202,960,478 202,960,478
Distributions
From net investment income (1,624,026) (1,624,026)From capital gains (127,500) (127,500)
Total distributions (1,751,526) (1,751,526)
Increase in Net Assets for the Period 209,428,501 209,428,501
Net Assets - End of Period $ 209,428,501 $ 209,428,501
The accompanying notes are an integral part of the financial statements. 309
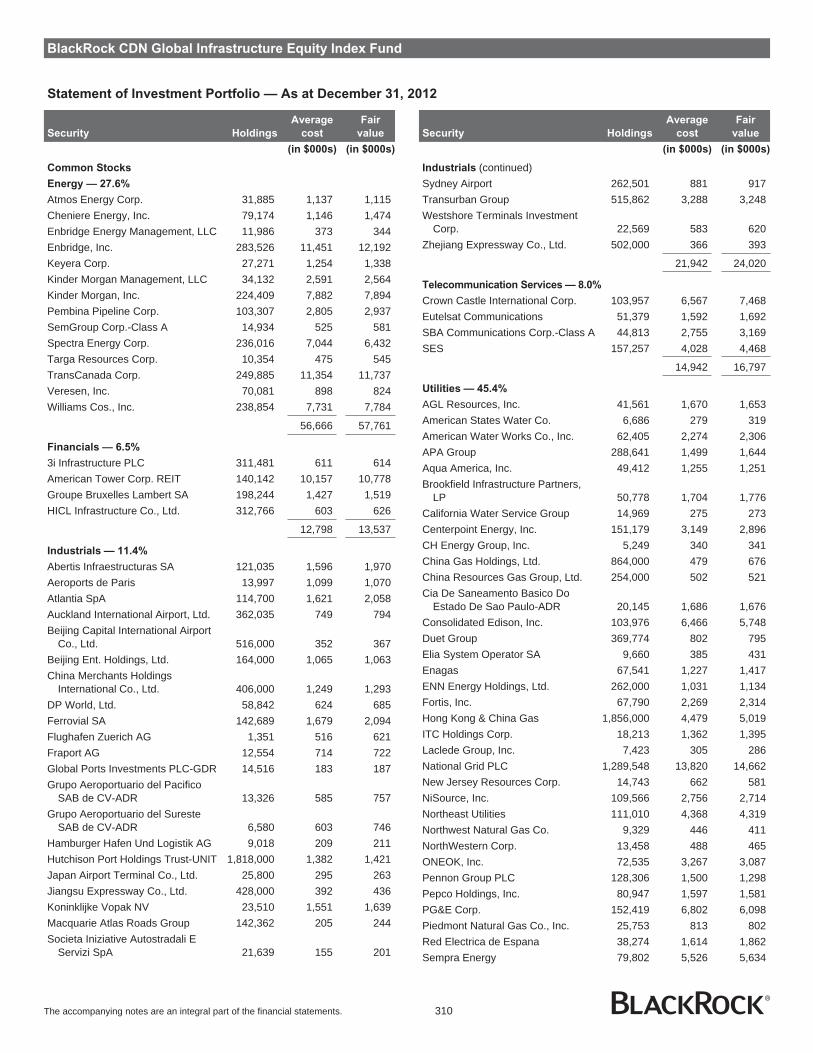
BlackRock CDN Global Infrastructure Equity Index Fund
Statement of Investment Portfolio — As at December 31, 2012
Security Holdings
Average
cost
Fair
value
(in $000s) (in $000s)
Common Stocks
Energy — 27.6%
Atmos Energy Corp. 31,885 1,137 1,115Cheniere Energy, Inc. 79,174 1,146 1,474Enbridge Energy Management, LLC 11,986 373 344Enbridge, Inc. 283,526 11,451 12,192Keyera Corp. 27,271 1,254 1,338Kinder Morgan Management, LLC 34,132 2,591 2,564Kinder Morgan, Inc. 224,409 7,882 7,894Pembina Pipeline Corp. 103,307 2,805 2,937SemGroup Corp.-Class A 14,934 525 581Spectra Energy Corp. 236,016 7,044 6,432Targa Resources Corp. 10,354 475 545TransCanada Corp. 249,885 11,354 11,737Veresen, Inc. 70,081 898 824Williams Cos., Inc. 238,854 7,731 7,784
56,666 57,761
Financials — 6.5%
3i Infrastructure PLC 311,481 611 614American Tower Corp. REIT 140,142 10,157 10,778Groupe Bruxelles Lambert SA 198,244 1,427 1,519HICL Infrastructure Co., Ltd. 312,766 603 626
12,798 13,537
Industrials — 11.4%
Abertis Infraestructuras SA 121,035 1,596 1,970Aeroports de Paris 13,997 1,099 1,070Atlantia SpA 114,700 1,621 2,058Auckland International Airport, Ltd. 362,035 749 794Beijing Capital International Airport
Co., Ltd. 516,000 352 367Beijing Ent. Holdings, Ltd. 164,000 1,065 1,063China Merchants Holdings
International Co., Ltd. 406,000 1,249 1,293DP World, Ltd. 58,842 624 685Ferrovial SA 142,689 1,679 2,094Flughafen Zuerich AG 1,351 516 621Fraport AG 12,554 714 722Global Ports Investments PLC-GDR 14,516 183 187Grupo Aeroportuario del Pacifico
SAB de CV-ADR 13,326 585 757Grupo Aeroportuario del Sureste
SAB de CV-ADR 6,580 603 746Hamburger Hafen Und Logistik AG 9,018 209 211Hutchison Port Holdings Trust-UNIT 1,818,000 1,382 1,421Japan Airport Terminal Co., Ltd. 25,800 295 263Jiangsu Expressway Co., Ltd. 428,000 392 436Koninklijke Vopak NV 23,510 1,551 1,639Macquarie Atlas Roads Group 142,362 205 244Societa Iniziative Autostradali E
Servizi SpA 21,639 155 201
Security Holdings
Average
cost
Fair
value
(in $000s) (in $000s)
Industrials (continued)Sydney Airport 262,501 881 917Transurban Group 515,862 3,288 3,248Westshore Terminals Investment
Corp. 22,569 583 620Zhejiang Expressway Co., Ltd. 502,000 366 393
21,942 24,020
Telecommunication Services — 8.0%
Crown Castle International Corp. 103,957 6,567 7,468Eutelsat Communications 51,379 1,592 1,692SBA Communications Corp.-Class A 44,813 2,755 3,169SES 157,257 4,028 4,468
14,942 16,797
Utilities — 45.4%
AGL Resources, Inc. 41,561 1,670 1,653American States Water Co. 6,686 279 319American Water Works Co., Inc. 62,405 2,274 2,306APA Group 288,641 1,499 1,644Aqua America, Inc. 49,412 1,255 1,251Brookfield Infrastructure Partners,
LP 50,778 1,704 1,776California Water Service Group 14,969 275 273Centerpoint Energy, Inc. 151,179 3,149 2,896CH Energy Group, Inc. 5,249 340 341China Gas Holdings, Ltd. 864,000 479 676China Resources Gas Group, Ltd. 254,000 502 521Cia De Saneamento Basico Do
Estado De Sao Paulo-ADR 20,145 1,686 1,676Consolidated Edison, Inc. 103,976 6,466 5,748Duet Group 369,774 802 795Elia System Operator SA 9,660 385 431Enagas 67,541 1,227 1,417ENN Energy Holdings, Ltd. 262,000 1,031 1,134Fortis, Inc. 67,790 2,269 2,314Hong Kong & China Gas 1,856,000 4,479 5,019ITC Holdings Corp. 18,213 1,362 1,395Laclede Group, Inc. 7,423 305 286National Grid PLC 1,289,548 13,820 14,662New Jersey Resources Corp. 14,743 662 581NiSource, Inc. 109,566 2,756 2,714Northeast Utilities 111,010 4,368 4,319Northwest Natural Gas Co. 9,329 446 411NorthWestern Corp. 13,458 488 465ONEOK, Inc. 72,535 3,267 3,087Pennon Group PLC 128,306 1,500 1,298Pepco Holdings, Inc. 80,947 1,597 1,581PG&E Corp. 152,419 6,802 6,098Piedmont Natural Gas Co., Inc. 25,753 813 802Red Electrica de Espana 38,274 1,614 1,862Sempra Energy 79,802 5,526 5,634
The accompanying notes are an integral part of the financial statements. 310
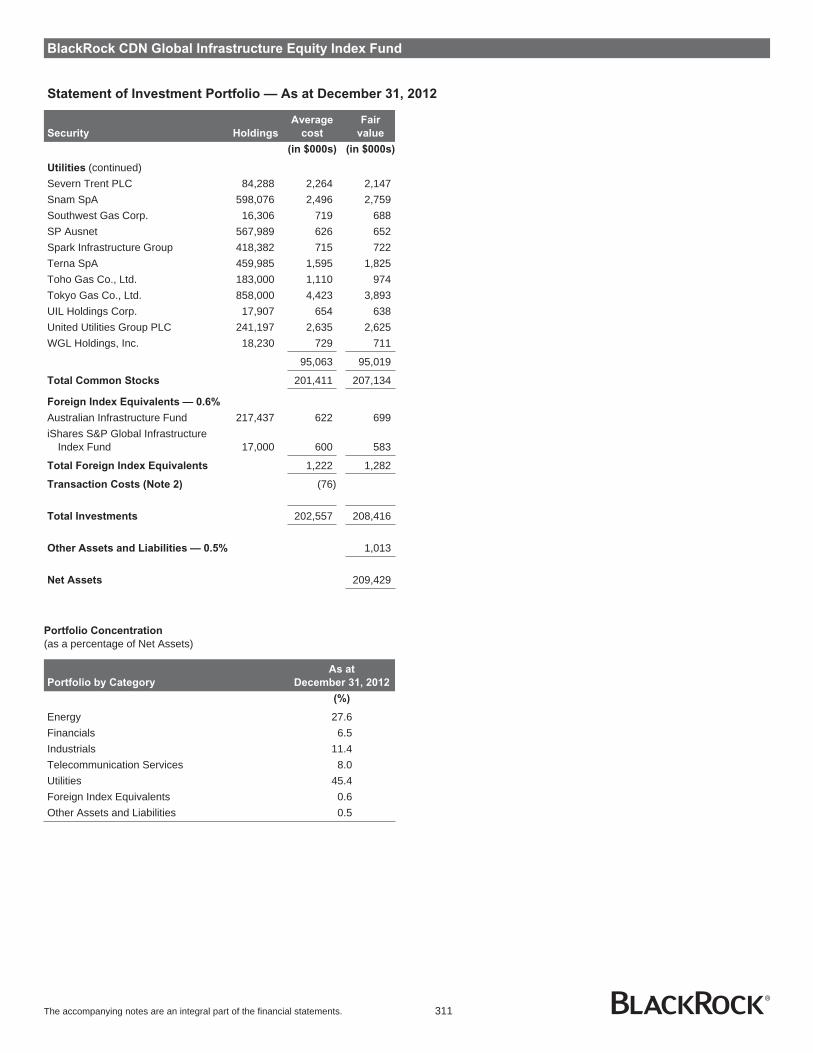
BlackRock CDN Global Infrastructure Equity Index Fund
Statement of Investment Portfolio — As at December 31, 2012
Security Holdings
Average
cost
Fair
value
(in $000s) (in $000s)
Utilities (continued)Severn Trent PLC 84,288 2,264 2,147Snam SpA 598,076 2,496 2,759Southwest Gas Corp. 16,306 719 688SP Ausnet 567,989 626 652Spark Infrastructure Group 418,382 715 722Terna SpA 459,985 1,595 1,825Toho Gas Co., Ltd. 183,000 1,110 974Tokyo Gas Co., Ltd. 858,000 4,423 3,893UIL Holdings Corp. 17,907 654 638United Utilities Group PLC 241,197 2,635 2,625WGL Holdings, Inc. 18,230 729 711
95,063 95,019
Total Common Stocks 201,411 207,134
Foreign Index Equivalents — 0.6%
Australian Infrastructure Fund 217,437 622 699iShares S&P Global Infrastructure
Index Fund 17,000 600 583
Total Foreign Index Equivalents 1,222 1,282
Transaction Costs (Note 2) (76)
Total Investments 202,557 208,416
Other Assets and Liabilities — 0.5% 1,013
Net Assets 209,429
Portfolio Concentration
(as a percentage of Net Assets)
Portfolio by Category
As at
December 31, 2012
(%)
Energy 27.6Financials 6.5Industrials 11.4Telecommunication Services 8.0Utilities 45.4Foreign Index Equivalents 0.6Other Assets and Liabilities 0.5
The accompanying notes are an integral part of the financial statements. 311

BlackRock CDN Emerging Markets Fundamental Index Fund
Statement of Net Assets — As at December 31
2012 2011
Assets
Investments - at fair value (Note 2) $ 95,623,895 $ 24,916,919Cash 2,308,225 329,263Dividends receivable 103,518 29,569
98,035,638 25,275,751
Liabilities
Payables for investment purchases 1,149,977 -Distributions payable 2,433,743 1,018,446
3,583,720 1,018,446
Net Assets $ 94,451,918 $ 24,257,305
Number of Units Issued and Outstanding (Note 8) 4,882,700 1,368,828
Net Assets per Unit $ 19.34 $ 17.72
Investments at Cost $ 94,962,506 $ 28,701,104
Approved by BlackRock Asset Management Canada Limited,Manager of the Funds
Eric Léveillé, Director Noel Archard, Director
The accompanying notes are an integral part of the financial statements. 312

BlackRock CDN Emerging Markets Fundamental Index Fund
Statement of Operations — For the Years Ended December 31
2012 2011
Revenue
Dividend income $ 2,827,896 $ 1,111,055Interest income - 154Securities lending income 14,788 -Foreign exchange loss (97,961) (58,244)Other income - 1,024Withholding taxes (346,282) (110,659)
2,398,441 943,330
Expenses
Interest and bank charges 1,402 613Other operating expenses - 87
1,402 700
Net Investment Income for the Year 2,397,039 942,630
Gain (Loss) on Investments
Net realized gain (loss) on sale of investments 296,899 382,220Transaction costs (Note 2,13) (112,647) (125,514)Net change in unrealized appreciation (depreciation) in value of investments 4,445,574 (6,331,662)Net change in unrealized appreciation/depreciation on foreign exchange transactions 9,374 (3,946)
Net Gain (Loss) on Investments 4,639,200 (6,078,902)
Increase in Net Assets from Operations $ 7,036,239 $ (5,136,272)
Increase (Decrease) in Net Assets from Operations per Unit $ 2.04 $ (3.75)
Statement of Changes in Net Assets — For the Years Ended December 31
2012 2011
Net Assets - Beginning of Year $ 24,257,305 $ 30,395,882
Increase (Decrease) in Net Assets from Operations 7,036,239 (5,136,272)
Capital Transactions
Proceeds from issue of units 66,360,665 -Reinvestment of distributions 95,245 249,417Redemption of units (768,548) (794)
Net capital transactions 65,687,362 248,623
Distributions
From net investment income (2,433,743) (1,018,446)From capital gains (95,245) (232,482)
Total distributions (2,528,988) (1,250,928)
Increase (Decrease) in Net Assets for the Year 70,194,613 (6,138,577)
Net Assets - End of Year $ 94,451,918 $ 24,257,305
The accompanying notes are an integral part of the financial statements. 313

BlackRock CDN Emerging Markets Fundamental Index Fund
Statement of Investment Portfolio — As at December 31, 2012
Security Holdings
Average
cost
Fair
value
(in $000s) (in $000s)
Common Stocks
Consumer Discretionary — 2.7%
Bajaj Auto Ltd. 1,130 34 44Cheng Shin Rubber Industry Co. Ltd. 42,180 104 109Cyrela Brazil Realty SA
Empreendimentos e Participações 8,000 62 70Dongfeng Motor Corp., Class ‘H’ 55,500 96 85Far Eastern Department Stores Ltd. 51,833 60 53Formosa Taffeta Co. Ltd. 95,000 87 91Foschini Ltd. 4,454 65 74Gafisa SA 24,600 50 56Genting BHD 29,100 95 87Genting Malaysia BHD 28,400 34 33Guangzhou Automobile Group Co.
Ltd., Class ‘H’ 78,000 81 69Hero MotoCorp Ltd. 816 31 28Imperial Holdings Ltd. 8,855 163 206JD Group Ltd. 13,023 76 69Lojas Americanas SA 1,406 12 12Lojas Americanas SA, Preferred 6,802 54 60Mahindra & Mahindra Ltd. 1,512 20 25Mercuries & Associates Ltd. 68,640 60 62Naspers Ltd., Series ‘N’ 4,496 238 287PDG Realty SA Empreendimentos e
Participações 29,100 59 47Pou Chen Corp. 225,080 189 235PT Astra International TBK 135,000 62 105Steinhoff International Holdings Ltd. 54,578 169 176Tata Motors Ltd. 7,372 29 42Tatung Co. Ltd. 440,267 138 111Truworths International Ltd. 6,282 66 80UMW Holdings BHD 32,300 88 126Woolworths Holdings Ltd. 16,407 91 137
2,313 2,579
Consumer Staples — 3.7%
Anadolu Efes Biracilik ve MaltSanayii AS 3,982 54 57
Balrampur Chini Mills Ltd. 77,494 94 70BRF - Brasil Foods SA 13,500 229 277British American Tobacco Malaysia
Berhad 1,700 30 34China Resources Enterprise Ltd. 42,000 144 151Coca-Cola FEMSA SAB de CV 12,989 127 191Companhia Brasileira de Distribuicao
Grupo Pao de Acucar, PerferenceA Shares 2,500 104 110
Companhia de Bebidas dasAmericas 1,900 57 77
Companhia de Bebidas dasAméricas, Preferred 11,100 402 462
Grupo Bimbo SAB de CV, Series ‘A’ 58,000 130 149
Security Holdings
Average
cost
Fair
value
(in $000s) (in $000s)
Consumer Staples (continued)Hindustan Unilever Ltd. 3,380 19 32IOI Corp. BHD 44,100 75 72ITC Ltd. 23,991 82 125JBS SA 28,000 105 82Kimberly-Clark de Mexico SAB de
CV, Series ‘A’ 41,693 81 106Kuala Lumpur Kepong Berhad 2,600 20 20Marfrig Frigorificos e Comercio de
Alimentos SA 10,600 58 44Natura Cosmeticos SA 4,400 106 125Pick’n Pay Stores Ltd. 10,708 62 56PPB Group Berhad 6,000 32 23President Chain Store Corp. 18,000 92 96Shoprite Holdings Ltd. 9,116 149 219Souza Cruz SA 7,000 91 105Spar Group Ltd. (The) 4,545 68 69Tiger Brands Ltd. 2,534 81 97Uni-President Enterprises Corp. 178,596 263 326Wal-Mart de Mexico SA de CV,
Series ‘V’ 102,700 271 332
3,026 3,507
Energy — 19.1%
Bharat Petroleum Corp. Ltd. 21,088 137 135China Coal Energy Co., Class ‘H’ 129,000 146 139China Petroleum and Chemical
Corp. (Sinopec), Series ‘H’ 1,026,000 1,016 1,157China Shenhua Energy Co. Ltd. 91,500 384 398CNOOC Ltd. 419,000 825 903Cosan SA Industria e Comercio 4,000 69 81Formosa Petrochemical Corp. 70,000 204 206Grupa Lotos SA 11,345 110 150Hindustan Petroleum Corp. Ltd. 33,742 215 178Indian Oil Corp. Ltd. 22,837 116 112IRPC Public Co. Ltd. 695,500 88 93MOL Hungarian Oil and Gas Co.
PLC 4,817 387 386Novatek OAO, GDR 1,579 173 188OAO Gazprom, ADR 202,546 2,365 1,907OAO LUKOIL, ADR 29,564 1,797 1,946OAO Tatneft, GDR 10,497 361 455Oil and Natural Gas Corp. Ltd. 36,229 192 176OJSC Rosneft Oil Co., GDR 58,732 425 521PetroChina Co. Ltd., Series ‘H’ 844,000 1,166 1,186Petróleo Brasileiro SA 161,600 2,054 1,533Petróleo Brasileiro SA, Preferred 235,900 2,839 2,237Polish Oil & Gas 95,341 121 160Polski Koncern Naftowy Orlen SA 38,725 446 617PT Bumi Resources TBK 300,000 77 18PTT Exploration and Production
Public Co. Ltd. 41,732 217 222
The accompanying notes are an integral part of the financial statements. 314

BlackRock CDN Emerging Markets Fundamental Index Fund
Statement of Investment Portfolio — As at December 31, 2012
Security Holdings
Average
cost
Fair
value
(in $000s) (in $000s)
Energy (continued)PTT Public Co. Ltd. 43,100 438 466Reliance Industries Ltd. 37,357 610 568Sasol Ltd. 19,935 882 849Surgutneftegaz, ADR 35,221 327 309Thai Oil Public Co. Ltd. 55,400 114 122Tupras-Turkiye Petrol Rafinerileri AS 9,216 200 264Ultrapar Participações SA 10,900 220 244Yanzhou Coal Mining Co. Ltd.,
Class ‘H’ 48,700 90 80
18,811 18,006
Financials — 34.5%
ABSA Group Ltd. 15,301 282 294African Bank Investments Ltd. 30,005 145 113Agricultural Bank of China Ltd. 685,000 316 338Akbank T.A.S. 50,073 192 245AMMB Holdings BHD 30,400 61 66Axis Bank Ltd. 3,057 71 75Banco Bradesco SA, Preferred 70,270 1,136 1,202Banco de Chile, ADR 1,110 95 107Banco do Brasil SA 62,600 798 779Banco do Estado do Rio Grande do
Sul SA, Preferred, Class ‘B’ 6,200 56 47Banco Santander (Brasil) SA 42,600 379 309Banco Santander Chile SA, ADR 3,865 122 110Bangkok Bank Public Co. Ltd.,
Registered 9,000 51 61Bank of China Ltd., Class ‘H’ 3,579,000 1,551 1,595Bank of Communications Co. Ltd.,
Class ‘H’ 313,900 261 235Bank Pekao SA 3,769 185 203BM&F BOVESPA SA 56,600 324 385BR Malls Participações SA 5,900 74 77Cathay Financial Holding Co. Ltd. 301,382 350 325Chang Hwa Commercial Bank 151,907 75 83China Citic Bank, Class ‘H’ 285,000 181 168China Construction Bank Corp.,
Class ‘H’ 2,495,000 1,911 1,993China Development Financial
Holding Corp. 528,372 139 138China Life Insurance Co. Ltd.,
Series ‘H’ 179,000 569 583China Merchants Bank Co. Ltd. 86,500 189 190China Minsheng Banking Corp. Ltd.,
Series ‘H’ 99,900 95 115China Overseas Land & Investment
Ltd. 76,000 162 226China Pacific Insurance (Group) Co.
Ltd., Class ‘H’ 34,400 120 127China Resources Land Ltd. 42,000 79 113Chinatrust Financial Holding Co. Ltd. 392,309 235 230
Security Holdings
Average
cost
Fair
value
(in $000s) (in $000s)
Financials (continued)CIMB Group Holdings BHD 62,300 154 155Commercial International Bank,
GDR 6,000 28 33DLF Ltd. 7,211 36 30First Financial Holding Co. Ltd. 224,820 131 136FirstRand Ltd. 151,940 456 553Fubon Financial Holding Co. Ltd. 281,640 305 339Growthpoint Properties Ltd. 43,761 117 126Haci Omer Sabanci Holding AS 23,113 100 125HDFC Bank Ltd. 3,642 35 45Housing Development Finance Corp.
Ltd. 4,138 52 63Hua Nan Financial Holdings Co. Ltd. 225,174 128 129ICICI Bank Ltd. 6,576 132 136Industrial and Commercial Bank of
China, Class ‘H’ 2,128,000 1,428 1,504iShares MSCI Chile Investable
Market Index Fund 15,171 997 955iShares MSCI Indonesia Investable
Market Index Fund 38,483 1,153 1,159iShares MSCI Malaysia Index Fund 105,314 1,515 1,586iShares S&P India Nifty 50 Index
Fund 106,926 2,403 2,651Itau Unibanco Holding SA 6,900 103 104Itau Unibanco Holding SA, Preferred 74,400 1,244 1,208Itausa-Investimentos Itau SA,
Preferred, Registered 52,390 264 247Kasikornbank Public Co. Ltd. 26,500 134 167Komercni Banka AS 795 143 167Liberty Holdings Ltd. 8,691 92 113Malayan Banking BHD 89,200 252 264Market Vectors Egypt Index ETF 30,800 404 401Market Vectors Russia ETF 90,865 2,601 2,710Mega Financial Holding Co. Ltd. 356,516 253 276MMI Holdings Ltd. 42,981 96 112Nedbank Group Ltd. 10,561 212 233OTP Bank Nyrt. 25,178 471 470PICC Property and Casualty Co.
Ltd., Series ‘H’ 58,000 65 81Ping An Insurance (Group) Co. of
China Ltd. 36,500 300 304Powszechna Kasa Oszczednosci
Bank Polski SA 21,735 230 257Powszechny Zaklad Ubezpieczen
SA 2,315 245 325PT Bank Central Asia TBK 46,500 27 43PT Bank Mandiri 51,000 38 42PT Bank Rakyat Indonesia (Persero)
TBK 58,500 30 42Public Bank BHD 68,200 302 361Punjab National Bank Ltd. 5,218 94 83
The accompanying notes are an integral part of the financial statements. 315

BlackRock CDN Emerging Markets Fundamental Index Fund
Statement of Investment Portfolio — As at December 31, 2012
Security Holdings
Average
cost
Fair
value
(in $000s) (in $000s)
Financials (continued)Remgro Ltd. 12,805 197 239Sanlam Ltd. 96,943 388 509Sberbank of Russia, ADR 18,280 234 229Sberbank of Russia, ADR 14,000 192 171Shin Kong Financial Holding Co. Ltd. 334,000 106 94Siam Commercial Bank Public Co.
Ltd. 27,200 118 160Sino-Ocean Land Holdings Ltd. 186,000 91 138SinoPac Holdings Co. 308,461 108 132Standard Bank Group Ltd. 66,622 929 929State Bank of India 2,308 101 100Sul America SA 7,034 59 61Taishin Financial Holdings Co. Ltd. 420,620 152 166Taiwan Cooperative Financial
Holding 197,739 112 111Turkiye Garanti Bankasi AS 43,500 166 224Turkiye Halk Bankasi AS 15,480 119 151Turkiye Is Bankasi, Series ‘C’ 89,490 222 308Turkiye Vakiflar Bankasi T.A.O.,
Class ‘D’ 46,901 88 121VTB Bank, GDR 56,361 227 194Yapi ve Kredi Bankasi AS 56,625 119 164Yuanta Financial Holding Co. Ltd. 240,678 124 123
30,826 32,591
Health Care — 0.3%
Aspen Pharmacare Holdings Ltd. 8,813 137 175Gedeon Richter Rt. 422 73 69Network Healthcare Holdings Ltd. 50,320 96 116
306 360
Industrials — 5.0%
Alfa SA, Series ‘A’ 100,220 126 211All America Latina Logistica 18,200 94 74Aveng Ltd. 28,039 133 100Barloworld Ltd. 15,792 163 162Beijing Enterprises Holdings Ltd. 15,000 89 97Bharat Heavy Electricals Ltd. 7,820 55 32Bidvest Group Ltd. 13,568 288 343CCR SA 31,700 247 299China Communications Construction
Co. Ltd., Class ‘H’ 211,000 201 202China COSCO Holdings Co. Ltd.,
Class ‘H’ 147,500 99 72China International Marine
Containers (Group) Co.Ltd 50,500 76 77China Merchants Holdings
International Co. Ltd. 28,241 94 90China Railway Construction Corp.,
Class ‘H’ 170,000 151 192China Railway Group Ltd., Class ‘H’ 336,000 156 196Citic Pacific Ltd. 73,000 130 108
Security Holdings
Average
cost
Fair
value
(in $000s) (in $000s)
Industrials (continued)Dogan Sirketler Grubu Holdings AS 179,162 80 91Embraer SA 28,700 208 201Empresas ICA SAB de CV 52,700 98 130Far Eastern New Century Corp. 173,076 192 196Grindrod Ltd. 43,494 80 79Grupo Aeroportuario del Pacifico SA
de CV 24,900 97 140IJM Corp. BHD 19,300 34 31Koc Holding AS 89,227 339 460Larsen & Toubro Ltd. 4,389 132 128Latam Airlines Group SA, ADR 1,888 52 44Murray & Roberts Holdings Ltd. 28,611 97 82Orascom Construction Industries,
GDR 800 36 32PT United Tractors TBK 10,000 25 20Reunert Ltd. 9,677 82 85Shanghai Industrial Holdings Ltd. 24,000 80 83Sime Darby Berhad 66,700 212 206Turk Hava Yollari Anonim Ortakligi 96,284 155 335Walsin Lihwa Corp. 330,000 111 112
4,212 4,710
Information Technology — 10.5%
Acer Inc. 248,025 355 214Advanced Semiconductor
Engineering Inc. 295,269 268 254Asustek Computer Inc. 48,080 460 537AU Optronics Corp. 1,146,000 615 511Chimei Innolux Corp. 556,443 285 298Cielo SA 3,040 92 84Compal Electronics Inc. 387,025 426 259Coretronic Corp. 92,000 91 71Delta Electronics Inc. 100,000 303 363Foxconn Technology Co. Ltd. 27,825 94 87HannStar Display Corp. 275,000 60 30Hon Hai Precision Industry Co. Ltd. 493,682 1,605 1,503HTC Corp. 20,567 349 212Infosys Technologies Ltd. 2,349 137 99Inventec Co. Ltd. 240,534 95 92Lenovo Group Ltd. 260,000 235 234Lite-On Technology Corp. 180,387 227 238Macronix International Co. Ltd. 254,305 91 76MediaTek Inc. 45,000 440 498Mstar Semiconductor Inc. 14,000 90 104Pegatron Corp. 118,608 169 153Powertech Technology Inc. 51,800 105 83Quanta Computer Inc. 179,000 436 419Siliconware Precision Industries Co. 193,000 225 205Synnex Technology International
Corp. 55,000 130 101
The accompanying notes are an integral part of the financial statements. 316
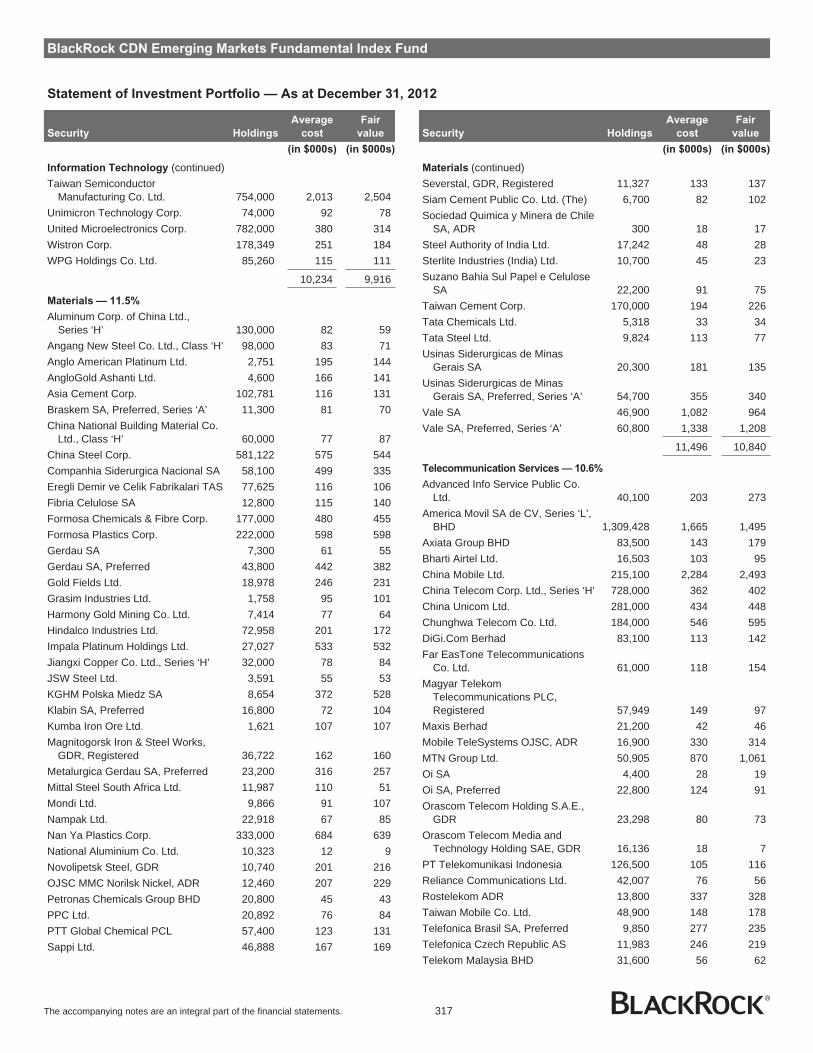
BlackRock CDN Emerging Markets Fundamental Index Fund
Statement of Investment Portfolio — As at December 31, 2012
Security Holdings
Average
cost
Fair
value
(in $000s) (in $000s)
Information Technology (continued)Taiwan Semiconductor
Manufacturing Co. Ltd. 754,000 2,013 2,504Unimicron Technology Corp. 74,000 92 78United Microelectronics Corp. 782,000 380 314Wistron Corp. 178,349 251 184WPG Holdings Co. Ltd. 85,260 115 111
10,234 9,916
Materials — 11.5%
Aluminum Corp. of China Ltd.,Series ‘H’ 130,000 82 59
Angang New Steel Co. Ltd., Class ‘H’ 98,000 83 71Anglo American Platinum Ltd. 2,751 195 144AngloGold Ashanti Ltd. 4,600 166 141Asia Cement Corp. 102,781 116 131Braskem SA, Preferred, Series ‘A’ 11,300 81 70China National Building Material Co.
Ltd., Class ‘H’ 60,000 77 87China Steel Corp. 581,122 575 544Companhia Siderurgica Nacional SA 58,100 499 335Eregli Demir ve Celik Fabrikalari TAS 77,625 116 106Fibria Celulose SA 12,800 115 140Formosa Chemicals & Fibre Corp. 177,000 480 455Formosa Plastics Corp. 222,000 598 598Gerdau SA 7,300 61 55Gerdau SA, Preferred 43,800 442 382Gold Fields Ltd. 18,978 246 231Grasim Industries Ltd. 1,758 95 101Harmony Gold Mining Co. Ltd. 7,414 77 64Hindalco Industries Ltd. 72,958 201 172Impala Platinum Holdings Ltd. 27,027 533 532Jiangxi Copper Co. Ltd., Series ‘H’ 32,000 78 84JSW Steel Ltd. 3,591 55 53KGHM Polska Miedz SA 8,654 372 528Klabin SA, Preferred 16,800 72 104Kumba Iron Ore Ltd. 1,621 107 107Magnitogorsk Iron & Steel Works,
GDR, Registered 36,722 162 160Metalurgica Gerdau SA, Preferred 23,200 316 257Mittal Steel South Africa Ltd. 11,987 110 51Mondi Ltd. 9,866 91 107Nampak Ltd. 22,918 67 85Nan Ya Plastics Corp. 333,000 684 639National Aluminium Co. Ltd. 10,323 12 9Novolipetsk Steel, GDR 10,740 201 216OJSC MMC Norilsk Nickel, ADR 12,460 207 229Petronas Chemicals Group BHD 20,800 45 43PPC Ltd. 20,892 76 84PTT Global Chemical PCL 57,400 123 131Sappi Ltd. 46,888 167 169
Security Holdings
Average
cost
Fair
value
(in $000s) (in $000s)
Materials (continued)Severstal, GDR, Registered 11,327 133 137Siam Cement Public Co. Ltd. (The) 6,700 82 102Sociedad Quimica y Minera de Chile
SA, ADR 300 18 17Steel Authority of India Ltd. 17,242 48 28Sterlite Industries (India) Ltd. 10,700 45 23Suzano Bahia Sul Papel e Celulose
SA 22,200 91 75Taiwan Cement Corp. 170,000 194 226Tata Chemicals Ltd. 5,318 33 34Tata Steel Ltd. 9,824 113 77Usinas Siderurgicas de Minas
Gerais SA 20,300 181 135Usinas Siderurgicas de Minas
Gerais SA, Preferred, Series ‘A’ 54,700 355 340Vale SA 46,900 1,082 964Vale SA, Preferred, Series ‘A’ 60,800 1,338 1,208
11,496 10,840
Telecommunication Services — 10.6%
Advanced Info Service Public Co.Ltd. 40,100 203 273
America Movil SA de CV, Series ‘L’,BHD 1,309,428 1,665 1,495
Axiata Group BHD 83,500 143 179Bharti Airtel Ltd. 16,503 103 95China Mobile Ltd. 215,100 2,284 2,493China Telecom Corp. Ltd., Series ‘H’ 728,000 362 402China Unicom Ltd. 281,000 434 448Chunghwa Telecom Co. Ltd. 184,000 546 595DiGi.Com Berhad 83,100 113 142Far EasTone Telecommunications
Co. Ltd. 61,000 118 154Magyar Telekom
Telecommunications PLC,Registered 57,949 149 97
Maxis Berhad 21,200 42 46Mobile TeleSystems OJSC, ADR 16,900 330 314MTN Group Ltd. 50,905 870 1,061Oi SA 4,400 28 19Oi SA, Preferred 22,800 124 91Orascom Telecom Holding S.A.E.,
GDR 23,298 80 73Orascom Telecom Media and
Technology Holding SAE, GDR 16,136 18 7PT Telekomunikasi Indonesia 126,500 105 116Reliance Communications Ltd. 42,007 76 56Rostelekom ADR 13,800 337 328Taiwan Mobile Co. Ltd. 48,900 148 178Telefonica Brasil SA, Preferred 9,850 277 235Telefonica Czech Republic AS 11,983 246 219Telekom Malaysia BHD 31,600 56 62
The accompanying notes are an integral part of the financial statements. 317

BlackRock CDN Emerging Markets Fundamental Index Fund
Statement of Investment Portfolio — As at December 31, 2012
Security Holdings
Average
cost
Fair
value
(in $000s) (in $000s)
Telecommunication Services
(continued)Telekomunikacja Polska SA 60,137 317 237Telkom SA SOC Ltd. 70,969 236 140Tim Participações SA 23,740 119 95Turk Telekomunikasyon AS 25,377 107 98Turkcell Iletisim Hizmetleri AS 13,469 70 86Vodacom Group Ltd. 12,177 141 177
9,847 10,011
Utilities — 3.3%
AES Tiete SA 2,100 26 21AES Tiete SA, Preferred 4,100 58 47Centrais Elétricas Brasileiras SA 52,700 492 162Centrais Elétricas Brasileiras SA,
Preferred, Class ‘B’ 22,500 288 114CEZ AS 9,784 408 348China Resources Power Holdings
Co. Ltd. 58,000 111 147Cia Saneamento Basico de Sao
Paulo NPV 2,400 81 101Companhia de Saneamento de
Minas Gerais - Copasa MG 2,700 61 57Companhia Energetica de Minas
Gerais 3,100 47 33Companhia Energetica de Minas
Gerais, Preferred 19,275 352 211Companhia Energética de São
Paulo, Preferred, Class ‘B’ 3,600 61 34Companhia Paranaense de Energia-
Copel, Preferred, Series ‘B’ 6,200 143 95EDP - Energias do Brasil SA 12,700 86 77Eletropaulo Metropolitana SA,
Preferred 9,200 145 75Empresa Nacional de Electricidad
SA, ADR 3,232 168 157Enersis SA, ADR 10,842 216 198Federal Hydrogenerating Co. JSC
ADR 92,223 272 212Gail (India) Ltd. 5,168 42 34Huaneng Power International Inc.,
Series ‘H’ 182,000 116 167Light SA 6,700 92 72NTPC Ltd. 29,893 84 85Petronas Gas Berhad 4,400 23 28Polska Grupa Energetyczna SA 29,382 187 172PT Perusahaan Gas Negara 51,500 21 24Reliance Energy Ltd. 3,095 36 29Tauron Polska Energia SA 114,338 174 174Tenaga Nasional BHD 27,300 57 61Tractebel Energia SA 7,700 127 124
Security Holdings
Average
cost
Fair
value
(in $000s) (in $000s)
Utilities (continued)YTL Power International BHD 88,200 50 45
4,024 3,104
Total Common Stocks 95,095 95,624
Transaction Costs (Note 2) (132)
Total Investments 94,963 95,624
Other Assets and Liabilities — (1.2)% (1,172)
Net Assets 94,452
Portfolio Concentration
(as percentage of Net Assets)
Portfolio Category
As at
December 31, 2012
As at
December 31, 2011
(%) (%)
Consumer Discretionary 2.7 3.1Consumer Staples 3.7 5.2Energy 19.1 22.1Financials 34.5 28.8Health Care 0.3 0.3Industrials 5.0 3.7Information Technology 10.5 10.4Materials 11.5 13.2Telecommunication
Services 10.6 11.9Utilities 3.3 4.0Other Assets and Liabilities (1.2) (2.7)
The accompanying notes are an integral part of the financial statements. 318
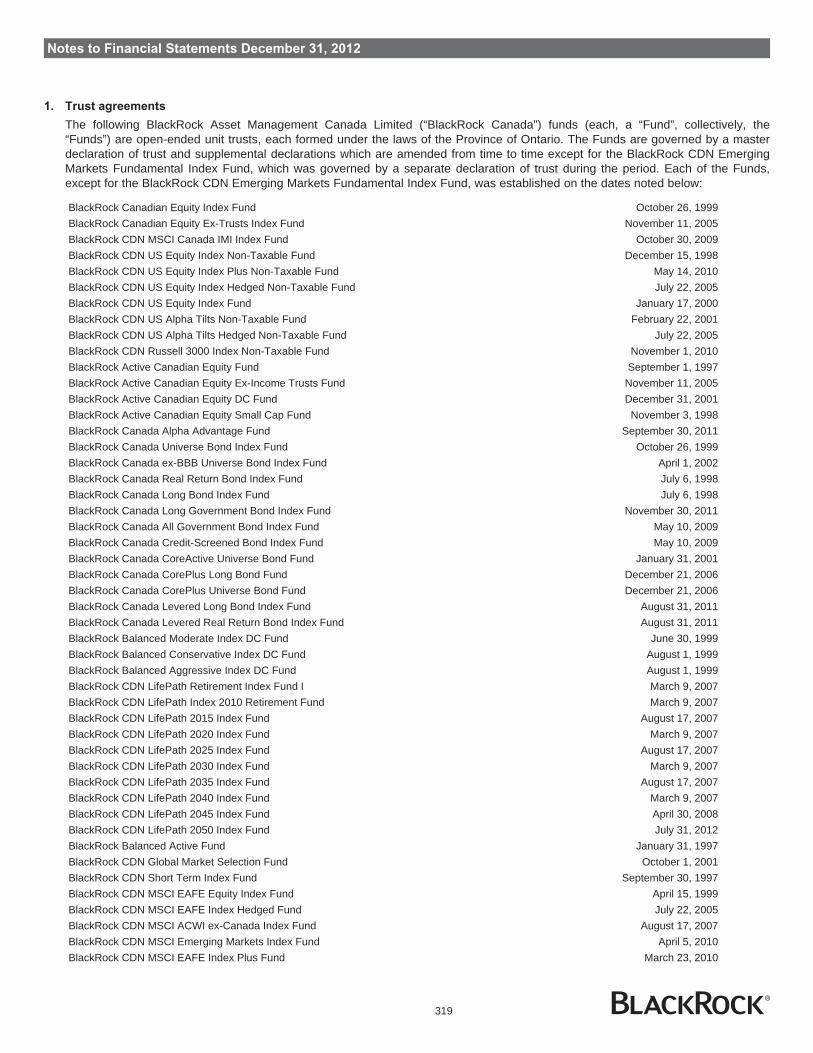
Notes to Financial Statements December 31, 2012
1. Trust agreements
The following BlackRock Asset Management Canada Limited (“BlackRock Canada”) funds (each, a “Fund”, collectively, the“Funds”) are open-ended unit trusts, each formed under the laws of the Province of Ontario. The Funds are governed by a masterdeclaration of trust and supplemental declarations which are amended from time to time except for the BlackRock CDN EmergingMarkets Fundamental Index Fund, which was governed by a separate declaration of trust during the period. Each of the Funds,except for the BlackRock CDN Emerging Markets Fundamental Index Fund, was established on the dates noted below:
BlackRock Canadian Equity Index Fund October 26, 1999BlackRock Canadian Equity Ex-Trusts Index Fund November 11, 2005BlackRock CDN MSCI Canada IMI Index Fund October 30, 2009BlackRock CDN US Equity Index Non-Taxable Fund December 15, 1998BlackRock CDN US Equity Index Plus Non-Taxable Fund May 14, 2010BlackRock CDN US Equity Index Hedged Non-Taxable Fund July 22, 2005BlackRock CDN US Equity Index Fund January 17, 2000BlackRock CDN US Alpha Tilts Non-Taxable Fund February 22, 2001BlackRock CDN US Alpha Tilts Hedged Non-Taxable Fund July 22, 2005BlackRock CDN Russell 3000 Index Non-Taxable Fund November 1, 2010BlackRock Active Canadian Equity Fund September 1, 1997BlackRock Active Canadian Equity Ex-Income Trusts Fund November 11, 2005BlackRock Active Canadian Equity DC Fund December 31, 2001BlackRock Active Canadian Equity Small Cap Fund November 3, 1998BlackRock Canada Alpha Advantage Fund September 30, 2011BlackRock Canada Universe Bond Index Fund October 26, 1999BlackRock Canada ex-BBB Universe Bond Index Fund April 1, 2002BlackRock Canada Real Return Bond Index Fund July 6, 1998BlackRock Canada Long Bond Index Fund July 6, 1998BlackRock Canada Long Government Bond Index Fund November 30, 2011BlackRock Canada All Government Bond Index Fund May 10, 2009BlackRock Canada Credit-Screened Bond Index Fund May 10, 2009BlackRock Canada CoreActive Universe Bond Fund January 31, 2001BlackRock Canada CorePlus Long Bond Fund December 21, 2006BlackRock Canada CorePlus Universe Bond Fund December 21, 2006BlackRock Canada Levered Long Bond Index Fund August 31, 2011BlackRock Canada Levered Real Return Bond Index Fund August 31, 2011BlackRock Balanced Moderate Index DC Fund June 30, 1999BlackRock Balanced Conservative Index DC Fund August 1, 1999BlackRock Balanced Aggressive Index DC Fund August 1, 1999BlackRock CDN LifePath Retirement Index Fund I March 9, 2007BlackRock CDN LifePath Index 2010 Retirement Fund March 9, 2007BlackRock CDN LifePath 2015 Index Fund August 17, 2007BlackRock CDN LifePath 2020 Index Fund March 9, 2007BlackRock CDN LifePath 2025 Index Fund August 17, 2007BlackRock CDN LifePath 2030 Index Fund March 9, 2007BlackRock CDN LifePath 2035 Index Fund August 17, 2007BlackRock CDN LifePath 2040 Index Fund March 9, 2007BlackRock CDN LifePath 2045 Index Fund April 30, 2008BlackRock CDN LifePath 2050 Index Fund July 31, 2012BlackRock Balanced Active Fund January 31, 1997BlackRock CDN Global Market Selection Fund October 1, 2001BlackRock CDN Short Term Index Fund September 30, 1997BlackRock CDN MSCI EAFE Equity Index Fund April 15, 1999BlackRock CDN MSCI EAFE Index Hedged Fund July 22, 2005BlackRock CDN MSCI ACWI ex-Canada Index Fund August 17, 2007BlackRock CDN MSCI Emerging Markets Index Fund April 5, 2010BlackRock CDN MSCI EAFE Index Plus Fund March 23, 2010
319
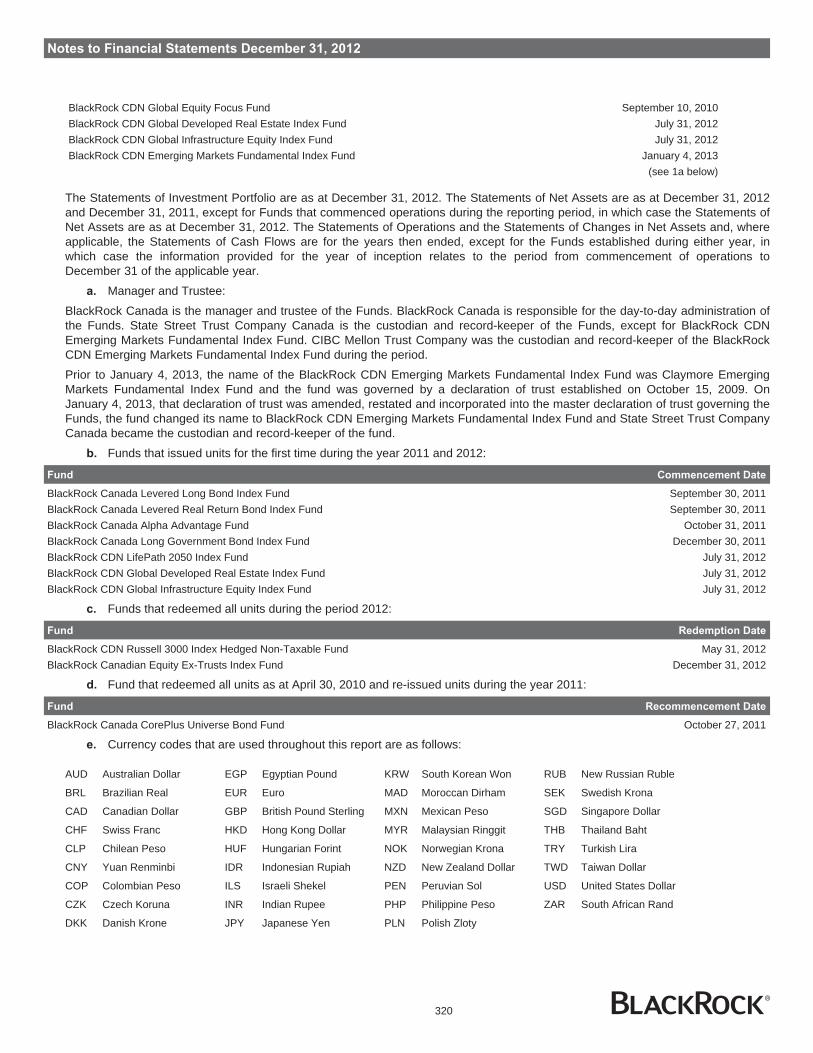
Notes to Financial Statements December 31, 2012
BlackRock CDN Global Equity Focus Fund September 10, 2010BlackRock CDN Global Developed Real Estate Index Fund July 31, 2012BlackRock CDN Global Infrastructure Equity Index Fund July 31, 2012BlackRock CDN Emerging Markets Fundamental Index Fund January 4, 2013
(see 1a below)
The Statements of Investment Portfolio are as at December 31, 2012. The Statements of Net Assets are as at December 31, 2012and December 31, 2011, except for Funds that commenced operations during the reporting period, in which case the Statements ofNet Assets are as at December 31, 2012. The Statements of Operations and the Statements of Changes in Net Assets and, whereapplicable, the Statements of Cash Flows are for the years then ended, except for the Funds established during either year, inwhich case the information provided for the year of inception relates to the period from commencement of operations toDecember 31 of the applicable year.
a. Manager and Trustee:
BlackRock Canada is the manager and trustee of the Funds. BlackRock Canada is responsible for the day-to-day administration ofthe Funds. State Street Trust Company Canada is the custodian and record-keeper of the Funds, except for BlackRock CDNEmerging Markets Fundamental Index Fund. CIBC Mellon Trust Company was the custodian and record-keeper of the BlackRockCDN Emerging Markets Fundamental Index Fund during the period.
Prior to January 4, 2013, the name of the BlackRock CDN Emerging Markets Fundamental Index Fund was Claymore EmergingMarkets Fundamental Index Fund and the fund was governed by a declaration of trust established on October 15, 2009. OnJanuary 4, 2013, that declaration of trust was amended, restated and incorporated into the master declaration of trust governing theFunds, the fund changed its name to BlackRock CDN Emerging Markets Fundamental Index Fund and State Street Trust CompanyCanada became the custodian and record-keeper of the fund.
b. Funds that issued units for the first time during the year 2011 and 2012:
Fund Commencement Date
BlackRock Canada Levered Long Bond Index Fund September 30, 2011BlackRock Canada Levered Real Return Bond Index Fund September 30, 2011BlackRock Canada Alpha Advantage Fund October 31, 2011BlackRock Canada Long Government Bond Index Fund December 30, 2011BlackRock CDN LifePath 2050 Index Fund July 31, 2012BlackRock CDN Global Developed Real Estate Index Fund July 31, 2012BlackRock CDN Global Infrastructure Equity Index Fund July 31, 2012
c. Funds that redeemed all units during the period 2012:
Fund Redemption Date
BlackRock CDN Russell 3000 Index Hedged Non-Taxable Fund May 31, 2012BlackRock Canadian Equity Ex-Trusts Index Fund December 31, 2012
d. Fund that redeemed all units as at April 30, 2010 and re-issued units during the year 2011:
Fund Recommencement Date
BlackRock Canada CorePlus Universe Bond Fund October 27, 2011
e. Currency codes that are used throughout this report are as follows:
AUD Australian Dollar EGP Egyptian Pound KRW South Korean Won RUB New Russian Ruble
BRL Brazilian Real EUR Euro MAD Moroccan Dirham SEK Swedish Krona
CAD Canadian Dollar GBP British Pound Sterling MXN Mexican Peso SGD Singapore Dollar
CHF Swiss Franc HKD Hong Kong Dollar MYR Malaysian Ringgit THB Thailand Baht
CLP Chilean Peso HUF Hungarian Forint NOK Norwegian Krona TRY Turkish Lira
CNY Yuan Renminbi IDR Indonesian Rupiah NZD New Zealand Dollar TWD Taiwan Dollar
COP Colombian Peso ILS Israeli Shekel PEN Peruvian Sol USD United States Dollar
CZK Czech Koruna INR Indian Rupee PHP Philippine Peso ZAR South African Rand
DKK Danish Krone JPY Japanese Yen PLN Polish Zloty
320

Notes to Financial Statements December 31, 2012
2. Summary of significant accounting policies
These financial statements, prepared in accordance with Canadian generally accepted accounting principles (“GAAP”), includeestimates and assumptions made by BlackRock Canada that may affect the reported amounts of assets, liabilities, income,expenses and changes in net assets during the reporting period. Actual results could differ from those estimates. The following is asummary of significant accounting policies followed by the Funds:
a. Valuation of investments
Investments held by the Funds have been categorized as held for trading and are stated at fair value. Investments at fair value onthe valuation date are determined as follows:‰ Securities listed upon a recognized public stock exchange are valued at their bid prices for long positions and at their ask
prices for the short positions.‰ Fixed income securities are valued at their bid quotations for long positions and at their ask quotations for short positions by
sources independent of BlackRock Canada.‰ Money market securities are valued using cost plus accrued interest, which approximates fair value.‰ Funds invested in other funds that are not listed on a public exchange are valued using the net asset value per unit of the
underlying fund.Investments in securities having no quoted market prices or where, in the opinion of BlackRock Canada, a market quotation for asecurity is inaccurate, unreliable or not readily available, will be priced at fair value using a valuation technique. Valuationtechniques may include valuation of similar instruments using arm’s length market transactions, discounted cash flow analysis, and/or models, as may be determined by BlackRock Canada from time to time.The Funds are required to calculate the net assets per unit for the purposes of the financial statements in accordance withCanadian GAAP, which may be different from the method by which net asset value per unit is calculated for the purpose ofpurchase and redemption of units of the Funds. Under Canadian GAAP, financial instruments that are quoted in active marketsshall be valued based on the bid price for long positions and the ask price for short positions, as compared to the net asset valueper unit method for unitholder transactions in which such securities would be valued using the closing price. As a result, the netassets per unit presented in the financial statements (the “Net Assets per unit”) may differ from the Net Asset Value per unit (the“Net Asset Value per unit”). The comparison between the Net Assets per unit and the Net Asset Value per unit as at December 31,2012 and December 31, 2011 is detailed in Note 11.
b. Cash and bank overdraft
Cash represents cash held by the Funds, and bank overdrafts are short-term borrowings. All are carried at fair value.
c. Other assets and liabilities
Cash, interest receivable, securities lending income receivable, dividends receivable, tax reclaim receivable, receivables from issueof units, receivable for investment sales, margin due from/to brokers, unrealized gain (loss) on forward currency contracts,operating expenses payable, payables for redemption of units, payables for investment purchases and payables for repurchaseagreements are recorded at cost in the financial statements. Due to their short-term duration, cost approximate fair value for theseassets and liabilities.
d. Investment transactions and income recognition
Investment transactions are accounted for on a trade date basis. Realized gains and losses and unrealized appreciation anddepreciation from investment transactions are calculated on an average cost basis. Interest income is recorded as revenue on anaccrual basis. Dividend income is recorded on the ex-dividend date. Distributions from underlying funds and income trusts arerecorded on the ex-dividend date.
e. Futures contracts
Certain Funds may invest in futures contracts for the purpose of acting as a substitute for other investments such as equities orbonds. A futures contract obligates the buyer to purchase an asset (or the seller to sell an asset), at a predetermined future dateand price. The futures contracts held by the Funds are standardized contracts and are traded on a recognized exchange. Onentering into such a contract, the Fund is required to maintain with the broker an amount of cash and/or cash equivalents equal tothe minimum initial margin requirements of the exchange on which the contract is traded. Pursuant to the contract, the Fund agreesto receive from, or pay to, the broker an amount of cash equal to the daily fluctuation in the value of the contracts held. Suchreceipts or payments are known as “variation margin” and recorded by the Fund as investment income (or loss) in the Statement ofOperations and in the Statements of Net Assets as margin due to or from brokers. Long futures contracts are valued at their bidprices and short futures contracts are valued at their ask prices as reported by the exchange on which they are traded.
321

Notes to Financial Statements December 31, 2012
f. Forward currency contracts
Certain Funds may enter into forward currency contracts to hedge or gain foreign currency exposure. A forward currency contract isan obligation to purchase or sell one currency against another currency, at a future date and price, which has been agreed on bytwo parties (the Fund and the counterparty). The contracts are traded over-the-counter and not on a recognized exchange. Theforward currency contracts are marked-to-market daily using the relevant exchange rates of the underlying currencies and anygains or losses are recorded for financial statement purposes as unrealized appreciation or depreciation until the contractsettlement date. When the contracts are closed or delivered on the settlement date, any gains or losses realized are included in thenet realized gains (losses) from forward currency contacts in the Statement of Operations.
g. Repurchase agreements
Certain Funds have financed the acquisition of some investments through the use of repurchase agreements. In a repurchaseagreement, the Fund delivers a financial instrument to a counterparty with an agreement to purchase the same financial instrumentback from the purchaser at an agreed upon price and date. Repurchase agreements are valued daily at par and the cost offinancing is accrued daily and posted as interest expense.
h. Translation of foreign currency
Foreign currency amounts are expressed in Canadian dollars as follows:(i) Fair market values of investments and other assets at the rate of exchange on each valuation date; and(ii) Purchase and sale of investments, investment income and expenses at the rate of exchange prevailing on the respective dates
of such transactions.(iii) Realized and unrealized foreign currency gains or losses on investments are included in the Statements of Operations in net
realized gain (loss) on sale of investments and net change in unrealized appreciation (depreciation) in value of investments,respectively. Realized and unrealized foreign currency gains or losses on monetary assets and liabilities other than investmentsdenominated in foreign currencies are included in the Statement of Operations in net realized and unrealized gain (loss) onforeign exchange transactions.
i. Securities lending income
The Funds may lend securities to investment dealers and banks on a collateralized basis. Income is recognized on an accrualbasis.
j. Real return bonds
The par and the cost base of the real return bonds are adjusted daily by an inflation adjustment. Interest income is accrued on eachvaluation date based on the inflation adjusted par at that time. The daily change in the inflation adjusted par is recognized asincome. At maturity, the bonds will pay their final coupon interest payment plus the cumulative inflation compensation accrued fromthe original issue date.
k. Total return swaps
Certain Funds may enter into total return swap contracts for the purpose of gaining exposure to, or managing exposure to indexmarkets. Total return swaps are contracts between parties where, for a fixed period of time, one party pays the total return of areference asset in exchange for a specific fixed or floating rate payment by the counterparty based on the notional principal valueequal to the cost of the reference asset. The periodic payments received or made by the Fund are reported on the Statements ofOperations as net realized gain (loss) on total return swaps. Swaps are marked-to-market daily and changes in value are recordedas unrealized gains (losses) in value of investments. Gains or losses realized upon early termination or settlement of the swapcontracts are recorded as net realized gain (loss) on total return swaps.
l. Short sales
Certain Funds engage in selling securities short. When a Fund sells a security short, an amount equal to the proceeds received isrecorded as a liability and is subsequently adjusted to the current market value of the securities sold short resulting in an unrealizedappreciation or depreciation on securities sold short. Upon closing the position, the differences between the proceeds originallyreceived and the cost of the securities purchased to close the short position are recognized as a net realized gain (loss) on sale ofinvestments. Dividends for securities sold short are paid to the broker and reflected as an expense on the Statements ofOperations.
m. Increase (decrease) in net assets from operations per unit
The increase (decrease) in net assets from operations per unit is based on the increase (decrease) in net assets from operations,divided by the weighted average number of units outstanding during the year.
322

Notes to Financial Statements December 31, 2012
n. Allocation of income and expenses amongst classes
Certain Funds are structured with more than one class. Expenses directly attributable to a class are charged to that class. Otherincome, expenses, gains and losses are allocated to each class proportionately based upon the relative net asset value of eachclass.
o. National Instrument 81-106 – Investment Fund Continuous Disclosure (“NI 81-106”)
Pursuant to NI 81-106, as mutual funds that are not reporting issuers, the Funds rely on Part 2.11 Filing Exemption for MutualFunds that are Non-Reporting Issuers of NI 81-106, for the exemption from filing the financial statements with the securitiesregulators.
p. Transaction costs
Transaction costs, such as commissions incurred in the purchase and sale of securities by the Fund are expensed and are includedin the Statements of Operations.
3. Taxation
The Funds qualify as unit trusts as defined in the Income Tax Act (Canada) (the “Act”) and accordingly, are not taxed on thatportion of taxable income that is paid to or allocated to unitholders.In accordance with the master declaration of trust, the Funds pay sufficient income and net capital gains in order to minimizeincome taxes. Accordingly, no provisions for income taxes have been made in the financial statements. Net income is paid tounitholders as specified in the Funds’ master declaration of trust. Net capital gains, when distributed, are paid to unitholders at leastannually and, typically, on the last valuation date of the year.
a. Suspended losses
All Funds are subject to suspended loss rules contained in subsections 40(3.3) and 40(3.4) of the Act. A loss on a disposition ofcapital property is considered a suspended loss when a Fund acquires a property that is the same or identical to the property sold(“substituted property”), within 30 days before and 30 days after the disposition and the Fund still owns the substituted property 30days after the original disposition. If a loss is suspended, the loss cannot be deducted against other capital gains. Instead it isdeferred until the substituted property is sold and is not acquired within 30 days before and after the sale.The suspended losses for the Funds as at December 31, 2012 are listed below:
Fund December 31, 2012
BlackRock Canadian Equity Index Fund $95,538,722BlackRock CDN MSCI Canada IMI Index Fund 11,861,187BlackRock CDN US Equity Index Non-Taxable Fund 443,461,102BlackRock CDN US Equity Index Plus Non-Taxable Fund 3,427,776BlackRock CDN US Equity Index Hedged Non-Taxable Fund 47,811,485BlackRock CDN US Equity Index Fund 74,965,443BlackRock CDN US Alpha Tilts Non-Taxable Fund 157,252,425BlackRock CDN US Alpha Tilts Hedged Non-Taxable Fund 15,541,407BlackRock CDN Russell 3000 Index Non-Taxable Fund 3,566,856BlackRock Active Canadian Equity Fund 96,976,348BlackRock Active Canadian Equity Ex-Income Trusts Fund 91,627,741BlackRock Active Canadian Equity DC Fund 24,969,148BlackRock Active Canadian Equity Small Cap Fund 9,506,884BlackRock Canada Alpha Advantage Fund 3,897,652BlackRock Canada Universe Bond Index Fund 10,134,214BlackRock Canada ex-BBB Universe Bond Index Fund 815,421BlackRock Canada Real Return Bond Index Fund 1,559,427BlackRock Canada Long Bond Index Fund 23,694,507BlackRock Canada Long Government Bond Index Fund 843,549BlackRock Canada All Government Bond Index Fund 215,415BlackRock Canada Credit-Screened Bond Index Fund 122,660BlackRock Canada CoreActive Universe Bond Fund 1,746,372BlackRock Canada CorePlus Long Bond Fund 323,146BlackRock Canada CorePlus Universe Bond Fund 33,896BlackRock Canada Levered Long Bond Index Fund 967
323

Notes to Financial Statements December 31, 2012
Fund December 31, 2012
BlackRock Balanced Moderate Index DC Fund $7,501,351BlackRock Balanced Conservative Index DC Fund 3,448,143BlackRock Balanced Aggressive Index DC Fund 1,203,736BlackRock CDN LifePath Retirement Index Fund I 723,325BlackRock CDN LifePath Index 2010 Retirement Fund 3,226,421BlackRock CDN LifePath 2015 Index Fund 1,492,181BlackRock CDN LifePath 2020 Index Fund 10,723,073BlackRock CDN LifePath 2025 Index Fund 1,334,914BlackRock CDN LifePath 2030 Index Fund 8,573,176BlackRock CDN LifePath 2035 Index Fund 838,180BlackRock CDN LifePath 2040 Index Fund 5,598,424BlackRock CDN LifePath 2045 Index Fund 143,351BlackRock Balanced Active Fund 2,405,005BlackRock CDN Global Market Selection Fund 94,077BlackRock CDN MSCI EAFE Equity Index Fund 262,966,757BlackRock CDN MSCI EAFE Index Hedged Fund 19,498,361BlackRock CDN MSCI ACWI ex-Canada Index Fund 29,068,876BlackRock CDN MSCI Emerging Markets Index Fund 411,118BlackRock CDN MSCI EAFE Index Plus Fund 8,085,427BlackRock CDN Global Equity Focus Fund 84,299BlackRock CDN Global Developed Real Estate Index Fund 46,867BlackRock CDN Global Infrastructure Equity Index Fund 101,019BlackRock CDN Emerging Markets Fundamental Index Fund 50,075
b. Capital loss carry-forwards
The capital losses for income tax purposes may be carried forward indefinitely and applied against future capital gains. Thefollowing Funds had capital loss carry-forwards as at December 31, 2012:
Fund December 31, 2012
BlackRock Canadian Equity Index Fund $6,498,408BlackRock Canadian Equity Ex-Trusts Index Fund 7,212,354BlackRock CDN US Equity Index Non-Taxable Fund 1,012,635,016BlackRock CDN US Equity Index Hedged Non-Taxable Fund 34,550,263BlackRock CDN US Equity Index Fund 60,506,225BlackRock CDN US Alpha Tilts Non-Taxable Fund 372,244,788BlackRock CDN US Alpha Tilts Hedged Non-Taxable Fund 96,122,057BlackRock Canada Long Government Bond Index Fund 824,237BlackRock Canada CoreActive Universe Bond Fund 17,908,548BlackRock Canada CorePlus Universe Bond Fund 281,777BlackRock Balanced Moderate Index DC Fund 38,664,644BlackRock Balanced Aggressive Index DC Fund 10,043,831BlackRock Balanced Active Fund 3,208,343BlackRock CDN Short Term Index Fund 3,664BlackRock CDN MSCI EAFE Equity Index Fund 74,921,448BlackRock CDN MSCI EAFE Index Hedged Fund 41,535,629BlackRock CDN MSCI ACWI ex-Canada Index Fund 64,853,070BlackRock CDN MSCI Emerging Markets Index Fund 10,226,941BlackRock CDN MSCI EAFE Index Plus Fund 753,701
324
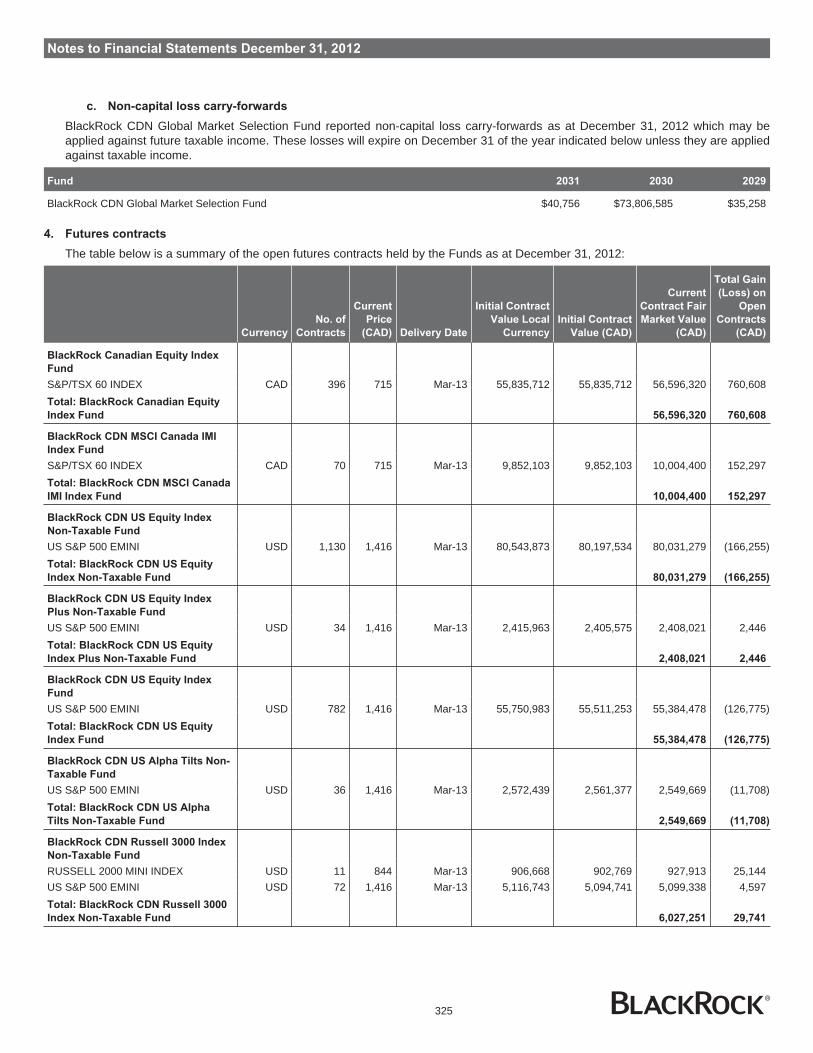
Notes to Financial Statements December 31, 2012
c. Non-capital loss carry-forwards
BlackRock CDN Global Market Selection Fund reported non-capital loss carry-forwards as at December 31, 2012 which may beapplied against future taxable income. These losses will expire on December 31 of the year indicated below unless they are appliedagainst taxable income.
Fund 2031 2030 2029
BlackRock CDN Global Market Selection Fund $40,756 $73,806,585 $35,258
4. Futures contracts
The table below is a summary of the open futures contracts held by the Funds as at December 31, 2012:
Currency
No. of
Contracts
Current
Price
(CAD) Delivery Date
Initial Contract
Value Local
Currency
Initial Contract
Value (CAD)
Current
Contract Fair
Market Value
(CAD)
Total Gain
(Loss) on
Open
Contracts
(CAD)
BlackRock Canadian Equity Index
Fund
S&P/TSX 60 INDEX CAD 396 715 Mar-13 55,835,712 55,835,712 56,596,320 760,608Total: BlackRock Canadian Equity
Index Fund 56,596,320 760,608
BlackRock CDN MSCI Canada IMI
Index Fund
S&P/TSX 60 INDEX CAD 70 715 Mar-13 9,852,103 9,852,103 10,004,400 152,297Total: BlackRock CDN MSCI Canada
IMI Index Fund 10,004,400 152,297
BlackRock CDN US Equity Index
Non-Taxable Fund
US S&P 500 EMINI USD 1,130 1,416 Mar-13 80,543,873 80,197,534 80,031,279 (166,255)Total: BlackRock CDN US Equity
Index Non-Taxable Fund 80,031,279 (166,255)
BlackRock CDN US Equity Index
Plus Non-Taxable Fund
US S&P 500 EMINI USD 34 1,416 Mar-13 2,415,963 2,405,575 2,408,021 2,446Total: BlackRock CDN US Equity
Index Plus Non-Taxable Fund 2,408,021 2,446
BlackRock CDN US Equity Index
Fund
US S&P 500 EMINI USD 782 1,416 Mar-13 55,750,983 55,511,253 55,384,478 (126,775)Total: BlackRock CDN US Equity
Index Fund 55,384,478 (126,775)
BlackRock CDN US Alpha Tilts Non-
Taxable Fund
US S&P 500 EMINI USD 36 1,416 Mar-13 2,572,439 2,561,377 2,549,669 (11,708)Total: BlackRock CDN US Alpha
Tilts Non-Taxable Fund 2,549,669 (11,708)
BlackRock CDN Russell 3000 Index
Non-Taxable Fund
RUSSELL 2000 MINI INDEX USD 11 844 Mar-13 906,668 902,769 927,913 25,144US S&P 500 EMINI USD 72 1,416 Mar-13 5,116,743 5,094,741 5,099,338 4,597Total: BlackRock CDN Russell 3000
Index Non-Taxable Fund 6,027,251 29,741
325
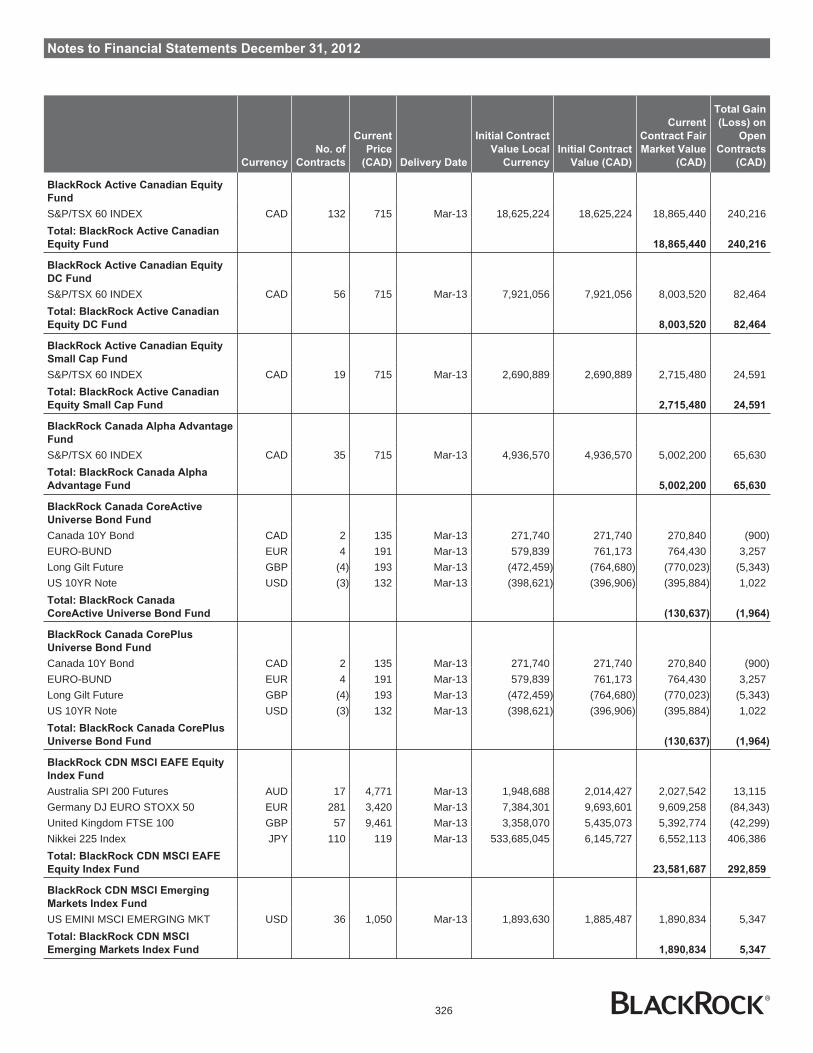
Notes to Financial Statements December 31, 2012
Currency
No. of
Contracts
Current
Price
(CAD) Delivery Date
Initial Contract
Value Local
Currency
Initial Contract
Value (CAD)
Current
Contract Fair
Market Value
(CAD)
Total Gain
(Loss) on
Open
Contracts
(CAD)
BlackRock Active Canadian Equity
Fund
S&P/TSX 60 INDEX CAD 132 715 Mar-13 18,625,224 18,625,224 18,865,440 240,216Total: BlackRock Active Canadian
Equity Fund 18,865,440 240,216
BlackRock Active Canadian Equity
DC Fund
S&P/TSX 60 INDEX CAD 56 715 Mar-13 7,921,056 7,921,056 8,003,520 82,464Total: BlackRock Active Canadian
Equity DC Fund 8,003,520 82,464
BlackRock Active Canadian Equity
Small Cap Fund
S&P/TSX 60 INDEX CAD 19 715 Mar-13 2,690,889 2,690,889 2,715,480 24,591Total: BlackRock Active Canadian
Equity Small Cap Fund 2,715,480 24,591
BlackRock Canada Alpha Advantage
Fund
S&P/TSX 60 INDEX CAD 35 715 Mar-13 4,936,570 4,936,570 5,002,200 65,630Total: BlackRock Canada Alpha
Advantage Fund 5,002,200 65,630
BlackRock Canada CoreActive
Universe Bond Fund
Canada 10Y Bond CAD 2 135 Mar-13 271,740 271,740 270,840 (900)EURO-BUND EUR 4 191 Mar-13 579,839 761,173 764,430 3,257Long Gilt Future GBP (4) 193 Mar-13 (472,459) (764,680) (770,023) (5,343)US 10YR Note USD (3) 132 Mar-13 (398,621) (396,906) (395,884) 1,022Total: BlackRock Canada
CoreActive Universe Bond Fund (130,637) (1,964)
BlackRock Canada CorePlus
Universe Bond Fund
Canada 10Y Bond CAD 2 135 Mar-13 271,740 271,740 270,840 (900)EURO-BUND EUR 4 191 Mar-13 579,839 761,173 764,430 3,257Long Gilt Future GBP (4) 193 Mar-13 (472,459) (764,680) (770,023) (5,343)US 10YR Note USD (3) 132 Mar-13 (398,621) (396,906) (395,884) 1,022Total: BlackRock Canada CorePlus
Universe Bond Fund (130,637) (1,964)
BlackRock CDN MSCI EAFE Equity
Index Fund
Australia SPI 200 Futures AUD 17 4,771 Mar-13 1,948,688 2,014,427 2,027,542 13,115Germany DJ EURO STOXX 50 EUR 281 3,420 Mar-13 7,384,301 9,693,601 9,609,258 (84,343)United Kingdom FTSE 100 GBP 57 9,461 Mar-13 3,358,070 5,435,073 5,392,774 (42,299)Nikkei 225 Index JPY 110 119 Mar-13 533,685,045 6,145,727 6,552,113 406,386Total: BlackRock CDN MSCI EAFE
Equity Index Fund 23,581,687 292,859
BlackRock CDN MSCI Emerging
Markets Index Fund
US EMINI MSCI EMERGING MKT USD 36 1,050 Mar-13 1,893,630 1,885,487 1,890,834 5,347Total: BlackRock CDN MSCI
Emerging Markets Index Fund 1,890,834 5,347
326
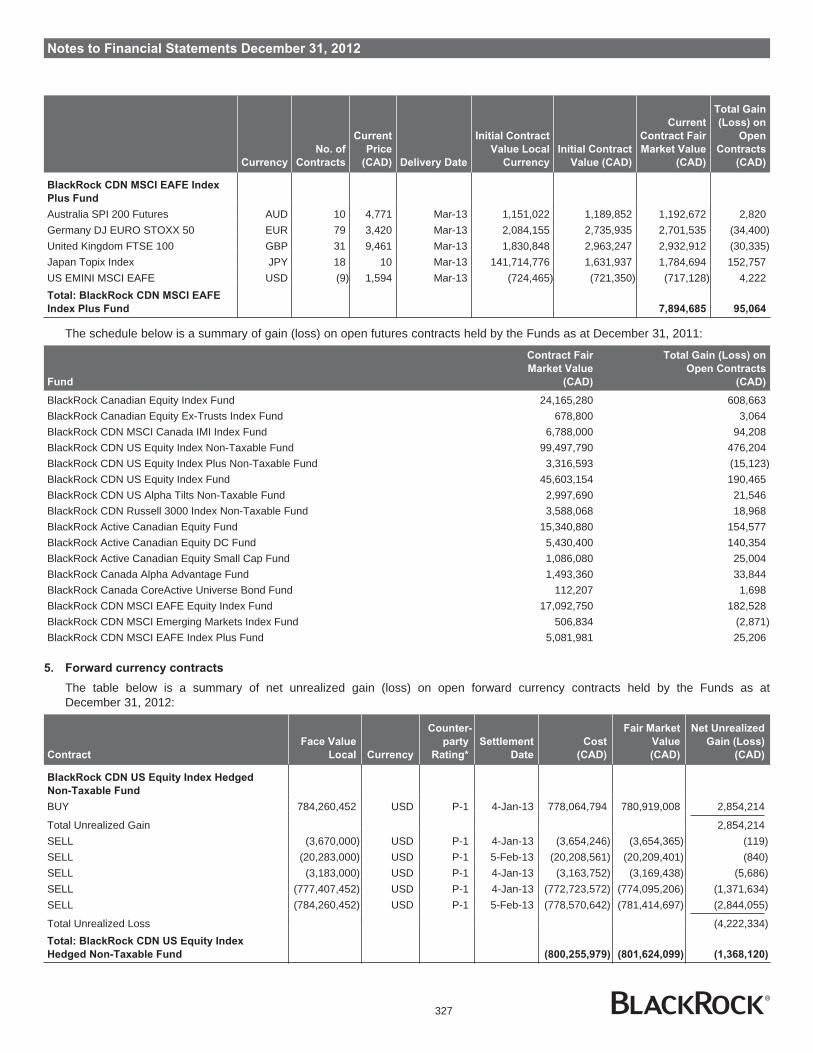
Notes to Financial Statements December 31, 2012
Currency
No. of
Contracts
Current
Price
(CAD) Delivery Date
Initial Contract
Value Local
Currency
Initial Contract
Value (CAD)
Current
Contract Fair
Market Value
(CAD)
Total Gain
(Loss) on
Open
Contracts
(CAD)
BlackRock CDN MSCI EAFE Index
Plus Fund
Australia SPI 200 Futures AUD 10 4,771 Mar-13 1,151,022 1,189,852 1,192,672 2,820Germany DJ EURO STOXX 50 EUR 79 3,420 Mar-13 2,084,155 2,735,935 2,701,535 (34,400)United Kingdom FTSE 100 GBP 31 9,461 Mar-13 1,830,848 2,963,247 2,932,912 (30,335)Japan Topix Index JPY 18 10 Mar-13 141,714,776 1,631,937 1,784,694 152,757US EMINI MSCI EAFE USD (9) 1,594 Mar-13 (724,465) (721,350) (717,128) 4,222Total: BlackRock CDN MSCI EAFE
Index Plus Fund 7,894,685 95,064
The schedule below is a summary of gain (loss) on open futures contracts held by the Funds as at December 31, 2011:
Fund
Contract Fair
Market Value
(CAD)
Total Gain (Loss) on
Open Contracts
(CAD)
BlackRock Canadian Equity Index Fund 24,165,280 608,663BlackRock Canadian Equity Ex-Trusts Index Fund 678,800 3,064BlackRock CDN MSCI Canada IMI Index Fund 6,788,000 94,208BlackRock CDN US Equity Index Non-Taxable Fund 99,497,790 476,204BlackRock CDN US Equity Index Plus Non-Taxable Fund 3,316,593 (15,123)BlackRock CDN US Equity Index Fund 45,603,154 190,465BlackRock CDN US Alpha Tilts Non-Taxable Fund 2,997,690 21,546BlackRock CDN Russell 3000 Index Non-Taxable Fund 3,588,068 18,968BlackRock Active Canadian Equity Fund 15,340,880 154,577BlackRock Active Canadian Equity DC Fund 5,430,400 140,354BlackRock Active Canadian Equity Small Cap Fund 1,086,080 25,004BlackRock Canada Alpha Advantage Fund 1,493,360 33,844BlackRock Canada CoreActive Universe Bond Fund 112,207 1,698BlackRock CDN MSCI EAFE Equity Index Fund 17,092,750 182,528BlackRock CDN MSCI Emerging Markets Index Fund 506,834 (2,871)BlackRock CDN MSCI EAFE Index Plus Fund 5,081,981 25,206
5. Forward currency contracts
The table below is a summary of net unrealized gain (loss) on open forward currency contracts held by the Funds as atDecember 31, 2012:
Contract
Face Value
Local Currency
Counter-
party
Rating*
Settlement
Date
Cost
(CAD)
Fair Market
Value
(CAD)
Net Unrealized
Gain (Loss)
(CAD)
BlackRock CDN US Equity Index Hedged
Non-Taxable Fund
BUY 784,260,452 USD P-1 4-Jan-13 778,064,794 780,919,008 2,854,214
Total Unrealized Gain 2,854,214SELL (3,670,000) USD P-1 4-Jan-13 (3,654,246) (3,654,365) (119)SELL (20,283,000) USD P-1 5-Feb-13 (20,208,561) (20,209,401) (840)SELL (3,183,000) USD P-1 4-Jan-13 (3,163,752) (3,169,438) (5,686)SELL (777,407,452) USD P-1 4-Jan-13 (772,723,572) (774,095,206) (1,371,634)SELL (784,260,452) USD P-1 5-Feb-13 (778,570,642) (781,414,697) (2,844,055)
Total Unrealized Loss (4,222,334)Total: BlackRock CDN US Equity Index
Hedged Non-Taxable Fund (800,255,979) (801,624,099) (1,368,120)
327
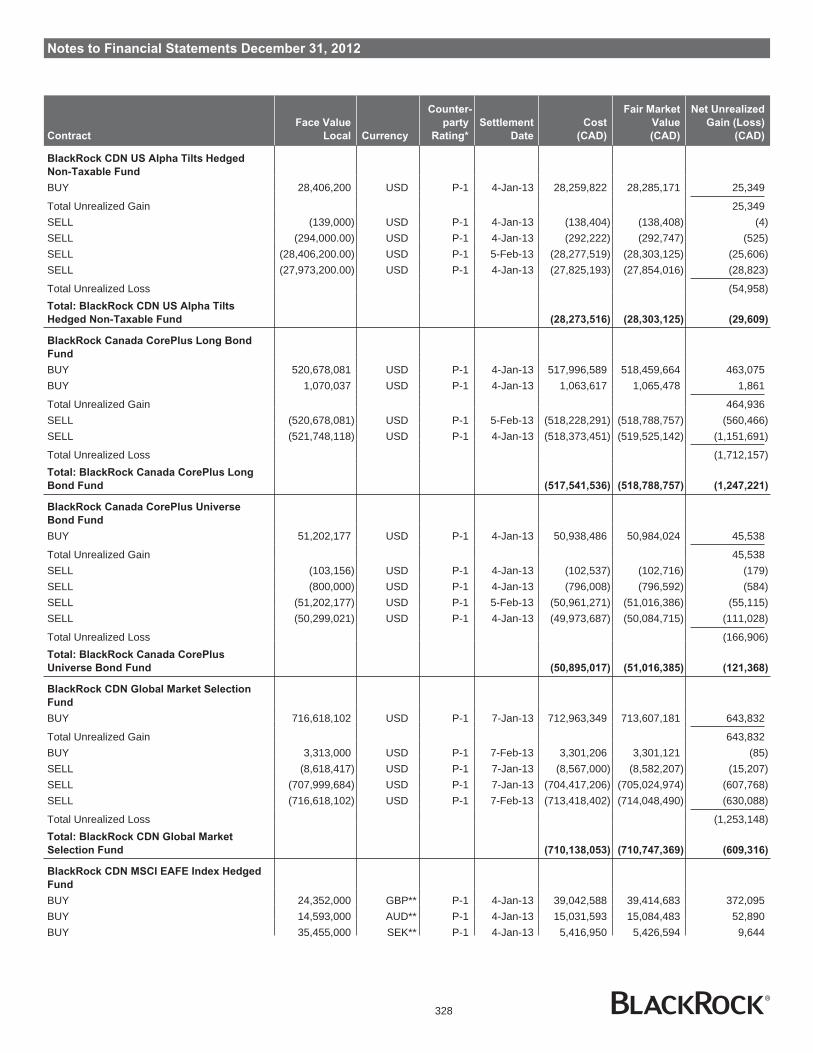
Notes to Financial Statements December 31, 2012
Contract
Face Value
Local Currency
Counter-
party
Rating*
Settlement
Date
Cost
(CAD)
Fair Market
Value
(CAD)
Net Unrealized
Gain (Loss)
(CAD)
BlackRock CDN US Alpha Tilts Hedged
Non-Taxable Fund
BUY 28,406,200 USD P-1 4-Jan-13 28,259,822 28,285,171 25,349
Total Unrealized Gain 25,349SELL (139,000) USD P-1 4-Jan-13 (138,404) (138,408) (4)SELL (294,000.00) USD P-1 4-Jan-13 (292,222) (292,747) (525)SELL (28,406,200.00) USD P-1 5-Feb-13 (28,277,519) (28,303,125) (25,606)SELL (27,973,200.00) USD P-1 4-Jan-13 (27,825,193) (27,854,016) (28,823)
Total Unrealized Loss (54,958)Total: BlackRock CDN US Alpha Tilts
Hedged Non-Taxable Fund (28,273,516) (28,303,125) (29,609)
BlackRock Canada CorePlus Long Bond
Fund
BUY 520,678,081 USD P-1 4-Jan-13 517,996,589 518,459,664 463,075BUY 1,070,037 USD P-1 4-Jan-13 1,063,617 1,065,478 1,861
Total Unrealized Gain 464,936SELL (520,678,081) USD P-1 5-Feb-13 (518,228,291) (518,788,757) (560,466)SELL (521,748,118) USD P-1 4-Jan-13 (518,373,451) (519,525,142) (1,151,691)
Total Unrealized Loss (1,712,157)Total: BlackRock Canada CorePlus Long
Bond Fund (517,541,536) (518,788,757) (1,247,221)
BlackRock Canada CorePlus Universe
Bond Fund
BUY 51,202,177 USD P-1 4-Jan-13 50,938,486 50,984,024 45,538
Total Unrealized Gain 45,538SELL (103,156) USD P-1 4-Jan-13 (102,537) (102,716) (179)SELL (800,000) USD P-1 4-Jan-13 (796,008) (796,592) (584)SELL (51,202,177) USD P-1 5-Feb-13 (50,961,271) (51,016,386) (55,115)SELL (50,299,021) USD P-1 4-Jan-13 (49,973,687) (50,084,715) (111,028)
Total Unrealized Loss (166,906)Total: BlackRock Canada CorePlus
Universe Bond Fund (50,895,017) (51,016,385) (121,368)
BlackRock CDN Global Market Selection
Fund
BUY 716,618,102 USD P-1 7-Jan-13 712,963,349 713,607,181 643,832
Total Unrealized Gain 643,832BUY 3,313,000 USD P-1 7-Feb-13 3,301,206 3,301,121 (85)SELL (8,618,417) USD P-1 7-Jan-13 (8,567,000) (8,582,207) (15,207)SELL (707,999,684) USD P-1 7-Jan-13 (704,417,206) (705,024,974) (607,768)SELL (716,618,102) USD P-1 7-Feb-13 (713,418,402) (714,048,490) (630,088)
Total Unrealized Loss (1,253,148)Total: BlackRock CDN Global Market
Selection Fund (710,138,053) (710,747,369) (609,316)
BlackRock CDN MSCI EAFE Index Hedged
Fund
BUY 24,352,000 GBP** P-1 4-Jan-13 39,042,588 39,414,683 372,095BUY 14,593,000 AUD** P-1 4-Jan-13 15,031,593 15,084,483 52,890BUY 35,455,000 SEK** P-1 4-Jan-13 5,416,950 5,426,594 9,644
328

Notes to Financial Statements December 31, 2012
Contract
Face Value
Local Currency
Counter-
party
Rating*
Settlement
Date
Cost
(CAD)
Fair Market
Value
(CAD)
Net Unrealized
Gain (Loss)
(CAD)
BUY 9,101,000 NOK** P-1 4-Jan-13 1,619,294 1,628,269 8,975BUY 3,798,000 SGD** P-2 4-Jan-13 3,089,475 3,095,979 6,504BUY 42,573,000 HKD** P-1 4-Jan-13 5,465,785 5,469,205 3,420BUY 262,000 NZD** P-1 4-Jan-13 212,971 215,220 2,249BUY 414,000 EUR** P-2 5-Feb-13 543,029 543,991 962BUY 129,000 GBP** P-2 5-Feb-13 208,105 208,910 805BUY 52,000 ILS** P-1 4-Jan-13 13,543 13,877 334BUY 85,000 CHF** P-2 5-Feb-13 92,401 92,584 183BUY 3,900,000 ILS** P-1 4-Jan-13 1,040,666 1,040,758 92BUY 64,000 USD P-1 4-Jan-13 63,670 63,727 57BUY 189,000 SEK** P-2 5-Feb-13 28,877 28,925 48BUY 82,000 NOK** P-2 5-Feb-13 14,638 14,663 25BUY 32,000 DKK** P-2 5-Feb-13 5,628 5,637 9BUY 1,000 NZD** P-2 4-Jan-13 814 821 7BUY 1,000 USD P-1 4-Jan-13 995 996 1SELL (2,264,804,000) JPY** P-1 4-Jan-13 (27,431,886) (26,080,672) 1,351,214SELL (2,747,610,000) JPY** P-1 5-Feb-13 (31,954,527) (31,667,318) 287,209SELL (458,743,000) JPY** P-1 4-Jan-13 (5,531,236) (5,282,720) 248,516SELL (37,726,000) EUR** P-1 5-Feb-13 (49,675,069) (49,571,464) 103,605SELL (12,812,000) AUD** P-2 4-Jan-13 (13,287,313) (13,243,500) 43,813SELL (24,063,000) JPY** P-1 4-Jan-13 (290,374) (277,101) 13,273SELL (14,001,000) CHF** P-2 5-Feb-13 (15,262,491) (15,250,235) 12,256SELL (505,000) ILS** P-1 4-Jan-13 (142,777) (134,765) 8,012SELL (11,394,000) DKK** P-1 5-Feb-13 (2,008,726) (2,007,054) 1,672SELL (1,694,000) AUD** P-1 4-Jan-13 (1,752,353) (1,751,053) 1,300SELL (553,846,000) JPY** P-1 5-Feb-13 (6,383,494) (6,383,300) 194SELL (87,000) AUD** P-1 4-Jan-13 (89,971) (89,930) 41SELL (2,000) NZD** P-2 5-Feb-13 (1,643) (1,641) 2SELL (3,000) ILS** P-1 5-Feb-13 (800) (800) -
Total Unrealized Gain 2,529,407BUY 11,394,000 DKK** P-1 4-Jan-13 2,006,403 2,004,806 (1,597)BUY 14,001,000 CHF** P-2 4-Jan-13 15,243,232 15,230,017 (13,215)BUY 37,726,000 EUR** P-1 4-Jan-13 49,628,553 49,525,527 (103,026)BUY 2,747,610,000 JPY** P-1 4-Jan-13 31,926,605 31,640,494 (286,111)SELL (7,971) USD P-1 5-Feb-13 (7,971) (7,971) -SELL (30,000) NZD** P-1 5-Feb-13 (24,608) (24,609) (1)SELL (1,000) ILS** P-1 5-Feb-13 (265) (267) (2)SELL (1,000) USD P-2 5-Feb-13 (993) (996) (3)SELL (862,000) NOK** P-1 5-Feb-13 (154,133) (154,143) (10)SELL (44,000) HKD** P-1 5-Feb-13 (5,643) (5,657) (14)SELL (1,207,000) DKK** P-1 5-Feb-13 (212,593) (212,613) (20)SELL (505,000) SGD** P-1 5-Feb-13 (411,882) (411,902) (20)SELL (4,227,000) HKD** P-1 5-Feb-13 (543,437) (543,458) (21)SELL (43,000) SGD** P-2 4-Jan-13 (35,023) (35,052) (29)SELL (4,187,000) SEK** P-1 5-Feb-13 (640,753) (640,783) (30)SELL (13,000) SGD** P-2 5-Feb-13 (10,572) (10,603) (31)SELL (279,000) HKD** P-1 4-Jan-13 (35,809) (35,842) (33)SELL (64,000) USD P-1 5-Feb-13 (63,710) (63,768) (58)SELL (86,000) AUD** P-2 5-Feb-13 (88,677) (88,743) (66)SELL (1,969,000) AUD** P-1 5-Feb-13 (2,031,733) (2,031,801) (68)
329
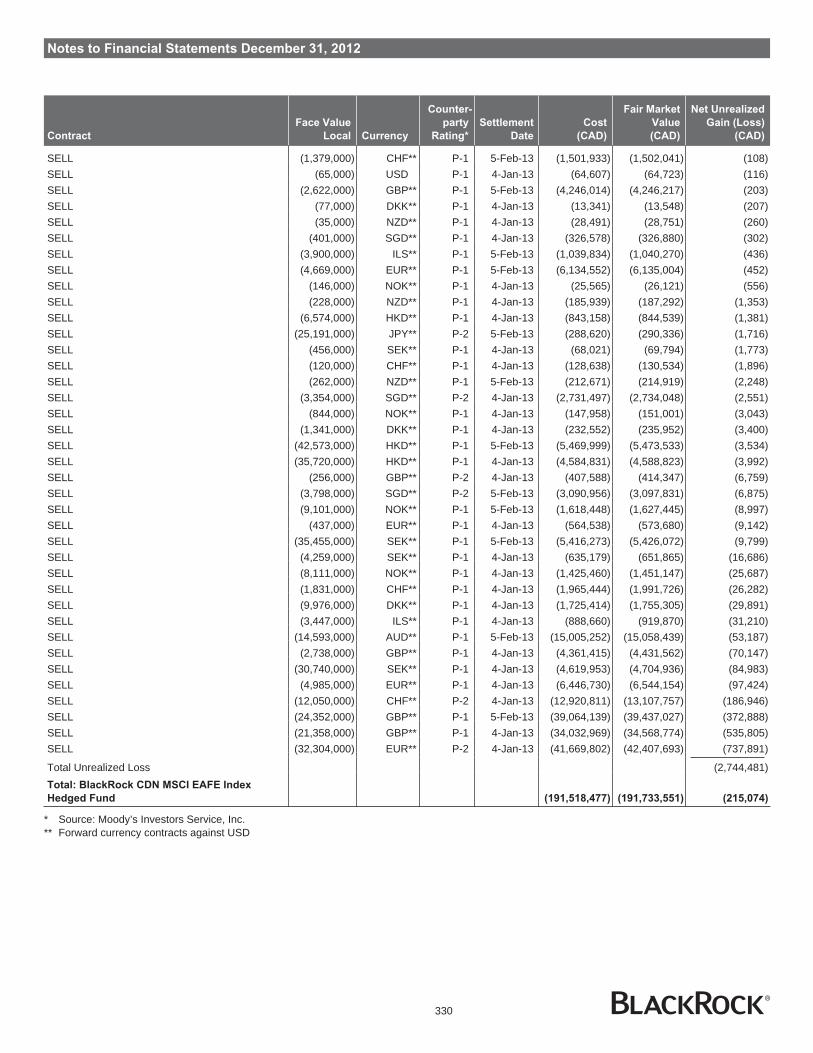
Notes to Financial Statements December 31, 2012
Contract
Face Value
Local Currency
Counter-
party
Rating*
Settlement
Date
Cost
(CAD)
Fair Market
Value
(CAD)
Net Unrealized
Gain (Loss)
(CAD)
SELL (1,379,000) CHF** P-1 5-Feb-13 (1,501,933) (1,502,041) (108)SELL (65,000) USD P-1 4-Jan-13 (64,607) (64,723) (116)SELL (2,622,000) GBP** P-1 5-Feb-13 (4,246,014) (4,246,217) (203)SELL (77,000) DKK** P-1 4-Jan-13 (13,341) (13,548) (207)SELL (35,000) NZD** P-1 4-Jan-13 (28,491) (28,751) (260)SELL (401,000) SGD** P-1 4-Jan-13 (326,578) (326,880) (302)SELL (3,900,000) ILS** P-1 5-Feb-13 (1,039,834) (1,040,270) (436)SELL (4,669,000) EUR** P-1 5-Feb-13 (6,134,552) (6,135,004) (452)SELL (146,000) NOK** P-1 4-Jan-13 (25,565) (26,121) (556)SELL (228,000) NZD** P-1 4-Jan-13 (185,939) (187,292) (1,353)SELL (6,574,000) HKD** P-1 4-Jan-13 (843,158) (844,539) (1,381)SELL (25,191,000) JPY** P-2 5-Feb-13 (288,620) (290,336) (1,716)SELL (456,000) SEK** P-1 4-Jan-13 (68,021) (69,794) (1,773)SELL (120,000) CHF** P-1 4-Jan-13 (128,638) (130,534) (1,896)SELL (262,000) NZD** P-1 5-Feb-13 (212,671) (214,919) (2,248)SELL (3,354,000) SGD** P-2 4-Jan-13 (2,731,497) (2,734,048) (2,551)SELL (844,000) NOK** P-1 4-Jan-13 (147,958) (151,001) (3,043)SELL (1,341,000) DKK** P-1 4-Jan-13 (232,552) (235,952) (3,400)SELL (42,573,000) HKD** P-1 5-Feb-13 (5,469,999) (5,473,533) (3,534)SELL (35,720,000) HKD** P-1 4-Jan-13 (4,584,831) (4,588,823) (3,992)SELL (256,000) GBP** P-2 4-Jan-13 (407,588) (414,347) (6,759)SELL (3,798,000) SGD** P-2 5-Feb-13 (3,090,956) (3,097,831) (6,875)SELL (9,101,000) NOK** P-1 5-Feb-13 (1,618,448) (1,627,445) (8,997)SELL (437,000) EUR** P-1 4-Jan-13 (564,538) (573,680) (9,142)SELL (35,455,000) SEK** P-1 5-Feb-13 (5,416,273) (5,426,072) (9,799)SELL (4,259,000) SEK** P-1 4-Jan-13 (635,179) (651,865) (16,686)SELL (8,111,000) NOK** P-1 4-Jan-13 (1,425,460) (1,451,147) (25,687)SELL (1,831,000) CHF** P-1 4-Jan-13 (1,965,444) (1,991,726) (26,282)SELL (9,976,000) DKK** P-1 4-Jan-13 (1,725,414) (1,755,305) (29,891)SELL (3,447,000) ILS** P-1 4-Jan-13 (888,660) (919,870) (31,210)SELL (14,593,000) AUD** P-1 5-Feb-13 (15,005,252) (15,058,439) (53,187)SELL (2,738,000) GBP** P-1 4-Jan-13 (4,361,415) (4,431,562) (70,147)SELL (30,740,000) SEK** P-1 4-Jan-13 (4,619,953) (4,704,936) (84,983)SELL (4,985,000) EUR** P-1 4-Jan-13 (6,446,730) (6,544,154) (97,424)SELL (12,050,000) CHF** P-2 4-Jan-13 (12,920,811) (13,107,757) (186,946)SELL (24,352,000) GBP** P-1 5-Feb-13 (39,064,139) (39,437,027) (372,888)SELL (21,358,000) GBP** P-1 4-Jan-13 (34,032,969) (34,568,774) (535,805)SELL (32,304,000) EUR** P-2 4-Jan-13 (41,669,802) (42,407,693) (737,891)
Total Unrealized Loss (2,744,481)Total: BlackRock CDN MSCI EAFE Index
Hedged Fund (191,518,477) (191,733,551) (215,074)
* Source: Moody’s Investors Service, Inc.** Forward currency contracts against USD
330
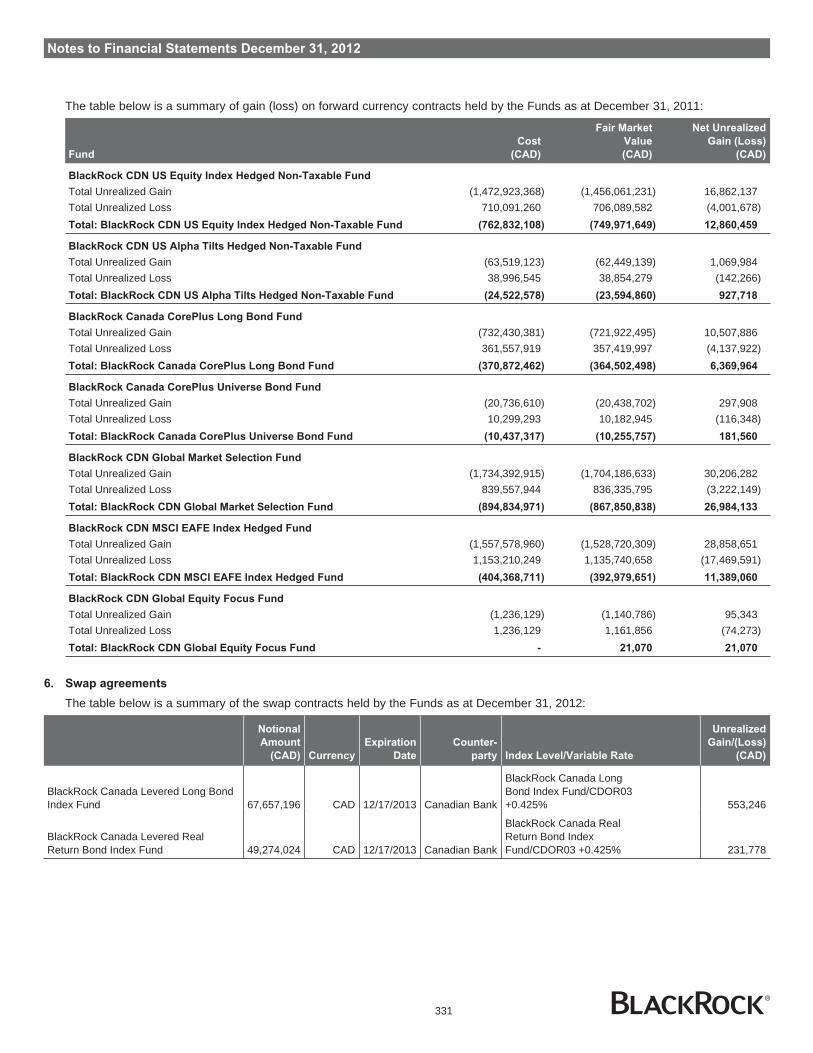
Notes to Financial Statements December 31, 2012
The table below is a summary of gain (loss) on forward currency contracts held by the Funds as at December 31, 2011:
Fund
Cost
(CAD)
Fair Market
Value
(CAD)
Net Unrealized
Gain (Loss)
(CAD)
BlackRock CDN US Equity Index Hedged Non-Taxable Fund
Total Unrealized Gain (1,472,923,368) (1,456,061,231) 16,862,137Total Unrealized Loss 710,091,260 706,089,582 (4,001,678)Total: BlackRock CDN US Equity Index Hedged Non-Taxable Fund (762,832,108) (749,971,649) 12,860,459
BlackRock CDN US Alpha Tilts Hedged Non-Taxable Fund
Total Unrealized Gain (63,519,123) (62,449,139) 1,069,984Total Unrealized Loss 38,996,545 38,854,279 (142,266)Total: BlackRock CDN US Alpha Tilts Hedged Non-Taxable Fund (24,522,578) (23,594,860) 927,718
BlackRock Canada CorePlus Long Bond Fund
Total Unrealized Gain (732,430,381) (721,922,495) 10,507,886Total Unrealized Loss 361,557,919 357,419,997 (4,137,922)Total: BlackRock Canada CorePlus Long Bond Fund (370,872,462) (364,502,498) 6,369,964
BlackRock Canada CorePlus Universe Bond Fund
Total Unrealized Gain (20,736,610) (20,438,702) 297,908Total Unrealized Loss 10,299,293 10,182,945 (116,348)Total: BlackRock Canada CorePlus Universe Bond Fund (10,437,317) (10,255,757) 181,560
BlackRock CDN Global Market Selection Fund
Total Unrealized Gain (1,734,392,915) (1,704,186,633) 30,206,282Total Unrealized Loss 839,557,944 836,335,795 (3,222,149)Total: BlackRock CDN Global Market Selection Fund (894,834,971) (867,850,838) 26,984,133
BlackRock CDN MSCI EAFE Index Hedged Fund
Total Unrealized Gain (1,557,578,960) (1,528,720,309) 28,858,651Total Unrealized Loss 1,153,210,249 1,135,740,658 (17,469,591)Total: BlackRock CDN MSCI EAFE Index Hedged Fund (404,368,711) (392,979,651) 11,389,060
BlackRock CDN Global Equity Focus Fund
Total Unrealized Gain (1,236,129) (1,140,786) 95,343Total Unrealized Loss 1,236,129 1,161,856 (74,273)Total: BlackRock CDN Global Equity Focus Fund - 21,070 21,070
6. Swap agreements
The table below is a summary of the swap contracts held by the Funds as at December 31, 2012:
Notional
Amount
(CAD) Currency
Expiration
Date
Counter-
party Index Level/Variable Rate
Unrealized
Gain/(Loss)
(CAD)
BlackRock Canada Levered Long BondIndex Fund 67,657,196 CAD 12/17/2013 Canadian Bank
BlackRock Canada LongBond Index Fund/CDOR03+0.425% 553,246
BlackRock Canada Levered RealReturn Bond Index Fund 49,274,024 CAD 12/17/2013 Canadian Bank
BlackRock Canada RealReturn Bond IndexFund/CDOR03 +0.425% 231,778
331

Notes to Financial Statements December 31, 2012
The table below is a summary of the swap contracts held by the Funds as at December 31, 2011:
Notional
Amount
(CAD) Currency
Expiration
Date
Counter-
party Index Level/Variable Rate
Unrealized
Gain/(Loss)
(CAD)
BlackRock Canada Levered Long BondIndex Fund 46,219,651 CAD 12/20/2012 Canadian Bank
BlackRock Canada LongBond Index Fund/CDOR03+0.425% 2,257,978
BlackRock Canada Levered RealReturn Bond Index Fund 46,216,764 CAD 12/20/2012 Canadian Bank
BlackRock Canada RealReturn Bond IndexFund/CDOR03 +0.425% 3,517,931
The swap agreements are subject to termination if the leverage ratio exceeds a certain limit.
7. Repurchase agreements
The table below is a summary of the repurchase agreements held by the Funds as at December 31, 2012:
BlackRock Canada CorePlus Long Bond Fund
Security Sold Trade Date Currency
Expiration
Date
Counter-
party
Amount
of Cash
Received
(CAD)
Repurchase
Price
(CAD)
Fair Value of
Securities Sold
At December 31, 2012
(CAD)
Province of British Columbia 6.35%, June 2031 1-Nov-12 CAD Open SCC 5,441,250 145.10 5,358,277Province of British Columbia 4.3%, June 2042 1-Nov-12 CAD Open SCC 12,234,900 119.95 12,095,159Province of Quebec 5.35%, June 2025 1-Nov-12 CAD Open SCC 2,471,000 123.55 2,432,491Province of Quebec 5.75%, December 2036 1-Nov-12 CAD Open SCC 14,332,500 136.50 14,137,147Province of Ontario 4.65%, June 2041 1-Nov-12 CAD Open SCC 35,239,050 124.30 34,736,890Province of Ontario 6.5%, March 2029 6-Nov-12 CAD Open CWM 20,590,000 142.00 20,440,562Province of Ontario 6.2%, June 2031 15-Nov-12 CAD 11-Jan-13 CWM 9,252,750 142.35 9,037,352Government of Canada 8%, June 2027 30-Nov-12 CAD Open TD 16,507,562 178.75 15,962,676Province of Ontario 8.1%, September 2023 30-Nov-12 CAD Open TD 9,876,240 149.64 9,722,267Province of Quebec 6.25%, June 2032 30-Nov-12 CAD Open TD 15,847,200 142.00 15,467,156Province of Quebec 5%, December 2038 30-Nov-12 CAD Open TD 16,617,655 126.37 16,274,808Hydro Quebec 5%, February 2050 4-Dec-12 CAD Open SCC 9,683,450 132.65 9,589,880Province of Ontario 8.5%, December 2025 4-Dec-12 CAD Open CWM 6,300,000 157.50 6,289,536Province of Ontario 2.85%, June 2023 6-Dec-12 CAD 11-Jan-13 CWM 7,017,500 100.25 6,992,300Government of Canada 3.5%, December 2045 10-Dec-12 CAD Open RBC 24,048,585 127.85 23,700,459Province of Quebec 6%, October 2029 10-Dec-12 CAD Open TD 2,685,000 134.25 2,667,727Government of Canada 8%, June 2023 18-Dec-12 CAD Open TD 12,216,723 157.90 12,213,111Government of Canada 9%, June 2025 18-Dec-12 CAD Open RBC 11,187,009 176.73 11,190,985Government of Canada 5.75%, June 2029 18-Dec-12 CAD Open RBC 44,061,292 148.15 44,189,251Government of Canada 5.75%, June 2033 18-Dec-12 CAD Open RBC 49,457,487 154.69 49,648,349Government of Canada 5%, June 2037 18-Dec-12 CAD Open RBC 52,480,021 147.11 52,789,130Government of Canada 4%, June 2041 18-Dec-12 CAD Open SCC 56,963,232 132.80 57,338,316Hydro Quebec 6.5%, February 2035 18-Dec-12 CAD Open SCC 9,866,800 145.10 9,809,813Province of Ontario 5.85%, March 2033 18-Dec-12 CAD Open RBC 17,576,559 136.57 17,480,665Province of Ontario 3.5%, June 2043 18-Dec-12 CAD 11-Jan-13 CWM 24,969,000 101.50 25,164,136Province of Quebec 4.25%, December 2043 18-Dec-12 CAD 11-Jan-13 SCC 18,370,100 112.70 18,548,362Government of Canada 1.5%, June 2023 20-Dec-12 CAD 11-Jan-13 SCC 11,359,322 100.90 10,834,059Total: BlackRock Canada CorePlus Long
Bond Fund 516,652,187 514,110,864
BlackRock Canada CorePlus Universe Bond
Fund
Province of Ontario 4.3%, March 2017 5-Jun-12 CAD Open RBC 512,726 112.44 501,897Province of Quebec 5%, December 2041 5-Jun-12 CAD Open RBC 745,775 128.14 734,781Hydro Quebec 9.625%, July 2022 18-Jun-12 CAD Open RBC 123,272 162.20 118,404
332

Notes to Financial Statements December 31, 2012
Security Sold Trade Date Currency
Expiration
Date
Counter-
party
Amount
of Cash
Received
(CAD)
Repurchase
Price
(CAD)
Fair Value of
Securities Sold
At December 31, 2012
(CAD)
Canada Housing Trust 2.2%, March 2014 27-Jun-12 CAD Open RBC 598,425 102.47 591,201Canada Housing Trust No. 1 3.8%, June 2021 27-Jun-12 CAD Open RBC 690,484 113.38 685,196Government of Canada 2%, December 2014 27-Jun-12 CAD Open RBC 1,244,403 102.42 1,234,498Government of Canada 3%, December 2015 27-Jun-12 CAD 16-Jan-13 RBC 974,807 106.42 961,804Government of Canada 2%, June 2016 27-Jun-12 CAD Open RBC 808,931 103.18 802,312Government of Canada 2.75%, September 2016 27-Jun-12 CAD Open RBC 812,813 107.09 797,369Government of Canada 1.5%, March 2017 27-Jun-12 CAD Open RBC 727,886 101.66 720,061Canada Housing Trust 2.75%, December 2014 26-Jul-12 CAD Open RBC 565,651 103.98 559,949Canada Housing Trust 2.95%, March 2015 26-Jul-12 CAD Open RBC 536,194 105.55 526,520Government of Canada 2.25%, August 2014 26-Jul-12 CAD Open RBC 1,120,736 103.58 1,100,856Canada Housing Trust No. 1 2.05%, June 2017 22-Aug-12 CAD Open RBC 915,660 101.74 915,961Government of Canada 1%, February 2014 27-Aug-12 CAD Open RBC 806,788 99.85 807,073Government of Canada 0.75%, May 2014 27-Aug-12 CAD Open RBC 796,560 99.57 796,109Government of Canada 2.5%, June 2015 27-Aug-12 CAD Open RBC 917,121 104.10 908,932Province of Ontario 4.65%, June 2041 27-Aug-12 CAD Open RBC 943,559 123.18 938,570Canada Housing Trust 2.75%, December 2015 7-Sep-12 CAD Open RBC 528,079 104.57 524,735Canada Housing Trust No. 1 2.65%, March 2022 7-Sep-12 CAD Open RBC 574,456 103.88 570,446Government of Canada 3.5%, June 2020 24-Sep-12 CAD Open RBC 1,187,469 114.51 1,171,883Government of Canada 5.75%, June 2033 24-Sep-12 CAD Open RBC 1,472,438 157.48 1,451,933Canada Housing Trust No. 1 3.75%, March 2020 26-Sep-12 CAD Open RBC 484,877 112.24 482,205Province of Ontario 5.85%, March 2033 2-Oct-12 CAD Open RBC 452,410 137.93 445,506Government of Canada 2.75%, June 2022 4-Oct-12 CAD Open RBC 878,960 109.87 865,580Government of Canada 1%, November 2014 5-Oct-12 CAD Open RBC 600,600 100.10 598,505Government of Canada 1.5%, August 2015 5-Oct-12 CAD Open RBC 495,733 101.17 493,522Canada Housing Trust No. 1 1.7%, December 2017 10-Oct-12 CAD Open RBC 499,050 99.81 500,023Canada Housing Trust No. 1 3.15%, June 2015 16-Oct-12 CAD Open RBC 563,601 105.94 555,741Canada Housing Trust No. 1 2.45%, December 2015 16-Oct-12 CAD Open RBC 553,865 104.11 548,198Canada Housing Trust No. 1 2.75%, June 2016 16-Oct-12 CAD Open RBC 1,201,076 105.45 1,187,129Canada Housing Trust No. 1 4.1%, December 2018 16-Oct-12 CAD Open RBC 696,099 114.49 685,295Government of Canada 2%, March 2014 16-Oct-12 CAD Open RBC 694,260 101.50 690,969Government of Canada 3%, June 2014 16-Oct-12 CAD Open RBC 1,107,752 104.21 1,090,770Government of Canada 5%, June 2014 16-Oct-12 CAD Open RBC 657,734 108.18 640,837Government of Canada 4.5%, June 2015 16-Oct-12 CAD Open RBC 755,136 110.40 738,140Government of Canada 4%, June 2016 16-Oct-12 CAD Open RBC 761,224 111.29 745,506Government of Canada 9.75%, June 2021 16-Oct-12 CAD Open RBC 127,969 168.38 124,006Government of Canada 8%, June 2023 16-Oct-12 CAD Open RBC 368,653 161.69 359,906Government of Canada 9%, June 2025 16-Oct-12 CAD Open RBC 275,226 181.07 268,725Government of Canada 8%, June 2027 16-Oct-12 CAD Open RBC 534,918 175.96 525,463Province of Ontario 4.2%, June 2020 16-Oct-12 CAD Open RBC 605,629 113.84 596,287Province of Ontario 4%, June 2021 16-Oct-12 CAD Open RBC 909,549 112.29 896,333Province of Ontario 6.5%, March 2029 16-Oct-12 CAD Open RBC 537,586 141.47 535,684Province of Quebec 4.5%, December 2020 16-Oct-12 CAD Open RBC 527,318 115.64 518,957Province of Quebec 5%, December 2038 16-Oct-12 CAD Open RBC 474,658 124.91 470,299Canada Housing Trust No. 1 1.85%, December 2016 23-Oct-12 CAD Open RBC 905,624 101.87 898,511Province of Ontario 5%, March 2014 23-Oct-12 CAD Open RBC 431,664 105.80 425,898Province of Ontario 3.15%, June 2022 23-Oct-12 CAD Open RBC 942,551 104.38 934,327Province of Ontario 7.6%, June 2027 23-Oct-12 CAD Open RBC 391,287 154.05 383,561Province of Ontario 4.6%, June 2039 23-Oct-12 CAD Open RBC 641,203 121.44 633,133Canada Housing Trust 3.15%, June 2014 1-Nov-12 CAD Open SCC 680,688 104.40 670,388Canada Housing Trust No. 1 2.75%, September 2014 1-Nov-12 CAD Open SCC 598,850 103.25 595,027
333

Notes to Financial Statements December 31, 2012
Security Sold Trade Date Currency
Expiration
Date
Counter-
party
Amount
of Cash
Received
(CAD)
Repurchase
Price
(CAD)
Fair Value of
Securities Sold
At December 31, 2012
(CAD)
Government of Canada 4%, June 2017 1-Nov-12 CAD Open SCC 894,380 113.50 876,478Government of Canada 5.75%, June 2029 1-Nov-12 CAD Open SCC 1,147,220 150.95 1,129,210Government of Canada 5%, June 2037 1-Nov-12 CAD Open SCC 1,480,007 149.95 1,460,528Hydro Quebec 11%, August 2020 5-Nov-12 CAD Open RBC 248,273 162.27 242,123Hydro Quebec 6.5%, February 2035 5-Nov-12 CAD Open RBC 222,057 146.09 219,278Hydro Quebec 5%, February 2045 5-Nov-12 CAD Open RBC 197,007 129.61 195,270Government of Canada 4%, June 2041 6-Nov-12 CAD Open RBC 1,592,582 135.77 1,568,001Province of Ontario 6.2%, Juen 2031 6-Nov-12 CAD Open CWM 356,580 141.50 350,371Government of Canada 3.25%, June 2021 14-Nov-12 CAD Open CWM 1,019,750 114.45 998,514Province of Ontario 2.85%, June 2023 28-Nov-12 CAD 11-Jan-13 CWM 152,400 101.60 149,835Canada Housing Trust No. 1 2.4%, December 2022 4-Dec-12 CAD Open CWM 381,938 101.85 376,984Province of Ontario 3.5%, June 2043 4-Dec-12 CAD Open RBC 664,430 102.22 664,906Government of Canada 1.5%, June 2023 6-Dec-12 CAD Open SCC 353,018 97.25 349,331Government of Canada 3.5%, December 2045 6-Dec-12 CAD Open RBC 675,983 128.27 664,016Hydro Quebec 5%, February 2050 6-Dec-12 CAD Open RBC 268,337 132.84 265,364Canada Housing Trust No. 1 3.35%, December 2020 18-Dec-12 CAD Open RBC 411,897 108.68 413,306Government of Canada 1%, February 2015 18-Dec-12 CAD Open RBC 830,415 100.05 827,567Government of Canada 1.5%, September 2017 18-Dec-12 CAD Open RBC 689,882 100.86 687,618Government of Canada 4.25%, June 2018 18-Dec-12 CAD Open CWM 889,665 114.50 890,395Government of Canada 3.75%, June 2019 18-Dec-12 CAD Open RBC 1,566,883 113.46 1,565,607Province of Ontario 4.4%, June 2019 18-Dec-12 CAD Open RBC 740,099 112.82 740,265Government of Canada 1.25%, February 2016 27-Dec-12 CAD Open RBC 350,735 100.21 349,723Government of Canada 1.25%, March 2018 27-Dec-12 CAD 15-Jan-13 RBC 223,560 99.36 223,013Total: BlackRock Canada CorePlus Universe
Bond Fund 52,317,081 51,732,624
8. Unitholders’ equity
The authorized capital of the Funds consists of an unlimited number of units without nominal or par value. Unitholders have theright, under the Funds’ master declaration of trust, to request the redemption of their units at the current net asset value per unit.For certain funds the authorized capital consists of multiple classes of units. Unitholders in Class D units are primarily definedcontribution pension plans and unitholders in Class A are primarily defined benefit pension plans.
In accordance with the Funds’ master declaration of trust, the number of units issued as a result of distributions will be consolidatedso that the number of units then outstanding will be equal to the number of units outstanding immediately prior to the issuance ofsuch additional units, except for the BlackRock CDN Emerging Markets Fundamental Index Fund, for which the number of unitsoutstanding includes units issued as a result of income distributions, in accordance with its declaration of trust.
Changes in issued units, for the periods ended December 31, 2012 and December 31, 2011 respectively, are summarized below:
2012 2011
Fund/Class Units Issued Units Redeemed Units Issued Units Redeemed
BlackRock Canadian Equity Index Class A 13,876,600 (8,213,948) 10,751,778 (5,254,340)BlackRock Canadian Equity Index Class D 26,863,374 (10,889,053) 26,298,400 (11,664,778)BlackRock Canadian Equity Ex-Trusts Index Fund 96,504 (1,704,898) 160,947 (1,067,320)BlackRock CDN MSCI Canada IMI Index Fund 18,896,194 (8,863,374) 16,132,696 (38,691,473)BlackRock CDN US Equity Index Non-Taxable Class A 20,046,343 (31,275,409) 79,953,758 (105,240,588)BlackRock CDN US Equity Index Non-Taxable Class D 17,889,861 (3,791,347) 11,684,242 (5,477,855)BlackRock CDN US Equity Index Plus Non-Taxable Fund 4,193,593 - 1,415,384 (11,182,164)BlackRock CDN US Equity Index Hedged Non-Taxable Fund 2,716,679 (9,090,109) 4,572,733 (16,321,878)BlackRock CDN US Equity Index Class A 1,051,703 (40,907) 21,341 (81,998)BlackRock CDN US Equity Index Class D 95,849,101 (11,816,533) 32,488,487 (9,699,383)BlackRock CDN US Alpha Tilts Non-Taxable Fund 1,795,304 (11,321,241) 1,473,790 (31,593,616)
334

Notes to Financial Statements December 31, 2012
2012 2011
Fund/Class Units Issued Units Redeemed Units Issued Units Redeemed
BlackRock CDN US Alpha Tilts Hedged Non-Taxable Fund - (9,786) 102,950 (1,495,799)BlackRock CDN Russell 3000 Index Non-Taxable Fund 38,991,555 (41,500,187) 17,834,669 (41,256,712)BlackRock Active Canadian Equity Fund 15,954,667 (6,126,760) 4,515,073 (9,301,491)BlackRock Active Canadian Equity Ex-Income Trusts Fund 303,979 (23,813,339) 7,284,753 (20,056,462)BlackRock Active Canadian Equity DC Fund 6,796,041 (2,133,779) 2,579,872 (2,661,662)BlackRock Active Canadian Equity Small Cap Fund - (1,351,327) - (700,513)BlackRock Canada Alpha Advantage Fund 22,199,198 - 9,999,962 -BlackRock Canada Universe Bond Index Class A 8,546,115 (62,646,845) 32,137,783 (67,604,792)BlackRock Canada Universe Bond Index Class D 44,766,854 (18,004,164) 33,009,520 (23,906,275)BlackRock Canada ex-BBB Universe Bond Index Fund 3,218 (19,128,454) 438,036 (4,576,455)BlackRock Canada Real Return Bond Index Class A 153,581 (1,554,438) 4,060,932 (3,055,209)BlackRock Canada Real Return Bond Index Class D 10,666,291 (1,388,351) 5,352,303 (2,289,068)BlackRock Canada Long Bond Index Class A 65,258,255 (22,187,158) 68,362,973 (88,373,654)BlackRock Canada Long Bond Index Class D 28,151,215 (3,202,417) 14,972,710 (5,914,269)BlackRock Canada Long Government Bond Index Fund - (17,104,175) 57,908,766 -BlackRock Canada All Government Bond Index Fund 1,306,978 (2,227,084) 556,167 (1,448,245)BlackRock Canada Credit -Screened Bond Index Fund 18,329,414 (8,742,829) 266,482 (1,248,427)BlackRock Canada CoreActive Universe Bond Class A 197,867 (149,247) 327,916 (840,539)BlackRock Canada CorePlus Long Bond Fund 14,772,110 - 3,317,192 -BlackRock Canada CorePlus Universe Bond Fund 200,748 (36,394) 9,127,817 -BlackRock Canada Levered Long Bond Index Fund 1,230,913 (241,308) 3,848,139 -BlackRock Canada Levered Real Return Bond Index Fund - (395,444) 3,847,558 -BlackRock Balanced Moderate Index DC Fund 10,156,759 (5,702,060) 8,985,386 (5,448,846)BlackRock Balanced Conservative Index DC Fund 7,009,673 (3,313,390) 5,828,503 (2,000,577)BlackRock Balanced Aggressive Index DC Fund 2,200,801 (1,148,145) 2,134,677 (947,849)BlackRock CDN LifePath Retirement Index Fund I 6,680,993 (1,533,967) 6,982,639 (1,274,542)BlackRock CDN LifePath Index 2010 Retirement Fund 1,418,620 (2,027,019) 1,598,389 (2,855,945)BlackRock CDN LifePath 2015 Index Fund 13,375,612 (2,626,295) 15,129,050 (1,789,909)BlackRock CDN LifePath 2020 Index Fund 26,400,915 (3,626,945) 23,060,218 (3,229,372)BlackRock CDN LifePath 2025 Index Fund 29,106,542 (3,320,193) 21,373,991 (912,412)BlackRock CDN LifePath 2030 Index Fund 26,334,854 (3,893,698) 19,963,058 (1,721,164)BlackRock CDN LifePath 2035 Index Fund 19,390,386 (1,811,748) 14,653,598 (568,923)BlackRock CDN LifePath 2040 Index Fund 14,808,185 (1,762,624) 11,815,809 (1,258,640)BlackRock CDN LifePath 2045 Index Fund 12,802,088 (833,865) 7,408,419 (403,495)BlackRock CDN LifePath 2050 Index Fund 650,003 (3,012) - -BlackRock Balanced Active Fund - - - (494,287)BlackRock CDN Global Market Selection Class A 240,333 (3,874,606) 1,493,754 (47,385)BlackRock CDN Short Term Index Class A 12,314,491 (4,185,297) 1,154,945 (394,567)BlackRock CDN Short Term Index Class D 1,034,236 (1,214,113) 1,581,042 (1,577,172)BlackRock CDN MSCI EAFE Equity Index Class A 51,047,149 (47,791,370) 53,145,277 (40,157,789)BlackRock CDN MSCI EAFE Equity Index Class D 56,050,754 (15,645,648) 46,527,828 (23,314,662)BlackRock CDN MSCI EAFE Index Hedged Fund 5,150,200 (30,076,164) 15,666,976 (9,549,706)BlackRock CDN MSCI ACWI ex-Canada Index Fund 26,960,524 (3,207,716) 6,246,815 (3,765,950)BlackRock CDN MSCI Emerging Markets Index Class A 6,348,750 (36,613) 6,351,972 (274,359)BlackRock CDN MSCI EAFE Index Plus Fund 1,931,784 (2,148,279) 10,943,537 -BlackRock CDN Global Equity Focus Fund 1,552,996 (60,581) 4,363,908 -BlackRock CDN Global Developed Real Estate Index Class D 36,195,127 (1,646,446) - -BlackRock CDN Global Infrastructure Equity Index Class D 21,788,668 (1,759,714) - -BlackRock CDN Emerging Markets Fundamental Index Fund 3,555,621* (41,749) 760 (36)
* BlackRock CDN Emerging Markets Fundamental Index Fund includes units reinvested.
335

Notes to Financial Statements December 31, 2012
9. Redemptions
In determining the amount of distributions payable to unitholders at the end of the year, net realized capital gains may be allocatedto redeeming unitholders. Any such redeeming unitholders will receive a T3 supplementary slip for the allocated gain. Any netcapital gains that remain after allocations to redeeming unitholders will be distributed to remaining unitholders.
10. Related parties
BlackRock Canada has appointed 1) BlackRock Institutional Trust Company, N.A. (“BTC”), a national banking associationorganized under the laws of the United States of America that operates as a limited purpose trust company as the sub-adviser ofthe Funds, except for the BlackRock CDN Global Equity Focus Fund, and 2) BlackRock Investment Management (UK) Limited,(“BIM UK”), a corporation incorporated under the laws of England and Wales that is authorized and regulated by the FinancialServices Authority of the United Kingdom (“FSA”), as sub-adviser of the BlackRock CDN Global Equity Focus Fund. As sub-advisers, BTC and BIM UK are responsible for the investment management activities of the Funds, subject to the policies, controland supervision of BlackRock Canada. BTC and BIM UK, each, an affiliate of BlackRock Canada, are wholly-owned, indirectsubsidiaries of BlackRock, Inc., an asset management company. BlackRock Canada remains responsible for the management ofthe Funds, including the management of investment portfolios and the investment advice provided by BTC and BIM UK.
The Funds are responsible for all operating expenses incurred by or on behalf of the Funds. If BlackRock Canada provides any ofthese services, it will be entitled to fees for such services. The Funds are responsible for all commissions payable to brokers ordealers on behalf of the Funds.
a. Investments in other funds
The Funds may invest in other investment funds managed by BlackRock Canada or its affiliates, in accordance with their respectiveinvestment objectives. Disclosure of such investments held as at December 31, 2012 is provided in the Statements of InvestmentPortfolio in the financial statements.
b. Securities lending
The Funds may lend securities, either directly, or through an agent, to brokers, dealers and other financial institutions. Securitieslending enables the Funds to earn additional income. By using such income to offset the Funds’ expenses, the Funds will be able toreduce the effect such expenses have on the Funds’ ability to provide investment results that more closely correspond to theinvestment objectives of the Funds.
The Funds have entered into a securities lending authorization agreement with each of BTC and BlackRock Advisors (UK) Limited(“BRAL”), as lending agents, subject to the overriding authority of BlackRock Canada. BRAL is a corporation incorporated under thelaws of England and Wales and is authorized and regulated by the FSA. BRAL is also an affiliate of BlackRock Canada and awholly-owned, indirect subsidiary of BlackRock, Inc. Both BTC and BRAL have considerable experience and expertise in securitieslending.
The net income earned in connection with securities lending is allocated 50% to the applicable lending agent and 50% to therelevant Fund. The lending agents bear all operational costs with respect to the lending of securities.
The Funds require collateral in the form of cash or obligations of, or guaranteed by, the Government of Canada or a provincethereof or of the United States Government or its agencies or instrumentalities or other acceptable collateral that has an aggregatevalue of not less than 102% of the fair value of the loaned securities. BlackRock Canada assesses the credit-worthiness of eachborrower, and acts promptly to demand payment from any borrower in realizing any collateral.
During the period, the Funds received sovereign, Canadian agencies and US Government-backed instruments bonds as collateralwhich is held by the lending agent on behalf of the Funds. The market value of securities on loan and the market value of theassociated collateral as at December 31, 2012 are provided below:
Fund
Market Value of Securities on Loan
as at December 31, 2012*
Market Value of Collateral
as at December 31, 2012* %
BlackRock Canadian Equity Index Fund $294,005,405 $312,049,215 1.06BlackRock Canadian Equity Ex-Trusts Index Fund 51,676 54,575 1.06BlackRock CDN MSCI Canada IMI Index Fund 77,193,846 81,915,741 1.06BlackRock CDN US Equity Index Non-Taxable Fund 4,131,181 4,540,359 1.10BlackRock CDN Russell 3000 Index Non-Taxable Fund 117,651 129,304 1.10BlackRock Active Canadian Equity Fund 92,073,974 97,472,935 1.06BlackRock Active Canadian Equity Ex-Income Trusts Fund 19,482,992 20,811,486 1.07BlackRock Active Canadian Equity DC Fund 27,302,960 29,167,724 1.07BlackRock Active Canadian Equity Small Cap Fund 5,009,110 5,293,118 1.06
336

Notes to Financial Statements December 31, 2012
Fund
Market Value of Securities on Loan
as at December 31, 2012*
Market Value of Collateral
as at December 31, 2012* %
BlackRock Canada Universe Bond Index Fund $826,247,459 $861,412,718 1.04BlackRock Canada ex-BBB Universe Bond Index Fund 34,173,987 35,625,024 1.04BlackRock Canada Long Bond Index Fund 85,943,880 89,385,594 1.04BlackRock Canada All Government Bond Index Fund 26,604,750 27,733,387 1.04BlackRock Canada Credit-Screened Bond Index Fund 4,032,129 4,194,744 1.04BlackRock Canada CoreActive Universe Bond Fund 10,471,798 10,921,972 1.04BlackRock Balanced Moderate Index DC Fund 102,420 107,788 1.05BlackRock Balanced Conservative Index DC Fund 341,400 359,294 1.05BlackRock Balanced Aggressive Index DC Fund 170,700 179,647 1.05BlackRock CDN MSCI EAFE Equity Index Fund 49,625,811 53,098,452 1.07BlackRock CDN MSCI EAFE Index Plus Fund 4,288,378 4,708,099 1.10
* at market close prices
c. Inter-fund trading
Certain funds executed inter-fund trades for the periods ended December 31, 2012 and December 31, 2011, respectively. Inter-fund trading is the buying and selling of portfolio securities between funds to which BlackRock Canada serves as trustee andmanager, or between funds to which BlackRock Canada serves as manager and trustee and managed accounts to whichBlackRock Canada serves as manager. At certain regularly scheduled meetings, the IRC (as defined hereinafter) reviews suchtransactions for compliance with certain requirements and restrictions, including the price at which the inter-fund trades areexecuted.
d. Indirect expenses
Funds investing in exchange traded funds may incur indirect expenses for investment management fees. The indirect expensesbased on the average holdings of exchange traded funds for the year ended December 31, 2012 and December 31, 2011 aresummarized below:
Indirect Expenses as a Percentage of Net Assets
Fund December 31, 2012 December 31, 2011
BlackRock Balanced Moderate Index DC Fund 0.07% 0.06%BlackRock Balanced Conservative Index DC Fund 0.06% 0.05%BlackRock Balanced Aggressive Index DC Fund 0.08% 0.07%BlackRock CDN LifePath Retirement Index Fund I 0.11% 0.13%BlackRock CDN LifePath Index 2010 Retirement Fund 0.11% 0.13%BlackRock CDN LifePath 2015 Index Fund 0.12% 0.15%BlackRock CDN LifePath 2020 Index Fund 0.13% 0.16%BlackRock CDN LifePath 2025 Index Fund 0.14% 0.17%BlackRock CDN LifePath 2030 Index Fund 0.13% 0.17%BlackRock CDN LifePath 2035 Index Fund 0.13% 0.17%BlackRock CDN LifePath 2040 Index Fund 0.12% 0.16%BlackRock CDN LifePath 2045 Index Fund 0.11% 0.13%BlackRock CDN LifePath 2050 Index Fund 0.03% -BlackRock Balanced Active Fund 0.09% 0.06%BlackRock CDN MSCI ACWI ex-Canada Index Fund 0.11% 0.09%
11. Comparison of Net Asset Value per Unit and Net Assets per Unit
The primary reason for the difference between the Net Asset Value per Unit and Net Assets per Unit is described in Note 2.As at December 31, 2012 As at December 31, 2011
Fund/Class
Net Asset
Value Per
Unit
Net Assets
Per Unit
Net Asset
Value Per
Unit
Net Assets
Per Unit
BlackRock Canadian Equity Index Class A $57.13 $57.03 $53.29 $53.19BlackRock Canadian Equity Index Class D 23.86 23.82 22.26 22.22
337

Notes to Financial Statements December 31, 2012
As at December 31, 2012 As at December 31, 2011
Fund/Class
Net Asset
Value Per
Unit
Net Assets
Per Unit
Net Asset
Value Per
Unit
Net Assets
Per Unit
BlackRock Canadian Equity Ex-Trusts Index Fund $56.68 $-* $53.03 $52.94BlackRock CDN MSCI Canada IMI Index Fund 11.24 11.21 10.55 10.53BlackRock CDN US Equity Index Non-Taxable Class A 10.04 10.04 8.85 8.85BlackRock CDN US Equity Index Non-Taxable Class D 17.49 17.49 15.42 15.41BlackRock CDN US Equity Index Plus Non-Taxable Fund 13.11 13.11 11.56 11.56BlackRock CDN US Equity Index Hedged Non-Taxable Fund 12.49 12.49 10.75 10.75BlackRock CDN US Equity Index Class A 8.61 8.62 7.62 7.62BlackRock CDN US Equity Index Class D 8.61 8.62 7.62 7.62BlackRock CDN US Alpha Tilts Non-Taxable Fund 9.79 9.79 8.40 8.40BlackRock CDN US Alpha Tilts Hedged Non-Taxable Fund 12.18 12.18 10.22 10.22BlackRock CDN Russell 3000 Index Non-Taxable Fund 12.00 12.00 10.54 10.54BlackRock Active Canadian Equity Fund 33.34 33.27 30.91 30.86BlackRock Active Canadian Equity Ex-Income Trusts Fund 32.95 32.88 30.75 30.70BlackRock Active Canadian Equity DC Fund 24.13 24.09 22.52 22.48BlackRock Active Canadian Equity Small Cap Fund 48.82 48.66 44.59 44.46BlackRock Canada Alpha Advantage Fund 11.16 11.12 10.00 9.97BlackRock Canada Universe Bond Index Class A 27.54 27.51 26.56 26.54BlackRock Canada Universe Bond Index Class D 23.55 23.52 22.72 22.70BlackRock Canada ex-BBB Universe Bond Index Fund 18.85 18.83 18.24 18.23BlackRock Canada Real Return Bond Index Class A 33.76 33.72 32.82 32.78BlackRock Canada Real Return Bond Index Class D 15.65 15.63 15.22 15.20BlackRock Canada Long Bond Index Class A 29.05 29.02 27.72 27.69BlackRock Canada Long Bond Index Class D 15.44 15.43 14.74 14.73BlackRock Canada Long Government Bond Index Fund 10.40 10.39 10.00 9.99BlackRock Canada All Government Bond Index Fund 12.24 12.24 11.93 11.92BlackRock Canada Credit-Screened Bond Index Fund 12.76 12.73 12.01 11.98BlackRock Canada CoreActive Universe Bond Class A 20.91 20.89 20.16 20.13BlackRock Canada CorePlus Long Bond Fund 16.77 16.76 15.53 15.52BlackRock Canada CorePlus Universe Bond Fund 11.09 11.08 10.43 10.44BlackRock Canada Levered Long Bond Index Fund 11.79 11.79 10.94 10.94BlackRock Canada Levered Real Return Bond Index Fund 11.93 11.93 11.49 11.49BlackRock Balanced Moderate Index DC Fund 20.09 20.09 18.50 18.50BlackRock Balanced Conservative Index DC Fund 19.22 19.22 17.93 17.93BlackRock Balanced Aggressive Index DC Fund 19.81 19.81 18.00 18.00BlackRock CDN LifePath Retirement Index Fund I 12.44 12.44 11.64 11.63BlackRock CDN LifePath Index 2010 Retirement Fund 12.19 12.19 11.40 11.39BlackRock CDN LifePath 2015 Index Fund 11.88 11.88 11.04 11.02BlackRock CDN LifePath 2020 Index Fund 11.47 11.47 10.53 10.51BlackRock CDN LifePath 2025 Index Fund 11.31 11.31 10.30 10.28BlackRock CDN LifePath 2030 Index Fund 10.75 10.75 9.74 9.72BlackRock CDN LifePath 2035 Index Fund 10.45 10.45 9.43 9.41BlackRock CDN LifePath 2040 Index Fund 10.20 10.20 9.17 9.15BlackRock CDN LifePath 2045 Index Fund 10.53 10.53 9.44 9.41BlackRock CDN LifePath 2050 Index Fund 10.74 10.74 - -BlackRock Balanced Active Fund 26.96 26.96 24.65 24.65BlackRock CDN Global Market Selection Class A 50.72 50.72 49.46 49.46BlackRock CDN Short Term Index Class A 15.80 15.80 15.65 15.64BlackRock CDN Short Term Index Class D 13.26 13.26 13.13 13.12BlackRock CDN MSCI EAFE Equity Index Class A 10.13 10.11 8.81 8.80BlackRock CDN MSCI EAFE Equity Index Class D 10.12 10.11 8.81 8.79
338

Notes to Financial Statements December 31, 2012
As at December 31, 2012 As at December 31, 2011
Fund/Class
Net Asset
Value Per
Unit
Net Assets
Per Unit
Net Asset
Value Per
Unit
Net Assets
Per Unit
BlackRock CDN MSCI EAFE Index Hedged Fund $11.02 $11.02 $9.36 $9.36BlackRock CDN MSCI ACWI ex-Canada Index Fund 9.33 9.34 8.18 8.18BlackRock CDN MSCI Emerging Markets Index Class A 10.38 10.35 8.99 8.97BlackRock CDN MSCI EAFE Index Plus Fund 10.68 10.67 9.30 9.28BlackRock CDN Global Equity Focus Fund 10.88 10.88 9.51 9.50BlackRock CDN Global Developed Real Estate Index Class D 10.66 10.65 - -BlackRock CDN Global Infrastructure Equity Index Class D 10.47 10.46 - -BlackRock CDN Emerging Markets Fundamental Index Fund 19.37 19.34 17.76 17.72
* For additional information, refer to Note 1 (c)
12. Financial instrument risk
a. Valuation of financial instruments
The Funds are required to classify fair value measurement using a fair value hierarchy that reflects the significance of inputs used inmaking the measurements. The fair value hierarchy has the following levels:
Level 1: Quoted market price in an active market for an identical instrument. Example of securities that are priced at Level 1 includelisted equities, exchange traded derivatives and exchange-traded funds. The Fund does not adjust the quoted price for theseinstruments. A financial instrument is regarded as quoted in an active market if quoted prices are readily or regularly available froman exchange or prices that represent actual and regularly occurring market transactions on an arm’s length basis.
Level 2: Valuation techniques used to price securities are based on observable inputs. This category includes instruments valuedusing quoted prices in active markets for similar instruments, quoted prices for similar instruments in markets that are consideredless than active or other valuation techniques where all significant inputs are directly or indirectly observable from market data.Examples of securities that are priced at Level 2 include money market, bonds and forward contracts.
Valuation techniques used for non-standardized financial instruments such as options, currency swaps or other over-the-counterderivatives, include the use of comparable recent arm’s length transactions, reference to other instruments that are substantially thesame, discounted cash flow analysis, options pricing models and other valuation techniques commonly used by market participantsmaking the maximum use of market inputs and relying as little as possible on entity-specific inputs.
Level 3: Valuation techniques using significant unobservable inputs. This category includes all instruments where the valuationtechnique includes inputs not based on observable data and the unobservable inputs can have a significant impact on theinstrument’s valuation. This also includes instruments that are valued based on quoted prices for similar instruments wheresignificant unobservable adjustments or assumptions are required to reflect differences between the instruments, and instrumentsfor which there is no active market.
The determination of what constitutes ‘observable’ requires significant judgment by BlackRock Canada. BlackRock Canadaconsiders observable data to be market data that is readily available, regularly distributed or updated, reliable and verifiable, notproprietary, and provided by independent sources that are actively involved in the relevant market.
Tables below present the hierarchical classification of the financial instruments measured at fair value as at December 31, 2012and December 31, 2011. The Funds held no financial instruments that are categorized as Level 3. There were no significanttransfers between the levels during the period.
i) Equity funds
As at December 31, 2012
Level 1 Level 2
FundEquities
(000’s CAD)
Net Futures
(000’s CAD)
Equities
(000’s CAD)
Money Market
Investments
(000’s CAD)
Net Forward
Currency
Contracts
(000’s CAD)
Other
Financial
Instruments
(000’s CAD)
Total ($)
(000’s CAD)
BlackRock Canadian Equity Index Fund 4,096,874 761 - - - - 4,097,635BlackRock CDN MSCI Canada IMI Index Fund 1,126,581 152 - - - - 1,126,733BlackRock CDN US Equity Index Non-Taxable Fund 4,236,191 (166) - 8,627 - - 4,244,652BlackRock CDN US Equity Index Plus Non-Taxable Fund 263,232 2 - 298 - - 263,532
339
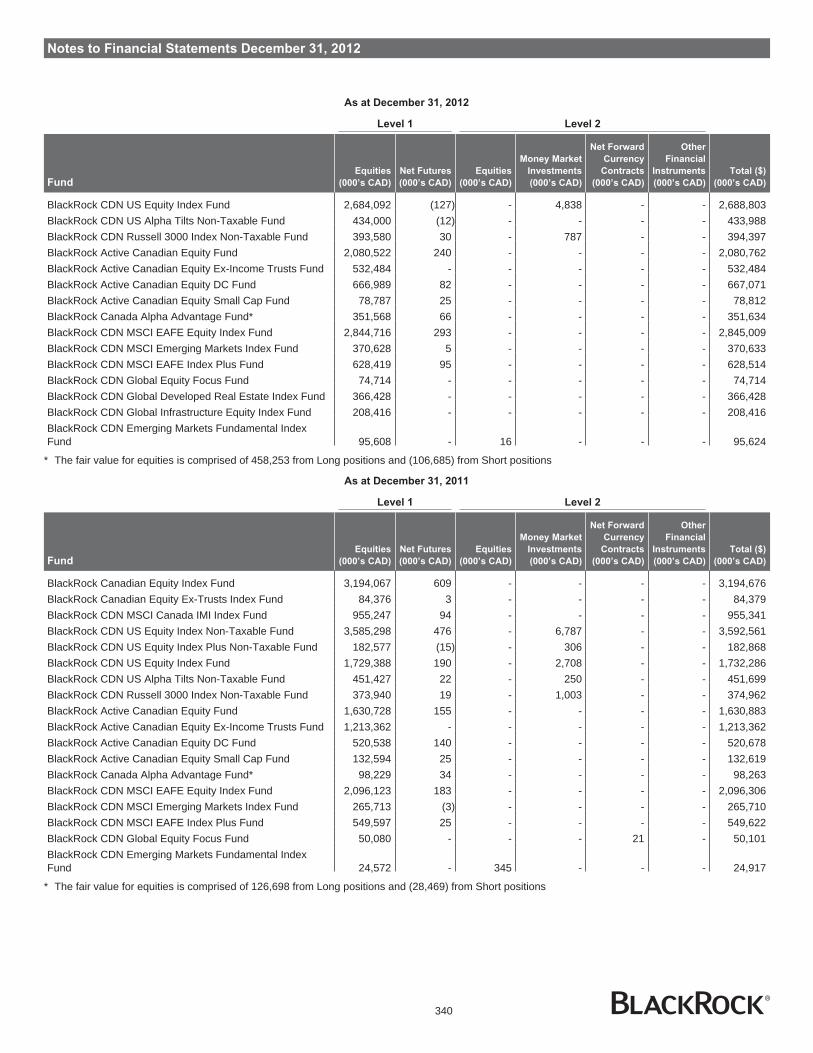
Notes to Financial Statements December 31, 2012
As at December 31, 2012
Level 1 Level 2
FundEquities
(000’s CAD)
Net Futures
(000’s CAD)
Equities
(000’s CAD)
Money Market
Investments
(000’s CAD)
Net Forward
Currency
Contracts
(000’s CAD)
Other
Financial
Instruments
(000’s CAD)
Total ($)
(000’s CAD)
BlackRock CDN US Equity Index Fund 2,684,092 (127) - 4,838 - - 2,688,803BlackRock CDN US Alpha Tilts Non-Taxable Fund 434,000 (12) - - - - 433,988BlackRock CDN Russell 3000 Index Non-Taxable Fund 393,580 30 - 787 - - 394,397BlackRock Active Canadian Equity Fund 2,080,522 240 - - - - 2,080,762BlackRock Active Canadian Equity Ex-Income Trusts Fund 532,484 - - - - - 532,484BlackRock Active Canadian Equity DC Fund 666,989 82 - - - - 667,071BlackRock Active Canadian Equity Small Cap Fund 78,787 25 - - - - 78,812BlackRock Canada Alpha Advantage Fund* 351,568 66 - - - - 351,634BlackRock CDN MSCI EAFE Equity Index Fund 2,844,716 293 - - - - 2,845,009BlackRock CDN MSCI Emerging Markets Index Fund 370,628 5 - - - - 370,633BlackRock CDN MSCI EAFE Index Plus Fund 628,419 95 - - - - 628,514BlackRock CDN Global Equity Focus Fund 74,714 - - - - - 74,714BlackRock CDN Global Developed Real Estate Index Fund 366,428 - - - - - 366,428BlackRock CDN Global Infrastructure Equity Index Fund 208,416 - - - - - 208,416BlackRock CDN Emerging Markets Fundamental IndexFund 95,608 - 16 - - - 95,624
* The fair value for equities is comprised of 458,253 from Long positions and (106,685) from Short positions
As at December 31, 2011
Level 1 Level 2
FundEquities
(000’s CAD)
Net Futures
(000’s CAD)
Equities
(000’s CAD)
Money Market
Investments
(000’s CAD)
Net Forward
Currency
Contracts
(000’s CAD)
Other
Financial
Instruments
(000’s CAD)
Total ($)
(000’s CAD)
BlackRock Canadian Equity Index Fund 3,194,067 609 - - - - 3,194,676BlackRock Canadian Equity Ex-Trusts Index Fund 84,376 3 - - - - 84,379BlackRock CDN MSCI Canada IMI Index Fund 955,247 94 - - - - 955,341BlackRock CDN US Equity Index Non-Taxable Fund 3,585,298 476 - 6,787 - - 3,592,561BlackRock CDN US Equity Index Plus Non-Taxable Fund 182,577 (15) - 306 - - 182,868BlackRock CDN US Equity Index Fund 1,729,388 190 - 2,708 - - 1,732,286BlackRock CDN US Alpha Tilts Non-Taxable Fund 451,427 22 - 250 - - 451,699BlackRock CDN Russell 3000 Index Non-Taxable Fund 373,940 19 - 1,003 - - 374,962BlackRock Active Canadian Equity Fund 1,630,728 155 - - - - 1,630,883BlackRock Active Canadian Equity Ex-Income Trusts Fund 1,213,362 - - - - - 1,213,362BlackRock Active Canadian Equity DC Fund 520,538 140 - - - - 520,678BlackRock Active Canadian Equity Small Cap Fund 132,594 25 - - - - 132,619BlackRock Canada Alpha Advantage Fund* 98,229 34 - - - - 98,263BlackRock CDN MSCI EAFE Equity Index Fund 2,096,123 183 - - - - 2,096,306BlackRock CDN MSCI Emerging Markets Index Fund 265,713 (3) - - - - 265,710BlackRock CDN MSCI EAFE Index Plus Fund 549,597 25 - - - - 549,622BlackRock CDN Global Equity Focus Fund 50,080 - - - 21 - 50,101BlackRock CDN Emerging Markets Fundamental IndexFund 24,572 - 345 - - - 24,917
* The fair value for equities is comprised of 126,698 from Long positions and (28,469) from Short positions
340

Notes to Financial Statements December 31, 2012
ii) Fixed income funds
As at December 31, 2012
Level 1 Level 2
FundNet Futures
(000’s CAD)
Money Market
Investments/
Debt
Securities
(000’s CAD)
Other Funds
(000’s CAD)
Net Forward
Currency
Contracts
(000’s CAD)
Other
Financial
Instruments*
(000’s CAD)
Total ($)
(000’s CAD)
BlackRock Canada Universe Bond Index Fund - 6,631,030 - - - 6,631,030BlackRock Canada ex-BBB Universe Bond Index Fund 246,387 - - - 246,387BlackRock Canada Real Return Bond Index Fund - 912,629 - - - 912,629BlackRock Canada Long Bond Index Fund - 9,273,510 - - - 9,273,510BlackRock Canada Long Government Bond Index Fund - 420,300 - - - 420,300BlackRock Canada All Government Bond Index Fund - 157,484 - - - 157,484BlackRock Canada Credit-Screened Bond Index Fund - 287,495 - - - 287,495BlackRock Canada CoreActive Universe Bond Fund (2) 95,520 - - - 95,518BlackRock Canada CorePlus Long Bond Fund - 1,062,349 524,168 (1,247) (516,652) 1,068,618BlackRock Canada CorePlus Universe Bond Fund (2) 102,223 51,331 (121) (52,317) 101,114BlackRock CDN Short Term Index Fund - 177,540 - - - 177,540
As at December 31, 2011
Level 1 Level 2
FundNet Futures
(000’s CAD)
Money Market
Investments/
Debt
Securities
(000’s CAD)
Other Funds
(000’s CAD)
Net Forward
Currency
Contracts
(000’s CAD)
Other
Financial
Instruments*
(000’s CAD)
Total ($)
(000’s CAD)
BlackRock Canada Universe Bond Index Fund - 7,221,058 - - - 7,221,058BlackRock Canada ex-BBB Universe Bond Index Fund - 584,948 - - - 584,948BlackRock Canada Real Return Bond Index Fund - 792,498 - - - 792,498BlackRock Canada Long Bond Index Fund - 7,356,149 - - - 7,356,149BlackRock Canada Long Government Bond Index Fund - 574,171 - - - 574,171BlackRock Canada All Government Bond Index Fund - 164,473 - - - 164,473BlackRock Canada Credit-Screened Bond Index Fund - 159,333 - - - 159,333BlackRock Canada CoreActive Universe Bond Fund 2 90,791 - - - 90,793BlackRock Canada CorePlus Long Bond Fund - 753,711 390,939 6,370 (392,091) 758,929BlackRock Canada CorePlus Universe Bond Fund - 93,857 48,806 182 (10,820) 132,025BlackRock CDN Short Term Index Fund - 51,898 - - - 51,898
* Repurchase Agreement
iii) Funds holding investment funds (Fund of Funds)
As at December 31, 2012
Level 1 Level 2
Fund
Exchange
Traded Funds
(000’s CAD)
Net Futures
(000’s CAD)
Other Funds
(000’s CAD)
Net Forward
Currency
Contracts
(000’s CAD)
Other
Financial
Instruments**
(000’s CAD)
Total ($)
(000’s CAD)
BlackRock CDN US Equity Index Hedged Non-Taxable Fund - - 804,656 (1,368) - 803,288BlackRock CDN US Alpha Tilts Hedged Non-Taxable Fund - - 28,516 (30) - 28,486BlackRock Canada Levered Long Bond Index Fund - - 44,940 - 553 45,493BlackRock Canada Levered Real Return Bond Index Fund - - 32,576 - 232 32,808BlackRock Balanced Moderate Index DC Fund 106,954 - 978,442 - - 1,085,396BlackRock Balanced Conservative Index DC Fund 50,609 - 545,404 - - 596,013BlackRock Balanced Aggressive Index DC Fund 29,575 - 237,495 - - 267,070BlackRock CDN LifePath Retirement Index Fund I 17,800 - 184,798 - - 202,598BlackRock CDN LifePath Index 2010 Retirement Fund 10,742 - 106,531 - - 117,273
341

Notes to Financial Statements December 31, 2012
As at December 31, 2012
Level 1 Level 2
Fund
Exchange
Traded Funds
(000’s CAD)
Net Futures
(000’s CAD)
Other Funds
(000’s CAD)
Net Forward
Currency
Contracts
(000’s CAD)
Other
Financial
Instruments**
(000’s CAD)
Total ($)
(000’s CAD)
BlackRock CDN LifePath 2015 Index Fund 47,039 - 468,672 - - 515,711BlackRock CDN LifePath 2020 Index Fund 101,502 - 943,875 - - 1,045,377BlackRock CDN LifePath 2025 Index Fund 86,641 - 723,215 - - 809,856BlackRock CDN LifePath 2030 Index Fund 87,680 - 721,583 - - 809,263BlackRock CDN LifePath 2035 Index Fund 50,382 - 440,544 - - 490,926BlackRock CDN LifePath 2040 Index Fund 40,600 - 388,032 - - 428,632BlackRock CDN LifePath 2045 Index Fund 22,815 - 240,836 - - 263,651BlackRock CDN LifePath 2050 Index Fund 579 - 6,366 - - 6,945BlackRock Balanced Active Fund 3,484 - 31,566 - - 35,050BlackRock CDN Global Market Selection Fund - - 711,907 (609) - 711,298BlackRock CDN MSCI EAFE Index Hedged Fund - - 191,585 (215) - 191,370BlackRock CDN MSCI ACWI ex-Canada Index Fund 51,399 - 318,599 - - 369,998
As at December 31, 2011
Level 1 Level 2
Fund
Exchange
Traded Funds
(000’s CAD)
Net Futures
(000’s CAD)
Other Funds
(000’s CAD)
Net Forward
Currency
Contracts
(000’s CAD)
Other
Financial
Instruments**
(000’s CAD)
Total ($)
(000’s CAD)
BlackRock CDN US Equity Index Hedged Non-Taxable Fund - - 754,925 12,860 - 767,785BlackRock CDN US Alpha Tilts Hedged Non-Taxable Fund - - 23,857 928 - 24,785BlackRock Canada Levered Long Bond Index Fund - - 32,094 - 2,258 34,352BlackRock Canada Levered Real Return Bond Index Fund - - 33,624 - 3,518 37,142BlackRock Balanced Moderate Index DC Fund 88,787 - 827,960 - - 916,747BlackRock Balanced Conservative Index DC Fund 40,019 - 449,234 - - 489,253BlackRock Balanced Aggressive Index DC Fund 24,062 - 199,683 - - 223,745BlackRock CDN LifePath Retirement Index Fund I 35,510 - 94,001 - - 129,511BlackRock CDN LifePath Index 2010 Retirement Fund 31,868 - 84,665 - - 116,533BlackRock CDN LifePath 2015 Index Fund 109,592 - 250,482 - - 360,074BlackRock CDN LifePath 2020 Index Fund 232,218 - 486,873 - - 719,091BlackRock CDN LifePath 2025 Index Fund 159,335 - 312,567 - - 471,902BlackRock CDN LifePath 2030 Index Fund 168,700 - 345,530 - - 514,230BlackRock CDN LifePath 2035 Index Fund 87,257 - 189,750 - - 277,007BlackRock CDN LifePath 2040 Index Fund 76,522 - 188,907 - - 265,429BlackRock CDN LifePath 2045 Index Fund 32,689 - 90,355 - - 123,044BlackRock Balanced Active Fund 3,038 - 28,977 - - 32,015BlackRock CDN Global Market Selection Fund - - 869,520 26,984 - 896,504BlackRock CDN MSCI EAFE Index Hedged Fund - - 395,006 11,389 - 406,395BlackRock CDN MSCI ACWI ex-Canada Index Fund 17,361 - 112,754 - - 130,115
** Total Return Swaps
b. Strategy in using financial instruments
The Funds’ activities expose them to a variety of financial risks: market risk (including currency risk, interest rate risk, and othermarket risk), credit risk and liquidity risk.The Funds’ overall risk management program focuses on the processes, strategies, and the objectives of each Fund.
a) Index funds – the overall risk management program focuses on processes and strategies to minimize tracking between eachFund’s performance and the performance of the relevant index.
b) Active funds – the overall risk management program seeks to minimize the potentially adverse effect of risk on each Fund’sperformance in a manner consistent with their investment objective.
342
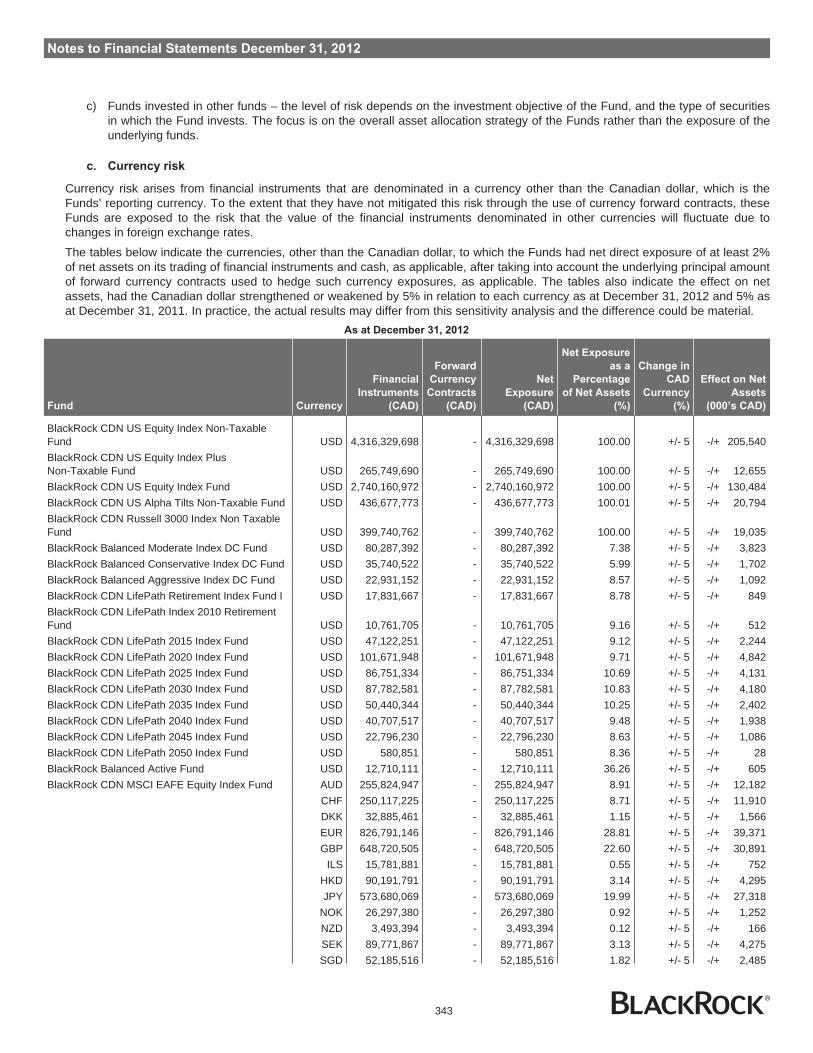
Notes to Financial Statements December 31, 2012
c) Funds invested in other funds – the level of risk depends on the investment objective of the Fund, and the type of securitiesin which the Fund invests. The focus is on the overall asset allocation strategy of the Funds rather than the exposure of theunderlying funds.
c. Currency risk
Currency risk arises from financial instruments that are denominated in a currency other than the Canadian dollar, which is theFunds’ reporting currency. To the extent that they have not mitigated this risk through the use of currency forward contracts, theseFunds are exposed to the risk that the value of the financial instruments denominated in other currencies will fluctuate due tochanges in foreign exchange rates.
The tables below indicate the currencies, other than the Canadian dollar, to which the Funds had net direct exposure of at least 2%of net assets on its trading of financial instruments and cash, as applicable, after taking into account the underlying principal amountof forward currency contracts used to hedge such currency exposures, as applicable. The tables also indicate the effect on netassets, had the Canadian dollar strengthened or weakened by 5% in relation to each currency as at December 31, 2012 and 5% asat December 31, 2011. In practice, the actual results may differ from this sensitivity analysis and the difference could be material.
As at December 31, 2012
Fund Currency
Financial
Instruments
(CAD)
Forward
Currency
Contracts
(CAD)
Net
Exposure
(CAD)
Net Exposure
as a
Percentage
of Net Assets
(%)
Change in
CAD
Currency
(%)
Effect on Net
Assets
(000’s CAD)
BlackRock CDN US Equity Index Non-TaxableFund USD 4,316,329,698 - 4,316,329,698 100.00 +/- 5 -/+ 205,540BlackRock CDN US Equity Index PlusNon-Taxable Fund USD 265,749,690 - 265,749,690 100.00 +/- 5 -/+ 12,655BlackRock CDN US Equity Index Fund USD 2,740,160,972 - 2,740,160,972 100.00 +/- 5 -/+ 130,484BlackRock CDN US Alpha Tilts Non-Taxable Fund USD 436,677,773 - 436,677,773 100.01 +/- 5 -/+ 20,794BlackRock CDN Russell 3000 Index Non TaxableFund USD 399,740,762 - 399,740,762 100.00 +/- 5 -/+ 19,035BlackRock Balanced Moderate Index DC Fund USD 80,287,392 - 80,287,392 7.38 +/- 5 -/+ 3,823BlackRock Balanced Conservative Index DC Fund USD 35,740,522 - 35,740,522 5.99 +/- 5 -/+ 1,702BlackRock Balanced Aggressive Index DC Fund USD 22,931,152 - 22,931,152 8.57 +/- 5 -/+ 1,092BlackRock CDN LifePath Retirement Index Fund I USD 17,831,667 - 17,831,667 8.78 +/- 5 -/+ 849BlackRock CDN LifePath Index 2010 RetirementFund USD 10,761,705 - 10,761,705 9.16 +/- 5 -/+ 512BlackRock CDN LifePath 2015 Index Fund USD 47,122,251 - 47,122,251 9.12 +/- 5 -/+ 2,244BlackRock CDN LifePath 2020 Index Fund USD 101,671,948 - 101,671,948 9.71 +/- 5 -/+ 4,842BlackRock CDN LifePath 2025 Index Fund USD 86,751,334 - 86,751,334 10.69 +/- 5 -/+ 4,131BlackRock CDN LifePath 2030 Index Fund USD 87,782,581 - 87,782,581 10.83 +/- 5 -/+ 4,180BlackRock CDN LifePath 2035 Index Fund USD 50,440,344 - 50,440,344 10.25 +/- 5 -/+ 2,402BlackRock CDN LifePath 2040 Index Fund USD 40,707,517 - 40,707,517 9.48 +/- 5 -/+ 1,938BlackRock CDN LifePath 2045 Index Fund USD 22,796,230 - 22,796,230 8.63 +/- 5 -/+ 1,086BlackRock CDN LifePath 2050 Index Fund USD 580,851 - 580,851 8.36 +/- 5 -/+ 28BlackRock Balanced Active Fund USD 12,710,111 - 12,710,111 36.26 +/- 5 -/+ 605BlackRock CDN MSCI EAFE Equity Index Fund AUD 255,824,947 - 255,824,947 8.91 +/- 5 -/+ 12,182
CHF 250,117,225 - 250,117,225 8.71 +/- 5 -/+ 11,910DKK 32,885,461 - 32,885,461 1.15 +/- 5 -/+ 1,566EUR 826,791,146 - 826,791,146 28.81 +/- 5 -/+ 39,371GBP 648,720,505 - 648,720,505 22.60 +/- 5 -/+ 30,891
ILS 15,781,881 - 15,781,881 0.55 +/- 5 -/+ 752HKD 90,191,791 - 90,191,791 3.14 +/- 5 -/+ 4,295JPY 573,680,069 - 573,680,069 19.99 +/- 5 -/+ 27,318
NOK 26,297,380 - 26,297,380 0.92 +/- 5 -/+ 1,252NZD 3,493,394 - 3,493,394 0.12 +/- 5 -/+ 166SEK 89,771,867 - 89,771,867 3.13 +/- 5 -/+ 4,275SGD 52,185,516 - 52,185,516 1.82 +/- 5 -/+ 2,485
343
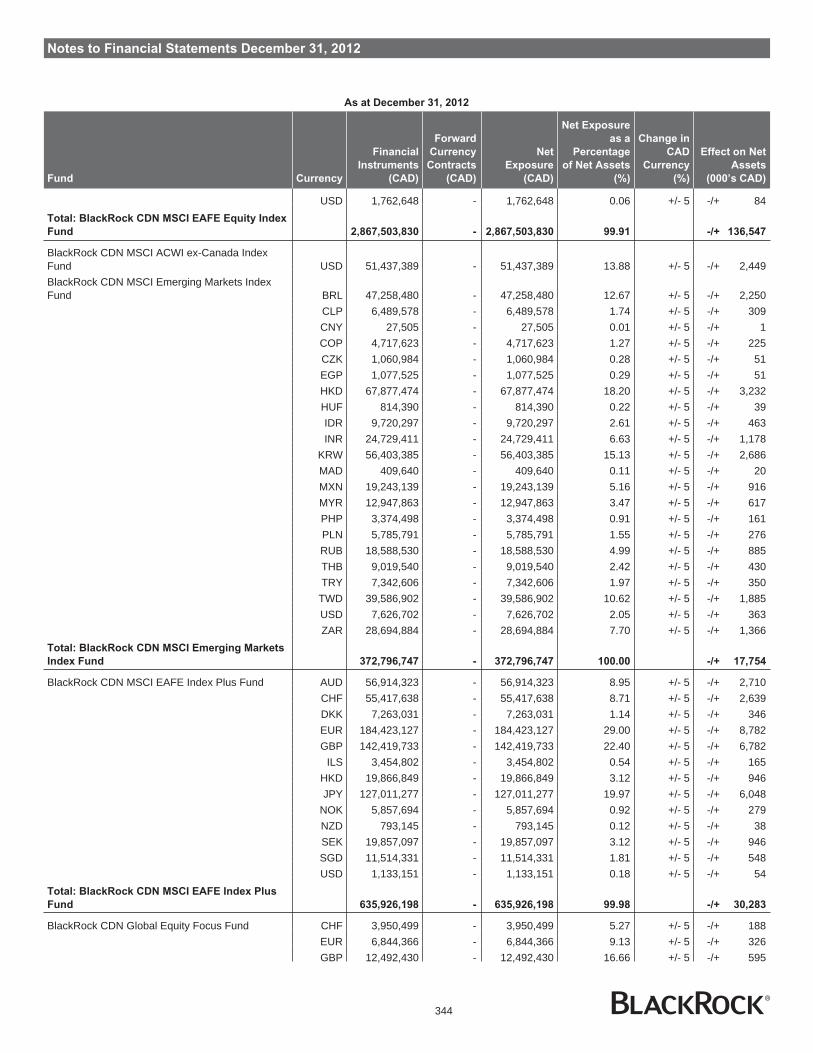
Notes to Financial Statements December 31, 2012
As at December 31, 2012
Fund Currency
Financial
Instruments
(CAD)
Forward
Currency
Contracts
(CAD)
Net
Exposure
(CAD)
Net Exposure
as a
Percentage
of Net Assets
(%)
Change in
CAD
Currency
(%)
Effect on Net
Assets
(000’s CAD)
USD 1,762,648 - 1,762,648 0.06 +/- 5 -/+ 84Total: BlackRock CDN MSCI EAFE Equity Index
Fund 2,867,503,830 - 2,867,503,830 99.91 -/+ 136,547
BlackRock CDN MSCI ACWI ex-Canada IndexFund USD 51,437,389 - 51,437,389 13.88 +/- 5 -/+ 2,449BlackRock CDN MSCI Emerging Markets IndexFund BRL 47,258,480 - 47,258,480 12.67 +/- 5 -/+ 2,250
CLP 6,489,578 - 6,489,578 1.74 +/- 5 -/+ 309CNY 27,505 - 27,505 0.01 +/- 5 -/+ 1COP 4,717,623 - 4,717,623 1.27 +/- 5 -/+ 225CZK 1,060,984 - 1,060,984 0.28 +/- 5 -/+ 51EGP 1,077,525 - 1,077,525 0.29 +/- 5 -/+ 51HKD 67,877,474 - 67,877,474 18.20 +/- 5 -/+ 3,232HUF 814,390 - 814,390 0.22 +/- 5 -/+ 39IDR 9,720,297 - 9,720,297 2.61 +/- 5 -/+ 463INR 24,729,411 - 24,729,411 6.63 +/- 5 -/+ 1,178
KRW 56,403,385 - 56,403,385 15.13 +/- 5 -/+ 2,686MAD 409,640 - 409,640 0.11 +/- 5 -/+ 20MXN 19,243,139 - 19,243,139 5.16 +/- 5 -/+ 916MYR 12,947,863 - 12,947,863 3.47 +/- 5 -/+ 617PHP 3,374,498 - 3,374,498 0.91 +/- 5 -/+ 161PLN 5,785,791 - 5,785,791 1.55 +/- 5 -/+ 276RUB 18,588,530 - 18,588,530 4.99 +/- 5 -/+ 885THB 9,019,540 - 9,019,540 2.42 +/- 5 -/+ 430TRY 7,342,606 - 7,342,606 1.97 +/- 5 -/+ 350TWD 39,586,902 - 39,586,902 10.62 +/- 5 -/+ 1,885USD 7,626,702 - 7,626,702 2.05 +/- 5 -/+ 363ZAR 28,694,884 - 28,694,884 7.70 +/- 5 -/+ 1,366
Total: BlackRock CDN MSCI Emerging Markets
Index Fund 372,796,747 - 372,796,747 100.00 -/+ 17,754
BlackRock CDN MSCI EAFE Index Plus Fund AUD 56,914,323 - 56,914,323 8.95 +/- 5 -/+ 2,710CHF 55,417,638 - 55,417,638 8.71 +/- 5 -/+ 2,639DKK 7,263,031 - 7,263,031 1.14 +/- 5 -/+ 346EUR 184,423,127 - 184,423,127 29.00 +/- 5 -/+ 8,782GBP 142,419,733 - 142,419,733 22.40 +/- 5 -/+ 6,782
ILS 3,454,802 - 3,454,802 0.54 +/- 5 -/+ 165HKD 19,866,849 - 19,866,849 3.12 +/- 5 -/+ 946JPY 127,011,277 - 127,011,277 19.97 +/- 5 -/+ 6,048
NOK 5,857,694 - 5,857,694 0.92 +/- 5 -/+ 279NZD 793,145 - 793,145 0.12 +/- 5 -/+ 38SEK 19,857,097 - 19,857,097 3.12 +/- 5 -/+ 946SGD 11,514,331 - 11,514,331 1.81 +/- 5 -/+ 548USD 1,133,151 - 1,133,151 0.18 +/- 5 -/+ 54
Total: BlackRock CDN MSCI EAFE Index Plus
Fund 635,926,198 - 635,926,198 99.98 -/+ 30,283
BlackRock CDN Global Equity Focus Fund CHF 3,950,499 - 3,950,499 5.27 +/- 5 -/+ 188EUR 6,844,366 - 6,844,366 9.13 +/- 5 -/+ 326GBP 12,492,430 - 12,492,430 16.66 +/- 5 -/+ 595
344

Notes to Financial Statements December 31, 2012
As at December 31, 2012
Fund Currency
Financial
Instruments
(CAD)
Forward
Currency
Contracts
(CAD)
Net
Exposure
(CAD)
Net Exposure
as a
Percentage
of Net Assets
(%)
Change in
CAD
Currency
(%)
Effect on Net
Assets
(000’s CAD)
IDR 1,100,322 - 1,100,322 1.47 +/- 5 -/+ 52JPY 2,279,839 - 2,279,839 3.04 +/- 5 -/+ 109
KRW 742,677 - 742,677 0.99 +/- 5 -/+ 35SEK 2,760,719 - 2,760,719 3.68 +/- 5 -/+ 131USD 43,728,510 - 43,728,510 58.31 +/- 5 -/+ 2,082
Total: BlackRock CDN Global Equity Focus
Fund 73,899,362 - 73,899,362 98.55 -/+ 3,518
BlackRock CDN Global Developed Real EstateIndex Fund AUD 29,853,318 - 29,853,318 8.12 +/- 5 -/+ 1,422
CHF 4,398,351 - 4,398,351 1.20 +/- 5 -/+ 209EUR 23,806,158 - 23,806,158 6.47 +/- 5 -/+ 1,134GBP 18,997,800 - 18,997,800 5.16 +/- 5 -/+ 905HKD 38,563,952 - 38,563,952 10.48 +/- 5 -/+ 1,836
ILS 347,981 - 347,981 0.09 +/- 5 -/+ 17JPY 40,354,505 - 40,354,505 10.97 +/- 5 -/+ 1,922
NOK 283,272 - 283,272 0.08 +/- 5 -/+ 13NZD 342,751 - 342,751 0.09 +/- 5 -/+ 16SEK 3,862,416 - 3,862,416 1.05 +/-5 -/+ 184SGD 18,864,564 - 18,864,564 5.13 +/-5 -/+ 898USD 168,384,849 - 168,384,849 45.78 +/-5 -/+ 8,018
Total: BlackRock CDN Global Developed
Real Estate Index Fund 348,059,917 - 348,059,917 94.62 16,574
BlackRock CDN Global Infrastructure EquityIndex Fund AUD 9,037,833 - 9,037,833 4.32 +/- 5 -/+ 430
CHF 621,674 - 621,674 0.30 +/-5 -/+ 30EUR 25,978,459 - 25,978,459 12.40 +/- 5 -/+ 1,237GBP 22,381,579 - 22,381,579 10.69 +/- 5 -/+ 1,066HKD 10,938,273 - 10,938,273 5.22 +/- 5 -/+ 521JPY 5,131,850 - 5,131,850 2.45 +/- 5 -/+ 244NZD 794,440 - 794,440 0.38 +/- 5 -/+ 38USD 102,440,183 - 102,440,183 48.91 +/- 5 -/+ 4,878
Total: BlackRock CDN Global Infrastructure
Equity Index Fund 177,324,291 - 177,324,291 84.67 8,444
BlackRock Emerging Markets FundamentalIndex Fund BRL 16,593,156 - 16,593,156 17.57 +/- 5 -/+ 790,150
CZK 739,681 - 739,681 0.78 +/- 5 -/+ 35,223HKD 16,869,884 - 16,869,884 17.86 +/- 5 -/+ 803,328HUF 1,025,808 - 1,025,808 1.09 +/- 5 -/+ 48,848IDR 425,408 - 425,408 0.45 +/- 5 -/+ 20,258INR 3,175,786 - 3,175,786 3.36 +/- 5 -/+ 151,228
MXN 2,778,326 - 2,778,326 2.94 +/- 5 -/+ 132,301MYR 2,127,892 - 2,127,892 2.25 +/- 5 -/+ 101,328PLN 2,850,268 - 2,850,268 3.02 +/- 5 -/+ 135,727THB 1,824,825 - 1,824,825 1.93 +/- 5 -/+ 86,896TRY 2,864,141 - 2,864,141 3.03 +/- 5 -/+ 136,388TWD 16,952,171 - 16,952,171 17.95 +/- 5 -/+ 807,246USD 18,359,927 - 18,359,927 19.44 +/- 5 -/+ 874,282ZAR 9,809,785 - 9,809,785 10.39 +/- 5 -/+ 467,133
Total: BlackRock Emerging Markets
Fundamental Index Fund 96,397,058 - 96,397,058 102.06 -/+ 4,590,336
345
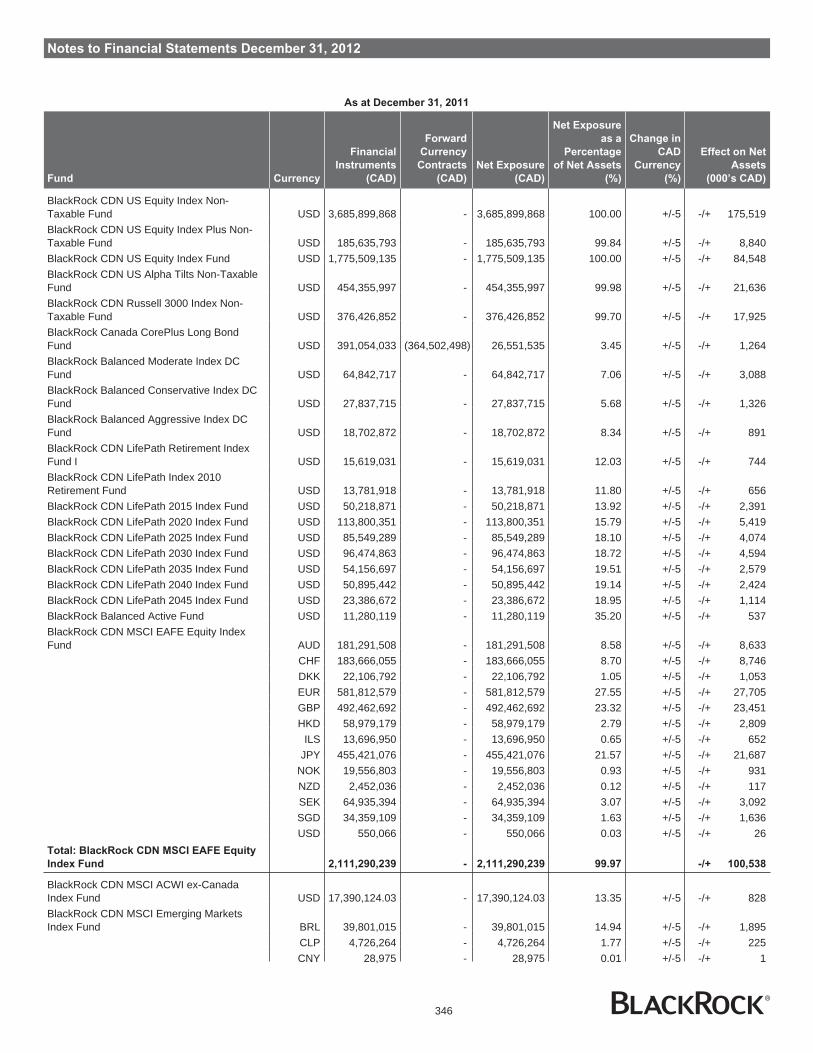
Notes to Financial Statements December 31, 2012
As at December 31, 2011
Fund Currency
Financial
Instruments
(CAD)
Forward
Currency
Contracts
(CAD)
Net Exposure
(CAD)
Net Exposure
as a
Percentage
of Net Assets
(%)
Change in
CAD
Currency
(%)
Effect on Net
Assets
(000’s CAD)
BlackRock CDN US Equity Index Non-Taxable Fund USD 3,685,899,868 - 3,685,899,868 100.00 +/-5 -/+ 175,519BlackRock CDN US Equity Index Plus Non-Taxable Fund USD 185,635,793 - 185,635,793 99.84 +/-5 -/+ 8,840BlackRock CDN US Equity Index Fund USD 1,775,509,135 - 1,775,509,135 100.00 +/-5 -/+ 84,548BlackRock CDN US Alpha Tilts Non-TaxableFund USD 454,355,997 - 454,355,997 99.98 +/-5 -/+ 21,636BlackRock CDN Russell 3000 Index Non-Taxable Fund USD 376,426,852 - 376,426,852 99.70 +/-5 -/+ 17,925BlackRock Canada CorePlus Long BondFund USD 391,054,033 (364,502,498) 26,551,535 3.45 +/-5 -/+ 1,264BlackRock Balanced Moderate Index DCFund USD 64,842,717 - 64,842,717 7.06 +/-5 -/+ 3,088BlackRock Balanced Conservative Index DCFund USD 27,837,715 - 27,837,715 5.68 +/-5 -/+ 1,326BlackRock Balanced Aggressive Index DCFund USD 18,702,872 - 18,702,872 8.34 +/-5 -/+ 891BlackRock CDN LifePath Retirement IndexFund I USD 15,619,031 - 15,619,031 12.03 +/-5 -/+ 744BlackRock CDN LifePath Index 2010Retirement Fund USD 13,781,918 - 13,781,918 11.80 +/-5 -/+ 656BlackRock CDN LifePath 2015 Index Fund USD 50,218,871 - 50,218,871 13.92 +/-5 -/+ 2,391BlackRock CDN LifePath 2020 Index Fund USD 113,800,351 - 113,800,351 15.79 +/-5 -/+ 5,419BlackRock CDN LifePath 2025 Index Fund USD 85,549,289 - 85,549,289 18.10 +/-5 -/+ 4,074BlackRock CDN LifePath 2030 Index Fund USD 96,474,863 - 96,474,863 18.72 +/-5 -/+ 4,594BlackRock CDN LifePath 2035 Index Fund USD 54,156,697 - 54,156,697 19.51 +/-5 -/+ 2,579BlackRock CDN LifePath 2040 Index Fund USD 50,895,442 - 50,895,442 19.14 +/-5 -/+ 2,424BlackRock CDN LifePath 2045 Index Fund USD 23,386,672 - 23,386,672 18.95 +/-5 -/+ 1,114BlackRock Balanced Active Fund USD 11,280,119 - 11,280,119 35.20 +/-5 -/+ 537BlackRock CDN MSCI EAFE Equity IndexFund AUD 181,291,508 - 181,291,508 8.58 +/-5 -/+ 8,633
CHF 183,666,055 - 183,666,055 8.70 +/-5 -/+ 8,746DKK 22,106,792 - 22,106,792 1.05 +/-5 -/+ 1,053EUR 581,812,579 - 581,812,579 27.55 +/-5 -/+ 27,705GBP 492,462,692 - 492,462,692 23.32 +/-5 -/+ 23,451HKD 58,979,179 - 58,979,179 2.79 +/-5 -/+ 2,809
ILS 13,696,950 - 13,696,950 0.65 +/-5 -/+ 652JPY 455,421,076 - 455,421,076 21.57 +/-5 -/+ 21,687
NOK 19,556,803 - 19,556,803 0.93 +/-5 -/+ 931NZD 2,452,036 - 2,452,036 0.12 +/-5 -/+ 117SEK 64,935,394 - 64,935,394 3.07 +/-5 -/+ 3,092SGD 34,359,109 - 34,359,109 1.63 +/-5 -/+ 1,636USD 550,066 - 550,066 0.03 +/-5 -/+ 26
Total: BlackRock CDN MSCI EAFE Equity
Index Fund 2,111,290,239 - 2,111,290,239 99.97 -/+ 100,538
BlackRock CDN MSCI ACWI ex-CanadaIndex Fund USD 17,390,124.03 - 17,390,124.03 13.35 +/-5 -/+ 828BlackRock CDN MSCI Emerging MarketsIndex Fund BRL 39,801,015 - 39,801,015 14.94 +/-5 -/+ 1,895
CLP 4,726,264 - 4,726,264 1.77 +/-5 -/+ 225CNY 28,975 - 28,975 0.01 +/-5 -/+ 1
346
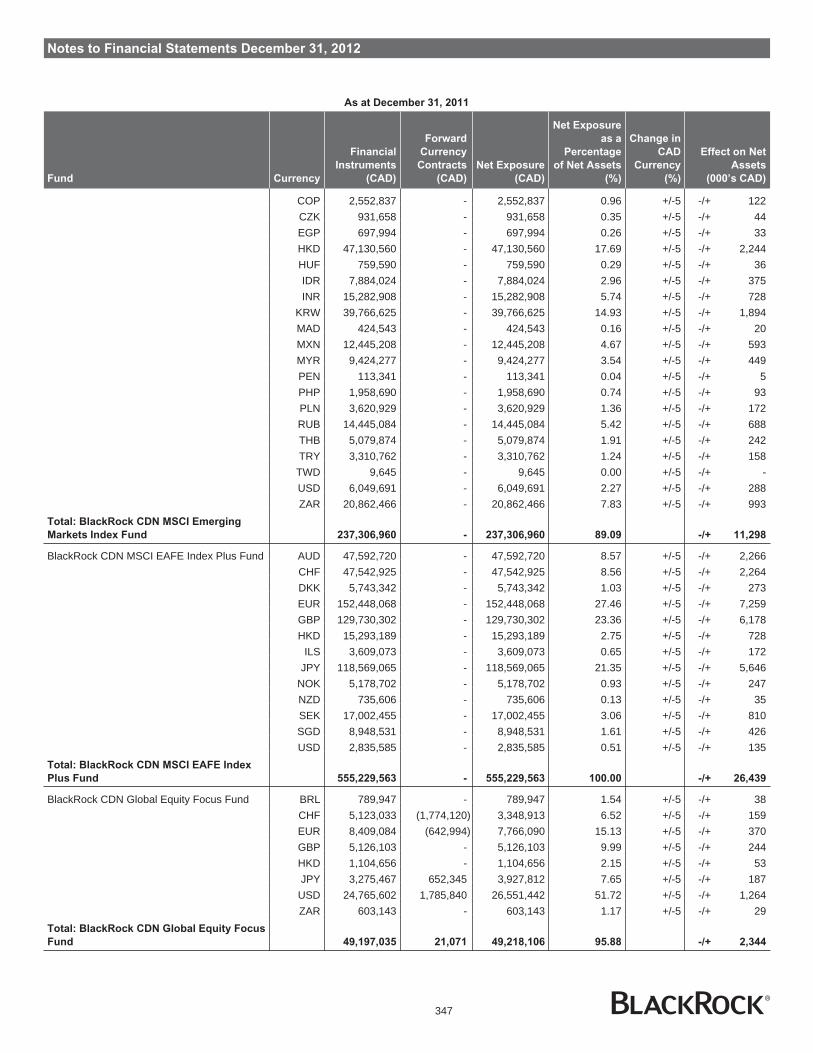
Notes to Financial Statements December 31, 2012
As at December 31, 2011
Fund Currency
Financial
Instruments
(CAD)
Forward
Currency
Contracts
(CAD)
Net Exposure
(CAD)
Net Exposure
as a
Percentage
of Net Assets
(%)
Change in
CAD
Currency
(%)
Effect on Net
Assets
(000’s CAD)
COP 2,552,837 - 2,552,837 0.96 +/-5 -/+ 122CZK 931,658 - 931,658 0.35 +/-5 -/+ 44EGP 697,994 - 697,994 0.26 +/-5 -/+ 33HKD 47,130,560 - 47,130,560 17.69 +/-5 -/+ 2,244HUF 759,590 - 759,590 0.29 +/-5 -/+ 36IDR 7,884,024 - 7,884,024 2.96 +/-5 -/+ 375INR 15,282,908 - 15,282,908 5.74 +/-5 -/+ 728
KRW 39,766,625 - 39,766,625 14.93 +/-5 -/+ 1,894MAD 424,543 - 424,543 0.16 +/-5 -/+ 20MXN 12,445,208 - 12,445,208 4.67 +/-5 -/+ 593MYR 9,424,277 - 9,424,277 3.54 +/-5 -/+ 449PEN 113,341 - 113,341 0.04 +/-5 -/+ 5PHP 1,958,690 - 1,958,690 0.74 +/-5 -/+ 93PLN 3,620,929 - 3,620,929 1.36 +/-5 -/+ 172RUB 14,445,084 - 14,445,084 5.42 +/-5 -/+ 688THB 5,079,874 - 5,079,874 1.91 +/-5 -/+ 242TRY 3,310,762 - 3,310,762 1.24 +/-5 -/+ 158TWD 9,645 - 9,645 0.00 +/-5 -/+ -USD 6,049,691 - 6,049,691 2.27 +/-5 -/+ 288ZAR 20,862,466 - 20,862,466 7.83 +/-5 -/+ 993
Total: BlackRock CDN MSCI Emerging
Markets Index Fund 237,306,960 - 237,306,960 89.09 -/+ 11,298
BlackRock CDN MSCI EAFE Index Plus Fund AUD 47,592,720 - 47,592,720 8.57 +/-5 -/+ 2,266CHF 47,542,925 - 47,542,925 8.56 +/-5 -/+ 2,264DKK 5,743,342 - 5,743,342 1.03 +/-5 -/+ 273EUR 152,448,068 - 152,448,068 27.46 +/-5 -/+ 7,259GBP 129,730,302 - 129,730,302 23.36 +/-5 -/+ 6,178HKD 15,293,189 - 15,293,189 2.75 +/-5 -/+ 728
ILS 3,609,073 - 3,609,073 0.65 +/-5 -/+ 172JPY 118,569,065 - 118,569,065 21.35 +/-5 -/+ 5,646
NOK 5,178,702 - 5,178,702 0.93 +/-5 -/+ 247NZD 735,606 - 735,606 0.13 +/-5 -/+ 35SEK 17,002,455 - 17,002,455 3.06 +/-5 -/+ 810SGD 8,948,531 - 8,948,531 1.61 +/-5 -/+ 426USD 2,835,585 - 2,835,585 0.51 +/-5 -/+ 135
Total: BlackRock CDN MSCI EAFE Index
Plus Fund 555,229,563 - 555,229,563 100.00 -/+ 26,439
BlackRock CDN Global Equity Focus Fund BRL 789,947 - 789,947 1.54 +/-5 -/+ 38CHF 5,123,033 (1,774,120) 3,348,913 6.52 +/-5 -/+ 159EUR 8,409,084 (642,994) 7,766,090 15.13 +/-5 -/+ 370GBP 5,126,103 - 5,126,103 9.99 +/-5 -/+ 244HKD 1,104,656 - 1,104,656 2.15 +/-5 -/+ 53JPY 3,275,467 652,345 3,927,812 7.65 +/-5 -/+ 187
USD 24,765,602 1,785,840 26,551,442 51.72 +/-5 -/+ 1,264ZAR 603,143 - 603,143 1.17 +/-5 -/+ 29
Total: BlackRock CDN Global Equity Focus
Fund 49,197,035 21,071 49,218,106 95.88 -/+ 2,344
347
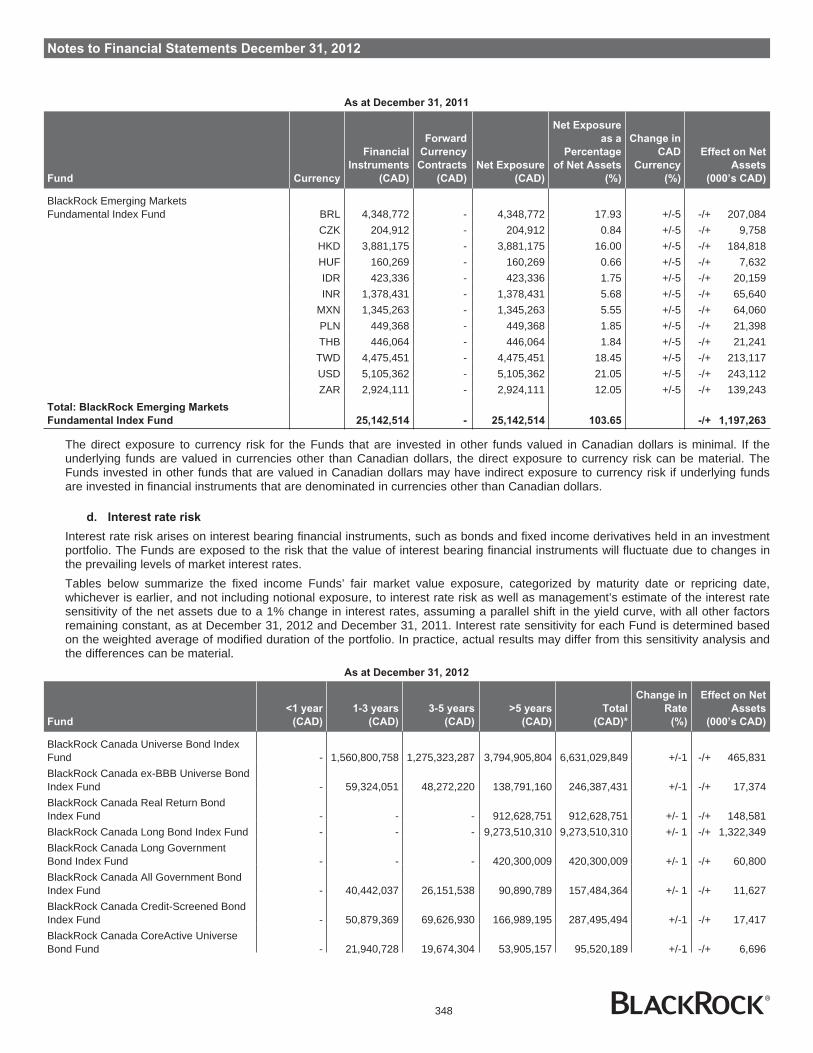
Notes to Financial Statements December 31, 2012
As at December 31, 2011
Fund Currency
Financial
Instruments
(CAD)
Forward
Currency
Contracts
(CAD)
Net Exposure
(CAD)
Net Exposure
as a
Percentage
of Net Assets
(%)
Change in
CAD
Currency
(%)
Effect on Net
Assets
(000’s CAD)
BlackRock Emerging MarketsFundamental Index Fund BRL 4,348,772 - 4,348,772 17.93 +/-5 -/+ 207,084
CZK 204,912 - 204,912 0.84 +/-5 -/+ 9,758HKD 3,881,175 - 3,881,175 16.00 +/-5 -/+ 184,818HUF 160,269 - 160,269 0.66 +/-5 -/+ 7,632IDR 423,336 - 423,336 1.75 +/-5 -/+ 20,159INR 1,378,431 - 1,378,431 5.68 +/-5 -/+ 65,640
MXN 1,345,263 - 1,345,263 5.55 +/-5 -/+ 64,060PLN 449,368 - 449,368 1.85 +/-5 -/+ 21,398THB 446,064 - 446,064 1.84 +/-5 -/+ 21,241TWD 4,475,451 - 4,475,451 18.45 +/-5 -/+ 213,117USD 5,105,362 - 5,105,362 21.05 +/-5 -/+ 243,112ZAR 2,924,111 - 2,924,111 12.05 +/-5 -/+ 139,243
Total: BlackRock Emerging Markets
Fundamental Index Fund 25,142,514 - 25,142,514 103.65 -/+ 1,197,263
The direct exposure to currency risk for the Funds that are invested in other funds valued in Canadian dollars is minimal. If theunderlying funds are valued in currencies other than Canadian dollars, the direct exposure to currency risk can be material. TheFunds invested in other funds that are valued in Canadian dollars may have indirect exposure to currency risk if underlying fundsare invested in financial instruments that are denominated in currencies other than Canadian dollars.
d. Interest rate risk
Interest rate risk arises on interest bearing financial instruments, such as bonds and fixed income derivatives held in an investmentportfolio. The Funds are exposed to the risk that the value of interest bearing financial instruments will fluctuate due to changes inthe prevailing levels of market interest rates.Tables below summarize the fixed income Funds’ fair market value exposure, categorized by maturity date or repricing date,whichever is earlier, and not including notional exposure, to interest rate risk as well as management’s estimate of the interest ratesensitivity of the net assets due to a 1% change in interest rates, assuming a parallel shift in the yield curve, with all other factorsremaining constant, as at December 31, 2012 and December 31, 2011. Interest rate sensitivity for each Fund is determined basedon the weighted average of modified duration of the portfolio. In practice, actual results may differ from this sensitivity analysis andthe differences can be material.
As at December 31, 2012
Fund
<1 year
(CAD)
1-3 years
(CAD)
3-5 years
(CAD)
>5 years
(CAD)
Total
(CAD)*
Change in
Rate
(%)
Effect on Net
Assets
(000’s CAD)
BlackRock Canada Universe Bond IndexFund - 1,560,800,758 1,275,323,287 3,794,905,804 6,631,029,849 +/-1 -/+ 465,831BlackRock Canada ex-BBB Universe BondIndex Fund - 59,324,051 48,272,220 138,791,160 246,387,431 +/-1 -/+ 17,374BlackRock Canada Real Return BondIndex Fund - - - 912,628,751 912,628,751 +/- 1 -/+ 148,581BlackRock Canada Long Bond Index Fund - - - 9,273,510,310 9,273,510,310 +/- 1 -/+ 1,322,349BlackRock Canada Long GovernmentBond Index Fund - - - 420,300,009 420,300,009 +/- 1 -/+ 60,800BlackRock Canada All Government BondIndex Fund - 40,442,037 26,151,538 90,890,789 157,484,364 +/- 1 -/+ 11,627BlackRock Canada Credit-Screened BondIndex Fund - 50,879,369 69,626,930 166,989,195 287,495,494 +/-1 -/+ 17,417BlackRock Canada CoreActive UniverseBond Fund - 21,940,728 19,674,304 53,905,157 95,520,189 +/-1 -/+ 6,696
348

Notes to Financial Statements December 31, 2012
As at December 31, 2012
Fund
<1 year
(CAD)
1-3 years
(CAD)
3-5 years
(CAD)
>5 years
(CAD)
Total
(CAD)*
Change in
Rate
(%)
Effect on Net
Assets
(000’s CAD)
BlackRock Canada CorePlus Long BondFund (516,652,187) - - 1,062,348,704 545,696,517 +/-1 -/+ 157,181BlackRock Canada CorePlus UniverseBond Fund (52,317,081) 24,460,390 19,524,807 58,237,926 49,906,042 +/- 1 -/+ 7,754BlackRock CDN Short Term Index Fund 177,540,253 - - - 177,540,253 +/- 1 -/+ 214
As at December 31, 2011
Fund
<1 year
(CAD)
1-3 years
(CAD)
3-5 years
(CAD)
>5 years
(CAD)
Total
(CAD)*
Change in
Rate
(%)
Effect on Net
Assets
(000’s CAD)
BlackRock Canada Universe Bond IndexFund - 1,698,768,234 1,457,732,786 4,064,556,818 7,221,057,838 +/- 1 -/+ 498,506BlackRock Canada ex-BBB Universe BondIndex Fund - 141,227,637 117,769,373 325,951,084 584,948,094 +/- 1 -/+ 40,257BlackRock Canada Real Return BondIndex Fund - 5,068,153 - 787,429,394 792,497,547 +/- 1 -/+ 129,566BlackRock Canada Long Bond Index Fund - - - 7,356,149,212 7,356,149,212 +/- 1 -/+ 1,027,916BlackRock Canada Long GovernmentBond Index Fund - - - 574,171,451 574,171,451 +/- 1 -/+ 81,884BlackRock Canada All Government BondIndex Fund - 44,623,003 29,304,037 90,545,579 164,472,619 +/- 1 -/+ 11,803BlackRock Canada Credit-Screened BondIndex Fund - 22,418,646 36,972,483 99,942,311 159,333,440 +/- 1 -/+ 9,536BlackRock Canada CoreActive UniverseBond Fund - 18,713,581 19,171,301 52,906,096 90,790,978 +/- 1 -/+ 6,550BlackRock Canada CorePlus Long BondFund (392,091,386) - - 753,710,808 361,619,422 +/- 1 -/+ 107,701BlackRock Canada CorePlus UniverseBond Fund (10,820,178) 22,300,586 18,282,127 53,274,534 83,037,069 +/- 1 -/+ 6,835BlackRock CDN Short Term Index Fund 51,897,513 - - - 51,897,513 +/- 1 -/+ 41
* Excludes cash, cash equivalents and investments in other funds
The tables below summarize net notional derivatives futures exposure of fixed income Funds to interest rate risk as atDecember 31, 2012 and December 31, 2011, respectively, categorized by maturity date.
As at December 31, 2012
Fund
<1 year
(CAD)
1-3 years
(CAD)
3-5 years
(CAD)
>5 years
(CAD)
Total
(CAD)
BlackRock Canada CoreActive Universe Bond Fund - - - (130,699) (130,699)BlackRock Canada CorePlus Universe Bond Fund - - - (130,699) (130,699)
As at December 31, 2011
Fund
<1 year
(CAD)
1-3 years
(CAD)
3-5 years
(CAD)
>5 years
(CAD)
Total
(CAD)
BlackRock Canada CoreActive Universe Bond Fund - - - 112,207 112,207
Funds invested in other funds may be exposed to indirect interest rate risk in the event the underlying funds are invested in interestbearing financial instruments. Certain funds are exposed to underlying funds through swap contracts – see Note 6.
e. Other market risk
Other market risk is the risk that the value of financial instruments may fluctuate as a result of changes in market prices (other thanthose arising from interest rate risk or currency risk). All securities present the risk of loss of capital due to market risk. The Fundsmoderate this risk through the use of various investment strategies within the parameters of the Funds’ investment guidelines.
349
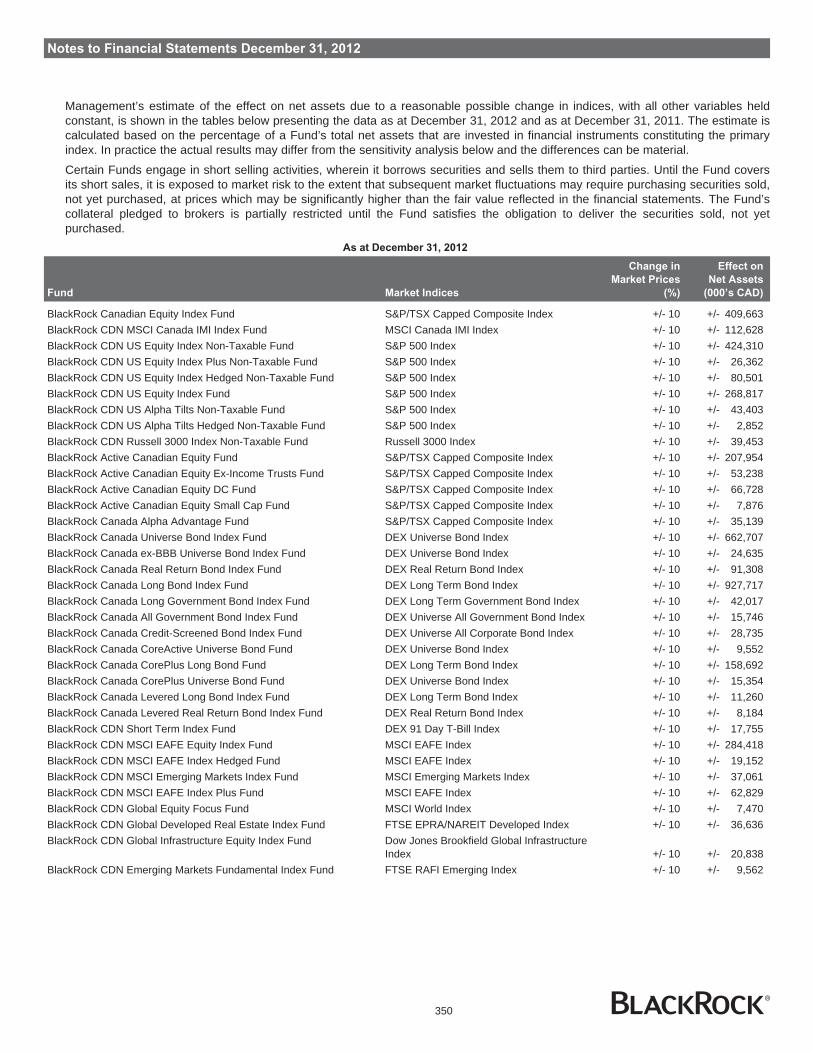
Notes to Financial Statements December 31, 2012
Management’s estimate of the effect on net assets due to a reasonable possible change in indices, with all other variables heldconstant, is shown in the tables below presenting the data as at December 31, 2012 and as at December 31, 2011. The estimate iscalculated based on the percentage of a Fund’s total net assets that are invested in financial instruments constituting the primaryindex. In practice the actual results may differ from the sensitivity analysis below and the differences can be material.
Certain Funds engage in short selling activities, wherein it borrows securities and sells them to third parties. Until the Fund coversits short sales, it is exposed to market risk to the extent that subsequent market fluctuations may require purchasing securities sold,not yet purchased, at prices which may be significantly higher than the fair value reflected in the financial statements. The Fund’scollateral pledged to brokers is partially restricted until the Fund satisfies the obligation to deliver the securities sold, not yetpurchased.
As at December 31, 2012
Fund Market Indices
Change in
Market Prices
(%)
Effect on
Net Assets
(000’s CAD)
BlackRock Canadian Equity Index Fund S&P/TSX Capped Composite Index +/- 10 +/- 409,663BlackRock CDN MSCI Canada IMI Index Fund MSCI Canada IMI Index +/- 10 +/- 112,628BlackRock CDN US Equity Index Non-Taxable Fund S&P 500 Index +/- 10 +/- 424,310BlackRock CDN US Equity Index Plus Non-Taxable Fund S&P 500 Index +/- 10 +/- 26,362BlackRock CDN US Equity Index Hedged Non-Taxable Fund S&P 500 Index +/- 10 +/- 80,501BlackRock CDN US Equity Index Fund S&P 500 Index +/- 10 +/- 268,817BlackRock CDN US Alpha Tilts Non-Taxable Fund S&P 500 Index +/- 10 +/- 43,403BlackRock CDN US Alpha Tilts Hedged Non-Taxable Fund S&P 500 Index +/- 10 +/- 2,852BlackRock CDN Russell 3000 Index Non-Taxable Fund Russell 3000 Index +/- 10 +/- 39,453BlackRock Active Canadian Equity Fund S&P/TSX Capped Composite Index +/- 10 +/- 207,954BlackRock Active Canadian Equity Ex-Income Trusts Fund S&P/TSX Capped Composite Index +/- 10 +/- 53,238BlackRock Active Canadian Equity DC Fund S&P/TSX Capped Composite Index +/- 10 +/- 66,728BlackRock Active Canadian Equity Small Cap Fund S&P/TSX Capped Composite Index +/- 10 +/- 7,876BlackRock Canada Alpha Advantage Fund S&P/TSX Capped Composite Index +/- 10 +/- 35,139BlackRock Canada Universe Bond Index Fund DEX Universe Bond Index +/- 10 +/- 662,707BlackRock Canada ex-BBB Universe Bond Index Fund DEX Universe Bond Index +/- 10 +/- 24,635BlackRock Canada Real Return Bond Index Fund DEX Real Return Bond Index +/- 10 +/- 91,308BlackRock Canada Long Bond Index Fund DEX Long Term Bond Index +/- 10 +/- 927,717BlackRock Canada Long Government Bond Index Fund DEX Long Term Government Bond Index +/- 10 +/- 42,017BlackRock Canada All Government Bond Index Fund DEX Universe All Government Bond Index +/- 10 +/- 15,746BlackRock Canada Credit-Screened Bond Index Fund DEX Universe All Corporate Bond Index +/- 10 +/- 28,735BlackRock Canada CoreActive Universe Bond Fund DEX Universe Bond Index +/- 10 +/- 9,552BlackRock Canada CorePlus Long Bond Fund DEX Long Term Bond Index +/- 10 +/- 158,692BlackRock Canada CorePlus Universe Bond Fund DEX Universe Bond Index +/- 10 +/- 15,354BlackRock Canada Levered Long Bond Index Fund DEX Long Term Bond Index +/- 10 +/- 11,260BlackRock Canada Levered Real Return Bond Index Fund DEX Real Return Bond Index +/- 10 +/- 8,184BlackRock CDN Short Term Index Fund DEX 91 Day T-Bill Index +/- 10 +/- 17,755BlackRock CDN MSCI EAFE Equity Index Fund MSCI EAFE Index +/- 10 +/- 284,418BlackRock CDN MSCI EAFE Index Hedged Fund MSCI EAFE Index +/- 10 +/- 19,152BlackRock CDN MSCI Emerging Markets Index Fund MSCI Emerging Markets Index +/- 10 +/- 37,061BlackRock CDN MSCI EAFE Index Plus Fund MSCI EAFE Index +/- 10 +/- 62,829BlackRock CDN Global Equity Focus Fund MSCI World Index +/- 10 +/- 7,470BlackRock CDN Global Developed Real Estate Index Fund FTSE EPRA/NAREIT Developed Index +/- 10 +/- 36,636BlackRock CDN Global Infrastructure Equity Index Fund Dow Jones Brookfield Global Infrastructure
Index +/- 10 +/- 20,838BlackRock CDN Emerging Markets Fundamental Index Fund FTSE RAFI Emerging Index +/- 10 +/- 9,562
350
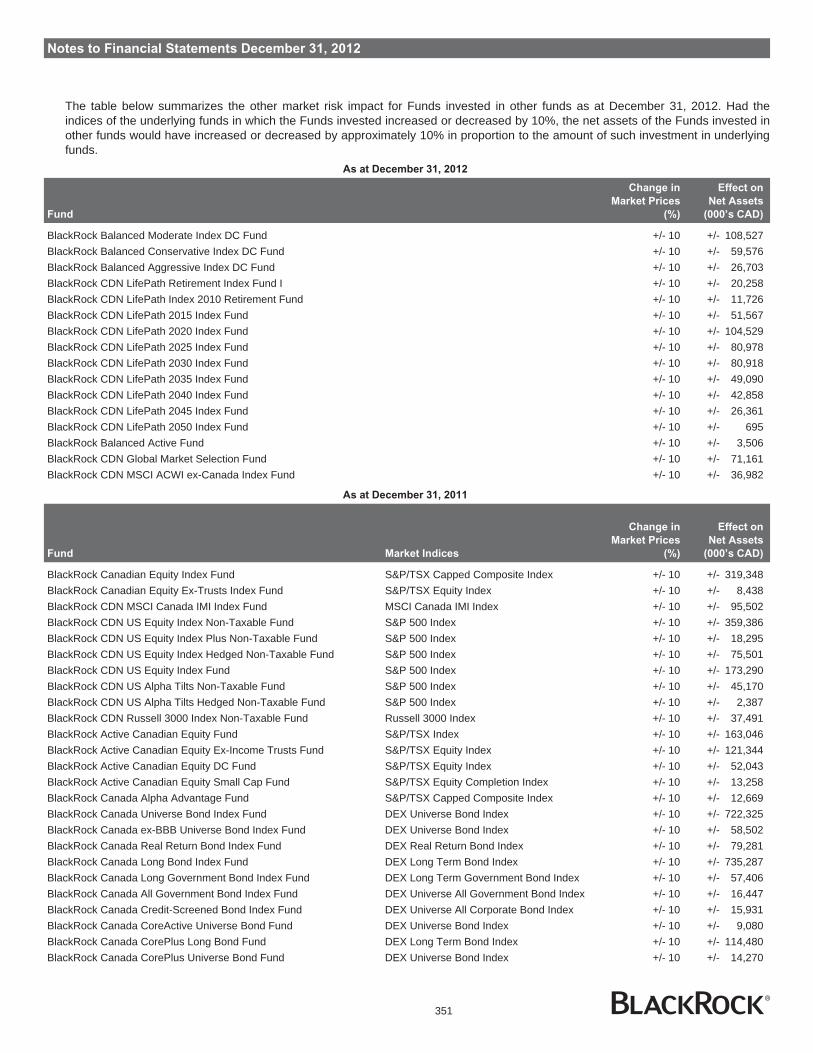
Notes to Financial Statements December 31, 2012
The table below summarizes the other market risk impact for Funds invested in other funds as at December 31, 2012. Had theindices of the underlying funds in which the Funds invested increased or decreased by 10%, the net assets of the Funds invested inother funds would have increased or decreased by approximately 10% in proportion to the amount of such investment in underlyingfunds.
As at December 31, 2012
Fund
Change in
Market Prices
(%)
Effect on
Net Assets
(000’s CAD)
BlackRock Balanced Moderate Index DC Fund +/- 10 +/- 108,527BlackRock Balanced Conservative Index DC Fund +/- 10 +/- 59,576BlackRock Balanced Aggressive Index DC Fund +/- 10 +/- 26,703BlackRock CDN LifePath Retirement Index Fund I +/- 10 +/- 20,258BlackRock CDN LifePath Index 2010 Retirement Fund +/- 10 +/- 11,726BlackRock CDN LifePath 2015 Index Fund +/- 10 +/- 51,567BlackRock CDN LifePath 2020 Index Fund +/- 10 +/- 104,529BlackRock CDN LifePath 2025 Index Fund +/- 10 +/- 80,978BlackRock CDN LifePath 2030 Index Fund +/- 10 +/- 80,918BlackRock CDN LifePath 2035 Index Fund +/- 10 +/- 49,090BlackRock CDN LifePath 2040 Index Fund +/- 10 +/- 42,858BlackRock CDN LifePath 2045 Index Fund +/- 10 +/- 26,361BlackRock CDN LifePath 2050 Index Fund +/- 10 +/- 695BlackRock Balanced Active Fund +/- 10 +/- 3,506BlackRock CDN Global Market Selection Fund +/- 10 +/- 71,161BlackRock CDN MSCI ACWI ex-Canada Index Fund +/- 10 +/- 36,982
As at December 31, 2011
Fund Market Indices
Change in
Market Prices
(%)
Effect on
Net Assets
(000’s CAD)
BlackRock Canadian Equity Index Fund S&P/TSX Capped Composite Index +/- 10 +/- 319,348BlackRock Canadian Equity Ex-Trusts Index Fund S&P/TSX Equity Index +/- 10 +/- 8,438BlackRock CDN MSCI Canada IMI Index Fund MSCI Canada IMI Index +/- 10 +/- 95,502BlackRock CDN US Equity Index Non-Taxable Fund S&P 500 Index +/- 10 +/- 359,386BlackRock CDN US Equity Index Plus Non-Taxable Fund S&P 500 Index +/- 10 +/- 18,295BlackRock CDN US Equity Index Hedged Non-Taxable Fund S&P 500 Index +/- 10 +/- 75,501BlackRock CDN US Equity Index Fund S&P 500 Index +/- 10 +/- 173,290BlackRock CDN US Alpha Tilts Non-Taxable Fund S&P 500 Index +/- 10 +/- 45,170BlackRock CDN US Alpha Tilts Hedged Non-Taxable Fund S&P 500 Index +/- 10 +/- 2,387BlackRock CDN Russell 3000 Index Non-Taxable Fund Russell 3000 Index +/- 10 +/- 37,491BlackRock Active Canadian Equity Fund S&P/TSX Index +/- 10 +/- 163,046BlackRock Active Canadian Equity Ex-Income Trusts Fund S&P/TSX Equity Index +/- 10 +/- 121,344BlackRock Active Canadian Equity DC Fund S&P/TSX Equity Index +/- 10 +/- 52,043BlackRock Active Canadian Equity Small Cap Fund S&P/TSX Equity Completion Index +/- 10 +/- 13,258BlackRock Canada Alpha Advantage Fund S&P/TSX Capped Composite Index +/- 10 +/- 12,669BlackRock Canada Universe Bond Index Fund DEX Universe Bond Index +/- 10 +/- 722,325BlackRock Canada ex-BBB Universe Bond Index Fund DEX Universe Bond Index +/- 10 +/- 58,502BlackRock Canada Real Return Bond Index Fund DEX Real Return Bond Index +/- 10 +/- 79,281BlackRock Canada Long Bond Index Fund DEX Long Term Bond Index +/- 10 +/- 735,287BlackRock Canada Long Government Bond Index Fund DEX Long Term Government Bond Index +/- 10 +/- 57,406BlackRock Canada All Government Bond Index Fund DEX Universe All Government Bond Index +/- 10 +/- 16,447BlackRock Canada Credit-Screened Bond Index Fund DEX Universe All Corporate Bond Index +/- 10 +/- 15,931BlackRock Canada CoreActive Universe Bond Fund DEX Universe Bond Index +/- 10 +/- 9,080BlackRock Canada CorePlus Long Bond Fund DEX Long Term Bond Index +/- 10 +/- 114,480BlackRock Canada CorePlus Universe Bond Fund DEX Universe Bond Index +/- 10 +/- 14,270
351

Notes to Financial Statements December 31, 2012
As at December 31, 2011
Fund Market Indices
Change in
Market Prices
(%)
Effect on
Net Assets
(000’s CAD)
BlackRock Canada Levered Long Bond Index Fund DEX Long Term Bond Index +/- 10 +/- 7,831BlackRock Canada Levered Real Return Bond Index Fund DEX Real Return Bond Index +/- 10 +/- 7,986BlackRock CDN Short Term Index Fund DEX 91 Day T-Bill Index +/- 10 +/- 5,189BlackRock CDN MSCI EAFE Equity Index Fund MSCI EAFE Index +/- 10 +/- 209,707BlackRock CDN MSCI EAFE Index Hedged Fund MSCI EAFE Index +/- 10 +/- 39,514BlackRock CDN MSCI Emerging Markets Index Fund MSCI Emerging Markets Index +/- 10 +/- 26,585BlackRock CDN MSCI EAFE Index Plus Fund MSCI EAFE Index +/- 10 +/- 54,969BlackRock CDN Global Equity Focus Fund MSCI World Index +/- 10 +/- 5,010BlackRock CDN Emerging Markets Fundamental Index Fund FTSE RAFI Emerging Index +/- 10 +/- 2,492
As at December 31, 2011
Fund
Change in
Market Prices
(%)
Effect on
Net Assets
(000’s CAD)
BlackRock Balanced Moderate Index DC Fund +/- 10 +/- 91,673BlackRock Balanced Conservative Index DC Fund +/- 10 +/- 48,923BlackRock Balanced Aggressive Index DC Fund +/- 10 +/- 22,372BlackRock CDN LifePath Retirement Index Fund I +/- 10 +/- 12,950BlackRock CDN LifePath Index 2010 Retirement Fund +/- 10 +/- 11,652BlackRock CDN LifePath 2015 Index Fund +/- 10 +/- 36,006BlackRock CDN LifePath 2020 Index Fund +/- 10 +/- 71,908BlackRock CDN LifePath 2025 Index Fund +/- 10 +/- 47,177BlackRock CDN LifePath 2030 Index Fund +/- 10 +/- 51,423BlackRock CDN LifePath 2035 Index Fund +/- 10 +/- 27,700BlackRock CDN LifePath 2040 Index Fund +/- 10 +/- 26,541BlackRock CDN LifePath 2045 Index Fund +/- 10 +/- 12,304BlackRock Balanced Active Fund +/- 10 +/- 3,201BlackRock CDN Global Market Selection Fund +/- 10 +/- 86,974BlackRock CDN MSCI ACWI ex-Canada Index Fund +/- 10 +/- 13,017
f. Credit risk
The Funds are exposed to credit risk, which is the risk that the counterparty will be unable to pay amounts to the Funds or deliversecurities in full to the Fund when due. All transactions in listed securities are settled (paid for) using approved brokers on delivery.The risk of default is considered minimal, as delivery of securities sold by a Fund is only made when the broker has receivedpayment. Payment from the Fund is made on a purchase when the securities have been received by the broker. A trade will fail ifeither party fails to meet its obligations.
A short seller can be exposed to credit risk for the amount of collateral pledged to the broker if the terms of the agreement with thebroker are unable to be met. The Funds seek to control this risk through counterparty credit evaluations, approvals and exposuremonitoring procedures undertaken by BlackRock Canada and its affiliates.
Credit risk arising on debt instruments is mitigated by investing primarily in instruments that have been rated as “investment grade”or above by independent third party rating agencies. Similarly, credit risk arising on forward currency contracts is mitigated byinvesting primarily in instruments issued by counterparties who have been rated as having a superior ability to repay short-termdebt by third party rating agencies.
Risks may arise as a result of the failure of the counterparty to a swap contract to comply with the terms of the swap contract. Theloss incurred by the failure of counterparty is generally limited to the aggregate of the unrealized appreciation on the swap contractsin an unrealized appreciation position as well as any collateral posted with the counterparty. Therefore, the Fund considers thecreditworthiness of each counterparty to a swap contract in evaluating potential credit risk.
352

Notes to Financial Statements December 31, 2012
In a repurchase agreement, the Fund delivers a financial instrument to a counterparty with an agreement to purchase the samefinancial instrument back from the purchaser at an agreed upon price and date. In connection with the agreement, the Fundpledges collateral to the counterparty made up of cash, securities issued by the U.S. government or its agencies or sponsoredentities, commercial paper, corporate debt obligations, or other financial instruments. Collateral is marked-to-market daily andadditional collateral is pledged as required by the counterparty. In connection with such agreements, if the counterparty defaults orenters an insolvency proceeding, return of the collateral may be delayed or limited.
The tables below summarize information on credit ratings of the Funds’ holdings for those Funds that had direct investments in debtsecurities and derivatives as at December 31, 2012 and December 31, 2011, respectively:
As at December 31, 2012
Fund
A/A3
(%)1AA/Aa3
(%)1AAA/Aaa3
(%)1BBB/Bbb3
(%)1P-1/P-2 (Forwards)4
(%)2Total
(%)
BlackRock Canada Universe Bond Index Fund 22.4 22.6 47.0 8.0 - 100.0BlackRock Canada ex-BBB Universe Bond Index Fund 24.7 24.5 50.8 - - 100.0BlackRock Canada Real Return Bond Index Fund 7.6 6.8 85.6 - - 100.0BlackRock Canada Long Bond Index Fund 37.8 28.9 33.3 - - 100.0BlackRock Canada Long Government Bond Index Fund 26.3 33.6 40.1 - - 100.0BlackRock Canada All Government Bond Index Fund 15.6 19.8 64.6 - - 100.0BlackRock Canada Credit-Screened Bond Index Fund 40.9 27.6 4.0 27.5 - 100.0BlackRock Canada CoreActive Universe Bond Fund 20.1 23.2 47.6 9.1 - 100.0BlackRock Canada CorePlus Long Bond Fund 34.9 26.6 30.9 7.6 - 100.0BlackRock Canada CorePlus Universe Bond Fund 22.8 22.6 47.2 7.4 - 100.0
Fund
A/A3
(%)1AA/Aa3
(%)1AAA/Aaa3
(%)1BBB/Bbb3
(%)1P-1/P-2 (Forwards)4
(%)2Total
(%)
BlackRock CDN US Equity Index Hedged Non-Taxable Fund - - - - 100.0 100.0BlackRock CDN US Alpha Tilts Hedged Non-Taxable Fund - - - - 100.0 100.0BlackRock Canada CorePlus Long Bond Fund - - - - 100.0 100.0BlackRock Canada CorePlus Universe Bond Fund - - - - 100.0 100.0BlackRock CDN Global Market Selection Fund - - - - 100.0** -BlackRock CDN MSCI EAFE Index Hedged Fund - - - - 100.0 100.0
As at December 31, 2012
Fund
Aa14
(%)
Aa24
(%)
Aa34
(%)
Aaa4
(%)
P-14
(%)
NR
(%)
Total
(%)
BlackRock Canada Levered Long Bond Index Fund - 100.0* - - - - 100.0BlackRock Canada Levered Real Return Bond Index Fund - 100.0* - - - - 100.0BlackRock CDN Short Term Index Fund - - - 10.1 19.4 70.5 100.0
As at December 31, 2011
Fund
A/A3
(%)1AA/Aa3
(%)1AAA/Aaa3
(%)1BBB/Bbb3
(%)1P-1 (Forwards)4
(%)2Total
(%)
BlackRock Canada Universe Bond Index Fund 19.1 23.0 50.6 7.3 - 100.0BlackRock Canada ex-BBB Universe Bond Index Fund 20.5 25.2 54.3 - - 100.0BlackRock Canada Real Return Bond Index Fund 8.9 7.8 83.3 - - 100.0BlackRock Canada Long Bond Index Fund 34.5 30.3 35.1 0.1 - 100.0BlackRock Canada Long Government Bond Index Fund 23.1 34.4 42.5 - - 100.0BlackRock Canada All Government Bond Index Fund 12.6 19.8 67.6 - - 100.0BlackRock Canada Credit-Screened Bond Index Fund 39.0 26.4 1.9 32.7 - 100.0BlackRock Canada CoreActive Universe Bond Fund 20.1 23.4 42.6 13.9 - 100.0BlackRock Canada CorePlus Long Bond Fund 34.5 29.1 29.1 7.3 - 100.0BlackRock Canada CorePlus Universe Bond Fund 19.7 23.7 50.2 6.4 - 100.0
353
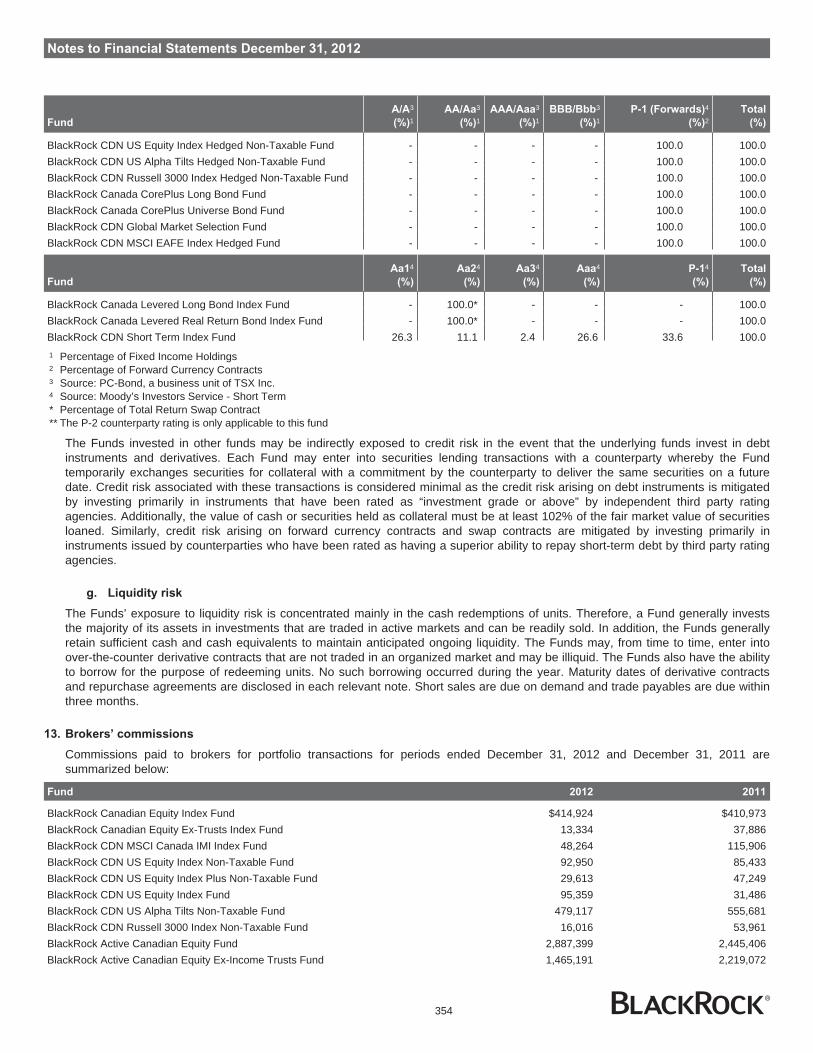
Notes to Financial Statements December 31, 2012
Fund
A/A3
(%)1AA/Aa3
(%)1AAA/Aaa3
(%)1BBB/Bbb3
(%)1P-1 (Forwards)4
(%)2Total
(%)
BlackRock CDN US Equity Index Hedged Non-Taxable Fund - - - - 100.0 100.0BlackRock CDN US Alpha Tilts Hedged Non-Taxable Fund - - - - 100.0 100.0BlackRock CDN Russell 3000 Index Hedged Non-Taxable Fund - - - - 100.0 100.0BlackRock Canada CorePlus Long Bond Fund - - - - 100.0 100.0BlackRock Canada CorePlus Universe Bond Fund - - - - 100.0 100.0BlackRock CDN Global Market Selection Fund - - - - 100.0 100.0BlackRock CDN MSCI EAFE Index Hedged Fund - - - - 100.0 100.0
Fund
Aa14
(%)
Aa24
(%)
Aa34
(%)
Aaa4
(%)
P-14
(%)
Total
(%)
BlackRock Canada Levered Long Bond Index Fund - 100.0* - - - 100.0BlackRock Canada Levered Real Return Bond Index Fund - 100.0* - - - 100.0BlackRock CDN Short Term Index Fund 26.3 11.1 2.4 26.6 33.6 100.01 Percentage of Fixed Income Holdings2 Percentage of Forward Currency Contracts3 Source: PC-Bond, a business unit of TSX Inc.4 Source: Moody’s Investors Service - Short Term* Percentage of Total Return Swap Contract** The P-2 counterparty rating is only applicable to this fund
The Funds invested in other funds may be indirectly exposed to credit risk in the event that the underlying funds invest in debtinstruments and derivatives. Each Fund may enter into securities lending transactions with a counterparty whereby the Fundtemporarily exchanges securities for collateral with a commitment by the counterparty to deliver the same securities on a futuredate. Credit risk associated with these transactions is considered minimal as the credit risk arising on debt instruments is mitigatedby investing primarily in instruments that have been rated as “investment grade or above” by independent third party ratingagencies. Additionally, the value of cash or securities held as collateral must be at least 102% of the fair market value of securitiesloaned. Similarly, credit risk arising on forward currency contracts and swap contracts are mitigated by investing primarily ininstruments issued by counterparties who have been rated as having a superior ability to repay short-term debt by third party ratingagencies.
g. Liquidity risk
The Funds’ exposure to liquidity risk is concentrated mainly in the cash redemptions of units. Therefore, a Fund generally investsthe majority of its assets in investments that are traded in active markets and can be readily sold. In addition, the Funds generallyretain sufficient cash and cash equivalents to maintain anticipated ongoing liquidity. The Funds may, from time to time, enter intoover-the-counter derivative contracts that are not traded in an organized market and may be illiquid. The Funds also have the abilityto borrow for the purpose of redeeming units. No such borrowing occurred during the year. Maturity dates of derivative contractsand repurchase agreements are disclosed in each relevant note. Short sales are due on demand and trade payables are due withinthree months.
13. Brokers’ commissions
Commissions paid to brokers for portfolio transactions for periods ended December 31, 2012 and December 31, 2011 aresummarized below:
Fund 2012 2011
BlackRock Canadian Equity Index Fund $414,924 $410,973BlackRock Canadian Equity Ex-Trusts Index Fund 13,334 37,886BlackRock CDN MSCI Canada IMI Index Fund 48,264 115,906BlackRock CDN US Equity Index Non-Taxable Fund 92,950 85,433BlackRock CDN US Equity Index Plus Non-Taxable Fund 29,613 47,249BlackRock CDN US Equity Index Fund 95,359 31,486BlackRock CDN US Alpha Tilts Non-Taxable Fund 479,117 555,681BlackRock CDN Russell 3000 Index Non-Taxable Fund 16,016 53,961BlackRock Active Canadian Equity Fund 2,887,399 2,445,406BlackRock Active Canadian Equity Ex-Income Trusts Fund 1,465,191 2,219,072
354

Notes to Financial Statements December 31, 2012
Fund 2012 2011
BlackRock Active Canadian Equity DC Fund $1,054,977 $808,844BlackRock Active Canadian Equity Small Cap Fund 404,839 504,690BlackRock Canada Alpha Advantage Fund 819,734 75,214BlackRock Canada CoreActive Universe Bond Fund 13,359 14,061BlackRock Canada CorePlus Long Bond Fund - 36,085BlackRock Canada CorePlus Universe Bond Fund 8,789 -BlackRock Balanced Moderate Index DC Fund 5,946 7,379BlackRock Balanced Conservative Index DC Fund 2,658 4,005BlackRock Balanced Aggressive Index DC Fund 1,271 1,757BlackRock CDN LifePath Retirement Index Fund I 35,460 12,217BlackRock CDN LifePath Index 2010 Retirement Fund 24,721 4,582BlackRock CDN LifePath 2015 Index Fund 94,659 28,015BlackRock CDN LifePath 2020 Index Fund 190,584 37,290BlackRock CDN LifePath 2025 Index Fund 143,104 36,532BlackRock CDN LifePath 2030 Index Fund 129,641 27,955BlackRock CDN LifePath 2035 Index Fund 74,206 18,656BlackRock CDN LifePath 2040 Index Fund 56,455 13,453BlackRock CDN LifePath 2045 Index Fund 30,310 8,160BlackRock CDN LifePath 2050 Index Fund 171 -BlackRock Balanced Active Fund 174 784BlackRock CDN MSCI EAFE Equity Index Fund 263,213 415,239BlackRock CDN MSCI ACWI ex-Canada Index Fund 10,134 3,969BlackRock CDN MSCI Emerging Markets Index Fund 57,356 135,892BlackRock CDN MSCI EAFE Index Plus Fund 89,428 129,698BlackRock CDN Global Equity Focus Fund 180,497 66,066BlackRock CDN Global Developed Real Estate Index Fund 171,533 -BlackRock CDN Global Infrastructure Equity Index Fund 80,022 -BlackRock CDN Emerging Markets Fundamental Index Fund 112,647 125,514
14. Independent review committee
On behalf of the Funds, BlackRock Canada has established an independent review committee (“IRC”) pursuant to the requirementsof the regulatory relief obtained by BlackRock Canada. Under the terms of the regulatory relief, BlackRock Canada is required topresent conflicts of interest relating to trades in securities of related issuers and inter-fund trading to the IRC for its approval. TheIRC is governed by certain provisions of National Instrument 81-107 – Independent Review Committee for Investment Funds (“NI81-107”) in determining whether to provide its approval. In accordance with the applicable requirements of NI 81-107, the IRC hasconsidered and provided its approval and has provided standing instructions which BlackRock Canada can rely upon in respect ofthese two conflicts of interest matters. Fees and expenses incurred with respect to the IRC are permitted to be charged to theFunds.
15. Comparative figures
Certain comparative figures have been reclassified to conform to the current year’s financial statement presentation.
16. Future accounting change – transition to International Financial Reporting Standards (“IFRS”)
On December 12, 2011, the Canadian Accounting Standards Board (“AcSB”) extended the deferral of the mandatory InternationalFinancial Reporting Standards (“IFRS”) changeover date for investment companies to fiscal year beginning on or after January 1,2014.Management has been monitoring developments in the IFRS conversion program and has been assessing the likely impacts onimplementation decisions, internal controls, information systems and training. In May 2011, the IASB issued IFRS 13 Fair ValueMeasurement, which defines fair value, sets out a single IFRS framework for measuring fair value and requires disclosure about fairvalue measurements. It only applies when other IFRSs require or permit fair value measurement. If an asset or liability measured atfair value has a bid price and an ask price, it requires valuation to be based on a price within the bid-ask spread that is mostrepresentative of fair value. It allows the use of mid-market pricing or other pricing conventions that are used by market participantsas a practical expedient for fair value measurements within a bid-ask spread. This may result in elimination of the differencesbetween the net assets per unit and NAV per unit at the financial statement reporting dates.
355

Notes to Financial Statements December 31, 2012
Based on management’s current assessment of the differences between Canadian GAAP and IFRS, other than the impact due toIFRS 13 noted above, BlackRock Canada has determined that there will likely be no material impact to the net asset value per unitfrom the changeover to IFRS. This current assessment may change if new standards are issued or if interpretations of existingstandards are revised. The impact of IFRS on accounting policies and implementation decisions will mainly be in the additionalinformation disclosures in the notes to financial statements and modified presentation and/or additional schedules which may haveto be included. As a result of the IFRS changeover, the Funds will be required to present a statement of cash flows.
356

March 22, 2013
Independent Auditor’s Report
To the Unitholders and Trustee of
BlackRock Canadian Equity Index FundBlackRock Canadian Equity Ex-Trusts Index FundBlackRock CDN MSCI Canada IMI Index FundBlackRock CDN US Equity Index Non-Taxable FundBlackRock CDN US Equity Index Plus Non-Taxable FundBlackRock CDN US Equity Index Hedged Non-Taxable FundBlackRock CDN US Equity Index FundBlackRock CDN US Alpha Tilts Non-Taxable FundBlackRock CDN US Alpha Tilts Hedged Non-Taxable FundBlackRock CDN Russell 3000 Index Non-Taxable FundBlackRock Active Canadian Equity FundBlackRock Active Canadian Equity Ex-Income Trusts FundBlackRock Active Canadian Equity DC FundBlackRock Active Canadian Equity Small Cap FundBlackRock Canada Alpha Advantage FundBlackRock Canada Universe Bond Index FundBlackRock Canada ex-BBB Universe Bond Index FundBlackRock Canada Real Return Bond Index FundBlackRock Canada Long Bond Index FundBlackRock Canada Long Government Bond Index FundBlackRock Canada All Government Bond Index FundBlackRock Canada Credit-Screened Bond Index FundBlackRock Canada CoreActive Universe Bond FundBlackRock Canada CorePlus Long Bond FundBlackRock Canada CorePlus Universe Bond FundBlackRock Canada Levered Long Bond Index FundBlackRock Canada Levered Real Return Bond Index FundBlackRock Balanced Moderate Index DC FundBlackRock Balanced Conservative Index DC FundBlackRock Balanced Aggressive Index DC FundBlackRock CDN LifePath Retirement Index Fund IBlackRock CDN LifePath Index 2010 Retirement FundBlackRock CDN LifePath 2015 Index FundBlackRock CDN LifePath 2020 Index FundBlackRock CDN LifePath 2025 Index Fund
PricewaterhouseCoopers LLPPwC Tower, 18 York Street, Suite 2600, Toronto, Ontario, Canada M5J 0B2T: +1 416 863 1133, F: +1 416 365 8215, www.pwc.com/ca
“PwC” refers to PricewaterhouseCoopers LLP, an Ontario limited liability partnership.
357
BlackRock CDN LifePath 2030 Index FundBlackRock CDN LifePath 2035 Index FundBlackRock CDN LifePath 2040 Index FundBlackRock CDN LifePath 2045 Index FundBlackRock CDN LifePath 2050 Index FundBlackRock Balanced Active FundBlackRock CDN Global Market Selection FundBlackRock CDN Short Term Index FundBlackRock CDN MSCI EAFE Equity Index FundBlackRock CDN MSCI EAFE Index Hedged FundBlackRock CDN MSCI ACWI ex-Canada Index FundBlackRock CDN MSCI Emerging Markets Index FundBlackRock CDN MSCI EAFE Equity Index Plus FundBlackRock CDN Global Equity Focus FundBlackRock CDN Global Developed Real Estate Index FundBlackrock CDN Global Infrastructure Equity Index FundBlackRock CDN Emerging Markets Fundamental Index Fund (formerly Claymore Emerging Markets Index Fund)(collectively the Funds)
We have audited the accompanying financial statements of each of the Funds, which comprise the statement of investment portfolioas at December 31, 2012, the statements of net assets and the statements of operations, cash flows, where applicable, and changes innet assets as at and for the periods as indicated in note 1, except for the BlackRock CDN Emerging Markets Fundamental IndexFund which is as at and for the year ended December 31, 2012, and the related notes, which comprise a summary of significantaccounting policies and other explanatory information.
Management’s responsibility for the financial statementsManagement is responsible for the preparation and fair presentation of the financial statements of each of the Funds in accordancewith Canadian generally accepted accounting principles, and for such internal control as management determines is necessary toenable the preparation of financial statements that are free from material misstatement, whether due to fraud or error.
Auditor’s responsibilityOur responsibility is to express an opinion on the financial statements of each of the Funds based on our audits. We conducted ouraudits in accordance with Canadian generally accepted auditing standards. Those standards require that we comply with ethicalrequirements and plan and perform the audit to obtain reasonable assurance about whether the financial statements are free frommaterial misstatement.
An audit involves performing procedures to obtain audit evidence about the amounts and disclosures in the financial statements. Theprocedures selected depend on the auditor’s judgment, including the assessment of the risks of material misstatement of the financialstatements, whether due to fraud or error. In making those risk assessments, the auditor considers internal control relevant to theentity’s preparation and fair presentation of the financial statements in order to design audit procedures that are appropriate in thecircumstances, but not for the purpose of expressing an opinion on the effectiveness of the entity’s internal control. An audit alsoincludes evaluating the appropriateness of accounting policies used and the reasonableness of accounting estimates made bymanagement, as well as evaluating the overall presentation of the financial statements.
358

We believe that the audit evidence we have obtained in each of our audits is sufficient and appropriate to provide a basis for ouraudit opinion.
OpinionIn our opinion, the financial statements of each of the Funds present fairly, in all material respects, the financial position of each ofthe Funds and the results of each of their operations and the changes in each of their net assets as at and for the periods indicated innote 1 except for the BlackRock CDN Emerging Markets Fundamental Index Fund which is as at and for the year endedDecember 31, 2012 in accordance with Canadian generally accepted accounting principles.
Other Matters
The financial statements of the BlackRock CDN Emerging Markets Fundamental Index Fund for the year ended December 31, 2011,were audited by another auditor who expressed an unmodified opinion on those statements on March 29, 2012.
Chartered Accountants, Licensed Public Accountants
359