blending tradition with innovation - arizona … · new perspectives robert j. linssen robert j....
TRANSCRIPT

BLENDING TRADITION WITH INNOVATION
ARIZONA POWER AUTHORITY ANNUAL R E P O R T45TH
TABLE OF CONTENTS
LETTER TO THE GOVERNOR . . . . . . . . . . . . . . . . . . . . . . . . . . . . . . . . . . . . . . . . . . . . . . . . . . . . . . . . . . . . . . . .2
REPORT OF THE EXECUTIVE DIRECTOR . . . . . . . . . . . . . . . . . . . . . . . . . . . . . . . . . . . . . . . . . . . . . . . . . . . . . . .3
REPORT OF THE COMMISSION . . . . . . . . . . . . . . . . . . . . . . . . . . . . . . . . . . . . . . . . . . . . . . . . . . . . . . . . . . . . . .5
NEW PERSPECTIVES . . . . . . . . . . . . . . . . . . . . . . . . . . . . . . . . . . . . . . . . . . . . . . . . . . . . . . . . . . . . . . . . . . . . .6
OPERATIONS AND THE ENVIRONMENT . . . . . . . . . . . . . . . . . . . . . . . . . . . . . . . . . . . . . . . . . . . . . . . . . . . . . . . .7
SCHEDULE OF CAPACITY AND ENERGY SALES . . . . . . . . . . . . . . . . . . . . . . . . . . . . . . . . . . . . . . . . . . . . . . . . . .8
FINANCIALS 2003 . . . . . . . . . . . . . . . . . . . . . . . . . . . . . . . . . . . . . . . . . . . . . . . . . . . . . . . . . . . . . . . . . . . . . . .9
REPORT OF INDEPENDENT ACCOUNTANTS . . . . . . . . . . . . . . . . . . . . . . . . . . . . . . . . . . . . . . . . . . . . . . . . . . . .10
MANAGEMENT’S DISCUSSION AND ANALYSIS . . . . . . . . . . . . . . . . . . . . . . . . . . . . . . . . . . . . . . . . . . . . . . . . .11(REQUIRED SUPPLEMENTARY INFORMATION)
FINANCIAL STATEMENTS . . . . . . . . . . . . . . . . . . . . . . . . . . . . . . . . . . . . . . . . . . . . . . . . . . . . . . . . . . . . . . . . . .17
DEBT SERVICE COVERAGE RATIO . . . . . . . . . . . . . . . . . . . . . . . . . . . . . . . . . . . . . . . . . . . . . . . . . . . . . . . . . . . .29
1
LETTER TO THE GOVERNOR
December 1, 2003
The Honorable
Janet A. Napolitano
Governor of Arizona
State Capitol
Ninth Floor, West Wing
Phoenix, AZ 85007
Dear Governor:
This 45th Annual Report of the Arizona Power Authority details the Authority’s operational
and financial activities for the fiscal year ending June 30, 2003. This Annual Report highlights
the Authority’s efforts in blending its traditional stewardship of the state’s power entitlement
from federal generation with the encouragement of new technologies. The Authority remains
a forward-looking power participant in the Southwest.
The Authority continues to assure reliable energy to its customers at one of the lowest rates in
the nation, through its active role in Hoover Dam’s engineering and operating functions. In
addition, the Authority is helping to define the role of public power within the new deregulated
utility environment in Arizona.
As Arizona’s power needs and capabilities continue to evolve, the Authority remains focused
on its original mandate—to provide the greatest public service through the best use of all power
resources available.
Sincerely,
Michael C. Francis
Chairman
2
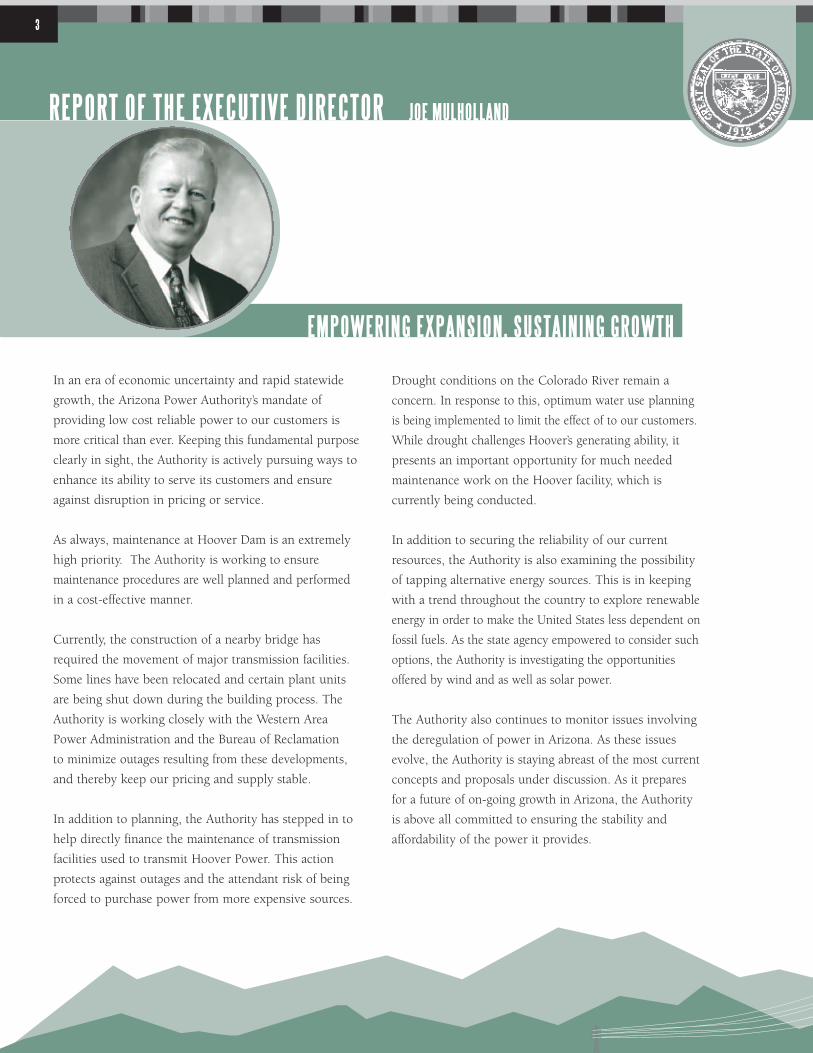
REPORT OF THE EXECUTIVE DIRECTOR
EMPOWERING EXPANSION, SUSTAINING GROWTH
In an era of economic uncertainty and rapid statewide
growth, the Arizona Power Authority’s mandate of
providing low cost reliable power to our customers is
more critical than ever. Keeping this fundamental purpose
clearly in sight, the Authority is actively pursuing ways to
enhance its ability to serve its customers and ensure
against disruption in pricing or service.
As always, maintenance at Hoover Dam is an extremely
high priority. The Authority is working to ensure
maintenance procedures are well planned and performed
in a cost-effective manner.
Currently, the construction of a nearby bridge has
required the movement of major transmission facilities.
Some lines have been relocated and certain plant units
are being shut down during the building process. The
Authority is working closely with the Western Area
Power Administration and the Bureau of Reclamation
to minimize outages resulting from these developments,
and thereby keep our pricing and supply stable.
In addition to planning, the Authority has stepped in to
help directly finance the maintenance of transmission
facilities used to transmit Hoover Power. This action
protects against outages and the attendant risk of being
forced to purchase power from more expensive sources.
Drought conditions on the Colorado River remain a
concern. In response to this, optimum water use planning
is being implemented to limit the effect of to our customers.
While drought challenges Hoover’s generating ability, it
presents an important opportunity for much needed
maintenance work on the Hoover facility, which is
currently being conducted.
In addition to securing the reliability of our current
resources, the Authority is also examining the possibility
of tapping alternative energy sources. This is in keeping
with a trend throughout the country to explore renewable
energy in order to make the United States less dependent on
fossil fuels. As the state agency empowered to consider such
options, the Authority is investigating the opportunities
offered by wind and as well as solar power.
The Authority also continues to monitor issues involving
the deregulation of power in Arizona. As these issues
evolve, the Authority is staying abreast of the most current
concepts and proposals under discussion. As it prepares
for a future of on-going growth in Arizona, the Authority
is above all committed to ensuring the stability and
affordability of the power it provides.
JOE MULHOLLAND
3
ANNUAL REPORT 2003
4
REPORT OF THE COMMISSION
MICHAEL C. FRANCISMichael Francis began his tenure
on the Commission in 1999, and
his current term extends until
2008. Mr. Francis assumed the
Chair in April with the passing of
Jewell Lewis. He was elected to
the Chair in May. He is also a
partner in Santa Lucia Farms,
which produces more than 3.7-
million garden rose bushes
annually. In addition to farming,
Francis owns and operates Francis
Insurance Agency, which writes
insurance for Arizona and
California farmers. A member of
the American Rose Society, Mr.
Francis is a member of the M&I
Thunderbird Bank Board of
Directors Arizona Region.
LT GEN JOHN I. HUDSONVice Chairman John Hudson
was first appointed to the Arizona
Power Authority Commission
in March 2000. Gen. Hudson
was elected to the Vice Chair in
May 2003 with his current term
expiring in 2006. John Hudson
is a member of the Board of
Directors of the Yuma Regional
Medical Center, member and past
chairman of the Greater Yuma
Port Authority Board of Directors,
a founding Director of the
Foothills Bank of Yuma, a member
of the Foothills Rotary Club of
Yuma and past president of Yuma’s
78-CRIME Board of Directors.
General Hudson served in the
U.S. Marine Corps for 37 years.
RICHARD S. WALDENRichard (Dick) Walden was appointed
to the Commission in 1984 and
re-appointed through his present
term expiring in 2010. He is also
a member of the Advisory Council
on Small Business and Agriculture
for the Federal Reserve Bank of
San Francisco. Mr. Walden is the
President and CEO of Farmers
Investment Co., a family-owned,
pecan growing and processing
company headquartered in
Sahuarita, Arizona. He is a member
of the board of International Tree
Nut Council and in that capacity
serves as the chairman of the
Committee for Nutrition and
Education associated with the
Nutrition and Education
Foundation. Dick is also a
member of the Board of National
Pecan Shellers Association.
DALTON H. COLEDalton Cole was appointed to
the Commission in January 2002.
His term will expire in 2008.
Mr. Cole is a retired businessman
and farmer. He has served as a
member of the Central Arizona
Water Conservation District
Board. He co-founded and
chaired the HoHoKam Irrigation
District. He served on the board
of Electrical District No. 2 in
Pinal County for 18 years and is
a past chairman. He is a past
president of the State Board of
Directors for Community
Colleges. He has served on the
Ground Water Management
Committee for Pinal County and
on advisory committees to the
Arizona Legislature regarding
water and power issues.
DELBERT R. LEWISCommissioner Lewis was
appointed to the Arizona Power
Commission in April 2003 to
complete the term of his wife,
the late Dr. Jewell Lewis. He has
been reappointed for a six-year
term ending in January 2010.
Commissioner Lewis is one of
the founders of KTVK Channel 3
and the CEO of MAC America
Communications, Inc. His past
and present civic affiliations
include the Arizona Broadcasters
Association, Metropolitan
Phoenix Broadcasters, Phoenix
Chamber of Commerce,
Samaritan Health Services,
Greater Phoenix Leadership, the
National Conference, Maricopa
County Sports Authority and
Orpheum Theatre Foundation.
Mr. Lewis and his late wife have
been nationally recognized for
their financial support and
commitment to education and
community service.
Since the Arizona Power Authority was established in 1944, it has been primarily responsible for
the stewardship of the State of Arizona’s allocation of federal power from Hoover Dam and Power
Plant. This stewardship was reaffirmed with the enactment of the Hoover Power Plant Act of 1984
and subsequent renewal of Arizona’s original Hoover power allocation and an additional allocation
of new Hoover power resulting from the uprating of the power plant equipment. While the
Authority continues to administer this valuable federal resource, it is also mindful of the growth
within the state resulting in increased demands for additional electrical power. The Authority is
actively researching and reviewing new technologies within the electric utility industry to provide
our customers with the most efficient and cost effective electrical power to meet their future needs
while maintaining a reliable and stable electrical system.
5

NEW PERSPECTIVES
ROBERT J. LINSSENRobert J. (Bob) Linssen is
Director of Engineering
and Operations. Bob has
a Bachelor of Electrical
Engineering degree and a
Master of Science degree
in Business Management.
He comes to the Arizona
Power Authority with over
thirty-six years of utility
industry experience,
as well as four years of
experience in small business
management and financial
consulting. Bob has
always been active in the
community and is past
president of the North
Phoenix Chamber of
Commerce and past
president of the Paradise
Valley Rotary Club. He
also served four years on
the Phoenix Planning
Committee for the Paradise
Village Area. Bob is a
Registered Professional
Engineer in Arizona and
Wisconsin.
MARCIA KENNEDYMarcia Kennedy is the
APA’s Principal Analyst.
With over 25 years of
professional experience
in such industries as
advertising, law, financial
management and computer
software administration,
Marcia brings a depth of
business knowledge and
expertise to the Authority.
In addition, Marcia is an
adjunct business professor
at Southwestern College,
specializing in economics,
marketing and computer
courses. She holds a
Bachelor of Arts degree in
Music Education. In 2000,
Marcia completed an M.B.A.
degree in Finance and
International Management
with a study trip to
China. Marcia sings and
performs with the Arizona
Opera Chorus.
6
OPERATIONS & THE ENVIRONMENT
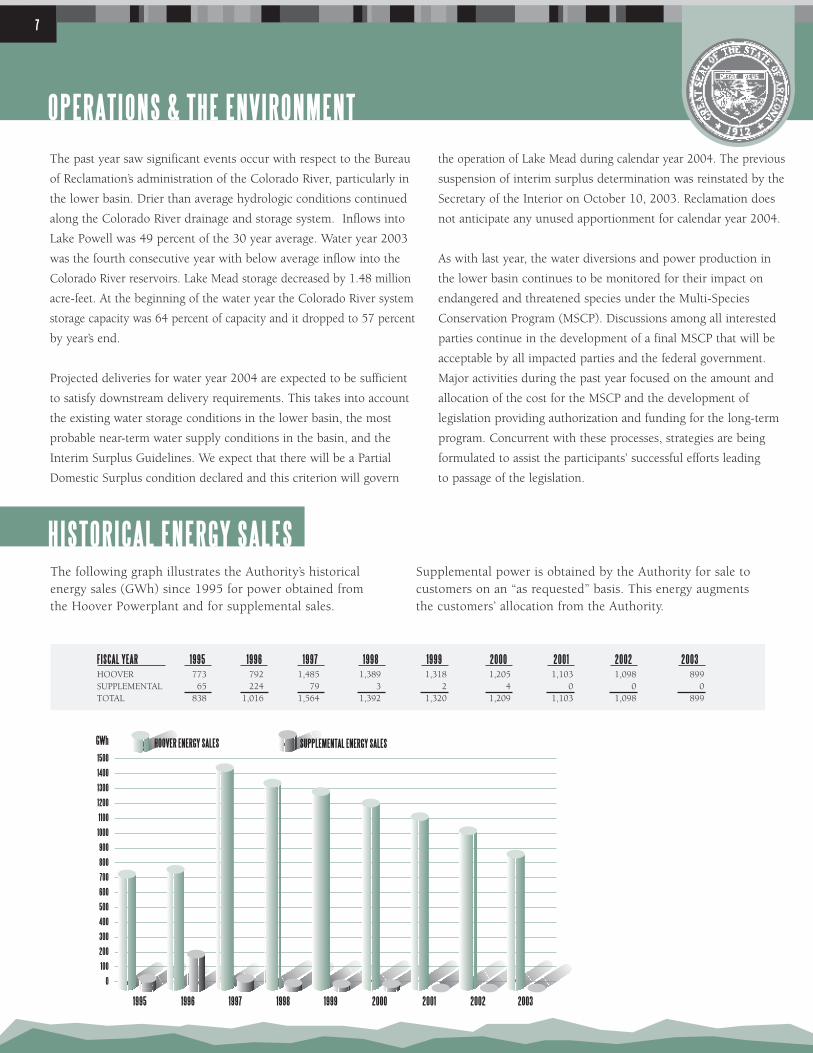
HISTORICAL ENERGY SALESThe following graph illustrates the Authority’s historical energy sales (GWh) since 1995 for power obtained from the Hoover Powerplant and for supplemental sales.
Supplemental power is obtained by the Authority for sale tocustomers on an “as requested” basis. This energy augmentsthe customers’ allocation from the Authority.
900
1000
1100
1200
1300
1400
1500
GWh
0
100
200
300
400
500
600
700
800
HOOVER ENERGY SALES SUPPLEMENTAL ENERGY SALES
19991998 2000 2001 2002 20031996 19971995
FISCAL YEAR 1995 1996 1997 1998 1999 2000 2001 2002 2003HOOVER 773 792 1,485 1,389 1,318 1,205 1,103 1,098 899SUPPLEMENTAL 65 224 79 3 2 4 0 0 0TOTAL 838 1,016 1,564 1,392 1,320 1,209 1,103 1,098 899
The past year saw significant events occur with respect to the Bureau
of Reclamation’s administration of the Colorado River, particularly in
the lower basin. Drier than average hydrologic conditions continued
along the Colorado River drainage and storage system. Inflows into
Lake Powell was 49 percent of the 30 year average. Water year 2003
was the fourth consecutive year with below average inflow into the
Colorado River reservoirs. Lake Mead storage decreased by 1.48 million
acre-feet. At the beginning of the water year the Colorado River system
storage capacity was 64 percent of capacity and it dropped to 57 percent
by year’s end.
Projected deliveries for water year 2004 are expected to be sufficient
to satisfy downstream delivery requirements. This takes into account
the existing water storage conditions in the lower basin, the most
probable near-term water supply conditions in the basin, and the
Interim Surplus Guidelines. We expect that there will be a Partial
Domestic Surplus condition declared and this criterion will govern
the operation of Lake Mead during calendar year 2004. The previous
suspension of interim surplus determination was reinstated by the
Secretary of the Interior on October 10, 2003. Reclamation does
not anticipate any unused apportionment for calendar year 2004.
As with last year, the water diversions and power production in
the lower basin continues to be monitored for their impact on
endangered and threatened species under the Multi-Species
Conservation Program (MSCP). Discussions among all interested
parties continue in the development of a final MSCP that will be
acceptable by all impacted parties and the federal government.
Major activities during the past year focused on the amount and
allocation of the cost for the MSCP and the development of
legislation providing authorization and funding for the long-term
program. Concurrent with these processes, strategies are being
formulated to assist the participants’ successful efforts leading
to passage of the legislation.
7
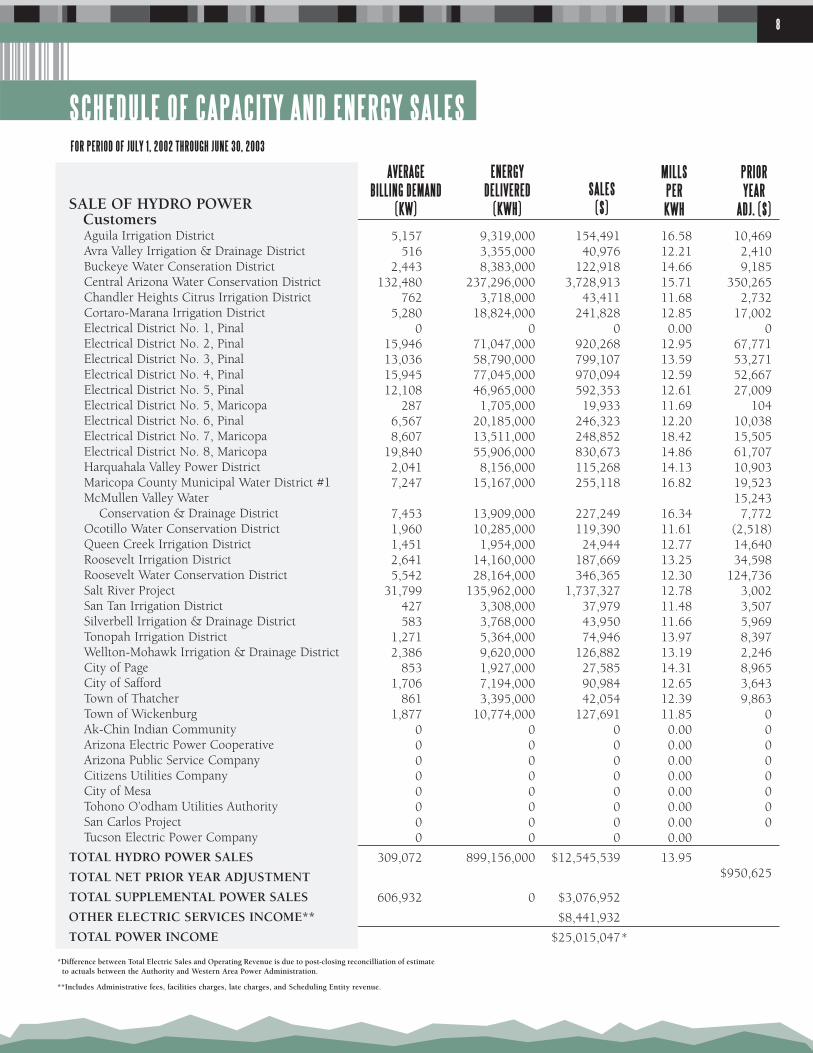
SCHEDULE OF CAPACITY AND ENERGY SALES
SALE OF HYDRO POWERCustomersAguila Irrigation DistrictAvra Valley Irrigation & Drainage DistrictBuckeye Water Conseration DistrictCentral Arizona Water Conservation DistrictChandler Heights Citrus Irrigation DistrictCortaro-Marana Irrigation DistrictElectrical District No. 1, PinalElectrical District No. 2, PinalElectrical District No. 3, PinalElectrical District No. 4, PinalElectrical District No. 5, PinalElectrical District No. 5, MaricopaElectrical District No. 6, PinalElectrical District No. 7, MaricopaElectrical District No. 8, MaricopaHarquahala Valley Power DistrictMaricopa County Municipal Water District #1McMullen Valley Water
Conservation & Drainage DistrictOcotillo Water Conservation DistrictQueen Creek Irrigation DistrictRoosevelt Irrigation DistrictRoosevelt Water Conservation DistrictSalt River ProjectSan Tan Irrigation DistrictSilverbell Irrigation & Drainage DistrictTonopah Irrigation DistrictWellton-Mohawk Irrigation & Drainage DistrictCity of PageCity of SaffordTown of ThatcherTown of WickenburgAk-Chin Indian CommunityArizona Electric Power CooperativeArizona Public Service CompanyCitizens Utilities CompanyCity of MesaTohono O’odham Utilities AuthoritySan Carlos ProjectTucson Electric Power Company
TOTAL HYDRO POWER SALES
TOTAL NET PRIOR YEAR ADJUSTMENT
TOTAL SUPPLEMENTAL POWER SALES
OTHER ELECTRIC SERVICES INCOME**
TOTAL POWER INCOME
AVERAGEBILLING DEMAND
(KW)
ENERGYDELIVERED
(KWH)
5,157 516
2,443 132,480
762 5,280
0 15,946 13,036 15,945 12,108
287 6,567 8,607
19,840 2,041 7,247
7,453 1,960 1,451 2,641 5,542
31,799 427 583
1,271 2,386
853 1,706
861 1,877
0 0 0 0 0 0 0 0
309,072
606,932
9,319,000 3,355,000 8,383,000
237,296,000 3,718,000
18,824,000 0
71,047,000 58,790,000 77,045,000 46,965,000
1,705,000 20,185,000 13,511,000 55,906,000
8,156,000 15,167,000
13,909,000 10,285,000
1,954,000 14,160,000 28,164,000
135,962,000 3,308,000 3,768,000 5,364,000 9,620,000 1,927,000 7,194,000 3,395,000
10,774,000 0 0 0 0 0 0 0 0
899,156,000
0
SALES($)
154,491 40,976
122,918 3,728,913
43,411 241,828
0 920,268 799,107 970,094 592,353
19,933 246,323 248,852 830,673 115,268 255,118
227,249 119,390
24,944 187,669 346,365
1,737,327 37,979 43,950 74,946
126,882 27,585 90,984 42,054
127,691 0 0 0 0 0 0 0 0
$12,545,539
$3,076,952
$8,441,932
$25,015,047
MILLSPER
KWH
16.58 12.21 14.66 15.71 11.68 12.85
0.00 12.95 13.59 12.59 12.61 11.69 12.20 18.42 14.86 14.13 16.82
16.34 11.61 12.77 13.25 12.30 12.78 11.48 11.66 13.97 13.19 14.31 12.65 12.39 11.85
0.00 0.00 0.00 0.00 0.00 0.00 0.00 0.00
13.95
PRIORYEAR
ADJ. ($)
10,469 2,410 9,185
350,265 2,732
17,002 0
67,771 53,271 52,667 27,009
104 10,038 15,505 61,707 10,903 19,523 15,243
7,772 (2,518)14,640 34,598
124,736 3,002 3,507 5,969 8,397 2,246 8,965 3,643 9,863
0 0 0 0 0 0 0 0
$950,625
FOR PERIOD OF JULY 1, 2002 THROUGH JUNE 30, 2003
*
*Difference between Total Electric Sales and Operating Revenue is due to post-closing reconcilliation of estimateto actuals between the Authority and Western Area Power Administration.
**Includes Administrative fees, facilities charges, late charges, and Scheduling Entity revenue.
8
FINANCIALS 2003
FINANCIAL TABLE OF CONTENTS
REPORT OF INDEPENDENT ACCOUNTANTS . . . . . . . . . . . . . . . . . . . . . . . . . . . . . . . . . . . . . . . . . . . . . . . . . . . .10
MANAGEMENT’S DISCUSSION AND ANALYSIS . . . . . . . . . . . . . . . . . . . . . . . . . . . . . . . . . . . . . . . . . . . . . . . . .11(REQUIRED SUPPLEMENTARY INFORMATION)
FINANCIAL STATEMENTS . . . . . . . . . . . . . . . . . . . . . . . . . . . . . . . . . . . . . . . . . . . . . . . . . . . . . . . . . . . . . . . . . .17
STATEMENT OF NET ASSETS . . . . . . . . . . . . . . . . . . . . . . . . . . . . . . . . . . . . . . . . . . . . . . . . . . . . . . . . . . .17
STATEMENT OF REVENUES, EXPENSES AND CHANGES IN NET ASSETS . . . . . . . . . . . . . . . . . . . . . . . . . .18
STATEMENT OF CASH FLOW . . . . . . . . . . . . . . . . . . . . . . . . . . . . . . . . . . . . . . . . . . . . . . . . . . . . . . . . . . .19
NOTES TO FINANCIAL STATEMENTS . . . . . . . . . . . . . . . . . . . . . . . . . . . . . . . . . . . . . . . . . . . . . . . . . . . . . . . . .20
DEBT SERVICE COVERAGE RATIO . . . . . . . . . . . . . . . . . . . . . . . . . . . . . . . . . . . . . . . . . . . . . . . . . . . . . . . . . . . .29
9
REPORT OF INDEPENDENT ACCOUNTANTS
To the Arizona Power Authority Commission
In our opinion, the accompanying statements of net assets and the related statements of revenues, expenses,
and changes in net assets, and statements of cash flows present fairly, in all material respects, the financial
position of the Arizona Power Authority (A Body, Corporate and Politic, of the State of Arizona) at June 30,
2003 and 2002, and the results of its operations and its cash flows for the years then ended in conformity
with accounting principles generally accepted in the United States of America. These financial statements are
the responsibility of the Company’s management; our responsibility is to express an opinion on these financial
statements based on our audits. We conducted our audits of these statements in accordance with auditing
standards generally accepted in the United States of America, which require that we plan and perform the
audits to obtain reasonable assurance about whether the financial statements are free of material misstatement.
An audit includes examining, on a test basis, evidence supporting the amounts and disclosures in the financial
statements, assessing the accounting principles used and significant estimates made by management, and
evaluating the overall financial statement presentation. We believe that our audits provide a reasonable basis
for our opinion.
As described in Note 1, the Authority adopted the provisions of the Governmental Accounting Standards
Board (“GASB”) Statement No. 34, Basic Financial Statements - and Management’s Discussion and Analysis -
for State and Local Governments, as amended by GASB Statement No. 37, Basic Financial Statements and
Management’s Discussion and Analysis - for State and Local Governments: Omnibus - an Amendment of
GASB Statements No. 21 and No. 34 and GASB Statement No. 38, Certain Financial Statement Note
Disclosures, as of July 1, 2001. The management’s discussion and analysis is not a required part of the
financial statements but is supplementary information required by the Governmental Accounting Standards
Board. We have applied certain limited procedures, which consisted principally of inquiries of management
regarding the methods of measurement and presentation of the supplementary information. However,
we did not audit the information and express no opinion on it.
August 7, 2003, except as to the
last paragraph of Note 6 which is
as of October 1, 2003
10
MANAGEMENT'S DISCUSSION AND ANALYSISThe following is a discussion and analysis of the Arizona Power Authority’s (the “Authority”) financial performance for the
fiscal year ended June 30, 2003 and is designed to (a) assist the reader in focusing on significant financial issues, (b) provide
an overview of the Authority’s financial activity and (c) identify changes in the Authority’s financial position. Since the
Management’s Discussion and Analysis (“MD&A”) is designed to focus on the current year’s activities, resulting changes
and currently known facts, please read it in conjunction with the Authority’s financial statements beginning on page 17.
HIGHLIGHTSFINANCIAL HIGHLIGHTS
• The Authority’s net assets decreased by $193,259 or 6 percent due to a write-off of invested funds associated with investments made by the Arizona State Treasurer (“Treasurer”). See Authority Highlights below.
• The Authority’s revenue increased by $1,994,987 or 9 percent primarily due to an increase in the sale of supplementalpower. The sale and concomitant purchase of additional supplemental power resulted from additional customer energy requirements brought on by reduced Hoover power generation, which in turn was caused by the sustained drought currently being experienced throughout the Colorado River Basin. The Authority’s purchased power costs increased by $1,972,328 or 12 percent due to the increase in supplemental power purchases to support additional supplemental power sales. Operating income increased by $519,188 or 131 percent largely due to a reduction in other operating expenses.
AUTHORITY HIGHLIGHTS
Revised Scheduling Entity Agreement - The Authority and Salt River Project are parties to a Scheduling Entity
Agreement which expires on September 30, 2004. This Agreement provides for Salt River Project to pay the Authority
$8.4 million each year in return for allowing Salt River Project to be the Scheduling Entity of the Hoover generation in
Arizona. Negotiations are currently underway to extend this Agreement.
Transmission Agreement - On January 24, 2003, the Authority and the Western Area Power Administration (“Western”)
entered into an agreement for the Advancement of Funds for Transmission Services. The Authority had an existing agreement
with Western that provided for the delivery of power and energy. The new agreement provides for the Authority to
advance funds to Western on a monthly basis to fund operations, maintenance and replacement costs associated with
Western’s transmission services. As of June 30, 2003, the Authority recorded a prepaid deposit of $182,360, which is
included in the Statements of Net Assets.
Arizona State Treasurer Investment Write-Off - The Authority is statutorily required to invest certain funds through
the Treasurer who has sole investment decision-making authority. In November 2002, the Authority was advised that one
of the Treasurer’s chosen investments managed by National Century Financial Enterprises was under investigation for
fraud. In December 2002, the Authority was informed that the Treasurer was vitiating the investment in question, thereby
reducing the value to zero. Since that time, litigation was initiated and continues. There is no guarantee that the litigation
will result in the recovery of the Authority’s funds, which total $227,224. Therefore, the Authority has written-off the lost
investment amount as of June 30, 2003.
11

Effects of Drought on Hoover Energy - The Colorado River Basin has been experiencing severe drought conditions
for the past four years. As a result, reservoirs have been reduced and power production at Hoover Dam has decreased,
since it is dependent on water flows on the Colorado River. Several Authority customers requested that the Authority
purchase supplemental power to offset the reduced energy production at Hoover. The supplemental power costs are
significantly higher and are passed directly to the customers at cost. These supplemental revenues and costs are reflected
on the Authority’s books, resulting in much higher revenue and purchased power costs.
Other Changes That Will Improve or Provide Future Benefit to the Arizona Power Authority - No other agreements
or new customers were added during the current period. However, the Authority added new staff members during the
year bringing substantial experience and knowledge regarding the operations of power systems in the Southwest.
USING THIS ANNUAL REPORTThis annual report consists of a series of financial statements. The Statements of Net Assets, the Statements of Revenues,
Expenses and Changes in Net Assets and the Statements of Cash Flows (on pages 17 - 20 respectively) provide information
about the activities of the Authority as a whole and present a longer-term view of the Authority’s finances. The Authority
is a body, corporate and politic of the State of Arizona and is a special-purpose government engaged only in business-type
activities. Accordingly, the financial statements presented in this Annual Report are the required basic financial statements
in accordance with the provisions of Governmental Accounting Standards Board Statement No. 34, Basic Financial
Statements - and Management’s Discussion and Analysis - for State and Local Governments. There are six basic or normal
transactions that will affect the comparability of the Statements of Net Assets summary presentation:
Net Results of Activities - which will impact (increase/decrease) current assets and undesignated net assets.
Borrowing for Capital - which will increase assets and long-term debt.
Spending Borrowed Proceeds on New Capital - which will reduce current assets and increase capital assets. There is a second impact, an increase in invested capital assets and an increase in related net debt which will not change the investment in capital assets, net of debt.
Spending of Nonborrowed Current Assets on New Capital - which will (a) reduce current assets and increase capital assets and (b) will reduce undesignated net assets and increase investment in capital assets, net of debt.
Principal Payment on Debt - which will reduce current assets and reduce long-term debt.
Reduction of Capital Assets through Depreciation - which will reduce capital assets and investment in capital assets, net of debt.
OVERVIEW OF THE FINANCIAL STATEMENTSThis Discussion and Analysis is an introduction to the Authority’s basic financial statements, which are comprised of two components:
(1) Fund Financial Statements.(2) Notes to the Financial Statements.
Fund Financial Statements (Reporting on all of the Authority’s Funds.)
The Fund Financial Statements begin on page 17 and provide detailed information about the individual funds. A fund is afiscal and accounting entity with a self-balancing set of accounts that the Authority uses to keep track of specific sourcesof revenues and disbursements for specific purposes. The Authority’s funds are treated as proprietary and are enterprisein nature. Most of the Authority’s financial dealings are with contracts outside of state government. A separate fund is notmaintained for government activities. The Authority does not act as a fiduciary.
12
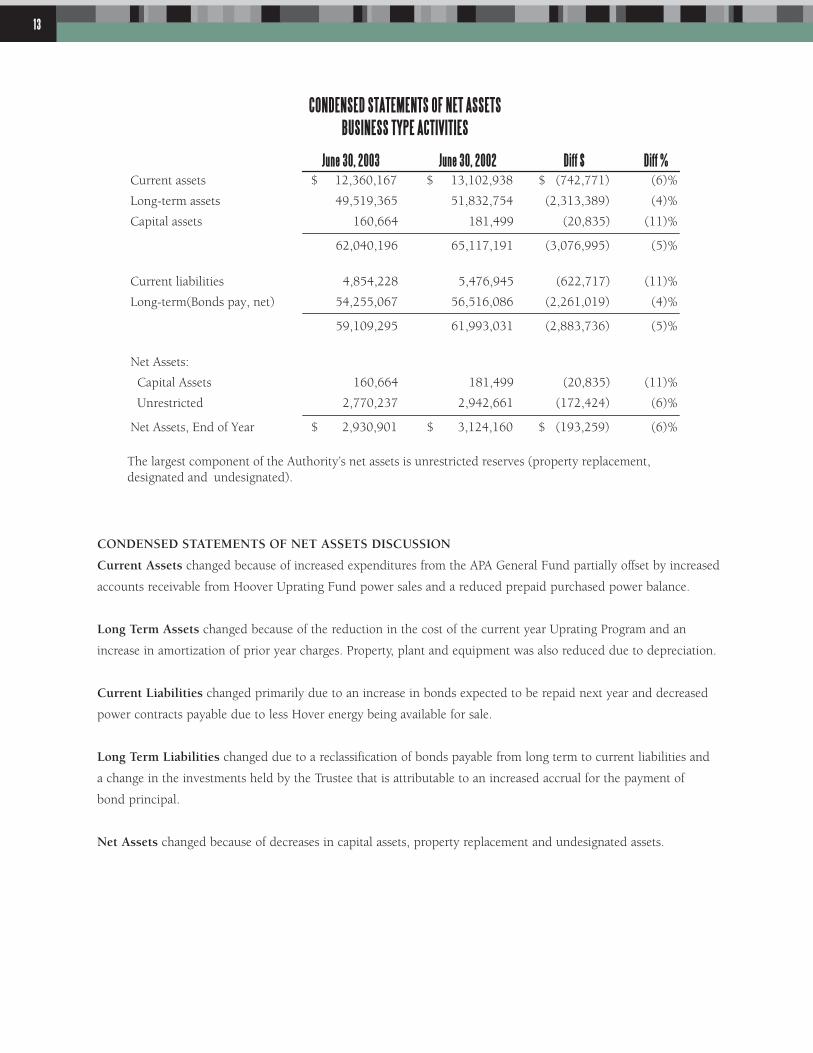
CONDENSED STATEMENTS OF NET ASSETSBUSINESS TYPE ACTIVITIES
June 30, 2003 June 30, 2002 Diff $ Diff %Current assets $ 12,360,167 $ 13,102,938 $ (742,771) (6)%
Long-term assets 49,519,365 51,832,754 (2,313,389) (4)%
Capital assets 160,664 181,499 (20,835) (11)%
62,040,196 65,117,191 (3,076,995) (5)%
Current liabilities 4,854,228 5,476,945 (622,717) (11)%
Long-term(Bonds pay, net) 54,255,067 56,516,086 (2,261,019) (4)%
59,109,295 61,993,031 (2,883,736) (5)%
Net Assets:
Capital Assets 160,664 181,499 (20,835) (11)%
Unrestricted 2,770,237 2,942,661 (172,424) (6)%
Net Assets, End of Year $ 2,930,901 $ 3,124,160 $ (193,259) (6)%
The largest component of the Authority’s net assets is unrestricted reserves (property replacement, designated and undesignated).
CONDENSED STATEMENTS OF NET ASSETS DISCUSSION
Current Assets changed because of increased expenditures from the APA General Fund partially offset by increased
accounts receivable from Hoover Uprating Fund power sales and a reduced prepaid purchased power balance.
Long Term Assets changed because of the reduction in the cost of the current year Uprating Program and an
increase in amortization of prior year charges. Property, plant and equipment was also reduced due to depreciation.
Current Liabilities changed primarily due to an increase in bonds expected to be repaid next year and decreased
power contracts payable due to less Hover energy being available for sale.
Long Term Liabilities changed due to a reclassification of bonds payable from long term to current liabilities and
a change in the investments held by the Trustee that is attributable to an increased accrual for the payment of
bond principal.
Net Assets changed because of decreases in capital assets, property replacement and undesignated assets.
13

There are six basic or normal transactions that will affect the comparability of the Statements of Changes in Net Assets
summary presentation.
REVENUES:
Economic Drought Condition - The sustained drought condition in the Colorado River Basin results in a decline in
power production from Hoover Dam and this has a substantial impact on Hoover generated power, supplemental power
consumption and rates for power sold.
Increase/Decrease in Commission Approved Power Rates - State statute requires rates to be set at levels to recover
the cost of supplying service. In addition, contracts between the Authority and its customers provide specific details
regarding rate determination. Consequently, the Arizona Power Authority’s Commission is solely responsible for
periodically modifying rates, as appropriate.
Market Impacts on Investment Income - Market conditions cause investment income to fluctuate more in the
long-term than alternative shorter-term options.
EXPENSES:
Introduction of New Programs - Individual programs may be added or deleted to meet changing Authority needs.
Increase/Decrease in Authorized Personnel - Changes in the Authority’s services may result in an increase/decrease
in authorized staffing. Staffing costs (salary and related benefits) represent 2.5 percent of the Authority’s operating costs.
Salary Increases (cost of living, merit and market adjustment) - The ability to attract and retain competent
personnel requires the Authority to provide a competitive salary structure.
14
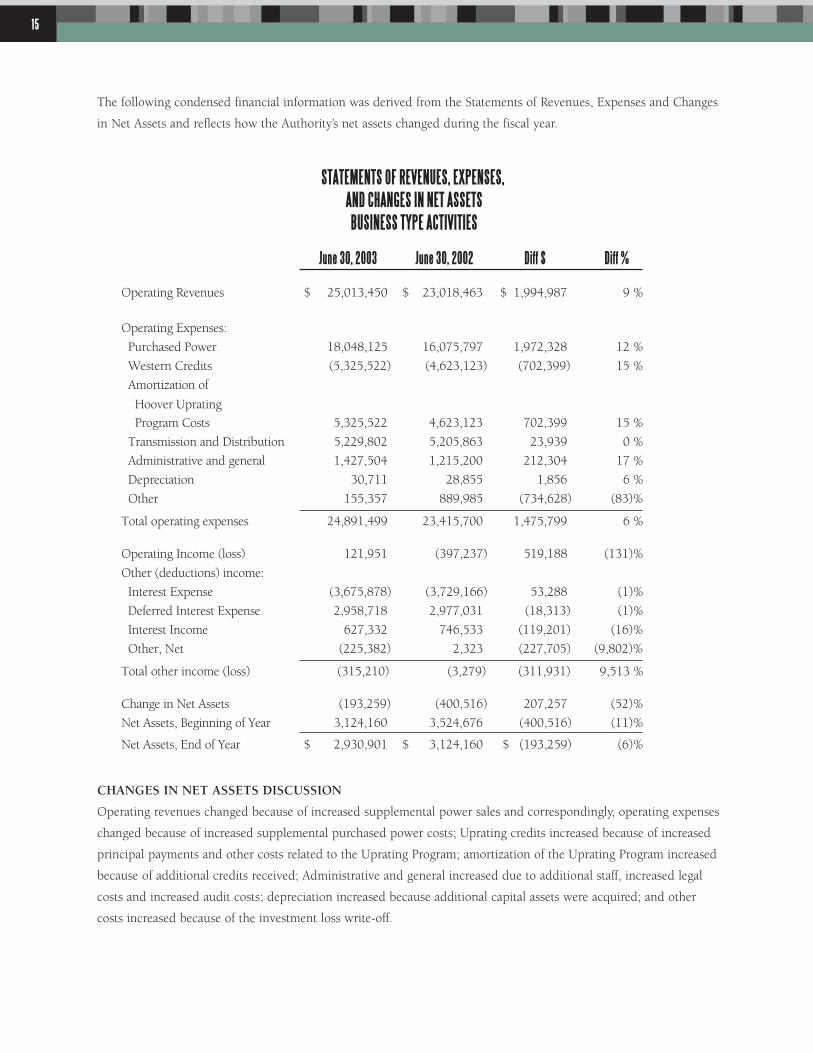
STATEMENTS OF REVENUES, EXPENSES, AND CHANGES IN NET ASSETS
BUSINESS TYPE ACTIVITIES
June 30, 2003 June 30, 2002 Diff $ Diff %
Operating Revenues $ 25,013,450 $ 23,018,463 $ 1,994,987 9 %
Operating Expenses:
Purchased Power 18,048,125 16,075,797 1,972,328 12 %
Western Credits (5,325,522) (4,623,123) (702,399) 15 %
Amortization of
Hoover Uprating
Program Costs 5,325,522 4,623,123 702,399 15 %
Transmission and Distribution 5,229,802 5,205,863 23,939 0 %
Administrative and general 1,427,504 1,215,200 212,304 17 %
Depreciation 30,711 28,855 1,856 6 %
Other 155,357 889,985 (734,628) (83)%
Total operating expenses 24,891,499 23,415,700 1,475,799 6 %
Operating Income (loss) 121,951 (397,237) 519,188 (131)%
Other (deductions) income:
Interest Expense (3,675,878) (3,729,166) 53,288 (1)%
Deferred Interest Expense 2,958,718 2,977,031 (18,313) (1)%
Interest Income 627,332 746,533 (119,201) (16)%
Other, Net (225,382) 2,323 (227,705) (9,802)%
Total other income (loss) (315,210) (3,279) (311,931) 9,513 %
Change in Net Assets (193,259) (400,516) 207,257 (52)%
Net Assets, Beginning of Year 3,124,160 3,524,676 (400,516) (11)%
Net Assets, End of Year $ 2,930,901 $ 3,124,160 $ (193,259) (6)%
The following condensed financial information was derived from the Statements of Revenues, Expenses and Changes
in Net Assets and reflects how the Authority’s net assets changed during the fiscal year.
CHANGES IN NET ASSETS DISCUSSION
Operating revenues changed because of increased supplemental power sales and correspondingly, operating expenses
changed because of increased supplemental purchased power costs; Uprating credits increased because of increased
principal payments and other costs related to the Uprating Program; amortization of the Uprating Program increased
because of additional credits received; Administrative and general increased due to additional staff, increased legal
costs and increased audit costs; depreciation increased because additional capital assets were acquired; and other
costs increased because of the investment loss write-off.
15
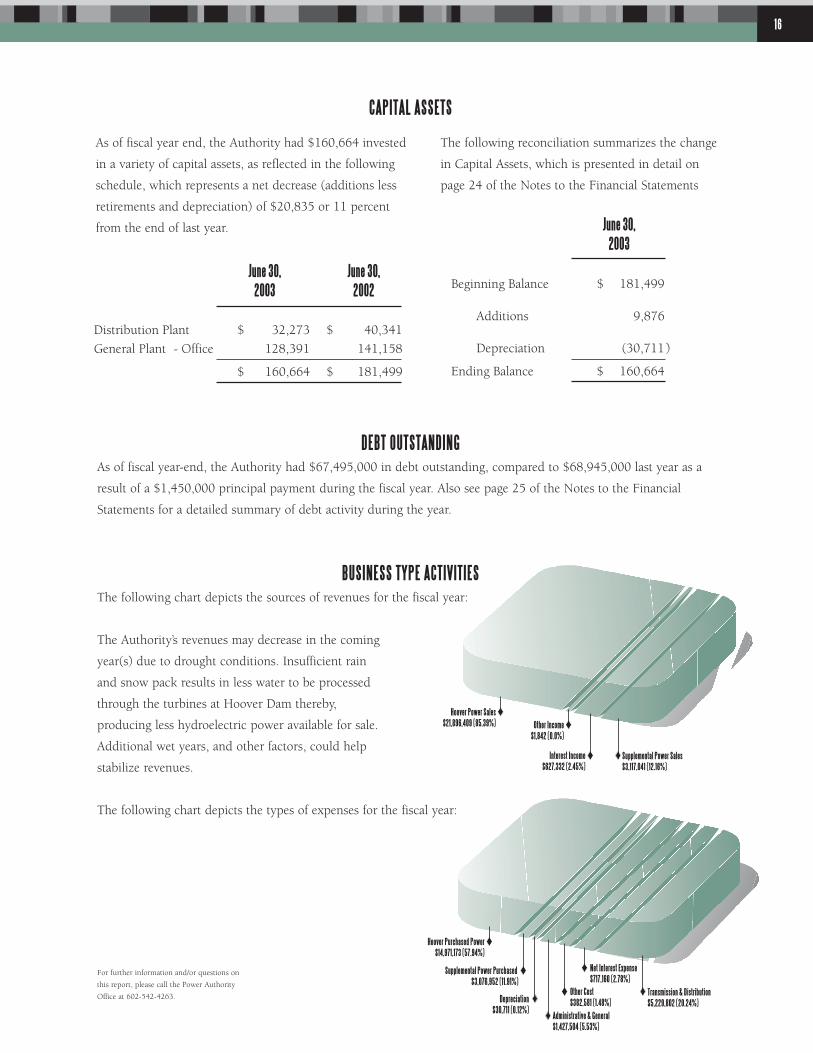
CAPITAL ASSETS
DEBT OUTSTANDINGAs of fiscal year-end, the Authority had $67,495,000 in debt outstanding, compared to $68,945,000 last year as a
result of a $1,450,000 principal payment during the fiscal year. Also see page 25 of the Notes to the Financial
Statements for a detailed summary of debt activity during the year.
BUSINESS TYPE ACTIVITIESThe following chart depicts the sources of revenues for the fiscal year:
The Authority’s revenues may decrease in the coming
year(s) due to drought conditions. Insufficient rain
and snow pack results in less water to be processed
through the turbines at Hoover Dam thereby,
producing less hydroelectric power available for sale.
Additional wet years, and other factors, could help
stabilize revenues.
The following chart depicts the types of expenses for the fiscal year:
For further information and/or questions on
this report, please call the Power Authority
Office at 602-542-4263.
June 30,2003
June 30,2002
Distribution Plant $ 32,273 $ 40,341
General Plant - Office 128,391 141,158
$ 160,664 $ 181,499
Hoover Purchased Power$14,971,173 (57.94%)
Supplemental Power Purchased $3,076,952 (11.91%)
Other Cost$382,581 (1.48%)
Net Interest Expense$717,160 (2.78%)
Depreciation$30,711 (0.12%)
Administrative & General$1,427,504 (5.53%)
Transmission & Distribution$5,229,802 (20.24%)
Other Income$1,842 (0.0%)
Hoover Power Sales$21,896,409 (85.39%)
Interest Income$627,332 (2.45%)
Supplemental Power Sales$3,117,041 (12.16%)
As of fiscal year end, the Authority had $160,664 invested
in a variety of capital assets, as reflected in the following
schedule, which represents a net decrease (additions less
retirements and depreciation) of $20,835 or 11 percent
from the end of last year. June 30,2003
Beginning Balance $ 181,499
Additions 9,876
Depreciation (30,711 )
Ending Balance $ 160,664
The following reconciliation summarizes the change
in Capital Assets, which is presented in detail on
page 24 of the Notes to the Financial Statements
16
FINANCIAL STATEMENTS
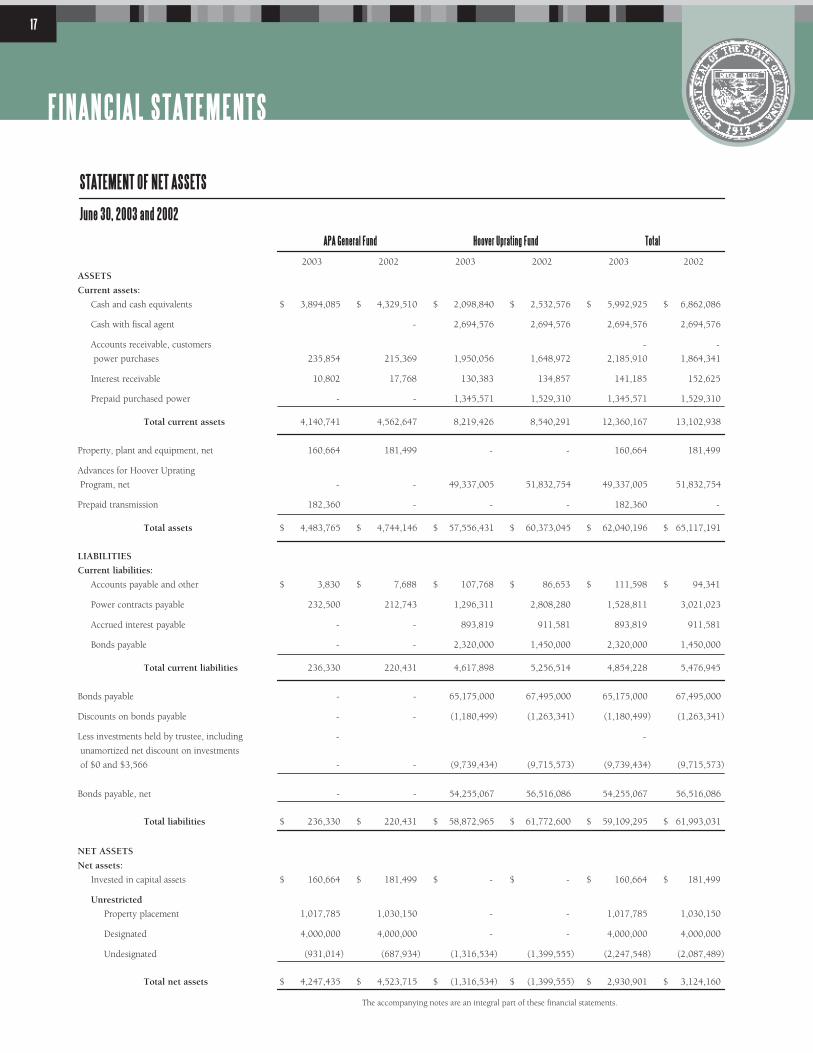
STATEMENT OF NET ASSETS
June 30, 2003 and 2002
The accompanying notes are an integral part of these financial statements.
APA General Fund Hoover Uprating Fund Total
2003 2002 2003 2002 2003 2002
ASSETS
Current assets:
Cash and cash equivalents 3,894,085$ 4,329,510$ 2,098,840$ 2,532,576$ 5,992,925$ 6,862,086$
Cash with fiscal agent - 2,694,576 2,694,576 2,694,576 2,694,576
Accounts receivable, customers - -
power purchases 235,854 215,369 1,950,056 1,648,972 2,185,910 1,864,341
Interest receivable 10,802 17,768 130,383 134,857 141,185 152,625
Prepaid purchased power - - 1,345,571 1,529,310 1,345,571 1,529,310
Total current assets 4,140,741 4,562,647 8,219,426 8,540,291 12,360,167 13,102,938
Property, plant and equipment, net 160,664 181,499 - - 160,664 181,499
Advances for Hoover Uprating
Program, net - - 49,337,005 51,832,754 49,337,005 51,832,754
Prepaid transmission 182,360 - - - 182,360 -
Total assets 4,483,765$ 4,744,146$ 57,556,431$ 60,373,045$ 62,040,196$ 65,117,191$
LIABILITIES
Current liabilities:
Accounts payable and other 3,830$ 7,688$ 107,768$ 86,653$ 111,598$ 94,341$
Power contracts payable 232,500 212,743 1,296,311 2,808,280 1,528,811 3,021,023
Accrued interest payable - - 893,819 911,581 893,819 911,581
Bonds payable - - 2,320,000 1,450,000 2,320,000 1,450,000
Total current liabilities 236,330 220,431 4,617,898 5,256,514 4,854,228 5,476,945
Bonds payable - - 65,175,000 67,495,000 65,175,000 67,495,000
Discounts on bonds payable - - (1,180,499) (1,263,341) (1,180,499) (1,263,341)
Less investments held by trustee, including - -
unamortized net discount on investments
of $0 and $3,566 - - (9,739,434) (9,715,573) (9,739,434) (9,715,573)
Bonds payable, net - - 54,255,067 56,516,086 54,255,067 56,516,086
Total liabilities 236,330$ 220,431$ 58,872,965$ 61,772,600$ 59,109,295$ 61,993,031$
NET ASSETS
Net assets:
Invested in capital assets 160,664$ 181,499$ -$ -$ 160,664$ 181,499$
Unrestricted
Property placement 1,017,785 1,030,150 - - 1,017,785 1,030,150
Designated 4,000,000 4,000,000 - - 4,000,000 4,000,000
Undesignated (931,014) (687,934) (1,316,534) (1,399,555) (2,247,548) (2,087,489)
Total net assets 4,247,435$ 4,523,715$ (1,316,534)$ (1,399,555)$ 2,930,901$ 3,124,160$
17

The accompanying notes are an integral part of these financial statements.
OPERATING REVENUES 3,117,041$ 761,942$ 21,896,409$ 22,256,521$ 25,013,450$ 23,018,463$
Operating expenses:
Purchased power 3,076,952 731,432 14,971,173 15,344,365 18,048,125 16,075,797
Western credits (Note 5) - - (5,325,522) (4,623,123) (5,325,522) (4,623,123)
Amortization of Hoover Uprating
Project costs - - 5,325,522 4,623,123 5,325,522 4,623,123
Transmission and distribution 11,996 1,715 5,217,806 5,204,148 5,229,802 5,205,863
Administrative and general 68,552 116,602 1,358,952 1,098,598 1,427,504 1,215,200
Depreciation 30,711 28,855 - - 30,711 28,855
Other 133,846 871,843 21,511 18,142 155,357 889,985
Total operating expenses 3,322,057 1,750,447 21,569,442 21,665,253 24,891,499 23,415,700
Operating income (loss) (205,016) (988,505) 326,967 591,268 121,951 (397,237)
Other (deductions) income:
Interest expense - - (3,675,878) (3,729,166) (3,675,878) (3,729,166)
Deferred interest expense - - 2,958,718 2,977,031 2,958,718 2,977,031
Interest income 66,177 114,455 561,155 632,078 627,332 746,533
Other, net (137,441) - (87,941) 2,323 (225,382) 2,323
Total other income (loss) (71,264) 114,455 (243,946) (117,734) (315,210) (3,279)
Increase (decrease) in net assets (276,280) (874,050) 83,021 473,534 (193,259) (400,516)
Net assets, beginning of the year 4,523,715 5,397,765 (1,399,555) (1,873,089) 3,124,160 3,524,676
Net assets, end of the year 4,247,435$ 4,523,715$ (1,316,534)$ (1,399,555)$ 2,930,901$ 3,124,160$
STATEMENT OF REVENUES, EXPENSES, AND CHANGES IN NET ASSETS
June 30, 2003 and 2002
APA General Fund Hoover Uprating Fund Total
2003 2002 2003 2002 2003 2002
18
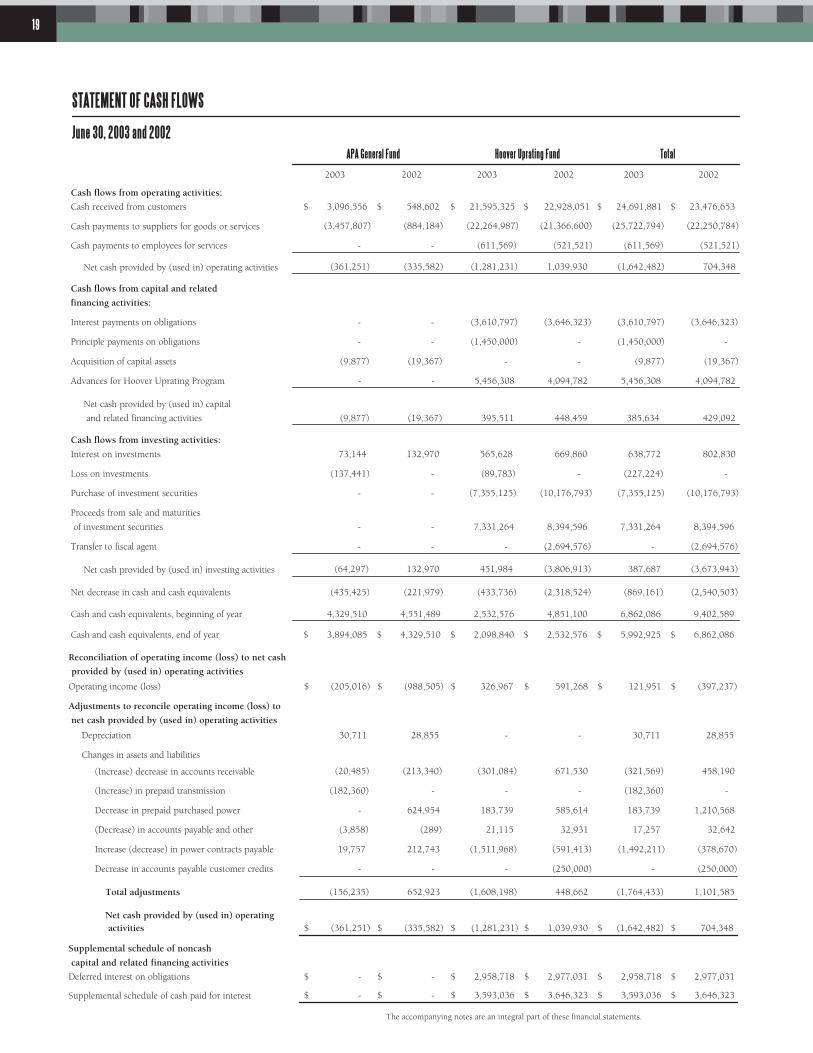
Cash flows from operating activities:
Cash received from customers 3,096,556$ 548,602$ 21,595,325$ 22,928,051$ 24,691,881$ 23,476,653$
Cash payments to suppliers for goods or services (3,457,807) (884,184) (22,264,987) (21,366,600) (25,722,794) (22,250,784)
Cash payments to employees for services - - (611,569) (521,521) (611,569) (521,521)
Net cash provided by (used in) operating activities (361,251) (335,582) (1,281,231) 1,039,930 (1,642,482) 704,348
Cash flows from capital and related
financing activities:
Interest payments on obligations - - (3,610,797) (3,646,323) (3,610,797) (3,646,323)
Principle payments on obligations - - (1,450,000) - (1,450,000) -
Acquisition of capital assets (9,877) (19,367) - - (9,877) (19,367)
Advances for Hoover Uprating Program - - 5,456,308 4,094,782 5,456,308 4,094,782
Net cash provided by (used in) capital
and related financing activities (9,877) (19,367) 395,511 448,459 385,634 429,092
Cash flows from investing activities:
Interest on investments 73,144 132,970 565,628 669,860 638,772 802,830
Loss on investments (137,441) - (89,783) - (227,224) -
Purchase of investment securities - - (7,355,125) (10,176,793) (7,355,125) (10,176,793)
Proceeds from sale and maturities
of investment securities - - 7,331,264 8,394,596 7,331,264 8,394,596
Transfer to fiscal agent - - - (2,694,576) - (2,694,576)
Net cash provided by (used in) investing activities (64,297) 132,970 451,984 (3,806,913) 387,687 (3,673,943)
Net decrease in cash and cash equivalents (435,425) (221,979) (433,736) (2,318,524) (869,161) (2,540,503)
Cash and cash equivalents, beginning of year 4,329,510 4,551,489 2,532,576 4,851,100 6,862,086 9,402,589
Cash and cash equivalents, end of year 3,894,085$ 4,329,510$ 2,098,840$ 2,532,576$ 5,992,925$ 6,862,086$
STATEMENT OF CASH FLOWS
June 30, 2003 and 2002APA General Fund Hoover Uprating Fund Total
2003 2002 2003 2002 2003 2002
The accompanying notes are an integral part of these financial statements.
Reconciliation of operating income (loss) to net cash
provided by (used in) operating activities
Operating income (loss) (205,016)$ (988,505)$ 326,967$ 591,268$ 121,951$ (397,237)$
Adjustments to reconcile operating income (loss) to
net cash provided by (used in) operating activities
Depreciation 30,711 28,855 - - 30,711 28,855
Changes in assets and liabilities
(Increase) decrease in accounts receivable (20,485) (213,340) (301,084) 671,530 (321,569) 458,190
(Increase) in prepaid transmission (182,360) - - - (182,360) -
Decrease in prepaid purchased power - 624,954 183,739 585,614 183,739 1,210,568
(Decrease) in accounts payable and other (3,858) (289) 21,115 32,931 17,257 32,642
Increase (decrease) in power contracts payable 19,757 212,743 (1,511,968) (591,413) (1,492,211) (378,670)
Decrease in accounts payable customer credits - - - (250,000) - (250,000)
Total adjustments (156,235) 652,923 (1,608,198) 448,662 (1,764,433) 1,101,585
Net cash provided by (used in) operating activities (361,251)$ (335,582)$ (1,281,231)$ 1,039,930$ (1,642,482)$ 704,348$
Supplemental schedule of noncash
capital and related financing activities
Deferred interest on obligations -$ -$ 2,958,718$ 2,977,031$ 2,958,718$ 2,977,031$
Supplemental schedule of cash paid for interest -$ -$ 3,593,036$ 3,646,323$ 3,593,036$ 3,646,323$
19

NOTES TO FINANCIAL STATEMENTS1. DESCRIPTION OF BUSINESS AND SUMMARY OF SIGNIFICANT ACCOUNTING POLICIES
Description of Business
The Arizona Power Authority (the “Authority”) is a body, corporate and politic, without taxing power, established by
the Arizona Legislature on May 27, 1944 by the Power Authority Act. Under the Power Authority Act, the Authority is
directed to obtain electric power developed from the mainstream of the Colorado River and sell such power to certain
qualified purchasers. The Power Authority Act provides that the Authority must be a self-supporting agency and prohibits
the Authority from incurring any obligation, which would be binding upon the State of Arizona.
The Authority supplies capacity and energy on a wholesale basis to certain power purchasers in the State of Arizona.
The Authority’s primary source of power and energy is the Hoover Power Plant at Hoover Dam, located approximately
25 miles from Las Vegas, Nevada. Hoover power is produced by the Boulder Canyon Project hydropower plant owned
by the Bureau of Reclamation. Hoover Dam is the highest and third largest concrete dam in the United States of
America. Hoover Dam was dedicated in 1935 and the first generator of the Hoover Power Plant was in full operation
in October 1936 and has been in continuous operation since. Power and energy from the Hoover Power Plant is
transmitted to load centers in Arizona, California and Nevada. The Authority first contracted for Arizona’s share of
Hoover power in 1952 and has continuously provided power and energy to its customers since that time.
The Authority is governed by a commission of five members appointed by the Governor (the “Commission”).
The term of office for each member is six years and the members select a chairman and vice-chairman from among
its membership for two-year terms.
Pursuant to Arizona law, the Commission serves as the Authority’s regulatory body with the exclusive authority to
establish electric prices. The Authority is required to follow certain procedures, pertaining to public notice requirements
and special meetings, before implementing changes in electric price schedules.
Change in Accounting Policy
Effective July 1, 2001, the Authority adopted Governmental Accounting Standards Board (“GASB”) Statement No. 34,
Basic Financial Statements - and Management’s Discussion and Analysis - for State and Local Governments, as amended
by GASB Statement No. 37, Basic Financial Statements - and Management’s Discussion and Analysis - for State and
Local Governments: Omnibus - an Amendment of GASB Statements No. 21 and No. 34 and GASB Statement No. 38,
Certain Financial Statement Note Disclosures. These statements established a new financial reporting model for state
and local governments consisting of both the governmentwide and fund financial statements (within the basic financial
statements) and primary activities are categorized as either governmental or business type. The Authority is only
engaged in business activities. In accordance with the provisions of paragraph 138 of GASB No. 34, this report presents
the required basic financial statements for special-purpose governments engaged only in business-type activities.
Accordingly, no significant change or impact resulted from the adoption of GASB No. 34, as amended by GASB
No. 37 and No. 38.
20
1. DESCRIPTION OF BUSINESS AND SUMMARY OF SIGNIFICANT ACCOUNTING POLICIES(CONTINUED)
Measurement Focus
The Authority’s funds are accounted for on a flow of economic resources measurement focus. All assets and
liabilities (whether current or noncurrent) associated with their activity are included in the Statements of Net
Assets. The Statements of Revenues, Expenses, and Changes in Net Assets present increases (revenues) and
decreases (expenses) in total net assets. The Authority’s reported total net assets are segregated into invested
capital assets and unrestricted components.
Basis of Accounting
Basis of Accounting refers to the time at which revenues and expenses are recognized in the accounts and
reported in the financial statements, regardless of the measurement focus applied. The accrual basis of
accounting is used by the Authority whereby revenues are recognized in the accounting period in which they
are earned and become measurable, and expenses are recognized when incurred.
Basis of Presentation
GASB No. 20, Accounting and Financial Reporting for Proprietary Funds and Other Governmental Entities
That Use Proprietary Fund Accounting, requires that governments’ proprietary activities apply all GASB
pronouncements as well as the following pronouncements issued on or before November 30, 1989, unless
those pronouncements conflict with or contradict GASB pronouncements, Financial Accounting Standards
Board (“FASB”) Statements and Interpretations, Accounting Principles Board Opinions and Accounting
Research Bulletins. Governments are given the option whether or not to apply all FASB Statements and
Interpretations issued after November 30, 1989, except for those that conflict with or contradict GASB
pronouncements. The Authority has elected not to implement FASB Statements and Interpretations issued
after November 30, 1989.
Revenue Recognition
The Authority recognizes revenue when power is delivered and billed to the customers.
Cash and Cash Equivalents
The Authority treats short-term temporary cash investments with original maturities when purchased, of three
months or less as cash equivalents.
Property, Plant, Equipment and Depreciation
Property, plant and equipment are stated at original cost. The costs of additions and replacements are
capitalized. Replacements of minor items of property are charged to expense as incurred. Costs of property
retired are eliminated from accounts, likewise such costs plus removal expense less salvage are charged to
accumulated depreciation.
Advances for Hoover Uprating Program
Proceeds from bonds payable were advanced by the Authority for uprating the Hoover Power Plant and are
recorded as advances. Such advances, including debt issue costs, plus net interest expense incurred by the
Authority are reimbursed in the form of credits on the monthly power bills rendered by the Western Are
Power Administration of the Department of Energy (“Western”). These credits are issued over the 30-year life
of the bonds. Substantially all advances, net interest expense and other related costs on the bonds are charged
to the Uprating Program as amounts to be recovered from future credits.
21
1. DESCRIPTION OF BUSINESS AND SUMMARY OF SIGNIFICANT ACCOUNTING POLICIES(CONTINUED)
Investments
The Authority has classified its marketable securities as held-to-maturity. Held-to-maturity securities represent
those securities that the Authority has both the intent and ability to hold to maturity and are carried at
amortized cost.
Schedule C Energy
Under its Electric Service Contract with Western, the Authority has preferential rights to excess energy
(“Schedule C energy”) generated at the Hoover Power Plant. The Authority buys Schedule C energy when
available from Western during an operating year (October 1 to September 30). The Authority’s financial
statements are prepared on a fiscal year (July 1 to June 30) basis. When excess energy is available, the
Authority bills its customers as Schedule C energy is delivered and receives payment during a given operating
year, but Western does not bill for the cost of such Schedule C energy until the following operating year. An
estimate of such amounts is accrued for at the end of the fiscal year. The Statement of Net Assets as of June 30,
2003 does not include an accrual for Schedule C energy as no Schedule C energy was available during the
operating year.
Operating and Nonoperating Revenues
Operating revenues are revenues derived from the sale of power to customers or from other contractual
agreements. Operating revenues include $8,400,000 and $6,300,000 received from Salt River Project for
scheduling entity services during the years ended June 30, 2003 and 2002, respectively. The revenue is the
result of an agreement between the Authority and the Salt River Project which will yield $8,400,000 annual
revenues to the Authority thereby reducing the overall revenue requirements to be paid by the Authority’s
customers through power rates. The agreement expires September 30, 2004 unless renewed. Nonoperating
revenues are from sources other than the sale of power to customers and primarily consist of income earned
on investments.
Application of Net Assets to Expenses Incurred
The Authority applies unrestricted, undesignated net assets to expenses incurred. To the extent undesignated
net assets are unavailable, unrestricted, designated net assets will be applied to expenses incurred.
Customer Credits
The Authority operates on a nonprofit basis and reduces charges to its customers, through credits on power
bills, for any revenues in excess of expenses after the close of the operating year. Likewise, the Authority bills
its customers for any deficit in revenues versus expenses incurred during the operating year.
As of June 30, 2003, there were no accrued credits to be applied to customers’ power bills based upon rates
from Western’s operating year ending September 30, 2003.
Income Taxes
The Authority is exempt from federal and Arizona state income taxes. Accordingly, no provision for income
taxes has been recorded for the Authority in the accompanying financial statements.
22
1. DESCRIPTION OF BUSINESS AND SUMMARY OF SIGNIFICANT ACCOUNTING POLICIES(CONTINUED)
Use of Estimates
The preparation of financial statements in conformity with accounting principles generally accepted in the
United States of America requires management to make estimates and assumptions that affect the reported
amounts of assets and liabilities and disclosures of contingent assets and liabilities at the date of the financial
statements and the reported amounts of revenues and expenses during the reporting period. Actual results
could differ from these estimates.
Geographic and Product Concentration
The Authority’s revenues are derived from the sale of electrical power and services to contracted customers in
the state of Arizona. The Hoover Uprating Fund is used to purchase electric power solely from Western. The
Authority’s General Fund is used to purchase electric power from various providers.
2. FUND ACCOUNTING
Hoover Uprating Fund
The Hoover Power Plant Act of 1984 (“Hoover Act”) authorized the U.S. government to increase the capacity
i.e., “uprate,” of existing generating equipment at the Hoover Dam Power Plant (“Uprating Program”). Instead
of appropriating further federal funds for the Uprating Program, Congress implemented an advancement of
funds procedure whereby prospective nonfederal purchasers of the uprated Hoover capacity and associated
energy contribute to the financing of the Uprating Program. The Uprating Program was determined to be
complete in September 1995.
The Authority financed a portion of the total Uprating Program by issuing bonds. The Hoover Uprating Fund
accounts for advances by the Authority in connection with the Uprating Program. Effective June 1, 1987, the
Authority executed new power contracts with Western and its customers which expire in 2017. The revenues
and expenditures applicable to the sale and transmission of power and energy received by the Authority from
Western under these contracts are accounted for in the Hoover Uprating Fund.
APA General Fund
The Authority’s operations other than those applicable to the Hoover Uprating Fund are accounted for in the
APA General Fund. The purchase of supplemental power and the sale and transmission of such power to the
Authority’s customers comprise the majority of this fund’s activity.
3. CASH
All cash balances maintained by the State of Arizona Treasurer are for pooled investment purposes. Statutes
require the State Treasurer to invest these pooled funds. The Authority’s Commission requires these pooled
investments to be invested in obligations of the U.S. government. All investments are carried at cost.
23
24
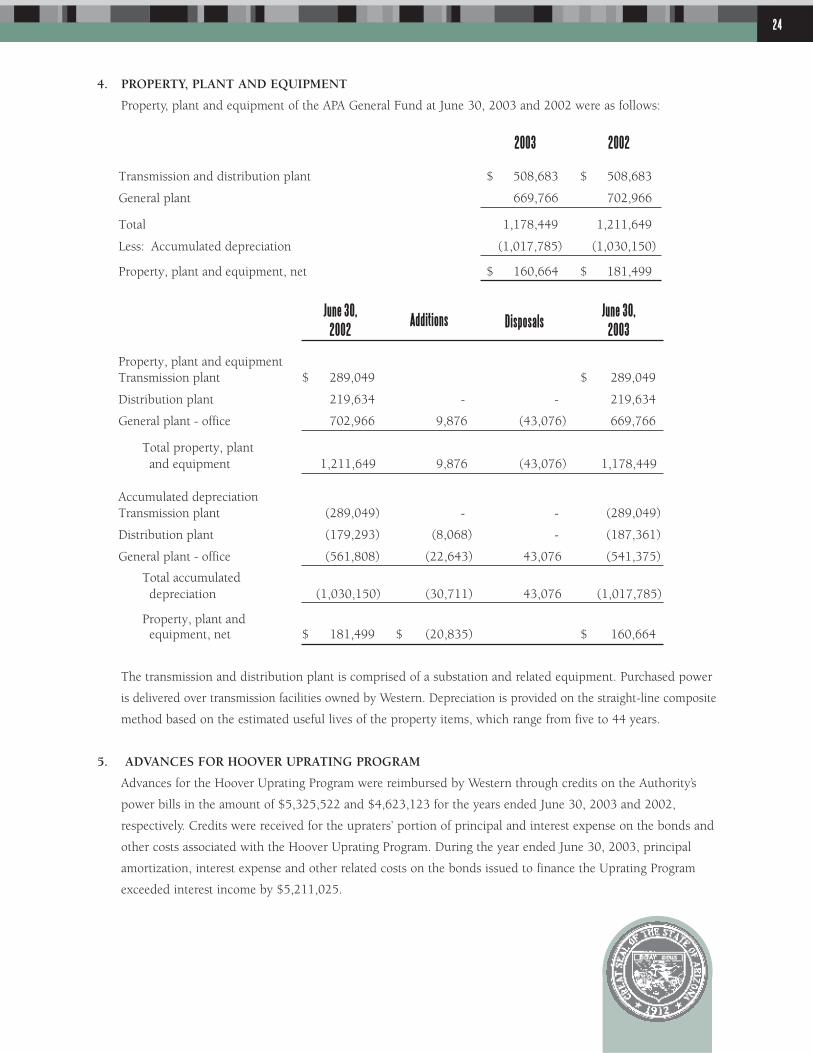
4. PROPERTY, PLANT AND EQUIPMENT
Property, plant and equipment of the APA General Fund at June 30, 2003 and 2002 were as follows:
The transmission and distribution plant is comprised of a substation and related equipment. Purchased power
is delivered over transmission facilities owned by Western. Depreciation is provided on the straight-line composite
method based on the estimated useful lives of the property items, which range from five to 44 years.
5. ADVANCES FOR HOOVER UPRATING PROGRAM
Advances for the Hoover Uprating Program were reimbursed by Western through credits on the Authority’s
power bills in the amount of $5,325,522 and $4,623,123 for the years ended June 30, 2003 and 2002,
respectively. Credits were received for the upraters’ portion of principal and interest expense on the bonds and
other costs associated with the Hoover Uprating Program. During the year ended June 30, 2003, principal
amortization, interest expense and other related costs on the bonds issued to finance the Uprating Program
exceeded interest income by $5,211,025.
2003 2002
Transmission and distribution plant 508,683$ 508,683$
General plant 669,766 702,966
Total 1,178,449 1,211,649
Less: Accumulated depreciation (1,017,785) (1,030,150)
Property, plant and equipment, net 160,664$ 181,499$
June 30,2002
June 30,2003
Additions Disposals
Property, plant and equipmentTransmission plant 289,049$ 289,049$
Distribution plant 219,634 - - 219,634
General plant - office 702,966 9,876 (43,076) 669,766
Total property, plant and equipment 1,211,649 9,876 (43,076) 1,178,449
Accumulated depreciationTransmission plant (289,049) - - (289,049)
Distribution plant (179,293) (8,068) - (187,361)
General plant - office (561,808) (22,643) 43,076 (541,375)
Total accumulated depreciation (1,030,150) (30,711) 43,076 (1,017,785)
Property, plant andequipment, net 181,499$ (20,835)$ 160,664$

6. BONDS PAYABLE
Bonds payable consists of the following:
In prior years, the Authority defeased various issues of bonds by purchasing U.S. government securities which
were deposited in an irrevocable trust with an escrow agent to provide for future debt service until the call
dates. As a result, those bonds are considered to be defeased and the liability for these bonds has been
removed from the Hoover Uprating Fund. Accordingly, these trust account assets and related liabilities are not
included in the Authority’s financial statements.
The remaining bonds, totaling $67,495,000, bear interest ranging from 5.0 percent to 5.4 percent, are due
from 2004 through 2017, and are secured by the pledged property, as defined by the resolution, which
includes the proceeds from the sale of the bonds, rights and interest in various contracts and revenues. The
Authority amortizes the bond discount using the straight-line method, which approximates the effective
interest method. Principal amounts due over the next five fiscal years ended June 30 and thereafter are as
follows: $2,320,000 in 2004, $2,545,000 in 2005, $2,790,000 in 2006, $3,070,000 in 2007, $3,385,000 in
2008, $22,675,000 in 2009 through 2013, and $30,710,000 in 2014 through 2018. Interest amounts due
over the next five fiscal years ended June 30 and thereafter are as follows: $3,575,274 in 2004, $3,459,274 in
2005, $3,329,479 in 2006, $3,184,399 in 2007, $3,021,689 in 2008, $11,958,780 in 2009 through 2013,
and $5,009,369 in 2014 through 2018.
Crossover Refunding
On September 12, 2001 the Authority issued $57,520,000 of Special Obligation Crossover Refunding Bonds.
Proceeds from the sale of the bonds along with a fund contribution by the Authority will be held in an escrow
trust account invested in government securities until October 1, 2003 (the “Crossover Date”) when, if certain
conditions are met, the crossover refunding is scheduled to take place and $62,630,000 of the 1993 Series
Power Resource Revenue Refunding Bonds maturing on and after October 1, 2005 will be called. If these
conditions are not met, the assets in the escrow trust account will be used to retire the Special Obligation
Crossover Bonds on the Crossover Date. The crossover is subject to the condition that on the Crossover Date
balances held in the Debt Service Reserve Account at least equal the Debt Service Reserve Requirement and an
appropriate legal opinion regarding the validity of the Authority’s 2001 Series Power Resource Revenue
Refunding Bonds has been received.
June 30,2002
June 30,2003Increases Reductions Transfers
Bond payable current 1,450,000$ (1,450,000)$ 2,320,000$ 2,320,000$
Bond payable long-term 67,495,000 - - (2,320,000) 65,175,000
Total bonds payable 68,945,000$ (1,450,000)$ 67,495,000$
25
26
6. BONDS PAYABLE(CONTINUED)
(Crossover Refunding - Continued)
The proceeds in the government securities escrow trust account, together with the income realized from
investment of trust assets, serve as collateral for the Special Obligation Crossover Bonds and are paying the
debt service on those bonds until the Crossover Date. The Special Obligation Crossover Bonds are payable
solely from the amounts in the escrow trust account and are not payable from any other source. Because they
are not payable from revenues derived by the Authority or secured by any assets held by the Authority, neither
the Special Obligation Crossover Bonds nor the assets held in the escrow trust account are reflected on the
Authority’s Statements of Net Assets at June 30, 2003 or 2002. However, in conjunction with the issuance of
the Crossover Bonds, the Authority deposited $2,694,576 with the crossover bond trustee; this amount is
reflected as “Cash with fiscal agent” in the Authority’s Statements of Net Assets at June 30, 2003 and 2002.
If the crossover occurs on the Crossover Date, the outstanding Special Obligation Crossover Bonds will be
exchanged for 2001 Series Power Resource Revenue Refunding Bonds of the same principal amount, maturity
date, and interest rate as the crossover bonds. The proceeds in the escrow trust account will be used to call
that portion of the 1993 Series Bonds maturing on and after October 1, 2005. The 2001 Series Bonds will be
reflected as obligations on the Authority’s books, and any gain or loss on extinguishment will be reflected in
the Authority’s records as of the Crossover Date. On and after the Crossover Date, the called portion of the
1993 Series Bonds will no longer be outstanding and will cease to be entitled to any lien on the revenues
pledged to payment of those bonds. Instead, the revenue stream originally pledged to secure the called
portion of the 1993 Series Bonds will “cross over” to pay debt service on the 2001 Series Bonds. The
Crossover Bonds and 2001 Series Bonds bear interest at a rate of 5 percent and 5.25 percent, payable on
April 1 and October 1 of each year, commencing April 1, 2004 and maturing in 2017.
On October 1, 2003, the Authority met the conditions described above to effect the crossover refunding which
resulted in $57,520,000 of Special Obligation Crossover Refunding Bonds being exchanged for 2001 Series
Power Resource Revenue Refunding Bonds of the same principal amount, maturity date and interest rates as
the crossover bonds. In addition, as part of the crossover, $62,630,000 of the 1993 Series Power Resource
Revenue Refunding Bonds maturing on and after October 1, 2005 were called. As required by regulation, the
Authority applied an additional $600,113 of funds held in the Debt Service Reserve Account to effect the
crossover transaction and call the $62,630,000 obligation. As a result of this transaction, the Authority
recognized an economic gain (difference between the present value of the old and new debt service payments)
of $2,095,648. The crossover refunding resulted in the recognition of a deferred amount of $2,411,956 that
will be reflected as a decrease in bonds payable and will be amortized as a component of interest expense over
the life of the refunded bonds. The cash flows required to service the new debt are $4,572,093 less than the
cash flows required to service the old debt.
7. INVESTMENTS HELD BY TRUSTEE
As of June 30, 2003 and 2002, investments are collateralized with securities held by the Authority’s trustee.
The amortized cost, which approximates fair value due to the short-term nature of the held-to-maturity
investments, of the investment securities at June 30 is as follows:
On September 19, 1996, the Authority entered into a repurchase and custody agreement with MBIA
Investment Management Corporation (“IMC”) wherein the Authority agreed to effect a series of repurchase
transactions with IMC, in investments allowable under the bond resolution agreements and state law, with a
fixed earnings rate of 6.95 percent. The securities are held in trust by Bank One of Arizona, N.A. If at any time
the aggregate market value of all purchased securities is less than the amount required under the repurchase
and custody agreement (calculated using a percentage of 104 percent), the Authority may require IMC to
transfer additional securities so the aggregate market value of all securities will equal or exceed such requirement.
8. NET ASSETS
Allocations of net assets for specified purposes are authorized and designated by the Commission, under provision
of the Arizona Power Authority Act of 1944, as amended. The designated reserves shown on the accompanying
statements of net assets are comprised of the following at June 30, 2003 and 2002:
9. RETIREMENT PLAN
The Authority contributes to the retirement plan described below. Benefits are established by state statute and
generally provide retirement, death, long-term disability, survivor, and health insurance premium benefits.
The Arizona State Retirement System (the “Plan” or “ASRS”) administers a cost-sharing multiple-employer
defined benefit pension plan that covers permanent, full-time employees of the Authority. The ASRS is governed
by the Arizona State Retirement System Board according to the provisions of ARS Title 38, Chapter 5, Article 2.
The ASRS issues a publicly available financial report that includes its financial statements and required
supplementary information. A report may be obtained by writing or calling the Plan at 1020 East Missouri
Avenue, Phoenix, Arizona 85014, (602) 255-5575. The Plan was established by the State of Arizona to provide
benefits for employees of the state and employees of participating political subdivisions and school districts.
The Plan became effective on July 1, 1971. By actuarial computation, employee member and Authority
contributions to the Plan were fixed at 2.49 percent (2.00 percent retirement and .49 percent long-term disability)
of their compensation for the years ended June 30, 2003 and 2002, with the contributions made through payroll
deductions. Employee contributions vest immediately. Total contributions to the Plan for the years ended
June 30, 2003 and 2002 by the Authority’s covered employees were $14,854 and $12,728, respectively.
2003 2002
Repurchase agreement 7,146,663$ 7,146,663$
U.S. government securities 2,592,771 2,568,910
Total held-to-maturity investments 9,739,434$ 9,715,573$
2003 2002
Resource development 3,500,000$ 3,500,000$
Operations fund 200,000 200,000
Power contracts 100,000 100,000
System improvement and repairs 200,000 200,000
Total 4,000,000$ 4,000,000$
27
28
9. RETIREMENT PLAN(CONTINUED)
Matching employer member contributions were actuarially determined and fixed at the same rate as employee
member contributions for the years ended June 30, 2003 and 2002. In the event the Plan’s actuary determines
that additional contributions are needed in order to amortize an unfunded accrued liability, every employer
member will be required to contribute the revised contribution percentage which is established by the
Arizona State Legislature.
All full-time employees of the Authority are required to become members of the Plan. The Authority’s total
payroll for employees covered by this Plan for the years ended June 30, 2003 and 2002 were $611,569 and
$521,521, respectively. Contributions to the Plan by the Authority for its covered employees vest over five
years. All required employer contributions are made to the Plan by the end of each month.
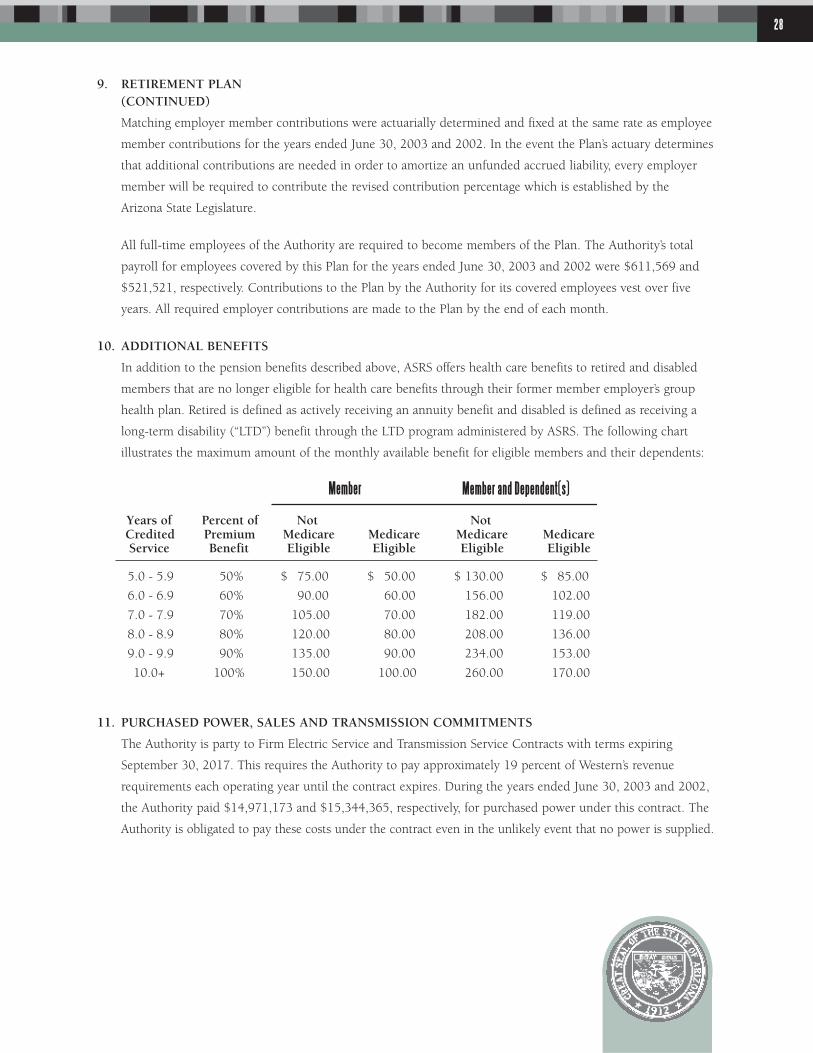
10. ADDITIONAL BENEFITS
In addition to the pension benefits described above, ASRS offers health care benefits to retired and disabled
members that are no longer eligible for health care benefits through their former member employer’s group
health plan. Retired is defined as actively receiving an annuity benefit and disabled is defined as receiving a
long-term disability (“LTD”) benefit through the LTD program administered by ASRS. The following chart
illustrates the maximum amount of the monthly available benefit for eligible members and their dependents:
Member and Dependent(s)Member
Years of Percent of Not NotCredited Premium Medicare Medicare Medicare MedicareService Benefit Eligible Eligible Eligible Eligible
5.0 - 5.9 50% 75.00$ 50.00$ 130.00$ 85.00$
6.0 - 6.9 60% 90.00 60.00 156.00 102.00
7.0 - 7.9 70% 105.00 70.00 182.00 119.00
8.0 - 8.9 80% 120.00 80.00 208.00 136.00
9.0 - 9.9 90% 135.00 90.00 234.00 153.00
10.0+ 100% 150.00 100.00 260.00 170.00
11. PURCHASED POWER, SALES AND TRANSMISSION COMMITMENTS
The Authority is party to Firm Electric Service and Transmission Service Contracts with terms expiring
September 30, 2017. This requires the Authority to pay approximately 19 percent of Western’s revenue
requirements each operating year until the contract expires. During the years ended June 30, 2003 and 2002,
the Authority paid $14,971,173 and $15,344,365, respectively, for purchased power under this contract. The
Authority is obligated to pay these costs under the contract even in the unlikely event that no power is supplied.
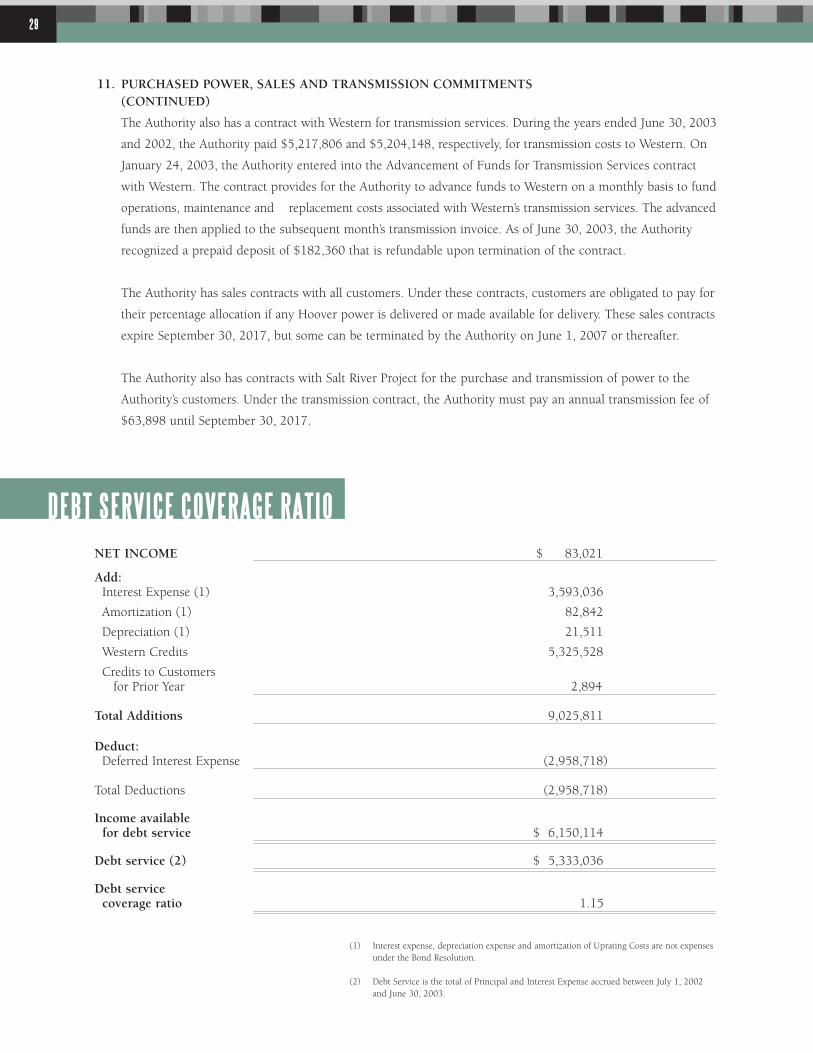
NET INCOME $ 83,021
Add:Interest Expense (1) 3,593,036
Amortization (1) 82,842
Depreciation (1) 21,511
Western Credits 5,325,528
Credits to Customersfor Prior Year 2,894
Total Additions 9,025,811
Deduct:Deferred Interest Expense (2,958,718)
Total Deductions (2,958,718)
Income availablefor debt service $ 6,150,114
Debt service (2) $ 5,333,036
Debt servicecoverage ratio 1.15
(1) Interest expense, depreciation expense and amortization of Uprating Costs are not expenses under the Bond Resolution.
(2) Debt Service is the total of Principal and Interest Expense accrued between July 1, 2002 and June 30, 2003.
DEBT SERVICE COVERAGE RATIO
11. PURCHASED POWER, SALES AND TRANSMISSION COMMITMENTS(CONTINUED)
The Authority also has a contract with Western for transmission services. During the years ended June 30, 2003
and 2002, the Authority paid $5,217,806 and $5,204,148, respectively, for transmission costs to Western. On
January 24, 2003, the Authority entered into the Advancement of Funds for Transmission Services contract
with Western. The contract provides for the Authority to advance funds to Western on a monthly basis to fund
operations, maintenance and replacement costs associated with Western’s transmission services. The advanced
funds are then applied to the subsequent month’s transmission invoice. As of June 30, 2003, the Authority
recognized a prepaid deposit of $182,360 that is refundable upon termination of the contract.
The Authority has sales contracts with all customers. Under these contracts, customers are obligated to pay for
their percentage allocation if any Hoover power is delivered or made available for delivery. These sales contracts
expire September 30, 2017, but some can be terminated by the Authority on June 1, 2007 or thereafter.
The Authority also has contracts with Salt River Project for the purchase and transmission of power to the
Authority’s customers. Under the transmission contract, the Authority must pay an annual transmission fee of
$63,898 until September 30, 2017.
29
32
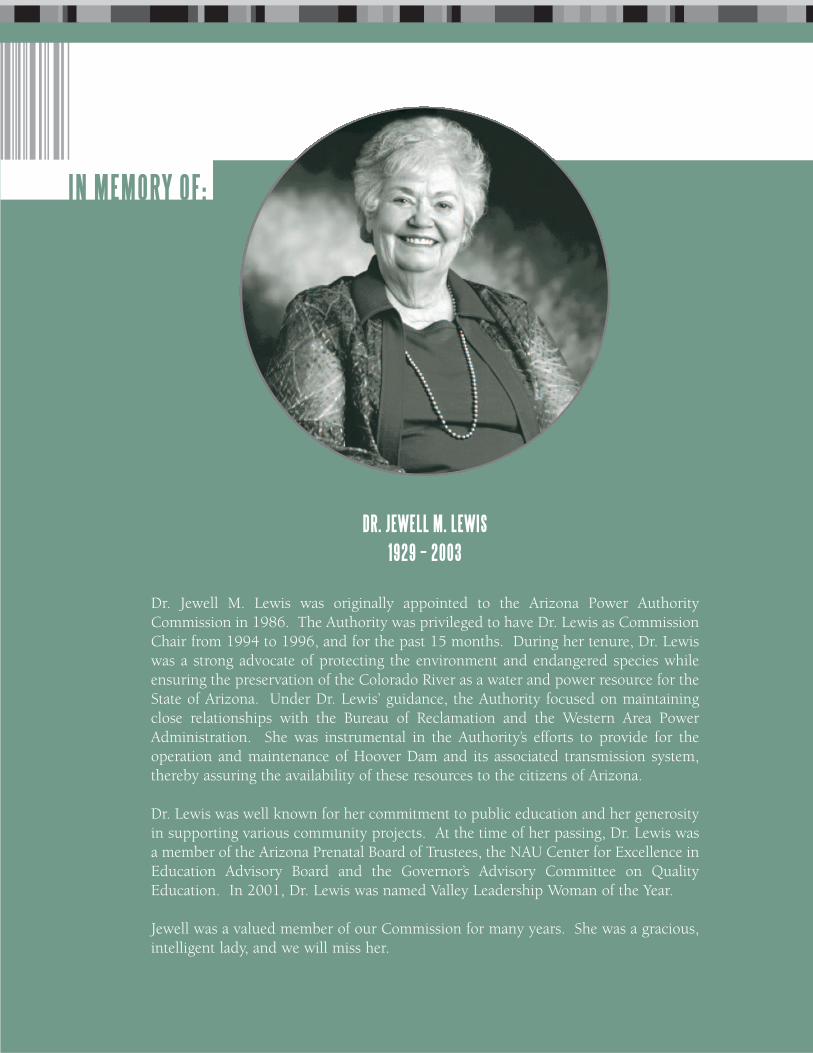
IN MEMORY OF:
DR. JEWELL M. LEWIS1929 – 2003
Dr. Jewell M. Lewis was originally appointed to the Arizona Power AuthorityCommission in 1986. The Authority was privileged to have Dr. Lewis as CommissionChair from 1994 to 1996, and for the past 15 months. During her tenure, Dr. Lewiswas a strong advocate of protecting the environment and endangered species whileensuring the preservation of the Colorado River as a water and power resource for theState of Arizona. Under Dr. Lewis’ guidance, the Authority focused on maintainingclose relationships with the Bureau of Reclamation and the Western Area PowerAdministration. She was instrumental in the Authority’s efforts to provide for theoperation and maintenance of Hoover Dam and its associated transmission system,thereby assuring the availability of these resources to the citizens of Arizona.
Dr. Lewis was well known for her commitment to public education and her generosityin supporting various community projects. At the time of her passing, Dr. Lewis wasa member of the Arizona Prenatal Board of Trustees, the NAU Center for Excellence inEducation Advisory Board and the Governor’s Advisory Committee on QualityEducation. In 2001, Dr. Lewis was named Valley Leadership Woman of the Year.
Jewell was a valued member of our Commission for many years. She was a gracious,intelligent lady, and we will miss her.

ARIZONA POWER AUTHORITY1810 West Adams Street / Phoenix, Arizona 85007(602) 542-4263 / Fax (602) 253-7970