blends for an alternative to dark chocolate: …
TRANSCRIPT

B.CEPPA, Curitiba, v. 36, n. 1, jan./jun. 2019 1
BLENDS FOR AN ALTERNATIVE TO DARK CHOCOLATE: APPROACH WITH SENSORY PANEL AND CONSUMERS
ANDRÉA ALVES SIMIQUELI1
RITA DE CÁSSIA DOS SANTOS NAVARRO DA SILVA 2 ALINE IAMIN GOMIDE3 LUIS ANTONIO MINIM4
VALÉRIA PAULA RODRIGUES MINIM5
Chocolate is a product much appreciated for its sensory characteristics. With regards to health, the bitter part of it that has greater benefits due to compounds naturally present in cocoa. However, chocolate with high content of cocoa solids has predominant characteristics as a high residual bitter taste and greater hardness, directly affecting the consumer acceptability. The objective of this study was to substitute traditional dark chocolate for blends containing lower (27%), equal (35%) and higher (47%) cocoa concentrations than the traditional product. Chocolates were characterized by their sensory attributes: brown color, aroma and flavor of the cocoa mass, sweet taste, residual bitter taste, hardness, spreadability and adhesiveness by means of a new descriptive technique, the Optimized Descriptive Profile. Acceptability was evaluated by 120 consumers using a nine-point hedonic scale. The results were analyzed by principal component analysis, Dunnet’s test and Preference Map. The blends “equal” and “higher” differed from the control for all attributes related to texture and were more accepted than the commercial formulation. This highlights that texture characteristics of chocolate were the main attribute defining acceptability. Blending technology showed to be an alternative for improving the acceptability of chocolates with higher cocoa content.
KEYWORDS: CHOCOLATE BLENDS; ACCEPTABILITY; OPTIMIZED DESCRIPTIVE PROFILE; SEN-SORY QUALITY.
B.CEPPA, Curitiba, v. 36, n. 1, jan./jun. 20192
1 INTRODUCTION
Chocolate is gaining more and more space in the media, not only because of its sensory properties, but also because of its potential health benefits. A more in-depth analysis, based on scientific studies, suggests that some chocolates may truly benefit health when consumed in moderation (LIPPI et al., 2009).
According to Lamuela-Raventós et al. (2005), Desch et al. (2010) and Katz, Doughty and Ali (2011), from a health perspective, dark chocolate has greater benefits due to compounds occurring naturally in cocoa. Santos-Buelga and Scalbert (2000) reported that cocoa, the essential raw material in the preparation of chocolate, is a rich source of flavonoids which make up a unique class of polyphenols, including monomers (catechin and epicatechin), oligomers and polymers (proanthocyanidins). Those compounds not only improve cardiac function to favor digestion but also stimulate the nervous system and bowel function (CORTI et al., 2009). Desch et al. (2010) reported that the presence of polyphenols in cocoa beans has a beneficial health role by presenting anti-carcinogenic, anti-inflammatory, analgesic, anti-allergenic and anti-oxidant functions, which allows chelate metals to interact with enzymes and electron transporters, and block the formation, propagation and deleterious action of reactive oxygen species.
Besides containing polyphenols, dark chocolate has psychoactive components, represented by tyramine and phenylethylamine, a neuromodulator that operates in the production of serotonin, the hormone that regulates mood and ability to relax, as well as moderation of binge eating and anxiety, common signs during the premenstrual syndrome (PMS) (FARAH, 2008; PASCHOAL & KALLUF, 2009). Studies suggest that low levels of serotonin in the plasma, during the premenstrual period, are related to depression, impatience and eating disorders (EFRAIM, 2004).
Methylxanthines, potentially active compounds, are substances that present many beneficial health effects, including antioxidant, vasodilator, diuretic and stimulant of the neuromuscular system (EFRAIM, 2004). In chocolate this is present in the form of theobromine, where its concentration increases as the content of cocoa solids increases (LAMUELA-RAVENTÓS et al., 2005; KATZ, DOUGHTY & ALI, 2011).
On the other hand, from a sensory point of view, chocolate with high cocoa solids content presents the predominant features of high residual bitter taste and greater hardness, directly affecting consumer acceptability (GUEDES, 2007). According to Worch and Ennis (2013), milk and dark chocolates may present different consumer segments, where a more intense bitter taste may be undesirable for a milk chocolate, but may provide excellent acceptance for dark chocolate. In contrast, the high cocoa content in dark chocolate not only alters the residual bitter taste of the product, but also alters its textural properties resulting in a more compact texture and less soft chocolate (NEBESNY & ZYZELEWICZ, 2005).
The use of mixing technologies, i.e., the production of chocolate blends has been used by chocolate manufacturing companies such as Garoto, Nestlé and Harald to obtain chocolate with specific characteristics and higher applicability in the production of bonbons, truffles, toppings and other products. This technology may present itself as an attractive alternative to improve the sensory characteristics of dark chocolate, allowing it to keep the appropriate bitter taste and providing a more pleasurable texture to consumers. In this context, the present work aimed to study the replacement of traditional dark chocolate for blends containing lower, similar and superior cocoa levels to the traditional product.
2 MATERIALS AND METHODS
The substitution of conventional dark chocolate for chocolate blends was evaluated according to two approaches: (i) panel of judges – characterized the products and quantified the intensity of
B.CEPPA, Curitiba, v. 36, n. 1, jan./jun. 2019 3
sensory characteristics of the chocolates by means of a new descriptive technique, the Optimized Descriptive Profile (SILVA et al., 2012; 2013), (ii) consumers - evaluated sensory acceptance of chocolates using a 9-point hedonic scale (MEILGAARD, CIVILLE & CARR, 2006). The present study was approved by the Ethics Committee on Human Research of the Universidade Federal de Viçosa (UFV), Brazil, under number 365.029. The analyses were performed at the Sensory Analysis Laboratory of the UFV, in individual booths with white light.
2.1 CHOCOLATE SAMPLES
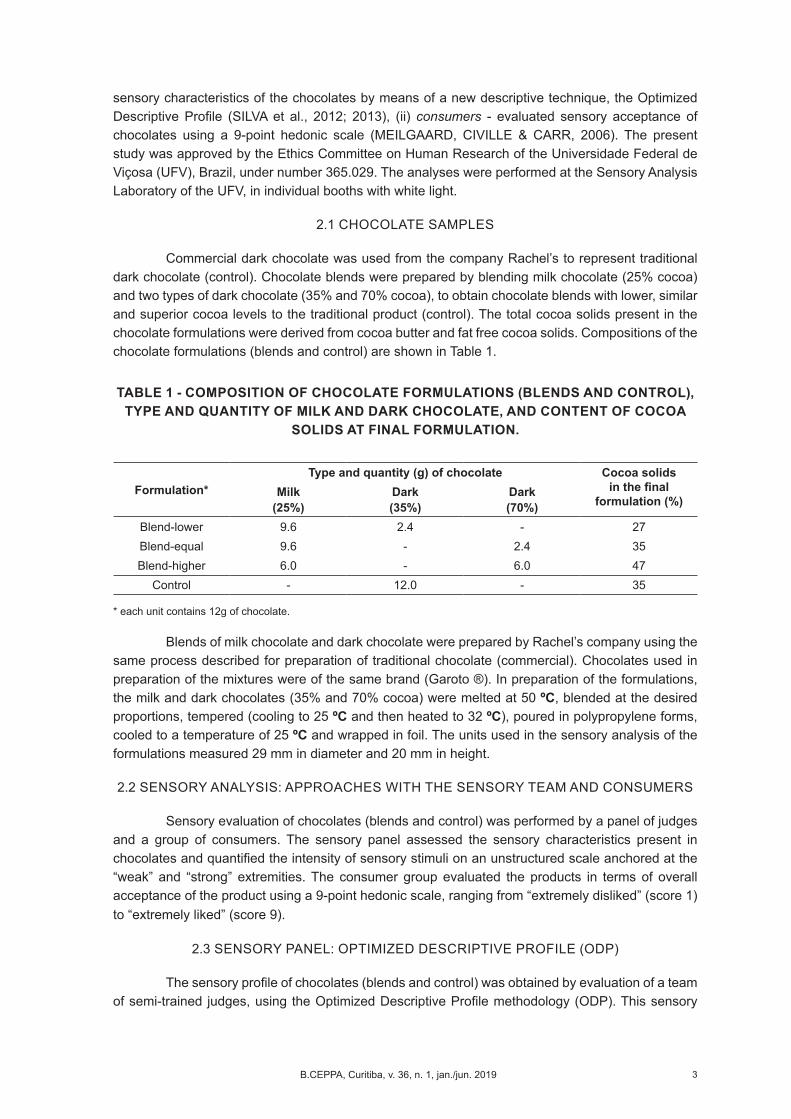
Commercial dark chocolate was used from the company Rachel’s to represent traditional dark chocolate (control). Chocolate blends were prepared by blending milk chocolate (25% cocoa) and two types of dark chocolate (35% and 70% cocoa), to obtain chocolate blends with lower, similar and superior cocoa levels to the traditional product (control). The total cocoa solids present in the chocolate formulations were derived from cocoa butter and fat free cocoa solids. Compositions of the chocolate formulations (blends and control) are shown in Table 1.
TABLE 1 - COMPOSITION OF CHOCOLATE FORMULATIONS (BLENDS AND CONTROL), TYPE AND QUANTITY OF MILK AND DARK CHOCOLATE, AND CONTENT OF COCOA
SOLIDS AT FINAL FORMULATION.
Formulation*Type and quantity (g) of chocolate Cocoa solids
in the final formulation (%)
Milk(25%)
Dark(35%)
Dark(70%)
Blend-lower 9.6 2.4 - 27Blend-equal 9.6 - 2.4 35Blend-higher 6.0 - 6.0 47
Control - 12.0 - 35
* each unit contains 12g of chocolate.
Blends of milk chocolate and dark chocolate were prepared by Rachel’s company using the same process described for preparation of traditional chocolate (commercial). Chocolates used in preparation of the mixtures were of the same brand (Garoto ®). In preparation of the formulations, the milk and dark chocolates (35% and 70% cocoa) were melted at 50 ºC, blended at the desired proportions, tempered (cooling to 25 ºC and then heated to 32 ºC), poured in polypropylene forms, cooled to a temperature of 25 ºC and wrapped in foil. The units used in the sensory analysis of the formulations measured 29 mm in diameter and 20 mm in height.
2.2 SENSORY ANALYSIS: APPROACHES WITH THE SENSORY TEAM AND CONSUMERS
Sensory evaluation of chocolates (blends and control) was performed by a panel of judges and a group of consumers. The sensory panel assessed the sensory characteristics present in chocolates and quantified the intensity of sensory stimuli on an unstructured scale anchored at the “weak” and “strong” extremities. The consumer group evaluated the products in terms of overall acceptance of the product using a 9-point hedonic scale, ranging from “extremely disliked” (score 1) to “extremely liked” (score 9).
2.3 SENSORY PANEL: OPTIMIZED DESCRIPTIVE PROFILE (ODP)
The sensory profile of chocolates (blends and control) was obtained by evaluation of a team of semi-trained judges, using the Optimized Descriptive Profile methodology (ODP). This sensory
B.CEPPA, Curitiba, v. 36, n. 1, jan./jun. 20194
technique is a descriptive methodology that was recently proposed in order to reduce the time of sensory testing while providing quantitative information on the sensory attributes (SILVA et al., 2012; 2013).
In the ODP a panel of semi-trained judges evaluated the intensity of sensory stimuli present in the food tested using an unstructured scale anchored at the “weak” and “strong” extremities, which are represented by reference materials. To permit that semi-trained judges consistently evaluate all samples, they are simultaneously presented to the judges for their comparison before allocation of stimulus intensity on the unstructured scale. The reference materials that represent intensity extremes can also be consulted during evaluation of the products. Thus it is possible to make comparisons among samples and with the reference materials, as well as re-tasting of the products and re-allocation of stimulus intensity on the scale.
In the obtaining of the sensory profile of chocolates, a team of 26 judges, recruited using structured questionnaires and selected based on their sensory discrimination ability, assessed the attributes that characterized the chocolate and evaluated their intensity using the evaluation protocol of the ODP.
2.3.1 Recruitment of the judges
Volunteers to participate in the sensory tests were recruited among students of the Universidade Federal de Viçosa using structured questionnaires, in order to verify their good health, time availability, ability to work with unstructured scales and familiarity with sensory terms, as recommended by Meilgaard, Civille and Carr (2006).
2.3.2 Pre-selection
A screening test of the team of volunteers was conducted to verify the level of sensory acuity in relation to the discrimination power of the two samples (A and B) with small degree of sensory difference. Therefore, a series of four triangular tests was performed, where the judges selected (62% of female and 38% of male) were those with a correctness percentage higher than 75%.
In the triangle test, three samples properly coded with three random digits were presented to the judges, of which two were the same and one different. It was asked that the judge identify the different sample. The presentation order of the samples to the judges was balanced, where sometimes chocolate “A” was different and sometimes chocolate “B” was different (AAB, ABA, BAA, BBA, BAB, ABB), as recommended by Stone et al. (2012).
The samples used in this test consisted of two different chocolate blends, as follows: (A) 90% milk chocolate and 10% dark chocolate, and (B) 50% milk chocolate and 50% dark chocolate. Composition of the different test formulations was defined in preliminary triangular tests so that these formulations present small but perceptible sensory difference magnitudes (p < 0.05).
2.3.3 Definition of the sensory attributes for the reference materials
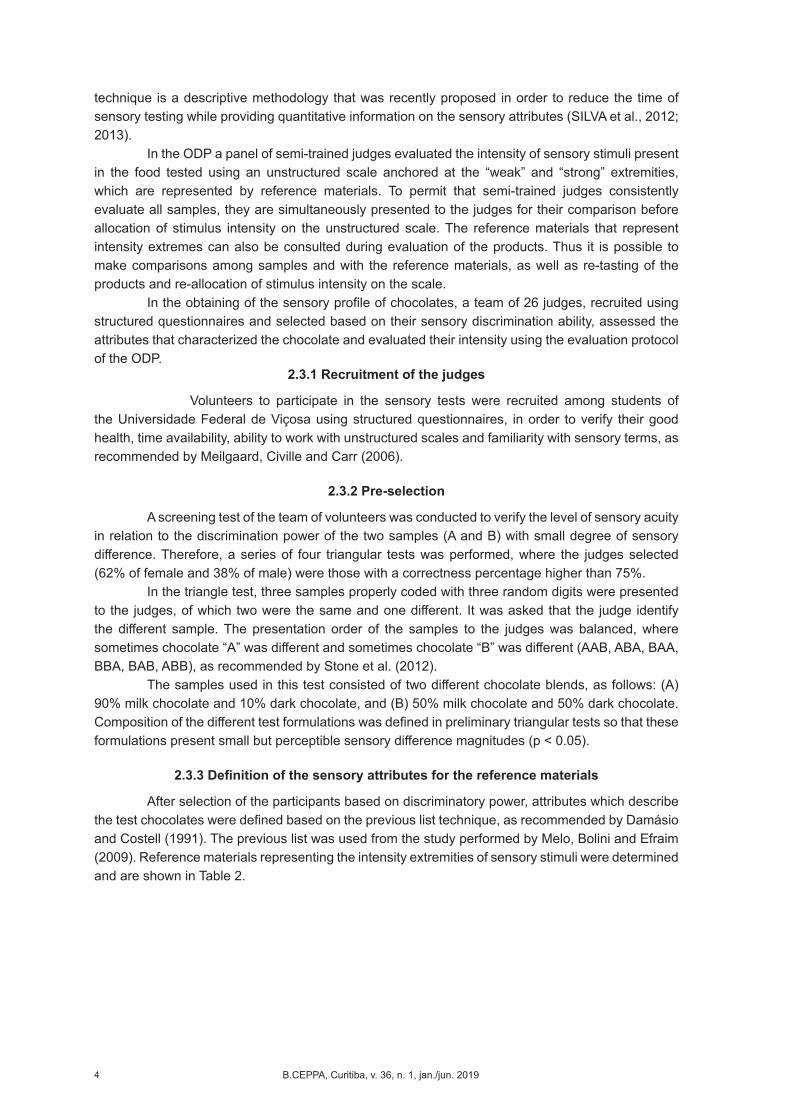
After selection of the participants based on discriminatory power, attributes which describe the test chocolates were defined based on the previous list technique, as recommended by Damásio and Costell (1991). The previous list was used from the study performed by Melo, Bolini and Efraim (2009). Reference materials representing the intensity extremities of sensory stimuli were determined and are shown in Table 2.
B.CEPPA, Curitiba, v. 36, n. 1, jan./jun. 2019 5
TABLE 2 - DEFINITION OF THE SENSORY ATTRIBUTES AND THE RESPECTIVE REFERENCE MATERIAL.
Attributes Definition Reference MaterialsAppearance
Brown color Brown color characteristic of chocolate.
Weak: milk chocolate (instrumental color - L:37.90; a:9.82; b:11.88)
Strong: formulation with 50% dark chocolate (35% cocoa) and 50% dark chocolate (70% cocoa) (final
formulation: instrumental color L:28.45; a:5.40; b:4.35)
Aroma
Cocoa mass aroma Aroma characteristic of bittersweet chocolate
Weak: milk chocolateStrong: formulation with 50% dark chocolate (35% cocoa) and 50%
dark chocolate (70% cocoa)Flavor
Cocoa mass flavor Characteristic flavor of bittersweet chocolate
Weak: milk chocolate
Strong: formulation with 50% dark chocolate (35% cocoa) and 50%
dark chocolate (70% cocoa)
Sweetness Sweet characteristic of a sugar solution (sucrose)
Weak: formulation with 50% dark chocolate (35% cocoa) and 50%
dark chocolate (70% cocoa)
Strong: milk chocolate
Bitterness Bitter taste that remains in the mouth after swallowing chocolate
Weak: milk chocolate
Strong: dark chocolate (70% cocoa)
Texture
Firmness Hardness of chocolate perceived by contact with teeth (bite)
Weak: milk chocolate (instrumental firmness: 43.90 N)
Strong: dark chocolate (70% cocoa) (final formulation: instrumental
firmness 119.45 N)
Spreadability Melting of chocolate in the mouth
Weak: dark chocolate (70% cocoa) (final formulation: instrumental
firmness 119.45 N)Strong: milk chocolate (instrumental
firmness: 43,90 N)
Adhesiveness Feeling of the product “stuck” on the tongue and palate.
Weak: dark chocolate (70% cocoa) (final formulation: instrumental
firmness 119.45 N)
Strong: milk chocolate (instrumental firmness: 43.90 N)
L: luminosity color component; a: green-red color component; b: blue-yellow color component; N: unit of force (Newton). The formulations and reference materials were processed using chocolates of the same brand.
Reference materials for the color attribute were products that presented inferior (“weak” reference) and superior (“strong” reference) coordinates of the CIELAB system compared to the products under evaluation. Regarding the attributes of texture, the reference materials presented instrumental firmness of 43.90 N (milk chocolate) and 119.45 N (dark chocolate), which anchored
B.CEPPA, Curitiba, v. 36, n. 1, jan./jun. 20196
the intensity extremities of the sensory stimuli hardness, spreadability and adhesiveness. For the attributes of aroma and flavor, the blend formulations consisting of milk chocolate (25% cocoa) and dark chocolate (35 and 70% cocoa) were used, which allowed for obtaining the sensible intensity differences and extremities regarding the formulations under evaluation.
2.3.4 Familiarization of the staff with the reference materials
After determining the attribute descriptors, a familiarization session was performed with the reference materials, as recommended for the ODP technique (SILVA et al., 2012; 2013). Thus, the judges participated in a familiarization session with descriptive terms and their reference materials. In this session, the objective was to standardize the evaluation form and clearly state which sensory stimulus was referred to by each term, in addition to anchoring the extremes of the unstructured scale (“weak” and “strong”). Samples were presented to the judges in individual booths containing white light, the descriptive terms and their reference materials. The judges were asked to read the definition of sensory stimulus and taste the references. In the ODP, reference materials are qualitative and quantitative, therefore they identify/define the sensory attribute and anchor the extremes of the evaluation scale. After this step, evaluation of the chocolates was initiated.
2.3.5 Evaluation of the chocolate formulations
Evaluation of the chocolates in the ODP was performed using the attribute-by-attribute protocol proposed by Ishii, Chang and O’mahony (2007) to avoid sensory fatigue of the panelists, since all samples and reference materials are provided simultaneously in a single session (SILVA et al., 2012). Thus, each sensory attribute is evaluated individually in each session.
In the evaluation sessions, the judge received the four chocolate formulations (blends and control), coded with three random digits, which were presented in a randomized and balanced order, and it was requested to evaluate the product in relation to a particular sensory stimulus. Reference materials (“weak” and “strong”) of the sensory attribute evaluated were also presented to the judge along with the samples. Thus, the judge could compare the samples among themselves and with the references before allocating sensory stimulus on the sensory scale.
The evaluation form was organized by attributes and contained the 9 cm unstructured scale (interval) associated with each formulation. The judge was asked to compare the samples among themselves and with the reference materials, and then allocate the stimulus intensity on the intensity scale.
Measurements were carried out according to a Randomized Block Design (RBD), so that all the judges evaluated all formulations. Three evaluation repetitions per judge were performed and only one attribute per session was evaluated. Therefore, there was a total of 24 sessions for the assessment of all attributes.
2.3.6 Data analysis
To obtain the sensory scores the interval between the left extreme of the scale and the mark made by the judge was measured with a ruler and the results were analyzed by means of the Principal Component Analysis (PCA) to obtain the sensory map, as described in Gacula et al. (2008). Data was also analyzed using the Dunnet’s test (α = 0.05) for comparing the blends with the control (traditional dark chocolate), in relation to each individual sensory attribute.
2.4 CONSUMER TEST: OVERALL ACCEPTANCE
The sensory acceptance test was conducted with 120 habitual chocolate consumers (57% of female and 43% of male). The formulations (blends and control), wrapped in foil, were served to the consumers containing random and monadic three-digit codes. Judges were asked to rinse their mouth between evaluations.
B.CEPPA, Curitiba, v. 36, n. 1, jan./jun. 2019 7
Tests were performed in individual booths with white light and sensory acceptability was measured by the nine-point hedonic scale, ranging from “extremely disliked” (score 1) to “extremely liked” (score 9), as described in Stone, Bleibaum and Thomas (2012). Analysis of the results were performed using the preference map (GACULA et al., 2008).
3. RESULTS AND DISCUSSION
3.1 SENSORY CHARACTERIZATION OF THE CHOCOLATE: ODP
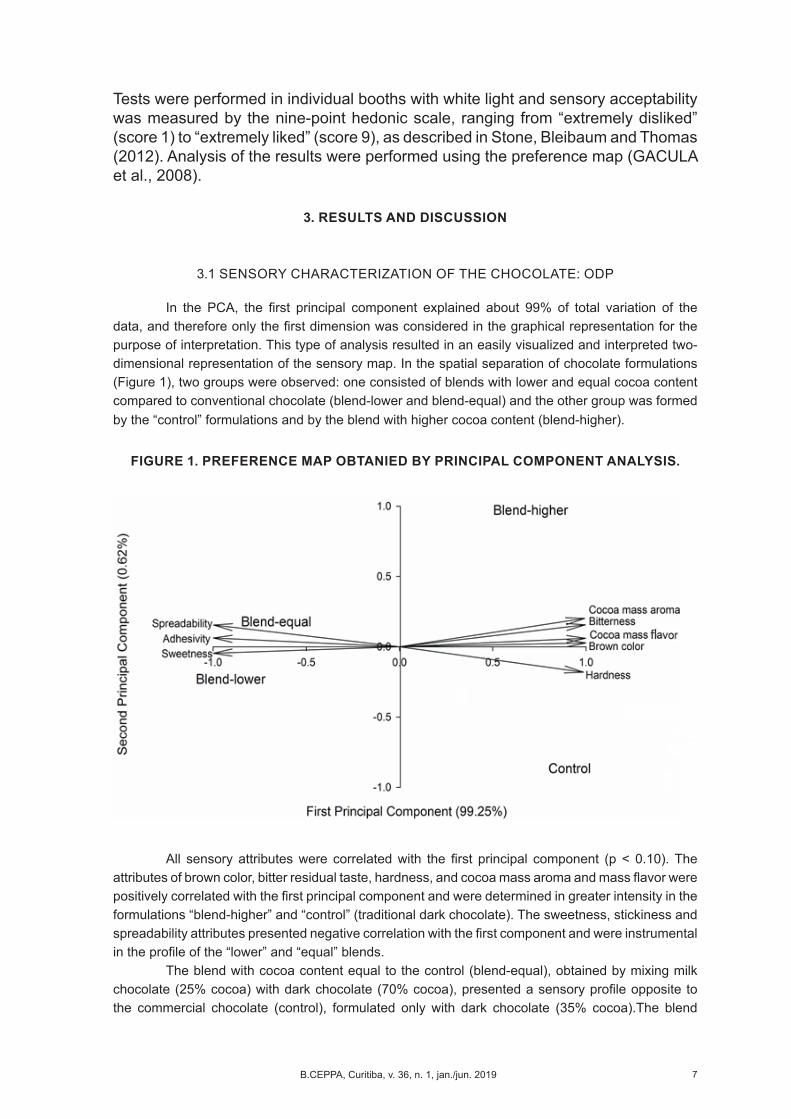
In the PCA, the first principal component explained about 99% of total variation of the data, and therefore only the first dimension was considered in the graphical representation for the purpose of interpretation. This type of analysis resulted in an easily visualized and interpreted two-dimensional representation of the sensory map. In the spatial separation of chocolate formulations (Figure 1), two groups were observed: one consisted of blends with lower and equal cocoa content compared to conventional chocolate (blend-lower and blend-equal) and the other group was formed by the “control” formulations and by the blend with higher cocoa content (blend-higher).
FIGURE 1. PREFERENCE MAP OBTANIED BY PRINCIPAL COMPONENT ANALYSIS.
All sensory attributes were correlated with the first principal component (p < 0.10). The attributes of brown color, bitter residual taste, hardness, and cocoa mass aroma and mass flavor were positively correlated with the first principal component and were determined in greater intensity in the formulations “blend-higher” and “control” (traditional dark chocolate). The sweetness, stickiness and spreadability attributes presented negative correlation with the first component and were instrumental in the profile of the “lower” and “equal” blends.
The blend with cocoa content equal to the control (blend-equal), obtained by mixing milk chocolate (25% cocoa) with dark chocolate (70% cocoa), presented a sensory profile opposite to the commercial chocolate (control), formulated only with dark chocolate (35% cocoa).The blend
B.CEPPA, Curitiba, v. 36, n. 1, jan./jun. 20198
formulation presented less intense brown color, less bitter, less hardness and milder cocoa aroma and flavor, indicating that blending technology altered the sensory characteristics of the product, considering a lower cocoa content in the final product.
Milk chocolate is a product obtained with lower content of cocoa mass, higher concentrations of fat, sugar and solid milk fats, and is also subject to less time for refining and conching of the mass, where both processes are performed at lower temperatures (NEBESNY & ZYZELEWICZ, 2005). Milder processing (shorter time and lower temperature) of the mass triggers Maillard reactions and more controlled caramelization, which contributes to the formation of a smaller concentration of aroma and flavor precursor compounds in the chocolate (AFOAKWA et al., 2009). The higher sugar content in the formulation contributes to increase the sweet taste and the fat from cocoa butter and milk favors the formation of a softer texture and better spreadability on the palate (RICHTER; LANNES, 2007). The “blend-equal” formulation was obtained by mixing 9.6g of milk chocolate with 2.4g of dark chocolate (70% cocoa), and therefore the predominant features of milk chocolate characterized the final mixture.
The “control” chocolate presented a similar sensory profile to chocolate with the higher cocoa content (blend-higher), indicating that the cocoa content of 35% to 47%, when conducted using the blending technology, did not alter the sensory profile of the product.
The predominant sensory characteristics of milk chocolate also favored the sensory profile of the “blend-higher”, which was formulated with 50% milk chocolate (6.0g) and 50% dark chocolate (6.0g). This blend showed color and flavor characteristics similar to the dark chocolate control, Table 3, but the texture characteristics (hardness, spreadability and adhesiveness) were significantly (p < 0.05) different, with lower intensity of hardness, and greater spreadability and adhesiveness.
In comparison of the blends with the control chocolate in relation to each sensory attribute, by Dunnet’s test (Table 3), it was found that the “blend-lower” and “blend-equal” chocolates presented significant difference from the control (p < 0.05) in relation to all sensory attributes, presenting sensory profile opposite to the control. Chocolate with higher cocoa content (blend-higher) was similar to the control, presenting a significant difference (p < 0.05) only in relation to the texture attributes (hardness, spreadability and adhesiveness). This indicates that mixtures technology favors the texture of the final product, leaving it softer, even this displaying a higher concentration of cocoa solids.
TABLE 3 - COMPARISON BETWEEN BLENDS AND COMMERCIAL CHOCOLATE (CONTROL) SCORES BY DUNNET TEST (P = 0.05).
AttributesFormulations
blend-lower blend-equal blend-higher ControlBrown color 1.6* 3.1* 7.3ns 7.4
Cocoa mass aroma 1.3* 2.3* 6.9ns 7.2Sweetness 7.6* 6.8* 2.4ns 2.2Bitterness 0.7* 1.5* 5.9ns 6.1
Cocoa mass flavor 1.0* 1.8* 6.9ns 7.0Firmness 1.5* 2.4* 6.1* 7.9
Spreadability 7.9* 6.9* 2.9* 1.7Adhesiveness 7.6* 6.9* 2.8* 1.8* differ significantly of control sample at 5% probability; ns: do not differ of control sample.
B.CEPPA, Curitiba, v. 36, n. 1, jan./jun. 2019 9
3.2 SENSORY ACCEPTANCE
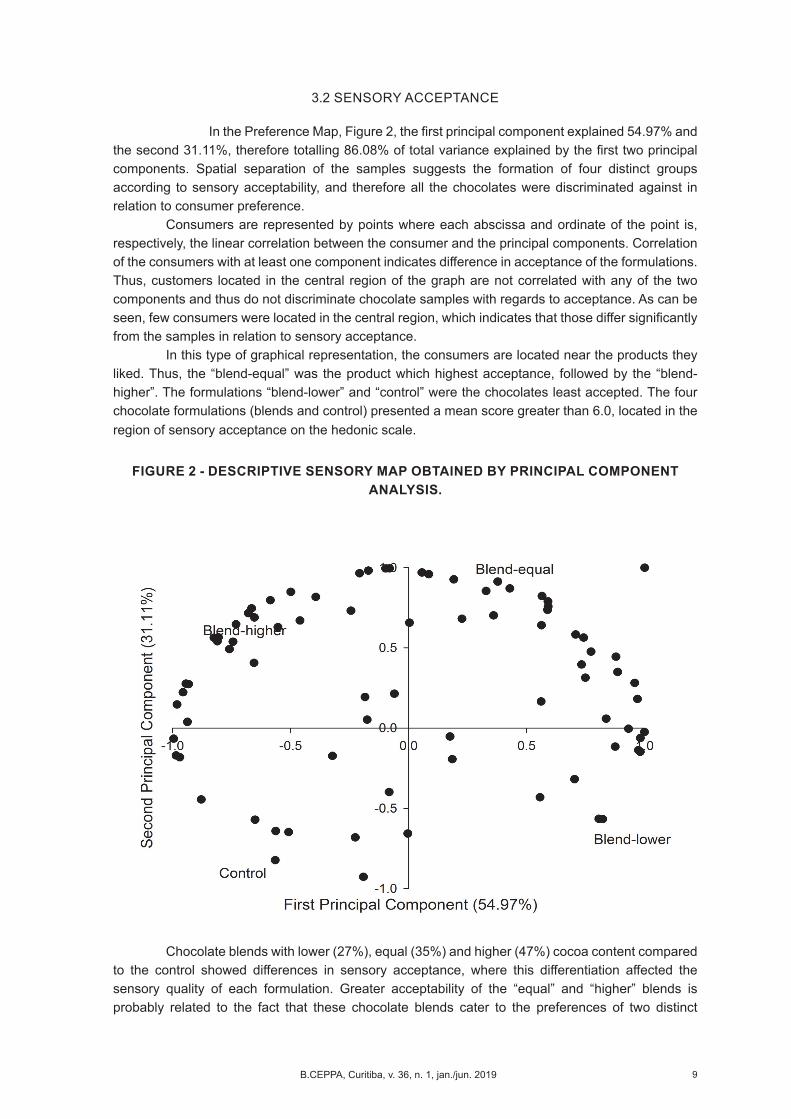
In the Preference Map, Figure 2, the first principal component explained 54.97% and the second 31.11%, therefore totalling 86.08% of total variance explained by the first two principal components. Spatial separation of the samples suggests the formation of four distinct groups according to sensory acceptability, and therefore all the chocolates were discriminated against in relation to consumer preference.
Consumers are represented by points where each abscissa and ordinate of the point is, respectively, the linear correlation between the consumer and the principal components. Correlation of the consumers with at least one component indicates difference in acceptance of the formulations. Thus, customers located in the central region of the graph are not correlated with any of the two components and thus do not discriminate chocolate samples with regards to acceptance. As can be seen, few consumers were located in the central region, which indicates that those differ significantly from the samples in relation to sensory acceptance.
In this type of graphical representation, the consumers are located near the products they liked. Thus, the “blend-equal” was the product which highest acceptance, followed by the “blend-higher”. The formulations “blend-lower” and “control” were the chocolates least accepted. The four chocolate formulations (blends and control) presented a mean score greater than 6.0, located in the region of sensory acceptance on the hedonic scale.
FIGURE 2 - DESCRIPTIVE SENSORY MAP OBTAINED BY PRINCIPAL COMPONENT ANALYSIS.
Chocolate blends with lower (27%), equal (35%) and higher (47%) cocoa content compared to the control showed differences in sensory acceptance, where this differentiation affected the sensory quality of each formulation. Greater acceptability of the “equal” and “higher” blends is probably related to the fact that these chocolate blends cater to the preferences of two distinct
B.CEPPA, Curitiba, v. 36, n. 1, jan./jun. 201910
consumer types, those who tend to prefer chocolate with sensory characteristics of milk chocolate, such as the group near the formulation “blend-equal”, and the consumers that preferred chocolates with a sensory profile characteristic of dark chocolate (“blend-higher”). Both chocolate blends differed from the control for all attributes related to texture (hardness, spreadability and adhesiveness) (Table 3) and were more accepted than the commercial formulation (control); this shows that the texture characteristics of chocolate were the attributes that most impacted its acceptability, and more intense bitter taste was not a rejection factor for the consumers.
The formulation of milk chocolate and dark chocolate blends resulted in acquisition of a final product showing differentiated sensory characteristics and greater consumer acceptance. Chocolate blends with higher cocoa content presented higher sensory acceptance due to the more pleasing texture characteristics, and still allowed for incorporation of higher cocoa content in the product, providing greater health benefits.
The chocolate blending process during processing of bonbons, truffles, toppings, and other chocolate-based products is a simple procedure that allowed the incorporation of a higher cocoa content into products and also improved the sensory characteristics of the final product.
4 CONCLUSION
The use of milk chocolate and dark chocolate blends is presented as an alternative to industries producing bonbons, truffles, toppings and chocolate-derived products, providing better sensory quality than dark chocolate.
For the same cocoa content in the final product, the chocolate blend presented differentiated sensory property from conventional chocolate (dark) and was more accepted by consumers. Incorporation of higher cocoa levels in chocolate blends also allowed for maintaining the bitter taste desired by consumers, and at the same time improving the textural properties and sensory acceptance of the product.
RESUMO
BLENDS COMO UMA ALTERNATIVA PARA O CHOCOLATE AMARGO: ABORDAGEM COM PAINEL TREINADO E CONSUMIDORES
O chocolate é um produto muito apreciado pelas suas características sensoriais. Em relação à saúde, é o amargo que possui maiores benefícios, devido a compostos naturalmente presentes no cacau. Entretanto, um chocolate com alto teor de sólidos de cacau, apresenta como características predominantes um elevado gosto amargo residual e maior dureza, afetando diretamente na aceitabilidade dos consumidores. O objetivo deste trabalho foi estudar a substituição do chocolate amargo tradicional por blends contendo teores de cacau menor (27%), igual (35%) e maior (47%) ao chocolate tradicional (amostra controle). Os chocolates foram caracterizados pelos atributos sensoriais: cor marrom, aroma e sabor de massa de cacau, gosto doce, gosto amargo residual, dureza, espalhabilidade e adesividade por meio de uma nova técnica descritiva, o Perfil Descritivo Otimizado. A aceitabilidade foi avaliada por 120 consumidores, utilizando escala hedônica de nove pontos. Os resultados foram analisados por meio da análise de componentes principais, teste de Dunnet e Mapa de Preferência. Os blends “equal” e “higher” apresentaram diferença do controle para todos os atributos relacionados à textura e foram mais aceitos que a formulação comercial, isto evidencia que as características de textura do chocolate foram os atributos que definiram a aceitabilidade. A tecnologia de blends se mostrou uma alternativa para melhorar a aceitabilidade de chocolates com maior teor de cacau.
B.CEPPA, Curitiba, v. 36, n. 1, jan./jun. 2019 11
PALAVRAS-CHAVE: BLENDS DE CHOCOLATE; ACEITABILIDADE; PERFIL DESCRITIVO OTIMIZA-DO; QUALIDADE SENSORIAL.
REFERENCES
1. AFOAKWA, E.O.; PATERSON, A.; FOWLER, M.; RYAN, A. Matrix effects on flavour volatiles release in dark chocolates varying in particle size distribution and fat content using GC–mass spectrometry and GC–olfactometry. Food Chemistry, v. 113, n. 1, p. 208–215, 2009.
2. CORTI, R.; LAMMER. A.; HOLLENBERG, N.K.; LUSCHER, T.F. Cocoa and Cardiovascular Helth. Circulation, v. 119, n. 10, p. 1433-1441, 2009.
3. DAMÁSIO, M.H.; COSTELL, E. Análisis sensorial descriptivo: generación de descriptores y selección de catadores. Revista Agroquímica de Tecnologia Alimentaria, v. 31, n. 2, p. 165-178. 1991.
4. DESCH, S.; SCHMIDT, J.; KOBLER, D.; SONNABEND, M.; EITEL, I.; SAREBAN, M. Effect of cocoa products on blood pressure: systematic review and meta-analysis. American Journal of Hypertension, v. 23, n.1, p. 97-103, 2010.
5. EFRAIM, P. Estudos para minimizara as perdas de flavonoides durante a fermentação de semente de cacau para produção de chocolate. Campinas, 126f, 2004. Dissertação (Mestrado em Tecnologia de Alimentos). Universidade Estadual de Campinas.
6. FARAH, R. Chocolate: energia e saúde. São Paulo: Alaúde Editorial, 2008, 151p.
7. GUEDES, G.B. Elaboração e análise sensorial de chocolates com propriedades funcionais. 2007, 32p. Dissertação de mestrado - Faculdade Assis Gurgacz Cascavel.
8. ISHII, R.; CHANG, H.; O’MAHONY, M. Comparison of serial monadic and attribute-by-attribute protocols for simple descriptive analysis with untrained judges. Food Quality and Preference, v. 18 n. 2, p. 440–449, 2007.
9. KATZ, D.L.; DOUGHTY, K.; ALI, A. Cocoa and chocolate in human health and disease. Antioxidants & Redox Signaling, v. 15, p. 2779 – 2811, 2011.
10. LAMUELA-RAVENTÓS, R.M.; ROMERO-PÉREZ, A.I.; ANDRÉS-LACUEVA, C.; TORNERO, A. Review: health effects of cocoa flavonoids. Food Science and Technology. Int. v. 11, p. 159–176, 2005.
11. LIPPI, G.; FRANCHINI, M.; MONTAGNANA, M.; FAVALORO, E.J.; GUIDI, G.C.; TARGHER, G. Dark chocolate: Consumption for pleasure or therapy? Journal of Throbosis and Thrombolysis, v. 28, n. 4, p. 482-488, 2009.
12. MEILGAARD, M.C.; CIVILLE, G.V.; CARR, B.T. Sensory Evaluation Techniques. 4. ed. Boca Raton: CRC Press, 2006.
13. MELO, L.L.M.M.; BOLINI, H.M.A.; EFRAIM, P. Sensory profile, acceptability, and their relationship for diabetic/reduced calorie chocolates. Food Quality and Preference, v. 20, n. 2, p. 138–143, 2009.
14. NEBESNY, E.; ZYZELEWICZ, D. Effect of lecithin concentration on properties of sucrose-free chocolate masses sweetened with isomalt. European Food Research and Technology, v. 220, n. 2, p. 131-135, 2005.
15. PASCHOAL, V.; KALLUF, L. Fome de bom humor. In: MARANGONI, S. (Edit.). Revista Nutrir, v. 2, p. 32-35, 2009.
16. RICHTER, M.; LANNES, S. C. S. Bombom para dietas especiais: avaliação química e sensorial. Ciência e Tecnologia de Alimentos. v. 27, n. 1, p. 193-200, 2007.
17. SANTOS-BUELGA, C.; SCALBERT, A Proanthocyanidins and tannin-like compounds– nature, occurrence, dietary intake and effectson nutrition and health (review). Journal of the Science Food and Agriculture, v. 80, p. 1094-1117, 2000.
18. SILVA, R.C.S.N.; MINIM, V.P.R.; SIMIQUELI, A.A.; MORAES, L.E.S.; GOMIDE, A.I.; MINIM, L.A. Optimized Descriptive Profile: A rapid methodology for sensory description. Food Quality and Preference, v. 24, p. 190-200, 2012.
19. SILVA, R.C.S.N.; MINIM, V.P.R.; CARNEIRO, J.D.S.; NASCIMENTO, M.; DELLA LUCIA, S.M.; MINIM, L.A. Quantitative sensory description using the Optimized Descriptive Profile: comparison with conventional and alternative methods for evaluation of chocolate. Food Quality and Preference, v. 30, p. 169-179. 2013.
20. STONE, H.; BLEIBAUM, R.N.; THOMAS, H.A. Sensory evaluation practices. 4. ed. Orlando, USA: Academic Press, 2012.
21. WORCH, T.; ENNIS, J.M. Investigating the single ideal assumption using Ideal Profile Method. Food Quality and
Preference, v. 29, p. 40–47, 2013.
B.CEPPA, Curitiba, v. 36, n. 1, jan./jun. 201912
ACKNOWLEDGEMENTS
The authors would like to acknowledge the Conselho Nacional de Pesquisa e Desenvolvimento (CNPq) and Fundação de Amparo à Pesquisa de Minas Gerais (Fapemig) for their financial support.