blogs, podcasts gain interest trustworthy sources as b2b...
TRANSCRIPT
2018 CONTENT PREFERENCES SURVE Y REPORT
SURVEY REPORT
Blogs, Podcasts Gain Interest As B2B Buyers Look To
For Credible Content That
Proves Value
Trustworthy Sources
SPONSORED BY

2018 CONTENT PREFERENCES SURVEY REPORT | 2
INTRODUCTIONAs B2B purchases grow longer and more complex, buyers are becoming increasingly more selective in the content they are consuming and the amount of time spent with each piece of content. To that end, B2B buyers continue to rely more on trustworthy sources, industry influencers and their peers to educate themselves.
According to findings from Demand Gen Report’s annual Content Preferences Survey, buyers are becoming more discerning and selective in the content they decide to consume. A majority (88%) agree that content producers need to focus less on product specifics and more on the value that can be brought to their business. Three-quarters (75%) strongly agree that producers should use more data and research to support the claims and suggestions made in their content.
These trends are driving a reemergence of some formats — particularly blogs and podcasts — in which buyers can easily access through a variety of devices. Blog posts were cited as one of the most consumed content formats, with 71% of respondents stating they reviewed a blog while on their buying journey. Podcasts were cited by 64% of respondents as a valuable content format in the early stage of the buying journey — only falling short of infographics (76%).
Other notable content formats preferred by buyers include:
• Case studies (79%);
• Webinars (66%);
• Video (49%); and
• Interactive content (36%).
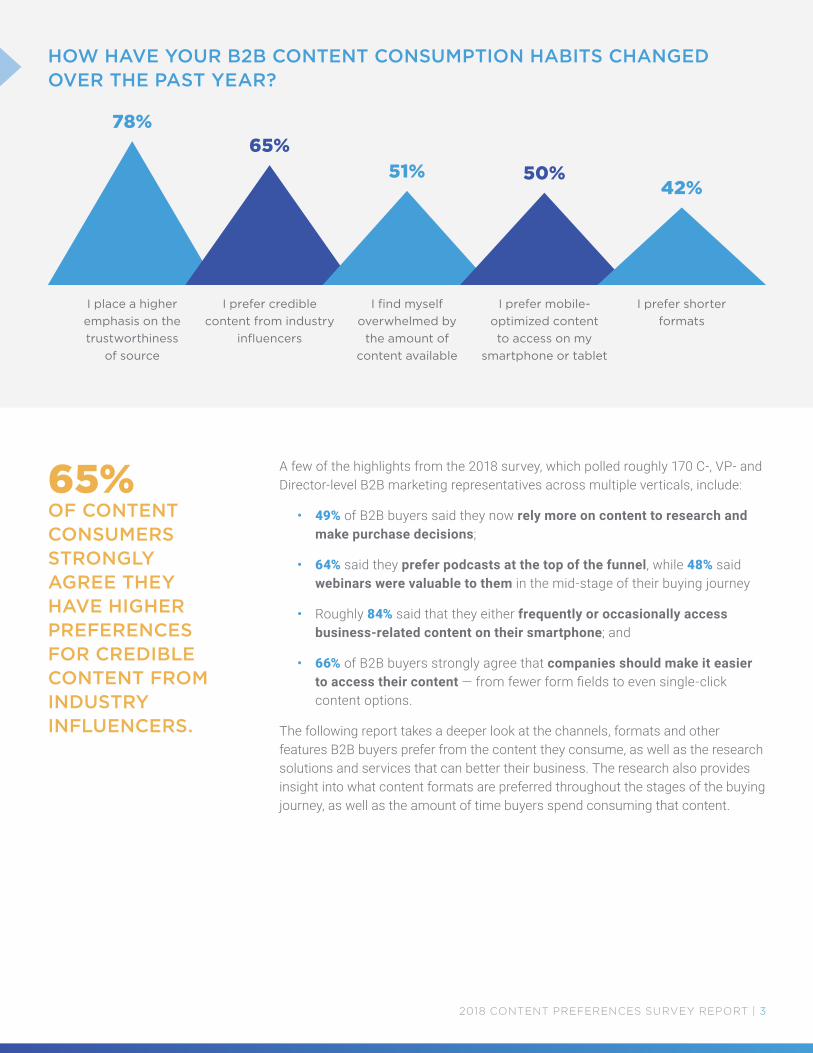
Seventy-eight percent of B2B buyers strongly agree they are placing a higher emphasis on trustworthiness in the content’s source — a 3% increase year over year. Furthermore, close to two-thirds (65%) of content consumers strongly agree they have higher preferences for credible content from industry influencers.
BUYERS ARE BECOMING MORE DISCERNING AND SELECTIVE IN THE CONTENT THEY DECIDE TO CONSUME.
A few of the highlights from the 2018 survey, which polled roughly 170 C-, VP- and Director-level B2B marketing representatives across multiple verticals, include:
• 49% of B2B buyers said they now rely more on content to research and make purchase decisions;
• 64% said they prefer podcasts at the top of the funnel, while 48% said webinars were valuable to them in the mid-stage of their buying journey
• Roughly 84% said that they either frequently or occasionally access business-related content on their smartphone; and
• 66% of B2B buyers strongly agree that companies should make it easier to access their content — from fewer form fields to even single-click content options.
The following report takes a deeper look at the channels, formats and other features B2B buyers prefer from the content they consume, as well as the research solutions and services that can better their business. The research also provides insight into what content formats are preferred throughout the stages of the buying journey, as well as the amount of time buyers spend consuming that content.
65% OF CONTENT CONSUMERS STRONGLY AGREE THEY HAVE HIGHER PREFERENCES FOR CREDIBLE CONTENT FROM INDUSTRY INFLUENCERS.
2018 CONTENT PREFERENCES SURVEY REPORT | 3
HOW HAVE YOUR B2B CONTENT CONSUMPTION HABITS CHANGED OVER THE PAST YEAR?
I prefer shorter formats
I prefer mobile-optimized content to access on my
smartphone or tablet
I find myself overwhelmed by
the amount of content available
I prefer credible content from industry
influencers
I place a higher emphasis on the trustworthiness
of source
78%65%
51% 50%42%
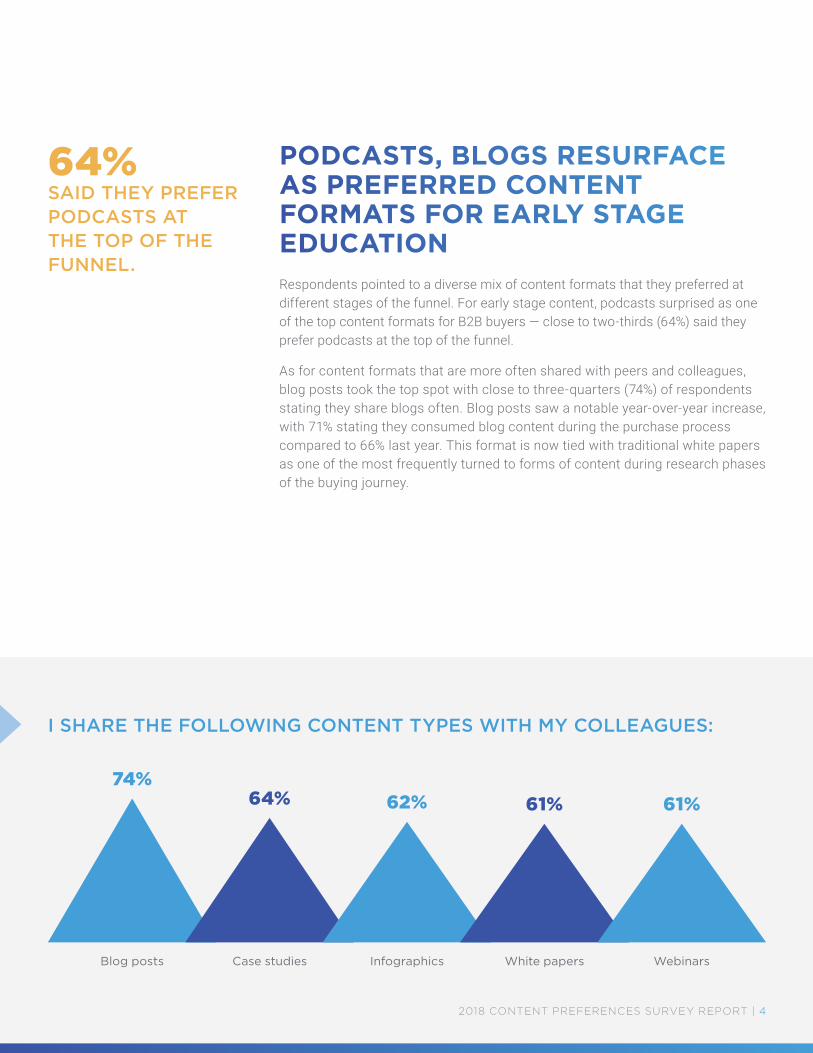
I SHARE THE FOLLOWING CONTENT TYPES WITH MY COLLEAGUES:
WebinarsWhite papersInfographicsCase studiesBlog posts
74%64% 62% 61% 61%
PODCASTS, BLOGS RESURFACE AS PREFERRED CONTENT FORMATS FOR EARLY STAGE EDUCATIONRespondents pointed to a diverse mix of content formats that they preferred at different stages of the funnel. For early stage content, podcasts surprised as one of the top content formats for B2B buyers — close to two-thirds (64%) said they prefer podcasts at the top of the funnel.
As for content formats that are more often shared with peers and colleagues, blog posts took the top spot with close to three-quarters (74%) of respondents stating they share blogs often. Blog posts saw a notable year-over-year increase, with 71% stating they consumed blog content during the purchase process compared to 66% last year. This format is now tied with traditional white papers as one of the most frequently turned to forms of content during research phases of the buying journey.
64% SAID THEY PREFER PODCASTS AT THE TOP OF THE FUNNEL.
2018 CONTENT PREFERENCES SURVEY REPORT | 4
Other notable formats often shared with colleagues include:
• Case studies (64%);
• Infographics (62%);
• Webinars (61%); and
• Third-party/analyst reports (55%).
Infographics (76%) and interactive content (51%) were two additional content types respondents emphasized as helpful when tackling business challenges. This shows that buyers continue to prefer short-form, ungated content that can be accessed on any device.
In terms of which channels content is most frequently shared: email (70%) and LinkedIn (52%) continue to rank the highest, which was similar to last year. Facebook, in particular, saw notable growth, with 38% stating they occasionally or frequently share business-related content on the social platform.
2018 CONTENT PREFERENCES SURVEY REPORT | 5
71%STATED THEY CONSUMED BLOG CONTENT DURING THE PURCHASE PROCESS COMPARED TO 66% LAST YEAR.
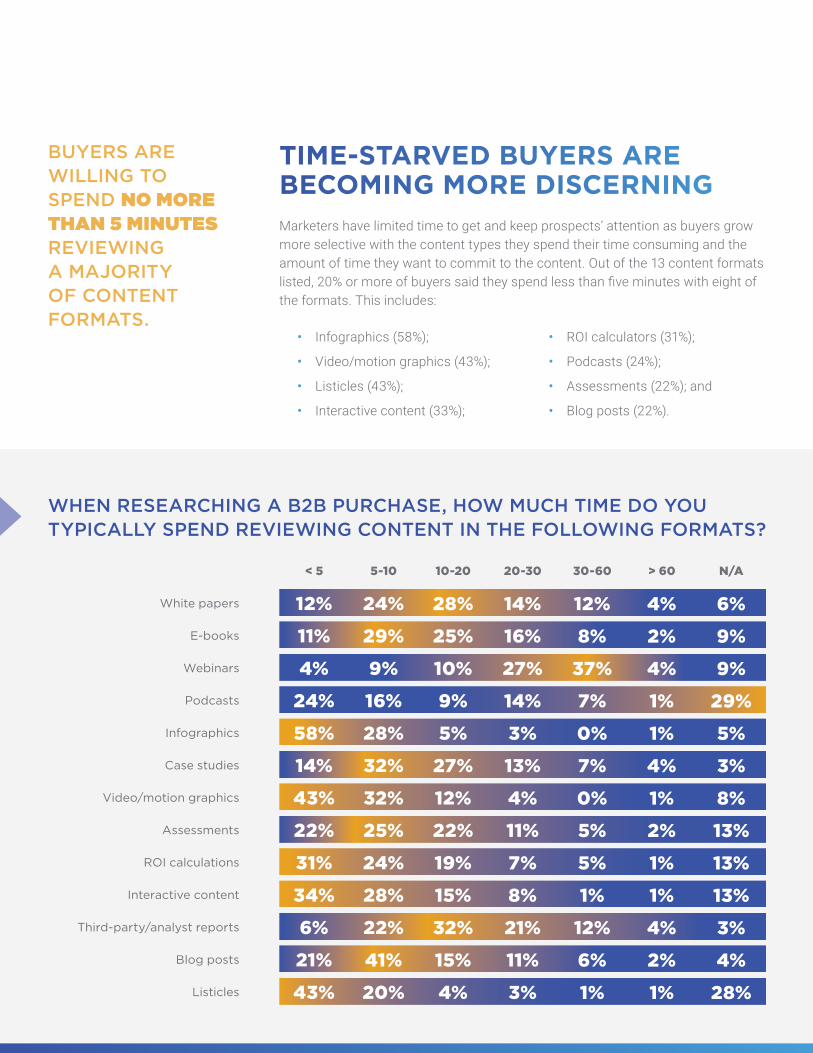
WHEN RESEARCHING A B2B PURCHASE, HOW MUCH TIME DO YOU TYPICALLY SPEND REVIEWING CONTENT IN THE FOLLOWING FORMATS?
Infographics
Third-party/analyst reports
Case studies
Blog posts
Listicles
Podcasts
Interactive content
Webinars
ROI calculations
E-books
Assessments
White papers
< 5 5-10 10-20 20-30 30-60 > 60 N/A
Video/motion graphics
12%
11%
4%
24%
58%
14%
43%
22%
31%
34%
6%
21%
43%
24%
29%
9%
16%
28%
32%
32%
25%
24%
28%
22%
41%
20%
28%
25%
10%
9%
5%
27%
12%
22%
19%
15%
32%
15%
4%
14%
16%
27%
14%
3%
13%
4%
11%
7%
8%
21%
11%
3%
12%
8%
37%
7%
0%
7%
0%
5%
5%
1%
12%
6%
1%
4%
2%
4%
1%
1%
4%
1%
2%
1%
1%
4%
2%
1%
6%
9%
9%
29%
5%
3%
8%
13%
13%
13%
3%
4%
28%
TIME-STARVED BUYERS ARE BECOMING MORE DISCERNINGMarketers have limited time to get and keep prospects’ attention as buyers grow more selective with the content types they spend their time consuming and the amount of time they want to commit to the content. Out of the 13 content formats listed, 20% or more of buyers said they spend less than five minutes with eight of the formats. This includes:
BUYERS ARE WILLING TO SPEND NO MORE THAN 5 MINUTES REVIEWING A MAJORITY OF CONTENT FORMATS.
• Infographics (58%);
• Video/motion graphics (43%);
• Listicles (43%);
• Interactive content (33%);
• ROI calculators (31%);
• Podcasts (24%);
• Assessments (22%); and
• Blog posts (22%).

OF THE FOLLOWING CONTENT FORMATS, WHICH DO YOU FIND MOST VALUABLE FOR EARLY, MID AND LATE STAGES OF THE BUYING PROCESS?
Infographics
B2B media/news sites
Podcasts
E-books
Industry newsletters/publications
76%65%64%62%61%
ROI calculators
Case studies
Assessments
Colleagues and peers
Third-party/ analyst reports
48%42%40%
35%25%
Third-party/ analyst reports
Webinars
Interactive content
Case studies
Blogs by thought leaders/industry analysts
48%47%
43%42%40%
Early Stage Mid Stage Late Stage
BUYERS WILLING TO GIVE MORE TIME, INFORMATION FOR WEBINAR CONTENTWebinar content continues to be a staple for B2B buyers in the mid-stage of the sales funnel. Close to half of respondents (48%) said webinars were their top choice and most valuable content format in the mid-stage of their buying journey.
Other content formats buyers find valuable at the mid-stage of the funnel include:
• Third-party/analyst reports (48%);
• Interactive content (43%); and
• Colleagues and peers (41%).
48% OF RESPONDENTS SAID WEBINARS WERE THEIR TOP CHOICE AND MOST VALUABLE CONTENT FORMAT IN THE MID-STAGE OF THEIR BUYING JOURNEY.
2018 CONTENT PREFERENCES SURVEY REPORT | 7
Webinars also topped the list as the content format buyers are willing to spend the most time consuming. More than one-third (37%) said that they spend between 30 and 60 minutes reviewing the content. In comparison, third-party analyst reports came in second place, with only 12% stating they would spend 30 to 60 minutes reviewing that type of content.
Webinars are tied with white papers as the top content formats buyers are willing to register for and share information about themselves and their company, with three out of every four respondents (75%) stating they would share more information to receive webinar content.
For late-stage content, ROI calculators (48%), case studies (40%) and assessments (40%) were said to be the most valuable to fuel final purchase decisions. This emphasizes buyer demands for specific insight into how solutions and tactics will benefit their business, and how their peers are seeing ROI.
75% OF RESPONDENTS STATED THEY WOULD SHARE MORE INFORMATION TO RECEIVE WEBINAR CONTENT.
2018 CONTENT PREFERENCES SURVEY REPORT | 8
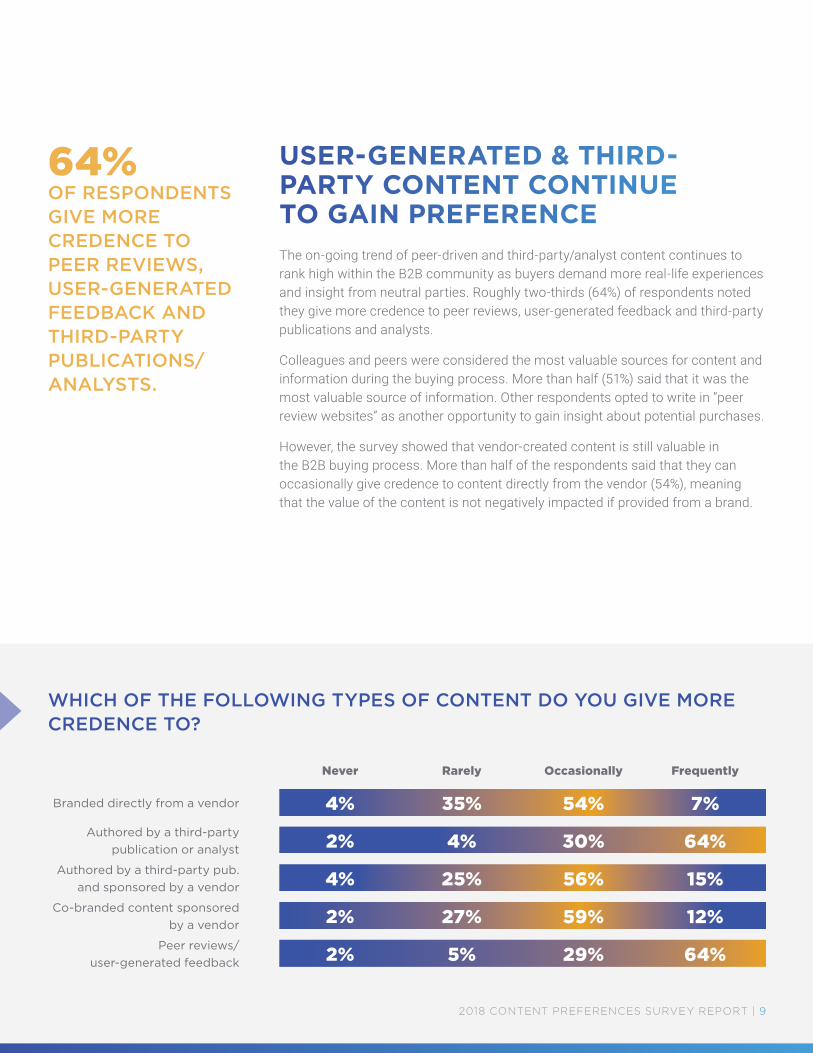
WHICH OF THE FOLLOWING TYPES OF CONTENT DO YOU GIVE MORE CREDENCE TO?
Peer reviews/ user-generated feedback
Co-branded content sponsored by a vendor
Authored by a third-party pub. and sponsored by a vendor
Authored by a third-party publication or analyst
Branded directly from a vendor
Never Rarely Occasionally Frequently
4%
2%
4%
2%
2%
35%
4%
25%
27%
5%
54% 7%
30% 64%
56% 15%
59% 12%
29% 64%
USER-GENERATED & THIRD-PARTY CONTENT CONTINUE TO GAIN PREFERENCEThe on-going trend of peer-driven and third-party/analyst content continues to rank high within the B2B community as buyers demand more real-life experiences and insight from neutral parties. Roughly two-thirds (64%) of respondents noted they give more credence to peer reviews, user-generated feedback and third-party publications and analysts.
Colleagues and peers were considered the most valuable sources for content and information during the buying process. More than half (51%) said that it was the most valuable source of information. Other respondents opted to write in “peer review websites” as another opportunity to gain insight about potential purchases.
However, the survey showed that vendor-created content is still valuable in the B2B buying process. More than half of the respondents said that they can occasionally give credence to content directly from the vendor (54%), meaning that the value of the content is not negatively impacted if provided from a brand.
64% OF RESPONDENTS GIVE MORE CREDENCE TO PEER REVIEWS, USER-GENERATED FEEDBACK AND THIRD-PARTY PUBLICATIONS/ANALYSTS.
2018 CONTENT PREFERENCES SURVEY REPORT | 9
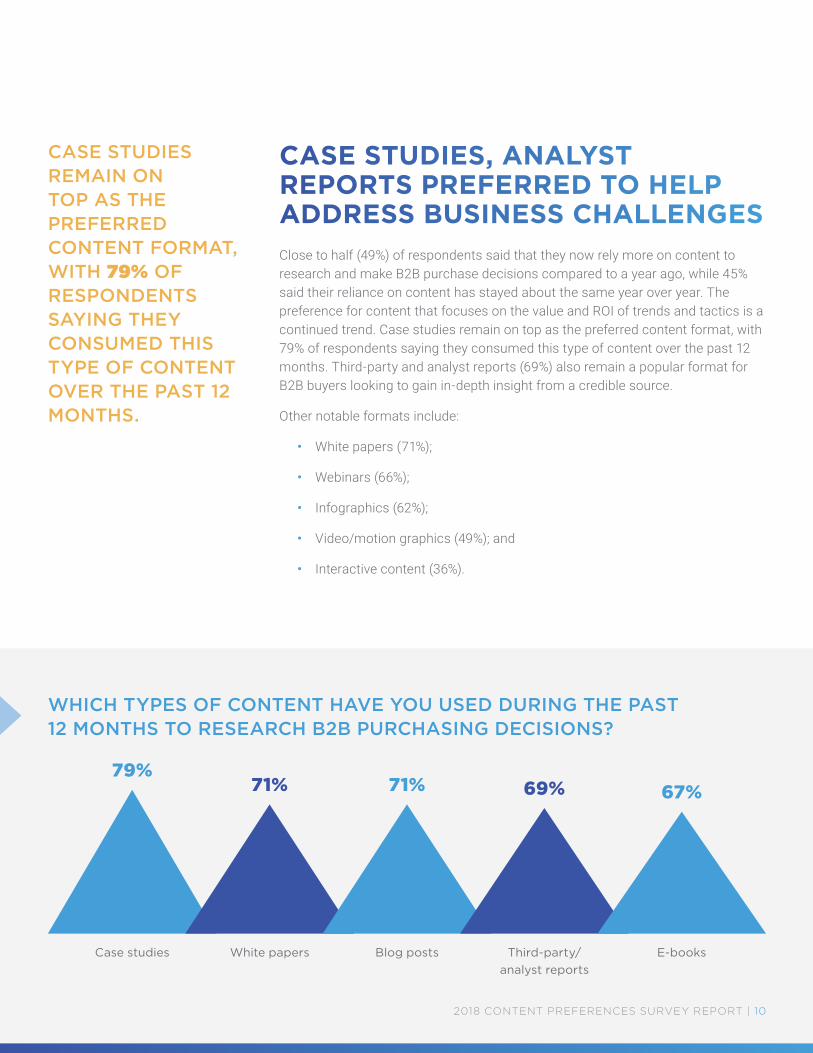
WHICH TYPES OF CONTENT HAVE YOU USED DURING THE PAST 12 MONTHS TO RESEARCH B2B PURCHASING DECISIONS?
E-booksThird-party/analyst reports
Blog postsWhite papersCase studies
79%71% 71% 69% 67%
CASE STUDIES, ANALYST REPORTS PREFERRED TO HELP ADDRESS BUSINESS CHALLENGESClose to half (49%) of respondents said that they now rely more on content to research and make B2B purchase decisions compared to a year ago, while 45% said their reliance on content has stayed about the same year over year. The preference for content that focuses on the value and ROI of trends and tactics is a continued trend. Case studies remain on top as the preferred content format, with 79% of respondents saying they consumed this type of content over the past 12 months. Third-party and analyst reports (69%) also remain a popular format for B2B buyers looking to gain in-depth insight from a credible source.
Other notable formats include:
• White papers (71%);
• Webinars (66%);
• Infographics (62%);
• Video/motion graphics (49%); and
• Interactive content (36%).
CASE STUDIES REMAIN ON TOP AS THE PREFERRED CONTENT FORMAT, WITH 79% OF RESPONDENTS SAYING THEY CONSUMED THIS TYPE OF CONTENT OVER THE PAST 12 MONTHS.
2018 CONTENT PREFERENCES SURVEY REPORT | 10

Buyers continue to engage with multiple assets during their buying cycle, according to the research. Prior to engaging with a salesperson, 40% of survey respondents said that they consumed between three and five pieces of content. This is smaller compared to our 2016 survey, in which 47% said they consume that same amount of content. Roughly one-quarter (21%) said they consume between five and seven pieces of content before engaging a sales rep, which is a notable increase from 17% in 2016.
PRIOR TO ENGAGING WITH A SALESPERSON, 40% OF SURVEY RESPONDENTS SAID THAT THEY CONSUMED BETWEEN THREE AND FIVE PIECES OF CONTENT.
2018 CONTENT PREFERENCES SURVEY REPORT | 11
HOW MANY PIECES OF CONTENT HAVE YOU TYPICALLY CONSUMED BEFORE ENGAGING WITH A SALESPERSON WHEN YOU ARE AMID MAKING A PURCHASE DECISION?
More than 75-73-51-3
22%
40%
21%17%

HOW WOULD YOU LIKE TO SEE B2B VENDORS ORGANIZE THE CONTENT ON THEIR WEBSITES?
By location/geographic region
Other
By size of organization
By specific vertical
By business role
By industry 64%
52%
46%
18%
13%
14%
BUYERS WANT CONTENT BUNDLED, ORGANIZED BY BUSINESS NEEDThe survey also highlights the continued trend of buyers demanding content that speaks directly to their concerns and how the subject matter can bring value to their business. When asked what recommendations they would give to improve the quality of the content created and offered by B2B vendors, more than half (52%) strongly agreed that packaging relevant content together would help expedite the research phase. Also, 52% said content should focus less on product specifics and more on value.
Survey respondents were able to write in any unique ways they would prefer to see content bundled together or organized on vendor websites, and of the 20% that shared, roughly half wrote that they would like to see content organized by specific pain points and topics.
Respondents also said they would like to see content organized on vendor websites by:
• Specific verticals within industries (46%);
• The size of the organization (18%); and
• Location or geographic region (14%).
52% STRONGLY AGREED THAT PACKAGING RELEVANT CONTENT TOGETHER WOULD HELP EXPEDITE THE RESEARCH PHASE.
2018 CONTENT PREFERENCES SURVEY REPORT | 12
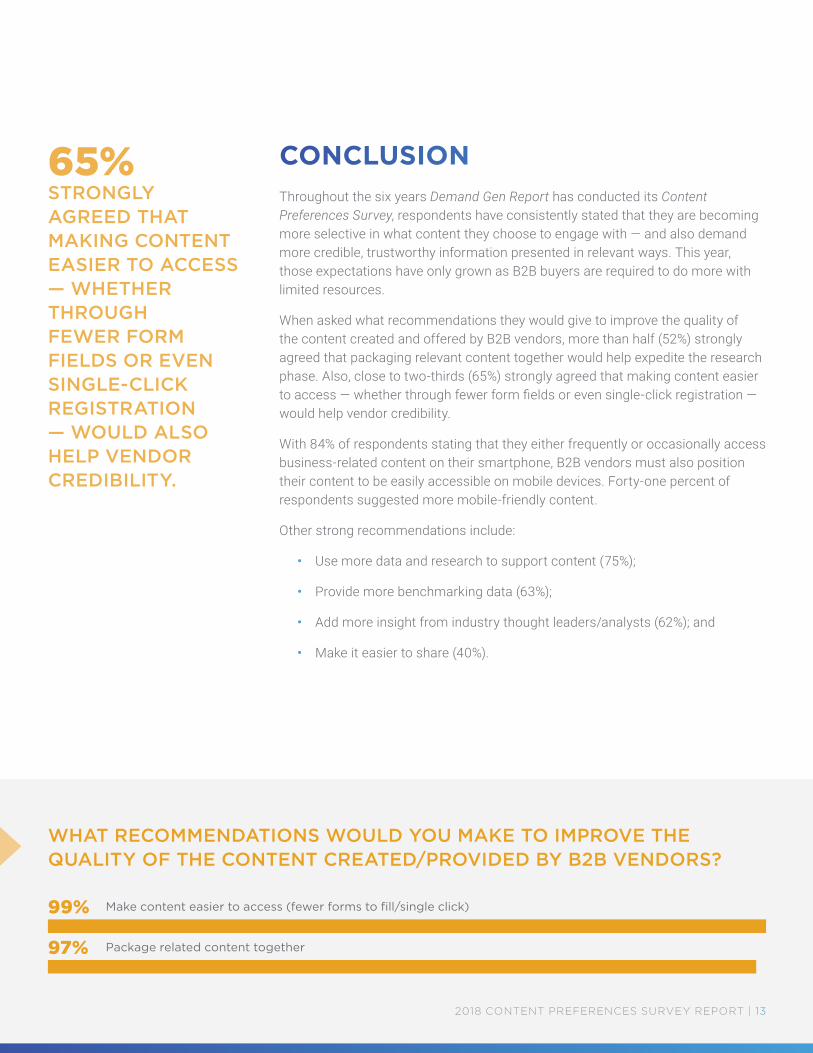
WHAT RECOMMENDATIONS WOULD YOU MAKE TO IMPROVE THE QUALITY OF THE CONTENT CREATED/PROVIDED BY B2B VENDORS?
Make content easier to access (fewer forms to fill/single click)
Package related content together
99%
97%
CONCLUSIONThroughout the six years Demand Gen Report has conducted its Content Preferences Survey, respondents have consistently stated that they are becoming more selective in what content they choose to engage with — and also demand more credible, trustworthy information presented in relevant ways. This year, those expectations have only grown as B2B buyers are required to do more with limited resources.
When asked what recommendations they would give to improve the quality of the content created and offered by B2B vendors, more than half (52%) strongly agreed that packaging relevant content together would help expedite the research phase. Also, close to two-thirds (65%) strongly agreed that making content easier to access — whether through fewer form fields or even single-click registration — would help vendor credibility.
With 84% of respondents stating that they either frequently or occasionally access business-related content on their smartphone, B2B vendors must also position their content to be easily accessible on mobile devices. Forty-one percent of respondents suggested more mobile-friendly content.
Other strong recommendations include:
• Use more data and research to support content (75%);
• Provide more benchmarking data (63%);
• Add more insight from industry thought leaders/analysts (62%); and
• Make it easier to share (40%).
65%STRONGLYAGREED THATMAKING CONTENTEASIER TO ACCESS— WHETHERTHROUGHFEWER FORMFIELDS OR EVENSINGLE-CLICKREGISTRATION— WOULD ALSOHELP VENDORCREDIBILITY.
2018 CONTENT PREFERENCES SURVEY REPORT | 13
ABOUT THE SURVEYThe 2018 Content Preferences Survey was conducted in Q1 2018 and surveyed 168 B2B marketing and sales professionals. Eighteen percent of the respondents hold C-level positions in their company, while 17% hold VP-level positions. More than half of the respondents either hold director-level (26%) or manager-level (29%) positions.
The top industries respondents associated themselves with include:
• Business Services/Consulting (32%);
• Software/Technology (25%);
• Tech/Enterprise IT (12%);
• Manufacturing (7%);
• Healthcare (4%); and
• Financial Services (4%).
Roughly 38% of respondents work for a company with an annual revenue of $50 million or more.
2018 CONTENT PREFERENCES SURVEY REPORT | 14
Content4Demand (C4D) is a business-to-business content strategy and content creation agency. Our team of content marketing experts specializes in two main areas: creating turnkey content to reach B2B buyers at all stages of the buyer’s journey and developing foundational marketing strategies including persona creation, content messaging development and nurture campaign design. Our ultimate goal is to construct buyer-focused content and marketing strategies that drive leads and stimulate demand for your business. C4D works with B2B companies across a variety of industry verticals including: technology, financial, manufacturing, media, healthcare and more. For more information and content samples, visit content4demand.com.
201.687.1179
ON24 is on a mission to empower data-driven marketers with the engagement they need to succeed in the digital world. Through the company’s demand generation platform, over 2,000 businesses engage their prospects, customers and employees for a total of one billion minutes per year. With one of the largest ecosystems of marketing automation and CRM platforms, ON24 transforms engagement into behavioral data helping marketers better qualify leads, accelerate sales pipeline and drive revenue.
877.202.9599

Demand Gen Report is a targeted online publication that uncovers the strategies and solutions that help companies better align their sales and marketing organizations, and ultimately, drive growth. A key component of the publication’s editorial coverage focuses on the sales and marketing automation tools that enable companies to better measure and manage their multi-channel demand generation efforts.
201.257.8528
INTERESTED IN LEARNING MORE?
YOU MIGHT ALSO LIKE...
2018 Demand Gen Benchmark Survey
2017 Content Preferences Survey
What's Working in Demand Generation?
Brian Anderson Avid B2B journalist with a knack for all things trendy in the demand generation, account-based marketing, artificial intelligence, and database management space.
ABOUT THE AUTHOR