blood and marrow transplantation (bmt) filefollowing bmt. • gvhd is the most frequent cause of...
TRANSCRIPT

Blood and Marrow Transplantation (BMT)
!!
Philip McCarthy, M.D. Blood and Marrow Transplant Program
Roswell Park Cancer Institute 2014
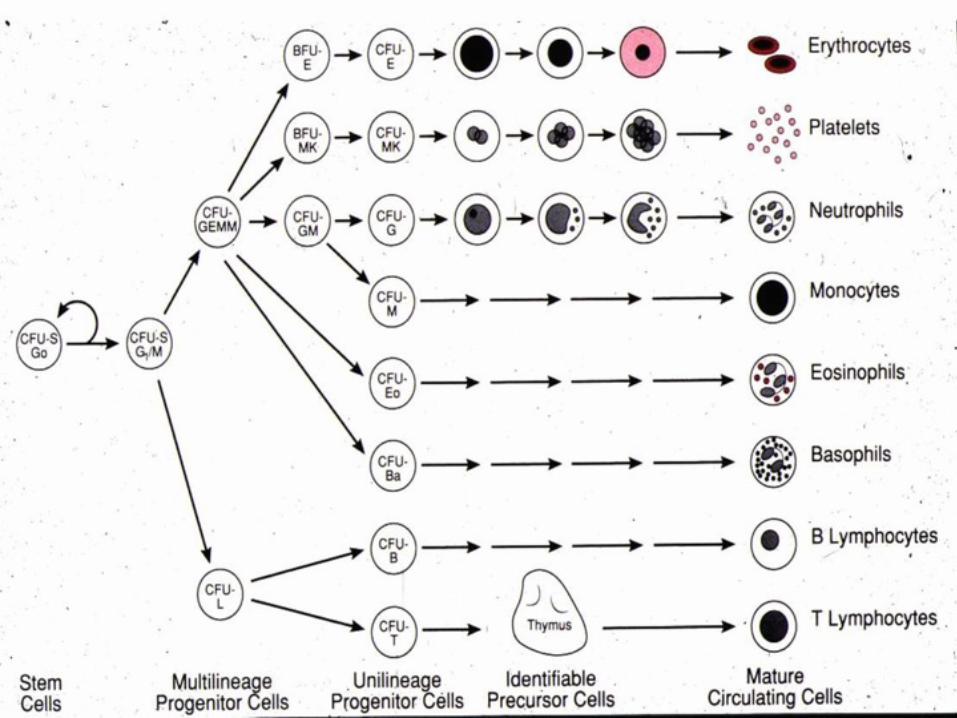

BFU-E

CFU-GM

CFU-GEMM


Bone Marrow Product

Mobilization of Stem Cells into the Peripheral Blood
Dreger et al BJH 1994

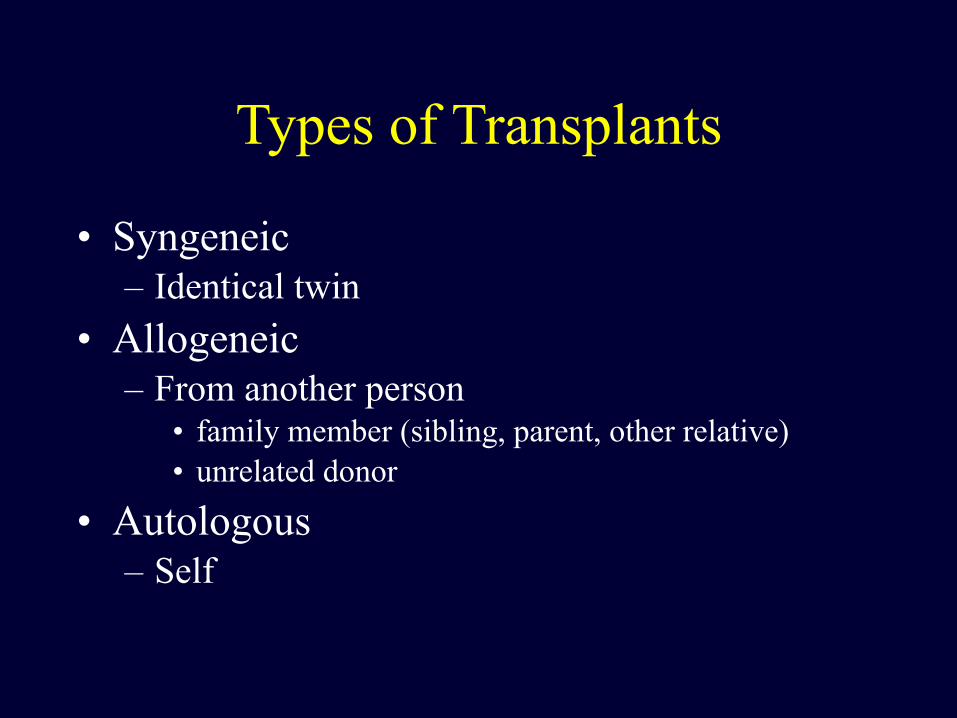
Types of Transplants
• Syngeneic – Identical twin
• Allogeneic – From another person
• family member (sibling, parent, other relative) • unrelated donor
• Autologous – Self

RPCI BMT Program:
• Autologous up to age 75 • Allogeneic
– Myeloablative up to age 60 – Reduced Intensity up to age 75
• Goal: Increasing patient access with decreasing mortality and improved outcome – Reduce the toxicity of chemotherapy and radiation
therapy – Reduce the toxicity of Graft-versus-Host Disease
(GvHD) and preserve the Graft-versus-Tumor (GvT) effect

Hematopoietic Stem Cell Transplantation - Classification -
Allogeneic
HLA-identical Other Unrelated sibling relative
Umbilicalcord blood
Negative or positive selection
Ex vivo expansion
Donor
Graft Source
Graft manipulation
Bone Marrow
Peripheral Blood
Peripheral Blood
Bone Marrow
In vivo selection
Non-myeloablative
Conditioning Regimen Intensity
Reduced Intensity Myeloablative
Syngeneic Autologous
Courtesy M Pasquini, CIBMTR

Patient
Autologous BMT
Freezer
High dose Chemo +/-XRT
Blood or Marrow Collection
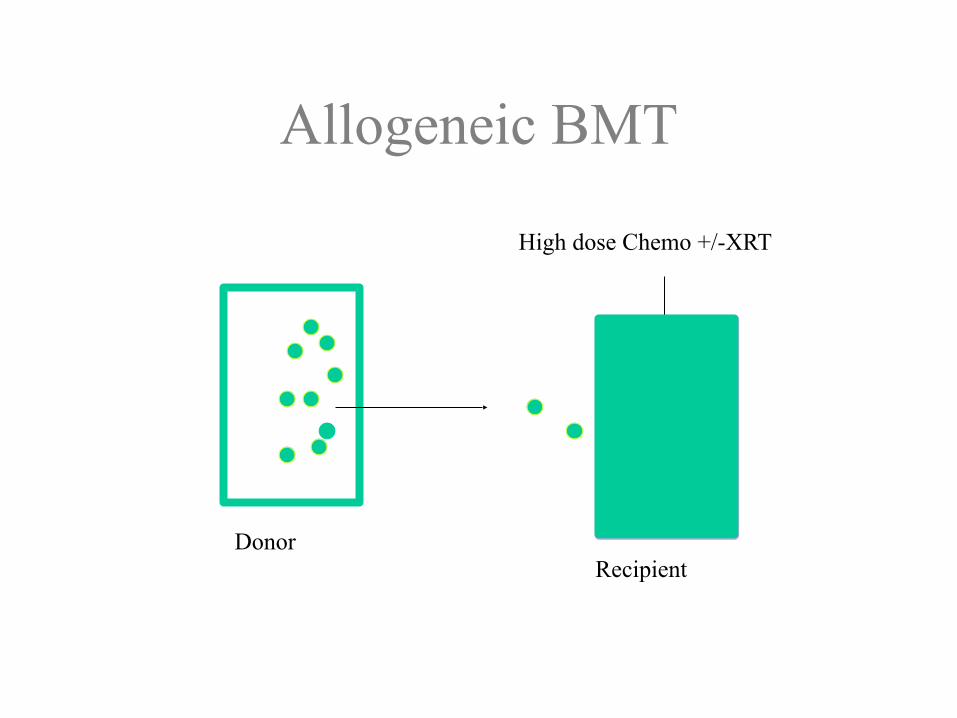
Allogeneic BMT
DonorRecipient
High dose Chemo +/-XRT

HLA (Human Leukocyte Antigens) Inheritance Simplified
A2 A23B7 B51DR 01 DR 04
A2 A11B7 B15
DR 01 DR 11
A 2 A30B 7 B35
DR 01 DR 13
A23 A11B51 B15
DR 04 DR 11
A23 A30B51 B35
DR 04 DR 13
A23 A30B51 B35
DR 04 DR 13
A11 A30B15 B35DR 11 DR 13
Father Mother

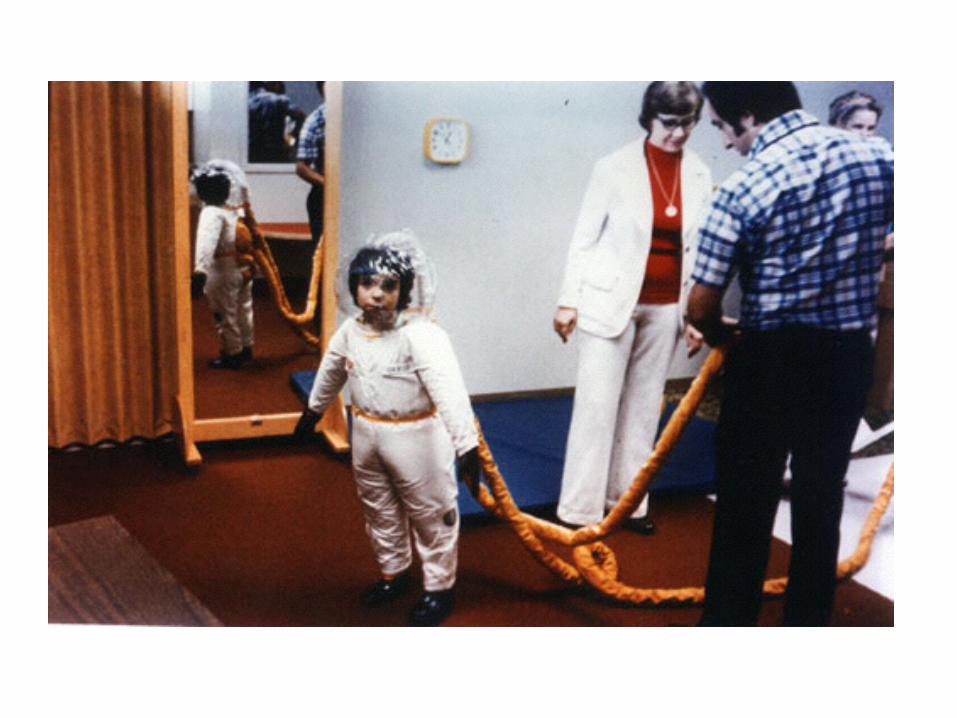


Bubble Boy (2001)


Graft-versus-Host Disease (GvHD) and Graft-versus-Tumor (GvT)
• Graft-versus-Host Disease (GvHD) is caused by the immune activation of donor cells recognizing recipient cells as foreign.
• Acute GvHD occurs ~ 100 days after BMT and affects Skin, GI tract and Liver.
• Chronic GvHD occurs after acute GvHD; up to 3 years following BMT.
• GvHD is the most frequent cause of mortality after allogeneic BMT.
• However, GvHD is accompanied by a Graft-versus-Tumor (GvT) effect that can result in eradication of the underlying cancer.

Scylla (GvHD) and Charybdis (Tumor)
http://www.gosanangelo.com/news/2009/aug/29/tell-me-a-story-8212-aug-308212-scylla-and-a/
GvHD
Tumor

MECHANISM OF GVHD
APC
IL-1
TIL-2R
T T
M
CTLNK
Target cell Death
Lymphokine dysregulation
Ag presentation
Cell activation
Clonal proliferation & differentiation
Afferent phase
Efferent phase
Courtesy of Mohamed Soliman RPCI Flow Cytometry
IL-2
T
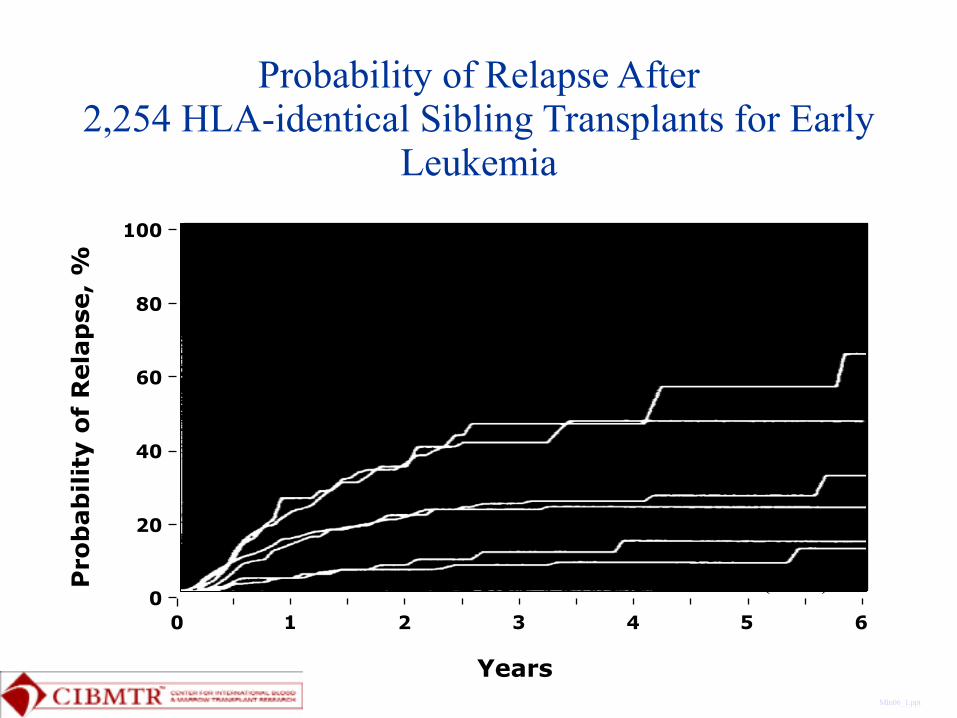
Probability of Relapse After 2,254 HLA-identical Sibling Transplants for Early
Leukemia
Mln06_1.ppt
0 2 4 61 3 50
20
40
60
80
100
Pro
bab
ility
of
Rel
apse
, %
Years
T Depletion (n=401)
Twins (N=70)
No GVHD (n=433)
AGVHD Only (n=738)
AGVHD + CGVHD (N=485)
CGVHD Only (N=127)
Twins (N=70)
T Depletion (n=401)
No GVHD (n=433)
AGVHD Only (n=738)CGVHD Only (N=127)
AGVHD + CGVHD (N=485)


Transplant regimensImmunosuppression
Myelosuppression
Flu-Cy Flu-Cy-ATG Flu-low dose
TBI Flu ATG
Cy-TBI Bu-CyFlu-Mel
Flu-Bu Flu-Mel-TBI
Regimen Related Toxicity
Later Graft-versus Disease Effect Earlier Anti-Disease Effect
Allo Nonmyeloablative
Allo Reduced Intensity
Auto and Allo Myeloablative
Relapse

Transplant Center-‐Specific Analysis 2013
• There are 168 Allogeneic BMT Centers reporting to the NMDP.
• There are 13/168 (8%) Allogeneic BMT Centers with survival outcomes that are statistically superior to their expected outcomes
• RPCI is one of these 13 Allogeneic BMT centers • Data Source: http://marrow.org/Patient/
Transplant_Planning/Choosing_a_Transplant_Center/U_S__Transplant_Centers.aspx
RPCI Transplant Center-‐Specific Survival Analysis 2013 Report (v 04 24 14) 35

Transplant Center Data
• Analysis based on: – Unrelated and related donor allogeneic patients 1/1/2009-‐12/31/2011 with follow-‐up to 12/31/2012 (3-‐year rolling average)
– Analysis only includes centers whose one-‐year patient status was known for >90% of transplanted recipients
• Essential risk factors include: Diagnosis, Recipient (R)/Donor (D) age, R/D gender, R race, Performance Status (KPS), disease/status, HLA match, conditioning regimen, donor and cell source, co-‐morbidities, R CMV status, time from diagnosis to BMT, prior autologous BMT
• Baseline and follow-‐up data were provided to the CIBMTR at the time of transplant (baseline), and at 100 days, six months and annually post-‐transplant, using standardized forms
RPCI Transplant Center-‐Specific Survival Analysis 2013 Report (v 04 24 14)

Transplant Center-‐Specific Analysis
• Number of Patients Transplanted • Case Mix Score • Actual 1-‐year overall survival rate • Predicted 1-‐year overall survival rate • 95% confidence interval (CI) for the predicted 1-‐year overall
survival rate (affected by # of patients transplanted by center, the larger the #, the narrower the CI)
• Results – each transplant center statistically has one of the following: – Lower survival rate than predicted (actual survival is <95% CI) – Similar survival rate to predicted (actual survival within 95% CI) – Higher survival rate than predicted (actual survival is >95% CI)
RPCI Transplant Center-‐Specific Survival Analysis 2013 Report (v 04 24 14)
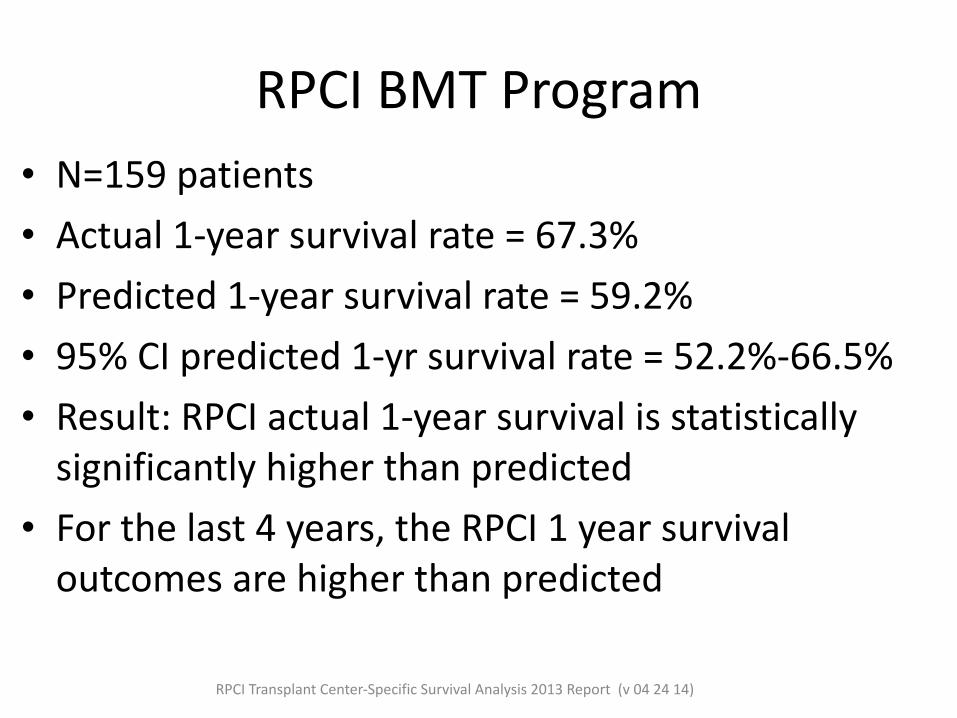
RPCI BMT Program• N=159 patients • Actual 1-‐year survival rate = 67.3% • Predicted 1-‐year survival rate = 59.2% • 95% CI predicted 1-‐yr survival rate = 52.2%-‐66.5% • Result: RPCI actual 1-‐year survival is statistically significantly higher than predicted
• For the last 4 years, the RPCI 1 year survival outcomes are higher than predicted
RPCI Transplant Center-‐Specific Survival Analysis 2013 Report (v 04 24 14)

RPCI BMT Program
Risk Category
0
1
2
3
4
5Ac
tual and
Predicted
O
verall Survival
0%
20%
40%
60%
80%
100%
2009 2010 2011 2012 2013
Risk Categories range from 0 (lowest risk) to 5 (highest risk). Analysis prepared by the Center for International Blood and Marrow Transplant Research (CIBMTR) for patients who received a related or unrelated donor BMT (3-‐year rolling average). The 2013 report analyzes patients transplanted from 2009 to 2011. * Significantly higher survival rate than predicted
58% 66%* 68%* 70%* 67%*52% 55% 58% 58% 59%4 5 5 5 5
RPCI Transplant Center-‐Specific Survival Analysis 2013 Report (v 04 24 14)

Chimera
All That Remains, Patricia Cornwell, Charles Scribner’s Sons New York, 1992, p 368
“Around the time he disappeared from his bookstore, Steven was treated for aplastic anemia at UVA,” I said. “I’ve talked with his hematologist. Steven received total lymphoid irradiation, chemotheraphy (sic). Gordon’s marrow was infused into Steven, and Steven then spent time in a laminar flow room…”

Mutational Complexity of Acute Myeloid Leukemia (AML).
Patel JP et al. N Engl J Med 2012;366:1079-1089.

Multivariate Risk Classification of Patients with Intermediate-Risk AML.
Patel JP et al. N Engl J Med 2012;366:1079-1089.

Revised Risk Stratification of Patients with AML on the Basis of Integrated Genetic Analysis.
Patel JP et al. N Engl J Med 2012;366:1079-1089.

Mouse Models of Hematopoietic Stem Cell Transplantation
Dr. X.Cao Dr. J. Lau
Dr. M. Nemeth Dr. E. Repasky Dr. G Chen Dr. T Hahn
Dr. A. Gudkov Dr. A. Shakhov
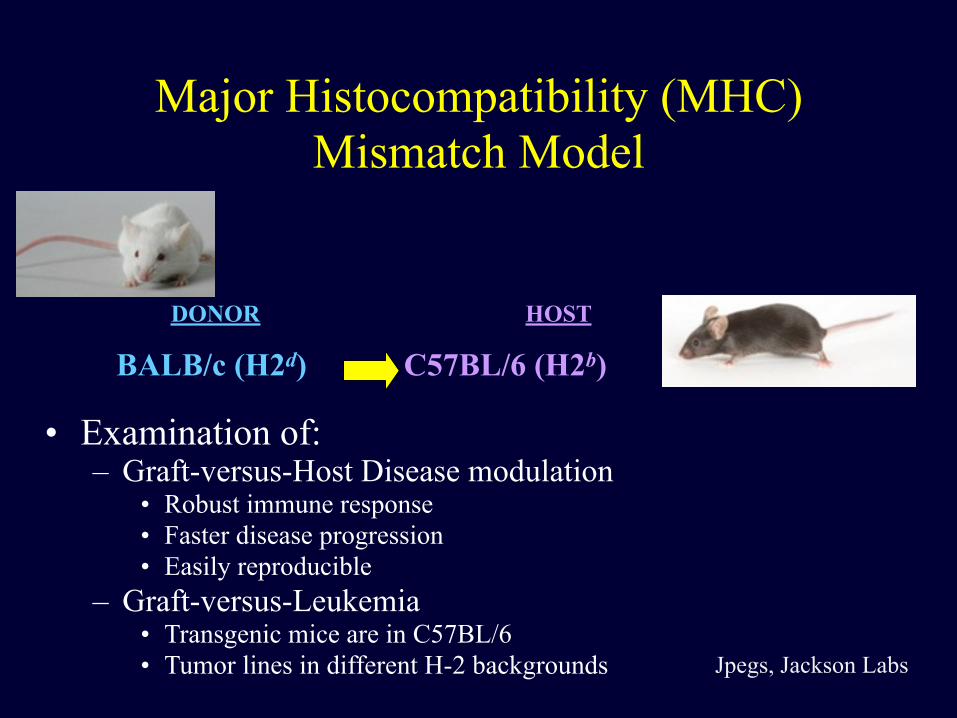
Major Histocompatibility (MHC) Mismatch Model
• Examination of: – Graft-versus-Host Disease modulation
• Robust immune response • Faster disease progression • Easily reproducible
– Graft-versus-Leukemia • Transgenic mice are in C57BL/6 • Tumor lines in different H-2 backgrounds
BALB/c (H2d) C57BL/6 (H2b)
DONOR HOST
Jpegs, Jackson Labs

Preparation of Donor Cells
Anti-thy-1.2 mAB & Guinea pig C’ for 45
mins @ 37oC
Plastic Petri dish coated with goat α mouse Ab for
1 hr @ 4oC
Non-adherent (T cell-enriched) cells
T cell-depleted BM
Adapted from a slide, courtesy of M Capitano
Femur
Spleen

Murine Transplant Simplified
Less or No GvHD Fewer T cells
More or Severe GvHD More T CellsTCD Bone Marrow (1-2 x 10⁶ cells) +
increasing T cell doses (1-5 x 10⁵)
800-1300 cGy
Can we reduce the toxicities of make BMT?
• Can we identify patients at high risk for poor outcome prospectively and – modify BMT treatment? – intervene earlier in the course of BMT?

A deletion polymorphism in glutathione-S-Transferase Mu (GSTM1) and/or Theta (GSTT1) is associated with an increased risk of toxicity after autologous blood and
marrow transplantation
Theresa Hahn, PhD Evgenia Zhelnova, MD, PhD
Philip McCarthy, MD Christine Ambrosone, PhD
Lara Sucheston, PhD Irina Demidova, MD
Valeri Savchenko, MD Minoo Battiwalla, MD Shannon Smiley, MD
Funded by American Cancer Society Roswell Park Alliance Foundation
Collaboration with the National Hematology Research Center in Moscow (not Idaho)

Genotype RR 95% CI pAutologous BMT patientsGSTM1
Present Null
!1.0
1.59
!!0.91 - 2.77
NS
GSTT1 Present
Null
!1.0
1.25
!!0.63 – 2.48
NS
GSTM1+/-GSTT1 Both Present
Either/Both Null
!1.0
1.87
!!1.05 – 3.33
0.035
Allogeneic BMT patientsGSTM1
Present Null
!1.0
1.36
!!0.64 – 2.89
NS
GSTT1 Present
Null
!1.0
0.72
!!0.31 – 1.70
NS
GSTM1+/-GSTT1 Both Present
Either/Both Null
!1.0
1.26
!!0.57 – 2.75
NS
Hahn, et al, BBMT 2010.
.

Genetic susceptibility to Bone Mineral Density (BMD) loss after Auto & Allo BMT
Song Yao, PhD Theresa Hahn, PhD
Lara Sucheston, PhD Philip McCarthy, MD Shannon Smiley, MD
Minoo Battiwalla, MD Kathy West, PharmD
Dominick Lamonica, MD Funded by CALGB Young Investigator Award

bone mass
BMP LRP5/WntMechanical Load
Androgens
Intermittent P TH
SOST Immobilization Aging
Estrogen Deficiency
Immobilization Low Ca (PTH)
Estrogen
SERM
Bisphosphonates
CalcitoninCalcium /
VitD
A delicate balance between bone formation & resorption
Modified from Harada et al. Nature 2003; 423:349-55
RANKL RANK
OPG

Bone loss and risk of fracture
Modified from Khosla & Melton. NEJM 2007;356:2293-2300
Normal Osteoporotic
-1.0 -2.5

% a
nnua
l dec
reas
e in
BM
D
0
4.5
9
13.5
18
Auto, Spine Allo, Spine
ExpectedObserved
Yao, et al., BBMT 2010

Osteoblasts/
stromal cells
Osteoclasts
RANK
RANKL
OPG
Ca2+Bone resorption
Bone formation
Wnt / Lrp5 Collagen type I, osteocalcin,
alkaline phosphatase, etc
OC precursors
Differentiation, formation
M-CSF, G-CSF
VitD3 D3 Diet
CYP24
CYP27A1/B1
Mg2+
DBP
absorptionPTH/PTHrp
Ca2+
Estrogen
VDRPTHR
ER
-aCaS
R
CYP19
Precursors
EP
PGE2
COX2
IL-1, IL-6, TNF-a
TGF-b, IGF-I
Calcineurin/NFAT

Genes and SNPs selected
46 genes and 170 SNPs classified into 6 groups:
- 1. Cytokines and receptors
- 2. Bone matrix proteins and regulators
- 3. Vitamin D receptor / metabolism enzymes
- 4. Estrogen receptor / metabolism enzymes
- 5. PTH & GC
- 6. Miscellaneous
S Yao et al PLOS One 2011

Genes with SNPs significant in multivariate models of BMD change after BMT
Pathway Auto BMT, Spine
Auto BMT, Femur
Allo BMT, Spine
Allo BMT, Femur
RANKL-RANK-OPG and regulating cytokines/receptors
None IL1RN RANKL * RANKL * TNFRSF1B
Bone matrix proteins and regulating factors
BGLAP MTHFR, ALOX12
None COL1A1 * RUNX2
Vitamin D receptor and metabolism enzymes
GC, CYP24A1
None None None
Steroid hormones/receptors
None ESR1 * None None
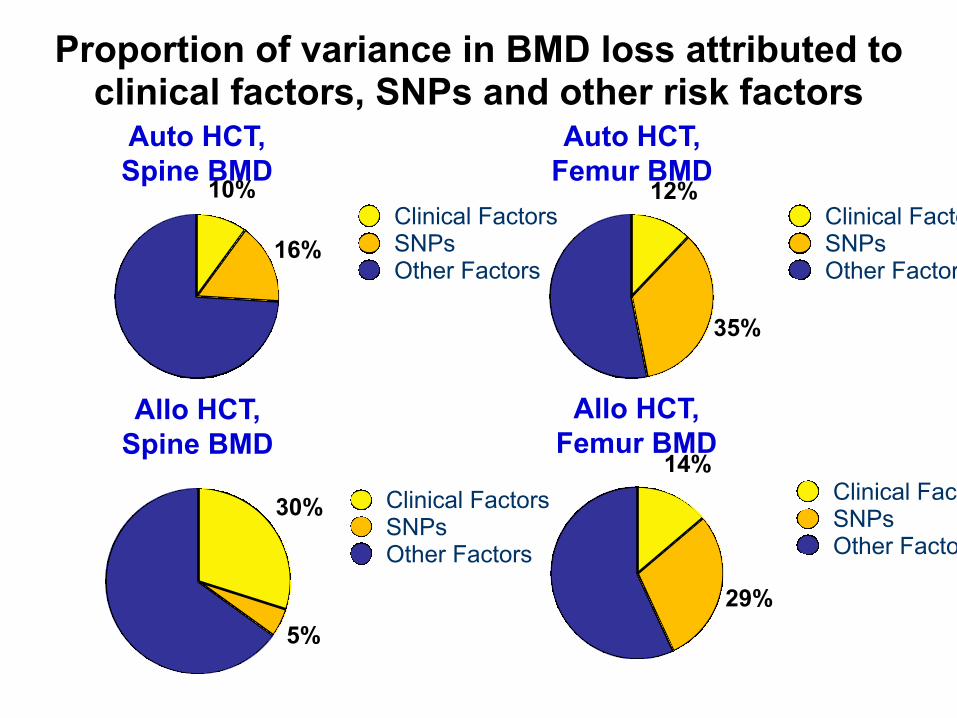
Proportion of variance in BMD loss attributed to clinical factors, SNPs and other risk factors
Auto HCT, Spine BMD
16%
10%Clinical FactorsSNPsOther Factors
Auto HCT, Femur BMD
35%
12%Clinical FactorsSNPsOther Factors
Allo HCT, Spine BMD
5%
30% Clinical FactorsSNPsOther Factors
Allo HCT, Femur BMD
29%
14%Clinical FactorsSNPsOther Factors
Future Directions!
• Preventing BMD loss after BMT is important to prevent risk of fractures and other bone related complications
• >80% of pre-BMT patients are vitamin D insufficient/deficient
• Bisphosphonates require sufficient vitamin D levels and also affect cytokine levels

NIH (NHLBI) R01 HL107213-‐01A1 7/5/10-‐6/30/14
!Multiple-‐PI:
Theresa Hahn, PhD Lara Sucheston, PhD Dept of Medicine Dept of Cancer
Prevention & Control !
Genetic susceptibility to unrelated donor hematopoietic cell transplantation-related
mortality
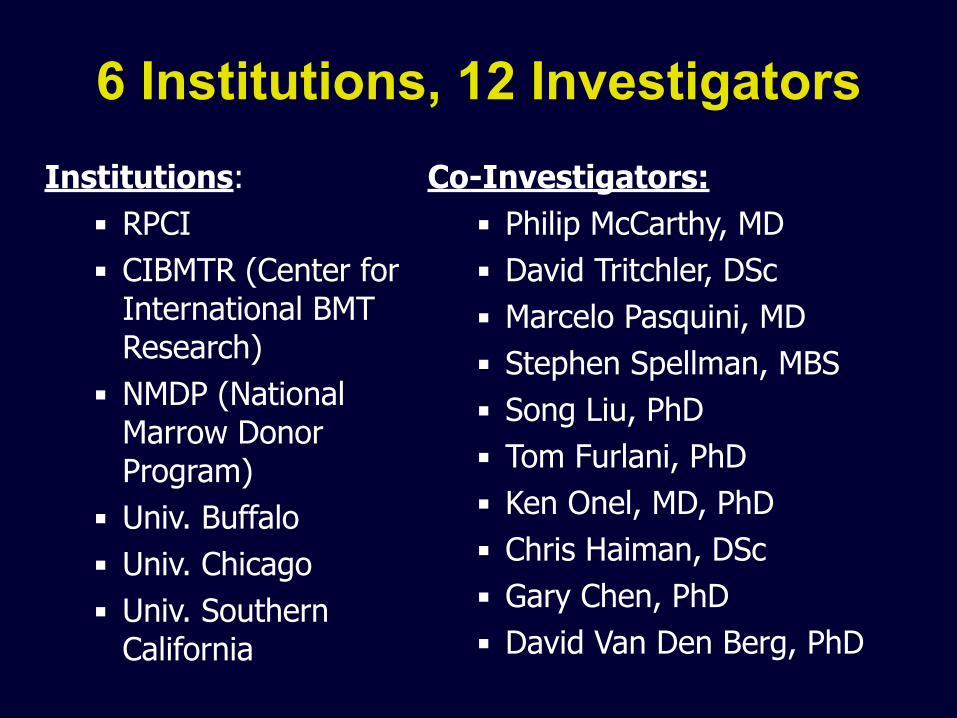
6 Institutions, 12 InvestigatorsCo-Investigators: ▪ Philip McCarthy, MD ▪ David Tritchler, DSc ▪ Marcelo Pasquini, MD ▪ Stephen Spellman, MBS ▪ Song Liu, PhD ▪ Tom Furlani, PhD ▪ Ken Onel, MD, PhD ▪ Chris Haiman, DSc ▪ Gary Chen, PhD ▪ David Van Den Berg, PhD !
Institutions: ▪ RPCI ▪ CIBMTR (Center for
International BMT Research)
▪ NMDP (National Marrow Donor Program)
▪ Univ. Buffalo ▪ Univ. Chicago ▪ Univ. Southern
California

Study population
• 2,800 recipients and their matched donors of 10/10 high-resolution HLA-matched unrelated donor allogeneic BMT from 2000-2008 reported to CIBMTR
• 1,000 recipient/donor pairs from 2009-2011 • Genome Wide Association Study (GWAS)
of >1 million SNPs and CNVs
Genetic susceptibility to unrelated donor stem cell transplant-related mortality
• To determine the host and donor genetic contribution to survival (TRM, PFS, OS) after matched unrelated donor BMT
• To determine if the genetic contribution to survival varies by a) conditioning regimen intensity, b) myeloablative conditioning regimen (CyTBI vs BuCy)
• To replicate the top genetic associations in an independent cohort

D-‐S Stage 1-‐3, < 70 years > 2 cycles of induction Attained SD or better ≤ 1 yr from start of therapy > 2 x 10⁶ CD34 cells/kg
Placebo
Lenalidomide* 10 mg/d with ↑↓ (5–15 mg)
Restaging Days 90–100
Registration
CALGB 100104 Schema
CR PR SD
Stratification based on registration β-‐2M level and prior thalidomide and lenalidomide use during Induction. Primary Endpoint: powered to determine a prolongation of TTP from 24 months to 33.6 months (9.6 months)
Mel 200 !
ASCT
* provided by Celgene Corp, Summit, NJ
Randomization
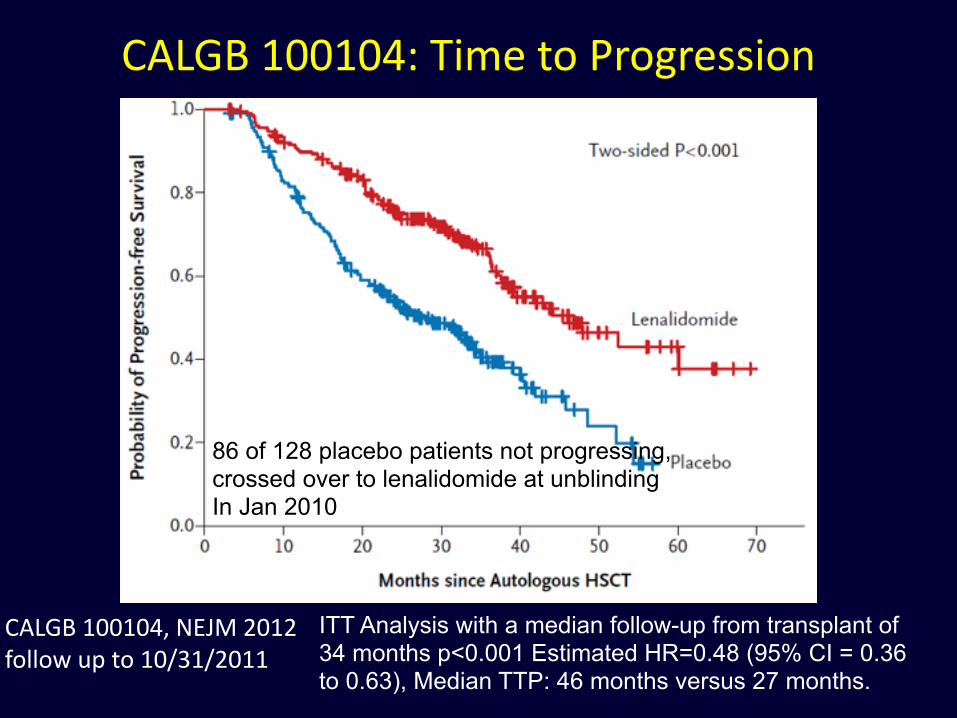
ITT Analysis with a median follow-up from transplant of 34 months p<0.001 Estimated HR=0.48 (95% CI = 0.36 to 0.63), Median TTP: 46 months versus 27 months.
CALGB 100104, NEJM 2012 follow up to 10/31/2011
86 of 128 placebo patients not progressing, crossed over to lenalidomide at unblinding In Jan 2010
CALGB 100104: Time to Progression

CALGB 100104, NEJM 2012 follow up to 10/31/2011
ITT Analysis: 35 deaths in the lenalidomide arm and 53 deaths in the placebo arm p=0.028, 3 yr OS 88 vs 80%, HR 0.62 or a 38% reduction in death with the cross over
Median follow-‐up of 34 months
CALGB 100104: Overall Survival

Immune cell population analysis before and after autoHSCT for MM
• Are there modifiable immune cell populations that correlate with improved outcomes?
• Day +15 absolute lymphocyte recovery (ALC) post-AHSCT correlates with better PFS/OS (Porrata et al Blood 2001)
• Are there immune cell subsets correlating with day +15 ALC recovery (>500 lymphs/µl) and improved PFS/OS?
• 70 multiple myeloma (MM) patients receiving first AHSCT at RPCI from 8/2007 - 9/2012
• Immunophenotyping performed pre- AHSCT (n=70), D+30 (n=40) and D+100 post-AHSCT(n=51)
! Hahn T et al. Blood 122: 3348, 2013.

Day 15 ALC recovery and Immune cell subsets analysis

Higher T γδ and CD8+ effector cells correlate with improved PFS and OS

BMT CTN 0702: SCHEMA
Register and
Randomize
MEL 200mg/m2 VRD x 4* Lenalidomide
Maintenance**
Lenalidomide Maintenance**
Lenalidomide Maintenance**
MEL 200mg/m2
**Lenalidomide 10 mg daily x 3mo then 15 mg daily. Total duration of maintenance 3 years
* Bortezomib 1.3mg /m2 days 1, 4, 8,11 Lenalidomide 15mg days 1-15 Dexamethasone 40mg days 1, 8, 15
Courtesy of M. Pasquini

Disease Response in PRIMeR Study
Arrows indicate time points for disease assessment for immunophenotyping BM samples for the PRIMeR Study

People and Services who make the BMT program possible
• George Chen • Hong Liu • Maureen Ross • Karen Arnold • Justine Bertolo • Eric Breitwieser • Melissa Everett • Jenn Grimmer • Rebecca Sewastynowicz • Molly Aungst • Pam Paplham • Sue Flavin • Rachel Kutas • Heather Werner • Mary Beth Schadel • Kelly Farrell • Hillary Jacobson • Sue Oakley
• Theresa Hahn • Steve Schinnagel • Shan Zhao • Michelle Steward • Dana Cipolla • Karen Dubel • Patty Lipka • Colleen Warren • Lora Yoerg • Eileen Duman • ID service • Rad Onc Service • Radiology Svc • Surgery Svc • Pathology Svc • Joanne Becker • Lab Medicine • Stem Cell Lab • Apheresis Unit • Managed Care and • Finance Svc
• Kathy West • Donna Swinnich • Lisa Privitere • Rose Kumpf • Dodie Killock • Mishellene.McKinney-Bost • Christina Tobin • Lynette Regan • Bethann Levin • Christy Paddon • Jennifer Kapinos • Greg Wilding • Anurag Singh • Medical Oncology Fellows • 5 East, 5 North and 6 North Nursing and
Secretarial Staff • Hospitalist Staff • Myron Czuczman • Meir Wetzler • Alex Adjei