blood cell adhesion on a silicone heart alvev...
TRANSCRIPT

BLOOD CELL ADHESION ON A SILICONE HEART VALVE LEAFLET PROCESSED
USING MAGNETIC ABRASIVE FINISHING
By
TAYLOR A. BOGGS
A THESIS PRESENTED TO THE GRADUATE SCHOOL
OF THE UNIVERSITY OF FLORIDA IN PARTIAL FULFILLMENT
OF THE REQUIREMENTS FOR THE DEGREE OF
MASTER OF SCIENCE
UNIVERSITY OF FLORIDA
2011

© 2011 Taylor A. Boggs
2

To my family
3

ACKNOWLEDGMENTS
I would like to thank my family for all of their unending love and encouragement,
and unwavering support. I would like to thank my advisor, Dr. Hitomi Greenslet, for
welcoming me into her lab. It has been an honor to work with her and receive her
guidance. Additionally, I would like to thank our collaborators, Dr. Roger Tran-Son-Tay,
Dr. Faris Al-Mousily, and Dr. Curt DeGroff for all of their advice, dedication, and effort
in realizing this project. I also want to thank Dr. Malisa Sarntinoranont for being on my
committee and John Greenslet for kindly taking the time to edit this work.
I want to thank the members of the Machine Tool Research Center (MTRC),
especially the members of Dr. Greenslet's lab, for their welcoming friendship, advice,
and support. It has been pleasure getting to know and work with everyone, your
friendship is cherished and appreciated.
4

TABLE OF CONTENTS
page
ACKNOWLEDGMENTS . . . . . . . . . . . . . . . . . . . . . . . . . . . . . . . . . . 4
LIST OF TABLES . . . . . . . . . . . . . . . . . . . . . . . . . . . . . . . . . . . . . . 7
LIST OF FIGURES . . . . . . . . . . . . . . . . . . . . . . . . . . . . . . . . . . . . . 8
ABSTRACT . . . . . . . . . . . . . . . . . . . . . . . . . . . . . . . . . . . . . . . . . 10
CHAPTER
1 INTRODUCTION . . . . . . . . . . . . . . . . . . . . . . . . . . . . . . . . . . . 12
1.1 Valvular Function and Valve Disease . . . . . . . . . . . . . . . . . . . . . 12
1.2 Current Valve Prostheses . . . . . . . . . . . . . . . . . . . . . . . . . . . 12
1.3 Motivation and Objectives . . . . . . . . . . . . . . . . . . . . . . . . . . . 15
2 SILICONE VALVE MANUFACTURING . . . . . . . . . . . . . . . . . . . . . . . 18
2.1 Design Considerations . . . . . . . . . . . . . . . . . . . . . . . . . . . . . 18
2.2 Valve Speci�cations . . . . . . . . . . . . . . . . . . . . . . . . . . . . . . 18
2.2.1 Lea�et Thickness . . . . . . . . . . . . . . . . . . . . . . . . . . . . 18
2.2.2 Factors that In�uence Cellular Adhesion . . . . . . . . . . . . . . . 18
2.3 Valve Manufacturing Process . . . . . . . . . . . . . . . . . . . . . . . . . 22
2.4 Valve Durability Testing . . . . . . . . . . . . . . . . . . . . . . . . . . . . 22
3 MOLD FABRICATION USING MAGNETIC ABRASIVE FINISHING . . . . . . . 26
3.1 Overview of Magnetic Abrasive Finishing . . . . . . . . . . . . . . . . . . 26
3.2 Processing Principle . . . . . . . . . . . . . . . . . . . . . . . . . . . . . . 26
3.3 Finishing Machine Development . . . . . . . . . . . . . . . . . . . . . . . 27
3.3.1 Design and Build . . . . . . . . . . . . . . . . . . . . . . . . . . . . 27
3.3.2 Magnetic Flux Density . . . . . . . . . . . . . . . . . . . . . . . . . 30
3.4 Mold Surface Analysis . . . . . . . . . . . . . . . . . . . . . . . . . . . . . 30
3.5 Mold Surface Finishing Characteristics . . . . . . . . . . . . . . . . . . . . 33
3.5.1 Un�nished Mold Surface . . . . . . . . . . . . . . . . . . . . . . . . 33
3.5.2 Mold Surface Finished with Loose Diamond Abrasive . . . . . . . . 34
3.5.3 Mold Surface Finished with Composite Magnetic Abrasive . . . . . 36
4 SILICONE LEAFLET FABRICATION . . . . . . . . . . . . . . . . . . . . . . . . 43
4.1 Controlling Lea�et Thickness . . . . . . . . . . . . . . . . . . . . . . . . . 43
4.2 Silicone Lea�et Mold Replication . . . . . . . . . . . . . . . . . . . . . . . 46
5 BLOOD CELL ADHESION TESTING . . . . . . . . . . . . . . . . . . . . . . . 50
5.1 Flow Chamber Development . . . . . . . . . . . . . . . . . . . . . . . . . 50
5

5.2 Experimental Testing Setup . . . . . . . . . . . . . . . . . . . . . . . . . . 52
5.3 Analysis of Blood Cell Adhesion . . . . . . . . . . . . . . . . . . . . . . . 57
6 CONCLUSION . . . . . . . . . . . . . . . . . . . . . . . . . . . . . . . . . . . . 68
6.1 Concluding Statements . . . . . . . . . . . . . . . . . . . . . . . . . . . . 68
6.2 Future Work . . . . . . . . . . . . . . . . . . . . . . . . . . . . . . . . . . . 68
APPENDIX
A BLOOD CELL ADHESION DATA . . . . . . . . . . . . . . . . . . . . . . . . . . 71
B CALCULATION OF BLOOD SHEAR STRESS . . . . . . . . . . . . . . . . . . 78
REFERENCES . . . . . . . . . . . . . . . . . . . . . . . . . . . . . . . . . . . . . . . 80
BIOGRAPHICAL SKETCH . . . . . . . . . . . . . . . . . . . . . . . . . . . . . . . . 83
6

LIST OF TABLES
Table page
2-1 Lea�et shear stress . . . . . . . . . . . . . . . . . . . . . . . . . . . . . 22
3-1 Maximum magnetic �ux density . . . . . . . . . . . . . . . . . . . . . . . 30
3-2 Measurement conditions . . . . . . . . . . . . . . . . . . . . . . . . . . . 33
3-3 Un�nished mold surface roughness . . . . . . . . . . . . . . . . . . . . 34
3-4 Diamond abrasive �nishing conditions . . . . . . . . . . . . . . . . . . . 35
3-5 Roughness comparison of molds �nished with diamond abrasive . . . . 35
3-6 White alumina (WA) magnetic abrasive �nishing conditions . . . . . . . 39
3-7 Diamond magnetic abrasive �nishing conditions phase I . . . . . . . . . 39
3-8 Diamond magnetic abrasive �nishing conditions phase II . . . . . . . . . 39
3-9 Roughness comparison of composite magnetic abrasive molds . . . . . 39
4-1 Lea�et curing conditions . . . . . . . . . . . . . . . . . . . . . . . . . . . 46
4-2 Optical pro�ler measurement conditions . . . . . . . . . . . . . . . . . . 47
4-3 Data processing conditions . . . . . . . . . . . . . . . . . . . . . . . . . 48
4-4 Silicone surface roughness comparison . . . . . . . . . . . . . . . . . . 48
5-1 Blood �ow rate and shear stress . . . . . . . . . . . . . . . . . . . . . . 52
5-2 Experimental conditions . . . . . . . . . . . . . . . . . . . . . . . . . . . 56
5-3 Number of trials per surface . . . . . . . . . . . . . . . . . . . . . . . . . 57
5-4 Number of areas analyzed per surface . . . . . . . . . . . . . . . . . . . 58
5-5 Number of adhered blood cells . . . . . . . . . . . . . . . . . . . . . . . 59
A-1 Data from Lea�et 1 . . . . . . . . . . . . . . . . . . . . . . . . . . . . . . 72
A-2 Data from Lea�et 2 . . . . . . . . . . . . . . . . . . . . . . . . . . . . . . 73
A-3 Data from Lea�et 3 . . . . . . . . . . . . . . . . . . . . . . . . . . . . . . 74
A-4 Data from Lea�et 4 . . . . . . . . . . . . . . . . . . . . . . . . . . . . . . 75
A-5 Data from Lea�et 5 . . . . . . . . . . . . . . . . . . . . . . . . . . . . . . 76
A-6 Data from Lea�et 6 . . . . . . . . . . . . . . . . . . . . . . . . . . . . . . 77
A-7 Data from Lea�et 7 . . . . . . . . . . . . . . . . . . . . . . . . . . . . . . 77
7

LIST OF FIGURES
Figure page
1-1 Diagram of the heart and valve function . . . . . . . . . . . . . . . . . . . . . . 13
1-2 Current replacement valves . . . . . . . . . . . . . . . . . . . . . . . . . . . . . 14
2-1 Morphology of adhered platelets . . . . . . . . . . . . . . . . . . . . . . . . . . 20
2-2 Scanning electron microscopy (SEM) images of adhered platelets . . . . . . . 21
2-3 Schematic of proposed valve . . . . . . . . . . . . . . . . . . . . . . . . . . . . 23
2-4 Silicone valve manufacturing process . . . . . . . . . . . . . . . . . . . . . . . 23
2-5 Block diagram of dynamic testing system . . . . . . . . . . . . . . . . . . . . . 24
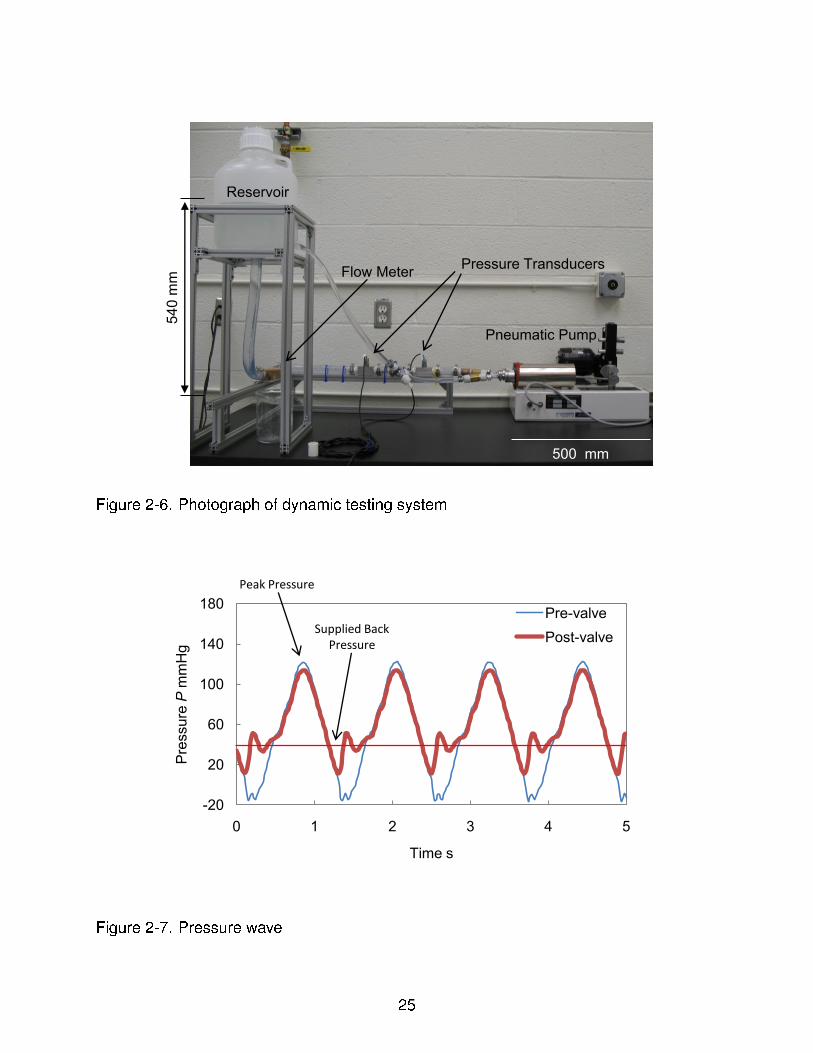
2-6 Photograph of dynamic testing system . . . . . . . . . . . . . . . . . . . . . . . 25
2-7 Pressure wave . . . . . . . . . . . . . . . . . . . . . . . . . . . . . . . . . . . . 25
3-1 Schematic of magnetic abrasive �nishing (MAF) processing principle . . . . . . 27
3-2 Design of �nishing machine . . . . . . . . . . . . . . . . . . . . . . . . . . . . . 28
3-3 Photograph of �nishing machine . . . . . . . . . . . . . . . . . . . . . . . . . . 29
3-4 Photograph of �nishing machine control box . . . . . . . . . . . . . . . . . . . . 29
3-5 Diagram of magnetic �eld analysis . . . . . . . . . . . . . . . . . . . . . . . . . 31
3-6 Photograph of surface roughness pro�ler . . . . . . . . . . . . . . . . . . . . . 32
3-7 Diagram of surface pro�le measurement . . . . . . . . . . . . . . . . . . . . . . 32
3-8 Diagram of surface pro�le . . . . . . . . . . . . . . . . . . . . . . . . . . . . . . 33
3-9 Un�nished mold surface roughness pro�le . . . . . . . . . . . . . . . . . . . . . 34
3-10 Diagram of �nishing direction . . . . . . . . . . . . . . . . . . . . . . . . . . . . 35
3-11 Roughness comparison of diamond abrasive molds . . . . . . . . . . . . . . . 36
3-12 Roughness pro�les of diamond abrasive molds . . . . . . . . . . . . . . . . . . 37
3-13 Roughness pro�les of diamond abrasive molds at reduced scales . . . . . . . 38
3-14 Roughness comparison of composite magnetic abrasive molds . . . . . . . . . 40
3-15 Roughness pro�les of composite magnetic abrasive molds . . . . . . . . . . . 41
3-16 Roughness pro�les of composite magnetic abrasive molds at reduced scales . 42
8

4-1 Mold curing orientations . . . . . . . . . . . . . . . . . . . . . . . . . . . . . . . 43
4-2 Diagram of curing process . . . . . . . . . . . . . . . . . . . . . . . . . . . . . . 44
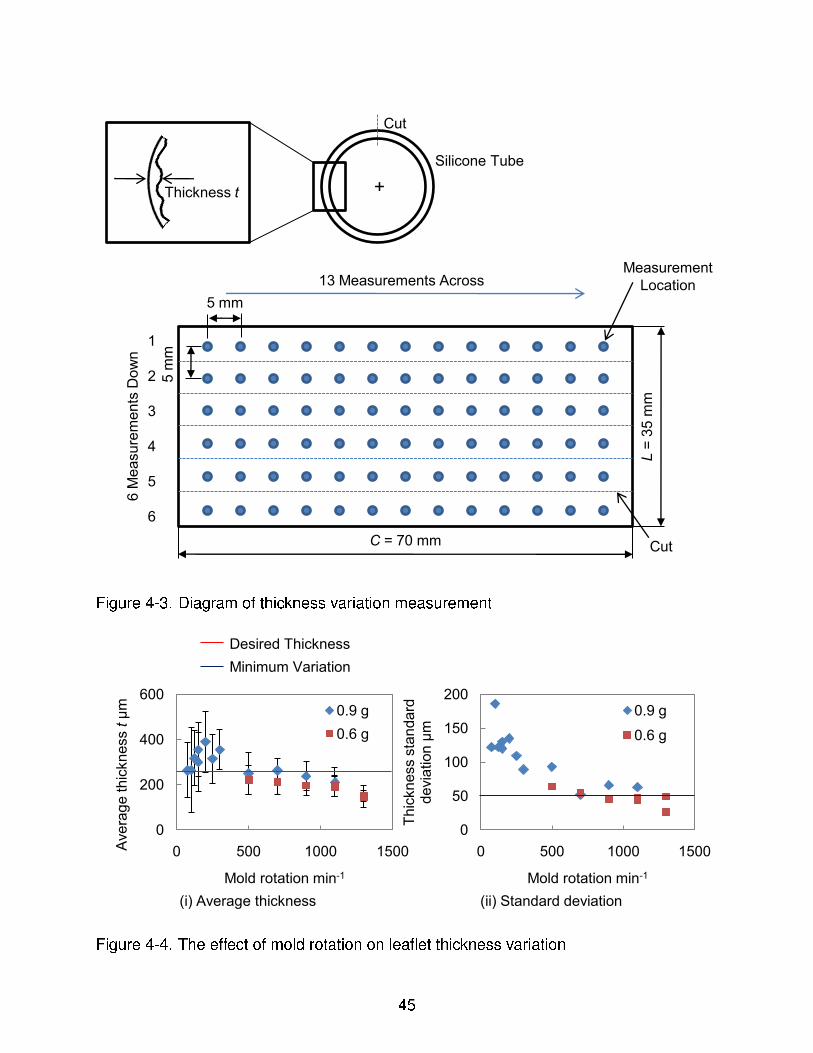
4-3 Diagram of thickness variation measurement . . . . . . . . . . . . . . . . . . . 45
4-4 The effect of mold rotation on lea�et thickness variation . . . . . . . . . . . . . 45
4-5 Lea�et processing . . . . . . . . . . . . . . . . . . . . . . . . . . . . . . . . . . 46
4-6 Diagram of optical pro�ler measurement . . . . . . . . . . . . . . . . . . . . . . 47
4-7 Comparison of mold surface and replicated silicone lea�et . . . . . . . . . . . . 49
4-8 Limitation of silicone mold replication . . . . . . . . . . . . . . . . . . . . . . . . 49
5-1 Flow chamber concept . . . . . . . . . . . . . . . . . . . . . . . . . . . . . . . . 50
5-2 Experimental design . . . . . . . . . . . . . . . . . . . . . . . . . . . . . . . . . 51
5-3 Design of �ow chamber . . . . . . . . . . . . . . . . . . . . . . . . . . . . . . . 52
5-4 Photograph of �ow chamber . . . . . . . . . . . . . . . . . . . . . . . . . . . . . 53
5-5 Flow chamber opening area . . . . . . . . . . . . . . . . . . . . . . . . . . . . . 53
5-6 Flow chamber preparation . . . . . . . . . . . . . . . . . . . . . . . . . . . . . . 54
5-7 Experimental setup . . . . . . . . . . . . . . . . . . . . . . . . . . . . . . . . . . 55
5-8 Blood bag spike . . . . . . . . . . . . . . . . . . . . . . . . . . . . . . . . . . . 56
5-9 Diagram of cell counting method . . . . . . . . . . . . . . . . . . . . . . . . . . 57
5-10 Adhered platelets . . . . . . . . . . . . . . . . . . . . . . . . . . . . . . . . . . . 58
5-11 Adhered red blood cells . . . . . . . . . . . . . . . . . . . . . . . . . . . . . . . 60
5-12 Comparison of adhered cells to diamond abrasive molds . . . . . . . . . . . . 62
5-13 Comparison of adhered cells to composite magnetic abrasive molds . . . . . . 63
5-14 Comparison of diamond abrasive size on surface �nish . . . . . . . . . . . . . 64
5-15 Comparison of composite magnetic abrasive size on surface �nish . . . . . . . 65
5-16 Timelapse images of adhered blood cells . . . . . . . . . . . . . . . . . . . . . 67
9
Abstract of Thesis Presented to the Graduate School
of the University of Florida in Partial Ful�llment of the
Requirements for the Degree of Master of Science
BLOOD CELL ADHESION ON A SILICONE HEART VALVE LEAFLET PROCESSED
USING MAGNETIC ABRASIVE FINISHING
By
Taylor A. Boggs
August 2011
Chair: Hitomi Yamaguchi Greenslet
Major: Mechanical Engineering
Heart valve prosthetics replace damaged, malfunctioning valves in the hope
of extending and improving a patient's quality of life. Current mechanical valves
are durable but suffer from thrombogenicity and �ow separation, and cause blood
damage leading to coagulation. While bioprosthetic valves have better haemodynamic
function than mechanical valves, the valves suffer from tears due to in�ammation
and collagen degradation. The absence of living tissue leaves them unable to repair
themselves, and their antigenicity must be masked. Polymeric valves have the potential
to produce improved haemodynamic function without the complications associated with
bioprosthetic valves, which include calci�cation, hydrolysis, and durability.
The goal of this project is to develop a trilea�et polymeric heart valve to overcome
the shortcomings of current mechanical and bioprosthetic valves. The valve should
replicate a mold surface texture and reduce blood cell adhesion. Blood cell adhesion
and subsequent thrombus formation is a major concern facing the development of
replacement heart valves; complications due to thrombosis occur between 1.5% and
3% per year for current mechanical and bioprosthetic valves. Studies investigating the
effects of surface texture on cell adhesion are well established and cells, including, but
not limited to platelets and red blood cells, �broblasts, and bladder smooth muscle cells,
have responded to changes in surface texture and roughness.
10

For the initial trials, silicone was chosen as the valve material; it is inert and
biostable, easy to manufacture, and has shown the ability to replicate surface features
at the micro- and nanometer scales. To study the effects of surface texture on cellular
adhesion, silicone lea�ets were developed from �nished brass molds. The mold surface
is fabricated using a magnetic abrasive �nishing (MAF) process. In the MAF process,
the �nished surface is controlled by the relative motion of the magnetic abrasive
particles against the workpiece. The process is capable of creating various textures with
varying surface roughness, and it has the ability to �nish free-form surface geometries.
The lea�ets were secured in a polycarbonate �ow chamber and �ushed with whole
human blood, followed by phosphate buffered saline (PBS), under low shear stress to
study the conditions most susceptible to adhesion. Using light microscopy, blood cell
adhesion was quanti�ed by counting the number of adhered cells and normalizing the
number to the lea�et surface area. This research uses the MAF process to �nish a
heart valve mold in an effort to reduce the adhesion of blood cells on the resulting lea�et
surface. The MAF process is able to produce various textures on the mold surface,
and the surface texture is replicated onto molded silicone lea�ets. The corresponding
MAF-produced smooth silicone surface reduces blood cell adhesion and aggregation.
11

CHAPTER 1
INTRODUCTION
1.1 Valvular Function and Valve Disease
Heart valve prosthetics replace damaged, malfunctioning valves in the hope of
extending and improving the patient's quality of life. It is estimated that 300,000 valve
replacements are made worldwide each year with 100,000 being performed annually in
the United States [1, 2]. This number is expected to increase to approximately 850,000
annual replacements worldwide by 2050 [1]. Rheumatic fever and ageing are the leading
causes of valve damage requiring replacement. Stenosis, the incomplete opening of the
valve, and regurgitation, leakage, are effects of valve failure [1, 3].
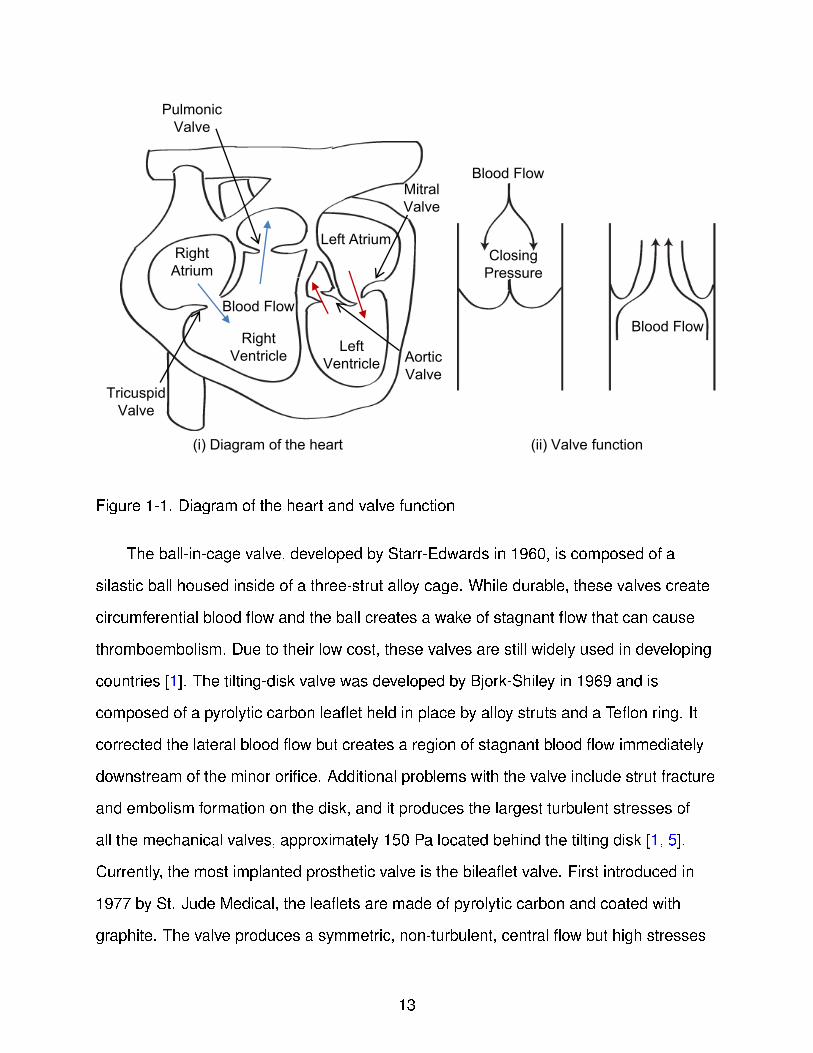
The heart has four valves directing blood �ow as shown in Figure 1-1: two
atrioventricular valves (AV valves) direct �ow from the atrium to the ventricle and
two semilunar valves separate the ventricles from the arteries. The valves open and
close according to pressure gradients. Of the AV valves, the mitral valve is located on
the left side of the heart and the tricuspid valve on the right. The AV valves open when
the pressure in the atrium becomes higher than the pressure in the ventricle and close
when the pressure gradient is reversed. The mitral valve is a bilea�et valve consisting
of two cusps of connective tissue while the tricuspid valve is a trilea�et valve featuring
three cusps. The aortic valve, a semilunar valve, separates the left ventricle from the
aorta, and the pulmonary valve separates the right ventricle from the pulmonary artery
[4].
1.2 Current Valve Prostheses
Two types of prosthetic valves are currently in use: mechanical valves, which
include the ball-in-cage, tilting-disk, and bilea�et valves, and bioprosthetic valves
made from either whole porcine valves or bovine pericardium. These valves are
shown in Figure 1-2. A third type of prosthetic valve that is less commonly used is
the cryopreserved homograft valve.
12
Right
Atrium
Right
Ventricle
Left Atrium
Left
Ventricle
Tricuspid
Valve
Pulmonic
Valve
Aortic
Valve
Mitral
Valve
Blood Flow
Closing
Pressure
Blood Flow
Blood Flow
(i) Diagram of the heart (ii) Valve function
Figure 1-1. Diagram of the heart and valve function
The ball-in-cage valve, developed by Starr-Edwards in 1960, is composed of a
silastic ball housed inside of a three-strut alloy cage. While durable, these valves create
circumferential blood �ow and the ball creates a wake of stagnant �ow that can cause
thromboembolism. Due to their low cost, these valves are still widely used in developing
countries [1]. The tilting-disk valve was developed by Bjork-Shiley in 1969 and is
composed of a pyrolytic carbon lea�et held in place by alloy struts and a Te�on ring. It
corrected the lateral blood �ow but creates a region of stagnant blood �ow immediately
downstream of the minor ori�ce. Additional problems with the valve include strut fracture
and embolism formation on the disk, and it produces the largest turbulent stresses of
all the mechanical valves, approximately 150 Pa located behind the tilting disk [1, 5].
Currently, the most implanted prosthetic valve is the bilea�et valve. First introduced in
1977 by St. Jude Medical, the lea�ets are made of pyrolytic carbon and coated with
graphite. The valve produces a symmetric, non-turbulent, central �ow but high stresses
13

appear during forward �ow while regurgitation, leakage, and stagnant �ow can occur
around the hinges; the hinge area also tends to induce thrombus formation [5].
In general, mechanical valves are durable but suffer from thrombogenicity due to
high shear stresses, which can activate platelets, cause �ow separation, stagnation,
and damage blood cells leading to coagulation. Consequently, lifelong anticoagulation
therapy is necessary. Mechanical valves also suffer from pannus overgrowth, the growth
of excess tissue over the sewing ring that can cause a narrowing of the valve ori�ce
or lea�et immobilization. Pannus overgrowth is a primary cause of obstructive valve
failure that can be produced by in�ammation and a chronic reaction by the patient to the
sewing ring that treats the prosthetic as a foreign body or injury [5].
(i) (ii)
(iii) (iv)
Figure 1-2. Current replacement valves include: (i) bilea�et valve, (ii) ball-in-cage valve,
(iii) bioprosthetic valves, and (iv) tilting disk valve [6]
14

Bioprosthetic valves have better haemodynamic function than mechanical valves
and do not need long-term anticoagulation therapy. Porcine valves, �rst introduced by
Hancock in 1970, are whole valves that are sewn into the valve structure. Alternatively,
bovine valves are made from bovine pericardium that is cut to form the valve lea�ets;
the valves are �xed in glutaraldehyde and often af�xed to a stent before being sewn
into the structure. Bovine valves have a theoretical advantage over porcine valves
in that the lea�ets are made larger and can accommodate the shrinkage that occurs
over the valve's life once implanted. Additionally, the lea�et opening is also more
symmetric, improving haemodynamics, and the collagen content is higher, improving
durability. Currently, it is unclear if the theoretical advantages translate to the patient
[1]. Tears due to in�ammation, collagen degradation, and the absence of living tissue
are the primary cause of tissue valve failure with calci�cation being the cause of less
than half [5]. The absence of living tissue leaves bioprosthetic valves unable to repair
themselves and there is a need to mask the valve's antigenicity. Similar problems exist
with cryopreserved homograft valves [7].
1.3 Motivation and Objectives
Polymeric valves have the potential to exhibit improved haemodynamic performance
over mechanical valves without the complications associated with bioprosthetic
valves and can have either bilea�et or trilea�et designs. Lea�et variations include
hemi-cylindrical cusps; half-open lea�ets; variable-curvature lea�ets; and elliptical,
hyperbolic, and conical shapes. The development of polymer valves also offers the
possibility of percutaneous implantation, allowing the patient to avoid open heart
surgery. Boudjemline and Bonhoeffer performed this technique using a bioprosthetic
valve [8]. Current issues associated with polymeric valves include calci�cation,
hydrolysis, and durability. To date, the most widely studied materials for polymeric
heart valves have been polyurethanes and silicone elastomers. Polyurethanes have
good viscoelasticity and have demonstrated good haemodynamics and biocompatibility,
15
resistance to cycle fatigue, and high tensile strength. Some polyurethanes, such
as polyether urethane (PEU), show good resistance to acid hydrolysis but have
a low resistance to oxidation, while another, polycarbonate urethane (PCU), has
good resistance to hydrolysis and oxidation but is prone to calci�cation. Problems
with biodegradation and mineralization, though, have been a major drawback to
using polyurethanes as a heart valve material. Meanwhile, silicone has shown good
�exibility and biocompatibility but has suffered from low durability. Design and material
improvements, including improved fabrication technologies, have increased the durability
and fatigue resistance of polymeric valves, but there is still high variability in life-cycle
[5].
Complications due to thrombosis occur between 1.5% and 3% per year for
current mechanical and bioprosthetic valves [9]. Polyurethane valves have shown
a lower thrombogenicity rate than bilea�et mechanical valves, and a PCU valve
has a comparable thrombosis rate to bioprosthetic valves in animal studies [2, 10].
Polymeric valves have shown similar �ow characteristics to bioprostheses and have
good haemodynamic properties.
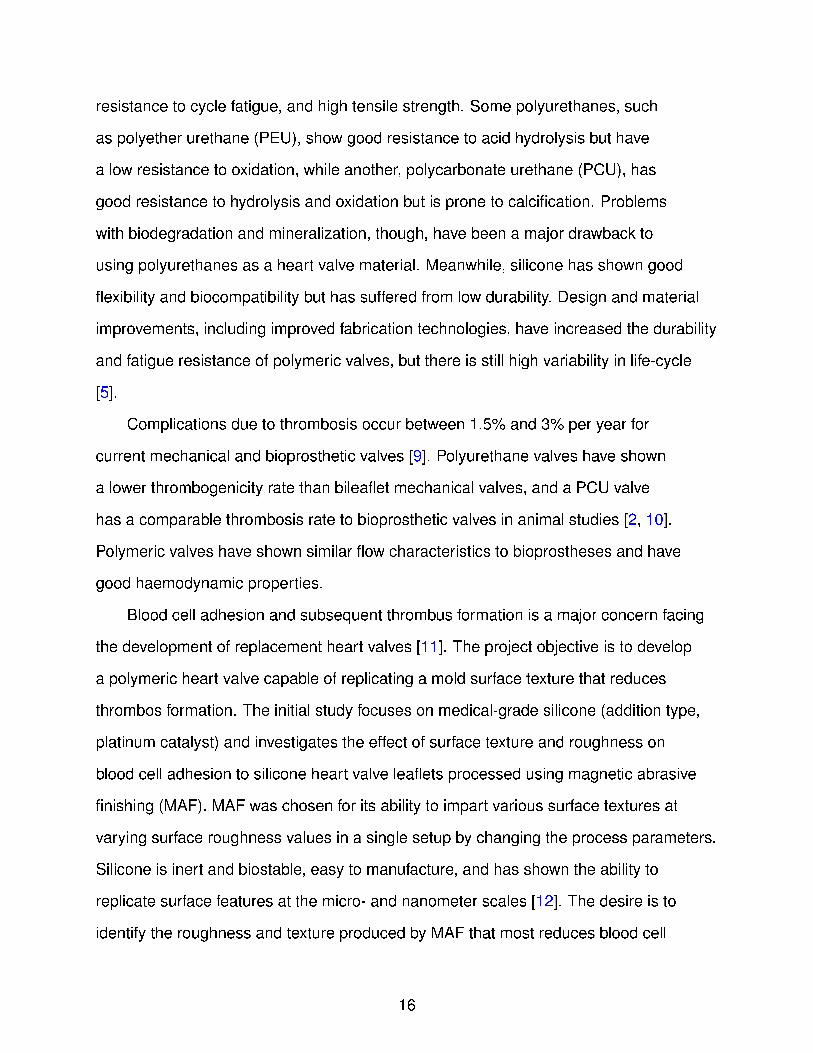
Blood cell adhesion and subsequent thrombus formation is a major concern facing
the development of replacement heart valves [11]. The project objective is to develop
a polymeric heart valve capable of replicating a mold surface texture that reduces
thrombos formation. The initial study focuses on medical-grade silicone (addition type,
platinum catalyst) and investigates the effect of surface texture and roughness on
blood cell adhesion to silicone heart valve lea�ets processed using magnetic abrasive
�nishing (MAF). MAF was chosen for its ability to impart various surface textures at
varying surface roughness values in a single setup by changing the process parameters.
Silicone is inert and biostable, easy to manufacture, and has shown the ability to
replicate surface features at the micro- and nanometer scales [12]. The desire is to
identify the roughness and texture produced by MAF that most reduces blood cell
16

adhesion and subsequent thrombus formation. Studies investigating the effects of
surface texture on cell adhesion are well established and cells, including, but not limited
to platelets and red blood cells, �broblasts, and bladder smooth muscle cells, have
responded to changes in surface texture and roughness [13�18]. Roughness and
topography have also been shown to affect the settlement of Ulva zoospores to silicone
[19, 20]. Due to the size of the platelets (1-3 µm), it is desired that the lea�ets have a
roughness of less than 1 µm Rz to prevent the platelets from becoming lodged between
the peaks. For this study, the mold roughness was varied from 2-3 µm to 0.1 µm Rz .
17

CHAPTER 2
SILICONE VALVE MANUFACTURING
2.1 Design Considerations
According to Ghanbari et al. the design requirements for developing a heart valve
prosthetic are listed below [10]:
1. Must �t host anatomy
2. Must provide minimum resistance to forward �ow
3. Must prevent regurgitation
4. Should minimize damage to blood cells and reduce thrombogenicity
5. Should minimize stress and improve durability
The design must allow unobstructed forward �ow at the initialization of a minimum
transvalvular pressure followed by valve sealing at the appropriate back pressure.
Additionally, the valve should minimize blood damage, thrombogenicity, and stress on
the valve components. It has been shown that the design and geometry of the valve
lea�ets in�uences the function of the valve such as opening, closing, effective ori�ce
area (EOA), leakage, and stress; the manufacturing process affects valve durability and
haemodynamic function [10].
2.2 Valve Speci�cations
2.2.1 Lea�et Thickness
Lea�et thickness is a major contributor to valve durability. Cycle fatigue testing
featuring polyurethane valves showed that lea�ets less than 50 µm thick lasted less
than 100 million cycles, 100 µm thick lea�ets lasted 600 million cycles, lea�ets between
150-200 µm thick lasted around 800 million cycles, and 300 µm thick lea�ets lasted 1
billion cycles [2]. Subsequently, our target lea�et thickness will be between 200-300 µm.
2.2.2 Factors that In�uence Cellular Adhesion
Part of the design is to impart in the valve a surface texture that reduces blood
cell adhesion and thromgenicity. Surface characteristics have been shown to affect the
18

biocompatibility of materials and can control interactions between the material and its
environment. Properties that in�uence cellular adhesion are listed below.
1. Hydrophobicity/hydrophilicity
2. Surface energy
3. Morphology
4. Topography
Surface topography can be introduced to a material, intentionally or accidentally,
affecting cellular adhesion, selective cell proliferation, differentiation, and apoptosis [10].
Common fabrication techniques used to introduce patterns or topography include
photolithography, casting, ablation, and embossing. For a given pattern, feature
depth, width, orientation, and frequency are thought to affect cell response [21].
Modi�cations to the surface can alter biocompatibility without affecting bulk material
properties. Studies have shown that �broblasts tend to align along ridges or parallel to
collagen �bers [22]. Plasma immersion ion implantation has been used to improve cell
attachment on synthetic material surfaces and cholesterol, and peptide modi�cation has
been used to enhance endothelial cell af�nity. Additionally, endothelial cell attachment
can mask the valve from being considered a foreign body, increasing blood compatibility.
Creating nanoscale topography could increase biocompatibility and haemodynamic
performance of polymeric heart valves [10].
When platelets encounter an implanted prosthetic or foreign object, they respond
by inducing hemostasis, which is the process used to stop bleeding at an injury site,
and can induce thrombosis in a heart valve prosthetic [23]. Kuwahara et al. used a
�ow chamber to study morphology changes in adhering platelets. An image of these
morphology changes is shown in Figure 2-1. As platelets come into contact with a
surface they begin rolling before entering a �rm but reversible adhesion. The next stage
in the adhesion process is spreading, which is irreversible.
19

1. Rolling 2. Firm, reversible
adhesion
3. Spreading,
irreversible adhesion
Disc-shaped: 1-3 μm
Filopods: 0.1 - 0.25 μm
Surface
Figure 2-1. Morphology of adhered platelets [23]
Park et al. studied the effect of different surface �nishes on platelet adhesion
to commercially pure titanium [24]. Platelet adhesion was measured using a lactate
dehydrogenase (LDH) assay on dual acid etched (DAE), abraded (320 grit), machined,
and polished titanium. Scanning electron microscopy (SEM) was used to qualitatively
view the adhered platelets after �xing with glutaraldehyde. All the surfaces were
extensively sonicated in acetone, deionized water, and ethanol prior to contact with
platelet-rich plasma. Figure 2-2 shows SEM images of adhered platelets on the four
titanium surfaces; in the images the scale bar is 6 µm. The abraded and DAE surfaces
produced between 85000 and 95000 adhered platelets per square millimeter, while the
machined and polished surfaces produced between 45000 and 42000 adhered platelets
over the same area. The differences between the surfaces were signi�cant (p <0.05)
suggesting that topography and surface roughness of the titanium in�uences platelet
adhesion.
Milner et al. textured polyether (urethane urea) (PUU) with sub-micron pillars
(700 and 400 nm) via a two-phase molding process to decrease platelet adhesion by
changing surface topography without affecting the surface chemistry of the substrate
[14]. Samples were placed in a rotating disk system that radially varied the shear stress.
The results from the study suggest that platelet adhesion, and the effect of surface
texture on platelet adhesion, is highest at low shear stresses.
20

(i) (ii)
(iii) (iv)
Figure 2-2. SEM images of adhered platelets to (i) DAE, (ii) abraded, (iii) machined, and
(iv) polished titanium after 30 min of exposure to platelet rich plasma [24]
Valvular shear stress varies widely based on the �ow conditions, measurement
method, and position of measurement, with studies indicating the stresses range from
3-180 Pa [25�28]. The largest shear stresses are often recorded downstream of the
valve due to the high velocity jets produced from the closing valve lea�ets; very few
studies have accurately measured or estimated the shear stresses present on the
lea�ets. Weston et al. attempted to estimate the shear stresses on an aortic valve lea�et
surface during peak systole under steady �ow conditions [25]. The maximum shear
stress recorded in the study was 79 dyne/cm2 (7.9 Pa) for a �ow rate of 22 L/min at
the tip of the lea�et; the minimum shear stress recorded was just under 1 Pa, 2 mm
upstream of the lea�et tip. The most common shear stress found on the valve lea�et
was approximately 3 Pa, located at various positions over the lea�et surface under
multiple �ow conditions.
Table 2-1 lists the locations and magnitudes of shear stresses present on the lea�et
surface. The 0◦ position represents the lea�et commissure, 60◦ identi�es the center of
the lea�et, and 30◦ lies halfway in between. Additionally, the 0 mm position identi�es the
lea�et tip, while all positive values indicate a position upstream of the tip. From these
21
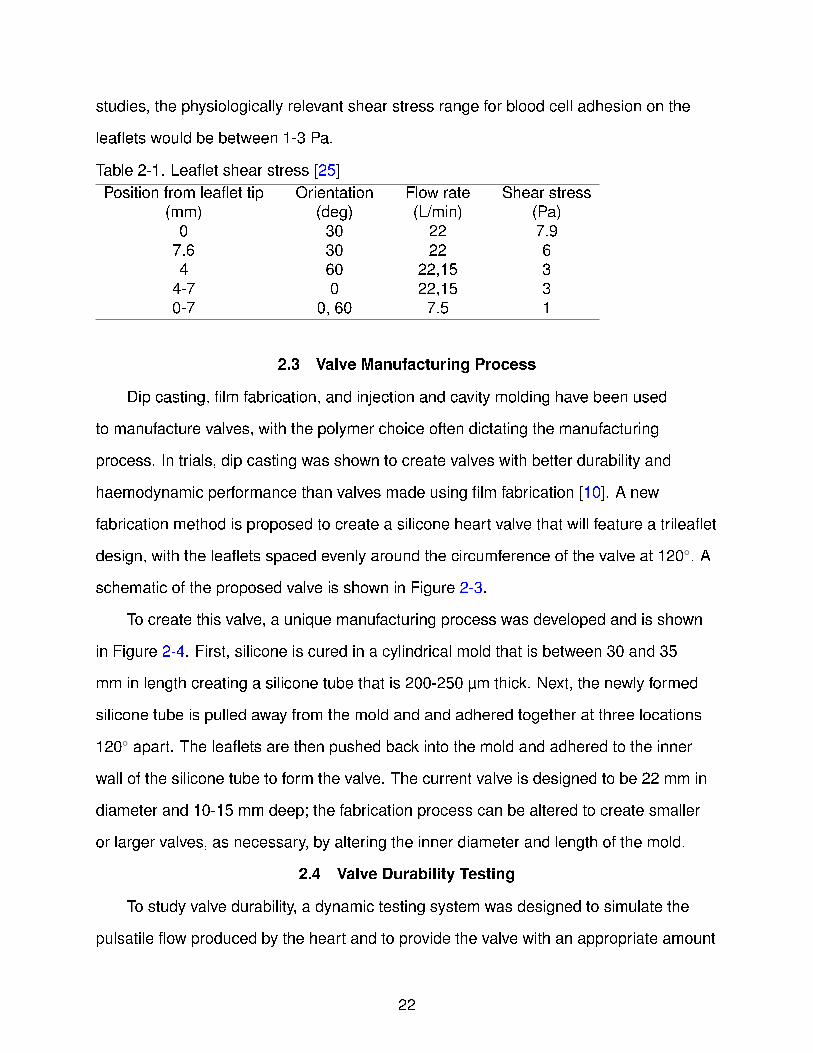
studies, the physiologically relevant shear stress range for blood cell adhesion on the
lea�ets would be between 1-3 Pa.
Table 2-1. Lea�et shear stress [25]
Position from lea�et tip Orientation Flow rate Shear stress
(mm) (deg) (L/min) (Pa)
0 30 22 7.9
7.6 30 22 6
4 60 22,15 3
4-7 0 22,15 3
0-7 0, 60 7.5 1
2.3 Valve Manufacturing Process
Dip casting, �lm fabrication, and injection and cavity molding have been used
to manufacture valves, with the polymer choice often dictating the manufacturing
process. In trials, dip casting was shown to create valves with better durability and
haemodynamic performance than valves made using �lm fabrication [10]. A new
fabrication method is proposed to create a silicone heart valve that will feature a trilea�et
design, with the lea�ets spaced evenly around the circumference of the valve at 120◦. A
schematic of the proposed valve is shown in Figure 2-3.
To create this valve, a unique manufacturing process was developed and is shown
in Figure 2-4. First, silicone is cured in a cylindrical mold that is between 30 and 35
mm in length creating a silicone tube that is 200-250 µm thick. Next, the newly formed
silicone tube is pulled away from the mold and and adhered together at three locations
120◦ apart. The lea�ets are then pushed back into the mold and adhered to the inner
wall of the silicone tube to form the valve. The current valve is designed to be 22 mm in
diameter and 10-15 mm deep; the fabrication process can be altered to create smaller
or larger valves, as necessary, by altering the inner diameter and length of the mold.
2.4 Valve Durability Testing
To study valve durability, a dynamic testing system was designed to simulate the
pulsatile �ow produced by the heart and to provide the valve with an appropriate amount
22

Leaflets
22 mm
25 mm1
5 m
m
35 m
m
120°
Mold
Figure 2-3. Schematic of proposed valve
22 m
m
1. Silicone cured 2. Leaflets pulled
back
4. Completed valve3. Leaflets formed
30
-35 m
m
Silicone Tube
22 mm
25 mm
Clips
Mold
Figure 2-4. Silicone valve manufacturing process
23

of back pressure. A block diagram of the system is shown in Figure 2-5. In the current
iteration of the design, a pneumatic pump is connected inline with the valve along with
two pressure transducers positioned before and after the valve. A �ow meter is placed
between the valve and the reservoir to record the �ow exiting the valve. A reservoir is
held above the valve and �uid is �lled to a line 540 mm above the valve centerline. This
corresponds to a constant back pressure of 40 mmHg. A picture of the completed setup
is shown in Figure 2-6.
Prosthetic
Reservoir
Pressure Transducers
Flow Meter
Pump
Figure 2-5. Block diagram of dynamic testing system
During testing, prototypes are secured into the testing system with the cusps
oriented so that the supplied back pressure causes the lea�ets to close and seal.
With each forward stroke of the pump, �uid pulses through the valve. For testing,
due to limitations of the current pump, 20 mL of �uid was pumped at 50 pulse/min.
The pressure waves were recorded and are shown in Figure 2-7. A peak pressure of
approximately 120 mmHg is achieved and the valves are able to hold a pressure of 40
mmHg without leakage.
24
Reservoir
Pressure Transducers
Pneumatic Pump
Flow Meter
540
mm
500 mm
Figure 2-6. Photograph of dynamic testing system
-20
20
60
100
140
180
0 1 2 3 4 5
Pre
ssure
Pm
mH
g
Time s
Pre-valve
Post-valveSupplied Back
Pressure
Peak Pressure
Figure 2-7. Pressure wave
25

CHAPTER 3
MOLD FABRICATION USING MAGNETIC ABRASIVE FINISHING
3.1 Overview of Magnetic Abrasive Finishing
The magnetic abrasive �nishing (MAF) process was chosen for its ability to
create various textures with varying surface roughness using a single �nishing setup.
Additionally, it has the ability to �nish free-form surface geometries [29�32]. MAF uses
a magnetic �eld to actuate magnetic abrasive against a workpiece surface. Magnetic
abrasives are composed of ferrous abrasive particles or ferrous particles combined with
loose abrasive. The magnetic �ux, produced by either electromagnets or permanent
magnets af�xed to the �nishing setup, in�uences the motion of the magnetic abrasive
against the workpiece surface without ever contacting the surface. A �nished surface
is produced when relative motion is achieved between the surface and the magnetic
abrasive, which is pressed against the surface by the magnetic force. MAF produces a
high-precision surface �nish that can be adapted in-process to alter the roughness or
texture for a given area by changing the process parameters.
The process is considered pressure-copying, allowing many complex, mostly
inaccessible surfaces by conventional �nishing operations to be polished [33].
Yamaguchi et al. used rotating and translating permanent magnets to �nish the internal
surfaces of bent tubes [30].
3.2 Processing Principle
A schematic of the �nishing process is shown in Figure 3-1. Magnetic abrasive
is held against the mold surface according to the magnetic �eld lines produced by
the permanent magnets con�gured on the magnetic yoke. As the mold rotates, the
magnetic abrasive is held at the �nishing site; when relative motion is achieved, material
is removed. Ideally, the motion of the �nishing unit also causes fresh abrasive to be
introduced to the surface, providing more ef�cient material removal. To achieve relative
motion, the magnetic force holding the magnetic abrasive against the surface must be
26

larger than the friction force between the surface and abrasive. The magnetic force
acting on the magnetic abrasive can be calculated using the following equation:
F = VχH · ∇H (3�1)
where F is the magnetic force, V is the volume of the magnetic abrasive, χ is the
magnetic susceptibility of the abrasive, H is the magnetic �eld strength, and ∇H is
the gradient of the magnetic �eld. The material removal corresponds to the amount of
abrasive pressed against the mold surface and the process parameters.
Brass
Mold
Magnetic Abrasive
Particles
90 mm
Yoke
(i) Finishing unit
Permanent
Magnets
Mold
Rotation
Ferrous Particles Abrasive
Mold
Pressure
(ii) Pressure from magnetic particles
90°
Figure 3-1. Schematic of magnetic abrasive �nishing (MAF) processing principle
3.3 Finishing Machine Development
3.3.1 Design and Build
To �nish the internal mold surface, a machine needed to be developed. Based on
previous machines designed for similar �nishing processes, the design needed to be
able to hold a minimum of four permanent magnets oriented at 90◦ angles, rotate the
heart valve mold, and oscillate the �nishing unit relative to the rotating mold.
27

A computer-aided design (CAD) model of the �nishing machine was created and
is shown in Figure 3-2. The design features one motor to produce mold rotation and a
second motor to oscillate the �nishing unit � which houses eight permanent magnets,
grouped in north-south (N-S) pairs on the yoke, secured 90◦ apart � via a link and shaft
coupling. The �nishing unit is mounted atop a linear slide that, combined with the link
and shaft coupling, converts the motor rotation into linear vibration along the mold axis
direction. Operated in unison, the motors are capable of producing the motion required
for the �nishing process outlined in Figure 3-1.
Finishing Unit Chuck
90 m
m
Motor
Motor
Figure 3-2. Design of �nishing machine
A photograph of the completed �nishing machine is shown in Figure 3-3. The
machine is operated by the controls shown in Figure 3-4. Initially, the design was for two
outer chucks to be connected via a belt and pulley system to the center shaft. Due to
machine vibration caused by tension in the pulleys and instability in the bearings, the
design was reduced to a single center chuck and shaft collars were added to stabilize
the center bearing. This modi�cation reduced the unwanted vibrations and was the �nal
modi�cation to the machine.
28

Finishing Unit Vibration
Finishing
Unit
Aluminum Chuck
Brass
Mold
350 mm
Rotation
Motor for Finishing
Unit Vibration
Motor for Mold
Rotation
Figure 3-3. Photograph of �nishing machine
Circuit Breakers
Controller for
Finishing UnitController for Mold
Rotation
Figure 3-4. Photograph of �nishing machine control box
29

3.3.2 Magnetic Flux Density
To characterize the magnetic �eld, a Hall probe was used to measure the magnetic
�ux density. A diagram of the Hall probe and the measurement setup is shown in Figure
3-5. Two measurements were made of the �ux between the mold and the magnet
face. In the �rst measurement, magnetic particles were introduced into the mold; in the
second measurement, no particles were present. The Hall probe was inserted in the
1 mm gap between the mold and the magnet with the sensor facing the magnet. The
measured �ux was reduced by more than half. The results of the measurements are
shown in Table 3-1. The measurement containing the magnetic abrasive produced the
largest amount of �ux, when the abrasive was removed the �ux reduced by more than
half.
Table 3-1. Maximum magnetic �ux density
Magnetic abrasive present Magnetic abrasive absent
0.7 T 0.235 T
3.4 Mold Surface Analysis
Two surface analysis methods employed in this study include using a stylus-type
surface pro�ler and an optical surface pro�ler. To characterize the mold surfaces a
stylus-type pro�ler was used and is pictured in Figure 3-6. To take a measurement, the
stylus is moved over the surface for the speci�ed evaluation length (maximum distance
of 1 inch) while the diamond stylus (tip radius: 2 µm) encounters the surface features.
The vertical displacement of the tip creates an analog signal (force detector: 0.75 mN)
which is converted to a digital signal and analyzed to create a 2-dimensional surface
pro�le. The processing unit can be controlled from a computer via a RS-232 cable,
importing the pro�le for analysis. A diagram of a surface pro�le measurement is shown
in Figure 3-7. From this pro�le, the peak-to-valley distance Rz , average roughness
Ra, and root-mean-square (rms) roughness Rq can be calculated. An example of a
surface pro�le is shown in Figure 3-8. The peak-to-valley distance is the largest distance
30

12.7 mm
3.8 mm
4 mm
101.6 mm1.2 mm
12.7 mm
Probe
(i) Hall probe
(ii) Measurement with ferrous
particles(iii) Measurement without ferrous
particles
6.3 mm
Brass Mold
Magnetic Abrasive
ParticlesPermanent
Magnets
Hall Probe
Hall Sensor
Figure 3-5. Diagram of magnetic �eld analysis featuring (i) a Hall Probe measuring the
magnetic �ux density produced (ii) with ferrous particles and (iii) without
between the highest and lowest points of the pro�le for a given evaluation length.
The average roughness is calculated as the average distance of the pro�le from the
centerline and the rms is taken as the root-mean square of the pro�le distance from the
centerline.
All measurements used a Gaussian band-pass �lter following the ISO 4287:1997
standard. The high-frequency �lter is based on the diamond tip radius, while the
low-frequency �lter is determined by the cut-off length de�ned in the standard.
All measurements were performed �rst with the longer cut-off length before being
31

Measurement Unit
Stylus
Processing Unit
90 mm
Figure 3-6. Photograph of surface roughness pro�ler
+
Measurement Direction
Heig
ht
Flu
ctu
atio
n
Tip Radius
Surface Profile
StylusTilt Angle
Figure 3-7. Diagram of surface pro�le measurement
32

RZ RqRa
Profile Line
Evaluation Length
Centerline
Figure 3-8. Diagram of surface pro�le
stepped-down if the roughness was found to be less than the minimum value for the
performed evaluation.
Table 3-2 lists the conditions used for each measurement in this report. The
measurement speed was also reduced with each step to increase the measurement
resolution at lower roughness values and shorter evaluation lengths. For each mold,
four measurements were taken randomly around the circumference of the mold and
averaged.
Table 3-2. International Organization for Standardization (ISO) standards and
measurement conditions
Cut-off length Evaluation length Roughness range Measurement speed
(mm) (mm) (µm Rz ) (mm/s)
0.8 4 0.5-10 0.5
0.25 1.25 0.1-0.5 0.1
3.5 Mold Surface Finishing Characteristics
3.5.1 Un�nished Mold Surface
For the heart valve mold, a brass 260 seamless tube was used. The initial,
un�nished mold surface had a roughness between 2-3 µm Rz . Representative
roughness values for the un�nished mold are shown in Table 3-3. A representative
mold surface roughness pro�le is shown in Figure 3-9. The un�nished mold surface is
33

labeled Mold 1 and corresponds to Lea�et 1 studied in the blood cell adhesion tests.
This naming system will continue for each mold generated by �nishing.
Table 3-3. Un�nished mold surface roughness
Roughness parameters Mold 1
Rz (µm) 2.59
Ra (µm) 0.34
Rq (µm) 0.38
Figure 3-9. Un�nished mold surface roughness pro�le (Mold 1)
3.5.2 Mold Surface Finished with Loose Diamond Abrasive
Three molds were generated using loose diamond abrasive to study blood cell
adhesion at various surface roughnesses. The �nishing conditions for these molds are
listed in Table 3-4. All of the molds �nished using the MAF process were rotated at 2000
min-1 while the �nishing unit vibrated at an amplitude of 5 mm at a frequency of 1.33 Hz.
Due to the high rotational speed, the �nishing direction � the direction of cutting marks
produced during �nishing � is at an angle of 0.17◦ relative to the tubes radial direction;
a diagram of the �nishing direction is shown in Figure 3-10. For each mold, 2.7 g of 330
µm mean diameter electrolytic iron was combined with 0.3 g of diamond abrasive. The
diamond abrasive used was 0-1 µm powder, for Mold 2, and 0-0.5 µm paste, for Molds 3
and 4. Molds 2 and 3 were �nished for 5 min while Mold 4 was �nished for 20 min. The
roughness of each mold after �nishing is presented in Table 3-5. To better visualize the
�nishing results the peak-to-vally roughness of each mold is presented in Figure 3-11.
34

Table 3-4. Diamond abrasive �nishing conditions
Mold 2 Mold 3 Mold 4
Mold 260 Brass tube (∅25.4 × ∅22 × 90 mm)
Mold rotation 2000 min-1
Pole Nd-Fe-B rare-earth permanent magnet (25.4 × 12.7 × 12.7 mm)
Pole motion Amplitude: 5 mm; Frequency: 1.33 Hz (80 min-1)
Clearance 1 mm
Iron particles Electrolytic iron particles: 2.7 g (330 µm mean diameter)
Abrasive Diamond abrasive: 0-1 µm 0-0.5 µm 0-0.5 µm
0.3 g powder paste paste
Lubricant Soluble-type barrel 3 mL 3 mL 4 mL
�nishing compound
Finishing time 5 min 5 min 20 min
Mold Rotation
Mold
Maximum contribution from
Finishing Unit Vibration: 1.33 Hz
Finishing
DirectionContribution from Mold
Rotation: 2000 min-1
0.17° ≈ 0°axial
radial
Figure 3-10. Diagram of �nishing direction
Table 3-5. Roughness comparison of molds �nished with diamond abrasive
Roughness Mold 2 Mold 3 Mold 4
Rz (µm) 0.28 0.79 0.11
Ra (µm) 0.04 0.06 0.01
Rq (µm) 0.05 0.11 0.02
35

0
0.5
1
1.5
2
2.5
3
1 2 3 4
Roug
hness RZμ
m
Leaflet molds
Figure 3-11. Roughness comparison of diamond abrasive molds
A comparison of the roughness pro�les is presented in Figure 3-12. Mold 3, �nished
for 5 min with 0-0.5 µm diamond paste, had the roughest surface with large features
present from the original surface remaining. For Molds 2 and 4, the pro�les are viewed
at a reduced scale in Figure 3-13. After �nishing for 5 min with 0-1 µm diamond powder,
Mold 2 had the greatest reduction in roughness for the short �nishing time. Large gaps
exist between the peaks corresponding to the larger abrasive size. Mold 4 was �nished
for the longest time with the smaller abrasive producing the smoothest surface, featuring
even, short cutting marks.
3.5.3 Mold Surface Finished with Composite Magnetic Abrasive
Three molds were generated using composite magnetic abrasives for the blood cell
adhesion trials. The �nishing conditions for the mold produced using white alumina (WA)
magnetic abrasive (Mold 5) are listed in Table 3-6. Mold 5 was �nished for 5 min with
2.4 g of 330 µm mean diameter electrolytic iron combined with 0.6 g of the magnetic
abrasive (80 µm Fe; <10 µm WA). The �nishing conditions for the molds produced
from the diamond magnetic abrasive are listed in Tables 3-7 and 3-8 for Molds 6 and
36

Figure 3-12. Roughness pro�les of diamond abrasive molds
37

Figure 3-13. Roughness pro�les of diamond abrasive molds at reduced scales
7, respectively. Mold 6 was �nished for 15 min with 2.4 g of 330 µm mean diameter
electrolytic iron combined with 0.6 g of the diamond magnetic abrasive (0-0.75 µm Fe;
0-0.25 µm diamond). Mold 7 underwent the same �nishing process as Mold 6 with an
additional �nishing phase (Table 3-8) of 5 min with 3 g of the diamond magnetic abrasive
and no iron particles. All of the molds were rotated at 2000 min-1 while the �nishing unit
vibrated at an amplitude of 5 mm at a frequency of 1.33 Hz. The roughness of each
mold after �nishing is presented in Table 3-9. The results are presented graphically in
Figure 3-14.
A comparison of the roughness pro�les is presented in Figure 3-15 at the
same scale as the un�nished mold surface. Mold 5, �nished for 5 min with WA
magnetic abrasive, had the roughest surface with deep gouges created from the
large abrasive; Molds 6 and 7 produced even surface �nishes. The pro�les are shown
38

Table 3-6. Composite magnetic abrasive �nishing conditions: WA magnetic abrasive
(Mold 5)
Mold 260 Brass tube (∅25.4 × ∅22 × 90 mm)
Mold rotation 2000 min-1
Pole Nd-Fe-B rare-earth permanent magnet (25.4 × 12.7 × 12.7 mm)
Pole motion Amplitude: 5 mm; Frequency: 1.33 Hz (80 min-1)
Clearance 1 mm
Iron particles Electrolytic iron particles: 2.4 g (330 µm mean diameter)
Abrasive WA magnetic abrasive: 0.6 g (80 µm Fe; <10 µm WA)
Lubricant Soluble-type barrel �nishing compound: 3 mL
Finishing time 5 min
Table 3-7. Composite magnetic abrasive �nishing conditions: diamond magnetic
abrasive (Mold 6)
Mold 260 Brass tube (∅25.4 × ∅22 × 90 mm)
Mold rotation 2000 min-1
Pole Nd-Fe-B rare-earth permanent magnet (25.4 × 12.7 × 12.7 mm)
Pole motion Amplitude: 5 mm; Frequency: 1.33 Hz (80 min-1)
Clearance 1 mm
Iron particles Electrolytic iron particles: 2.4 g (330 µm mean diameter)
Abrasive diamond magnetic abrasive: 0.6 g
(0-0.75 µm Fe, 0-0.25 µm diamond)
Lubricant Soluble-type barrel �nishing compound: 3 mL
Finishing time 15 min
Table 3-8. Composite magnetic abrasive �nishing conditions: diamond magnetic
abrasive, second �nishing phase (Mold 7)
Mold 260 Brass tube (∅25.4 × ∅22 × 90 mm)
Mold rotation 2000 min-1
Pole Nd-Fe-B rare-earth permanent magnet (25.4 × 12.7 × 12.7 mm)
Pole motion Amplitude: 5 mm; Frequency: 1.33 Hz (80 min-1)
Clearance 1 mm
Abrasive diamond magnetic abrasive: 3 g
(0-0.75 µm Fe, 0-0.25 µm diamond)
Lubricant Soluble-type barrel �nishing compound: 3 mL
Finishing time 15 min
Table 3-9. Roughness comparison of composite magnetic abrasive molds
Roughness parameters Mold 5 Mold 6 Mold 7
Rz (µm) 0.64 0.18 0.18
Ra (µm) 0.06 0.03 0.02
Rq (µm) 0.09 0.03 0.03
39

0
0.5
1
1.5
2
2.5
3
1 5 6 7
Roug
hness RZμ
m
Leaflet molds
Figure 3-14. Roughness comparison of composite magnetic abrasive molds
at a reduced scale in Figure 3-16. Mold 6 and 7 had similar roughness values, but Mold
7 appears to have shorter peak-to-peak distances than the surface produced by Mold 6
correspondingly Mold 7 had a slightly smaller average roughness, 0.02 µm Ra compared
to 0.03 µm Ra for Mold 6. The mold surface roughness is controlled by the size of the
abrasive and the �nishing time. Mold 5 was produced using larger abrasive than Molds 6
and 7 and was �nished for a shorter amount of time. The roughness values of the three
molds produced using the composite magnetic abrasives are similar to those produced
using the loose diamond abrasive, allowing for comparisons to be made on the effect of
abrasive choice and texture on blood cell adhesion.
40

Figure 3-15. Roughness pro�les of composite magnetic abrasive molds
41

Figure 3-16. Roughness pro�les of composite magnetic abrasive molds at reduced
scales
42

CHAPTER 4
SILICONE LEAFLET FABRICATION
4.1 Controlling Lea�et Thickness
Initially, the silicone was cured in the mold while the mold was in a vertical
orientation, shown in Figure 4-1. Due to the low viscosity of the medical-grade silicone,
the lea�ets were uneven and lost a signi�cant amount of silicone during the curing
process. To remedy this, it was decided to rotate the mold in a horizontal orientation to
counteract the effects of gravity and reduce lea�et variation.
The curing setup is shown in Figure 4-2. To develop lea�ets from the molds, the
molds were cut to 35 mm and silicone was applied to the mold, which was then secured
in the chuck and rotated for 24 hr.
Mold
Silicone
Silicone
Thickness
Mold
(i) Vertical orientation (ii) Horizontal orientation
Silicone
Thickness
Figure 4-1. Mold curing orientations
To study the effect of the mold rotation on lea�et thickness, a measurement method
was devised, Figure 4-3, that allowed the thickness to be measured across the entire
lea�et. After curing, the silicone tube was removed from the mold and cut open down its
length creating a 70 × 35 mm lea�et. The lea�et was then cut into 6 strips, 5 mm wide.
Along each strip, 13 measurements were made using digital vernier calipers. A total
of 78 measurements were made across the surface to measure the lea�et thickness
and variation. The rotational speed was varied from 75 to 1100 min-1 and the amount of
43

Mold (Ø25×Ø22 mm)
Chuck (Ø35×Ø28 mm)
45 mm
60 mm
80 mm
115 mm
Rotation
Motor
Figure 4-2. Diagram of curing process
applied silicone was either 0.6 or 0.9 g. These values, based on the speci�c gravity of
the cured silicone (1.09), were expected to produce lea�ets between 0.22 and 0.34 µm
thick. The results from the rotation trials are shown in Figure 4-4. Lea�et variation was
quanti�ed by using the standard deviation of the measurements.
Looking at Figure 4-4, there is a high amount of thickness variation at lower speeds
(<200 min-1), which decreases as the speed is increased. A minimum is reached
between 700 and 1100 min-1 of approximately 20% of the total lea�et thickness. At these
speeds, lea�ets produced using 0.6 g of silicone had thickness values at or below 200
µm, while lea�ets produced using 0.9 g of silicone had thickness values ranging from
200 µm (1100 min-1) to 250 µm (700 min-1). It was observed that at higher rotational
speeds, silicone was ejected from the mold reducing lea�et thickness. From these
results, curing conditions were chosen to be 0.9 g at 700 min-1. The lea�et curing
conditions that produced the most desireable results are provided in Table 4-1, these
conditions were used on all subsequent lea�ets.
To develop lea�ets for analysis and blood cell adhesion testing, the lea�ets were
processed as shown in Figure 4-5. After curing, the lea�ets were removed from the mold
as a silicone tube and cut down their length and opened. The edges of the lea�et were
44
C = 70 mm
6 M
easu
rem
ents
Do
wn
L=
35 m
m
Measurement
Location
Cut
1
2
3
4
5
6
13 Measurements Across
Cut
Silicone Tube
+Thickness t
5 mm
5 m
m
Figure 4-3. Diagram of thickness variation measurement
0
50
100
150
200
0 500 1000 1500
Thic
kness s
tandard
d
evia
tion
μm
Mold rotation min-1
0.9 g
0.6 g
0
200
400
600
0 500 1000 1500Ave
rag
e th
ickn
ess tμ
m
Mold rotation min-1
0.9 g
0.6 g
(i) Average thickness (ii) Standard deviation
Desired Thickness
Minimum Variation
Figure 4-4. The effect of mold rotation on lea�et thickness variation
45

Table 4-1. Lea�et curing conditions
Mold dimensions ∅25.4 × ∅22 × 35 mm
Silicone Medical grade
Weight amount 0.6-0.9 g
Curing time 72 hr (rotating: 24 hr)
Mold rotation 700 min-1
trimmed (70 × 25 mm) and mounted to a standard microscope slide (76 × 25.4 × 1
mm) using medical-grade silicone adhesive.
++
Cut
25 m
m70 mm
76 mm
1 mm
Silicone
Silicone Tube
Silicone
Removed
Brass Mold
Silicone Leaflet
Leaflet Mounted to
Microscope Slide
Silicone Tube
Opened
Microscope
Slide
25 mm
Leaflet
Figure 4-5. Lea�et processing
4.2 Silicone Lea�et Mold Replication
To examine the replicability of silicone, the lea�et surface was replicated from
�nished brass molds and viewed under an optical surface pro�ler, which uses scanning
46

white light interferometry. The optical pro�ler creates a map of the surface under
magni�cation and uses the data to calculate Rz , Ra, and Rq. For silicone lea�ets, the
20× magni�cation was used, measuring an area 176 × 133 µm. A diagram of the
optical pro�ler measurement is shown in Figure 4-6. The measurement conditions are
listed in Table 4-2, and the processing conditions are listed in Table 4-3. To apply a �lter
to the data, a 100 × 100 µm mask was applied to the total measured area. A Gaussian
band pass �lter (low: 20 µm, high: 0.828 µm) was then applied.
Cut
Cut
(ii) Mold Sample Section
Measured Area (176 ×133 μm)
xy
Brass Mold
+
Silicone Leaflet
Silicone-Mold
Interface
60°
xy
1. Cut mold sample
section
2. Cure silicone
leaflet
3. Measure surface using optical
profiler
Mold Sample
Section
(i) Silicone Leaflet
Masked Area (100 ×100 μm)
Figure 4-6. Diagram of optical pro�ler measurement
Table 4-2. Optical pro�ler measurement conditions
Number of averages 3
FDA resolution High
Scan length 20 µm
Lea�ets 6 and 7, were measured using the optical pro�ler. The results are shown
in Table 4-4. To illustrate the effects and limitations of the silicone lea�et replication, a
comparison was made between Molds 6 and 7 (produced from the diamond magnetic
abrasive) and their respective lea�ets in Figure 4-7. While Mold 6 and Mold 7 have
47

Table 4-3. Data processing conditions
Removed 4th order waviness
Masked 100 × 100 µm
Filter Gaussian band pass
Low frequency �lter 20 µm
High frequency �lter 0.828 µm
similar roughness values (0.18 µm Rz ) their effect on the developed lea�ets is drastically
different. Lea�et 6, produced from Mold 6, has long, evenly spaced ridges whose
direction corresponds to the mold �nishing direction (Figure 3-10). Lea�et 7 has no
visible ridges. Both lea�ets have similar peak-to-valley distances, 1.18 µm compared to
1.14 µm for Lea�ets 6 and 7, respectively, but the average roughness of Lea�et 7 is less
than half of Lea�et 6. Based on the lea�et's oblique plots this is to be expected; because
the peak-to-valley distance is the greatest distance over the entire measured area, the
spike located on Lea�et 7 skews the roughness value.
Table 4-4. Silicone surface roughness comparison
Roughness Lea�et 6 Lea�et 7
Rz (µm) 1.182 1.138
Ra (µm) 0.435 0.192
Rq (µm) 0.793 0.138
The disparity between the two silicone lea�ets lies in the difference in peak-to-peak
distance between features on the two molds. Due to the surface tension of the silicone,
if the peak-to-peak distance becomes too small the silicone will not completely replicate
the surface feature. This effect is shown in Figure 4-8 and can be controlled by the
abrasive size and the �nishing process parameters in addition to the choice of polymer.
In this study, the focus has been on the peak-to-valley distance in an effort to produce
surface textures that prevent platelets from becoming lodged in surface features. Since
the peak-to-valley distance is the distance between the highest peak and the lowest
valley, this parameter is greatly in�uenced by random spikes and surface features and
may not accurately re�ect the actual surface texture. A more accurate predictor may be
the average roughness, which accounts for the entire measured surface area.
48

Figure 4-7. Comparison of mold surface and replicated silicone lea�et
Silicone
Mold
Peak Distance
Gap
Figure 4-8. Limitation of silicone mold replication
49

CHAPTER 5
BLOOD CELL ADHESION TESTING
5.1 Flow Chamber Development
In Section 2.2.2 it was suggested that the physiologically relevant shear stress
range for blood cell adhesion on the lea�ets would be between 1-3 Pa. The shear stress,
or more directly, the shear rate can be controlled by the �ow rate of the �uid and the
geometry of the �ow chamber. Flow chambers are widely used to study cell adhesion
[13, 15, 18, 34]; the concept is presented in Figure 5-1. A suspension enters through the
top plate at the entrance port and �oods the sample surface before exiting the chamber
through the exit port. The height H and width W in the inner chamber in�uences the
shear rate induced on the suspension for a given �ow rate.
Leaflet
Suspension Flow
Entrance Port Exit Port
L
H
W
Figure 5-1. Flow chamber concept
The experimental design for blood cell adhesion testing is detailed in Figure 5-2.
Blood would be �ushed over the lea�et surface in a single pass and collected after
exiting. The lea�et would need to be secured in a clear �ow chamber that could be
sealed and disassembled easily and provide the cells with the appropriate shear stress.
A CAD model of a �ow chamber (Figure 5-3) was created that would allow the lea�et,
mounted on a microscope slide, to be viewed under dynamic �ow conditions.
50

Flow
Chamber
Blood Flow
Microscope Slide
Leaflet
Syringe
Pressure from Syringe Pump
Blood Collected
Flow Rate:
50 mL/hr
Gap Height
Figure 5-2. Experimental design
The �ow chamber was fabricated with a central pocket to house the lea�et and
could be sealed using vacuum grease and 6 M6 bolts. The completed �ow chamber,
pictured in Figure 5-4 was 150 × 70 × 25.4 mm and featured an opening on the bottom
plate to give the microscope objective clearance for locating and focusing on the surface.
The �ow chamber was designed to have an opening area, shown in Figure 5-5, of 0.2
× 25.4 mm. The microscope slide is 1 mm thick and the lea�et thickness ranged from
200-250 µm. Based on the �ow chamber opening area, a �ow rate of 50 mL/hr using a
20 mL syringe was chosen. The �ow rate is converted to a shear rate (219 s-1) and then
to a shear stress (0.83 Pa) by using the dynamic viscosity of blood (0.038 mPa·s); a �ow
rate of 100 mL/hr corresponds to a shear rate of 438 s-1 or a shear stress of 166 Pa. A
51

25.4
mm
Leaflet Viewing Area (25 × 75 mm)
Figure 5-3. Design of �ow chamber
calculation is included in Appendix B. Flow rates and their corresponding shear stresses
in the given range are shown in Table 5-1.
Table 5-1. Blood �ow rate and shear stress
Flow rate of blood (mL/hr) Shear rate (s-1) Shear stress (Pa)
50 219 0.83
100 438 1.66
150 656 2.49
200 875 3.32
5.2 Experimental Testing Setup
Prior to testing, all the lea�ets were cured for a minimum of 72 hr in advance and
mounted on the microscope slide 24 hr prior to testing to allow the silicone adhesive to
cure. The �ow chamber was then prepared for the �rst trial. Vacuum grease was �rst
applied to the �ow chamber seat located on the bottom plate, shown in Figure 5-6; the
52

Leaflet Viewing Area
(25.4 × 75 mm)Blood Flow
Figure 5-4. Photograph of �ow chamber
Microscope Slide
Leaflet
25.4 mm
0.1-0.2 mm
Flow
Chamber
Opening
Figure 5-5. Flow chamber opening area
53

ledge must be completely �lled before the lea�et can be pressed into place. The bottom
plate was then �ipped over and vacuum grease liberally applied to the contacting edge
of the microscope slide and the �ow chamber to effectively seal the base of the �ow
chamber. A thin coating of the vacuum grease was next applied to the interface between
the top and bottom plates. The top plate was then centered and pressed into place with
the 6 bolts used as locators while completing the seal. The completed �ow chamber
was mounted to the microscope stage using the �ow chamber clamp, shown in Figure
5-7, and inlet and exit tubes made of Nalgene 50 silicone were attached. The inlet tube
can be connected to a syringe via a Luer-Lok while the exit tube allows the �uid to be
collected in a 50 mL test tube.
Leaflet (70 × 25 × 0.25 mm)
Flow Chamber
Base
Flow Chamber Seat
Contacting Edge
Area of Vacuum Grease
Figure 5-6. Flow chamber preparation
Two hours before testing, the blood was collected and brought to the lab on ice.
Once in the lab, a 20 mL syringe �lled with 15 mL of phosphate-buffered saline (PBS)
was connected to the inlet tube and secured in the syringe pump to �ush the surface
54

100 mm
Flow
Chamber
Microscope
Blood Flow
Inlet Tube
Outlet Tube
Figure 5-7. Experimental setup
and check the �ow chamber seal. For the initial �ushing, the �ow rate was set to 100
mL/hr or twice the experimental �ow rate. While the surface was being �ushed, the
blood was removed from the cooler and pierced with a decanter, shown in Figure 5-8;
20-30 mL of blood were drained into a beaker before drawing 15 mL of blood into a
20 mL syringe. Initially, the blood was kept on ice during all of the experiments, but to
extend the blood's life, a protocol was established where after �lling the �rst syringe, the
remaining blood in the blood bag was to be stored in the refrigerator between 2 and 4◦C.
Between trials, the blood would be brought out and prepared for the next lea�et in time
for the blood to be brought back to nearly room temperature (22◦C).
Once the initial �ushing was complete, the PBS syringe was exchanged for one
with blood to begin the experiment. The experimental conditions are listed in Table
5-2. Blood was pushed over the lea�et surface in a single pass at 50 mL/hr followed by
a single pass of PBS at the same �ow rate. During this �nal �ush, the lea�et surface
was viewed using a Zeiss Axiovert 100 microscope and a 33× objective. Images were
55

60 mm
2-Way
Valve
Decanter
Spike
Figure 5-8. Blood bag spike
recorded by a CCD camera and simultaneously viewed on a television monitor. While
recording, different areas of the surface were viewed by moving the �ow chamber.
Table 5-2. Experimental conditions
Volume of blood 15 mL
Number of passes 1
Blood �ow rate 50 mL/hr
Volume of saline 15 mL
Saline �ow rate 50 mL/hr
After completing each trial, the lea�et was removed from the �ow chamber and
the �ow chamber and all of the components were soaked in bleach for 30 min. Once
cleaned, the components were rinsed with PBS and any disposable components and
tubing were discarded. For the initial trials, the same tubing was used for all experiments
completed in a single day, but in the �nal protocol, new tubing was to be used for each
trial. The second lea�et was mounted in the �ow chamber and the procedure was
repeated.
Efforts were made to run up to 4 trials each day (each trial takes approximately
2 hr from set up to clean up), but it was observed that the blood would begin to
drastically deteriorate after the second trial making it dif�cult to view the lea�et surface.
Subsequently, the trials were limited to two per day. A table listing the number of
experiments performed per surface is shown in Table 5-3.
56

Table 5-3. Number of trials per surface
Surface Number of trials
Lea�et 1 2
Lea�et 2 1
Lea�et 3 1
Lea�et 4 2
Lea�et 5 2
Lea�et 6 3
Lea�et 7 3
5.3 Analysis of Blood Cell Adhesion
Once video of the lea�et surface was captured and stored on a computer, a grid
was overlaid sectioning the �eld of view into 16 quadrants. A diagram of the video grid
is shown in Figure 5-9. Cells were counted in each quadrant and added together to get
the total number of cells per area. Multiple areas were viewed on each surface and are
listed in Table 5-4.
1
2
3
4
1 2 3 4 Q24
Overlaid Grid220 μm
17
0 μ
m
Blood Cell Adhesion
Video
Platelets
Red Blood Cell
Figure 5-9. Diagram of cell counting method
57

Table 5-4. Number of areas analyzed per surface
Surface Areas analyzed
Lea�et 1 7
Lea�et 2 3
Lea�et 3 6
Lea�et 4 7
Lea�et 5 3
Lea�et 6 5
Lea�et 7 5
The number of adhered platelets and red blood cells for each surface is presented
in Table 5-5; the complete data can be found in Appendix A. The results are shown
graphically for platelets and red blood cells in Figures 5-10 and 5-11, respectively.
0
200
400
600
800
1000
1200
1400
1 2 3 4 5 6 7
Nu
mb
er
of a
dh
ere
d p
late
lets
Leaflets
Figure 5-10. Adhered platelets
After counting the cells for each area and normalizing the number to the total area,
the standard deviation was calculated and added to the bias using the root-mean-square
error (ErrorRMS) shown in the following equation:
ErrorRMS =
√σ2
Bias + σ2
StDev (5�1)
58

Table5-5.Numberofadheredbloodcells
Lea�et1
Lea�et2
Lea�et3
Lea�et4
Lea�et5
Lea�et6
Lea�et7
Platelets
Average(Cells)
650
550
462
334
576
803
664
Error R
MS
139
88
49
68
70
439
124
Area(m
m)
0.22×0.17
AdheranceIndex,AI
17380
14687
12357
8919
15410
21471
17765
Error R
MS(AI)
3717
2353
1310
1818
1872
11738
3316
Redbloodcells
Average(Cells)
16
10.33
0.14
71
0.2
Error R
MS
7.4
10.5
0.4
8.7
1.7
0.4
Area(m
m)
0.22×0.17
AdheranceIndex,AI
428
27
94
187
27
5
Error R
MS(AI)
198
27
13
11
233
45
11
59

0
5
10
15
20
25
1 2 3 4 5 6 7
Nu
mb
er
of a
dh
ere
d R
BC
Leaflets
Figure 5-11. Adhered red blood cells
where σBias is the bias imparted by the researcher and σStDev is the standard deviation
between the areas, when squared this term becomes the variance. This is the total error
for each surface studied.
The results from the blood cell adhesion trials are presented in Figures 5-12 and
5-13 corresponding to molds generated from loose diamond abrasive and composite
magnetic abrasive, respectively. The molds' surface Rz roughness values are included
for comparison. It can be seen from the �gures that the un�nished surface has a
high number of adhered platelets and red blood cells, while molds �nished with loose
diamond abrasive have few adhered red blood cells; the number of adhered red blood
cells incrementally reduces for molds �nished with composite magnetic following
decreases in surface roughness.
The number of adhered platlets does not follow a similar trend. Of the molds
produced from loose diamond abrasive, Mold 3, which has less adhered platelets and
red blood cells than Mold 2, has a higher roughness, 0.79 µm Rz compared to 0.28 µm
Rz for Mold 2. This is explained by the size of abrasive used to �nish the two molds and
60

the size of the subsequent cutting marks. Figures 5-14 and 5-15 show a comparison
between all of the �nished molds based on the size of the abrasive used to �nish each.
The molds are compared based on a 300 µm section of each mold's surface pro�le; the
reduced scale was used to examine the surface texture of the mold. From Figure 5-14,
Mold 2, which was �nished with 0-1 µm diamond powder, has larger surface features
than Mold 3 which was �nished with 0-0.5 µm diamond paste. Both molds were �nished
for 5 min, with the larger abrasive removing more material and creating a more even
surface �nish compared to the smaller abrasive which was unable to remove some
of the large surface features present on the original surface. These remnant features
in�uence the overall surface roughness, but only over small areas, like those observed
during the blood cell adhesion trials, the smaller cutting marks made by the smaller
abrasive reduced blood cell adhesion. This trend continues as the Mold 4 was �nished
with same size abrasive, 0-0.5 µm diamond paste, but for a longer period of time to
create an even surface �nish of the smaller cutting marks. This surface had the fewest
number of adhered blood cells.
All of the surfaces produced using diamond abrasive had few adhered red blood
cells, while the surface produced by WA magnetic abrasive, the largest of the composite
abrasives studied, had a large number of adhered red blood cells and less visibly
adhered platelets than the smoother diamond magnetic abrasive molds; the surface had
only slightly less adhered platelets than the un�nished mold. Mold 5, shown in Figure
5-15 and �nished with the WA magnetic abrasive, has large surface features relative to
the molds produced from the diamond composite abrasive, suggesting that the larger
surface features in�uenced the adhesion of red blood cells. From the videos used to
quantify the results, it was apparent that the adhered red blood cells and many of the
platelets aggregated in large groups on rougher surfaces. Often cells knocked away
by other �owing cells emptied a space only to uncover another cell underneath. Due
to this observation and that many of the cells become adhered around or within large
61

(i) Normalized platelet count (ii) Normalized red blood cell count
(iii) Surface roughness
0
5000
10000
15000
20000
25000
1 2 3 4
Ad
he
ren
ce
in
de
x p
late
lets
/mm
2
Leaflets
0
100
200
300
400
500
600
700
1 2 3 4A
dhe
ren
ce
in
de
x R
BC
/mm
2
Leaflets
0
0.5
1
1.5
2
2.5
3
1 2 3 4
Ro
ug
hne
ss RZμ
m
Leaflet molds
Figure 5-12. Comparison of adhered cells to diamond abrasive molds
62

(i) Normalized platelet count (ii) Normalized red blood cell count
(iii) Surface roughness
0
5000
10000
15000
20000
25000
30000
35000
1 5 6 7
Ad
he
ren
ce
in
de
x p
late
lets
/mm
2
Leaflets
0
100
200
300
400
500
600
700
1 5 6 7
Ad
he
ren
ce
in
de
x R
BC
/mm
2
Leaflets
0
0.5
1
1.5
2
2.5
3
1 5 6 7
Ro
ug
hne
ss RZμ
m
Leaflet molds
Figure 5-13. Comparison of adhered cells to composite magnetic abrasive molds
63

Figure 5-14. Comparison of diamond abrasive size on surface �nish
64

Figure 5-15. Comparison of composite magnetic abrasive size on surface �nish
65

surface features, the presence of the red blood cells may be reducing the number of
observable adhered platelets, both skewing the microscope focus and covering cells
attached beneath them. In addition, due to the large �eld of view produced by the 33×
objective, the large surface features of the un�nished and WA magnetic abrasive molds
may also be masking adhered cells. This could be �xed by increasing the magni�cation
and viewing a smaller area, allowing for a more detailed view and easier identi�cation
of cells. Aggregation still occured on smoother surfaces, but in smaller groups and less
frequently. This trend varied among areas for each surface viewed but was consistent
overall.
Time lapse images of Lea�ets 3 and 5 are shown in Figure 5-16. Images from
Lea�et 5, shown in Figure 5-16 (i), show a large number of adhered red blood cells
that tend to aggregate in the top left-hand corner around a large feature on the
surface. Comparatively, Lea�et 3, has a larger overall peak-to-valley roughness �
0.79 compared to 0.6 µm Rz � but a similar average roughness (0.06 µm Ra) and no
adhered red blood cells. When roughness pro�les of the two molds are compared, in
Figures 5-14 (ii) and 5-15 (i) for Molds 3 and 5, respectively, it is apparent that at smaller
scales Mold 5 has a rougher surface compared to Mold 3 with larger peak-to-peak
distances and deeper valleys. Since Mold 3 was �nished with a smaller abrasive, but for
the same amount of time as Mold 5, the peak-to-valley is greatly in�uenced by the large
remnant surface features that were present on the un�nished mold and not removed
by the small abrasive. These remnant features are not necessarily encountered by the
cells, which are small and seem to respond to the texture produced by the �nishing
abrasive.
Additionally, it was observed that the smoother surfaces, with lower average
roughness values, were more likely to lose cells from the surface to local shear
stresses induced by localized �ow. Currently, due to the small height of the �ow
chamber opening, there is not much available space to accomodate variation in lea�et
66

(i) Leaflet 5 from mold finished with WA magnetic abrasive (0.6 μm RZ)
(ii) Leaflet 3 from mold finished with 0-0.5 μm diamond abrasive (0.79 μm RZ)
20 μm 20 μm 20 μm
20 μm 20 μm 20 μm
Adhered RBC
Adhered Platelets
Figure 5-16. Timelapse images of adhered blood cells
thickness. It was observed that thicker lea�ets or lea�ets with higher thickness variation
had varying �ow rates and paths according to the thickness of a given area. The
corresponding increase in shear stress would make it less likely for the cells to adhere
to a surface. It was observed that of the surfaces subjected to this increased shear,
including surfaces from Mold 1 (un�nished), Mold 4 (diamond abrasive), and Molds
6 and 7 (diamond magnetic abrasive), that the smoother the surface the more likely
cells were to be pulled off, reversing adhesion. This could be due to cells being lodged
in the large surface features of the rougher molds which would protect them from the
higher shear stresses, or because the surface topography induced irreversible adhesion,
discussed in Section 2.2.2. To reduce the variation in localized �ow rate and shear
stress, the next �ow chamber will feature a deeper opening to mitigate the in�uence of
lea�et thickness variation.
67

CHAPTER 6
CONCLUSION
6.1 Concluding Statements
This work focused on developing and imparting a surface texture into silicone heart
valve lea�ets that reduces blood cell adhesion. The results are summarized below,
1. A �nishing process was developed and a machine was built for �nishing the
internal surface of a mold used in a unique heart valve manufacturing process.
2. Various surface textures at different surface roughness values were created in
the molds by changing the the type and size of abrasive particles. The surface
textures were replicated onto silicone heart valve lea�ets. It was shown that
shorter peak-to-peak distances produced smooth silicone surfaces due to the
effect of the silicone surface tension during replication.
3. An experiment was designed featuring the developed lea�ets and a �ow chamber
allowing blood cell adhesion on the lea�et surface to be observed. A testing
protocol was �nalized and implemented.
4. The process was recorded, and platelet and red blood cell adhesion was
quanti�ed. The number of cells was normalized to the observed area.
5. Cell adhesion was correlated to the size of abrasive particles used during mold
�nishing. Smaller abrasives, which create smaller peak-to-peak distances in
the molds and smoother silicone surfaces, reduced blood cells adhesion. Mold
surfaces �nished with loose diamond abrasive, created short cutting marks and
short microfeatures reduced blood cell adhesion more than mold surfaces �nished
with composite magnetic abrasive.
6. Since the cells are small and are viewed over a relatively small area compared to
the evaluation lengths used to measure surface roughness, the average surface
roughness better determines cellular adhesion than peak-to-valley roughness,
which measures the highest peak to the lowest valley over the entire evaluation
length.
7. Smoother surfaces featured less cell aggregation and were more likely to lose cells
during instances of high shear than surfaces with large surface features.
6.2 Future Work
This work is an initial step in the development of a polymeric heart valve. To better
observe the effect of the valve surface texture on blood cell adhesion, changes to the
testing setup and experimental design are suggested. To reduce the effect of thickness
68

variation on the experimental shear stress, a new �ow chamber will be developed
with a deeper opening to reduce resistance to �ow. This will provide more consistent
experimental conditions within the chamber and reduce variation. In future trials, the
magni�cation will be increased to better observe adhered cells and their morphology.
Additionally, it was observed that lea�et placement on the microscope slide affected
the behavior of the blood within the �ow chamber. Since the 70 mm lea�et was shorter
than the 76 mm microscope slide, the placement could be skewed to one side of the
�ow chamber or the other. It was observed that blood would pool over areas where the
glass slide was exposed. This affected the behavior of the blood in two ways depending
on the position. First, if the lea�et was positioned under the �ow chamber inlet, blood
would not pool in this location and the surface would clear rapidly during �ushing. This
was advantageous because with the surface cleared adhered cells were easy to view,
identify, and count. Negatively, if the lea�et was positioned under the inlet, blood would
pool at the exit and clot. This blocked �ow and caused pressure changes within the
�ow chamber making the surface go in and out of focus. If the lea�et was positioned at
the opposite end of the slide, the opposite would occur. The blood would freely leave
the �ow chamber but the pooling at the inlet would provide the observed area with a
constant stream of cells, often blocking the view of the surface making the cells harder to
identify and count. With the lea�et centered, both clotting at the exit and cell streaming
would occur to various degrees. To remedy this, it is proposed that a larger diameter
mold be used when developing lea�ets for blood cell adhesion testing. The larger
diameter tube created in the mold will be opened to make a longer lea�et that spans the
length of the microscope slide. This should eliminate the effects of blood pooling.
In this study, due to the geometry of the �ow chamber, the �nishing direction was
oriented inline with the blood �ow. In future trials, cell adhesion will be studied when
the blood is �owing perpendicular to the �nishing direction. This will be accomplished
by �nishing a longer section of the mold, thus developing a longer lea�et that is then
69

trimmed to �t on the microscope slide. An alternate �ow chamber was proposed that
would feature a 25 × 25 mm lea�et, where blood cell adhesion could be studied in either
direction and orienting the lea�et accordingly. But due to the testing setup and size
of the microscope objective, the pocket created on the underside of the �ow chamber
would be too small to accomodate it.
After running many blood cell adhesion trials, a protocol was established for
handling the blood and performing the experiments. The blood is picked up two
hours before the initial test and brought back to the lab on ice. Once in the lab, the
initial sample mounted in the �ow chamber is immediately �ushed with 15 mL of
saline at twice the experimental �ow rate. The blood bag is spiked and gently rocked
back-and-forth for 5 min to mix the blood before 20-50 mL are drained from the bag.
The gentle rocking motion is performed to minimize damage to the blood cells while
adequately mixing the blood components. Draining the blood clears out blood that has
contacted the spike and possibly damaged, after the blood is drained, 15 mL are drawn
into a syringe. The remaining blood is stored in the refrigerator at 2-4◦C until the next
trial is being prepped. Before beginning the second trial, the blood should be brought
back out and drawn into a syringe approximately 45 min before the trial to allow the
temperature of the blood to approach room temperature (approximately 22◦C). It was
noticed that the experimental temperature of the blood affected its behavior, if the blood
was too warm or too cold, it would easily clot and disrupt the trial.
While this study focused on the �nished silicone surface, the surface exposed to air
during curing will also be studied and is theoretically the smoothest surface achievable
by the silicone; it is formed by the silicone surface tension and the centrifugal force
exerted by the mold rotation. The air-side surface will be compared with the surface
produced from Mold 4 to identify if a smoother lea�et surface is achievable.
70

APPENDIX A
BLOOD CELL ADHESION DATA
71

TableA-1.Data
from
Lea�et1
Area1
Area2
Area3
Area4
Area5
Area6
Area7
Quadrant
Pl
RBC
Pl
RBC
Pl
RBC
Pl
RBC
Pl
RBC
Pl
RBC
Pl
RBC
Q11
18
222
223
130
344
039
043
0
Q12
16
224
033
038
044
147
048
3
Q13
44
125
129
242
247
156
058
0
Q14
30
026
023
031
123
052
039
0
Q21
29
241
028
041
040
040
132
1
Q22
40
239
037
239
147
144
142
1
Q23
64
145
736
345
042
160
061
0
Q24
27
837
043
041
334
449
149
0
Q31
39
324
144
248
065
047
245
1
Q32
50
140
030
160
045
461
045
4
Q33
55
028
10
41
259
050
254
157
0
Q34
39
124
340
047
045
253
042
0
Q41
25
128
041
036
023
159
036
1
Q42
34
144
041
039
141
061
059
0
Q43
32
231
037
044
045
044
258
0
Q44
36
021
028
134
039
049
042
0
Total
578
27
499
24
554
14
674
11
674
17
815
8756
11
Bias
80
280
280
280
280
280
280
2
72

Table A-2. Data from Lea�et 2
Area 1 Area 2 Area 3
Quadrant Pl RBC Pl RBC Pl RBC
Q11 17 0 31 0 32 0
Q12 28 0 44 0 39 0
Q13 NA NA 37 0 39 0
Q14 NA NA 24 0 23 0
Q21 32 0 44 0 38 0
Q22 49 0 32 0 46 0
Q23 49 0 35 1 44 0
Q24 30 0 32 0 26 0
Q31 44 0 38 0 50 0
Q32 53 0 33 0 44 0
Q33 46 0 38 0 38 0
Q34 32 0 29 0 29 0
Q41 27 0 27 0 34 0
Q42 39 0 36 1 45 0
Q43 34 0 44 0 39 0
Q44 31 0 30 0 17 1
Total 511 0 554 2 583 1
Bias 80 0 80 0 80 0
73

TableA-3.Data
from
Lea�et3
Area1
Area2
Area3
Area4
Area5
Area6
Quadrant
Pl
RBC
Pl
RBC
Pl
RBC
Pl
RBC
Pl
RBC
Pl
RBC
Q11
15
026
016
030
026
017
0
Q12
21
018
025
014
027
032
0
Q13
33
040
031
039
023
037
0
Q14
25
016
015
022
027
031
0
Q21
34
025
021
025
035
035
0
Q22
90
25
029
033
031
034
0
Q23
41
024
048
038
034
053
0
Q24
35
039
027
023
129
048
0
Q31
21
017
025
020
030
032
0
Q32
19
041
041
025
042
035
0
Q33
45
038
028
028
033
037
0
Q34
14
024
022
035
034
031
0
Q41
15
132
037
020
021
030
0
Q42
30
036
041
034
030
040
0
Q43
31
030
036
030
025
026
0
Q44
12
013
036
030
019
021
0
Total
400
1444
0478
0446
1466
0539
0
Bias
16
016
016
016
016
016
0
74

TableA-4.Data
from
Lea�et4
Area1
Area2
Area3
Area4
Area5
Area6
Area7
Quadrant
Pl
RBC
Pl
RBC
Pl
RBC
Pl
RBC
Pl
RBC
Pl
RBC
Pl
RBC
Q11
12
015
017
016
010
016
019
0
Q12
17
014
127
025
04
023
015
0
Q13
20
024
031
027
030
030
031
0
Q14
21
016
027
017
021
016
027
0
Q21
17
017
023
016
09
026
016
0
Q22
25
020
030
019
010
022
014
0
Q23
21
028
039
017
028
031
049
0
Q24
26
019
030
014
08
020
038
0
Q31
34
022
032
015
019
027
020
0
Q32
25
026
037
017
018
029
013
0
Q33
21
027
039
013
021
010
023
0
Q34
17
014
027
09
09
031
020
0
Q41
13
017
018
025
05
013
010
0
Q42
16
022
025
013
014
025
023
0
Q43
35
032
018
022
015
032
017
0
Q44
20
011
027
019
014
016
03
0
Total
340
0324
1447
0284
0235
0367
0338
0
Bias
16
016
016
016
016
016
016
0
75

Table A-5. Data from Lea�et 5
Area 1 Area 2 Area 3
Quadrant Pl RBC Pl RBC Pl RBC
Q11 28 0 19 2 32 0
Q12 43 0 20 1 39 0
Q13 35 0 50 1 34 0
Q14 43 1 27 0 25 1
Q21 32 0 27 2 23 0
Q22 39 0 29 4 45 0
Q23 46 0 33 0 45 0
Q24 38 0 46 0 37 0
Q31 35 0 29 0 32 0
Q32 49 0 42 1 43 0
Q33 57 0 47 1 41 0
Q34 40 0 41 0 39 0
Q41 32 0 22 1 33 0
Q42 42 0 23 2 37 1
Q43 55 0 38 2 28 1
Q44 31 0 30 0 28 0
Total 645 1 523 17 561 3
Bias 32 0 32 1 32 0
76

Table A-6. Data from Lea�et 6
Area 1 Area 2 Area 3 Area 4 Area 5
Quadrant Pl RBC Pl RBC Pl RBC Pl RBC Pl RBC
Q11 60 0 49 0 48 0 20 0 22 0
Q12 73 0 76 0 75 0 15 0 22 0
Q13 75 1 60 1 79 0 17 0 25 0
Q14 89 0 53 0 64 0 10 0 23 0
Q21 57 0 51 0 61 0 17 0 17 0
Q22 53 0 54 0 53 0 24 0 25 0
Q23 126 0 82 0 74 0 17 0 25 0
Q24 95 0 71 0 70 0 21 0 16 0
Q31 72 0 65 0 44 0 23 0 28 0
Q32 65 1 86 1 74 0 12 0 32 0
Q33 98 0 85 0 79 0 28 0 31 0
Q34 76 0 77 0 69 0 16 0 18 0
Q41 68 0 50 0 38 0 22 0 20 0
Q42 82 0 81 0 70 0 20 0 22 0
Q43 78 1 79 0 77 0 15 0 19 0
Q44 62 0 73 0 54 0 26 0 17 0
Total 1229 3 1092 2 1029 0 303 0 362 0
Bias 80 1 80 1 80 1 16 1 16 1
Table A-7. Data from Lea�et 7
Area 1 Area 2 Area 3 Area 4 Area 5
Quadrant Pl RBC Pl RBC Pl RBC Pl RBC Pl RBC
Q11 27 0 35 0 28 0 25 0 20 0
Q12 57 0 37 0 39 0 31 0 33 0
Q13 61 0 45 0 41 0 42 0 35 0
Q14 49 0 40 0 42 0 23 1 19 0
Q21 50 0 38 0 52 0 25 0 18 0
Q22 46 0 51 0 37 0 34 0 36 0
Q23 54 0 50 0 49 0 41 0 39 0
Q24 40 0 46 0 47 0 28 0 25 0
Q31 38 0 35 0 34 0 39 0 33 0
Q32 59 0 49 0 58 0 37 0 28 0
Q33 62 0 66 0 61 0 53 0 47 0
Q34 51 0 43 0 59 0 29 0 32 0
Q41 38 0 37 0 41 0 38 0 33 0
Q42 45 0 46 0 59 0 48 0 42 0
Q43 50 0 34 0 77 0 42 0 44 0
Q44 35 0 40 0 49 0 41 0 35 0
Total 762 0 692 0 773 0 576 1 519 0
Bias 32 0 48 0 16 0 80 0 80 0
77

APPENDIX B
CALCULATION OF BLOOD SHEAR STRESS
To calculate the �ow rate based on a prescribed shear stress the shear rate was
found using the following relation:
τ = µ _γ (B�1)
which becomes
_γ =τ
µ(B�2)
where _γ is the shear rate, τ is the shear stress, and µ is the dynamic viscosity of blood
(0.0038 Pa·s). Velocity can be calculated from the shear rate using the relation,
_γ =∂u
∂y(B�3)
which becomes
u = _γy + C (B�4)
where u is the velocity pro�le and y is the distance from the center of the chamber. At
the wall, a distance of h
2from the center of the chamber, where h is the height of the
chamber, the velocity is zero. Applying this boundary condition, Equation B�4 can be
solved for the constant C.
C = − _γh2
(B�5)
78

Plugging this back in, the velocity is then found to be,
u = _γ
(y − h
2
)(B�6)
The maximum velocity is found at the center of the pro�le, where y is equal to zero.
umax = _γh
2(B�7)
Assuming parabolic �ow, the average velocity is approximately half of the maximum
velocity. Volumetric �ow, or the experimental �ow rate, is found by multiplying the
average velocity by the �ow chamber opening area.
_V =umax
2A (B�8)
79

REFERENCES
[1] J. C. Sun, M. J. Davidson, A. Lamy, and J. W. Eikelboom, �Antithrombotic
management of patients with prosthetic heart valves: current evidence and future
trends,� The Lancet, vol. 374, no. 9689, pp. 565�576, 2009.
[2] A. G. Kidane, G. Burriesci, P. Cornejo, A. Dooley, S. Sarkar, P. Bonhoeffer,
M. Edirisinghe, and A. M. Seifalian, �Current developments and future prospects for
heart valve replacement therapy,� Journal of Biomedical Materials Research Part B:
Applied Biomaterials, vol. 88B, no. 1, pp. 290�303, 2009.
[3] G. Truskey, F. Yuan, and D. Katz, Transport phenomena in biological systems, ser.
Pearson Prentice Hall Bioengineering. Pearson Prentice Hall, 2004.
[4] W. Germann and C. Stan�eld, Principles of human physiology. Benjamin
Cummings, 2002.
[5] P. Zilla, J. Brink, P. Human, and D. Bezuidenhout, �Prosthetic heart valves: Catering
for the few,� Biomaterials, vol. 29, no. 4, pp. 385�406, 2008.
[6] P. Bloom�eld, �Choice of heart valve prosthesis,� Heart, vol. 87, no. 6, pp. 583�589,
2002.
[7] M. S. Sacks, F. J. Schoen, and J. E. Mayer, Jr., �Bioengineering Challenges for
Heart Valve Tissue Engineering,� Annual Review Of Biomedical Engineering,
vol. 11, pp. 289�313, 2009.
[8] Y. Boudjemline and P. Bonhoeffer, �The percutaneous implantable heart valve,�
Progress in Pediatric Cardiology, vol. 14, no. 1, pp. 89�93, 2001.
[9] L. H. Edmunds, S. Mckinlay, J. M. Anderson, T. H. Callahan, J. H. Chesebro, E. A.
Geiser, D. M. Makanani, L. V. McIntire, W. Q. Meeker, G. K. Naughton, J. A. Panza,
F. J. Schoen, and P. Didisheim, �Directions for improvement of substitute heart
valves: National heart, lung, and blood institute's working group report on heart
valves,� Journal of Biomedical Materials Research, vol. 38, no. 3, pp. 263�266,
1997.
[10] H. Ghanbari, H. Viatge, A. G. Kidane, G. Burriesci, M. Tavakoli, and A. M. Seifalian,
�Polymeric heart valves: new materials, emerging hopes,� Trends in Biotechnology,
vol. 27, no. 6, pp. 359�367, 2009.
[11] A. Yoganathan, Z. He, and S. Jones, �Fluid mechanics of heart valves,� Annual
Review Of Biomedical Engineering, vol. 6, pp. 331�362, 2004.
[12] S. Chung, Y. Im, H. Kim, H. Jeong, and D. A. Dornfeld, �Evaluation of
micro-replication technology using silicone rubber molds and its applications,�
International Journal of Machine Tools and Manufacture, vol. 43, no. 13, pp.
1337�1345, 2003.
80

[13] N. Mohandas, R. M. Hochmuth, and E. E. Spaeth, �Adhesion of red cells to foreign
surfaces in the presence of �ow,� Journal of Biomedical Materials Research, vol. 8,
no. 2, pp. 119�136, 1974.
[14] K. R. Milner, C. A. Siedlecki, and A. J. Snyder, �Development of novel submicron
textured polyether(urethane urea) for decreasing platelet adhesion,� ASAIO J,
vol. 51, no. 5, pp. 578�584, 2005.
[15] E. Martines, K. McGhee, C. Wilkinson, and A. Curtis, �A parallel-plate �ow chamber
to study initial cell adhesion on a nanofeatured surface,� NanoBioscience, IEEE
Transactions on, vol. 3, no. 2, pp. 90�95, june 2004.
[16] N. J. Hallab, K. J. Bundy, K. O'Connor, R. L. Moses, and J. J. Jacobs, �Evaluation
of metallic and polymeric biomaterial surface energy and surface roughness
characteristics for directed cell adhesion,� Tissue Engineering, vol. 7, no. 1, pp.
55�71, 2001.
[17] A. Thapa, T. Webster, and K. Haberstroh, �Polymers with nano-dimensional surface
features enhance bladder smooth muscle cell adhesion,� J Biomed Mater Res, vol.
67A, no. 4, pp. 1374�1383, 2003.
[18] M. Stavridi, M. Katsikogianni, and Y. F. Missirlis, �The in�uence of surface
patterning and/or sterilization on the haemocompatibility of polycaprolactones,�
Materials Science and Engineering: C, vol. 23, no. 3, pp. 359�365, 2003.
[19] M. L. Carman, T. G. Estes, A. W. Feinberg, J. F. Schumacher, W. Wilkerson, L. H.
Wilson, M. E. Callow, J. A. Callow, and A. B. Brennan, �Engineered antifouling
microtopographies�correlating wettability with cell attachment,� Biofouling, vol. 22,
no. 1-2, pp. 11�21, 2006.
[20] J. F. Schumacher, M. L. Carman, T. G. Estes, A. W. Feinberg, L. H. Wilson, M. E.
Callow, J. A. Callow, J. A. Finlay, and A. B. Brennan, �Engineered antifouling
microtopographies - effect of feature size, geometry, and roughness on settlement
of zoospores of the green alga ulva,� Biofouling, vol. 23, no. 1-2, pp. 55�62, 2007.
[21] A. Curtis and C. Wilkinson, �Topographical control of cells,� Biomaterials, vol. 18,
no. 24, pp. 1573�1583, 1997.
[22] K. Milner and C. Siedlecki, �Fibroblast response is enhanced by poly(l-lactic acid)
nanotopography edge density and proximity,� Int J Nanomedicine, vol. 2, no. 2, pp.
201�211, 2007.
[23] M. Kuwahara, M. Sugimoto, S. Tsuji, H. Matsui, T. Mizuno, S. Miyata, and
A. Yoshioka, �Platelet shape changes and adhesion under high shear �ow,� Ar-
terioscler Thromb Vasc Biol, vol. 22, no. 2, pp. 329�334, 2002.
81

[24] J. Y. Park, C. H. Gemmell, and J. E. Davies, �Platelet interactions with titanium:
modulation of platelet activity by surface topography,� Biomaterials, vol. 22, no. 19,
pp. 2671�2682, 2001.
[25] M. W. Weston, D. V. LaBorde, and A. P. Yoganathan, �Estimation of the shear stress
on the surface of an aortic valve lea�et,� Annals of Biomedical Engineering, vol. 27,
pp. 572�579, 1999, 10.1114/1.199.
[26] S. Einav, D. Stolero, J. Avidor, D. Elad, and L. Talbot, �Wall shear stress distribution
along the cusp of a tri-lea�et prosthetic valve,� Journal of Biomedical Engineering,
vol. 12, no. 1, pp. 13�18, 1990.
[27] F. J. Walburn and P. D. Stein, �Wall shear stress during pulsatile �ow distal to a
normal porcine aortic valve,� Journal of Biomechanics, vol. 17, no. 2, pp. 97�102,
1984.
[28] D. M. Stevenson, A. P. Yoganathan, and F. P. Williams, �Numerical simulation of
steady turbulent �ow through trilea�et aortic heart valves�ii. results on �ve models,�
Journal of Biomechanics, vol. 18, no. 12, pp. 909�926, 1985.
[29] H. Yamaguchi and T. Shinmura, �Study of an internal magnetic abrasive �nishing
using a pole rotation system: Discussion of the characteristic abrasive behavior,�
Precision Engineering, vol. 24, no. 3, pp. 237�244, 2000.
[30] H. Yamaguchi, T. Shinmura, and A. Kobayashi, �Development of an internal
magnetic abrasive �nishing process for nonferromagnetic complex shaped tubes,�
JSME International Journal Series C Mechanical Systems, Machine Elements and
Manufacturing, vol. 44, no. 1, pp. 275�281, 2001.
[31] H. Yamaguchi, T. Shinmura, and R. Ikeda, �Study of internal �nishing of austenitic
stainless steel capillary tubes by magnetic abrasive �nishing,� Journal of Manufac-
turing Science and Engineering, vol. 129, pp. 885�892, 2007.
[32] R. E. Riveros, H. Yamaguchi, T. Boggs, I. Mitsuishi, K. Mitsuda, U. Takagi, Y. Ezoe,
K. Ishizu, and T. Moriyama, �Magnetic �eld assisted �nishing of silicon mems
micro-pore x-ray optics,� ASME Conference Proceedings, vol. 2010, no. 49460, pp.
87�94, 2010.
[33] H. Yamaguchi and T. Shinmura, �Study of the surface modi�cation resulting from
an internal magnetic abrasive �nishing process,� Wear, vol. 225-229, no. Part 1, pp.
246�255, 1999.
[34] N. M. K. Lamba, J. M. Courtney, J. D. S. Gaylor, and G. D. O. Lowe, �In vitro
investigation of the blood response to medical grade pvc and the effect of heparin
on the blood response,� Biomaterials, vol. 21, no. 1, pp. 89�96, 2000.
82
BIOGRAPHICAL SKETCH
Taylor Boggs was born in 1986 to William and Patti Boggs in Orlando, Florida. She
enrolled at the University of Florida in 2005 and graduated with a Bachelor of Science
in mechanical engineering in 2009. During her �nal year as an undergraduate, she
joined the Machine Tool Research Center (MTRC) and began conducting research with
Dr. Hitomi Greenslet who continued to guide her graduate work in January 2010. She
graduated with a Master of Science in mechanical engineering in August 2011.
83