bls working papers · bls working papers u.s. department of labor ... peter b. meyer, u.s. bureau...
TRANSCRIPT

BLS WORKING PAPERS
U.S. DEPARTMENT OF LABOR Bureau of Labor Statistics
OFFICE OF PRODUCTIVITY AND TECHNOLOGY
Proposed Category System for 1960-2000 Census Occupations
Peter B. Meyer, U.S. Bureau of Labor Statistics Anastasiya M. Osborne, U.S. Bureau of Labor Statistics
Working Paper 383 September 2005 All views expressed in this paper are those of the authors and do not necessarily reflect the views or policies of the U.S. Bureau of Labor Statistics.
1
Proposed category system for 1960-2000 Census occupations
9 September 2005
By Peter B. Meyer and Anastasiya M. Osborne Office of Productivity and Technology1
U.S. Bureau of Labor Statistics Abstract
This paper proposes a detailed, consistent category system for occupations in the Census of Population data from 1960 to 2000. Most of the categories are based on the 1990 Census occupation definitions. We analyze employment levels, average earnings levels, and earnings variance in our occupation categories over time, compare these to similar trends for occupations defined in the occ1950 IPUMS classification, and test both classifications for consistency over time.
1. Introduction and goals
The decennial Census of Population provides data on the earnings and occupations
of individuals living in the U.S. The occupations reported by respondents are placed in
different categories based upon a list of several hundred defined for each Census by the
Census Bureau. Since 1968, the monthly Current Population Survey (CPS) has used the
Census occupational categories, periodically updating them to the latest category system.
Researchers can therefore use either the Census or CPS to study occupations over time in
detail, but only with some restrictions because the classifications have changed from
decade to decade. Some occupation categories disappeared while new ones emerged,
partly due to technological reasons but mostly because the category system was evolving.
In some cases, the content of an ongoing job category changed. This paper proposes a
mapping between occupational category systems as they existed in the Census of
1 We thank Leo Sveikauskas, Mike Harper, David Autor, Steve Rosenow, Trent Alexander, and colleagues in the BLS Office of Employment and Unemployment Statistics for data, advice, and valuable comments. The views and findings in this exploratory research work do not represent official views, findings, or policy of the U.S. Bureau of Labor Statistics.
2
Population from 1960 to 2000, and in the CPS from 1968 to 2003, into a unified set of
categories, and tests the proposed system for consistency over time.
Matt Sobek of the IPUMS project2 developed a consistent occupational category
system and made it available for the IPUMS Census and CPS samples. The central
variable, occ1950, represents a consistent occupational system based on the 1950 Census
which Sobek extended to subsequent Censuses. Sobek assigned each occupation
observed in a given year to a job category from the list of occupations used in the 1950
Census. As part of our project, we studied the IPUMS common occupational
classification, since it is the only one we know of. With the exception of the military in
one year, IPUMS assigned each reported Census occupational code to a single occupation
in the 1950 category system. Data for each Census and CPS year has consequently been
dual-coded, in other words, an occupational code for its own year has also been assigned
a parallel code to tell us what that occupation would have been in 1950.
The text below reports evidence on the relative size and income stability of
occupations in the occ1950 category system and the new classification. Appendix B lists
the mapping between each occ1950 occupation and occupation categories in each of the
later years. The quality of this mapping is high. However, for certain research purposes,
one might want to use a different occupation system. For example, a test of a particular
hypothesis may require more detailed occupations for comparison, or larger subgroups in
order to provide larger samples to generate reliable summary statistics for each group,
such as the variance of earnings. Also, the researcher may wish to study a panel of
occupations to see how technology changes in since 1970s have affected occupations in
the U.S. Over time it becomes more difficult to match new occupations to the 1950-
based classification.
Any choice of a category system makes some tradeoffs between different desirable
attributes, such as consistency over time, length of the time series, accuracy, and
precision of the occupational information. Ideally, a new system should also conform to
categories used in other sources, such as the Dictionary of Occupational Titles or the
Labor Department’s new O*NET. Since specialists in this area repeatedly face the
2 IPUMS stands for Integrated Public Use Micro Samples. The ongoing project is discussed at http://www.ipums.umn.edu cited as Ruggles and Sobek (2003), and King, Ruggles, and Sobek (2003).

3
problem of mapping a category system to earlier years, we state here our methods
explicitly and provide supporting tables, code, and criteria reflecting our choices so
others can use, adapt, and improve on them.
Our effort to develop a consistent occupation system was similar to the IPUMS but is
centered on the 1990 Census occupation categories and is intended for somewhat
different purposes. We do not attempt to apply our category system to data earlier than
1060, whereas IPUMS mapped the occ1950 definitions onto Census data back to 1850.
Appendix A lists our Census 1990-based occupational system, together with a mapping
to relevant occupational categories back to the 1960, 1970, 1980 Census, and forward to
the 2000 Census. We combined several detailed occupations into more general
categories (making the occupation set more coarse) in order to provide a consistent time
series for other Census years. When possible, we tried to map back to the 1960 Census,
and forward to the 2000 Census. We have 389 occupation categories.3 We tested these
categories for consistency over time on the hypothesis that changes in levels and trends in
income measures should be relatively stable, if the proposed occupations were defined
consistently. Below we compare our proposed mapping to the IPUMS occ1950 mapping,
and show the least stable occupations in both systems, using changes from one Census
year to another in three analytical variables: mean earned income, the coefficient of
variation of earned income, and the fraction of the work force in each occupation.
2. Data sources and definitions
We obtained decennial Census of Population data for 1960-2000 from
www.ipums.umn.edu. All the analysis below was performed on the basis of this IPUMS
data, using 1% samples from 1960, 1970, and 2000, and 5% samples for 1980 and 1990.
The CPS has used Census of Population occupational categories since 1968.4 The
Census data offers large samples, but only every ten years, while the CPS has smaller
samples of earnings and occupation data for every year.
3 This includes some special cases which exist only in the 1960 data, and other special cases such as “unknown” and “unemployed” which are counted like occupations in some years. 4 The 1968-1970 March CPS used the 1960 Census occupation definitions, the 1971-182 CPS data used the 1970 Census definitions, the 1983-1990 CPS apply the 1980 Census occupation categories, the 1991-2002

4
The IPUMS occ1950 list of categories is shorter than the list of occupations in the
1990 and 2000 Census. Some 1950 occupation titles are not used any more. For
example, there were eleven categories with the job title “apprentice” in 1950, a title not
used in the later data. On the other hand, the 1950 list does not include distinguish
recently emerging occupations such as computer programmer, and detailed information
on those occupations is needed to examine to study the effect of technological change on
occupational structure and on income variance.
Chart 1. Counts of the Census occupational categories in years 1950-2000.
The Census defined 287 separate occupations in 1950, and more in later years, as
illustrated in Chart 1. Analysis of categories show significant changes over time: some
occupations disappeared, others emerged, and some were split into several categories.
The title of apprentice disappeared by the year 2000. Electricians’ apprentices have been
combined with electricians. Over the years, tile setters and roof repairers were
sometimes presented separately and sometimes as one occupation. In our proposed
classification, combining these occupations into one category reduces the level of detail
in some Census years, but achieves consistency over time. Our proposed classification
CPS data use the 1990 Census categories (with some tiny variations, documented on the IPUMS web site), and starting with the 2003 CPS the 2000 Census occupation definitions have been applied.
Occupational Categories in the Census of Population, 1950-2000
543
504
504
441
296287
250
300
350
400
450
500
550
600
1950 1960 1970 1980 1990 2000
Years
Nu
mb
er o
f Cen
sus
Occ
up
atio
ns

5
has 389 occupation categories. The list of occupations we propose is shorter and
therefore coarser than the 1990 Census. On the other hand, it is more numerous and
therefore finer than the 1950 set used by IPUMS.
A mapping between two category systems is called a crosswalk. Crosswalks
between occupation categories in the Dictionary of Occupational Titles (DOT), the
Census and the Standard Occupational Classification (SOC) are available at the National
Crosswalk Service Center. The national crosswalk service center has a crosswalk
between the DOT and the 2000 SOC. This Census web site has crosswalks between the
1990 census and the 2000 census, as well as the 2000 Census and the 2000 SOC. (See
http://www.census.gov/hhes/www/ioindex.html.) Appendix C integrates our proposed
classification with information on job attributes obtained from data provided in the
Dictionary of Occupational Titles (required strength, working with people, quality of
working conditions, and analytical tasks).
Occupations are distinguished from one another mainly by the kinds of tasks the
workers perform. Sometimes they are defined based on the function the workers provide
for others, or by the hierarchical relation between the worker and others (e.g. supervisors
and apprentices). Also, technological innovation may change the level and number of
tasks in a particular occupation without changing the occupation title, or it may lead to
the creation of a new category. For example, the blacksmith occupational category
existed in the Census classification until 1970, but not later. A category for computer
scientists first appeared in the 1970 Census. These occupational titles refer to particular
technologies. When occupations are organized by tasks, technical change can result in
the decline or disappearance of one occupation, and the appearance of a new one.
When occupations are instead organized by function, i.e. the type of service provided
to other people, technical change tends to occur within occupational categories without
altering occupation classification. For example, technological change has greatly altered
the work duties of nurses, but the occupation category “nurses” has remained consistently
defined.

6
2.1 The 1950 Occupation set used by IPUMS
The IPUMS project studied how occupations in later Census years could be mapped
to the earlier Census years. This project resulted in a crosswalk variable occ1950 given
in each IPUMS file from 1850 to the recent year 2000. In almost all cases, there is a
crosswalk between a particular occupation in a particular year and an occ1950 code.
The exception is the armed forces category. In most years, respondents could
specify their occupation as “in the military”. In 1990, the U.S. Census collected detailed
information on the job tasks the armed forces members were performing (e.g. cook,
doctor), and recorded separately whether the employer was the armed forces. This
resulted in a more precise data in 1990 than in other years. However, since the bulk of the
data came from other years and did not have the same level of detail, we decided to use
the same definition of the armed forces as the IPUMS occ1950 variable. The armed
forces are a separate occupation category. Individuals with distinctly military
occupations and those who reported the armed forces as the last employer were placed
into this category. Probably some civilian employees of the Dept of Defense, or
reservists, are being counted in the armed forces, even though if we had more detailed
information, we would count them in another occupation. (As per
http://www.ipums.umn.edu/usa/pwork/empstata.html ) See appendix A, category 905,
and appendix B, category 595, for the exact specification.
The occ1950 classification cannot satisfy the needs of some research projects, for
several reasons:
1) It does not provide detailed information on occupations that developed after 1950.
For example, it does not separate computer programming and computer administrators
from electrical engineers or mathematical scientists. A researcher might need to separate
these categories to study technological change over time.5
5 For example, in Meyer (2001) and subsequent research, these occupations were examined for the effects of rapid technological change and related uncertainty and turbulence.
7
2) It contains occupations with a sizable fraction of workers in the 1950s, which
warranted a separate category, but that fraction became thinner or completely disappeared
in later Census years. For example, the 1950 Census distinguished eleven categories
of apprentices (electricians, carpenters, masons, and so forth). All those categories were
replaced by a single category (“helpers”) in the 2000 Census. The apprentice categories
were small to begin with, and we do not know the reason of their disappearance from the
list of occupational categories.
3) Some of the occ1950 occupations are defined consistently over time and listed
separately, but are too small to compute reliable large-sample aggregate statistics for the
group. For example, only a few marine and naval architects and petroleum engineers
have been ever reported. Here a researcher would face a problem of a small sample,
rather than a problem of creating consistent time series.
By extending our proposed 1990-based category system back to the 1960s, we have
the advantage of knowing how occupations changed over time, and can choose categories
large enough and long lasting enough for a particular research project.
2.2 Definitions of key variables
For the statistical analysis presented below, we restrict the sample to respondents
between ages 16 and 75 who had a job (that is, the empstatd variable has the value 10, 12,
14, or 15). When we refer to fractions of the work force, we mean fractions of this
restricted sample.
We define earned income as the sum of wage income and income from business or
self-employment. For 1990 and 2000, IPUMS imputed the estimates of topcoded state-
specific incomes based on Census estimates they had. We have not studied top-coding in
other years.

8
3. Problems, issues, and opportunities in matching categories
3.1 Choice among assignments in a split
The Census Bureau published several technical papers that include tables showing
how many people were coded in each occupation in one Census year and how they
would be coded using the classification from the a different Census year. This allows us
to see the frequency of assigning a particular respondent record to particular occupations
in consecutive Censuses, such as those in Scopp (2003).
Table 1. Examples of occupational classification changes from 1970 to 1980
1970 code
1970 occupation
category
1980 code
1980 component categories and codes
Experienced Civilian
Labor Force in 1980
Percent of 1970
Category
007 Financial managers 9,810 1.31 023 Accountants and auditors 640,112 85.67 025 Other financial officers 50,930 6.82
036 Inspectors and compliance officers, except construction
14,870 1.99 001 Accountants
337 Bookkeepers, accounting, and auditing clerks 31,467 4.21 043 Architects 52,454 88.20 053 Civil engineers 4,096 6.89 002 Architects 058 Marine engineers and naval architects 2,925 4.92 064 Computer systems analysts and scientists 7,943 4.62
003 Computer
programmers 229 Computer programmers 163,845 95.38
004 Computer systems analysts
064 Computer systems analysts and scientists 84,804 100.00
007 Financial managers 153,488 47.37 019 Managers and administrators, n.e.c. 40,151 12.39 025 Other financial officers 109,575 33.82 303 Supervisors, general office 8,643 2.67
202 Bank officers and financial
managers 383 Bank tellers 12,154 3.75 009 Purchasing managers 9,586 4.40
013 Managers, marketing, advertising and public relations
124,506 57.10 231
Sales managers
and department heads, retail
trade 243 Supervisors and proprietors, sales occupations 83,968 38.51

9
IPUMS used these tables to assign the occ1950 mapping. Trent Alexander of
IPUMS kindly provided these tables to us. Table 1 provides one example of a mapping
given in the IPUMS Excel spreadsheet.
For any of the 1970 categories it is clear which occupation is the closest match in
1980 (shown in bold), but choosing that single assignment introduces a mismatch for
some of the individuals within it. The categories are not a one to one match since the
Census has redefined the category system, often because of technological changes, or to
conform to other systems such as the SOC, the Standard Occupational Classification.
3.2 Least-common-denominator occupational categories
In this section we discuss categories with “not elsewhere classified” in their titles,
usually abbreviated as “n.e.c.” Our proposed standard system has more of these
categories than the Census classification. Our “n.e.c.” categories can have different
meanings depending on a year and particular occupation. For example, midwives and
chiropractors used to be separate categories in 1960 and 1970, but were combined into
one category later. We assigned them into an “Other health and therapy jobs” category in
our proposed standard classification given in appendix A.
Another problematic example is presented in Table 2. It shows the difficulty of
creating an occupational crosswalk over time. A plurality of workers (37%) coded in 284
in 1970 would be mapped to occupation 263 in 1980.
Table 2. Sales workers category, an example where mapping is difficult
1970 code
1970 occupation
title
1980 code 1980 component categories and codes
Experienced Civilian
Labor Force
Percent of 1970
Category 263 Sales workers, motor vehicles and boats 185,160 37.06
266 Sales workers, furniture and home furnishings
98,941 19.80
267 Sales workers; radio, television, hi fi, and appliances
76,674 15.35
268 Sales workers, hardware and building supplies
81,668 16.35
269 Sales workers, parts 39,120 7.83 274 Sales workers, other commodities 16,008 3.20
284
Sales workers, except clerks, retail trade
277 Street and door to door sales workers 2,082 0.42
10
However, the title of 1980 occupation 263 is specifically restricted to motor vehicles
and boats, while the 1970 title is not. If we were to use the 1980 category name and
apply it to 1970 data, we would have had a category that explicitly mislabeled most of its
members. Instead, we combined the workers in category 284 in 1970 into the category
called “Salespersons not elsewhere classified”. Because occ1950 uses the predefined
1950 categories, no categories were renamed, or “n.e.c.” categories created or expanded,
to extend consistency in definition across years.
To test the consistency of occ1950 categories and our proposed standard set, for
example, “Technicians, n.e.c.” and “Salespersons, n.e.c.”, we conduct statistical analysis
of the subpopulations in these categories, as shown in Appendix D.
3.3 Reusable techniques
Other researchers may wish to create a different occupational classification more
suitable for their project. To make their job easier, we mean to make the tables,
spreadsheets, code, and testing criteria public by describing them in this working paper
and providing them on the Internet. Our methods and tools can then be applied in other
circumstances. In principle, the industry variable in the Census could be standardized in
a similar fashion.
4.0 Testing the categories
We computed three statistics for each occupation in the proposed standard system in
order to detect which job categories show sharp changes from one Census year to
another. Sharp changes in them probably reflect changes in a category’s definition rather
than a real-world change. Appendix D shows the three measures, and identifies
occupations with the most pronounced changes from Census to Census. We applied the
same criteria to the IPUMS standard occ1950 system that was in the IPUMS data
containing the 1960-2000 decennial Censuses. We resticted the sample to the employed
respondents between 16 and 75 years old. The variable empstatd was used to restrict the
employment status to respondents who had a job. All tables in this paper use Census
person weights in their construction of averages.

11
Our first measure is the weighted mean earned income for each occupation in each
Census year. Earned income was defined to be the person’s annual wage or salary, plus
business income. We compare this to the weighted mean earned income in the
occupation in the previous decade. Second, we measure earnings inequality within the
group by the coefficient of variation, and reported the greatest increase and lowest
increase for both occupational category systems for each pair of consecutive Censuses.
Third, we measure the fraction of the work force contained in each occupation, looking
for sharp increases or declines in this proportion from Census to Census. Appendix D
reports ratios measuring these changes. We found that the proposed new categories and
the occ1950 categories perform similarly by these criteria.
We do not use these measures as a tool to assign groups into an occupational
category system. The measures serve only to verify that certain kinds of gross errors
have been avoided. Many errors, avoidable and otherwise, could still be present in data
which perform well by such criteria. Judgment of whether an occupation system is
reasonable has to depend on the fundamental criteria by which the respondents were
grouped, not on these rough measures of consistency.
5.0 Job content attributes
The Dictionary of Occupational Titles has over 12,000 detailed occupations with a
few attributes measured on the basis of observing workers, and a text description about
each occupation. Among the attributes measured are the physical strength, language use,
and mathematical reasoning required. These occupations have been mapped to 1990
Census definitions, so these attributes can be included in all years.
Other researchers have defined useful attributes of occupations. England, Budig, and
Folbre (2002) defined care work occupations as those which required specific attention to
other individuals. Their research followed a tradition of measuring the degree to which
women were paid less than men because of job attributes. Meyer (2001) defined a set of
particular jobs which have been strongly affected by the pace of semiconductor
improvements and technological uncertainty. Rosen (1981) posits that particular
occupations are subject to a superstars effect, in which larger markets raise the inequality
12
of earnings. There are also long standing categories of clerical, managerial, professional,
or technical occupations. Ideally, researchers could use occupation category systems in
which category boundaries would match up with the substantive relevant to them.
The table in Appendix C of this paper shows how we map occupational attributes
from other sources into the proposed classification system. We hope our effort will help
researchers work around the limited definitions of skills that are sometimes used as
independent variables in earnings regressions. Sometimes skills are measured crudely by
the number of years of schooling, implying equal earnings for those with bachelor’s
degrees in electrical engineering, art history, and finance. Levels of education also reflect
signaling, certification, and opportunity differences, entirely apart from skills. Including
other available attributes of the job (see Appendix C) can provide better information
about the skills, tasks, and functions of the worker.
Once we establish a common occupational category system, we can measure other
attributes, such as the fraction of college graduates; the fraction of immigrants; the
fraction working in urban areas; and the fraction working in the private sector. These are
possible predictors about the way the occupation has evolved. We could test whether
occupations requiring mathematics have become more numerous or better paid over time,
holding all else constant. Perhaps occupations requiring government certification have
been more stable than other occupations. Perhaps occupations with supervisory authority
(such as managers) have evolved in different ways than other occupations. Perhaps new
occupations tend to appear at the top of the income distribution, and then drift down;
there could be a life cycle of occupations, in a way that is informative about technological
change.
6.0 Potential improvement: splitting recorded occupations
In almost every case, we have assigned each occupation mentioned in the Census to
one proposed standard category. There is one set of exceptions in 1990, where the armed
forces category was distinguished by a different field of information (empstatd) and
members of the armed forces had a variety of occupations (e.g. cook or doctor). Our

13
classification assigns all members of the armed forces to a single armed forces
occupation.
Using other information recorded in a Census, it may be possible in future work to
split the members of an originally recorded occupation into groups that fit the proposed
standard occupations better. The next sections provide examples of such recoding.
6.1 Using dual-coded data sets
From 2000 to 2002, many CPS records were dual-coded into the 1990 Census
category system as well as the 2000 Census system. Dual-coding makes it possible to
look at some occupation categories that were stable in 1990, but were split into groups in
2000, and vice versa. We can use micro data on the individuals who were assigned in the
different ways in the dual-coded data set, then apply the rules learned to the Census and
CPS data at large. Using this detailed information, in later work it may be possible to
define year-2000 occupation groups better than they are now classified in Appendix A,
and possibly in a way that improves the test performance in appendix D.
6.2 Splitting 1960 Census occupations
There were several cases in the 1960 data where it may be realistic to split a Census
occupation group into several proposed standard groups. One case is the “Statisticians
and actuaries” category in the 1960 classification. In the 1970 through 1990 Censuses,
statisticians and actuaries were recorded as separate groups. In Appendix A we assigned
all the “statisticians and actuaries” in 1960 to the statisticians group because it was much
larger and therefore provides the closest match for most of them. But we can detect those
who were likely to have been classified as actuaries in any later year, and move some of
them into the actuaries category, which is empty for now. Several predictors are pretty
strong, based on the 1970 evidence:
• 65% of actuaries worked in industry 717 (the insurance industry), whereas only 10% of statisticians did.
• 88% of actuaries worked in the private sector, whereas only 60% of statisticians did • 10% of statisticians were foreign-born; only 4% of actuaries were • About half of statisticians were female. Only a third of actuaries were.

14
• The mean salary of actuaries was 50% higher than the mean salary of statisticians • Actuaries had much higher mean business income.
Using all this information in a regression, it should be possible to predict which of
the “statisticians and actuaries” were most likely to be actuaries, and to reassign them.
Furthermore, we could try to estimate how many were then reclassified correctly and how
many reclassified incorrectly based on how such a rule would have worked in the 1970
Census and the 1971-1982 CPS. This would improve the accuracy of the data on
statisticians, and make a longer time series on actuaries possible.
Numbers of respondents: actuaries and statisticians in decennial
Census (1% samples of the population in 1960 and 1970; 5% in 1980 and 1990)
1960 1970 1980 1990
Actuaries 50 526 899 Statisticians
260 268 1615 1555
A similar situation occurs in the “Lawyers and judges” category. Lawyers and judges
were combined into a single category in the 1960 data. But in the 1970, 1980, and 1990
data, all judges worked in the public sector, and it may be possible to use information on
the place of work (government versus other) to infer which of the respondents were
mostly likely to be judges.
There are other examples. In one Census, some of the “athletes and kindred”
category were physical education teachers. Possibly, teachers can be separated out
because they worked in the public sector. There is also a large “Foremen, n.e.c.”
category which existed in the 1960 Census, and we had to keep it in the proposed
classification because there was no good category to match it to. This category can
perhaps be split up by industry to align its members with the later categories which
distinguished supervisors in extractive occupations from those in production occupations
and several other categories.
15
7.0 Conclusion: Possible contribution of this project
With an occupation category system lasting from 1960 to the present and large
samples like those in the Census and CPS, researchers could build informative panels of
occupations over time and test which attributes of an occupation predict other attributes
of an occupation. For example, Meyer (2001) tested how an attribute of an occupation –
the level of earnings dispersion within it -- evolved over time in particular types of
occupations. The hypothesis was that high tech occupations and media-amplified
occupations (called “superstars” occupations by Rosen (1981)) had rising inequality
within them.
Another set of applications would treat attributes associated with occupations as
predictors about individuals. For example, particular occupations have been identified as
involving care work, very new technology, superstars’ properties, and government
licensing requirements. England, Budig, and Folbre (2002) tested whether caring and
nurturing occupations (a gendered attribute) predicted pay levels apart from whether the
jobholder was male or female. There is also a literature on the economics of income
inequality, which could use narrow occupational categories as measures of skills.
A third set of applications to the methods proposed in this paper is to construct
analogous long-lasting category systems for the industry variable in the Census and CPS.
This would make it easier to identify long run trends, such as technological change, in
particular industries.
16
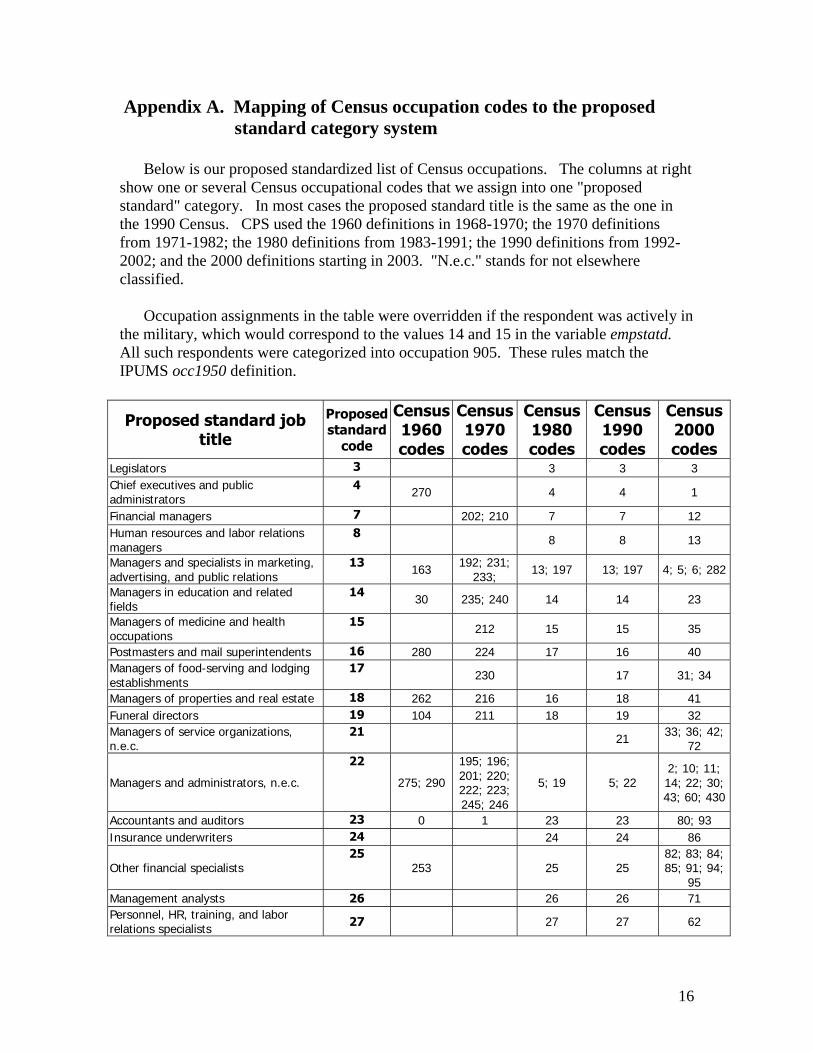
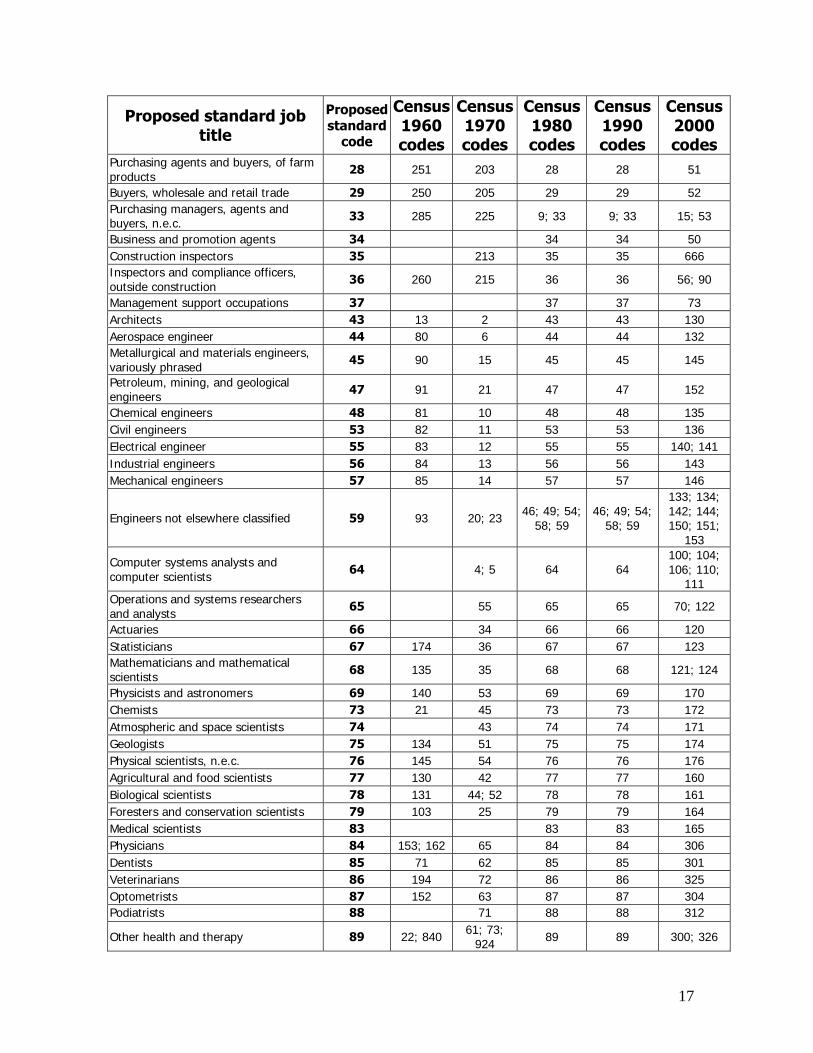
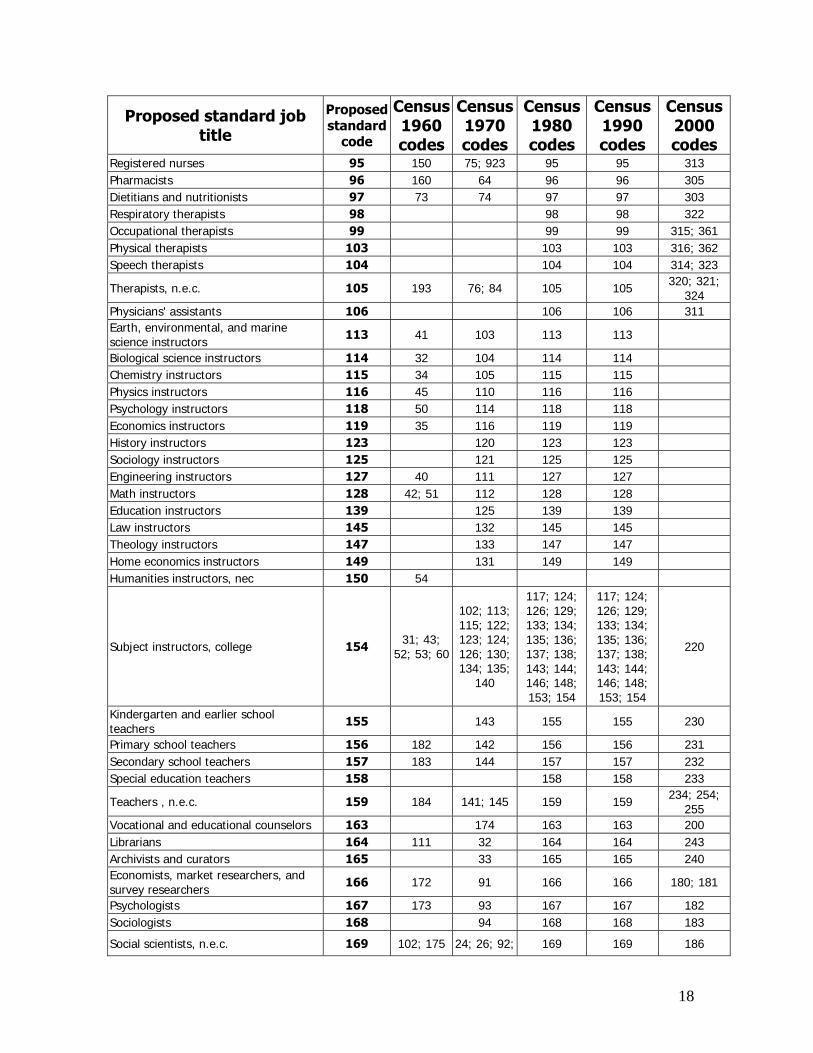
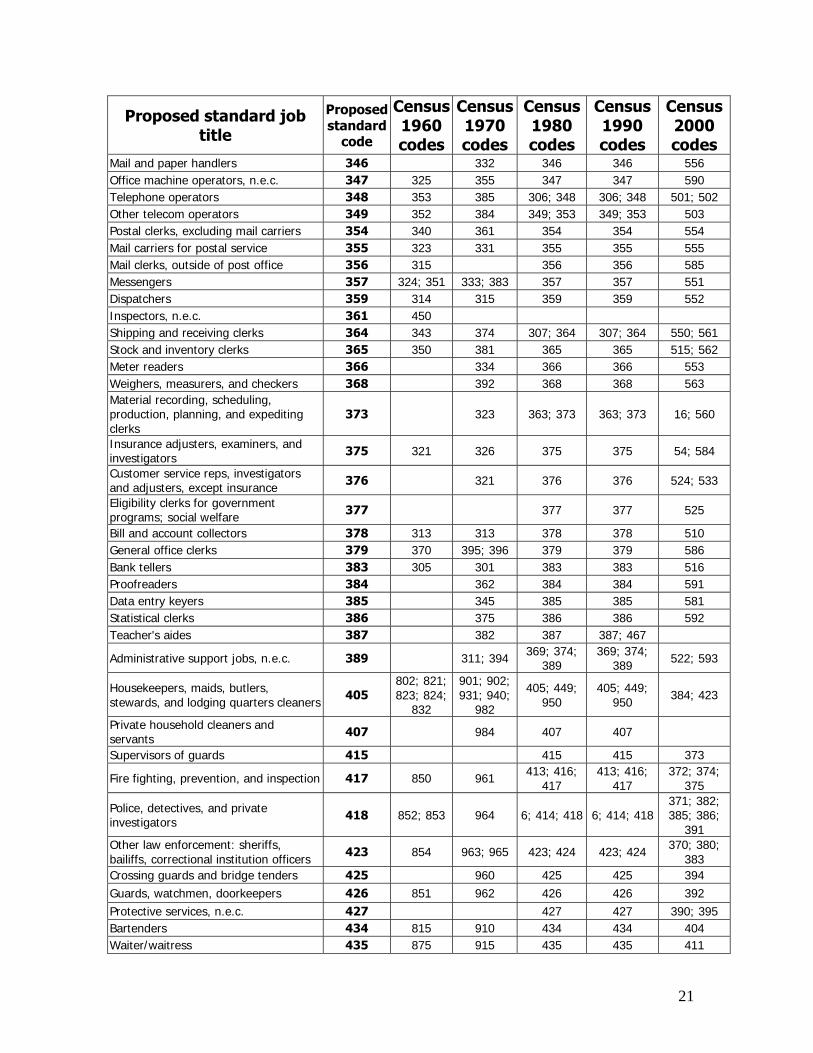
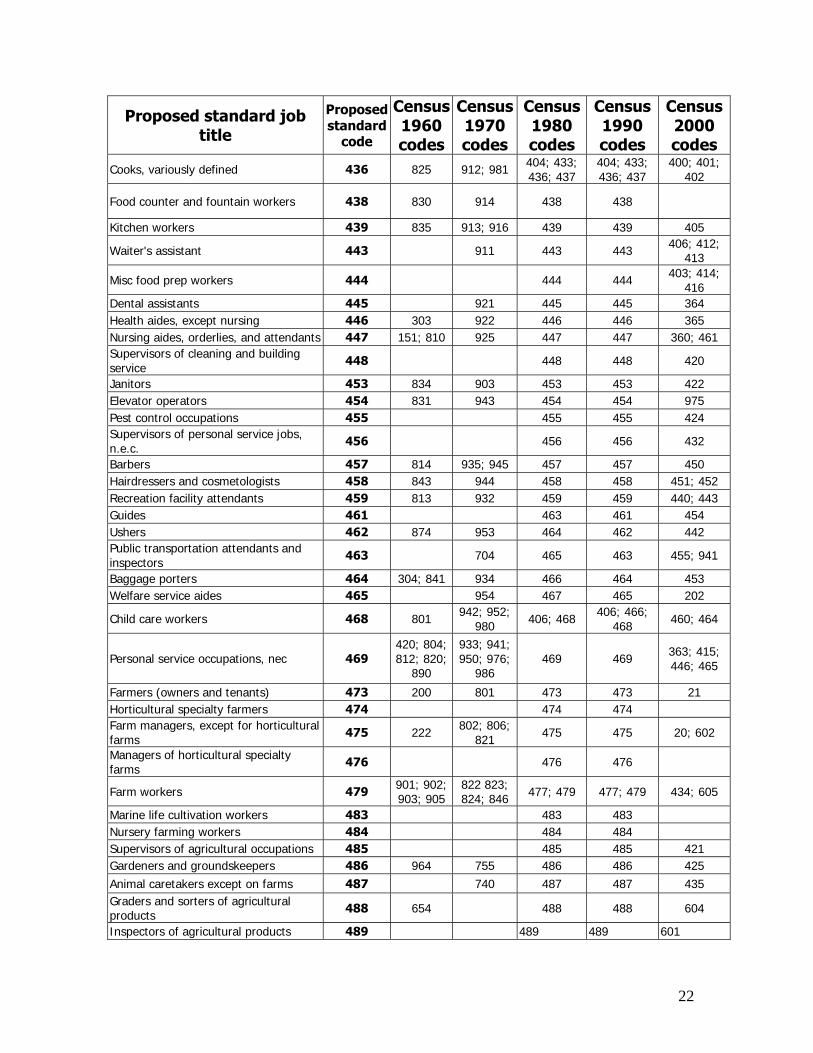
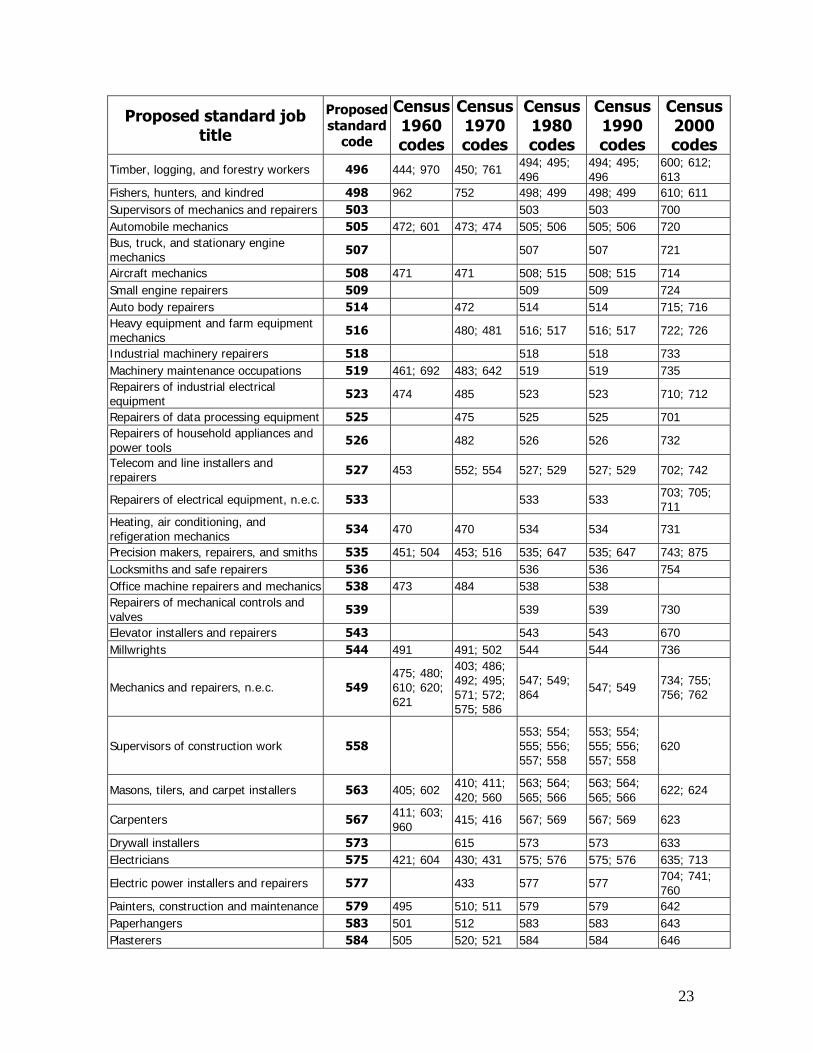
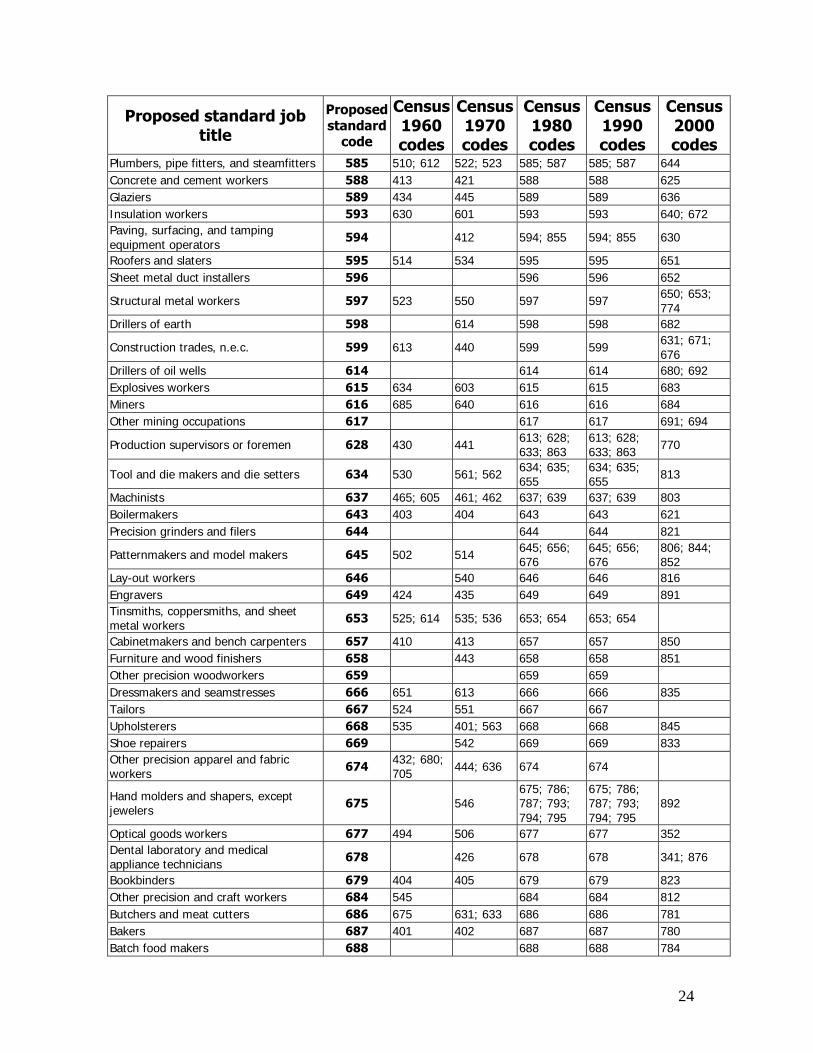
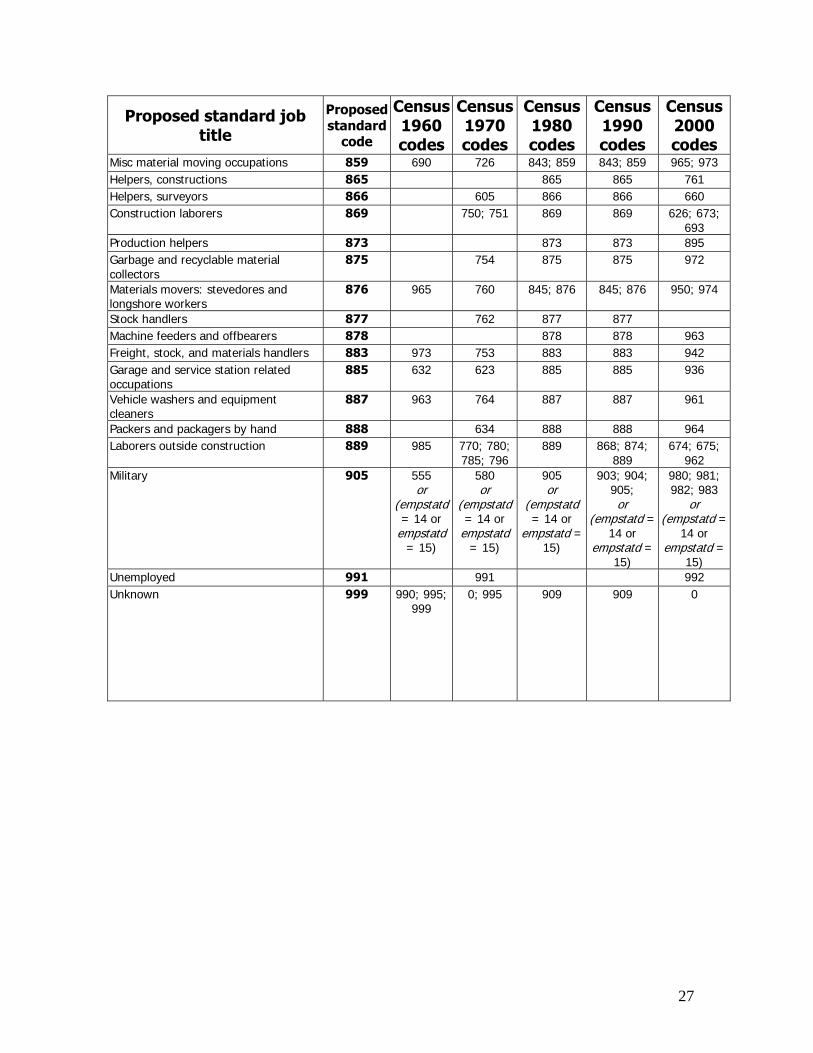
Appendix A. Mapping of Census occupation codes to the proposed standard category system
Below is our proposed standardized list of Census occupations. The columns at right
show one or several Census occupational codes that we assign into one "proposed standard" category. In most cases the proposed standard title is the same as the one in the 1990 Census. CPS used the 1960 definitions in 1968-1970; the 1970 definitions from 1971-1982; the 1980 definitions from 1983-1991; the 1990 definitions from 1992-2002; and the 2000 definitions starting in 2003. "N.e.c." stands for not elsewhere classified.
Occupation assignments in the table were overridden if the respondent was actively in
the military, which would correspond to the values 14 and 15 in the variable empstatd. All such respondents were categorized into occupation 905. These rules match the IPUMS occ1950 definition.
Proposed standard job title
Proposed standard
code
Census 1960 codes
Census 1970 codes
Census 1980 codes
Census 1990 codes
Census 2000 codes
Legislators 3 3 3 3 Chief executives and public administrators
4 270 4 4 1
Financial managers 7 202; 210 7 7 12 Human resources and labor relations managers
8 8 8 13
Managers and specialists in marketing, advertising, and public relations
13 163 192; 231; 233; 13; 197 13; 197 4; 5; 6; 282
Managers in education and related fields
14 30 235; 240 14 14 23
Managers of medicine and health occupations
15 212 15 15 35
Postmasters and mail superintendents 16 280 224 17 16 40 Managers of food-serving and lodging establishments
17 230 17 31; 34
Managers of properties and real estate 18 262 216 16 18 41 Funeral directors 19 104 211 18 19 32 Managers of service organizations, n.e.c.
21 21 33; 36; 42; 72
Managers and administrators, n.e.c.
22
275; 290
195; 196; 201; 220; 222; 223; 245; 246
5; 19 5; 22 2; 10; 11; 14; 22; 30; 43; 60; 430
Accountants and auditors 23 0 1 23 23 80; 93 Insurance underwriters 24 24 24 86
Other financial specialists 25
253 25 25 82; 83; 84; 85; 91; 94;
95 Management analysts 26 26 26 71 Personnel, HR, training, and labor relations specialists 27 27 27 62
17
Proposed standard job title
Proposed standard
code
Census 1960 codes
Census 1970 codes
Census 1980 codes
Census 1990 codes
Census 2000 codes
Purchasing agents and buyers, of farm products 28 251 203 28 28 51
Buyers, wholesale and retail trade 29 250 205 29 29 52 Purchasing managers, agents and buyers, n.e.c. 33 285 225 9; 33 9; 33 15; 53
Business and promotion agents 34 34 34 50 Construction inspectors 35 213 35 35 666 Inspectors and compliance officers, outside construction 36 260 215 36 36 56; 90
Management support occupations 37 37 37 73 Architects 43 13 2 43 43 130 Aerospace engineer 44 80 6 44 44 132 Metallurgical and materials engineers, variously phrased 45 90 15 45 45 145
Petroleum, mining, and geological engineers 47 91 21 47 47 152
Chemical engineers 48 81 10 48 48 135 Civil engineers 53 82 11 53 53 136 Electrical engineer 55 83 12 55 55 140; 141 Industrial engineers 56 84 13 56 56 143 Mechanical engineers 57 85 14 57 57 146
Engineers not elsewhere classified 59 93 20; 23 46; 49; 54; 58; 59
46; 49; 54; 58; 59
133; 134; 142; 144; 150; 151;
153
Computer systems analysts and computer scientists 64 4; 5 64 64
100; 104; 106; 110;
111 Operations and systems researchers and analysts 65 55 65 65 70; 122
Actuaries 66 34 66 66 120 Statisticians 67 174 36 67 67 123 Mathematicians and mathematical scientists 68 135 35 68 68 121; 124
Physicists and astronomers 69 140 53 69 69 170 Chemists 73 21 45 73 73 172 Atmospheric and space scientists 74 43 74 74 171 Geologists 75 134 51 75 75 174 Physical scientists, n.e.c. 76 145 54 76 76 176 Agricultural and food scientists 77 130 42 77 77 160 Biological scientists 78 131 44; 52 78 78 161 Foresters and conservation scientists 79 103 25 79 79 164 Medical scientists 83 83 83 165 Physicians 84 153; 162 65 84 84 306 Dentists 85 71 62 85 85 301 Veterinarians 86 194 72 86 86 325 Optometrists 87 152 63 87 87 304 Podiatrists 88 71 88 88 312
Other health and therapy 89 22; 840 61; 73; 924 89 89 300; 326
18
Proposed standard job title
Proposed standard
code
Census 1960 codes
Census 1970 codes
Census 1980 codes
Census 1990 codes
Census 2000 codes
Registered nurses 95 150 75; 923 95 95 313 Pharmacists 96 160 64 96 96 305 Dietitians and nutritionists 97 73 74 97 97 303 Respiratory therapists 98 98 98 322 Occupational therapists 99 99 99 315; 361 Physical therapists 103 103 103 316; 362 Speech therapists 104 104 104 314; 323
Therapists, n.e.c. 105 193 76; 84 105 105 320; 321; 324
Physicians' assistants 106 106 106 311 Earth, environmental, and marine science instructors 113 41 103 113 113
Biological science instructors 114 32 104 114 114 Chemistry instructors 115 34 105 115 115 Physics instructors 116 45 110 116 116 Psychology instructors 118 50 114 118 118 Economics instructors 119 35 116 119 119 History instructors 123 120 123 123 Sociology instructors 125 121 125 125 Engineering instructors 127 40 111 127 127 Math instructors 128 42; 51 112 128 128 Education instructors 139 125 139 139 Law instructors 145 132 145 145 Theology instructors 147 133 147 147 Home economics instructors 149 131 149 149 Humanities instructors, nec 150 54
Subject instructors, college 154 31; 43; 52; 53; 60
102; 113; 115; 122; 123; 124; 126; 130; 134; 135;
140
117; 124; 126; 129; 133; 134; 135; 136; 137; 138; 143; 144; 146; 148; 153; 154
117; 124; 126; 129; 133; 134; 135; 136; 137; 138; 143; 144; 146; 148; 153; 154
220
Kindergarten and earlier school teachers 155 143 155 155 230
Primary school teachers 156 182 142 156 156 231 Secondary school teachers 157 183 144 157 157 232 Special education teachers 158 158 158 233
Teachers , n.e.c. 159 184 141; 145 159 159 234; 254; 255
Vocational and educational counselors 163 174 163 163 200 Librarians 164 111 32 164 164 243 Archivists and curators 165 33 165 165 240 Economists, market researchers, and survey researchers 166 172 91 166 166 180; 181
Psychologists 167 173 93 167 167 182 Sociologists 168 94 168 168 183
Social scientists, n.e.c. 169 102; 175 24; 26; 92; 169 169 186

19
Proposed standard job title
Proposed standard
code
Census 1960 codes
Census 1970 codes
Census 1980 codes
Census 1990 codes
Census 2000 codes
96
Urban and regional planners 173 95 173 173 184 Social workers 174 171 100 174 174 201 Recreation workers 175 165 101 175 175 462
Clergy and religious workers 176 23; 170 86; 90 176; 177 176; 177 204; 205; 206
Lawyers 178 105 31 178 178 210 Judges 179 30 179 179 211 Writers and authors 183 20 181 183 183 285 Technical writers 184 184 184 284 Designers 185 72 183; 425 185 185 263 Musician or composer 186 120 185 186 186 275 Actors, directors, producers 187 10 175 187 187 270; 271 Art makers: painters, sculptors, craft-artists, and print-makers 188 14 190 188 188 260
Photographers 189 161 191 189 189 291 Dancers 193 70 182 193 193 274 Art/entertainment performers and related 194 101 194 194 194 276; 286
Editors and reporters 195 75 184 195 195 281; 283; 292
Announcers 198 193 198 198 280 Athletes, sports instructors, and officials 199 15; 180 180 199 199 272; 752 Professionals, n.e.c. 200 195 Clinical laboratory technologies and technicians 203 185 80 203 203 330
Dental hygienists 204 81 204 204 331 Health record tech specialists 205 82 205 205 351 Radiologic tech specialists 206 83 206 206 332 Licensed practical nurses 207 842 926 207 207 350 Health technologists and technicians, n.e.c. 208 85 208 208 340; 353;
354 Electrical and electronic (engineering) technicians 213 190 153 213 213
Engineering technicians, n.e.c. 214 154; 162 214; 216 214; 216 155; 196 Mechanical engineering technicians 215 155 215 215 Drafters 217 74 152 217 217 154 Surveyors, cartographers, mapping scientists and technicians 218 181; 642 161 63; 218;
867 63; 218;
867 131; 156
Biological technicians 223 150 223 223 190; 191 Chemical technicians 224 151 224 224 192 Other science technicians 225 191 156 225 225 193 Airplane pilots and navigators 226 12 163; 170 226 226 903 Air traffic controllers 227 164 227 227 904
Broadcast equipment operators 228 164 171 228 228 290; 296
Computer software developers 229 3 229 229 101; 102 Programmers of numerically controlled machine tools 233 172 233 233 790

20
Proposed standard job title
Proposed standard
code
Census 1960 codes
Census 1970 codes
Census 1980 codes
Census 1990 codes
Census 2000 codes
Legal assistants and paralegals 234 234 234 214; 215
Technicians, n.e.c. 235 192 165; 173 235 235 194 Sales supervisors and proprietors 243 254 243 243 470; 471 Insurance sales occupations 253 385 265 253 253 481 Real estate sales occupations 254 393 270; 363 254 254 81; 492 Financial services sales occupations 255 395 271 255 255 482 Advertising and related sales jobs 256 380 260 256 256 480 Sales engineers 258 92 22 258 258 493
Salespersons, n.e.c. 274 301; 381; 383; 394
261; 280; 281; 282; 284; 285;
296
257; 259; 263; 264; 265; 266; 267; 268; 269; 274; 284; 285
257; 259; 263; 264; 265; 266; 267; 268; 269; 274; 284; 285
474; 475; 484; 485; 494; 496
Retail sales clerks 275 283; 314 275 275 476 Cashiers 276 312 310 276 276 472; 513 Door-to-door sales, street sales, and news vendors 277 390 264; 266 277; 278 277; 278 495
Sales demonstrators / promoters / models 283 382 262 283 283 490
Office supervisors 303 312 303; 305 303; 305 500 Computer and peripheral equipment operators 308 343; 350 304; 308;
309 304; 308;
309 580
Secretaries 313 342 370; 371; 372 313 313 570
Stenographers 314 345 376 314 314 Typists 315 360 391 315 315 582; 583 Interviewers, enumerators, and surveyors 316 320 316 316 523; 531;
534 Hotel clerks 317 317 317 530 Transportation ticket and reservation agents 318 354 390 318 318 483; 541
Receptionists 319 341 364 319 319 540 Information clerks, nec 323 323; 325 323; 325 Correspondence and order clerks 326 326; 327 326; 327 521; 535 Human resources clerks, except payroll and timekeeping 328 154 56 328 328 536
Library assistants 329 302 330 329 329 244; 532 File clerks 335 320 325 335 335 526 Records clerks 336 336 336 520; 542 Bookkeepers and accounting and auditing clerks 337 310 305 337 337 512
Payroll and timekeeping clerks 338 333 360 338 338 514 Cost and rate clerks (financial records processing) 343 343 343
Billing clerks and related financial records processing 344 303; 341;
342 339; 344 339; 344 511
Duplication machine operators / office machine operators 345 344 345 345
21
Proposed standard job title
Proposed standard
code
Census 1960 codes
Census 1970 codes
Census 1980 codes
Census 1990 codes
Census 2000 codes
Mail and paper handlers 346 332 346 346 556 Office machine operators, n.e.c. 347 325 355 347 347 590 Telephone operators 348 353 385 306; 348 306; 348 501; 502 Other telecom operators 349 352 384 349; 353 349; 353 503 Postal clerks, excluding mail carriers 354 340 361 354 354 554 Mail carriers for postal service 355 323 331 355 355 555 Mail clerks, outside of post office 356 315 356 356 585 Messengers 357 324; 351 333; 383 357 357 551 Dispatchers 359 314 315 359 359 552 Inspectors, n.e.c. 361 450 Shipping and receiving clerks 364 343 374 307; 364 307; 364 550; 561 Stock and inventory clerks 365 350 381 365 365 515; 562 Meter readers 366 334 366 366 553 Weighers, measurers, and checkers 368 392 368 368 563 Material recording, scheduling, production, planning, and expediting clerks
373 323 363; 373 363; 373 16; 560
Insurance adjusters, examiners, and investigators 375 321 326 375 375 54; 584
Customer service reps, investigators and adjusters, except insurance 376 321 376 376 524; 533
Eligibility clerks for government programs; social welfare 377 377 377 525
Bill and account collectors 378 313 313 378 378 510 General office clerks 379 370 395; 396 379 379 586 Bank tellers 383 305 301 383 383 516 Proofreaders 384 362 384 384 591 Data entry keyers 385 345 385 385 581 Statistical clerks 386 375 386 386 592 Teacher's aides 387 382 387 387; 467
Administrative support jobs, n.e.c. 389 311; 394 369; 374; 389
369; 374; 389 522; 593
Housekeepers, maids, butlers, stewards, and lodging quarters cleaners 405
802; 821; 823; 824;
832
901; 902; 931; 940;
982
405; 449; 950
405; 449; 950 384; 423
Private household cleaners and servants 407 984 407 407
Supervisors of guards 415 415 415 373
Fire fighting, prevention, and inspection 417 850 961 413; 416; 417
413; 416; 417
372; 374; 375
Police, detectives, and private investigators 418 852; 853 964 6; 414; 418 6; 414; 418
371; 382; 385; 386;
391 Other law enforcement: sheriffs, bailiffs, correctional institution officers 423 854 963; 965 423; 424 423; 424 370; 380;
383 Crossing guards and bridge tenders 425 960 425 425 394 Guards, watchmen, doorkeepers 426 851 962 426 426 392 Protective services, n.e.c. 427 427 427 390; 395 Bartenders 434 815 910 434 434 404 Waiter/waitress 435 875 915 435 435 411
22
Proposed standard job title
Proposed standard
code
Census 1960 codes
Census 1970 codes
Census 1980 codes
Census 1990 codes
Census 2000 codes
Cooks, variously defined 436 825 912; 981 404; 433; 436; 437
404; 433; 436; 437
400; 401; 402
Food counter and fountain workers 438 830 914 438 438
Kitchen workers 439 835 913; 916 439 439 405
Waiter's assistant 443 911 443 443 406; 412; 413
Misc food prep workers 444 444 444 403; 414; 416
Dental assistants 445 921 445 445 364 Health aides, except nursing 446 303 922 446 446 365 Nursing aides, orderlies, and attendants 447 151; 810 925 447 447 360; 461 Supervisors of cleaning and building service 448 448 448 420
Janitors 453 834 903 453 453 422 Elevator operators 454 831 943 454 454 975 Pest control occupations 455 455 455 424 Supervisors of personal service jobs, n.e.c. 456 456 456 432
Barbers 457 814 935; 945 457 457 450 Hairdressers and cosmetologists 458 843 944 458 458 451; 452 Recreation facility attendants 459 813 932 459 459 440; 443 Guides 461 463 461 454 Ushers 462 874 953 464 462 442 Public transportation attendants and inspectors 463 704 465 463 455; 941
Baggage porters 464 304; 841 934 466 464 453 Welfare service aides 465 954 467 465 202
Child care workers 468 801 942; 952; 980 406; 468 406; 466;
468 460; 464
Personal service occupations, nec 469 420; 804; 812; 820;
890
933; 941; 950; 976;
986 469 469 363; 415;
446; 465
Farmers (owners and tenants) 473 200 801 473 473 21 Horticultural specialty farmers 474 474 474 Farm managers, except for horticultural farms 475 222 802; 806;
821 475 475 20; 602
Managers of horticultural specialty farms 476 476 476
Farm workers 479 901; 902; 903; 905
822 823; 824; 846 477; 479 477; 479 434; 605
Marine life cultivation workers 483 483 483 Nursery farming workers 484 484 484 Supervisors of agricultural occupations 485 485 485 421 Gardeners and groundskeepers 486 964 755 486 486 425 Animal caretakers except on farms 487 740 487 487 435 Graders and sorters of agricultural products 488 654 488 488 604
Inspectors of agricultural products 489 489 489 601
23
Proposed standard job title
Proposed standard
code
Census 1960 codes
Census 1970 codes
Census 1980 codes
Census 1990 codes
Census 2000 codes
Timber, logging, and forestry workers 496 444; 970 450; 761 494; 495; 496
494; 495; 496
600; 612; 613
Fishers, hunters, and kindred 498 962 752 498; 499 498; 499 610; 611 Supervisors of mechanics and repairers 503 503 503 700 Automobile mechanics 505 472; 601 473; 474 505; 506 505; 506 720 Bus, truck, and stationary engine mechanics 507 507 507 721
Aircraft mechanics 508 471 471 508; 515 508; 515 714 Small engine repairers 509 509 509 724 Auto body repairers 514 472 514 514 715; 716 Heavy equipment and farm equipment mechanics 516 480; 481 516; 517 516; 517 722; 726
Industrial machinery repairers 518 518 518 733 Machinery maintenance occupations 519 461; 692 483; 642 519 519 735 Repairers of industrial electrical equipment 523 474 485 523 523 710; 712
Repairers of data processing equipment 525 475 525 525 701 Repairers of household appliances and power tools 526 482 526 526 732
Telecom and line installers and repairers 527 453 552; 554 527; 529 527; 529 702; 742
Repairers of electrical equipment, n.e.c. 533 533 533 703; 705; 711
Heating, air conditioning, and refigeration mechanics 534 470 470 534 534 731
Precision makers, repairers, and smiths 535 451; 504 453; 516 535; 647 535; 647 743; 875 Locksmiths and safe repairers 536 536 536 754 Office machine repairers and mechanics 538 473 484 538 538 Repairers of mechanical controls and valves 539 539 539 730
Elevator installers and repairers 543 543 543 670 Millwrights 544 491 491; 502 544 544 736
Mechanics and repairers, n.e.c. 549 475; 480; 610; 620; 621
403; 486; 492; 495; 571; 572; 575; 586
547; 549; 864 547; 549 734; 755;
756; 762
Supervisors of construction work 558 553; 554; 555; 556; 557; 558
553; 554; 555; 556; 557; 558
620
Masons, tilers, and carpet installers 563 405; 602 410; 411; 420; 560
563; 564; 565; 566
563; 564; 565; 566 622; 624
Carpenters 567 411; 603; 960 415; 416 567; 569 567; 569 623
Drywall installers 573 615 573 573 633 Electricians 575 421; 604 430; 431 575; 576 575; 576 635; 713
Electric power installers and repairers 577 433 577 577 704; 741; 760
Painters, construction and maintenance 579 495 510; 511 579 579 642 Paperhangers 583 501 512 583 583 643 Plasterers 584 505 520; 521 584 584 646
24
Proposed standard job title
Proposed standard
code
Census 1960 codes
Census 1970 codes
Census 1980 codes
Census 1990 codes
Census 2000 codes
Plumbers, pipe fitters, and steamfitters 585 510; 612 522; 523 585; 587 585; 587 644 Concrete and cement workers 588 413 421 588 588 625 Glaziers 589 434 445 589 589 636 Insulation workers 593 630 601 593 593 640; 672 Paving, surfacing, and tamping equipment operators 594 412 594; 855 594; 855 630
Roofers and slaters 595 514 534 595 595 651 Sheet metal duct installers 596 596 596 652
Structural metal workers 597 523 550 597 597 650; 653; 774
Drillers of earth 598 614 598 598 682
Construction trades, n.e.c. 599 613 440 599 599 631; 671; 676
Drillers of oil wells 614 614 614 680; 692 Explosives workers 615 634 603 615 615 683 Miners 616 685 640 616 616 684 Other mining occupations 617 617 617 691; 694
Production supervisors or foremen 628 430 441 613; 628; 633; 863
613; 628; 633; 863 770
Tool and die makers and die setters 634 530 561; 562 634; 635; 655
634; 635; 655 813
Machinists 637 465; 605 461; 462 637; 639 637; 639 803 Boilermakers 643 403 404 643 643 621 Precision grinders and filers 644 644 644 821
Patternmakers and model makers 645 502 514 645; 656; 676
645; 656; 676
806; 844; 852
Lay-out workers 646 540 646 646 816 Engravers 649 424 435 649 649 891 Tinsmiths, coppersmiths, and sheet metal workers 653 525; 614 535; 536 653; 654 653; 654
Cabinetmakers and bench carpenters 657 410 413 657 657 850 Furniture and wood finishers 658 443 658 658 851 Other precision woodworkers 659 659 659 Dressmakers and seamstresses 666 651 613 666 666 835 Tailors 667 524 551 667 667 Upholsterers 668 535 401; 563 668 668 845 Shoe repairers 669 542 669 669 833 Other precision apparel and fabric workers 674 432; 680;
705 444; 636 674 674
Hand molders and shapers, except jewelers 675 546
675; 786; 787; 793; 794; 795
675; 786; 787; 793; 794; 795
892
Optical goods workers 677 494 506 677 677 352 Dental laboratory and medical appliance technicians 678 426 678 678 341; 876
Bookbinders 679 404 405 679 679 823 Other precision and craft workers 684 545 684 684 812 Butchers and meat cutters 686 675 631; 633 686 686 781 Bakers 687 401 402 687 687 780 Batch food makers 688 688 688 784

25
Proposed standard job title
Proposed standard
code
Census 1960 codes
Census 1970 codes
Census 1980 codes
Census 1990 codes
Census 2000 codes
Adjusters and calibrators 693 693 693 Water and sewage treatment plant operators 694 694 694 862
Power plant operators 695 701 525 695 695 860 Plant and system operators, stationary engineers
696 520 545 696 696 861
Other plant and system operators 699 699 699 863 Lathe, milling, and turning machine operatives
703 452 454; 652; 653
703; 704; 705
703; 704; 705
801; 802
Punching and stamping press operatives
706 656 706 706 795
Rollers, roll hands, and finishers of metal
707 513 533 707 707 794
Drilling and boring machine operators 708 650 708 708 796 Grinding, abrading, buffing, and polishing workers
709 521; 653 621; 651 709 709 800
Forge and hammer operators 713 402; 431 442 713 713 793 Fabricating machine operators, n.e.c. 717 660 717 717 Molders, and casting machine operators 719 492 503; 504 719 719 810 Metal platers 723 635 723 723 820 Heat treating equipment operators 724 435 446; 626 724 724 815 Wood lathe, routing, and planing machine operators
726 726 726 822
Sawing machine operators and sawyers 727 704 662 727 727 853 Shaping and joining machine operator (woodworking)
728 728 728
Nail and tacking machine operators (woodworking)
729 729 729 854
Other woodworking machine operators 733 733 733 855 Printing machine operators, n.e.c. 734 512; 615 423; 434;
530; 531 734; 737 734; 737 824
Photoengravers and lithographers 735 423; 503 515 735 735 Typesetters and compositors 736 414 422 736 736 825; 826 Winding and twisting textile/apparel operatives
738 672; 681 738 738 842
Knitters, loopers, and toppers textile operatives
739 673; 720 671; 673 739 739 841
Textile cutting machine operators 743 743 743 840 Textile sewing machine operators 744 663 744 744 832 Shoemaking machine operators 745 515 664 745 745 834 Pressing machine operators (clothing) 747 747 747 831 Laundry workers 748 674; 803 611; 630;
983 403; 748 403; 748 830
Misc textile machine operators 749 710 670; 674 749 749 836; 846 Cementing and gluing maching operators
753 753 753 885
Packers, fillers, and wrappers 754 693 604; 643 754 754 880 Extruding and forming machine operators
755 755; 758 755; 758 792; 843; 872
Mixing and blending machine operatives
756 652 620; 641 756 756 865

26
Proposed standard job title
Proposed standard
code
Census 1960 codes
Census 1970 codes
Census 1980 codes
Census 1990 codes
Census 2000 codes
Separating, filtering, and clarifying machine operators
757 757 757 864
Painting machine operators 759 694 644 759 759 881 Roasting and baking machine operators (food)
763 763 763 783
Washing, cleaning, and pickling machine operators
764 764 764 886
Paper folding machine operators 765 765 765 893 Furnace, kiln, and oven operators, apart from food
766 670; 672; 712
622; 666 766 766 804; 873
Crushing and grinding machine operators
768 490 501 768 768
Slicing and cutting machine operators 769 612 769 769 785; 871 Motion picture projectionists 773 493 505 773 773 441 Photographic process workers 774 695 645 774 774 883 Machine operators, n.e.c. 779 775 690; 692;
694; 695; 696
673; 714; 715; 725; 777; 779;
798
673; 714; 715; 725; 777; 779;
798
884; 890; 894; 896
Welders and metal cutters 783 721 680 783 783 814 Solderers 784 665 784 784 Assemblers of electrical equipment 785 631 602 636; 683;
785 636; 683;
785 771; 772; 773; 775
Hand painting, coating, and decorating occupations
789 543 789 789
Production checkers and inspectors 796 643 452; 610 689; 796; 797
689; 796; 797
Graders and sorters in manufacturing 799 671 624; 625 799 799 874 Supervisors of motor vehicle transportation
803 803 803; 864 900
Truck, delivery, and tractor drivers 804 650; 715; 971; 972
705; 706; 715; 763
804; 805; 806; 856
804; 805; 806; 856
751; 913; 960
Bus drivers 808 641 703 808 808 912 Taxi cab drivers and chauffeurs 809 714 714 809; 814 809; 814 911; 914;
915 Parking lot attendants 813 711 813 813 935 Railroad conductors and yardmasters 823 252; 645 226 823 823 924 Locomotive operators (engineers and firemen)
824 454; 460; 691
455; 456; 710
824; 826 824; 826 920; 926
Railroad brake, coupler, and switch operators
825 640; 713 712; 713 825 825 923
Ship crews and marine engineers 829 265; 703 221; 661; 701
497; 828; 829; 833
497; 828; 829; 833
930; 931; 933
Water transport infrastructure tenders and crossing guards
834 635; 860 834 834 934
Operating engineers of construction equipment
844 436 844 844 632
Crane, derrick, winch, and hoist operators
848 415 424 848; 849 848; 849 951; 956
Excavating and loading machine operators
853 425 853 853 952
27
Proposed standard job title
Proposed standard
code
Census 1960 codes
Census 1970 codes
Census 1980 codes
Census 1990 codes
Census 2000 codes
Misc material moving occupations 859 690 726 843; 859 843; 859 965; 973 Helpers, constructions 865 865 865 761 Helpers, surveyors 866 605 866 866 660 Construction laborers 869 750; 751 869 869 626; 673;
693 Production helpers 873 873 873 895 Garbage and recyclable material collectors
875 754 875 875 972
Materials movers: stevedores and longshore workers
876 965 760 845; 876 845; 876 950; 974
Stock handlers 877 762 877 877 Machine feeders and offbearers 878 878 878 963 Freight, stock, and materials handlers 883 973 753 883 883 942 Garage and service station related occupations
885 632 623 885 885 936
Vehicle washers and equipment cleaners
887 963 764 887 887 961
Packers and packagers by hand 888 634 888 888 964 Laborers outside construction 889 985 770; 780;
785; 796 889 868; 874;
889 674; 675;
962 Military 905 555
or (empstatd = 14 or
empstatd = 15)
580 or
(empstatd = 14 or
empstatd = 15)
905 or
(empstatd = 14 or
empstatd = 15)
903; 904; 905; or
(empstatd = 14 or
empstatd = 15)
980; 981; 982; 983
or (empstatd =
14 or empstatd =
15) Unemployed 991 991 992 Unknown 999 990; 995;
999 0; 995 909 909 0

28
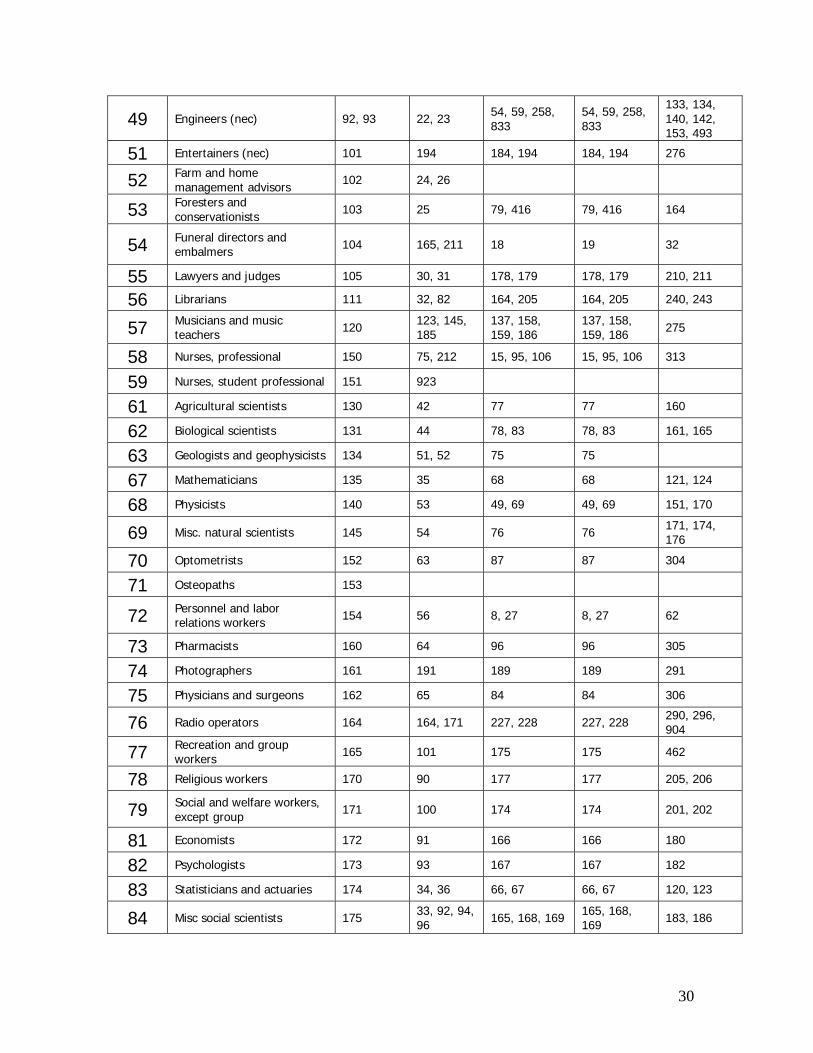
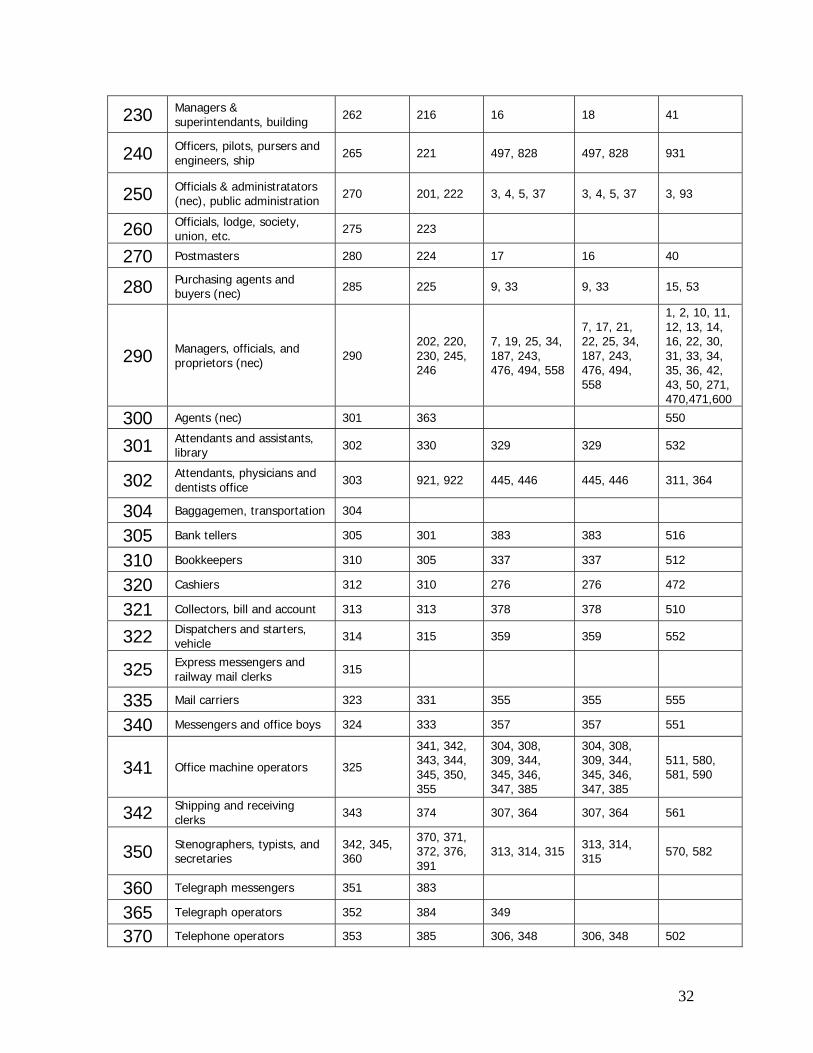
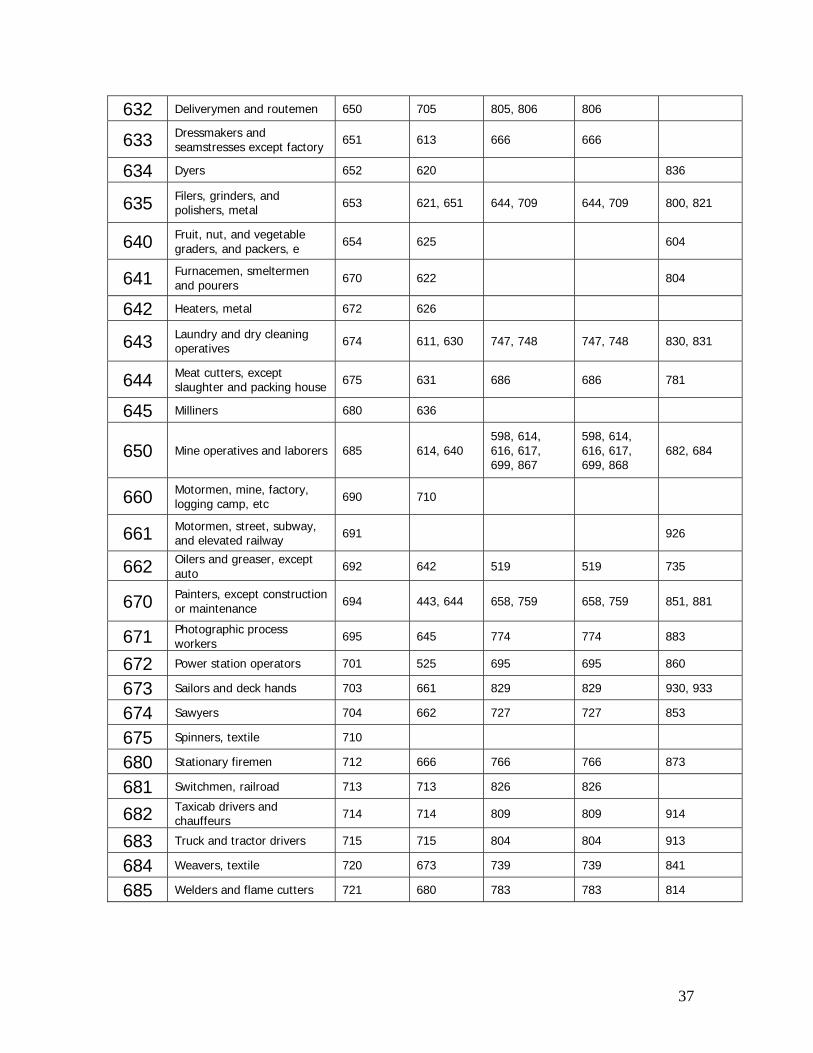
Appendix B. Mappings of Census occupation codes to the IPUMS standard occ1950
These are the 1950 Census occupation categories. IPUMS researcher Matt Sobek
mapped all later Census-defined occupation categories to these in the publicly available Census and CPS data available from www.ipums.org. Below we show how these assignments were made, based on the the IPUMS data available as of Nov 1, 2004. In the columns at right are the source categories which were assigned to the occ1950 code at the left. "N.e.c." stands for not elsewhere classified.
For 1960 and 1990, the occupation assignments implied by the table can be overridden by the empstatd variable, which has the value 14 or 15 if the respondent were actively in the military, regardless of the precise occupation. These respondents are all categorized into occupation 595.
1950 occ
Description Census 1960 occ
Census 1970 occ
Census 1980 occ
Census 1990 occ
Census 2000 occ
0 Accountants and auditors 0 1 23 23 80, 94
1 Actors and actresses 10 175 270
2 Airplane pilots and navigators 12 163 226 226 903
3 Architects 13 2 43 43 130
4 Artists and art teachers 14 190 188 188 260
5 Athletes 15 272
6 Authors 20 181 183 183 285
7 Chemists 21 45 73 73 172
8 Chiropractors 22 61 89 89 300
9 Clergymen 23 86 176 176 204
10 College presidents and deans 30 235
12 Agricultural sciences-Professors and instructors 31 102 136 136
13 Biological sciences-Professors and instructors 32 104 114 114
14 Chemistry-Professors and instructors 34 105 115 115
15 Economics-Professors and instructors 35 116 119 119
16 Engineering-Professors and instructors 40 111 127 127
17 Geology and geophysics-Professors and instructors 41

29
18 Mathematics professors and instructors 42 112 128, 129 128, 129
19 Medical science professors and instructors 43 113 133, 134 133, 134
23 Physics-Professors and instructors 45 110 116 116
24 Psychology-Professors and instructors 50 114 118 118
25 Statistics-Professors and instructors 51
26 Natural science (nec)-Professors and instructors 52 103 113 113
27 Social sciences (nec)-Professors and instructors 53 120, 121,
122 123, 124, 125, 126, 146
123, 124, 125, 126, 146
28 Nonscientific subjects-Professors and instructors 54 115 135 135
28 Nonscientific subjects-Professors and instructors 54 125 139 139
28 Nonscientific subjects-Professors and instructors 54 126 143 143
28 Nonscientific subjects-Professors and instructors 54 130 144 144
28 Nonscientific subjects-Professors and instructors 54 131, 132,
133, 134 145, 148, 149 145, 148, 149
29 Subject not specified-Professors and instructors 60 135, 140 117, 147,
153, 154 117, 147, 153, 154 220
31 Dancers and dancing teachers 70 182 193 193 274
32 Dentists 71 62 85 85 301
33 Designers 72 183 185 185 263
34 Dieticians and nutritionists 73 74 97 97 303
35 Draftsmen 74 152 217 217 154
36 Editors and reporters 75, 163 184, 192 195, 197 195, 197 281, 282, 283
41 Aeronautical-Engineers 80 6 44 44 132
42 Chemical-Engineers 81 10 48 48 135
43 Civil-Engineers 82 11 53 53 136
44 Electrical-Engineers 83 12 55 55 141
45 Industrial-Engineers 84 13 26, 56 26, 56 143
46 Mechanical-Engineers 85 14 57, 58 57, 58 146
47 Metallurgical, metallurgists-Engineers 90 15 45 45 145
48 Mining-Engineers 91 20, 21 46, 47 46 150, 152
30
49 Engineers (nec) 92, 93 22, 23 54, 59, 258, 833
54, 59, 258, 833
133, 134, 140, 142, 153, 493
51 Entertainers (nec) 101 194 184, 194 184, 194 276
52 Farm and home management advisors 102 24, 26
53 Foresters and conservationists 103 25 79, 416 79, 416 164
54 Funeral directors and embalmers 104 165, 211 18 19 32
55 Lawyers and judges 105 30, 31 178, 179 178, 179 210, 211
56 Librarians 111 32, 82 164, 205 164, 205 240, 243
57 Musicians and music teachers 120 123, 145,
185 137, 158, 159, 186
137, 158, 159, 186 275
58 Nurses, professional 150 75, 212 15, 95, 106 15, 95, 106 313
59 Nurses, student professional 151 923
61 Agricultural scientists 130 42 77 77 160
62 Biological scientists 131 44 78, 83 78, 83 161, 165
63 Geologists and geophysicists 134 51, 52 75 75
67 Mathematicians 135 35 68 68 121, 124
68 Physicists 140 53 49, 69 49, 69 151, 170
69 Misc. natural scientists 145 54 76 76 171, 174, 176
70 Optometrists 152 63 87 87 304
71 Osteopaths 153
72 Personnel and labor relations workers 154 56 8, 27 8, 27 62
73 Pharmacists 160 64 96 96 305
74 Photographers 161 191 189 189 291
75 Physicians and surgeons 162 65 84 84 306
76 Radio operators 164 164, 171 227, 228 227, 228 290, 296, 904
77 Recreation and group workers 165 101 175 175 462
78 Religious workers 170 90 177 177 205, 206
79 Social and welfare workers, except group 171 100 174 174 201, 202
81 Economists 172 91 166 166 180
82 Psychologists 173 93 167 167 182
83 Statisticians and actuaries 174 34, 36 66, 67 66, 67 120, 123
84 Misc social scientists 175 33, 92, 94, 96 165, 168, 169 165, 168,
169 183, 186

31
91 Sports instructors and officials 180 124, 180 138, 199 138
92 Surveyors 181 161 63, 218 63, 218 131, 156
93 Teachers (n.e.c.) 182, 183, 184
141, 142, 143, 144, 240
14, 155, 156, 157
14, 155, 156, 157
23, 230, 231, 232, 233, 234
94 Medical and dental-technicians 185
80, 81, 83, 84, 85, 426
203, 204, 206, 208, 678
203, 204, 206, 208, 678
314, 330, 331, 332, 340, 341, 351, 352, 353, 876
95 Testing-technicians 191, 192
43, 150, 151, 155, 156, 162, 172, 173
74, 215, 216, 223, 224, 225, 233, 235
74, 215, 216, 223, 224, 225, 233, 235
155, 190, 191, 192, 193, 194, 196
96 Technicians (nec) 190 153 213 213 244
97 Therapists and healers (nec) 193 71, 76 88, 98, 99, 103, 104, 105
88, 98, 99, 103, 104, 105
312, 315, 316, 320, 321, 322, 323, 324, 361, 362, 363
98 Veterinarians 194 72 86 86 325
99 Professional, technical & kindred workers (nec) 195
3, 4, 5, 55, 73, 95, 154, 174, 193, 195, 196, 382
64, 65, 163, 173, 198, 214, 229, 387
64, 65, 163, 173, 198, 214, 229, 387
60, 70, 71, 72, 73, 82, 83, 84, 85, 90, 91, 95, 100, 101, 102, 104, 106, 110, 111, 122, 181, 184, 200, 254, 255, 280, 284, 286, 326, 354
100 Farmers (owners and tenants) 200 801, 806 473, 474 473, 474 21
123 Farm managers 222 802 475 475 20
200 Buyers and dept heads, store 250 205, 231,
233 13, 29 13, 29 4, 5, 6, 52
201 Buyers and shippers, farm products 251 203 28 28 51
203 Conductors, railroad 252 226 823 823 924
204 Credit men 253 210
205 Floormen and floor managers, store 254
210 Inspectors, public administration 260 213, 215 36 36 56
32
230 Managers & superintendants, building 262 216 16 18 41
240 Officers, pilots, pursers and engineers, ship 265 221 497, 828 497, 828 931
250 Officials & administratators (nec), public administration 270 201, 222 3, 4, 5, 37 3, 4, 5, 37 3, 93
260 Officials, lodge, society, union, etc. 275 223
270 Postmasters 280 224 17 16 40
280 Purchasing agents and buyers (nec) 285 225 9, 33 9, 33 15, 53
290 Managers, officials, and proprietors (nec) 290
202, 220, 230, 245, 246
7, 19, 25, 34, 187, 243, 476, 494, 558
7, 17, 21, 22, 25, 34, 187, 243, 476, 494, 558
1, 2, 10, 11, 12, 13, 14, 16, 22, 30, 31, 33, 34, 35, 36, 42, 43, 50, 271, 470,471,600
300 Agents (nec) 301 363 550
301 Attendants and assistants, library 302 330 329 329 532
302 Attendants, physicians and dentists office 303 921, 922 445, 446 445, 446 311, 364
304 Baggagemen, transportation 304
305 Bank tellers 305 301 383 383 516
310 Bookkeepers 310 305 337 337 512
320 Cashiers 312 310 276 276 472
321 Collectors, bill and account 313 313 378 378 510
322 Dispatchers and starters, vehicle 314 315 359 359 552
325 Express messengers and railway mail clerks 315
335 Mail carriers 323 331 355 355 555
340 Messengers and office boys 324 333 357 357 551
341 Office machine operators 325
341, 342, 343, 344, 345, 350, 355
304, 308, 309, 344, 345, 346, 347, 385
304, 308, 309, 344, 345, 346, 347, 385
511, 580, 581, 590
342 Shipping and receiving clerks 343 374 307, 364 307, 364 561
350 Stenographers, typists, and secretaries
342, 345, 360
370, 371, 372, 376, 391
313, 314, 315 313, 314, 315 570, 582
360 Telegraph messengers 351 383
365 Telegraph operators 352 384 349
370 Telephone operators 353 385 306, 348 306, 348 502

33
380 Ticket, station, and express agents 354 390 318 318 541
390 Clerical and kindred workers (n.e.c.)
320, 333, 340, 341, 350, 370
303, 311, 312, 314, 320, 321, 323, 325, 332, 334, 360, 361, 362, 364, 375, 381, 392, 394, 395, 396
234, 275, 303, 305, 316, 317, 319, 323, 325, 326, 327, 328, 335, 336, 338, 339, 343, 353, 354, 356, 363, 365, 366, 368, 369, 373, 374, 376, 377, 379, 384, 386, 389
234, 275, 303, 305, 316, 317, 319, 323, 325, 326, 327, 328, 335, 336, 338, 339, 343, 353, 354, 356, 363, 365, 366, 368, 373, 374, 376, 377, 379, 384, 386, 389
214, 215, 365, 500, 501, 503, 513, 514, 515, 520, 521, 522, 523, 524, 252, 256, 530, 531, 533, 534, 535, 536, 540, 542, 553, 554, 556, 560, 562, 563, 584, 585, 586, 591, 592, 593
400 Advertising agents and salesmen 380 260 256 256 480
410 Auctioneers 381 261 284 284
420 Demonstrators 382 262 283 283 490
430 Hucksters and peddlers 383 264 277 277 495
450 Insurance agents and brokers 321, 385 265, 326 24, 253, 375 24, 253, 375 54, 86, 481
460 Newsboys 390 266 278 278
470 Real estate agents and brokers 393 270 254 254 81, 492
480 Stock and bond salesmen 395 271 255 255 482
490 Salesmen and sales clerks (nec) 394
281, 282, 283, 284, 285, 296
257, 259, 263, 264, 265, 266, 267, 268, 269, 274, 285
257, 259, 263, 264, 265, 266, 267, 268, 269, 274, 285
474, 475, 476, 484, 485, 494, 496
500 Bakers 401 402 687, 763 687, 763 780, 783
501 Blacksmiths 402 401, 403
502 Bookbinders 404 405 679 679 823
503 Boilermakers 403 404 643 643 621
504 Brickmasons,stonemasons, and tile setters 405 410, 560 553, 563, 565 553, 563,
565 622
505 Cabinetmakers 410 413 657 657 850
510 Carpenters 411 415 554, 567 554, 567 623
511 Cement and concrete finishers 413 421 588 588 625
512 Compositors and typesetters 414 422 736 736 824

34
513 Cranemen, derrickmen, and hoistmen 415 424 848, 849 848, 849 951, 956
514 Decorators and window dressers 420 425
515 Electricians 421 430 555, 575 555, 575 635
520 Electrotypers and stereotypers 423 434
521 Engravers, except photoengravers 424 435 649 649 891
522 Excavating, grading, and road machinery operators 425 412, 436 594, 814,
844, 853, 855
594, 814, 844, 853, 855
630, 631, 952
523 Foremen (nec) 430 441 485, 503, 613, 633, 803, 843, 863
485, 503, 613, 628, 803, 843, 864
620, 700, 770, 900
524 Forgemen and hammermen 431 442 713 713 793
525 Furriers 432 444 674 674
530 Glaziers 434 445 589 589 636
531 Heat treaters, annealers, temperers 435 446 724 724 815
532 Inspectors, scalers, and graders log and lumber 444 450
533 Inspectors (nec) 450 452 35, 489 35, 489 601, 666, 941
534 Jewelers, watchmakers, goldsmiths, and silversmiths 451 453 535, 647 535, 647 875
535 Job setters, metal 452 454 703 703
540 Linemen and servicemen, telegraph, telephone, & p 453 433, 552,
554 527, 529, 577 527, 529, 577 741, 742
541 Locomotive engineers 454 455 824 824 920
542 Locomotive firemen 460 456
543 Loom fixers 461 483
544 Machinists 465 461 637 637 803
545 Airplane-mechanics and repairmen 471 170, 471 508, 515 508, 515 703, 714
550 Automobile-mechanics and repairmen 472 472, 473 505, 507, 514 505, 507,
514 715, 716, 720, 721
551 Office machine-mechanics and repairmen 473 475, 484 525, 538 525, 538 701
552 Radio and television-mechanics and repairmen 474 485 523 523 702

35
553 Railroad and car shop-mechanics and repairmen 475 486 722
554 Mechanics and repairmen, nec 470, 480
470, 480, 481, 482, 492, 495
509, 516, 517, 518, 526, 533, 534, 536, 539, 543, 547, 549
509, 516, 517, 518, 526, 533, 534, 536, 539, 543, 547, 549
670, 704, 705, 710, 711, 712, 713, 724, 726, 730, 731, 732, 733, 734, 743, 751, 752, 754, 760, 762
555 Millers, grain, flour, feed, etc 490 501
560 Millwrights 491 502 544 544 736
561 Molders, metal 492 503 675 675
562 Motion picture projectionists 493 505 773 773 441
563 Opticians and lens grinders and polishers 494 506 677 677
564 Painters, construction and maintenance 495 510, 512,
543 556, 579, 583, 789
556, 579, 583, 789 642
565 Paperhangers 501 643
570 Pattern and model makers, except paper 502 514 645, 656, 676 645, 656,
676 806
571 Photoengravers & lithographers 503 515 735 735
572 Piano and organ tuners and repairmen 504 516
573 Plasterers 505 520 584 584 646
574 Plumbers and pipe fitters 510 522 557, 585 557, 585 644
575 Pressmen and plate printers, printing 512 530 734 734
580 Rollers and roll hands, metal 513 533 707 707 794
581 Roofers and slaters 514 534 595 595 651
582 Shoemakers and repairers, except factory 515 420, 542 566, 669 566, 669 833
583 Stationary engineers 520 545 694, 696 694, 696 861, 862
584 Stone cutters and stone carvers 521 546
585 Structural metal workers 523 540, 550 597, 646 597, 646 653, 774, 816
590 Tailors and tailoresses 524 551 667 667 835
591 Tinsmiths, coppersmiths, and sheet metal workers 525 535 596, 653 596, 653 652

36
592 Tool makers, and die makers and setters 530 561 634 634 813
593 Upholsterers 535 563 668 668 845
594 Craftsmen and kindred workers (nec) 545 575, 586
624, 632, 755, 756, 852, 855
595 Members of the armed services
555 or (empstatd = 14 or empstatd = 15)
580 or (empstatd = 14 or empstatd = 15)
905 or (empstatd = 14 or empstatd = 15)
903; 904;905; or (empstatd = 14 or empstatd = 15)
980, 981, 982, 983 or (empstatd = 14 or empstatd = 15)
600 Auto mechanics apprentice 601 474 506 506
601 Bricklayers and masons apprentice 602 411 564 564
602 Carpenters apprentice 603 416 569 569
603 Electricians apprentice 604 431 576 576
604 Machinists and toolmakers apprentice 605 462, 562 635, 639 635, 639
605 Mechanics, except auto apprentice 610 491
610 Plumbers and pipe fitters apprentice 612 523 587 587
611 Apprentices, building trades (nec) 613 511, 521
612 Apprentices, metalworking trades (nec) 614 504, 536 654 654
613 Apprentices, printing trades 615 423, 531
614 Apprentices, other specified trades 620 571, 945 659 659
615 Apprentices, trade not specified 621 572
620 Asbestos and insulation workers 630 601 593 593 640
621 Attendants, auto service and parking 632 623, 711 813, 885 813, 885 935, 936
622 Blasters and powdermen 634 603 615 615 683
623 Boatmen, canalmen, and lock keepers 635 701
624 Brakemen, railroad 640 712 825 825 923
625 Bus drivers 641 703 808 808 912
630 Chainmen, rodmen, and axmen, surveying 642 605 866 867
631 Conductors, bus & street railway 645 704
37
632 Deliverymen and routemen 650 705 805, 806 806
633 Dressmakers and seamstresses except factory 651 613 666 666
634 Dyers 652 620 836
635 Filers, grinders, and polishers, metal 653 621, 651 644, 709 644, 709 800, 821
640 Fruit, nut, and vegetable graders, and packers, e 654 625 604
641 Furnacemen, smeltermen and pourers 670 622 804
642 Heaters, metal 672 626
643 Laundry and dry cleaning operatives 674 611, 630 747, 748 747, 748 830, 831
644 Meat cutters, except slaughter and packing house 675 631 686 686 781
645 Milliners 680 636
650 Mine operatives and laborers 685 614, 640 598, 614, 616, 617, 699, 867
598, 614, 616, 617, 699, 868
682, 684
660 Motormen, mine, factory, logging camp, etc 690 710
661 Motormen, street, subway, and elevated railway 691 926
662 Oilers and greaser, except auto 692 642 519 519 735
670 Painters, except construction or maintenance 694 443, 644 658, 759 658, 759 851, 881
671 Photographic process workers 695 645 774 774 883
672 Power station operators 701 525 695 695 860
673 Sailors and deck hands 703 661 829 829 930, 933
674 Sawyers 704 662 727 727 853
675 Spinners, textile 710
680 Stationary firemen 712 666 766 766 873
681 Switchmen, railroad 713 713 826 826
682 Taxicab drivers and chauffeurs 714 714 809 809 914
683 Truck and tractor drivers 715 715 804 804 913
684 Weavers, textile 720 673 739 739 841
685 Welders and flame cutters 721 680 783 783 814

38
690 Operative and kindred workers (nec)
631, 643, 671, 673, 693, 705, 775
440, 602, 604, 610, 612, 615, 624, 633, 634, 635, 641, 643, 650, 652, 653, 656, 660, 663, 664, 665, 670, 671, 672, 674, 681, 690, 692, 694, 695, 696, 706, 726, 740
455, 487, 573, 636, 673, 683, 684, 688, 689, 693, 704, 705, 706, 708, 714, 715, 717, 719, 723, 725, 726, 728, 729, 733, 737, 738, 743, 744, 745, 749, 753, 754, 755, 756, 757, 758, 764, 765, 768, 769, 777, 779, 784, 785, 786, 787, 793, 794, 795, 796, 797, 798, 799, 856, 864, 873
455, 487, 573, 636, 683, 684, 688, 689, 693, 704, 705, 706, 708, 714, 715, 717, 719, 723, 725, 726, 728, 729, 733, 737, 738, 743, 744, 745, 749, 753, 754, 755, 756, 757, 758, 764, 765, 768, 769, 777, 779, 784, 785, 786, 787, 793, 795, 796, 796, 797, 798, 799, 856, 865, 874, 888
292, 424, 434, 435, 633, 650, 671, 672, 673, 674, 675, 676, 680, 691, 692, 693, 694, 761, 771, 772, 773, 775, 784, 785, 790, 792, 795, 796, 801, 802, 810, 812, 820, 822, 825, 826, 832, 834, 840, 842, 843, 844, 846, 854, 863, 864, 865, 871, 872, 874, 880, 884, 885, 886, 890, 892, 893, 894, 895, 896, 911, 915, 942, 960, 964, 973
700 Housekeepers, private household 802 982 405 405
710 Laundresses, private household 803 983 403 403
720 Private household workers (nec) 801, 804 980, 981,
984, 986 404, 406, 407 404, 406, 407 423
730 Attendants, hospital and other institution 810 925 447 447 360
731 Attendants, professional and personal service (nec) 812 933, 942,
952 463, 468, 469 461, 466, 467, 468, 469
454, 455, 460, 465
732 Attendants, recreation and amusement 813 932 427, 456, 459 427, 456,
459 443
740 Barbers, beauticians, and manicurists 814, 843 935, 944 457, 458 457, 458 450, 451
750 Bartenders 815 910 434 434 404
751 Bootblacks 820 941
752 Boarding and lodging house keepers 821 940
753 Charwomen and cleaners 824 902 449 449
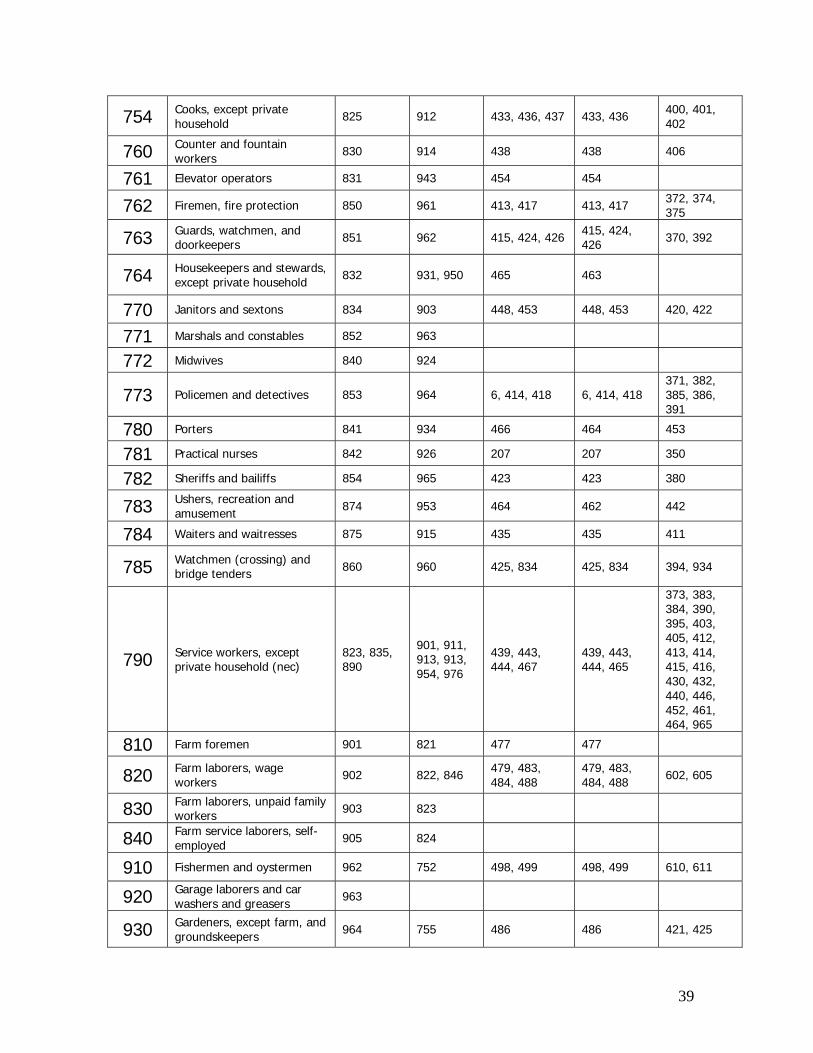
39
754 Cooks, except private household 825 912 433, 436, 437 433, 436 400, 401,
402
760 Counter and fountain workers 830 914 438 438 406
761 Elevator operators 831 943 454 454
762 Firemen, fire protection 850 961 413, 417 413, 417 372, 374, 375
763 Guards, watchmen, and doorkeepers 851 962 415, 424, 426 415, 424,
426 370, 392
764 Housekeepers and stewards, except private household 832 931, 950 465 463
770 Janitors and sextons 834 903 448, 453 448, 453 420, 422
771 Marshals and constables 852 963
772 Midwives 840 924
773 Policemen and detectives 853 964 6, 414, 418 6, 414, 418 371, 382, 385, 386, 391
780 Porters 841 934 466 464 453
781 Practical nurses 842 926 207 207 350
782 Sheriffs and bailiffs 854 965 423 423 380
783 Ushers, recreation and amusement 874 953 464 462 442
784 Waiters and waitresses 875 915 435 435 411
785 Watchmen (crossing) and bridge tenders 860 960 425, 834 425, 834 394, 934
790 Service workers, except private household (nec)
823, 835, 890
901, 911, 913, 913, 954, 976
439, 443, 444, 467
439, 443, 444, 465
373, 383, 384, 390, 395, 403, 405, 412, 413, 414, 415, 416, 430, 432, 440, 446, 452, 461, 464, 965
810 Farm foremen 901 821 477 477
820 Farm laborers, wage workers 902 822, 846 479, 483,
484, 488 479, 483, 484, 488 602, 605
830 Farm laborers, unpaid family workers 903 823
840 Farm service laborers, self-employed 905 824
910 Fishermen and oystermen 962 752 498, 499 498, 499 610, 611
920 Garage laborers and car washers and greasers 963
930 Gardeners, except farm, and groundskeepers 964 755 486 486 421, 425
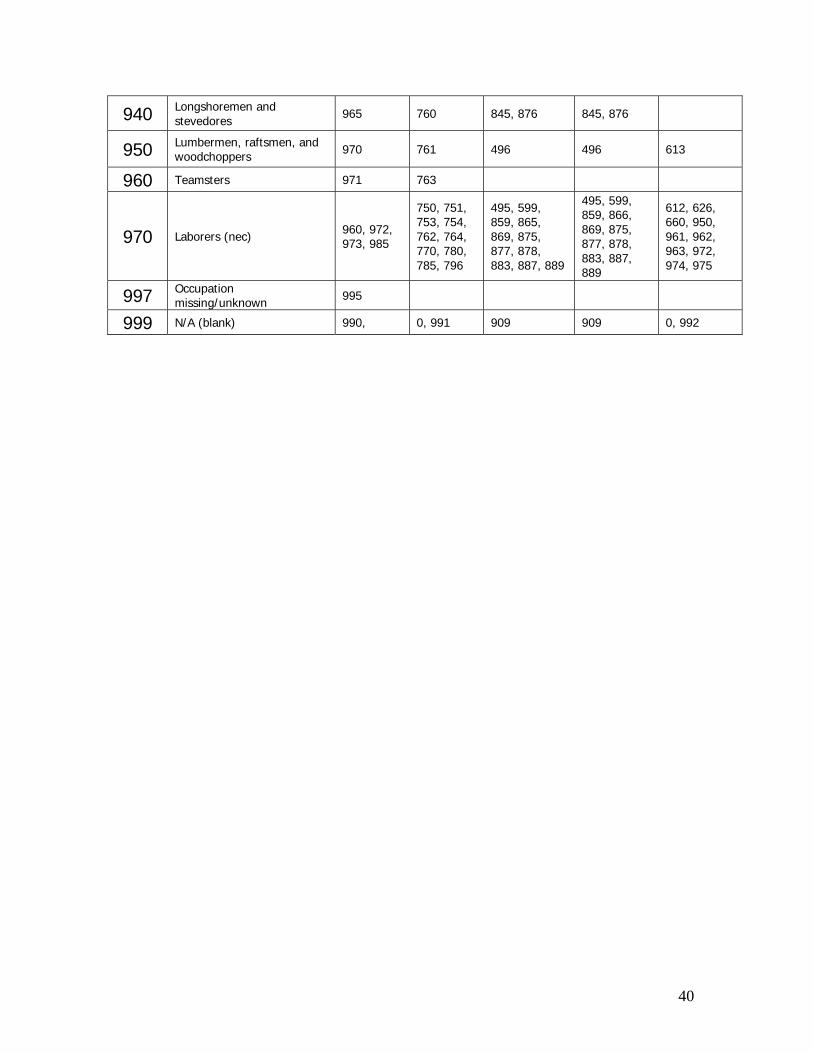
40
940 Longshoremen and stevedores 965 760 845, 876 845, 876
950 Lumbermen, raftsmen, and woodchoppers 970 761 496 496 613
960 Teamsters 971 763
970 Laborers (nec) 960, 972, 973, 985
750, 751, 753, 754, 762, 764, 770, 780, 785, 796
495, 599, 859, 865, 869, 875, 877, 878, 883, 887, 889
495, 599, 859, 866, 869, 875, 877, 878, 883, 887, 889
612, 626, 660, 950, 961, 962, 963, 972, 974, 975
997 Occupation missing/unknown 995
999 N/A (blank) 990, 0, 991 909 909 0, 992

41
Appendix C. Attributes of occupations
These attributes have been measured or imputed by researchers or by the Department of Labor’s Employment and Training Administration’s Dictionary of Occupational Titles (DOT) in 1991.
For the occupations where many DOT occupations map to just one in the standard
system, an average of the values of the relevant DOT occupations is shown. Also, an average length of special vocational training can be imputed for research purposes. Consult the sources in appendix E or the authors for the source data. The cells are blank in cases when there is no direct match between the proposed categories and the DOT data.
Reas stands for Reasoning Development, (1-6) from the DOT. Math stands for Mathematical Development, (1-6) from the DOT. Lang stands for Language Use, (1-6) from the DOT. SVP stands for Specialized Vocational Training (1-9), measured by the following
definition, taken from the DOT, volume 2, page 1009: Level Time
1 Short demonstration only 2 More than short demonstration, up to one month 3 More than one month, up to three months 4 More than three months, up to six months 5 More than six months, up to twelve months 6 1-2 years 7 2-4 years 8 4-10 years 9 More than 10 years
Str stands for use of physical Strength (1-5), from the DOT, coded from the categories Sedentary Work (1), Light Work (2), Medium Work (3), Heavy Work (4), to Very Heavy Work (5).
Care stands for care work, as coded by England, Budig, and Folbre (2002), by 0 or 1. The criterion for this indicator is whether the job involves face to face attention to other people in a way that improves the recipient’s capabilities.
Proposed standard job title Proposed standard
code Reason Math Lang SVP Str Care
Legislators 3 0
Chief executives and public administrators 4 5.00 4.00 5.00 8.00 1.00 0
Financial managers 7 4.88 4.63 4.63 8.25 1.13 0
Human resources and labor relations managers 8 5.00 4.00 4.83 7.33 1.33 0
Managers and specialists in marketing, advertising, and public relations 13 4.95 3.55 4.45 7.50 1.41 0
Managers in education and related fields 14 5.09 3.55 4.94 8.00 1.18 0

42
Proposed standard job title Proposed standard
code Reason Math Lang SVP Str Care
Managers of medicine and health occupations 15 5.22 4.33 5.11 7.89 1.33 0
Postmasters and mail superintendents 16 4.50 3.50 4.00 7.50 1.00 0
Managers of food-serving and lodging establishments 17 4.38 3.88 3.88 6.88 1.94 0
Managers of properties and real estate 18 4.53 3.89 4.32 7.21 1.79 0
Funeral directors 19 4.00 4.00 4.00 7.00 2.00 0
Managers of service organizations, n.e.c. 21 4.48 3.61 4.16 6.97 1.68 0
Managers and administrators, n.e.c. 22 4.82 4.08 4.44 7.68 1.39 0
Accountants and auditors 23 5.00 4.92 5.00 7.62 1.15 0
Insurance underwriters 24 5.00 4.00 5.00 7.00 1.00 0
Other financial specialists 25 4.84 3.95 4.47 7.26 1.11 0
Management analysts 26 4.60 3.80 4.10 7.40 1.10 0
Personnel, HR, training, and labor relations specialists 27 4.72 3.56 4.40 6.84 1.40 0
Purchasing agents and buyers, of farm products 28 4.80 3.60 4.40 7.20 1.60 0
Buyers, wholesale and retail trade 29 4.00 3.00 3.50 6.00 2.00 0
Purchasing managers, agents and buyers, n.e.c. 33 4.58 3.83 4.42 7.17 1.42 0
Business and promotion agents 34 4.44 3.67 4.33 6.67 1.33 0
Construction inspectors 35 4.30 3.60 3.70 6.60 2.00 0
Inspectors and compliance officers, outside construction 36 4.39 3.44 4.17 6.58 1.88 0
Management support occupations 37 4.63 3.37 4.37 7.32 1.16 0
Architects 43 5.33 5.33 5.33 7.33 1.67 0
Aerospace engineer 44 5.56 5.44 5.56 8.11 1.67 0
Metallurgical and materials engineers 45 5.18 5.09 5.09 7.82 1.91 0
Petroleum, mining, and geological engineers 47 5.60 5.60 5.60 8.40 1.20 0
Chemical engineers 48 5.50 5.50 5.33 8.00 1.67 0
Civil engineers 53 5.08 5.08 4.85 7.92 1.85 0
Electrical engineer 55 5.13 5.13 5.13 7.93 1.67 0
Industrial engineers 56 5.22 5.04 5.04 7.74 1.57 0
Mechanical engineers 57 5.00 4.93 4.86 7.64 1.57 0
Engineers not elsewhere classified 59 5.33 5.06 4.97 7.94 1.78 0
Computer systems analysts and computer scientists 64 4.62 3.85 4.62 7.08 1.38 0
Operations and systems researchers and analysts 65 6.00 6.00 6.00 7.00 1.00 0

43
Proposed standard job title Proposed standard
code Reason Math Lang SVP Str Care
Actuaries 66 5.00 5.00 5.00 8.00 1.00 0
Statisticians 67 5.33 5.33 5.00 7.67 1.00 0
Mathematicians and mathematical scientists 68 5.33 5.33 5.33 7.67 1.67 0
Physicists and astronomers 69 6.00 5.83 5.83 8.00 1.67 0
Chemists 73 5.40 5.00 4.80 7.20 2.20 0
Atmospheric and space scientists 74 5.00 5.00 5.00 7.00 2.00 0
Geologists 75 6.00 5.85 5.69 8.00 2.00 0
Physical scientists, n.e.c. 76 6.00 6.00 5.75 7.25 1.75 0
Agricultural and food scientists 77 6.00 5.91 5.82 7.91 2.18 0
Biological scientists 78 6.00 6.00 5.87 8.00 1.93 0
Foresters and conservation scientists 79 5.33 4.89 5.11 7.44 2.11 0
Medical scientists 83 6.00 5.83 6.00 8.00 1.83 0
Physicians 84 6.00 5.00 6.00 8.21 2.08 1
Dentists 85 6.00 5.00 5.00 8.00 1.90 1
Veterinarians 86 5.29 4.21 4.93 7.86 2.36 0
Optometrists 87 5.00 4.00 5.00 7.00 2.00 1
Podiatrists 88 5.00 4.00 5.00 7.00 2.00 1
Other health and therapy 89 4.80 3.60 4.60 6.60 2.20 1
Registered nurses 95 5.00 4.12 4.88 7.18 2.24 1
Pharmacists 96 5.67 5.33 5.33 7.33 2.00 0
Dietitians and nutritionists 97 5.14 4.14 5.00 7.71 1.86 0
Respiratory therapists 98 4.00 3.00 3.00 6.00 3.00 1
Occupational therapists 99 5.00 4.50 5.00 7.00 2.50 1
Physical therapists 103 4.00 2.75 3.75 6.75 2.50 1
Speech therapists 104 5.00 4.67 5.00 7.33 2.00 1
Therapists, n.e.c. 105 4.89 3.78 4.89 7.00 2.00 1
Physicians' assistants 106 5.00 4.00 5.00 7.00 2.00 1
Earth, environmental, and marine science instructors 113 1
Biological science instructors 114 1
Chemistry instructors 115 1
Physics instructors 116 1
Psychology instructors 118 1
Economics instructors 119 1
History instructors 123 1
Sociology instructors 125 1
Engineering instructors 127 1
Math instructors 128 1
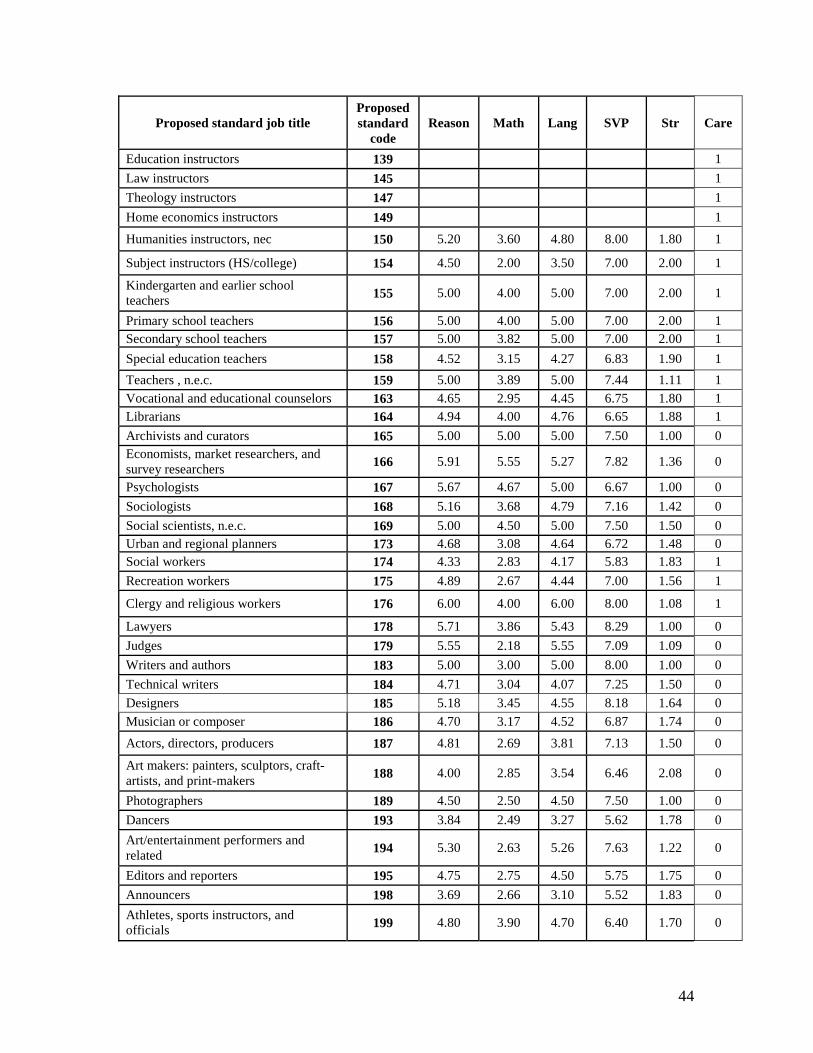
44
Proposed standard job title Proposed standard
code Reason Math Lang SVP Str Care
Education instructors 139 1
Law instructors 145 1
Theology instructors 147 1
Home economics instructors 149 1
Humanities instructors, nec 150 5.20 3.60 4.80 8.00 1.80 1
Subject instructors (HS/college) 154 4.50 2.00 3.50 7.00 2.00 1
Kindergarten and earlier school teachers 155 5.00 4.00 5.00 7.00 2.00 1
Primary school teachers 156 5.00 4.00 5.00 7.00 2.00 1 Secondary school teachers 157 5.00 3.82 5.00 7.00 2.00 1
Special education teachers 158 4.52 3.15 4.27 6.83 1.90 1
Teachers , n.e.c. 159 5.00 3.89 5.00 7.44 1.11 1 Vocational and educational counselors 163 4.65 2.95 4.45 6.75 1.80 1 Librarians 164 4.94 4.00 4.76 6.65 1.88 1
Archivists and curators 165 5.00 5.00 5.00 7.50 1.00 0 Economists, market researchers, and survey researchers 166 5.91 5.55 5.27 7.82 1.36 0
Psychologists 167 5.67 4.67 5.00 6.67 1.00 0
Sociologists 168 5.16 3.68 4.79 7.16 1.42 0
Social scientists, n.e.c. 169 5.00 4.50 5.00 7.50 1.50 0 Urban and regional planners 173 4.68 3.08 4.64 6.72 1.48 0 Social workers 174 4.33 2.83 4.17 5.83 1.83 1
Recreation workers 175 4.89 2.67 4.44 7.00 1.56 1
Clergy and religious workers 176 6.00 4.00 6.00 8.00 1.08 1
Lawyers 178 5.71 3.86 5.43 8.29 1.00 0
Judges 179 5.55 2.18 5.55 7.09 1.09 0
Writers and authors 183 5.00 3.00 5.00 8.00 1.00 0
Technical writers 184 4.71 3.04 4.07 7.25 1.50 0
Designers 185 5.18 3.45 4.55 8.18 1.64 0
Musician or composer 186 4.70 3.17 4.52 6.87 1.74 0
Actors, directors, producers 187 4.81 2.69 3.81 7.13 1.50 0
Art makers: painters, sculptors, craft-artists, and print-makers 188 4.00 2.85 3.54 6.46 2.08 0
Photographers 189 4.50 2.50 4.50 7.50 1.00 0
Dancers 193 3.84 2.49 3.27 5.62 1.78 0
Art/entertainment performers and related 194 5.30 2.63 5.26 7.63 1.22 0
Editors and reporters 195 4.75 2.75 4.50 5.75 1.75 0
Announcers 198 3.69 2.66 3.10 5.52 1.83 0
Athletes, sports instructors, and officials 199 4.80 3.90 4.70 6.40 1.70 0

45
Proposed standard job title Proposed standard
code Reason Math Lang SVP Str Care
Professionals, n.e.c. 200 4.00 3.00 4.00 6.00 2.00 0
Clinical laboratory technologies and technicians 203 4.50 3.50 4.50 6.50 1.50 0
Dental hygienists 204 5.00 4.00 5.00 7.33 2.44 1
Health record tech specialists 205 3.67 2.67 3.67 5.33 3.00 0
Radiologic tech specialists 206 4.14 3.58 3.89 6.25 2.17 0
Licensed practical nurses 207 4.40 4.40 3.70 6.90 2.10 1
Health technologists and technicians, n.e.c. 208 4.16 3.90 3.84 6.71 1.94 0
Electrical and electronic (engineering) technicians 213 4.86 4.29 4.14 7.29 1.71 0
Engineering technicians, n.e.c. 214 4.59 4.51 4.12 7.02 1.22 0
Mechanical engineering technicians 215 4.57 4.29 3.90 6.67 1.81 0
Drafters 217 3.87 3.27 3.27 5.53 2.33 0
Surveyors, cartographers, mapping scientists and technicians 218 4.67 4.25 3.92 6.50 2.00 0
Biological technicians 223 4.32 4.02 3.95 6.17 2.02 0
Chemical technicians 224 4.79 4.21 4.36 7.43 1.93 0
Other science technicians 225 4.40 3.40 4.00 7.80 1.60 0
Airplane pilots and navigators 226 4.19 3.43 3.81 7.00 1.38 0
Air traffic controllers 227 4.75 4.25 4.75 7.25 1.25 0
Broadcast equipment operators 228 4.00 3.50 3.50 6.00 1.00 0
Computer software developers 229 4.73 2.82 4.64 6.82 1.18 0
Programmers of numerically controlled machine tools 233 4.05 2.97 3.58 6.18 1.92 0
Legal assistants, paralegals, legal support, etc 234 4.14 3.41 3.73 6.50 1.91 0
Technicians, n.e.c. 235 4.00 3.00 4.00 5.50 1.50 0
Supervisors and proprietors of sales jobs 243 4.40 3.20 4.20 5.80 2.00 0
Insurance sales occupations 253 4.67 3.33 4.33 6.67 1.50 0
Real estate sales occupations 254 4.00 2.71 3.71 5.43 2.00 0
Financial services sales occupations 255 5.00 5.00 5.00 8.00 2.00 0
Advertising and related sales jobs 256 3.90 2.92 3.71 4.99 1.96 0
Sales engineers 258 3.00 2.45 2.70 3.15 2.05 0
Salespersons, n.e.c. 274 3.00 2.29 2.10 3.05 1.71 0
Retail sales clerks 275 2.38 2.13 2.25 2.63 2.25 0
Cashiers 276 3.25 2.25 2.94 3.44 1.81 0
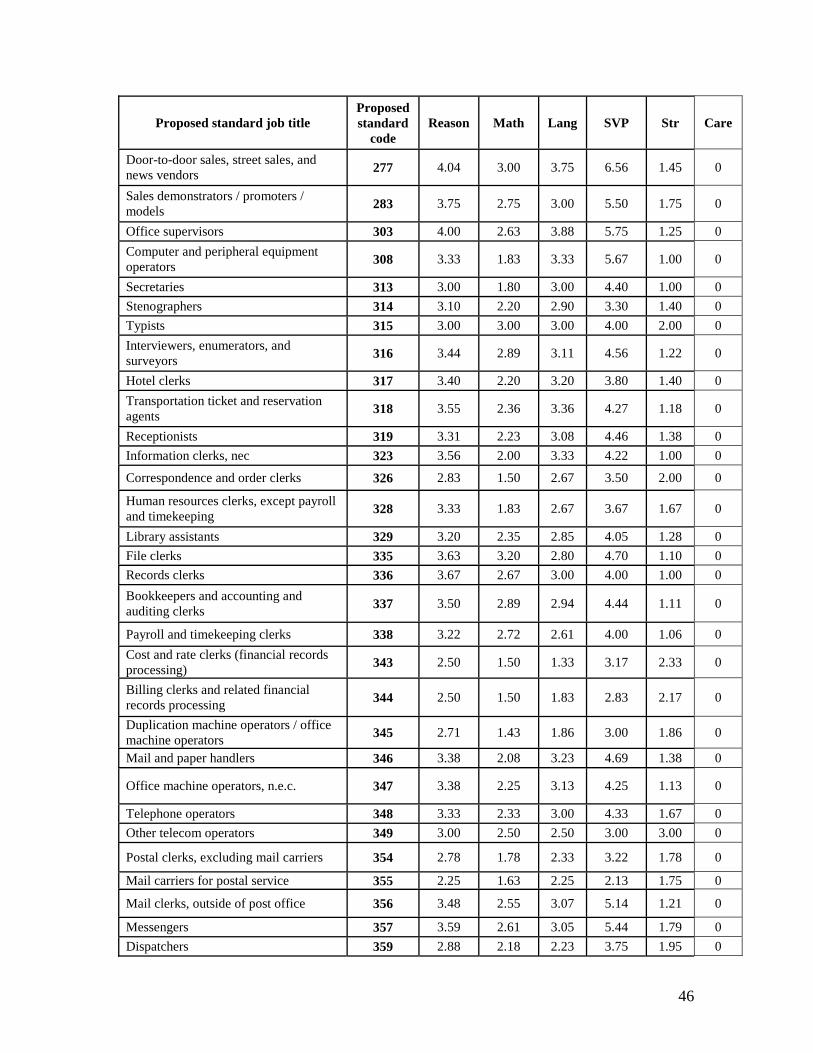
46
Proposed standard job title Proposed standard
code Reason Math Lang SVP Str Care
Door-to-door sales, street sales, and news vendors 277 4.04 3.00 3.75 6.56 1.45 0
Sales demonstrators / promoters / models 283 3.75 2.75 3.00 5.50 1.75 0
Office supervisors 303 4.00 2.63 3.88 5.75 1.25 0
Computer and peripheral equipment operators 308 3.33 1.83 3.33 5.67 1.00 0
Secretaries 313 3.00 1.80 3.00 4.40 1.00 0
Stenographers 314 3.10 2.20 2.90 3.30 1.40 0
Typists 315 3.00 3.00 3.00 4.00 2.00 0
Interviewers, enumerators, and surveyors 316 3.44 2.89 3.11 4.56 1.22 0
Hotel clerks 317 3.40 2.20 3.20 3.80 1.40 0
Transportation ticket and reservation agents 318 3.55 2.36 3.36 4.27 1.18 0
Receptionists 319 3.31 2.23 3.08 4.46 1.38 0
Information clerks, nec 323 3.56 2.00 3.33 4.22 1.00 0
Correspondence and order clerks 326 2.83 1.50 2.67 3.50 2.00 0
Human resources clerks, except payroll and timekeeping 328 3.33 1.83 2.67 3.67 1.67 0
Library assistants 329 3.20 2.35 2.85 4.05 1.28 0
File clerks 335 3.63 3.20 2.80 4.70 1.10 0
Records clerks 336 3.67 2.67 3.00 4.00 1.00 0
Bookkeepers and accounting and auditing clerks 337 3.50 2.89 2.94 4.44 1.11 0
Payroll and timekeeping clerks 338 3.22 2.72 2.61 4.00 1.06 0
Cost and rate clerks (financial records processing) 343 2.50 1.50 1.33 3.17 2.33 0
Billing clerks and related financial records processing 344 2.50 1.50 1.83 2.83 2.17 0
Duplication machine operators / office machine operators 345 2.71 1.43 1.86 3.00 1.86 0
Mail and paper handlers 346 3.38 2.08 3.23 4.69 1.38 0
Office machine operators, n.e.c. 347 3.38 2.25 3.13 4.25 1.13 0
Telephone operators 348 3.33 2.33 3.00 4.33 1.67 0
Other telecom operators 349 3.00 2.50 2.50 3.00 3.00 0
Postal clerks, excluding mail carriers 354 2.78 1.78 2.33 3.22 1.78 0
Mail carriers for postal service 355 2.25 1.63 2.25 2.13 1.75 0
Mail clerks, outside of post office 356 3.48 2.55 3.07 5.14 1.21 0
Messengers 357 3.59 2.61 3.05 5.44 1.79 0
Dispatchers 359 2.88 2.18 2.23 3.75 1.95 0

47
Proposed standard job title Proposed standard
code Reason Math Lang SVP Str Care
Inspectors, n.e.c. 361 3.00 2.00 2.00 3.00 2.00 0
Shipping and receiving clerks 364 2.75 2.14 2.18 3.11 2.14 0
Stock and inventory clerks 365 3.30 2.59 3.02 4.52 1.62 0
Meter readers 366 4.00 2.80 3.80 5.60 1.40 0
Weighers, measurers, and checkers 368 3.71 2.93 3.43 4.21 1.36 0
Material recording, scheduling, production, planning, and expediting clerks
373 4.00 3.00 4.00 5.50 1.50 0
Insurance adjusters, examiners, and investigators 375 3.33 2.67 3.00 4.00 2.00 0
Customer service reps, investigators and adjusters, except insurance 376 3.47 2.53 3.00 4.13 1.40 0
Eligibility clerks for government programs; social welfare 377 4.00 3.25 3.50 4.75 1.75 0
Bill and account collectors 378 3.75 1.25 3.75 4.50 1.25 0
General office clerks 379 3.30 1.90 3.00 4.60 1.10 0
Bank tellers 383 3.25 2.75 2.63 4.00 1.25 0
Proofreaders 384 3.33 2.67 3.00 3.00 1.33 0
Data entry keyers 385 3.11 2.13 2.80 3.97 1.48 0
Statistical clerks 386 2.22 1.33 1.78 3.11 2.11 0
Teacher's aides 387 2.50 1.67 2.00 2.50 2.50 1
Administrative support jobs, n.e.c. 389 3.80 2.40 3.60 6.80 1.80 0
Housekeepers, maids, butlers, stewards, and lodging quarters cleaners 405 3.78 2.67 3.17 6.06 1.61 0
Private household cleaners and servants 407 4.20 2.89 3.73 6.93 1.98 0
Supervisors of guards 415 3.11 2.00 2.83 4.89 2.06 0
Fire fighting, prevention, and inspection 417 2.00 1.33 2.00 2.33 2.00 0
Police, detectives, and private investigators 418 3.13 2.04 2.79 4.25 1.96 0
Other law enforcement: sheriffs, bailiffs, correctional institution officers 423 3.10 1.70 2.60 4.70 1.60 0
Crossing guards and bridge tenders 425 2.33 1.67 2.00 2.33 2.00 0
Guards, watchmen, doorkeepers 426 2.70 1.80 2.00 3.40 2.20 0
Protective services, n.e.c. 427 3.57 2.50 2.74 6.41 2.37 0
Bartenders 434 2.22 1.78 2.00 2.44 2.11 0
Waiter/waitress 435 2.44 1.67 1.67 3.00 2.22 0
Cooks, variously defined 436 2.00 1.00 1.00 2.00 2.75 0
Food counter and fountain workers 438 2.10 1.40 1.30 2.30 2.50 0
Kitchen workers 439 4.00 3.00 4.00 6.00 2.00 0
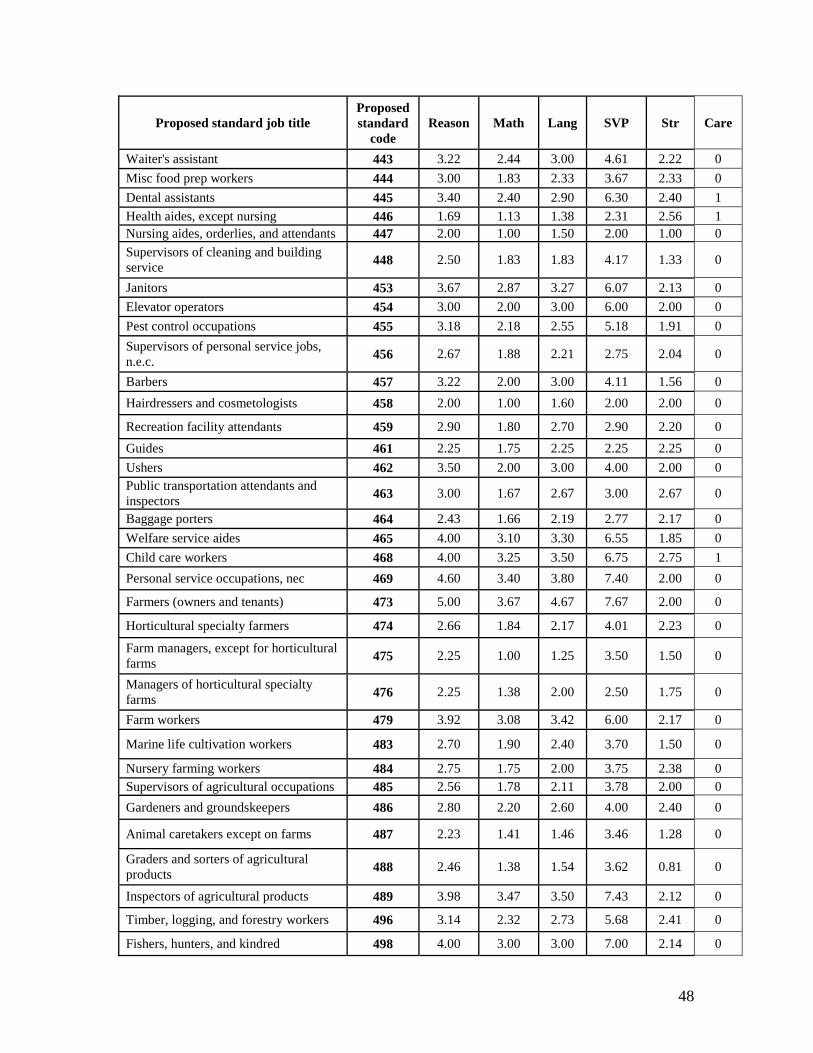
48
Proposed standard job title Proposed standard
code Reason Math Lang SVP Str Care
Waiter's assistant 443 3.22 2.44 3.00 4.61 2.22 0
Misc food prep workers 444 3.00 1.83 2.33 3.67 2.33 0
Dental assistants 445 3.40 2.40 2.90 6.30 2.40 1
Health aides, except nursing 446 1.69 1.13 1.38 2.31 2.56 1 Nursing aides, orderlies, and attendants 447 2.00 1.00 1.50 2.00 1.00 0
Supervisors of cleaning and building service 448 2.50 1.83 1.83 4.17 1.33 0
Janitors 453 3.67 2.87 3.27 6.07 2.13 0
Elevator operators 454 3.00 2.00 3.00 6.00 2.00 0
Pest control occupations 455 3.18 2.18 2.55 5.18 1.91 0
Supervisors of personal service jobs, n.e.c. 456 2.67 1.88 2.21 2.75 2.04 0
Barbers 457 3.22 2.00 3.00 4.11 1.56 0
Hairdressers and cosmetologists 458 2.00 1.00 1.60 2.00 2.00 0
Recreation facility attendants 459 2.90 1.80 2.70 2.90 2.20 0
Guides 461 2.25 1.75 2.25 2.25 2.25 0
Ushers 462 3.50 2.00 3.00 4.00 2.00 0 Public transportation attendants and inspectors 463 3.00 1.67 2.67 3.00 2.67 0
Baggage porters 464 2.43 1.66 2.19 2.77 2.17 0
Welfare service aides 465 4.00 3.10 3.30 6.55 1.85 0
Child care workers 468 4.00 3.25 3.50 6.75 2.75 1
Personal service occupations, nec 469 4.60 3.40 3.80 7.40 2.00 0
Farmers (owners and tenants) 473 5.00 3.67 4.67 7.67 2.00 0
Horticultural specialty farmers 474 2.66 1.84 2.17 4.01 2.23 0
Farm managers, except for horticultural farms 475 2.25 1.00 1.25 3.50 1.50 0
Managers of horticultural specialty farms 476 2.25 1.38 2.00 2.50 1.75 0
Farm workers 479 3.92 3.08 3.42 6.00 2.17 0
Marine life cultivation workers 483 2.70 1.90 2.40 3.70 1.50 0
Nursery farming workers 484 2.75 1.75 2.00 3.75 2.38 0 Supervisors of agricultural occupations 485 2.56 1.78 2.11 3.78 2.00 0
Gardeners and groundskeepers 486 2.80 2.20 2.60 4.00 2.40 0
Animal caretakers except on farms 487 2.23 1.41 1.46 3.46 1.28 0
Graders and sorters of agricultural products 488 2.46 1.38 1.54 3.62 0.81 0
Inspectors of agricultural products 489 3.98 3.47 3.50 7.43 2.12 0
Timber, logging, and forestry workers 496 3.14 2.32 2.73 5.68 2.41 0
Fishers, hunters, and kindred 498 4.00 3.00 3.00 7.00 2.14 0

49
Proposed standard job title Proposed standard
code Reason Math Lang SVP Str Care
Supervisors of mechanics and repairers 503 3.57 2.71 3.29 5.86 2.71 0
Automobile mechanics 505 3.58 2.92 2.92 6.25 2.17 0
Bus, truck, and stationary engine mechanics 507 2.92 2.08 2.00 5.23 2.23 0
Aircraft mechanics 508 3.65 2.65 2.88 6.47 1.71 0
Small engine repairers 509 3.55 2.76 2.91 6.11 2.09 0
Auto body repairers 514 2.30 1.27 1.64 3.39 1.98 0
Heavy equipment and farm equipment mechanics 516 3.80 3.20 3.02 6.59 2.37 0
Industrial machinery repairers 518 3.50 3.00 2.50 6.00 2.00 0
Machinery maintenance occupations 519 3.63 2.63 2.75 6.13 2.00 0
Repairers of industrial electrical equipment 523 4.00 3.40 3.00 7.00 1.60 0
Repairers of data processing equipment 525 3.52 2.58 2.61 6.06 2.32 0
Repairers of household appliances and power tools 526 3.55 2.64 2.91 6.64 1.91 0
Telecom and line installers and repairers 527 3.51 2.41 2.57 6.51 2.01 0
Repairers of electrical equipment, n.e.c. 533 3.67 3.00 3.00 6.33 1.33 0 Heating, air conditioning, and refigeration mechanics 534 3.75 2.75 2.88 6.38 2.38 0
Precision makers, repairers, and smiths 535 3.24 2.67 2.67 5.71 2.33 0
Locksmiths and safe repairers 536 4.00 3.00 3.00 7.25 2.00 0
Office machine repairers and mechanics 538 4.00 3.50 3.50 7.33 1.00 0
Repairers of mechanical controls and valves 539 2.93 1.86 2.02 4.60 1.88 0
Elevator installers and repairers 543 3.98 3.06 3.04 7.45 2.23 0
Millwrights 544 3.33 2.21 2.38 6.17 2.00 0
Mechanics and repairers, n.e.c. 549 3.48 2.61 2.39 5.82 2.36 0
Supervisors of construction work 558 2.67 2.00 2.00 5.50 2.50 0
Masons, tilers, and carpet installers 563 3.69 2.92 2.77 6.62 2.85 0
Carpenters 567 3.67 3.17 2.83 6.50 1.42 0
Drywall installers 573 2.83 1.83 1.83 6.67 2.67 0
Electricians 575 3.00 1.50 1.50 4.50 2.50 0
Electric power installers and repairers 577 3.50 2.25 2.50 7.00 3.00 0
Painters, construction and maintenance 579 3.67 2.44 2.78 6.50 1.33 0
Paperhangers 583 3.50 2.33 2.33 6.67 2.00 0
Plasterers 584 3.00 2.00 2.00 6.67 2.00 0
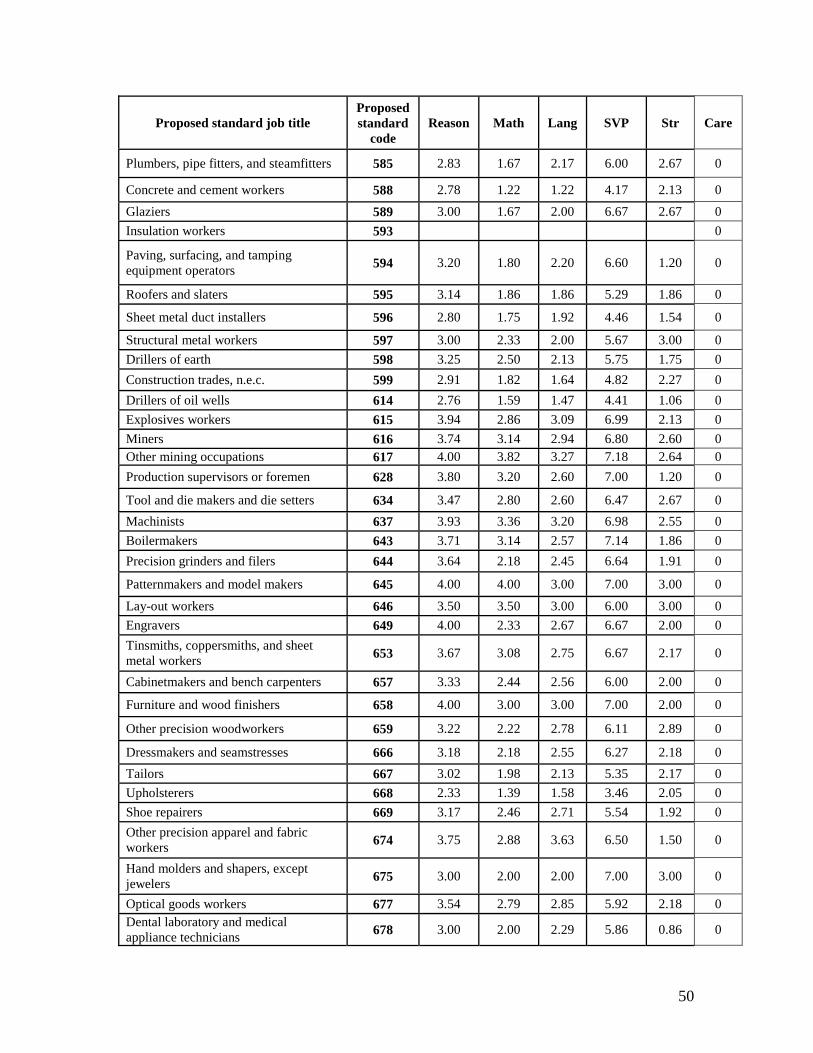
50
Proposed standard job title Proposed standard
code Reason Math Lang SVP Str Care
Plumbers, pipe fitters, and steamfitters 585 2.83 1.67 2.17 6.00 2.67 0
Concrete and cement workers 588 2.78 1.22 1.22 4.17 2.13 0
Glaziers 589 3.00 1.67 2.00 6.67 2.67 0
Insulation workers 593 0
Paving, surfacing, and tamping equipment operators 594 3.20 1.80 2.20 6.60 1.20 0
Roofers and slaters 595 3.14 1.86 1.86 5.29 1.86 0
Sheet metal duct installers 596 2.80 1.75 1.92 4.46 1.54 0
Structural metal workers 597 3.00 2.33 2.00 5.67 3.00 0
Drillers of earth 598 3.25 2.50 2.13 5.75 1.75 0
Construction trades, n.e.c. 599 2.91 1.82 1.64 4.82 2.27 0
Drillers of oil wells 614 2.76 1.59 1.47 4.41 1.06 0
Explosives workers 615 3.94 2.86 3.09 6.99 2.13 0
Miners 616 3.74 3.14 2.94 6.80 2.60 0 Other mining occupations 617 4.00 3.82 3.27 7.18 2.64 0
Production supervisors or foremen 628 3.80 3.20 2.60 7.00 1.20 0
Tool and die makers and die setters 634 3.47 2.80 2.60 6.47 2.67 0
Machinists 637 3.93 3.36 3.20 6.98 2.55 0
Boilermakers 643 3.71 3.14 2.57 7.14 1.86 0
Precision grinders and filers 644 3.64 2.18 2.45 6.64 1.91 0
Patternmakers and model makers 645 4.00 4.00 3.00 7.00 3.00 0
Lay-out workers 646 3.50 3.50 3.00 6.00 3.00 0
Engravers 649 4.00 2.33 2.67 6.67 2.00 0
Tinsmiths, coppersmiths, and sheet metal workers 653 3.67 3.08 2.75 6.67 2.17 0
Cabinetmakers and bench carpenters 657 3.33 2.44 2.56 6.00 2.00 0
Furniture and wood finishers 658 4.00 3.00 3.00 7.00 2.00 0
Other precision woodworkers 659 3.22 2.22 2.78 6.11 2.89 0
Dressmakers and seamstresses 666 3.18 2.18 2.55 6.27 2.18 0
Tailors 667 3.02 1.98 2.13 5.35 2.17 0
Upholsterers 668 2.33 1.39 1.58 3.46 2.05 0
Shoe repairers 669 3.17 2.46 2.71 5.54 1.92 0
Other precision apparel and fabric workers 674 3.75 2.88 3.63 6.50 1.50 0
Hand molders and shapers, except jewelers 675 3.00 2.00 2.00 7.00 3.00 0
Optical goods workers 677 3.54 2.79 2.85 5.92 2.18 0 Dental laboratory and medical appliance technicians 678 3.00 2.00 2.29 5.86 0.86 0

51
Proposed standard job title Proposed standard
code Reason Math Lang SVP Str Care
Bookbinders 679 3.00 2.00 2.00 6.67 0.67 0
Other precision and craft workers 684 3.67 2.44 2.89 6.56 2.44 0
Butchers and meat cutters 686 3.29 2.12 2.18 5.76 1.88 0
Bakers 687 3.43 2.86 2.86 5.14 2.29 0
Batch food makers 688 3.75 3.00 2.94 6.94 2.38 0
Adjusters and calibrators 693 3.10 2.60 2.50 5.50 2.70 0
Water and sewage treatment plant operators 694 3.26 2.65 2.61 5.32 2.29 0
Power plant operators 695 2.89 2.19 2.19 4.53 2.42 0
Plant and system operators, stationary engineers 696 2.60 1.82 1.88 3.84 1.90 0
Other plant and system operators 699 3.00 2.19 1.97 4.97 2.52 0
Lathe, milling, and turning machine operatives 703 2.75 2.18 2.00 3.82 2.46 0
Punching and stamping press operatives 706 2.61 1.76 1.89 3.99 2.26 0
Rollers, roll hands, and finishers of metal 707 2.94 2.06 1.94 4.82 1.65 0
Drilling and boring machine operators 708 2.60 1.76 1.84 3.93 2.35 0
Grinding, abrading, buffing, and polishing workers 709 2.55 1.69 1.75 3.74 2.09 0
Forge and hammer operators 713 2.53 1.92 1.90 3.63 2.24 0
Fabricating machine operators, n.e.c. 717 2.96 2.25 2.07 4.43 2.25 0
Molders, and casting machine operators 719 2.68 1.68 1.48 3.78 2.58 0
Metal platers 723 2.62 1.46 1.27 3.85 2.31 0
Heat treating equipment operators 724 2.17 1.33 1.21 3.00 2.25 0
Wood lathe, routing, and planing machine operators 726 2.00 1.20 1.20 2.00 2.20 0
Sawing machine operators and sawyers 727 2.37 1.50 1.50 3.23 2.49 0
Shaping and joining machine operator (woodworking) 728 2.85 1.65 1.89 4.67 2.27 0
Nail and tacking machine operators (woodworking) 729 3.53 2.14 2.31 6.35 1.94 0
Other woodworking machine operators 733 3.50 1.64 2.57 6.14 2.21 0
Printing machine operators, n.e.c. 734 2.08 1.06 1.31 2.86 2.17 0
Photoengravers and lithographers 735 3.03 1.55 1.95 4.87 2.24 0
Typesetters and compositors 736 2.25 1.11 1.75 2.81 2.11 0
Winding and twisting textile/apparel operatives 738 2.27 1.07 1.24 3.05 2.02 0

52
Proposed standard job title Proposed standard
code Reason Math Lang SVP Str Care
Knitters, loopers, and toppers textile operatives 739 2.80 1.60 1.80 3.40 2.00 0
Textile cutting machine operators 743 2.07 1.11 1.22 2.48 2.19 0
Textile sewing machine operators 744 2.44 1.44 1.67 3.59 2.41 0
Shoemaking machine operators 745 2.13 1.19 1.65 2.81 2.32 0
Pressing machine operators (clothing) 747 2.04 1.24 1.33 2.80 2.15 0
Laundry workers 748 2.17 1.25 1.52 2.71 2.05 0
Misc textile machine operators 749 2.28 1.38 1.46 3.10 2.21 0
Cementing and gluing maching operators 753 2.47 1.64 1.67 3.46 1.66 0
Packers, fillers, and wrappers 754 2.54 1.62 1.70 3.57 2.15 0
Extruding and forming machine operators 755 2.37 1.45 1.65 3.28 2.34 0
Mixing and blending machine operatives 756 2.37 1.59 1.68 3.41 1.93 0
Separating, filtering, and clarifying machine operators 757 2.21 1.40 1.49 2.72 2.16 0
Painting machine operators 759 2.37 1.53 1.53 3.16 2.37 0
Roasting and baking machine operators (food) 763 2.52 1.59 1.59 3.47 2.17 0
Washing, cleaning, and pickling machine operators 764 2.33 1.33 1.36 3.34 2.05 0
Paper folding machine operators 765 2.22 1.36 1.46 2.89 2.10 0
Furnace, kiln, and oven operators, apart from food 766 4.00 2.00 2.00 6.00 2.00 0
Crushing and grinding machine operators 768 3.21 2.00 2.19 5.20 1.70 0
Slicing and cutting machine operators 769 2.45 1.63 1.77 3.40 2.18 0
Motion picture projectionists 773 3.18 2.72 2.49 4.85 2.33 0
Photographic process workers 774 2.56 2.11 2.22 3.50 2.22 0
Machine operators, n.e.c. 779 2.24 1.41 1.52 3.03 2.06 0
Welders and metal cutters 783 2.13 1.20 1.28 3.05 2.06 0
Solderers 784 2.81 2.00 2.20 4.17 2.03 0
Assemblers of electrical equipment 785 2.15 1.33 1.61 2.90 2.04 0
Hand painting, coating, and decorating occupations 789 3.73 2.67 3.07 6.13 2.13 0
Production checkers and inspectors 796 2.64 1.42 1.78 3.08 2.67 0
Graders and sorters in manufacturing 799 3.00 2.00 2.00 3.33 2.67 0
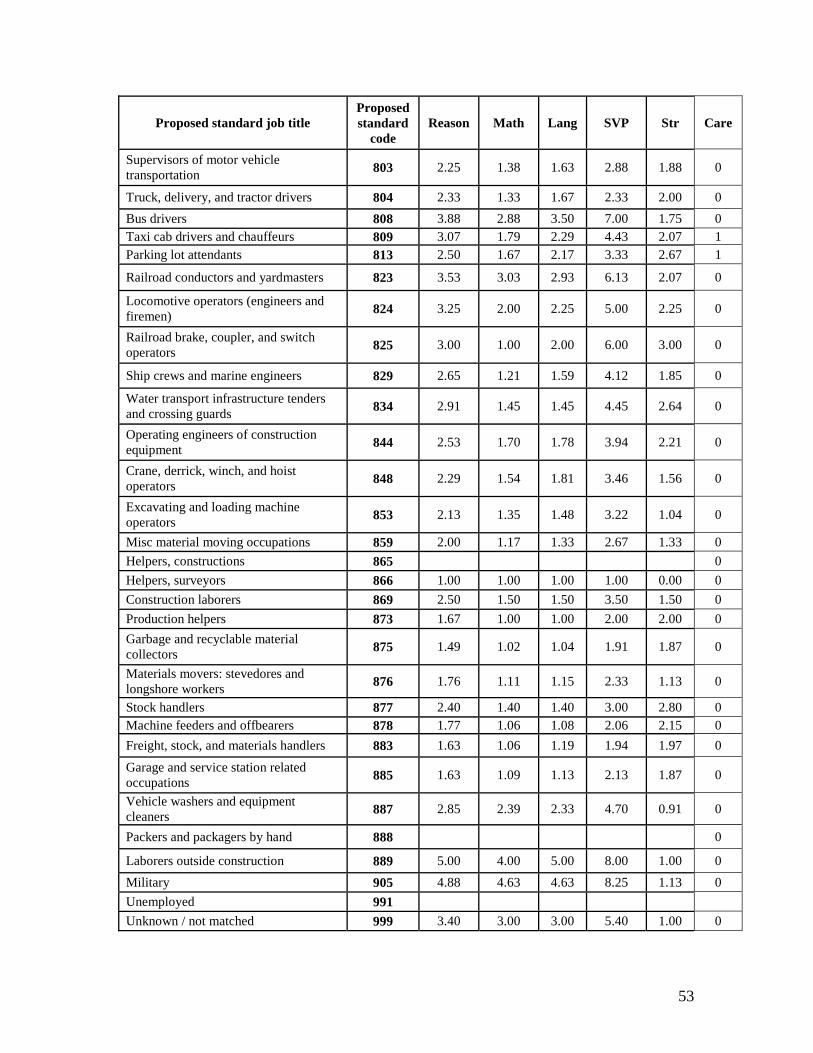
53
Proposed standard job title Proposed standard
code Reason Math Lang SVP Str Care
Supervisors of motor vehicle transportation 803 2.25 1.38 1.63 2.88 1.88 0
Truck, delivery, and tractor drivers 804 2.33 1.33 1.67 2.33 2.00 0
Bus drivers 808 3.88 2.88 3.50 7.00 1.75 0 Taxi cab drivers and chauffeurs 809 3.07 1.79 2.29 4.43 2.07 1 Parking lot attendants 813 2.50 1.67 2.17 3.33 2.67 1
Railroad conductors and yardmasters 823 3.53 3.03 2.93 6.13 2.07 0
Locomotive operators (engineers and firemen) 824 3.25 2.00 2.25 5.00 2.25 0
Railroad brake, coupler, and switch operators 825 3.00 1.00 2.00 6.00 3.00 0
Ship crews and marine engineers 829 2.65 1.21 1.59 4.12 1.85 0
Water transport infrastructure tenders and crossing guards 834 2.91 1.45 1.45 4.45 2.64 0
Operating engineers of construction equipment 844 2.53 1.70 1.78 3.94 2.21 0
Crane, derrick, winch, and hoist operators 848 2.29 1.54 1.81 3.46 1.56 0
Excavating and loading machine operators 853 2.13 1.35 1.48 3.22 1.04 0
Misc material moving occupations 859 2.00 1.17 1.33 2.67 1.33 0
Helpers, constructions 865 0
Helpers, surveyors 866 1.00 1.00 1.00 1.00 0.00 0
Construction laborers 869 2.50 1.50 1.50 3.50 1.50 0
Production helpers 873 1.67 1.00 1.00 2.00 2.00 0
Garbage and recyclable material collectors 875 1.49 1.02 1.04 1.91 1.87 0
Materials movers: stevedores and longshore workers 876 1.76 1.11 1.15 2.33 1.13 0
Stock handlers 877 2.40 1.40 1.40 3.00 2.80 0 Machine feeders and offbearers 878 1.77 1.06 1.08 2.06 2.15 0
Freight, stock, and materials handlers 883 1.63 1.06 1.19 1.94 1.97 0
Garage and service station related occupations 885 1.63 1.09 1.13 2.13 1.87 0
Vehicle washers and equipment cleaners 887 2.85 2.39 2.33 4.70 0.91 0
Packers and packagers by hand 888 0
Laborers outside construction 889 5.00 4.00 5.00 8.00 1.00 0
Military 905 4.88 4.63 4.63 8.25 1.13 0
Unemployed 991
Unknown / not matched 999 3.40 3.00 3.00 5.40 1.00 0

54
Appendix D. Tests of consistency of occupation definitions
The tables which follow compare the most pronounced changes by different criteria in the IPUMS assignment of Census 1950 occupations (in the variable named occ1950) and in the proposed classification (in appendix A). We apply the same consistency criteria to both classifications in order to study which categories seem to be inconsistent, and whether one classification is doing much less well than the other . Overall they perform similarly on these criteria.
Appendix D1. Occupation categories with the greatest and smallest increases in mean earned income within the occupation category
Occupations which were not measured at all in one of the years are left out of the
table. The measure of income is nominal, so a change of 1.0 is actually a decline in real income.
Occupations with the greatest and least increases in mean nominal income, 1960 to 1970, occ1950 classification
occ1950 Job title from 1950 Census Mean 1970 earned income divided by
mean 1960 earned income 752 Boarding and lodging house keepers 3.22 360 Telegraph messengers 3.12 59 Nurses, student professional 2.89 78 Religious workers 2.76
772 Midwives 2.63 . . . .
731 Attendants, professional and personal service (nec) 1.18 521 Engravers, except engravers 1.18 611 Apprentices, building trades (nec) 1.15 645 Milliners 0.92 100 Farmers (owners and tenants) 0.39
1960 to 1970, proposed standard classification Proposed
code Proposed job title Mean 1970 earned income divided by
mean 1960 earned income 468 Child care workers 3.32 469 Personal service occupations, nec 2.98 283 Sales demonstrators / promoters / models 2.61
599 Construction trades, n.e.c. 2.48
89 Other health and therapy 2.41 …
199 Athletes, sports instructors, and officials 1.17 185 Designers 1.16 228 Broadcast equipment operators 1.11 475 Farm managers, except for horticultural farms 1.00 473 Farmers (owners and tenants) 0.36

55
Occupation categories with the greatest and least increases in mean nominal earned
income, 1970 to 1980 IPUMS occ1950 Job title from 1950 Census
Mean 1980 earned income divided by mean 1970 earned income
710 Laundressses, private household 4.46 764 Housekeepers and stewards, except private household 3.11 370 Telephone operators 2.74 600 Auto mechanics apprentice 2.57 614 Apprentices, other specified trades 2.41
. . . . 77 Recreation and group workers 1.32
790 Service workers, except private household (nec) 1.32 6 Authors 1.30
33 Designers 1.23 525 Furriers 1.09
1970 to 1980, proposed standard classification Proposed
code Proposed job title Mean 1980 earned income divided
by mean 1970 earned income
475 Farm managers, except for horticultural farms 2.95
348 Telephone operators 2.74 468 Child care workers 2.62 616 Miners 2.46 717 Fabricating machine operators, n.e.c. 2.44
. . .
274 Salespersons, n.e.c. 1.30
183 Writers and authors 1.30
425 Crossing guards and bridge tenders 1.29
194 Art/entertainment performers and related 1.22
328 Human resources clerks, except payroll and
timekeeping 0.89
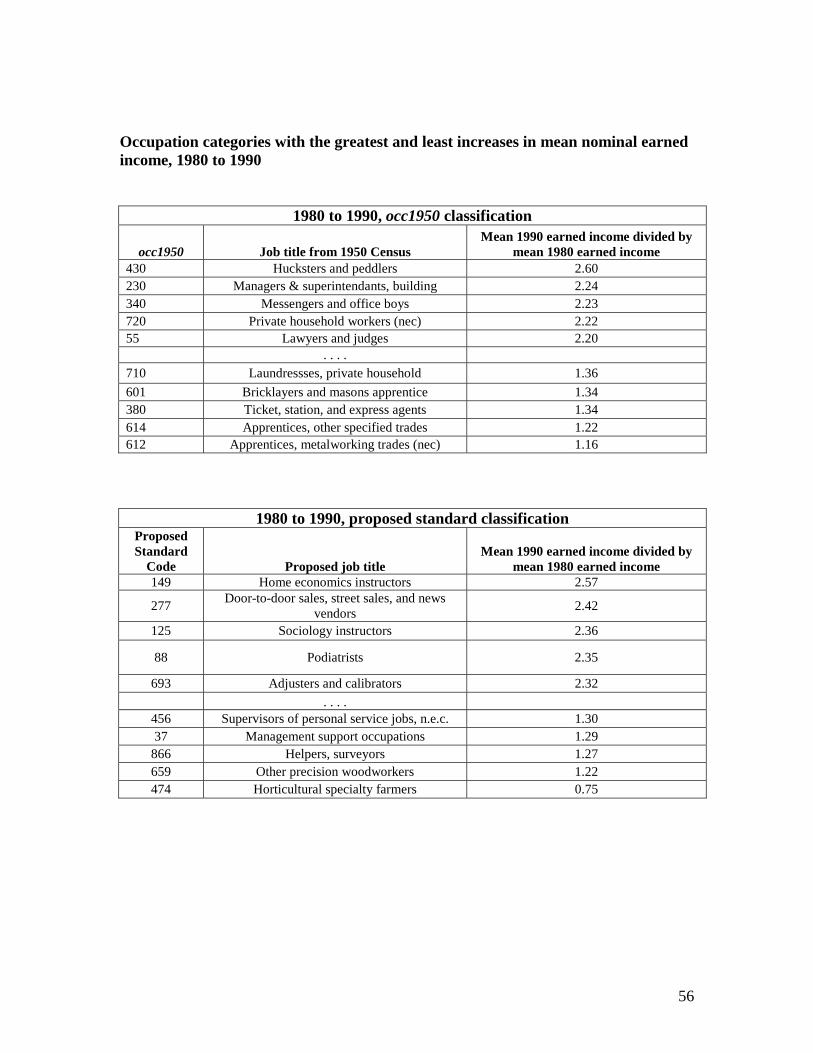
56
Occupation categories with the greatest and least increases in mean nominal earned income, 1980 to 1990
1980 to 1990, occ1950 classification
occ1950 Job title from 1950 Census Mean 1990 earned income divided by
mean 1980 earned income 430 Hucksters and peddlers 2.60 230 Managers & superintendants, building 2.24 340 Messengers and office boys 2.23 720 Private household workers (nec) 2.22 55 Lawyers and judges 2.20 . . . . 710 Laundressses, private household 1.36
601 Bricklayers and masons apprentice 1.34 380 Ticket, station, and express agents 1.34 614 Apprentices, other specified trades 1.22 612 Apprentices, metalworking trades (nec) 1.16
1980 to 1990, proposed standard classification Proposed Standard
Code Proposed job title Mean 1990 earned income divided by
mean 1980 earned income 149 Home economics instructors 2.57
277 Door-to-door sales, street sales, and news
vendors 2.42
125 Sociology instructors 2.36
88 Podiatrists 2.35
693 Adjusters and calibrators 2.32
. . . . 456 Supervisors of personal service jobs, n.e.c. 1.30 37 Management support occupations 1.29
866 Helpers, surveyors 1.27 659 Other precision woodworkers 1.22 474 Horticultural specialty farmers 0.75

57
Occupation categories with the greatest and least increases mean nominal earned income from 1990 to 2000
occ1950 (IPUMS) Job title from 1950 Census
Mean 2000 earned income divided by mean 1990 earned income
100 Farmers (owners and tenants) 7.51
790 Service workers, except private household
(nec) 2.00
720 Private household workers (nec) 1.98 302 Attendants, physicians and dentists office 1.94 783 Ushers, recreation and amusement 1.93
. . . . 622 Blasters and powdermen 0.97 51 Entertainers (nec) 0.96
562 Motion picture projectionists 0.95 732 Attendants, recreation and amusement 0.93 96 Technicians (nec) 0.41
Proposed Standard
Code Proposed job title Mean 2000 earned income divided by
mean 1990 earned income 473 Farmers (owners and tenants) 7.38
4 Chief executives and public administrators 3.77
465 Welfare service aides 2.52
799 Graders and sorters in manufacturing 2.43
346 Mail and paper handlers 2.37 . . . .
233 Programmers of numerically controlled
machine tools 1.06
773 Motion picture projectionists 0.95
678 Dental laboratory and medical appliance
technicians 0.92
159 Teachers , n.e.c. 0.88
876 Materials movers: stevedores and longshore
workers 0.72

58
Appendix D2. The fraction of the work force in each occupation
We measured the changes in the fraction of the work force in each occ1950 category and proposed standard occupation to detect which job categories experienced sharp change in the number of workers. The work force was defined by the respondent’s employment status (empstatd value in the set {10,12,14,15} and age (between 16 and 75). Here are the occupational categories which expanded or shrank rapidly from one decade to the next, first given for occ1950, then for the proposed classification.
Occupation categories which grew or shrank the most in size as a fraction of the work force from 1960 to 1970
occ1950 (IPUMS) Job title from 1950 Census
Fraction of workforce in 1970 divided by fraction of
workforce in 1960 26 Natural science (nec)-Professors and instructors 10.70
594 Craftsmen and kindred workers (nec) 5.44 51 Entertainers (nec) 5.18 10 College presidents and deans 5.10 24 Psychology-Professors and instructors 3.71
. . . 59 Nurses, student professional 0.24
710 Laundressses, private household 0.23 752 Boarding and lodging house keepers 0.21 780 Porters 0.12 300 Agents (nec) 0.11
Proposed Code Proposed job title
Fraction of workforce in 1970
divided by fraction of
workforce in 1960
14 Managers in education and related fields 25.41
13 Managers and specialists in marketing, advertising, and public
relations 14.18
859 Misc material moving occupations 12.47
599 Construction trades, n.e.c. 6.98
703 Lathe, milling, and turning machine operatives 6.41 . . . .
193 Dancers 0.24 464 Baggage porters 0.12 347 Office machine operators, n.e.c. 0.10 674 Other precision apparel and fabric workers 0.01 225 Other science technicians 0.00
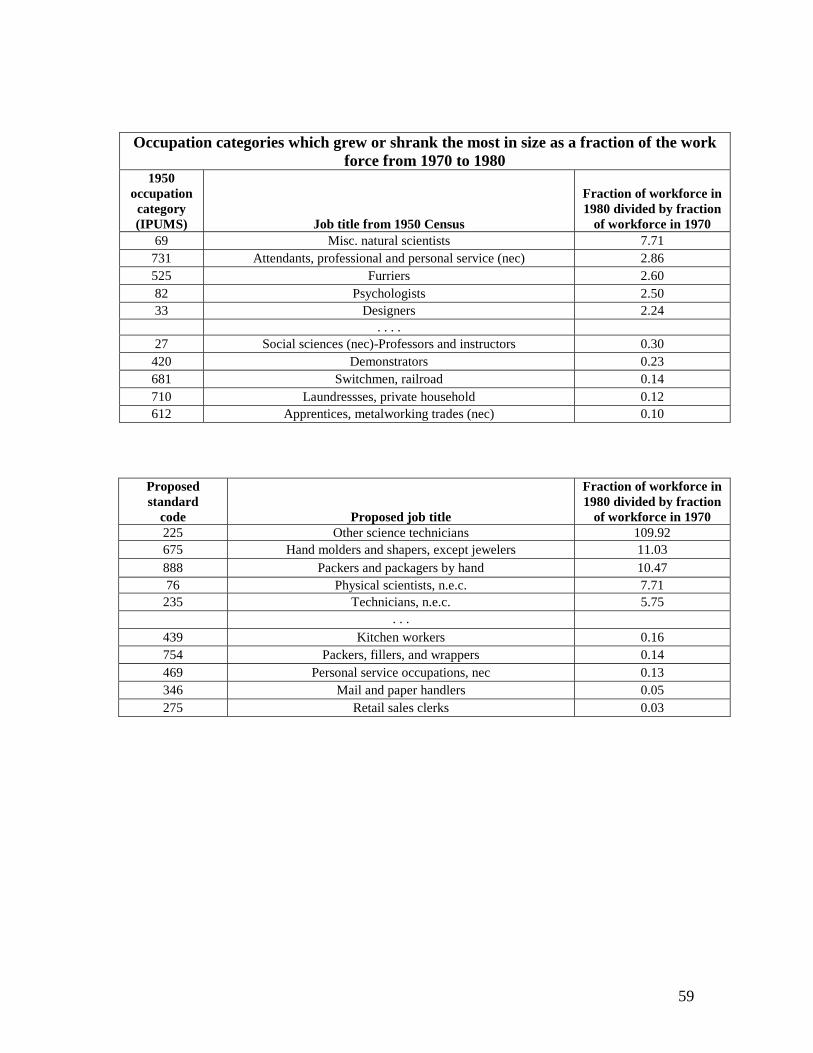
59
Occupation categories which grew or shrank the most in size as a fraction of the work force from 1970 to 1980
1950 occupation category (IPUMS) Job title from 1950 Census
Fraction of workforce in 1980 divided by fraction
of workforce in 1970 69 Misc. natural scientists 7.71
731 Attendants, professional and personal service (nec) 2.86 525 Furriers 2.60 82 Psychologists 2.50 33 Designers 2.24
. . . . 27 Social sciences (nec)-Professors and instructors 0.30
420 Demonstrators 0.23 681 Switchmen, railroad 0.14 710 Laundressses, private household 0.12 612 Apprentices, metalworking trades (nec) 0.10
Proposed standard
code Proposed job title
Fraction of workforce in 1980 divided by fraction
of workforce in 1970 225 Other science technicians 109.92 675 Hand molders and shapers, except jewelers 11.03 888 Packers and packagers by hand 10.47 76 Physical scientists, n.e.c. 7.71
235 Technicians, n.e.c. 5.75 . . .
439 Kitchen workers 0.16 754 Packers, fillers, and wrappers 0.14 469 Personal service occupations, nec 0.13 346 Mail and paper handlers 0.05 275 Retail sales clerks 0.03
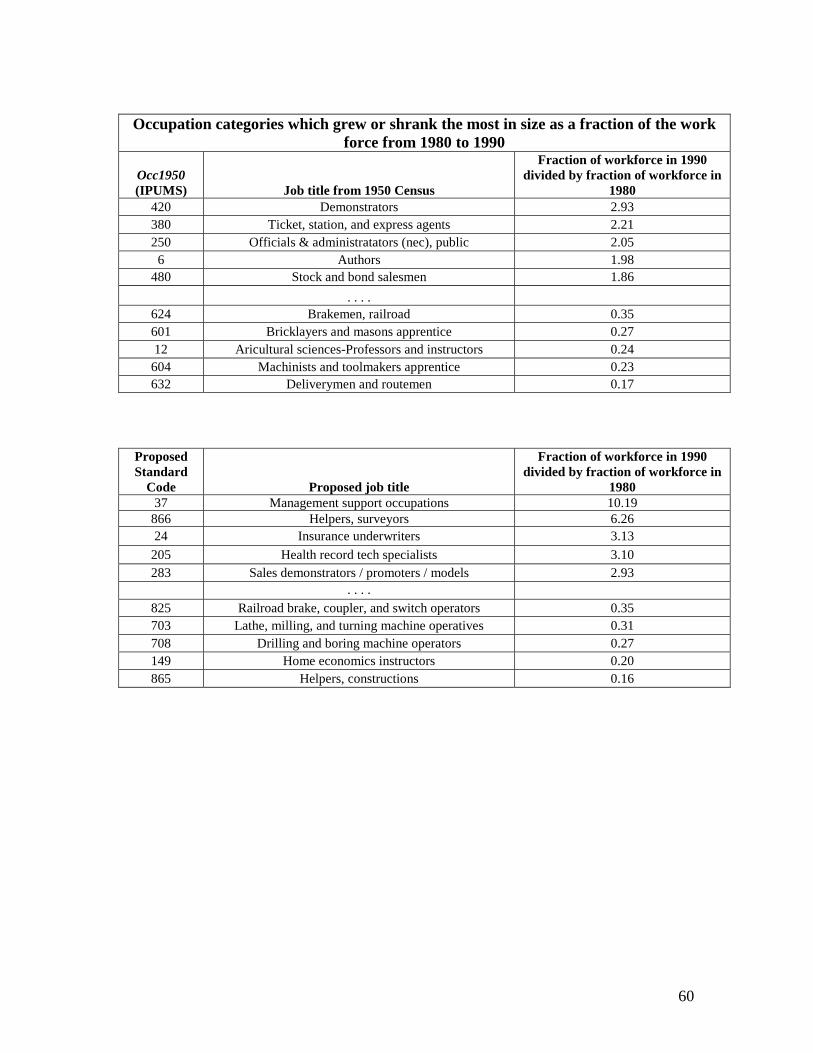
60
Occupation categories which grew or shrank the most in size as a fraction of the work
force from 1980 to 1990
Occ1950 (IPUMS) Job title from 1950 Census
Fraction of workforce in 1990 divided by fraction of workforce in
1980 420 Demonstrators 2.93 380 Ticket, station, and express agents 2.21 250 Officials & administratators (nec), public 2.05
6 Authors 1.98 480 Stock and bond salesmen 1.86
. . . . 624 Brakemen, railroad 0.35 601 Bricklayers and masons apprentice 0.27 12 Aricultural sciences-Professors and instructors 0.24
604 Machinists and toolmakers apprentice 0.23 632 Deliverymen and routemen 0.17
Proposed Standard
Code Proposed job title
Fraction of workforce in 1990 divided by fraction of workforce in
1980 37 Management support occupations 10.19
866 Helpers, surveyors 6.26 24 Insurance underwriters 3.13
205 Health record tech specialists 3.10 283 Sales demonstrators / promoters / models 2.93
. . . . 825 Railroad brake, coupler, and switch operators 0.35 703 Lathe, milling, and turning machine operatives 0.31 708 Drilling and boring machine operators 0.27 149 Home economics instructors 0.20 865 Helpers, constructions 0.16
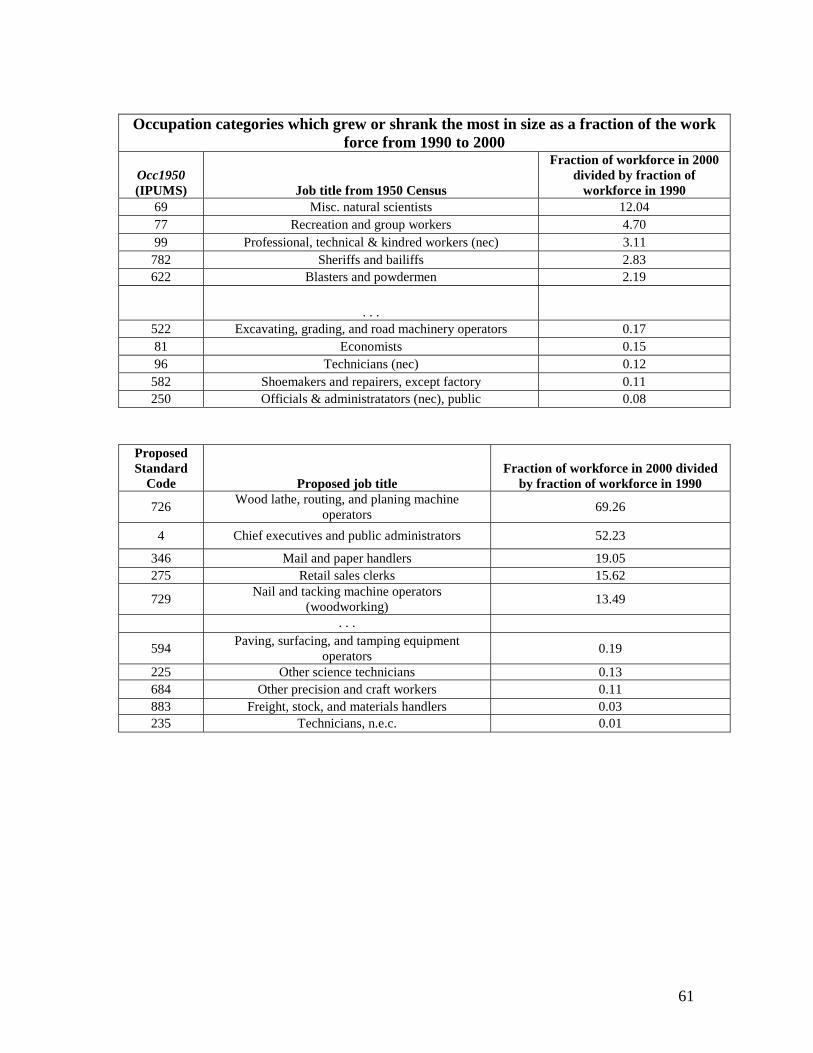
61
Occupation categories which grew or shrank the most in size as a fraction of the work
force from 1990 to 2000
Occ1950 (IPUMS) Job title from 1950 Census
Fraction of workforce in 2000 divided by fraction of
workforce in 1990 69 Misc. natural scientists 12.04 77 Recreation and group workers 4.70 99 Professional, technical & kindred workers (nec) 3.11
782 Sheriffs and bailiffs 2.83 622 Blasters and powdermen 2.19
. . . 522 Excavating, grading, and road machinery operators 0.17 81 Economists 0.15 96 Technicians (nec) 0.12
582 Shoemakers and repairers, except factory 0.11 250 Officials & administratators (nec), public 0.08
Proposed Standard
Code Proposed job title Fraction of workforce in 2000 divided
by fraction of workforce in 1990
726 Wood lathe, routing, and planing machine
operators 69.26
4 Chief executives and public administrators 52.23
346 Mail and paper handlers 19.05 275 Retail sales clerks 15.62
729 Nail and tacking machine operators
(woodworking) 13.49
. . .
594 Paving, surfacing, and tamping equipment
operators 0.19
225 Other science technicians 0.13 684 Other precision and craft workers 0.11 883 Freight, stock, and materials handlers 0.03 235 Technicians, n.e.c. 0.01

62
Appendix D3. Measures of the dispersion of earned income
Our third criterion of occupational stability was earning inequality. Earnings
inequality was measured by the coefficient of variation, or the sample’s standard deviation for each occupation divided by its mean.
Occupation categories with the greatest and least increases in coefficient of
variation of income, 1960 to 1970 occ1950
(IPUMS) Job title from 1950 Census Ratio of 1970 coefficient of variation to
1960 coefficient of variation 100 Farmers (owners and tenants) 2.87 771 Marshals and constables 1.87 700 Housekeepers, private household 1.78 69 Misc. natural scientists 1.76
611 Apprentices, building trades (nec) 1.72
. . . 201 Buyers and shippers, farm products 0.73 15 Economics-Professors and instructors 0.71
645 Milliners 0.67 660 Motormen, mine, factory, logging camp, etc 0.65 59 Nurses, student professional 0.63
Proposed Standard
Code Proposed job title Ratio of 1970 coefficient of variation to
1960 coefficient of variation 473 Farmers (owners and tenants) 2.95 76 Physical scientists, n.e.c. 1.76
199 Athletes, sports instructors, and officials 1.70
883 Freight, stock, and materials handlers 1.64
703 Lathe, milling, and turning machine operatives 1.54 . . . .
584 Plasterers 0.76 28 Purchasing agents and buyers, of farm products 0.73
745 Shoemaking machine operators 0.73 119 Economics instructors 0.71 583 Paperhangers 0.63

63
Occupation categories with the greatest and smallest increases in coefficient
of variation of income, 1970 to 1980 occ1950
(IPUMS) Job title from 1950 Census Ratio of 1980 coefficient of variation to
1970 coefficient of variation 525 Furriers 0.74 573 Plasterers 0.74 630 Chainmen, rodmen, and axmen, surveying 0.65 612 Apprentices, metalworking trades (nec) 0.62 201 Buyers and shippers, farm products 0.62
. . .
31 Dancers and dancing teachers 0.36
78 Religious workers 0.36 710 Laundressses, private household 0.30
764 Housekeepers and stewards, except private
household 0.29
700 Housekeepers, private household 0.24 31 Dancers and dancing teachers 0.36
Proposed Standard
Code Proposed job title Ratio of 1980 coefficient of variation to
1970 coefficient of variation
349 Other telecom operators 0.79
225 Other science technicians 0.76
658 Furniture and wood finishers 0.75 584 Plasterers 0.74 139 Education instructors 0.71
. . .
105 Therapists, n.e.c. 0.35 168 Sociologists 0.34 475 Farm managers, except for horticultural farms 0.33 205 Health record tech specialists 0.29 316 Interviewers, enumerators, and surveyors 0.28
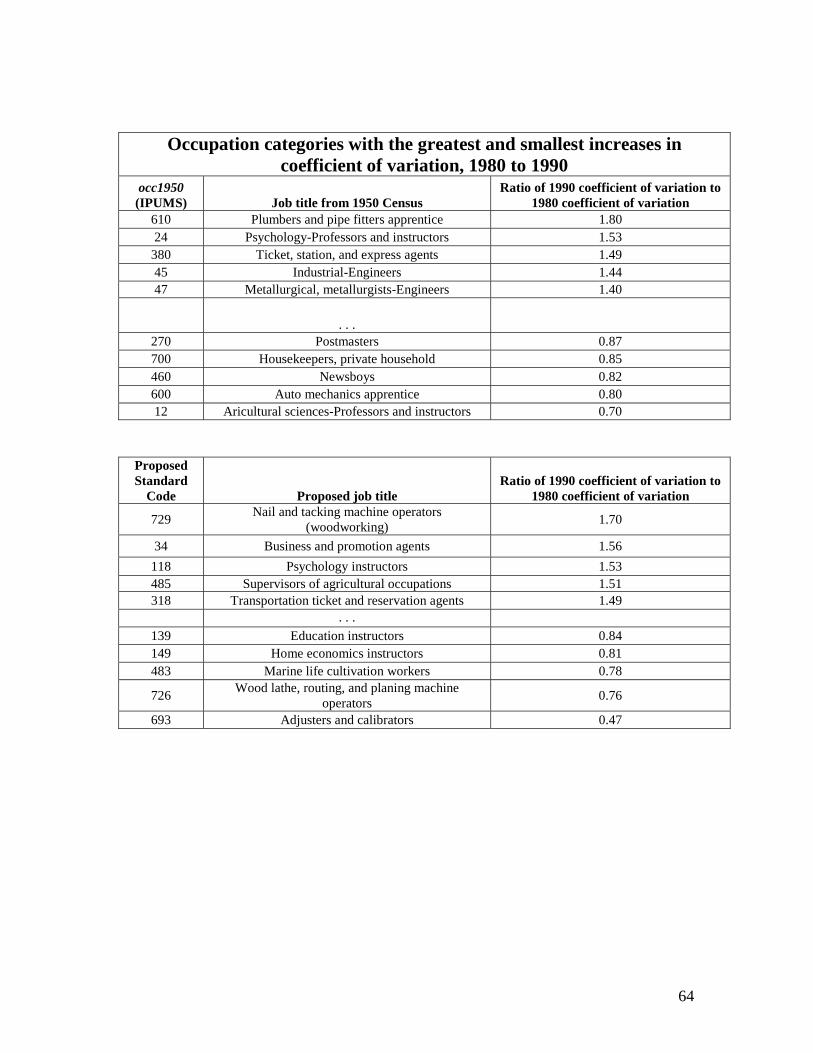
64
Occupation categories with the greatest and smallest increases in coefficient of variation, 1980 to 1990
occ1950 (IPUMS) Job title from 1950 Census
Ratio of 1990 coefficient of variation to 1980 coefficient of variation
610 Plumbers and pipe fitters apprentice 1.80 24 Psychology-Professors and instructors 1.53
380 Ticket, station, and express agents 1.49 45 Industrial-Engineers 1.44 47 Metallurgical, metallurgists-Engineers 1.40
. . . 270 Postmasters 0.87 700 Housekeepers, private household 0.85 460 Newsboys 0.82 600 Auto mechanics apprentice 0.80 12 Aricultural sciences-Professors and instructors 0.70
Proposed Standard
Code Proposed job title Ratio of 1990 coefficient of variation to
1980 coefficient of variation
729 Nail and tacking machine operators
(woodworking) 1.70
34 Business and promotion agents 1.56
118 Psychology instructors 1.53 485 Supervisors of agricultural occupations 1.51 318 Transportation ticket and reservation agents 1.49
. . .
139 Education instructors 0.84 149 Home economics instructors 0.81 483 Marine life cultivation workers 0.78
726 Wood lathe, routing, and planing machine
operators 0.76
693 Adjusters and calibrators 0.47

65
Occupation categories with the greatest and smallest increases in coefficient of variation, 1990 to 2000
occ1950 (IPUMS) Job title from 1950 Census
Ratio of 1990 coefficient of variation to 1980 coefficient of variation
96 Technicians (nec) 4.27 513 Cranemen,derrickmen, and hoistmen 3.83 680 Stationary firemen 3.74 570 Pattern and model makers, except paper 3.58 34 Dieticians and nutritionists 3.47
. . . 84 Misc social scientists 1.84
760 Counter and fountain workers 1.83 783 Ushers, recreation and amusement 1.53 45 Industrial-Engineers 1.40
100 Farmers (owners and tenants) 0.81
Proposed standard
code Proposed job title Ratio of 1990 coefficient of variation to
1980 coefficient of variation
594 Paving, surfacing, and tamping equipment
operators 5.00
106 Physicians' assistants 4.07
764 Washing, cleaning, and pickling machine
operators 4.04
848 Crane, derrick, winch, and hoist operators 3.83
539 Repairers of mechanical controls and valves 3.81 . . . .
225 Other science technicians 1.33 168 Sociologists 1.28
346 Mail and paper handlers 1.18
489 Inspectors of agricultural products 0.99 473 Farmers (owners and tenants) 0.82
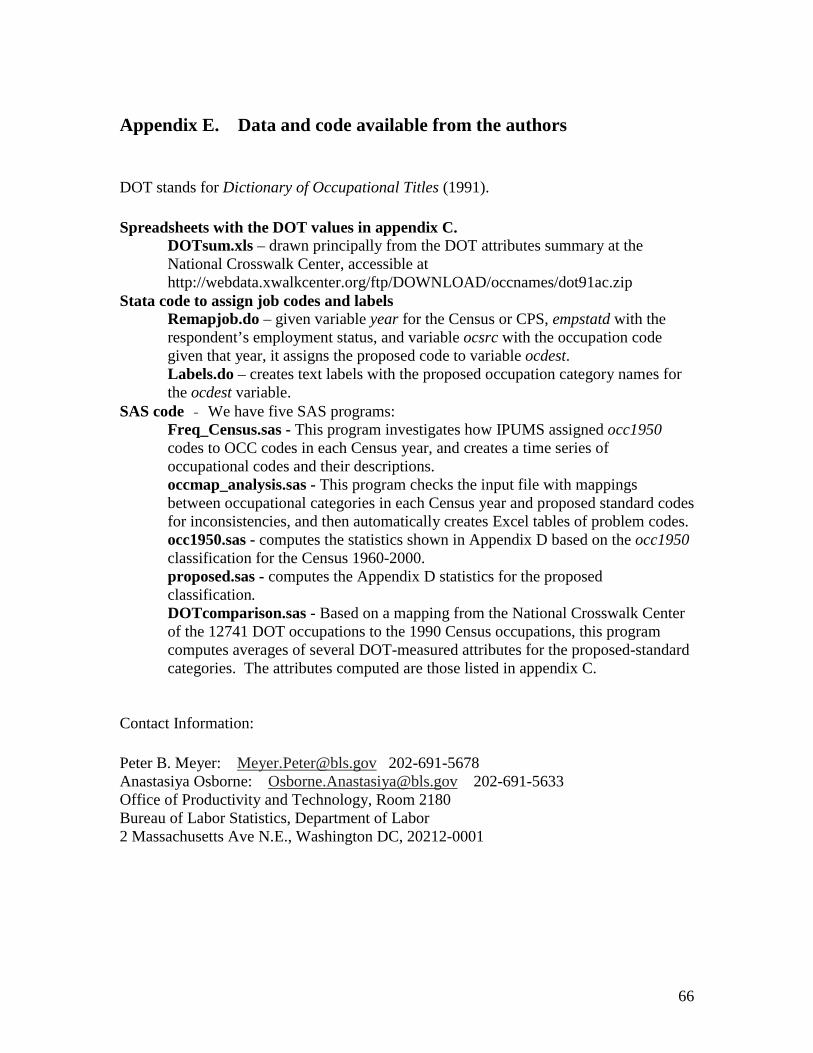
66
Appendix E. Data and code available from the authors DOT stands for Dictionary of Occupational Titles (1991). Spreadsheets with the DOT values in appendix C.
DOTsum.xls – drawn principally from the DOT attributes summary at the National Crosswalk Center, accessible at http://webdata.xwalkcenter.org/ftp/DOWNLOAD/occnames/dot91ac.zip
Stata code to assign job codes and labels Remapjob.do – given variable year for the Census or CPS, empstatd with the respondent’s employment status, and variable ocsrc with the occupation code given that year, it assigns the proposed code to variable ocdest. Labels.do – creates text labels with the proposed occupation category names for the ocdest variable.
SAS code - We have five SAS programs: Freq_Census.sas - This program investigates how IPUMS assigned occ1950 codes to OCC codes in each Census year, and creates a time series of occupational codes and their descriptions. occmap_analysis.sas - This program checks the input file with mappings between occupational categories in each Census year and proposed standard codes for inconsistencies, and then automatically creates Excel tables of problem codes. occ1950.sas - computes the statistics shown in Appendix D based on the occ1950 classification for the Census 1960-2000. proposed.sas - computes the Appendix D statistics for the proposed classification. DOTcomparison.sas - Based on a mapping from the National Crosswalk Center of the 12741 DOT occupations to the 1990 Census occupations, this program computes averages of several DOT-measured attributes for the proposed-standard categories. The attributes computed are those listed in appendix C.
Contact Information: Peter B. Meyer: [email protected] 202-691-5678 Anastasiya Osborne: [email protected] 202-691-5633 Office of Productivity and Technology, Room 2180 Bureau of Labor Statistics, Department of Labor 2 Massachusetts Ave N.E., Washington DC, 20212-0001

67
References
Advisory Panel on the Dictionary of Occupational Titles. 1993. Known as “the APDOT report.”
Downloaded from http://www.onetcenter.org/dl_files/PDF/AppendixC.pdf Autor, David H., Frank Levy, and Richard J. Murnane. 2003. The Skill Content of Recent
Technological Change: An Empirical Exploration. Quarterly Journal of Economics CXVIII: 4 (Nov, 2003).
England, Paula, Michelle Budig, and Nancy Folbre. 2002. Wages of Work: The Relative Pay of
Care Work. Social Problems 49:4, pp. 455-473. King, Miriam, Steven Ruggles, and Matthew Sobek. Integrated Public Use Microdata Series,
Current Population Survey: Preliminary Version 0.1. Minneapolis: Minnesota Population Center, University of Minnesota, 2003.
Meyer, Peter B. 2001. Technological uncertainty and earnings dispersion. Northwestern
University, Department of Economics dissertation. Meyer, Peter B. Technological uncertainty and superstardom: two sources of changing
inequality within occupations. Paper in progress. National Crosswalk Service Center: http://www.xwalkcenter.org/ Rosen, Sherwin. 1981. The Economics of Superstars. American Economic Review 71:5 (Dec.,
1981), 845-858. Steven Ruggles, Matthew Sobek, Trent Alexander, Catherine A. Fitch, Ronald Goeken, Patricia
Kelly Hall, Miriam King, and Chad Ronnander. Integrated Public Use Microdata Series: Version 3.0 [Machine-readable database]. Minneapolis, MN: Minnesota Population Center [producer and distributor], 2004. Online at: http://www.ipums.org.
Scopp, Thomas M. The Relationship between the 1990 Census and Census 2000 Industry and
Occupation Classification Systems. U.S. Census Bureau Technical Paper #65. Oct 2003. Online at: http://www.census.gov/hhes/www/ioindex/pdfio/techpaper2000.pdf
U.S. Department of Labor, Employment and Training Administration. 1991. Dictionary of
Occupational Titles, fourth edition. U.S. Department of Labor. 1993. Labor Composition and U.S. Productivity Growth, 1948-90.
(pp 77-78 on substitute income for topcoded incomes) U.S. Department of Labor. 1999. Report on the American Workforce chapter 3, “Economic
change and structures of classification.” https://www.bls.gov/opub/rtaw/chapter3.htm