bls_0585_1933.pdf
TRANSCRIPT

UNITED STATES DEPARTMENT OF LABORFRANCES PERKINS, Secretary
BUREAU OF LABOR STATISTICSISADOR LUBIN, Commissioner
BULLETIN OF THE UNITED STATES! CQC BUREAU OF LABOR S T A T IS T IC S /................... PlOe DOD
P R O D U C T I V I T Y OF L A B O R S E R I E S
LABOR PRODUCTIVITY IN THE AUTOMOBILE TIRE INDUSTRY
By BORIS STERN
JULY 1933
UNITED STATES GOVERNMENT PRINTING OFFICE
WASHINGTON: 1933
For sale by the Superintendent of Documents, Washington, D.C. Price 10 cents
Digitized for FRASER http://fraser.stlouisfed.org/ Federal Reserve Bank of St. Louis

Digitized for FRASER http://fraser.stlouisfed.org/ Federal Reserve Bank of St. Louis

C o n t e n t s
PageChapter 1.—Labor productivity in manufacturing automobile tires____ 1
Production of and demand for tires______________________________ 1Growth of tire industry_________________________________________ 2Object and scope of present survey and methods used_____________ 4
Measuring production______________________________________ 5“ Man-hours” defined______________________________________ 5
Productivity of labor in the industry_____________________________ 6Productivity of labor in individual plants_________________________ 10
Chapter 2.—Technological displacement of labor in the tire industry__ 15Displacement of labor defined and measured______________________ 15Causes of technological displacement of labor_____________________ 24Factors affecting reemployment of displaced workers______________ 26
Chapter 3.—Rates of wages and earnings of workers in the tire industry. _ 28Average hourly rates of wages, by departments___________________ 28Average actual monthly earnings, by departments_________________ 29Seasonal fluctuations in the industry_____________________________ 31
Chapter 4.— Manufacturing automobile tires: Preparation of crude rubber______________________________________________________________ 38
Cutting, washing, and breaking down crude rubber________________ 38Milling, compounding, and mixing rubber________________________ 40Calender department___________________________________________ 42Technological changes and labor displacement in washing, milling,
compounding, and calendering rubber__________________________ 43Labor productivity in washing, compounding, milling, and caldender-
ing rubber___________________ _______________________________ 44Chapter 5.— Manufacturing automobile tires: Stock preparation and car
cass building_____________________________________________________ 48Making tire plies_______________________________________________ 48Making tire beads______________________________________________ 49Constructing the tread and side walls of a tire____________________ 49Making chafers, cushions, breakers, etc___________________________ 50Building the body or carcass of the tire__________________________ 50Shaping drum-built tires_____________________ __________________ 52Technological labor displacement in the stock-preparation and car
cass-building departments_____________________________________ 53Labor productivity in the stock-preparation and tire-building depart
ments_______________________________________________________ 54Chapter 6.— Manufacturing automobile tires: Curing, finishing, and
inspecting tires___________________________________________________ 58Curing tires____________________________________________________ 58Finishing and inspecting tires___________________________________ 60Utilization of conveyors in the tire industry______________________ 61Technological displacement of labor in curing, finishing, and inspecting
tires_________________________________________________________ 62Labor productivity in curing, finishing, and inspecting tires________ 63
Chapter 7.— Manufacture of inner tubes____________________________ 67Changes in process of making inner tubes________________________ 67Technological displacement of labor in manufacturing inner tubes and
accessories___________________________________________________ 70Labor productivity in manufacturing inner tubes--------------------------- 71
h i
Digitized for FRASER http://fraser.stlouisfed.org/ Federal Reserve Bank of St. Louis

Digitized for FRASER http://fraser.stlouisfed.org/ Federal Reserve Bank of St. Louis

BULLETIN OF THE
U. S. BUREAU OF LABOR STATISTICS
n o * 585 WASHINGTON j u l y 1933
LABOR PRODUCTIVITY IN THE AUTOMOBILE TIRE INDUSTRY
C h a p ter 1.—Labor Productivity in Manufacturing Automobile Tires1
Production of and Demand for Tires
The manufacture of tires is a comparatively new industry. The history of tire maMng, like that of its parent, the automobile industry, has been predominately a post-war development. In 1914 only approximately 9,000,000 pneumatic tires were produced in this country. In 1920, 33,000,000 tires were produced, and in 1928, the year of the largest tire output, the total production was approximately 78,000,000 tires. The 1931 output was 48,500,000 tires.
There are two principal sources of demand for tires in the United States—for new equipment in the automobile industry and for renewals of tires on older cars. In addition, there is also a small demand for tires for export purposes. Table 1, based on data compiled by the India Rubber World, gives the total number of tires produced from 1913 to 1931, also the total number of tires used as new equipment and the number sold for renewal purposes from 1923 to 1931. The figures indicate that the principal demand for tires comes from renewal sales. The same table also contains the number of new automobiles produced and the total number of cars registered from 1913 to 1931. Division of the total number of tires used in renewal sales by the total number of registered cars gives the average number of renewal tires purchased annually for every car registered during that year.
i In the securing of the data the most generous cooperation was received from the general managers of thecompanies included in the present survey, from their men in the office, and their foremen and engineersin the plant proper. The latter were especially helpful because of their thorough familiarity with the technical developments and the numerous changes in the process of manufacturing automobile tires. TheBureau is indebted to P. W . Litchfield, president of the Goodyear Tire & Rubber Co.; T . G. Graham,vice president and general manager of B. F. Goodrich Co.; John W . Thomas, president of Firestone Tire& Rubber Co.; and F. B. Davis, Jr., president of United States Tire Co., for personal efforts in making this survey possible.
1
Digitized for FRASER http://fraser.stlouisfed.org/ Federal Reserve Bank of St. Louis

T a b l e 1.— Production and sales of tires, production and registration of automobiles, and number of renewal tires per car for specified yearsf 1918 to 1931
2 LABOR PRODUCTIVITY IN AUTOMOBILE TIRE INDUSTRY
Year
Number of tires
ProducedFor new equipment
For renewals
Totalsold
Number of automobiles
Produced RegisteredTotal requiring
tiresNum
ber
Renewal tires sold per registered car
Index(1926=
100)
1913.1914.1919.1920.1921.1922.1923.1924.1925.1926.1927. 19281929.1930.1931.
6, 600, 9, 000,
32, 835, 33, 000, 27, 298, 40, 930, 45, 241, 51, 633, 60, 855, 60, 725, 64, 537, 77, 940, 68, 724, 50, 966, 48, 497,
15. 977.00013. 535.00017. 400.00015. 985.00013. 025.00017. 700.00020. 957.00013. 631.000 9, 637,000
4, 675, 6, 725,
25. 100,24. 000,20. 500,30. 000, 29, 900, 34, 200, 37, 300,40. 100,47. 000,49. 500, 45, 847, 37, 965, 37, 310,
45. 877.00047. 735.00051. 700.00056. 085.00060. 025.00067. 200.00066. 804.00051. 596.00043. 947.000
485.000569.000
1. 934.0002. 227.0001. 682.0002. 646.0004. 180.0003. 758.0004. 428.0004. 506.0003. 580.0004. 601.0005. 354.0003. 509.0002. 460.000
1. 258.0001. 711.0007. 565.0009. 232.000
10. 465.00012. 240.00015. 092.00017. 595.00019. 954.00022.001.00023. 133.00024. 493.00026. 501.00026. 524.00025. 940.000
1. 743.0002. 280.000 9, 499,000
11. 459.00012. 147.00014. 886.00019. 272.00021. 353.00024. 382.00026. 507.00026. 713.00029. 094.00031. 855.00030. 033.00028. 400.000
3.723.93 3.31 2.60 1.2.451.1.94 1.81 1.82 2.03 2.021.731.431.43
204.40 215.94 181.87 142.86 107.69 134.62 108.79 106.59 102.75 100.00 115.38 110.9995.0578.5778.57
From 1923 through 1926 the average number of renewal tires purchased per registered car gradually diminished. During 1927 and1928 the average rose considerably, to a figure above that of 1923, the cause being the rapid introduction in 1925 and 1926 of the balloon tire, the first manufactures of which apparently did not last as long as the average high-pressure tires of the previous years. Since 1928, however, the average number of renewal tires purchased per registered car has been diminishing even more rapidly, and in 1931 amounted to only 1.43 tires, as compared with the 1927 average of 2.03 tires and the 1923 average of 1.98 tires.
The principal cause of this reduction in the number of renewal tires per registered car has unquestionably been the better quality and longer life of the average tire produced. In 1914 the average guaranteed mileage per tire did not exceed 3,500 miles. In 1922 the average life of a cord tire was more than 8,000 miles, while in 1930 and 1931 the life of an average tire was conservatively estimated at between 15,000 and 20,000 miles. Constant improvement in the quality of the product may result eventually in the manufacture of tires that will last as long as the average automobile. In that case the largest source of the present demand for tires will be automatically eliminated and tire manufacturing will be reduced to a comparatively minor part of the automobile industry.
Growth of Tire Industry
The development and growth of the automobile-tire industry during the last decade is presented in table 2, compiled from census reports covering the period from 1921 to 1931,
Digitized for FRASER http://fraser.stlouisfed.org/ Federal Reserve Bank of St. Louis

CHAP. 1.— MANUFACTURING AUTOMOBILE TIRES 3T a b l e 2 .— Statistics of production for automobile-iire industry, for specified years,
1921 to 1931
Item 1921 1923 1925 1927 1929 1931
Number of establishments___ 178 160 126 109 91 54Number of wage earners______ 55,496 73,963 81,640 78,256 83,263 48,341
Average per establishment................................. 312 462 648 718 915 895
Amount paid in wages.......... $75,054,000 $1,352
$108,623,000 $120,614,000 $120,064,000$1,542
$127,082,000 $62,385,000Average per worker______ $1,469 $1,477 $1,526 $1,290
Number of tires produced:C asings.-............................ 27,298,000 45,425,000 58,784,000 63,550,000 69,765,000 48,989,000Solid tires--............... .......... 401,000 944,000 1,035,000 813,000 424,000 103,000Average per establish
ment.................................. 155,600 289,800 474,800 590,500 771,300 943,000Average per worker............ 499.1 626.9 732.7 822.5 843.0 1,015.5
Number of inner tubes produced-........- ............................ 32,082,000 57,229,000 77,388,000 70,855,000 74,043,000 47,728,000
Value of tires and tubes......... $496,123,000 $644,194,000 $925,002,000 $869,688,000 $676,364,000 $352,924,000Average per article----------- $17.91 $13.89 $15.46 $13.51 $9.63 $7.19
Value added by manufacture.. $204,569,000 $279,029,000 $3,776
$365,062,000 $370,467,000 $340,570,000 $221,036,000Average per worker______ $3,686 $4,472 $4,734 $4,090 $4,574
Percent earnings are of valueadded per worker____ _____ 36.68 38.90 33.03 32.58 37.31 28.20
In 1921, 178 establishments employing an average of 55,496 wage earners produced 27,298,000 pneumatic and 401,000 solid tires. In 1931, 54 establishments employing on the average 48,341 wage earners produced 48,989,000 pneumatic and 103,000 solid tires. During this period, therefore, the total number of establishments fell from 178 to 54. The total number of wage earners, however, rose gradually from 55,496 in 1921 to a maximum of 83,263 in 1929 and then abruptly declined to 48,341 in 1931. The rapid decrease in the number of establishments, accompanied by the substantial increase in the average number of wage earners employed, clearly indicates the extent of concentration which took place in the tire industry during the short period between 1921 and 1929. The concentration is still further emphasized by the rapidly growing output per establishment. In 1921 the average yearly production was 155,600 pneumatic and solid tires per establishment; in 1927 it was 590,500 tires; and in 1931,943,000 tires, or more than six times as much as in 1921.
Side by side with this large growth of output per establishment there was also registered a very large annual increase in the output per wage earner employed in the industry. In 1921 the average annual output per wage earner was 499.1 tires, in 1927 it was 822.5 tires, and in 1931 it was 1,015.5 tires, or more than twice that of 1921. This increase could not have been accomplished without a correspondingly large increase in man-hour output. A brief analysis of the man-hour productivity in the tire industry from 1914 to 1927 was published in the March 1930 issue of the Monthly Labor Review, in an article entitled, “ Productivity of Labor in 11 Manufacturing Industries.” Table 3, taken from that article, gives the index numbers of man- hours, of total production, and of output per man per hour, on the 1914 base. These figures were computed partly from data taken from census reports and partly, especially in the case of man-hours, from the employment data of the Bureau of Labor Statistics. The1927 index of man-hours was 197, the production index was 773, and the man-hour productivity index was 392. According to these figures the output per man per hour has nearly quadrupled from 1914 to 1927.
Digitized for FRASER http://fraser.stlouisfed.org/ Federal Reserve Bank of St. Louis

T a ble 3 .— Index numbers of man-hoursy production, and man-hour productivity in the rubber-tire industry, for specified years, 1914 to 1927
4 LABOR PRODUCTIVITY IN AUTOMOBILE TIRE INDUSTRY
[1914=100]
Year Man-hours
Production
Man-hourproductivity
Year Man-hours
Production
Man-hourproductivity
1914____ ________ ____ 100 100 100 1924 180207
608728739
338352366
1919_________ _______ _ 262 391 149 1925................1921__________________ 154 305 198 1926____________ 2021923__________________ 187 521 279 1927 197 773 392
Object and Scope of Present Survey and Methods Used
Since 1927 the increase in the labor productivity has been even more rapid than in the previous years. This is especially true of1930 and 1931, as shown by the fact that in 1931 the annual output per wage earner was 1,015.5 tires, as compared with 843 tires in1929 and 822.5 tires in 1927. This uninterrupted growth in the man- hour output in the tire industry caused the Bureau of Labor Statistics to undertake the present survey with the object, first, of measuring the actual extent of the increase in the labor productivity in the tire industry; second, of determining if possible the principal factors responsible for the increase in man-hour output; and finally, of estimating approximately the effects on labor employment in the industry produced by the increase in labor productivity. The sample covered by the survey consists of six major tire-manufacturing plants which were studied for a period from 1922 to 1931. In 1922 these six plants combined produced over 18,000,000 pneumatic tires, or 44.76 percent of the tires produced by the entire industry. In1931 the six plants produced slightly over 29,000,000 tires, or 59.80 percent of the 48,500,000 tires produced in the country. The percentage the sample forms of the total industry ranges from 44.26 (in 1925) to 59.80 (in 1931); this further emphasizes the degree of concentration which has taken place in the industry during the last decade and especially during the last 5 or 6 years.
T a b le 4 .— Tire production of 6 representative plants, as compared with total production of tire industry, 1922 to 1931
Year
Production of pneumatic tires Index numbers (1926=100)
Entire industry 1
6 representative plants Total
production
Production of 6
representative
plants
Percent sample forms of
total productionAmount
Percent of total
1922_______ _____________ ______________ 40,930,000 18,320,000 44.76 67.40 65.69 97.471923_____________ _______ _____ _____ _ 45,241,000 20,641,000 45.63 74.50 74.02 99.371924___________________________ ________ 51,633,000 23,182,000 44.90 85.02 83.12 97.761925____________________________________ 60,855,000 26,936,000 44.26 100.21 96.59 96.391926_________________ ____ _____________ 60,725,000 27,887,000 45.92 100.00 100.00 100.001927_____________ ____ - ____ __________ 64,537,000 31,311,000 48.52 106.28 112.28 105.661928__________________ ______ _________ _ 77,940,000 37,488,000 48.10 128.35 134.43 104.751929_________ _________ ________________ 68,724,000 37,783,000 54.98 113.18 135.49 119.731930.................... ............................................ 50,966,000 29,865,000 58.60 83.93 107.09 127.611931................................................ ............ 48,497,000 29,001,000 59.80 79.86 104.00 130.23
1 Based on statistics of Rubber Association of America, published monthly in India Rubber World.
Digitized for FRASER http://fraser.stlouisfed.org/ Federal Reserve Bank of St. Louis

Measuring Production
The United States Census Bureau and the tire trade use the number of tires, irrespective of size, as the unit for measuring output. The variation in the sizes of tires produced and in the number of plies used per tire, however, is so large as to render questionable the use of number of tires alone as a measure of output. The variation has been especially marked since 1926, when large trucks and busses began to use pneumatic tires. In all six plants covered by the survey the average weight of rubber compounded with fabric used in the production of pneumatic tires ranged from 15.44 pounds per tire (in 1924) to 22.93 pounds (in 1930). In the individual plants the variation was even greater, with a range in one plant specializing in the larger sizes of tires from 17.32 pounds per tire (in 1922) to 35.62 pounds per tire (in 1929), or more than 100 percent. The larger-size tires require not only more labor time on account of the extra amount of rubber and fabric handled, but also the use of a different method of building the body of the tire. In fact, the new process of building the tire on a flat or shoulder drum can be applied to tires only up to a certain size, beyond which the tire must be built by the old “ core” process.
It is apparent, then, that for an exact measurement of output some other criterion must be found. As a matter of fact, many individual plants prefer and use the weight of the rubber compounded with fabric as the unit for measuring their total production and particularly their man-hour output. Unfortunately this was not true of all the plants studied, and the Bureau of Labor Statistics therefore was compelled to use both units—number of tires produced and weight of rubber compounded with fabric.
“Man-Hours” Defined
The term “ man-hours” , as used in this survey, covers direct productive labor only, that is the labor directly and intimately involved in the process of production. Warehousemen, laboratory workers, foremen, checkers, timekeepers, etc., whose services are not directly involved in the process of tire making, are therefore not included in the figures for the man-hours used in this survey. It was not possible, however, for the Bureau to obtain strictly comparable figures on man-hours for all the six plants. While most of the plants had records showing separately the man-hours spent on direct productive labor, in two plants no complete segregation was made of such indirect labor as that of machinists, electricians, oilers, checkers, etc., whose labor time had therefore to be included in the man-hours for those two plants. Again, since not all of the plants could furnish separate man-hour data for the various departments of the plant, in some cases it was necessary to obtain these data from the pay rolls of the departments, on the basis of the average hourly earnings of the workers in each. During the period covered by the Bureau's survey (i.e., 1922 to 1931) so many changes have taken place in the plants as a whole, and especially in the make-up of the individual departments, as to render impossible any attempt to trace by departments the history of the changes in the plants. Instead, the entire process of tire manufacturing has been divided into three major parts, namely: (a) Preparation of the crude rubber, which
CHAP. 1.— MANUFACTURING AUTOMOBILE TIRES 5
Digitized for FRASER http://fraser.stlouisfed.org/ Federal Reserve Bank of St. Louis

includes washing, milling, compounding, and calendering the rubber and the fabric; (6) preparation of all the constituents of a tire (i.e., stock preparation) and the actual process of tire building (“ carcass” building); (c) vulcanization or curing of the tires and the finishing and final inspection of tires.
In preparing the statistics on man-hours for the individual plants, it thus became necessary not only to reclassify the data for various plant departments so as to fit them into one of the major divisions mentioned above, but at times even to break up the total labor time of any one department, assigning one part of it to one division and another to another division. For each plant the primary consideration was to keep the three major group divisions uniform for the entire period covered by the survey. On the other hand, while the figures of any one plant have thus been made comparable from year to year for the entire period, those of the different plants are not exactly comparable with each other. This, of course, precludes the possibility of comparing the productivity of one plant with that of another, especially since at a given time the industrial status of the individual plants has not been the same.
Productivity of Labor in the Industry
The average pneumatic tire produced in 1931 is very different from the average tire produced in 1926, and the latter in turn differed greatly from the tires produced in 1922 and in 1914. Year after year changes have been made in the style, shape, size, and weight of tires and in the quantity and proportion of raw materials used in their production. No standard of measurement is available by which the output of any one plant may be expressed in terms of output of another plant or the total output of any one year expressed in terms of the total output of another year. For this reason the data on labor productivity presented in this report do not measure precisely the actual changes in the total output or in the man-hour output in manufacturing pneumatic tires. The statistics here presented are based (1) on the total number of tires produced and (2) on the combined total weight of the rubber, chemical ingredients, and fabric used in the production of tires; these bases offer the closest approximation available for the measuring of changes in labor productivity in the manufacture of pneumatic tires.
Table 5 presents a composite production history of the six manufacturing plants studied. The table gives data for the actual production from 1922 to 1931, and index numbers of production, with the year 1926 as the base. In the index numbers shown, the year 1926 was selected as the base because of its relation to three important events in the tire industry:
(1) The change in the style of pneumatic tires produced. Balloon tires, although invented early in the twentieth century, did not make their appearance as standard automobile equipment until late in 1924. In 1925 high-pressure tires still predominated in production. By 1926 balloon tires represented nearly 50 percent of the total tire production and continued to gain very rapidly, so that by 1931 they constituted 86 percent of the total production. The history of tire manufacturing from 1926 to the present day, therefore, represents the history of the balloon tire, while from 1922 to 1926 the history was that primarily of the cord high-pressure tire.
6 LABOR PRODUCTIVITY IN AUTOMOBILE TIRE INDUSTRY
Digitized for FRASER http://fraser.stlouisfed.org/ Federal Reserve Bank of St. Louis

(2) The change in the process of building the body, or “ carcass” , of the tire. As early as 1919 some plants began to use the flat-drum process of manufacturing pneumatic tires, but it was not until 1925 that any large percentage of the tire manufacturers definitely adopted this process for the typical automobile tires. Since then the development of the process has been very rapid, and by 1931 only the very large bus and truck tires were built by the old hand or “ core” process. All other pneumatic tires are now built partly by the flat and partly by the shoulder drum process. Here again 1926 may be regarded as the dividing line between the old and the new processes, the core process predominating prior to that year and the flat-drum process thereafter.
(3) The 2 years, 1925 and, particularly, 1926 may be regarded as periods of more or less stable, normal production in the country as a whole, as well as in the automobile and tire industries.
CHAP. 1.— MANUFACTURING AUTOMOBILE TIRES 7
T a b l e 5*— Total and man-hour production in 6 representative plants and index numbers thereof, 1922 to 1981, by years
Total output Output per man-hour
AverIndex numbers (1926=100)
YearNumber of tires Pounds
Man-hours
workedTires Pounds
ageweight
pertire
Total outputMan-hours
Output per man-hour
Tires Pounds Tires Pounds
1922___ 18,320,000 295,222,000 26,165.000 0.70 11.28Lbs.16.12 65.69 58.57 85.99 76.34 68.46
1923___ 20,631,000 324.544.000357.863.000
26,431,000 .78 12.28 15.73 73.98 64.71 86.87 85.17 74.501924___ 23,182,000 28,161,000 .82 12.71 15.44 83.13 71.36 92.55 89.75 77.101925____ 26,936,000 466,238,000 33,860,000 .80 13.77 17.31 96.59 92.97 111.28 86.80 83.551926.... 27.887.000
31.311.000501, 513,000 30,427,000 .92 16.48 17.98 100.00 100.00 100.00 100.00 100.00
1927____ 599,642,000 31,867,000 .98 18.82 19.15 112.28 119.57 104.73 107.20 114.171928____ 37,488,000 752,333,000 35,885,000 1.05 20.97 20.07 134.43 150.01 117.94 113.96 127.201929___ 37,783,000 801,725,000 35,167,000 1.07 22.80 21.22 135.49 159.86 115.58 117.12 138.321930___ 29.865.000
29.001.000684.645.000648.648.000
26,166,000 1.14 26.17 22.93 107.09 136.52 86.00 124.43 158.751931___ 21,150,000 1.37 30.67 22.37 103.99 129.34 69.51 149.51 186.08
In 1922 the six manufacturing plants covered by table 5 produced18.320.000 tires whose combined weight (rubber compounded with fabric) was 295,222,000 pounds. From that year until 1929 there was a steady increase in the number of tires produced and a still larger increase in the total weight of the tires, due to the increase in the average size of tires produced. In 1929 these plants produced37.783.000 tires, the largest number of tires produced by them in any one year. There was a large decline in the number of tires produced in 1930, but in 1931 the total number of tires produced by the six plants was only slightly smaller than their 1930 output. Expressed in index numbers, with 1926 as a base, the total output, measured by the number of tires produced, rose from 65.69 in 1922 to a maximum of 135.49 in 1929, then declined to 107.09 in 1930 and 103.99 in 1931. Notwithstanding the decline in 1931, the index for that year is more than one and a half times as high as that of 1922. Measured by the weight of output, the index rose from 58.57 in 1922 to a maximum of 159.86 in 1929 and then declined to 136.52 in 1930 and 129.34 in 1931, which is more than twice the index for 1922.
Digitized for FRASER http://fraser.stlouisfed.org/ Federal Reserve Bank of St. Louis

In 1922 the total direct productive labor time required for the manufacture of pneumatic tires in these six plants amounted to26,165,000 man-hours. The peak in direct productive labor time expended was reached in 1928, when 35,885,000 man-hours were required. In 1929 the number of man-hours worked declined, in spite of the small increase both in total number of tires produced and in weight of product. There was a very large decline in the number of man-hours worked in 1930 and another substantial decline in 1931, notwithstanding the fact that in 1931 the total output of the six plants (measured either by number of tires or weight of product) registered only a slight decrease as compared with 1930. Expressed in index numbers on the1926 base, the productive labor time expended rose from 85.99 in 1922 to 111.28 in 1925. In 1926 it fell to 100 and then rose again to117.94 in 1928, which is the highest index of man-hours for the entire period. It declined to 115.58 in 1929 and then suffered a very large decline to 86 in 1930, and still another large decline in 1931, when the index of man-hours stood at 69.51, the lowest for the entire period covered by the survey.
The output per man per hour, measured in terms of tires produced, rose from 0.70 tire in 1922 to 0.82 tire in 1924. It declined to 0.80 tire in 1925, a circumstance which can be attributed to the experimentation with balloon tires, which made their first appearance late in 1924. Beginning with 1926, the man-hour output showed a continuous rise, somewhat slow until 1929, but accelerating decidedly in 1930 and particularly in 1931. The increase is even more noticeable if the man-hour output is measured in terms of weight. In 1922 the average output per man per hour was 11.28 pounds. In 1925, although the number of tires produced per man-hour declined slightly, there was a considerable increase in the number of pounds produced per man-hour. This, of course, was due to the fact that the balloon tire required a larger amount of rubber and fabric than the average high- pressure tire. From 1926 through 1931 the output in pounds per man-hour showed a trend similar to that of the man-hour output of tires, but the increase was more rapid. Thus, from 1926 to 1927 the index of man-hour output of tires rose 7.20 points, while that of man- hour output in pounds rose 14.17 points. From 1930 to 1931 a very considerable rise occurred in man-hour output, the index of tire output registering a gain of 25.08 points and that of pounds output a gain of 27.33 points. During the period from 1922 to 1931 the man-hour output of tires has nearly doubled and that of pounds nearly tripled.
The present survey included a number of years already covered in a previous analysis by the Bureau of Labor Statistics. In the earlier study 1914 was taken as the base year. Table 6 shows index numbers of the total and man-hour output of the six manufacturing plants on the 1914. base.
8 LABOR PRODUCTIVITY IN AUTOMOBILE TIRE INDUSTRY
Digitized for FRASER http://fraser.stlouisfed.org/ Federal Reserve Bank of St. Louis

T a b l e 6 .— Index numbers of total and man-hour output and of labor time required in 6 representative plants, 1914 to 1981
CHAP. 1.— MANUFACTURING AUTOMOBILE TIRES 9
[1914=100]
YearTotal output Man-
hours
Output per man- hour
Tires Poundsworked
Tires Pounds
1914_________________________ ______ ______________ 100.00 100.00 100.00 100.00 100.00250.561922________ ______ ____________ _____ _____________ 485.45 432.83 173.70 279.40
1923______ ______________________ ________ _________ 546.71 478.21 175.48 311.72 272.671 9 2 4 ________ ____________ ________ _______________ 614.33 527.35 186.95 328.49 282.191926___ __________ _____ ___________________________ 713.80 687.05 224.79 317.69 305.791926-___________________ ____________________ ____ 739.00 739.00 202.00 366.00 366.00
417.86 465.55 506.25
1927-..........— __________ ___________________________ 829.75 883.62 211.55 392.351928-_____ _________________________________ ____ _ 993.44 1,108.57 238.24 417.091929_______ _______ ________________________________ 1,001.27
791.401,181.37 1,008.88
955.82
233.47 428.661930__________ __________________ _____ ____________ 173.72 455.41 581.031931_________ ____ _________________________________ 768.49 140.41 547.21 681.05
The index of the total tire output of the six plants covered by the present survey and measured by the number of tires produced rose from 100 in 1914 to 1,001.27 in 1929, then receded to 791.40 in 1930 and to 768.49 in 1931. The index of the weight output rose from 100 in 1914 to a maximum of 1,181.37 in 1929 or nearly 12 times the 1914 figure. It then receded to 1,008.88 in 1930 and to 955.82 in 1931, which is still nearly 10 times as high as in 1914. That the total direct productive man-hours worked did not keep pace with the total output may be seen from the fact that the peak index number for man-hours (238.24 in 1928) was not quite two and a half times the 1914 figure. Since 1928 the labor time required has rapidly diminished, reaching in 1931 an index of 140.41, only 40 percent over 1914, whereas in the same year the tire-production index stood at 668 percent and the weight-production index at 856 percent above1914\This contrast in pace between total production and total man- hours was due chiefly to the tremendous increase in the output per man-hour which took place during the period from 1914 to 1931. The tire output per man-hour rose from an index of 100 in 1914 to 279.40 in 1922 and to 547.21 in 1931. The weight output per man- hour rose from an index of 100 in 1914 to 250.56 in 1922 and to 506.25 in 1929. Between 1929 and 1930 an increase of nearly 75 points occurred (the index rising to 581.03); and between 1930 and 1931, an increase of more than 100 points (rising to 681.05), the largest yearly increase shown in the period covered by the survey. The upward trend of man-hour output has thus continued from year to year quite irrespective of the trend in the total production or of the total man-hours worked. Man-hour productivity, which rose while total output and total man-hours worked were increasing, continued to do so at an even faster pace after total output and labor time began to fall, thus indicating a greater reduction in labor time requirements per unit of output during periods of reduced than in periods of increased production.
Digitized for FRASER http://fraser.stlouisfed.org/ Federal Reserve Bank of St. Louis

Productivity of Labor in Individual Plants
Table 7 presents data for the individual plants on a similar basis as the composite statistics for all 6 plants (table 5). The total output and the number of man-hours worked in each plant are omitted in order to preclude the possibility of recognizing the individual plants through their output. The data given for actual production merely cover the output per man per hour in the number of tires produced and the weight of rubber compounded with fabric.
In analyzing and comparing the statistics for the individual plants, it must be emphasized that the industrial progress and the rate of growth of these plants were decidedly different. One plant may have reached a high degree of development in 1926, the base year in this survey. Consequently, its rate of progress since then could not have been as rapid as that of another plant which was in a comparatively lower stage of development in 1926. The present survey deals primarily with the problem of change in development rather than with the question of the industrial status of the individual plants. It is quite feasible, therefore, that a certain plant which may in the present survey show a very high index of change should in reality have a lower man-hour output than another plant with a much lower rate of change. The order of presentation of the individual plants is according to the 1931 index of man-hour output of the plant rather than the actual man-hour output, commencing with the plant with the highest index for that year.
The data for plant l 2 cover a period from 1922 to 1931. In 1922 the average output per man per hour was 0.42 tire or 7.38 pounds of rubber compounded with fabric; in 1931 the man-hour output was 1.34 tires or 29.20 pounds of rubber. Expressed in index numbers, with 1926 as 100, the output per man per hour for this plant measured by number of tires produced rose from 57.84 in 1922 to 182.26 in 1931, and in terms of rubber compounded with fabric from 53.58 in 1922 to 212.09 in 1931. The output per man per hour has more than doubled since 1926 and nearly quadrupled since 1922. In comparing the indexes, it will be noticed that while the total output has nearly tripled in the number of tires and nearly quadrupled in the weight of the tires produced during the last 10 years, the number of man-hours has actually been reduced, with the 1931 index for man-hours lower than the corresponding index for 1922. In fact, at no time during this decade has the index for man-hours risen above that of 1922, in spite of the tremendous increases in the total production and in the output per man per hour.
The statistics for plant 2 are for the period from 1921 to 1931. The output per man-hour in this plant rose from 1.42 tires in 1922 to1.86 tires in 1931 or from 17.51 pounds of rubber compounded with fabric in 1922 to 34.19 pounds in 1931. The index of the total tire output rose from 67.97 in 1922 to 184.17 in 1929, and then receded to 116.13 in 1931. That of the total weight output rose from 60.81 in 1922 to 227.60 in 1929 and then receded to 155.48 in 1931. The man-hour index rose from 58.34 in 1922 to 158.14 in 1929, dropped nearly 57 points in 1930, and then dropped again more than 25 points in 1931, when the index went down to 76.39. In 1931, therefore, with
8 Identical plant numbers throughout the bulletin do not signify identical plants.
10 LABOR PRODUCTIVITY IN AUTOMOBILE TIRE INDUSTRY
Digitized for FRASER http://fraser.stlouisfed.org/ Federal Reserve Bank of St. Louis

a reduction of nearly 24 percent in the productive labor time, this plant produced 16 percent more tires and handled 55 percent more rubber compounded with fabric than in 1926. The difference in the trends between the man-hours and the total production is of course due to the very large increases in the man-hour output registered by this plant, particularly in the last few years. There had been comparatively little change in the output per man per hour from 1922 to 1927, but since then the change has been very rapid, and in 1931 the tire output per man per hour was 52 percent and the man-hour weight output 104 percent higher than in 1926.
The man-hour output of plant 3 varies from 0.85 tire or 9.62 pounds of rubber compounded with fabric in 1919 to 2.44 tires and 39.22 pounds in 1931. With 1926 as a base, the total tire output ranges from 45.26 (in 1921) to 172.40 (in 1929); the index for 1931 is 122.81, which is 23 percent higher than that of 1926 and more than twice as high as that for 1919. The index for the total weight output ranges from 41.78 (in 1921) to 198.05 (in 1929); for 1931 the index (153.36) is more than 50 percent higher than that for 1926 and more than three times as high as that for 1919. The index for total man-hours rose from 43.82 (in 1921) to 125.92 (in 1929). The 1931 index for man-hours (80.46) is 20 percent lower than that for 1926 and 25 percent lower than that for 1919. The tire output per man-hour rose rapidly from 53.10 in 1919 to 103.32 in 1921. It then rose more slowly to 108.15 in 1924 and registered a substantial decline in 1925, when the index was 86.83. A slow recovery until 1927 was followed by a more rapid growth, the index rising to 144.76 in 1929. Its 1931 index (152.66) is more than 50 percent higher than that for 1926 and nearly three times as high as that for 1919. Measured by the weight of rubber compounded with fabric, the man-hour-output index follows a somewhat similar line as the corresponding tire index. In 1931 it was 90 percent higher than in 1926 and more than four times as high as in 1919. This accounts for the fact that in 1931, with a reduction of 20 percent in the actual man-hours worked, as compared with 1926, this plant could increase its total output 53 percent above that of 1926.
In plant 4 the actual output per man-hour varies from 0.33 tire or 6.84 pounds of rubber compounded with fabric in 1919 to 1.07 tires or 32.86 pounds in 1931. The average weight per tire in this plant ranges from 18.88 pounds per tire (in 1924) to 30.63 pounds per tire (in 1930). With 1926 as a base, the index of the total tire output ranges from 38.01 (in 1921) to 150.15 (in 1928); its 1931 index is 90.02. The index for the total weight output ranges from 36.62 (in 1921) to 172.28 (in 1929); its 1931 index is 122.20. The index for the total man-hours in this plant ranges from 67.09 (in 1921) to 183.82 (in 1919). In 1928 its index was 138.69, the highest since 1920, but the 1931 index of 69.16 is only 2 points higher than the lowest index for the entire period. In 1931 this plant, with a labor time which was 31 percent less than in 1926, produced a total weight output which was 22 percent larger than that of 1926.
Even more significant is the contrast between 1931 and 1919. In 1931, with a labor time which was just a little more than one third of that of 1919, this plant produced a tire output which was more than 23 percent larger than in 1919 and nearly doubled the 1919 weight output. This contrast is due to the tremendous change in the output per man-hour which has occurred in this plant. With 1926 as a base,
CHAP. 1.— MANUFACTURING AUTOMOBILE TIRES 11
Digitized for FRASER http://fraser.stlouisfed.org/ Federal Reserve Bank of St. Louis

the index of man-hour tire output shows a continuous rise from 39.88 in 1919 to 130.19 in 1931. On the same basis, the man-hour index of weight output rose from 36.78 in 1919 to 176.68 in 1931. The output per man-hour has thus more than tripled from 1919 to 1931 if measured in the number of tires produced, and nearly quintupled in the weight of the rubber compounded with fabric used in the production of tires.
The actual man-hour output in plant 5 varies from 0.47 tire, or 7.91 pounds of rubber compounded with fabric in 1920, to 1.45 tires, or 33.19 pounds of rubber compounded with fabric in 1931. The average weight of rubber and fabric used per tire ranges from 15.44 pounds per tire (in 1924) to 23.34 pounds (in 1930). With 1926 as 100, the index for the total tire output of this plant rose from 39.22 in 1921 to 147.29 in 1928 and receded to 81.08 in 1931. On the same basis the index of the total weight output rose from 37.99 in 1921 to 158.39 in1928 and receded to 105.99 in 1931. The index of the total man- hours worked ranges from 60.08 (in 1931) to 151.88 (in 1920). In1928, when the index for the total production was at a maximum, the man-hour index was 133.02. In 1931 this index was 10 points lower than that for 1921, although the index for the total tire output was more than twice and that for total weight nearly three times as high as in 1921.
The man-hour output of this plant, measured by the number of tires produced or by the weight of the tires, shows a steady and continuous growth. The index of tire output rose from 43.87 in 1920 to134.94 in 1931; the corresponding index of weight output rose from 42.02 to 176.41. During this period, therefore, from 1920 through 1931, the output per man per hour has been more than tripled in the number of tires produced and more than quadrupled in weight.
In plant 6 the actual tire output per man per hour in 1931 was exactly the same as 1922, namely 0.60 tire, but the man-hour weight output rose from 10.39 pounds of rubber compounded with fabric in 1922 to 19.40 pounds in 1931. The average weight per tire produced in this plant ranges from 17.32 pounds (in 1922) to 35.62 pounds per tire (in 1929), a variation of more than 100 percent. This plant specializes in the production of very large sizes of tires. With 1926 as 100, the index for total tire output of this plant ranges from 49.33 (in 1931) to 100 (in 1926). The corresponding index for total weight output ranges from 52.52 (in 1922) to 122.99 (in 1929). The index for man-hours in this plant ranges from 46.99 (in 1931) to 105.53 (in 1929). The index for the man-hour tire output declined from 105.63 in 1922 to 93.13 in 1925. In 1926 it rose to 100 and then again steadily declined until 1929, when the index was at its lowest, namely 71.13." Since then the index has been rising rapidly and in 1931 it stood at 104.93, which is slightly lower than the highest index, 105.63, registered in 1922. The corresponding index of man-hour weight output followed an entirely different trend. It was at its lowest in 1922, with an index of 84.07, and rose continually until 1928, when the index was 126.92. In 1929 it registered a decline of more than 10 points but recovered again and rose to 133.55 in 1930 and 156.98 in 1931, which is the highest index for the entire period. The contrast between the two indexes for the man-hour output is due chiefly to the large percentage of very large tires produced in this plant.
12 LABOR PRODUCTIVITY IN AUTOMOBILE TIRE INDUSTRY
Digitized for FRASER http://fraser.stlouisfed.org/ Federal Reserve Bank of St. Louis

CHAP. 1.— MANUFACTURING AUTOMOBILE TIRES 13T a b l e 7*—Actual man-hour production and index numbers of total and man-hour
production in specified plants, 1919 to 1981, by years
Index numbers (1926=100)
Plant number and year
output/ perman-hour Aver
ageweight
pertire
Total output
Man-hours
Output per man-hour
Number of tires
Pounds Tires Pounds Tires Pounds
Plant 1:1922............................— ............ 0.42 7.38
Pounds17.41 70.05 64.99 121.31 57.84 53.58
1923______ ____ - ..................... ........ .47 7.76 17.06 73.40 2 66.73 1115.64 63.57 2 56.391924...................... — ------------------- .54 8.44 15.64 79.57 66.30 108.13 73.67 61.321925____________ ______ _________ .69 11.92 17.37 103.18 95.49 110.31 93.59 86.561926— ............... ................................ .73 13.77 18.77 100.00 100.00 100.00 100.00 100.001927_____ _____ ________ ________ .72 14.39 19.89 75.97 80.48 77.01 98.77 104.521928.____ ______ ____ ______ ____ .74 16.21 21.80 104.16 120.94 102.72 101. 50 117.741929..........— ............ ................... — .84 18.77 22.33 100.42 119.45 87.64 114.60 136.291930____________________ _____ .98 22.29 22.76 148.84 180. 43 111. 45 133. 56 161.891931______ ________ _____________ 1.34 29.20 21.86 204.44 238.12 112.27 182. 26 212.09
Plant 2:(3)1921________ ______ — ............ . <3) 15.77 (3) 58.93 62.77 (3) 93.89
1922............................... ..................... 1.42 17.51 12.30 67.97 60.81 58.34 116. 53 104.231923_____________________________ 1.46 17.92 12.30 92.94 83.15 77.94 119. 23 106.691924_________ ____ ______________ 1.44 17.65 12.26 93.83 83.70 79.66 117. 76 105.081925______ __________ ______ 1.27 17.76 13.96 100.61 102.12 96.59 104.17 106,731926________ ________ ___________ 1.22 16.80 13.75 100.00 100.00 100.00 100.00 100.001927______ _____________________ 1.22 17.56 14.35 132.98 138.82 132.78 100.16 104.151928____________ ____ ___________ 1.32 20.25 15.30 146.84 163.44 135. 57 108. 27 120. £61929................................................- 1.42 24.18 16.99 184.17 227. 60 158.14 116.45 143.921930...................................- ......... 1.56 29.44 18.90 129.97 178.68 101.95 127.41 175.261931............... ............................ ......... 1.86 34.19 18.41 116.13 155.48 76.39 152.05 203.54
Plant 3:1919_____________________________ .85 9.62 11.36 56.23 49.53 105.92 53.10 46.761920_____________________ _____ - 1.06 11.72 11.04 54.33 46.51 81.63 66.58 56.981921_____________________________ 1.65 19.62 11.91 45.26 41.78 43.82 103.32 95.361922______________________ ______ 1.64 18.98 11.55 60.86 54.51 59.11 103.01 92.221923__________________ _____ ____ 1.70 19.67 11.56 77.56 69.49 72.70 106.71 95.581924____ ________________________ 1.73 20.05 11.62 81.90 73.82 75.75 108.15 97.451925_____________________________ 1.39 17.04 12.31 87.84 83.81 101.19 86.83 82.831926-..-_____ ___________________ 1.60 20.58 12.90 100.00 100.00 100.00 100.00 100.001927_____ ____ __________________ 1.68 22.45 13.34 109.67 113.41 103.97 105. 52 109.081928_____________________________ 2.00 28.56 14.26 157.98 174.76 125.92 125.52 138.791929_____________________________ 2.31 34.21 14.81 172. 40 198.05 119.14 144.76 166.231930______________________ _____ - 2.37 36.67 15.47 127.60 153.07 85.89 148.59 178.221931_____________________ _____ - 2.44 39.22 16.11 122.81 153.36 80.46 152.66 190.60
Plant 4:1919______ ____ — ...................— .33 6.84 20.80 73.30 67.62 183.82 39.88 36.781920_____________________________ .36 7.33 19.95 64.18 56.77 145.70 44.00 45.441921_____________________________ .47 10.15 21.73 38.01 36.62 67.09 56. 61 54. 581922________________________ ____ .54 11.66 21.43 63.39 60.24 96.10 65.94 62.691923_____________________________ .59 12.78 21. 75 60.11 57.99 84.42 71.16 68.681924_____________________________ .65 12.32 18.88 72.34 60.57 91.43 79.16 66.241925_____________________________ .67 14.00 20.95 94.36 87.66 116.48 80.97 75.251926_____________________________ .83 18.60 23.13 100.00 100.00 100.00 100.00 100.001927_____________________________ .85 20.85 24.51 119.13 129.51 115. 55 103.04 112.081928_____________________________ .89 22.90 25.64 150.15 170.75 138.69 108.25 142.031929_____ _______________________ .94 25.55 27.20 142.83 172. 28 125.41 113.82 137. 371930_________ _____ _____________ .98 29.91 30.63 108. 30 147.10 91.47 118.30 160.811931............... - ------------------------------ 1.07 32.86 30.61 90.02 122.20 69.16 130.19 176.68
Plant 5:1920_____________________________ .47 7.91 16.76 66.62 63.82 151.88 43.87 42.021921_____________________________ .60 10.12 16.94 39.22 37.99 70.61 55.58 53.811922_____________________________ .65 10.78 16.60 67.98 64.50 112.57 60.41 57.301923_____________________________ .77 12.01 15.60 76.87 65.58 107.42 71. 56 63.841924_____________________________ .83 12.79 15.44 94.46 83.40 122.70 76.95 67.971925_____________________________ .82 13.94 17.10 102.90 100.62 135.84 75.74 74.071926______ ____ _________________ 1.08 18.82 17.49 100.00 100.00 100.00 100.00 100.001927_____________________________ 1.17 21.58 18.41 135.42 142.54 124.30 108.92 114.681928_____ _______________________ 1.19 22.41 18.81 147.29 158.39 133.02 110.69 119.071929________________________ ____ 1.21 24.38 20.12 132.66 152.61 117.80 112.64 129.551930_____________________________ 1.19 27.78 23.34 91.87 122.65 83.07 110.59 147.661931— ____ ______ ______ _______ 1.45 33.19 22.86 81.08 105.99 60.08 134.94 176.41
1 Index for man-hours, inclusive of solid tires, is 118.32.2 Includes some production of solid tires, which is not included in the man-hours.3 Not available.
171867°—33------2
Digitized for FRASER http://fraser.stlouisfed.org/ Federal Reserve Bank of St. Louis

14 LABOR PRODUCTIVITY IN AUTOMOBILE TIRE INDUSTRY
T a b le 7 .— Actual man-hour production and index numbers of total and man-hour production in specified plants, 1919 to 1931, by years— Continued
Index numbers (1926=100)
Plant number and year
man-hour Average
weightpertire
Total output
Man-hours
Output per man-hour
Number of tires
Pounds Tires Pounds Tires Pounds
Plant 6:1922____________ ________ _______ 0.60 10.39
Pounds17.32 66.00 52.52 62.47 105.63 84.07
1923___________ _______ _________ .55 10.41 18.62 66.07 57.18 67.87 97.36 84.251924_________________ _____ _____ .56 10.68 18.98 74.57 65.00 75.24 99.12 86.391925....................................... .......... . .53 11.11 20.99 93.20 89.94 100.07 93.13 89.881926____________ ________ _______ .57 12.36 21.77 100.00 100.00 100.00 100.00 100.001927_____ _______________________ .56 14.44 26.03 86.32 103.22 88.33 97.71 116.851928........................................ .......... .53 15.69 29.88 84.30 115.73 91.19 92.43 126.921929...................................... .............. .40 14.40 35.62 75.18 122.99 105.53 71.13 116. 551930.................... .................... .......... .49 16.51 33.68 56.46 87.33 65.38 86.27 133.551931_______ _____________________ .60 19.40 32.55 49.33 73.77 46.99 104.93 156.98
Digitized for FRASER http://fraser.stlouisfed.org/ Federal Reserve Bank of St. Louis

C h a p ter 2.—Technological Displacement of Labor in the Tire Industry
In spite of its frequent use in economic literature and elsewhere, the phrase “ technological displacement of labor” has not yet been clearly defined and has not always been given the same meaning. To the average reader it conveys something synonymous with unemployment, except that it also brings with it a vaguely conceived notion of the cause of unemployment. Sometimes technological displacement of labor is defined to signify the actual elimination of a definite job by a mechanical process, with or without resulting unemployment for the particular workers formerly engaged in doing the work now performed by a machine. Attempts have been made to measure the technological displacement of labor, or as it is sometimes called “ job opportunities lost,” by comparing the actual number of workers employed with those which would have been required to produce the total output of a given year with the technology or state of mechanical arts of some previous year taken as a base. This method of calculation assumes that the changes in the total volume produced could and would have taken place in a world with a stationary technology. It is obvious that the longer the span of time elapsing between the two periods compared, the larger the “ job opportunities lost” would be. Conceivably these can be enlarged indefinitely, provided the base is far enough removed from the year for which the employment comparisons are made. The fallacies of this method of calculating the volume of labor displaced were disclosed as early as 1830 in a pamphlet anonymously written and entitled “ The Results of Machinery.” In discussing the effects of the water-pipe system on the employment of water carriers in the city of London, the writer says:1
At 2 pence a gallon, which would not have been a large price considering the distances to which it must have been carried, the same supply of water would have cost about 9 millions of pounds sterling a year, and would have employed, at the wages of 2 shillings a day, more than one half of all the present inhabitants of London, or 800,000 people, that is, about four times the number of able-bodied men altogether contained in the metropolis. Such a supply, therefore, would have been utterly out of the question. To have supplied 1 gallon instead of 200 gallons to each house at the same rate of wages, would have required the labor of 12,000 men. It is evident that even this number could not have been employed in such an office because, had there been no means of supplying London with water but the means of human hands, London could not have increased to one twentieth of its present size—there would not have been one twentieth part of the population to have been supplied— and therefore 600 water carriers would have been ample proportion to this population.
Displacement of Labor Defined and Measured
In order to understand clearly the real meaning of technological displacement of labor, it is necessary to analyze the conditions under which technological changes are effected in a plant and the influence
i The Working-Man’s Companion. American ed., New York, 1830, pp. 85, 86: Results of Machinery, etc.
15
Digitized for FRASER http://fraser.stlouisfed.org/ Federal Reserve Bank of St. Louis

they exert upon the employment situation in the plant. Technological changes, or rather technological improvements (sine© all changes are for the sake of improvement), include any and all changes in the nature of the product, method of production, type of labor, hours of work, machinery and equipment used, etc., which result either in an improvement in the quality of the article produced or in an increase in the output per unit of labor time. It is conceivable that an improvement in the quality of the product may readily result in a decrease in the output per unit of labor time, thus actually increasing the volume of labor required for its production. Usually, however, the object of improved technology is to reduce the labor costs of operation. The reduction is measured by the difference in the labor requirements per unit of output before and after the change in technology took place, which may or may not result in the immediate elimination of jobs or workers from the plant. It produces a surplus of labor time, and unless there is a corresponding increase in the total output, some workers will eventually be eliminated as a direct result of the technological change.
Increased output per unit of labor time and increased total production are not entirely independent of each other. A reduction in the labor cost of production may bring with it as a consequence an increase in the total output; and similarly an increased total output may pave the way for further reductions in the labor cost of production. From the point of view of employment, however, the two factors are at constant war with one another, the increased output per unit of labor time displacing labor and the increased total production putting labor back to work. Given a constant supply of labor, it is left entirely to the struggle between these two factors to decide whether at any one time there shall be a shortage or a surplus of labor in the particular industry concerned.
The employment situation from 1921 through 1931 of the six representative tire plants included in the present survey is shown in table 8. The average number of wage earners in the six plants showed a continuous increase from 1921 through 1929, dropped in 1930, and took another substantial fall in 1931, though not so large a one as during the previous year.T a b l e 8 .— Number of employees, and index numbers thereof, in 6 tire plants, 1921
to 1931
16 LABOR PRODUCTIVITY IN AUTOMOBILE TIRE INDUSTRY
Year
Employees in 6 tire plants
Monthly average1
Indexnumber
(1926=100)
19212................................................... . 23,423 28,598 32,465 32,191 39,593 38,897 40,665 42,637 45,453 35,815 29,756
60.22 73.52 83.46 82.76
101.79 100.00 104.55 109.61 116.85 92.07 76.50
1922...........................................................1923_____________ _________ _____1924............................... ...........................1925.................... ......................................1926............................................. ........1927...... .................................................1928______ ________ _________________1929____________ _____ ____________1930........... ...................... ............ ............1931___________________ _________ _
i Covers all employees, including those working on tires, tubes, and miscellaneous rubber products. » Last 6 months only.
Digitized for FRASER http://fraser.stlouisfed.org/ Federal Reserve Bank of St. Louis

In this connection it should be pointed out that the situation as regards the wage earners in the six plants covered does not fairly represent that in the manufacture of tires. The census figures of employment for the whole industry, given elsewhere, cover the workers engaged in the manufacture of tires and tubes only. The plants covered by the Bureau’s survey, however, produce not only tires but also other rubber products, such as rubber belts, hose, heels, drug and miscellaneous sundries, and the employment figures shown in table 8 also include those working on the other articles mentioned. As some of these articles were not produced during the entire period covered by the survey, the figures of labor enrollment in the six plants are therefore not strictly comparable from year to year. Again, during 1930 and 1931, few of the plants worked full time, some averaging not over 3 days per week. For these reasons the total labor enrollment figures in the six plants, while reflecting the general employment situation there, may not represent the situation due to conditions in the production of tires only.
A much better barometer for the measurement of the reduction in the total labor time required in these six plants is afforded by the actual total man-hours worked in the production of tires. The combined and separate effects of improved technology and increased total production upon the employment of labor from 1922 through 1931, in terms of man-hours worked in the six tire plants, are shown in table 9. In column 5 are given the man-hours which were required to produce the differential in the annual output shown in column 4 at the average rate of production for that year. Column 6 shows the actual annual changes in the total man-hours worked, which are derived by subtracting from the total man-hours worked during any one year the man-hours of the preceding year. The difference between the actual changes in the total man-hours worked and the corresponding increases or decreases in the man-hours caused by the changes in the total output represents the reduction in the total labor time caused by technological changes and constitutes the total volume of labor displaced, which is shown in column 7.
CHAP. 2.— TECHNOLOGICAL DISPLACEMENT OF LABOR 17
T a b l e 9.— Actual production and volume of technological labor displacement in 6 representative tire plants, 1922 to 1981, by years
Year
ActuaJ productionIncrease or decrease com
pared with previous year in— Net increase
or decrease in man- hours
6
Technological
displacement, in
man- hours
7
Total output
1
Total man- hours
2
Outputper
man-hour
3
Total output
4
Man-hours, caused by change in
total output5
1922Pounds
295.222.000324.544.000357.863.000466.238.000501.513.000599.642.000752.333.000801.725.000684.645.000648.648.000
26.165.00026.431.00028.161.00033.860.00030.427.00031.867.00035.885.00035.167.00026.166.000 21,150,000
Pounds 11.28 12.28 12.71 13.77 16.48 18.82 20.97 22.80 26.17 30.67
Pounds
192 3 .192 4 .192 5 ........192 6 .192 7 ............ .192 8 ............192 9 _______193 0 .................193 1 ______ _
Cumulative effects, 1922-311
+29,322,000 +33,319,000
+108,375,000 +35,275,000 +98,129,000
+152,691,000 +49,392,000
-117,080,000 -35,997,000
+353,426,000
+2,388,000 +2,622,000 +7,870,000 +2,140,000 +5,215,000 +7,283,000 +2,167,000 -5,135,000 -1,376,000
+23,174,000
+266,000 +1,730,000 +5,699,000 -3,433,000 +1,440,000 +4,018,000
-718,000 -9,001,000 -5,016,000
-5,015,000
2,122,000 . 892,0002.171.0005.573.0003.775.0003.265.0002.885.0003.866.0003.640.000
28,189,000
i Result obtained by subtracting total decrease from total increase.
Digitized for FRASER http://fraser.stlouisfed.org/ Federal Reserve Bank of St. Louis

In 1922 the six plants combined used 295,222,000 pounds of rubber compounded with fabric in the production of pneumatic tires. With an expenditure of 26,165,000 man-hours they averaged 11.28 pounds per man-hour. In 1923 the total production was increased by29.322.000 pounds. To produce this increase at the rate of 12.28 pounds, which was the average man-hour output of that year, the six plants would have required an addition of 2,388,000 man-hours. In reality, however, they worked only 266,000 man-hours more than in1922. The difference of 2,122,000 man-hours between the net increase in the labor time and the increase necessitated by the change in the total output represents the volume of labor displaced in the six plants by the technological changes which enabled them to increase the man-hour output from 11.28 to 12.28 pounds.
The continuous rise in the man-hour output of the six representative tire plants from 1922 through 1931 indicates that technological changes have taken place in these plants continually. From 1922 through1929 there has also been a continuous annual increase in the total volume of production, which with one exception proved not only sufficient to reabsorb the surplus labor time caused by the technological changes, but actually resulted in net increases in the total labor time worked. In 1926 the increase of 35,275,000 pounds in the total output required at the rate of 16.48 pounds per man per hour, an increase of 2,140,000 man-hours. The net result, however, was a decrease of 3,433,000 man-hours. This was due to the fact that in increasing the man-hour output from 13.77 pounds per man-hour in1925 to 16.48 pounds in 1926 the technological changes caused a total labor displacement of 5,573,000 man-hours.
In 1927 and in 1928 the very large annual increases in the total output of the six plants were not only sufficient to reabsorb all the labor displaced by technological changes but resulted in net increases in the total man-hours worked. In 1929, however, the increase in the total output was only 49,392,000 pounds, which at the rate of man-hour output for that year required an addition of 2,167,000 man-hours. This total was not sufficient to overcome the surplus of2.885.000 man-hours caused by the technological changes which increased the man-hour output from 20.97 to 22.80 pounds. The net result was therefore a decrease of 718,000 man-hours worked.
Between 1929 and 1930 the total output of the six tire plants was reduced by 117,080,000 pounds. The reduced production resulted in a decrease of 5,135,000 man-hours. In addition the technological changes which raised the man-hour output from 22.80 to 26.17 pounds caused a technological displacement of 3,866,000 man-hours, thus resulting in a net total decrease of 9,001,000 man-hours. Between1930 and 1931 the total production of the six plants was again reduced by 35,997,000 pounds. The reduced production resulted in a further decrease of 1,376,000 man-hours. In addition the technological changes which raised the man-hour output from 26.17 to 30.67 pounds caused a technological displacement of 3,640,000 man-hours, thus resulting in a net total decrease of 5,016,000 man-hours.
By cumulating the annual changes in total output, changes in the man-hour requirements caused by the variations in the total output, net changes in the total man-hours worked, and the total volume of labor technologically displaced (columns 4-7 of table 9) results are obtained which cover the entire period from 1922 to 1931. From
18 LABOR PRODUCTIVITY IN AUTOMOBILE TIRE INDUSTRY
Digitized for FRASER http://fraser.stlouisfed.org/ Federal Reserve Bank of St. Louis

1922 through 1929 the total production was increased by 506,503,000 pounds, which at the changing rate of man-hour output during these years, necessitated a total increase of 29,685,000 man-hours. During1930 and 1931 the total production of the six tire plants was reduced by 153,077,000 pounds, which at the man-hour rates of these 2 years caused a drop of 6,511,000 man-hours. For the entire period the total output of the six plants rose by 353,426,000 pounds, which required an increase of 23,174,000 man-hours. The net results, however, of all the increases and decreases in the actual man-hours worked in the six plants during this period were: Total increase,13,153,000 man-hours; total decrease, 18,168,000 man-hours; actual net decrease, 5,015,000 man-hours. The technological changes in these six plants, which gradually raised the man-hour output from11.28 pounds in 1922 to 30.67 pounds in 1931, not only displaced all the 23,174,000 man-hours which were needed to take care of the annual increases in the total output, but actually lopped off an additional 5,015,000 man-hours from the labor time worked in 1922.
This figure (28,189,000 man-hours) is much larger than the volume of technological labor displacement obtained by comparing the data for 1922 and 1931, and omitting the intervening years. The net actual increase of 353,426,000 pounds used in the production of tires and the net actual decrease of 5,015,000 man-hours worked remain unchanged. But the increase in the total output between 1922 and1931 produced at the 1931 rate of man-hour output, namely, 30.67 pounds, would have required only an addition of 11,524,000 man- hours, thus making a total of 16,539,000 man-hours technologically displaced in 1931 on the basis of the 1922 production.
The difference in the total volume of technological displacement of labor obtained by the two methods of computation is sufficiently large to require a careful analysis of both methods. The total volume of technological labor displaced is a result of two factors: (1) The reduction in labor-time requirements per unit of output and (2) the total quantity of output to which the technological change is applied. In the year-to-year method of measuring the volume of displaced labor; consideration is given to both factors. As the total volume of production is increased the base upon which the volume of technological displacement of labor is calculated is also increased. Similarly, a reduced total output reduces the base upon which the displacement is measured. These annual variations in the total output and their effects on the volume of technological displacement of labor are altogether omitted in the second method of calculation which only compares the last year with a given base. The larger the span of time intervening between the 2 years selected for comparison, the larger will be the difference in the volume of technological labor displacement as measured by the two methods presented above. Both methods give the same net results so far as actual production and actual increases or decreases in the labor time worked. The year-to-year system, however, indicates that the annual adjustments and changes caused by improved technology are considerably larger than becomes evident from a comparison of any 2 distant years. Since technological changes take place year after year and are cumulative in their effects, the year-after-year or period-after-period method of measuring the volume of labor dis
CHAP. 2.— TECHNOLOGICAL DISPLACEMENT OF LABOR 19
Digitized for FRASER http://fraser.stlouisfed.org/ Federal Reserve Bank of St. Louis

placed is more representative of the actual situation in industry than a comparison between any two distant periods.
From 1922 through 1925 there was no unemployment, technological or other kind, in the six tire manufacturing plants. In 1926 the revolutionary change in the method of tire building caused by the wholesale adoption of the flat drum process produced such a large displacement of labor that the increased total output could reabsorb only a part of that surplus labor, leaving 3,433,000 man-hours completely unemployed, at least so far as the six plants were concerned. All the men who represented this volume of labor were technologically unemployed. During 1927 and 1928 the annual very large increases in the volume of output not only reabsorbed all the labor which was technologically displaced during these 2 years but created enough work for those who lost their jobs in 1926 (if by that time they had not gotten employment elsewhere) and in addition some 2,000,000 man- hours had to be supplied from sources outside the six plants. In1929, however, a net surplus of 718,000 man-hours were left technologically unemployed. Then the depression came. Between 1929 and1930, the total production of the six plants dropped nearly 15 percent. At the 1929 rate of output this drop in the total production called for a reduction of 5,135,000 man-hours. Actually there was a decrease of 9,001,000 man-hours, due to an additional technological displacement of 3,866,000 man-hours. Of the men who lost their jobs in 1930 because of the surplus of 9,001,000 man-hours, 43 percent were technologicallyunemployed. Between 1930 and 1931, the total production of the six plants fell slightly less than 9 percent. This reduction at the 1930 man-hour output called for a decrease of1,376,000 man-hours. The actual drop was 5,016,000 man-hours because of an additional 3,640,000 man-hours which were displaced technologically because of the increased man-hour output from 26.17 to 30.67 pounds. Of the men who lost their jobs in 1931 nearly 73 percent were technologically unemployed.
Between the peak of 1928 and 1931 the six plants dropped as surplus labor 14,735,000 man-hours, or 41 percent of their 1928 total. Of the men who lost their jobs because of this labor surplus, 71 percent were technologically unemployed and the remaining 29 percent were unemployed because of a drop in the total production of the six plants.
The biennial manufactures reports of the Census Bureau may also be used to calculate the total volume of labor displaced by technological improvements. Instead of actual man-hours worked, which are not available, the total number of employees given may be used, and the results are therefore subject to the same qualifications which must always be present when average enrollments of employees are used to represent actuai man-hours worked. An analysis of the total number of employees technologically displaced in the tire industry from 1921 through 1931 is presented in table 10. In 1923 the total output of the tire industry was increased by 18,670,000 tires as compared with 1921. At the average 1923 rate of 626.9 tires per annum per employee, the increase in the total output necessitated an increase of 29,781 employees. The net increase, however, was only 18,467 employees, giving a difference of 11,314 employees displaced technologically in the change
20 LABOR PRODUCTIVITY IN AUTOMOBILE TIRE INDUSTRY
Digitized for FRASER http://fraser.stlouisfed.org/ Federal Reserve Bank of St. Louis

from 499.1 tires produced per worker in 1921 to 626.9 tires in 1923. In 1925 the total output was again increased by 13,450,000 tires. At the rate of 732.7 tires per employee the increase in the total output required an addition of 18,357 employees, but the net increase was only 7,677 employees, making a difference of 10,680 employees which were displaced technologically in the 2 years between 1923 and 1925. In 1927 the additional increase in the total output of 4,544,000 tires required, at the rate of 822.5 tires per employee, an increase of 5,525 employees. Instead there was a net reduction of 3,384 employees, making a total of 8,909 employees displaced by improved technology. In 1931 the total output of the entire industry was reduced by 21,097,- 000 tires. At the 1930 rate of 843.0 tires per employee, this reduction called for a decrease of 25,026 employees. The actual net decrease was 34,922 employees, indicating an additional 9,896 employees displaced technologically in 1931. During the entire period from 1921 through 1931 there was a net actual increase of 21,393,000 tires produced, which necessitated an increase of 35,536 employees. Actually there was a net reduction of 7,155 employees, making a total of 42,691 employees technologically displaced during this period.
CHAP. 2.— TECHNOLOGICAL DISPLACEMENT OF LABOE 21
T a b l e 10.— Volume of technological displacement of labor in manufacturing automobile tiresy 1921 to 1931, by years, based on census reports
YearTotal
number of tires pro
duced
Average number of wage earners
Average output of tires
per wage earner
per year
Increase or decrease compared with previous census year in—
Net increase or decrease
in wage earners1
Technological displacement
of wage earnersTotal output
Wage earners caused by change in
total output
1921_________________ 27.699.00046.369.00059.819.00064.363.00070.189.00049.092.000
55,496 73,963 81,640 78,256 83,263 48,341
499.1 626.9 732.7 822.5 843.0
1,015.5
1923_________________1925________ ____ __ .1927_______ _________1929. ________________1931_________________
Cumulative effects, 1921-31 ......... .......
+18,670,000 +13,450,000 +4,544,000 +5,816,000
-21,097,000
+21,393,000
+29,781 +18,357 +5,525 +6,899
-25,026
+35,536
+18,467 +7,677 -3,384 +5,007
-34,922
-7,155
11,314 10,680 8,909 1,892 9,896
42,691
* Result obtained by subtracting total decrease from total increase.
By comparing the data for 1921 and 1931 and completely omitting the intervening periods, the same results are obtained so far as the net changes in the total output and the total number of employees are concerned. But at the 1931 rate of 1,015.5 tires per employee, the net increase of 21,393,000 tires would have required an increase of 21,066 employees, and the total volume of labor displaced by technological changes between 1921 and 1931 would have amounted to 28,221 employees. The difference between the 42,691 employees which were technologically displaced when calculated by the 2-year census periods and the 28,221 employees displaced when calculated
Digitized for FRASER http://fraser.stlouisfed.org/ Federal Reserve Bank of St. Louis

22 LABOR PRODUCTIVITY IN AUTOMOBILE TIRE INDUSTRY
on the basis of comparing the first and last periods available is due to the fact that in the first case the total output is changed from one period to another and the volume of displacement based on the ac
tual production for that period, while in the second case the entire volume of displacement is measured on the basis of the 1921 output only.
Digitized for FRASER http://fraser.stlouisfed.org/ Federal Reserve Bank of St. Louis

CHAP. 2.— TECHNOLOGICAL DISPLACEMENT OF LABOR 23
INDEX OF TOTAL WEIGHT OF TIR ES PRODUCED, OF MAN-HOURS
W
Digitized for FRASER http://fraser.stlouisfed.org/ Federal Reserve Bank of St. Louis

Causes of Technological Displacement of Labor
As used in the present survey the phrase “ technological change” is defined to include all changes—whether in nature of the product, method of production, type of labor, hours worked, machinery and equipment used, etc.—which result in higher productivity per man- hour. This is in accordance with the actual conditions in the plant, where seldom, if ever, is it possible to segregate any one factor as “ the cause” of the increased productivity of labor in the plant. In some cases major changes, such as, for instance, the invention of the Owens bottle-blowing machine in the glass industry, the dial-tele- phone system, or the introduction of “ canned” music in the motion- picture theaters, are revolutionary in scope and are responsible for abrupt and very large displacements of workers in their respective fields. Such changes, however, do not occur very frequently in any one industry.
Much more important from the point of view of labor employment are the smaller and more frequent changes which occur in large and small plants alike, day after day, increasing the output per worker in one part of the plant, eliminating one worker here or a group of workers there, and thus constantly reducing the labor time required per unit of output. The tire industry offers an instance in which the increased productivity of labor was due more to the so-called evolutionary small changes in production than to any revolutionary change in the process of tire manufacturing. Essentially there has been but one major change in the manufacture of pneumatic tires, and that occurred when the core process of tire building gave place to the flat-drum process. In some plants this change occurred as early as 1919. By1927 practically all of the major plants in this country had already adopted the drum process of carcass building. But the increase in the man-hour output in the tire industry did not cease in 1927. On the contrary, since 1927, and especially during the last 2 years, there has been an increase in man-hour productivity, much larger than during any preceding year in the history of tire making.
In searching for the actual causes of this enormous increase in productivity a series of changes was noted which in the aggregate contributed to a very large degree to the increased man-hour output. An extensive list of such technological changes and their effects on the labor situation in the department affected by the change is given on pages 43, 53, 62, and 71. The following are presented merely as illustrative of the type of technological changes which recently occurred in two of the plants. In one column is shown the nature of the change and in the other its immediate effect on the labor engaged in the particular branch of the plant where the change took place.
24 LABOR PRODUCTIVITY IN AUTOMOBILE TIRE INDUSTRY
Digitized for FRASER http://fraser.stlouisfed.org/ Federal Reserve Bank of St. Louis

CHAP. 2.— TECHNOLOGICAL DISPLACEMENT OF LABOR 25T a b l e 11.— Effect on labor of specified technological changes in 2 tire-manufacturing
plants
Technological change Effect on labor
3 rubber plasticators installed..
Liquid soapstoning devices installed for Banbury mixers.
Direct method of tire building installed using gum-inserting machines, rotary cutters, compensators, liner stands, etc.
Compensators installed on 40 tire-building machines, and room rearranged to take care of increased output.
5 curing units equipped with overhead conveyors, tire removers, etc.
Curing room rearranged to take care of increased production.
Preparation conveyor in tube room moved and service conveyor and automatic soap- stoning rearranged.
6 automatic cutters installed on tube preparation unit.
New tray skids purchased for the handling of tubes and flaps.
Banbury mixers installed for 2 tandem calenders.
Cutting and rerolling departments consolidated and rearranged.
Festoons and working platforms erected for the supplying of stock to the automatic unit of tire building.
20 modem shoulder-drum machines installed to replace old flat-drum machines for building tires.
Tire conveyor extended from building unit to painting machines.
New system of sorting and assembling tubes installed.
2 conveyor units, 1 for the purpose of assembling inner tube valves and the other for the testing of valves installed.
Saving in direct labor, due to increased man-hour output, of 328 man-hours per day, equivalent to displacement of 41 men.
1 man per shift, who formerly soapstoned by hand, eliminated. Labor saving, 24 man-hours per day, or 3 men displaced.
Savings in normal production: (1) Replacement of male with female labor, (2) elimination of time lost by assemblers due to stock changes, (3) direct handling of stock from rotary cutter, (4) elimination of trucking assembled bands to tire room. Saving in direct labor, 248 man- hours per day, or 31 men displaced.
Saving in normal production estimated to exceed 416 man- hours per day, or 52 men displaced.
5 men per shift eliminated.
Saving in direct labor, when operating at full capacity, 173 man-hours per day, or 22 men displaced.
2 girls per shift eliminated, saving 48 man-hours per day.
1 girl per shift eliminated.
2 bookers per shift eliminated.
2 truckmen, 8 millmen, and 6 compounders per day elimi nated, saving in direct labor 128 man-hours.
Direct labor saving, 112 man-hours per day, or 14 girls dis placed.
3 supply girls per shift eliminated, 72 man-hours per day.
Direct labor saving 600 man-hours per day, or 75 men dis placed.
1 trucker and one half a loading man per shift eliminated saving 36 man-hours per day.
6 girls eliminated, saving 64 man-hours per day.
5 men and 5 girls eliminated, saving 80 man-hours per day
In addition to such technological changes as those illustrated above, there were other changes the effects of which can not be measured precisely. Among these may be mentioned the sharp reduction in the labor turnover in the plants, the elimination of the less efficient machines and less efficient workers, and the introduction of the so-called “ motion time studies” in several of the plants included in the survey. The motion time study consists in analyzing to the minutest degree the individual movements and operations each worker is required to make in the process of performing his or her task. The workers are then instructed to follow precisely the requirements set in the time analysis, thus eliminating a large proportion of what is known as waste motion. Automatic machinery and especially automatic conveyors are geared to the standard of output set for the workers around the machine or the conveyor. It is frankly admitted by the managers and engineers in charge of operations that during the last year these motion time studies have been, more than any other factor or factors, responsible for the increased output per man-hour.
Digitized for FRASER http://fraser.stlouisfed.org/ Federal Reserve Bank of St. Louis

Factors Affecting Reemployment of Displaced WorkersIn considering the prospects of reemployment of the displaced
workers in the tire industry the present (1932) depressed conditions of American industry as a whole and of the automobile trade in particular, both of which seriously affected the tire industry, are disregarded here. Assuming a return to normal conditions, the tire industry will, nevertheless, be confronted with a situation which makes it doubtful whether the industry will be able to reemploy the workers who lost their jobs because of technological changes or other reasons. On the one hand there is the slow but steady improvement in the quality of tires, resulting in considerable prolongation of the life of the average tire. Tires are purchased for their mileage qualities only, and while improvements in the tire may have the immediate result of increased sales for the plant producing it, in general the total demand for tires is reduced in proportion as the life of the average tire is increased. On the other hand there is the constant increase in the man-hour output of tires. Whether due to new and improved machinery, to better management, to elimination of the least efficient plants or the least efficient workers, to a speed-up process resulting in the elimination of waste time and motion— the result is a larger output per man- hour with the invariable concomitant of reduced labor requirements per unit of output. From the point of view of labor employment, the tire industry appears to be “ burning its candle at both ends” , reducing the total demand for tires by improving the quality of the tire and at the same time further reducing the demand for labor by continually increasing the output per man-hour. There is at present no indication of any change in this trend. Unless there is an unforeseen, enormous increase in the total demand for tires, or unless definite steps are taken to increase the volume of employment in the industry by shortening the hours of work there is bound to be further reduction in total requirement of labor and therefore further unemployment in the tire industry.
During 1931 and 1932 a number of large tire plants adopted the 6-hour shift with a 3 to 4 day weekly average for all of its employees. This plan helped the industry to retain on its pay rolls a larger number of men than would have been possible with a full-time schedule. But at the same time it considerably reduced the average weekly earnings of the workers, in some cases to the extent of seriously endangering their standard of living. The shorter shift and the shorter week, accompanied by adjustments in the hourly rates of wages, may result in an increase in the labor cost of tire production. This is not an impossible development in an industry which for more than a decade has diverted to the consumer nearly all the benefits arising from the improved quality of the tire and from the labor savings caused by technological changes, in terms not only of a better tire but also of much reduced prices per tire. According to the census figures the 1921 average value of a tire and tube combined was $17.91. In 1929 the value per tire and tube combined was $9.63, and in 1931 it was only $7.19, or about 40 percent of its 1921 value. Again in 1914 the average consumer's price of a tire and tube combined was about $30.50, in 1929 it was $15.70, and in 1931 only $12.07.
26 LABOR PRODUCTIVITY IN AUTOMOBILE TIRE INDUSTRY
Digitized for FRASER http://fraser.stlouisfed.org/ Federal Reserve Bank of St. Louis

It is quite possible that in the past the continuous reduction in the price of tires acted as a stimulus for an increase in the total demand for tires. But with the present (1932) conditions in the tire industry and the prevailing low price of tires, any further reduction in the price can have only a very slight influence, if any, on the total demand for tires. By eliminating cutthroat competition and establishing a more or less stabilized price per tire, it would be possible for the tire manufacturers to divert some of the benefits arising from further improvement in the quality of tires or additional savings in labor toward the employment of a larger volume of labor and a shorter working week. This alone will safeguard the industry from further increases in the ranks of its unemployed workers.
CHAP. 2.— TECHNOLOGICAL DISPLACEMENT OF LABOR 27
Digitized for FRASER http://fraser.stlouisfed.org/ Federal Reserve Bank of St. Louis

C h ap ter 3.—Rates of Wages and Earnings of Workers in the Tire Industry
Average Hourly Rates of Wages, by Departments
Table 12 gives average hourly rates of wages of the workers in the several major divisions of two tire plants. Plant 1 is represented by 10 departments, for which precise dates of the general or vertical changes in the rates of wages from January 1921 through December1931 are given. The data for plant 2 cover yearly changes in the rates of 8 departments from 1924 through 1931. The figures given for both plants do not represent actual individual earnings, but rather the average hourly rates of wages of the entire group of workers constituting the department. The rates of the skilled workers are of course, higher than those of their semiskilled or unskilled helpers. The women generally have lower rates than the men. The variations in the wages between departments are therefore due, not only to the differences in the amount of skill required on the job, but also to the proportion of woman workers included in the department. In both plants the rates for solid tires and for building and curing pneumatic tires are the highest, chiefly because there are few or no women employed in these departments. On the other hand, the rates of wages in the inner tubes and accessories units are the lowest because of the vast predominance of female labor.
T a b l e 12.— Average hourly rates of wages in 2 tire plants in specified years, 1921to 1931, by departments
Plant number, and departmentJanuary1921
Feb. 1 to M ay 16,1921
M ay 16 to Sept. 1, 1921
Sept. 1, 1921, to June 1,
1922
June 1, 1922, to Feb. 15,
1923
Feb. 15, 1923, to Sept. 1,
1923
Sept. 1, 1923, to M ay 8,
1931
M ay 8, 1931, to Dec. 31,
1931
Plant 1:Crude rubber................................... $1,006 $0,838 $0.755 $0,686 $0,754 $0,838 $0.762 $0.701Compounding__________________ .971 .809 .729 .663 .729 .810 .736 .677Calendering-------------------------------- 1.074 .895 .806 .733 .805 .894 .813 .748Stock preparation-------- ---------------Tire building------------------------------
1.925 .771 .695 .632 .694 .771 .701 .6451.103 .919 .828 .753 .828 .920 .836 .769
Tire curing--------------- ------- ---------- 1.075 .895 .806 .734 .806 .895 .813 .748Tire finishing______________ ____ .941 .784 .706 .642 .705 .783 .712 .655Inner tubes..................... . ........ ....... .895 .746 .672 .611 .671 .746 .678 .624Accessories...... ................... .............. .796 .663 .597 .543 .597 .663 .603 .555Solid tires.......................................... 1.175 .979 .882 .802 .881 .979 .890 .819
1924 1925 1926 1927 1928 1929 1930 1931
Plant 2:M ill room ...................................... $0.811 $0.821 $0.832 $0,853 $0.842 $0,860 $0.866 $0.750Stock preparation- .................... .Tire building....................................
.795 .757 .798 .836 .841 .794 .740 .678
.933 .885 .854 .869 .870 .904 .963 .859Tire curing.................... ............. . .953 .994 .939 1.040 1.030 1.087 .982 .934Solid tires...................................— .881 .894 .840 .847 .843 .795 .831 .780Inner tubes, m aking.............. ....... .822 .826 .913 .855 .901 .943 .953 .871Inner tubes, curing and finishing.. .872 .900 .911 .713 .769 .819 .698 .573Accessories........................................ .684 .713 .718 .860 ,854 .786 .596 .602
28
Digitized for FRASER http://fraser.stlouisfed.org/ Federal Reserve Bank of St. Louis

In plant 1 the highest rates of wages were paid in January 1921. These were changed several times between February 1921 and September 1923. The latter rates remained intact until May 8, 1931, when a general cut reduced the rates of all the departments to the lowest average for the entire period. The 1931 rates of wages in the second plant are with one exception also the lowest for the period covered.
Average Actual Monthly Earnings, by Departments
The hourly rates of wages are significant only in normal times when the wage earners can rely on getting, more or less, a full week's work. Since 1929, however, very few of the tire manufacturing plants have operated on full-time schedules. In 1931 a number of plants adopted the four 6-hour shifts basis of operation in order to divide the available work and retain on its pay roll a larger number of employees. This resulted in further reductions in the incomes of the wage earners in the industry. Average actual monthly earnings and the average number of wage earners employed in three tire plants combined are therefore given in table 13. All the departments in the 3 plants are combined mto 4 major groups: 1. Crude-rubber division, which includes washing, milling, compounding, and calendering stock; 2. Stock preparation and tire building; 3. Curing and finishing tires; and 4. The manufacture of miscellaneous items including inner tubes, flaps, and other accessories.
CHAP. 3.— RATES OF WAGES AND EARNINGS OF WORKERS 29
T a b l e 1 3 .— Average number of wage earners and average actual monthly earnings in 3 automobile tire plants combined, 1921 to 1981, by years and divisions
Year
Crude rubberStock preparation and tire
buildingCuring and
finishing tires Miscellaneous All divisions
Average
number of em
ployees
Average
monthly earn
ings
Average
number of em
ployees
Average
monthly earn
ings
Average
number of em
ployees
Average
monthly earn
ings
Average
number of em
ployees
Average
monthly earn
ings
Average
number of em
ployees
Average
monthly earn
ings
Index numbers of
monthlyearn- ings (1926=
100)
Average
earnings
Realearnings
19211 1,107 $107.06 2,464 $116.61 1,529 $127.72 1,563 $116.00 6,663 $117.43 86.93 85.881922______ 1,139 125.42 2,537 127.52 1,649 134.67 1,248 122.07 6,573 127.92 94.70 99.161923______ 1,253 133. 61 2,828 137.88 1,726 149.02 1,427 131.40 7,234 138.52 102.55 105.101924.......... 1,188 138. 51 2,739 135.68 1,793 152.86 1,687 125.34 7,407 137.93 102.11 104.841925______ 1,482 138.70 3,709 123.21 2,309 151.63 2,034 130. 61 9,534 134.08 99.26 98.971926............ 1,451 134.39 3,401 136.08 2,084 137.45 1,936 131.28 8,872 135.08 100.00 100.001927.......... 1,428 134. 51 3,468 130.28 2,046 144.82 1,823 127.08 8,765 133. 70 98.98 98.031928______ 1,466 141.79 4,066 128.08 2,091 145.60 1,860 127.00 9,483 133.85 99.09 99.661929______ 1,605 143.86 4,605 125.82 2,223 147.22 1,970 117.42 10,403 131.59 97.42 99.931930.......... 1,707 120.17 3,740 117.18 2,063 132.77 1,627 109.14 9,137 119.82 88.70 94.961931............ 1,331 107.04 3,207 111. 37 1,645 120.87 1,200 93.84 7,383 109.86 81.33 96.25
1 Last 6 months only.
The highest average money income of the wage earners in these 3 plants occurred in 1923, when the 7,234 workers employed averaged $138.52 per month. Their lowest money income was in 1931, when
171867°—33------3
Digitized for FRASER http://fraser.stlouisfed.org/ Federal Reserve Bank of St. Louis

the 7,383 wage earners employed averaged $109.86 per month. With1926 as 100, the index of the average monthly earnings rose from 86.93 for the last 6 months of 1921 to a maximum of 102.55 in 1923; in1930 the index was 88.70, and in 1931 it was 81.33, the lowest for the entire period. The index of real earnings, which is shown in the same table, was derived by dividing the index of average earnings by the corresponding cost-of-living index for the United States, with 1926 as a base.1 The highest index of real earnings, namely 105.10, is also shown in 1923; in 1924 the index was 104.84, or slightly less than in 1923. It was during these 2 years only that the index of real earnings rose above 100. The lowest index, 85.88, occurred in 1921; the next lowest index, namely 94.96, occurred in 1930. In 1931 the index of real earnings rose to 96.25, due mainly to the large drop in the cost-of-living index from 93.41 in 1930 to 84.50 in 1931.
The average number of wage earners employed and their average monthly earnings in the three individual plants separately are shown in table 14. The plan of presentation in these tables is similar to that of table 13. In plant 1 the highest average earnings occurred in1929, when the 1,980 wage earners employed averaged $142.96 per month. Their lowest earnings were in 1921, when the 2,935 workers employed averaged for the whole year $119.55 per month. In the second plant the average monthly earnings ranged from $100.55 for 3,198 workers employed in 1931 to $138.73 for the 3,686 wage earners in 1924. The average monthly earnings in the third plant ranged from $97.97 for the 1,626 workers employed in 1931 to $142.91 for 1,286 wage earners in 1923.
With 1926 as a base, the index of the average monthly earnings in the first plant ranges from 91.34 in 1921 to 109.23 in 1929. In the second plant the range is from 73.66 in 1931 to 101.63 in 1924, and in the third plant it is from 71.79 in 1931 to 104.72 in 1923. The corresponding index of real earnings in plant 1 ranges from 90.24 in 1921 to 113.15 in 1931. In plant 2 the range is from 84.74 in 1921 to 104.34 in 1924, and in plant 3 it is from 84.96 in 1931 to 107.33 in 1923.
30 LABOR PRODUCTIVITY IN AUTOMOBILE TIRE INDUSTRY
T a b l e 14.— Average number of wage earners and monthly earnings in 8 individual tire plants, 1921 to 1981, by years and divisions
Crude rubberStock preparation and tire
buildingCuring and
finishing tires Miscellaneous All divisions
Year and plant
number
o
i s
ll
£3§ aS jf
©
l | it
j>>3•*»a
a !li
>*2a0 |
o
I sg g
>>3a
s .s
Index numbers of monthly
earnings (1926=100.00)
li s j * ® a>><
o< ® a<s ©i<
© u «3 ® ©><
Qt
1 9«3 © II©>
© fl 09 © u
<
® %bogC3 ®u©><
IIi
03 ® <X>>
Ave
rage
earn
ings
Rea
lea
rnin
gs
Plant 1: 1921.. 537 $111.30 1,345 $115. 74 816 $131.08 237 $120.16 2,935 $119.55 91.34 $90.241922.. 528 113.88 1,050 113.21 773 134.08 197 120.56 2,548 124.69 95.27 99.761933- 544 127.32 883 142.54 768 147.25 298 130.70 2,493 139.26 106.40 109.051924.. 515 131.69 773 133.17 775 149.99 384 116.98 2,447 135.64 103.64 106.411925._ 586 133.71 755 136.88 582 146.54 379 140.87 2,302 139.17 106.33 106.021926.. 556 123.13 711 133.30 622 134.94 353 131.03 2,242 130.88 100.00 100.001927.. 361 93.51 557 129.99 493 125.99 286 122.01 1,697 125.24 95.69 97.08
1 These cost-of-living index numbers were computed from the cost-of-living figures (on the 1913 basis) published by the U.S. Bureau of Labor Statistics,
Digitized for FRASER http://fraser.stlouisfed.org/ Federal Reserve Bank of St. Louis

CHAP. 3.— RATES OF WAGES AND EARNINGS OP WORKERS 31T a b l e 14.— Average number of wage earners and monthly earnings in 3 individual
tire plants, 1921 to 1931, by years and divisions— Continued
Crude rubberStock preparation and tire
buildingCuring and
finishing tires Miscellaneous All divisions
Year and plant
number I s
>>3
I f
©
S £S 3
!ro
* *§ !
£3+»a
I
o
i t5 5
>>2ao CQ
I.SI sl |
>»2a
I
Index numbers of monthly
earnings (1926=100.00)
&<0 rjban os a>
<
® £3bfi w OS ® u <v >
<
® abX)P c3 ©
<
O N M g 03 ® u ©><
. f t
« © %<
u93>
<
i t1® isU) s * ® Jh
>£ >
® bMg 03 ®tHa>
< Aver
age
earn
ings
Real
earn
ings
Plant 1:1928- 384 136.93 864 131.08 532 139.49 313 135.06 2,093 134.89 103.06 105.811929- 389 136.65 748 147.44 552 148.46 291 129.45 1,980 142.96 109.23 112.041930- 766 118. 30 1,085 129.45 757 144.81 340 124. 51 2,948 129.93 99.27 106.271931- 560 116.02 1,161 124.12 655 135.18 183 123. 56 2,559 125.14 95.61 113.15
Plant 2:1921i. 395 119.50 558 117.83 470 120.84 1,235 114.57 2,658 117.09 85.77 84.741922- 456 138.70 998 135.84 653 136.68 874 121.89 2,981 132.37 96.97 101.541923- 534 134.93 1,315 136.07 671 147.59 935 129.50 3,455 136.35 99.88 102.371924- 492 144.20 1,364 138.24 737 153.37 1,093 127.03 3,686 138.73 101.63 104.341925- 676 141.13 1,988 130.31 994 152.27 1,368 127.05 5,026 135.22 99.06 98.771926- 700 139. 71 1,955 139.92 976 132.29 1,308 132.87 4,939 136. 51 100.00 100.001927- 766 138.25 1,945 131.54 895 152. 56 2 1,222 128.34 4,828 135.69 99.40 98.451928- 758 144.04 2,240 129.62 838 147. 98 1,398 121.68 5,234 132.53 97.08 97.641929- 807 145.60 2,811 118.53 874 144.44 1,448
1,076117.07 5,940
4,147125.66 92.05 94.42
1930- 602 122.72 1,819 1,320
113.04 650 128.36 107. 01 115.28 84.45 90.411931- 471 106.62 101. 36 513 114.20 894 89.51 3,198 100.55 73.66 87.17
Plant 3:1921- 175 123.11 561 117.47 243 129.76 91 124.68 1,070 121.80 89.26 88.181922- 155 125.69 489 118.09 223 130.86 177 124.64 1,044 123.05 90.17 94.421923- 175 149.13 630 135.12 287 157.08 194 141. 65 1,286 142.91 104.72 107.331924„ 181 142.43 602 133.09 281 159.43 210 131.82 1,274 140.02 102.61 105.351925- 220 144.53 966 97.91 733 154.66 287 130. 57 2,206 125.71 92.12 91.851926- 195 147.41 735 128.56 486 151.03 275 124.05 1,691
2,240136.46 100.00 100.00
1927- 301 143.10 966 127.92 658 148.39 315 126.80 135.82 99.53 100.971928- 324 142.30 962 121.79 721 147.34 149 103.49 2,156 132.15 96.84 99.431929- 409 147.28 1,046 129.94 797 149.41 231 104. 51 2,483 136.68 100.16 102.741930- 339 119.90 836 110.18 656 123.25 211 95.28 2,042 114.45 83.87 89.791931- 300 94.53 726 95.41 477 108.41 123 81.11 1,626 97.97 71.79 84.96
1 Last 6 months only.2 Production of fabric tires dropped in 1927.
Seasonal Fluctuations in the IndustryThe reduction in the total output since 1929 has greatly accentuated
the seasonal characteristics of the tire industry. Even during the so-called “ normal years” of increased total production the range between the months of the highest and the lowest output has been very great. Table 15 presents figures of tires produced monthly bv the entire industry from 1923 to 1931, and by the six representative plants covered by the present survey. For each month there is also given the index for that month’s output calculated on the basis of the average monthly output for the entire year as 100. The variations of each month from the average are plotted on the chart following table 15 and indicate the seasonal fluctuations in the tire industry, independent of its secular or long-distance trend. The seasonal fluctuations in the six representative plants are also given in the same chart.
Digitized for FRASER http://fraser.stlouisfed.org/ Federal Reserve Bank of St. Louis

T a b l e 15*— Monthly fluctuations in the production of tires, 1922 to 1931, by years
[Monthly average for specified year=100]
32 LABOR PRODUCTIVITY IN AUTOMOBILE TIRE INDUSTRY
ENTIRE INDUSTRY
Month
1923 1924 1925
Tiresproduced
Indexnumbers
Tiresproduced
Indexnumbers
Tiresproduced
Indexnumbers
January— ----------------- ------- --------- 4,169,000 110.58 4,293,000 99.77 4,740,000 93.47February------------------------- ---------- 4,289,000 113.77 4,372,000 101.60 4,908,000 96.79M arch______________ ______ ____ 5,141,000 136.37 4,571,000 106.23 5,273,000 103.98April--------- --------------------------------- 4,719,000 125.17 4,409,000 102.46 5,340,000 105.31
4,880,000 129.45 4,051,000 94.14 5,467,000 107.813,943,000 104.59 3,507,000 81.50 5,417,000 106.82
July____________________________ 2,657,000 70.48 3,403, 000 79.08 5,588,000 110.20August---------------------------------------- 3,141,000 83.32 4,313,000 100.23 5,607,000 110.57September-------------- ------- ------------ 2,705,000 71.75 4,708,000 109.41 5,007,000 98.74October_________________________ 3,148,000 83.50 5,169,000 120.13 4,505,000 88.84November_________ _____ ______ 3,200,000 84.90 4,253,000 98.84 4,243,000 83.67December_________ ______ ______ 3,249, 000 86.18 4,584,000 106.53 4,760,000 93.87
Average— ............................ 3,770, 000 100.00 4,303,000 100.00 5,071,000 100.00
1926 1927 1928
January............................................. 4,109,000 81.21 4,965,000 92.32 5,357,000 82.48February.......... ................................ 4,865,000 96.15 5,096,000 94.76 6,363,000 97.97March__________________________ 5,456,000 107.83 6,277,000 116.72 6,819,000 104.99April--------- --------------------------------- 5,345,000 105.63 6,400,000 119.00 6,177,000 95.10M ay................................................... 5,023,000 99.28 6,152,000 114.39 6,759.000 104.06June____________________________ 5,289,000 104.53 6,212,000 115.51 6,692,000 103.03July......... — .......................... - ........ 4,949,000 97.81 5,088,000 94.61 6,499,000 100.06August--------------- ------- ---------------- 5,872,000 116.05 5,751,000 106.94 7,468,000 114.98September______________________ 5,707,000 112.79 4,821,000 89.64 6,801,000 104.71October_______________ ______ — 5,103,000 100.85 4,777,000 88.82 7,325,000 112.78November______________________ 4,324,000 85.45 4,501,000 83.69 6,075,000 93.53December........................................ 4,683,000 92.55 4,497,000 83.62 5,605,000 86.30
Average--------- ------- . ---------- 5,060,000 100.00 5,378, 000 100.00 6,495,000 100.00
1929 1930 1931
January— ...................................... 6,301,000 109.39 4,486, 000 105.63 3,674,000 90.92February................. ............ .......... . 6,480,000 112.50 4,556,000 107.28 3,985,000 98.61M arch...................... ......................... 7,049,000 122.38 4,864,000 114. 53 4,663,000 115.39April...............— .......... — ........ —M ay_______ ____ _______ ____
7,391,000 128.32 5,648,000 132.99 4,944,000 122.357,636,000 132.57 5,718s 000 134.64 5,679,000 140.53
June-------- ------------------- -------- ------ 6,847,000 118.87 5,123,000 120.63 5,671,000 140.34July.........- ________ ____________ 6,070,000 105.39 3,991,000 93.97 4,926,000 121.90August....... ................. ................... 5,442,000 94.48 4,165,000 98.07 3,906,000 96.66Septem ber....................... .............. 4,460,000 77.43 3,365,000 79.23 3,172,000 78.50October_________________________ 4,611,000 80.05 3,582,000 84.34 2,974,000 73.60November........ ............................... 3,379,000 58.66 2,654,000 62.49 2,259,000 55.90December----------------------------------- 3,058,000 53.09 2,814,000 66.26 2,644,000 65.43
Average__________________ 5,760,000 100.00 4,247,000 100.00 4,041,000 100.00
Digitized for FRASER http://fraser.stlouisfed.org/ Federal Reserve Bank of St. Louis

T a b l e 1 5 .— Monthly fluctuations in the production of tires, 1922 to 1981, by years—Continued
6 REPRESENTATIVE TIRE PLANTS
CHAP. 3.— RATES OP WAGES AND EARNINGS OP WORKERS 33
Month
1922
Tirespro
duced
Indexnumbers
1923
Tirespro
duced
Indexnumbers
1924
Tirespro
duced
Indexnumbers
1925
Tirespro
duced
Indexnumbers
January___February..March____April______M ay______June______July_______August____September.October___November. Decem ber-
Average..
1.307.0001.219.0001.498.0001.394.0001.608.0001.751.0001.563.0001.782.0001.463.0001.581.0001.574.0001.580.000
85.59 79.83 98.10 91.29
105.30 114.67 102.36 116.70 95.81
103.54 103.08 103.53
1.900.0001.965.0002.317.0002.061.000 2,101,000 1, 665, 0001.313.000 1,497, 000 1,180, 0001.481.000 1,517, 000 1,634, 000
110.47 114.24 134.71 119.83 122.15 96.80 76.34 87.03 68.61 86.10 88.20 95.00
1,527,000 100.00 1,720,000 100.00
1926 1927
January...........February........March.............April________M ay.................June.................July..................A ugust..........September___October. .........November___December____
Average.
2.283.0002.322.0002.560.0002.433.0002.083.0002.121.000 2,080,0002.605.0002.551.0002.310.0002.200.000 2,339,000
2,324,000
99.91 110.16 104.89.91.2789.50
112.09109.7799.4094.70
100.65
2.514.000 2,529, 000 2,997, 000 2, 960, 000 2, 785, 000 2, 914, 0002.504.000 2,843, 000 2, 325, 0002.264.000 2, 232, 000 2,442, 000
100.00 2,609,000
96.36 96.93
114.87 113.46 106.75 111.95.
108.9789.1186.7885.55
100.00
January______February........March.............April________M ay_________June_________July_________August_______September___October______November___December____
Average.
2.903.0002.731.0003.036.0003.497.0003.252.0002.863.0002.171.0002.320.0001.882.0001.980.0001.507.0001.723.000
2,489,000
116.63 109.72 121.98 140.05 130.65 115.0387.22 93. 21 75. 61 79. 55 60.5569.22
2,386, 000 2,563, 0003.003.0002.999.0003.385.000 3,392, 0002.635.000 2,058, 0001.777.0001.622.0001.592.0001.589.000
100.00 2,417,000
98.72106.04 125.37 124.08140.05 140.34 109.0285.15 73.52 67.11 65.87 65.74
100.00
2,102, 0001.872.0002.070.0002.039.0001.760.0001.550.0001.567.0001.957.0002.198.0002.251.0001.825.0001.991.000
108.8096.89
107.14 105.5491.1080.2381.11
101.29 113.76 116.5194.46
103.05
2,210,0002.007.0002.185.0002.243.0002.265.0002.353.0002.415.0002.438.0002.220.0002.148.0002.131.0002.321.000
1,932,000 100.00 2,245,000
1928 1929
3.031.0003.327.0003.489.0002.964.0003.092.000 3,149, 0002.964.0003.266.0003.044.0003.305.0003.029.0002.828.000
3,124,000
97.02106.50111.94.88 98.98
100.8094.88
104.5597.44
105.79 96.96 90.52
3.416.0003.453.0003.854.0003.744.0004.087.0003.687.0003.401.0003.090.0002.599.0002.594.0002.065.0001.793.000
100.00 3,149,000
108.48 109.65 122.39 118.89 129.79 117.08 108.00 98.13 82.53 82.38 65.58 56.94
100.00
Digitized for FRASER http://fraser.stlouisfed.org/ Federal Reserve Bank of St. Louis

34 LABOR PRODUCTIVITY IN AUTOMOBILE TIRE INDUSTRY
For the entire industry the peak output in March 1923 was 36.37 percent higher than the average for the year, and the low production in July was 29.52 percent below the average. The range between
the peak and the low months of 1923 w as thus 65.89 percent of the average for the year. From 1924 through 1928 the monthly fluctuations from the average for each year were somewhat smaller than in
Digitized for FRASER http://fraser.stlouisfed.org/ Federal Reserve Bank of St. Louis

1923, but in the next 3 years they rose very rapidly above the 1923 figures. The smallest range between the peak and the low months occurred in 1925, when the peak was 10.57 percent above and the low 16.33 percent below the average for the year. The maximum range of 84.63 percent occurred in 1931, with a peak in May 40.53 percent above and a low in November 44.10 percent below the average for the year.
The monthly fluctuations in the tire production of the six plants covered by the survey are almost identical with those for the entire industry. The smallest range from the peak to the low month of production in the 6 plants combined occurred in 1925, when the peak was 8.60 percent above and the low 10.60 percent below the average for the year. The maximum range of 79.50 percent occurred in 1930, with a peak in May 40.05 percent above and a low in November 39.45 percent below the year’s average.
The variations of the peak and low monthly production of tires from the yearly average, 1922 to 1931, in the entire industry and in the six representative plants covered in the study, are shown in table 16.
CHAP. 3.— RATES OF WAGES AND EARNINGS OF WORKERS 35
T a b l e 16.— Percentage variations of peak and low monthly production of tires from average monthly production, 1922 to 1931, by years
Entire industry 6 representative plants
YearPeak Low
Range between peak and
lowPeak Low
Range between peak and
low
1922 ................................................................. 14.67 20.17 34.841923 ...... .......... — .......... —................... .......... 36.37 29.52 65.89 34.71 23.76 58.371924_______ ____ ____ ____ ________ ______ 20.13 20.92 41.05 16.51 19.77 36.281925 _____________________________________ 10.57 16.33 26.90 8.60 10.60 19.201926 ........................ ........... .......... ................... 16.05 18.79 34.84 12.09 10.50 22.591927 ..........- ........ —....................................... 19.00 16.38 35.38 14.87 14.45 29.321928 _________________________ ____ ______ 14.98 17.52 32.50 11.68 9.48 21.161929 ......................................... ............ 32.57 46.91 79.48 29.79 43.06 72.851930 _____ ___ ____ _____________________ 34.64 37.51 72.15 40.05 39.45 79.501931 —- ............................................................. 40.53 44.10 84.63 40.34 34.26 74.60
What is true of the entire industry and of the six representative plants combined is equally true of the individual tire plants. The effects of these seasonal fluctuations on the employment situation and the earnings of the wage earners in the individual plants may be gaged from table 17, which gives the monthly figures of wage earners employed and their average earnings in the tire-building departments of three plants for the years 1926, 1929, and 1931. Conditions in the tire-building department of each plant may be taken as more or less representative of the entire plant. The percentage variations in employment and in the earnings of the wage earners from the monthly average for the year, which is taken as 100, are also given.
In 1926 the range of employment between the peak and the low months in plant 1 was 22.90 percent and the range of earnings 24.33 percent of the average for the year. In 1929 the range of employment was 60.90 percent and the range in earnings 43.33 percent of the average. In 1931 the range of employment was 38.82 percent and the range of earnings 68.71 percent of the average. In plant 2 the
Digitized for FRASER http://fraser.stlouisfed.org/ Federal Reserve Bank of St. Louis
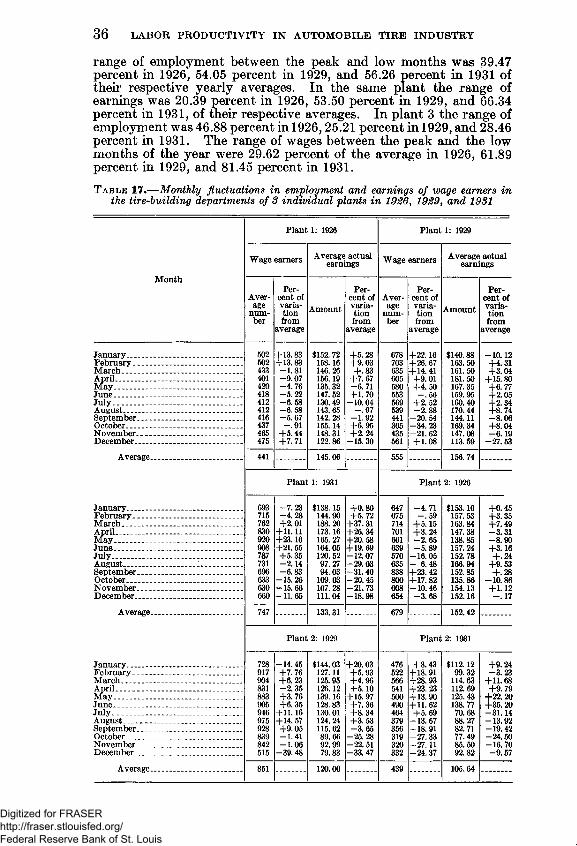
range of employment between the peak and low months was 39.47 percent in 1926, 54.05 percent in 1929, and 56.26 percent in 1931 of their respective yearly averages. In the same plant the range of earnings was 20.39 percent in 1926, 53.50 percent in 1929, and 66.34 percent in 1931, of their respective averages. In plant 3 the range of employment was 46.88 percent in 1926,25.21 percent in 1929, and 28.46 percent in 1931. The range of wages between the peak and the low months of the year were 29.62 percent of the average in 1926, 61.89 percent in 1929, and 81.45 percent in 1931.T a b l e 17.— Monthly fluctuations in employment and earnings of wage earners in
the tire-building departments of 8 individual plants in 1926, 1929, and 1981
36 LABOR PRODUCTIVITY IN AUTOMOBILE TIRE INDUSTRY
Plant 1: 1926
Month
Wage earners Average actual earnings Wage earners Average actual
earnings
Average
number
Percent of variation from
average
Amount
Percent of variation from
average
Average
number
Percent of variation from
average
Amount
Percent of variation from
average
January______ ______________________ 502 +13.83 $152.72 +5.28+9.03+ .83
+7.67-6 .71
678 +22.16 +26.67 +14.41 +9.01 +4.50 —.56
$140.88 -10.12February______________________ _ _ 502 +13.83
-1 .81158.16 703 163.50 +4.31
+3.04+15.80+6.77+2.05+2.34+8.74—8.06
March_______________________ . . . _ 433 146. 26 635 161.50A pril.— _______ ____________________ 401 -9 .07 156.19 605 181.50M ay__________ ________ ____________ 420 -4 .76 135.32 580 167.35June__________________ ____________ 418 -5 .22 147. 52 +1.70
-10.04553 159.95
July_______________ _____ __________ 412 -6 .58 130.49 569 +2.52—2.88
160.40August__________________ ___ 412 —6.58 143. 65 —.97 539 170.44September__________________________ 416 -5 .67 142.28 -1 .9 2 441 -20.54 144.11October_____________________________ 437 - .9 1 155.14 +6.95
+2.24-15.30
365 -34.23 169. 34 +8.04 —6.19November_____________ ____ _______ 465 +5.44 148. 31 435 -21.62 147.03
December________________________ __ 475 +7. 71 122.86 561 +1.08 113. 59 -27.53
Average___________________ ___ 441 145.06 555 156.74
Plant 1: 1931 Plant 2: 1926
January_______________ __________ 693 -7 .23 $138.15 +0.80+5.72
647 -4 .71 $153.10 157.53
+0.45 +3.35 +7.49 -3 .3 1
February______ ____ _______________ 715 -4 .28 144.90 675 - .5 9March_______ ______________________ 762 +2.01 188.20 +37.31
+26.34 +20.58 +19.69
714 +5.15 +3.24 -2 .6 5
163.84April_______________ _______________ 830 +11.11
+23.16 +21.55
173.16 701 147.38M ay___________ ____ _______ _______ 920 165.27 661 138.85 —8.90June__________ ____ _______ _____ __ 908 164.05 639 -5 .8 9 157.24 +3.16
+ .24July________________________________ 787 +5.35 120.52 -12.07 570 -16.05 152.78August _______________ _ 731 -2 .14 97.27 -29.03 635 — 6.48 166.94 +9.53
+ .28-10.86
September_________________________ 696 -6 .83 94.03 -31.40 838 +23.42 +17.82 -10.46
152.85October._______ ____________________ 633 -15.26 109.03 -20.45 800 135.86November.......................................... . 630 -15.66 107.28 -21.73 608 154.13 +1.12
- .1 7December................................................. 660 -11.65 111.04 -18.98 654 -3 .6 8 152.16
Average______________________ 747 133.31 679 152.42
Plant 2: 1929 Plant 2: 1981
January................................................... 728 -14.45 $144.03 127.11
+20.03 +5.93 +4.96 +5.10
+15.97 +7.36 +8.34 +3.53 -3 .65
476 +8.43 +18.91 +28.93 +23.23 +13.90 +11.62 +5.69
-13.67
$112.12 99.32
+9.24—3.23February_______ ____ ______ ____ _ 917 +7.76
+6.23-2 .35
522M arch................................... ................... 904 125.95 566 114.63 +11.68
+9.79 +22.20 +35.20 -31.14
April....................... .......... .......... ........... 831 126.12 541 112.69M ay............. ........................... ............... 883 +3.76
+6.35 +11.16
139.16 500 125.43June___________ _________ __________ 905 128.83 490 138.77July_________ _________ ________ _ 946 130.01 464 70.68August_________________ _____ _____ 975 +14.57
+9.05124. 24 379 88.27 -13.92
September_______________ __________ 928 115.62 356 -18.91 82.71 -19.42October_______________ _____ _______ 839 -1 .41 89.66 -25.28 319 -27.33 77.49 -24.50November______________ ____ ______ 842 -1 .0 6 92.99 -22.51 320 -27.11 85.50 -16.70December................. ............................. 515 -39.48 79.83 -33.47 332 -24.37 92.82 -9 .5 7
Average........................................ 851 120.00 439 105.64
Plant 1: 1929
Digitized for FRASER http://fraser.stlouisfed.org/ Federal Reserve Bank of St. Louis

CHAP. 3.— RATES OP WAGES AND EARNINGS OF WORKERS 37T a b l e 17.— Monthly fluctuations in employment and earnings of wage earners in
the tire-building departments of 3 individual plants in 1926, 1929, and 1931— Continued
Month
January______February____March_______April________M ay_________June.................July_________A ugust..........September___October______November___December.......
Average.
Plant 3: 1926
Wage earners
Aver-
num-ber
cent of variation from
average
681583588608555515485607707778754743
-7 .0 4 -6 .7 2 -5 .9 2 -2 .7 2
- 11.20 -17.60 -22.40
- 2.88 +13.12 +24.48 +20.64 +18.88
Average actual earnings
Amount
Percent of variation from
average
$133.51 138.65 152. 22 128.28 113.35 115.00 114.69 147.44 139.24 121. 75 134. 78 130.07
131.21
+1. 75 +5.67
+16.01 -2 .23
-13 . 61 12.35
-12.59 +12.37 +6.12 -7 .21 +2.72 - .8 7
Plant 3: 1929
Wage earners
Aver-
num-ber
Percent of variation from
average
414430457478478473495522533481466
-12.29 -8 .9 0 -3 .1 8 +1.27 +1.27 + .21
+4.87 +10.59 +12.92 +1.91 -1 .2 7 -7 .2 0
Average actual earnings
Amount
$179.83 165.03 165.99 146.42 196.01 167.35167.93 162.88 133.45 111. 61 106.96102.93
150.40
Percent of variation from
average
+19.57 +9.73
+10.37 -2 .6 5
+30.33 +11.27 +11.66 +8.30
-11.27 -25.79 -28.88 -31 . 56
Plant 3: 1931
January...........February____March_______April_________M ay_________June............-July_________August............September___October______November___December.......
Average.
311311315329364385396391388404415416
-15.72 -15.72 -14.63 -10.84 -1 .3 6 +4.34 +7.32 +5.96 +5.15 +9.49
+12.47 +12.74
$131. 72 111. 98 135.27 122.22 123.43 133.52 79.71 86.9484.88 53.25 84.0785.89
100.69
+30.82 +11.21 +34.34+21. r+22.58 +32. 61 -20.84 -13.66 -15.70 -47.11 -16.51 -14.70
Undoubtedly the demand for tires which comes from the production of new automobiles and from renewal purchases of tires on older cars is seasonal, with apparently a major peak in the spring and a minor peak in the fall of the year. While the tire manufacturers are fully aware of the nature of this demand, no serious attempt has as yet been made to arrange the production side of the industry so as to eliminate or at least to mitigate the peaks and the valleys in the field of production. Several reasons have been advanced for the inaction on part of the manufacturers, some of which are the rapid changes in the styles and sizes of tires used as standard automobile equipment, changes in the cost of raw materials and in the selling prices of tires, and the dangers of carrying very large reserves of stocks. In the meantime, whether justifiable or not, each plant is compelled to carry a much larger reserve of workers and of plant equipment than would be required under more stabilized conditions. Any rationalization plan intended to provide work for the large number of technologically displaced workers in the tire industry must, therefore, necessarily contain a scheme to reduce the enormous seasonal fluctuations in the industry, which have been so violently accentuated during the last 3 years.
Digitized for FRASER http://fraser.stlouisfed.org/ Federal Reserve Bank of St. Louis

C h a p ter 4.—Manufacturing Automobile Tires: Preparation of Crude Rubber
Cutting, Washing, and Breaking Down Crude Rubber
Crude rubber is delivered to the tire manufacturing plants in bales or boxes weighing about 224 pounds each. The first operation in the plant proper is to cut the large mass of congealed rubber into smaller pieces more suitable for subsequent operations. Until recently many different devices have been used to cut crude rubber, depending largely on the grade of the rubber and the purposes for which it was intended, but now most plants use the vertical or horizontal hydraulic “ pie cutter” , which with one cut subdivides the bale of plantation rubber into 6 or 8 pieces.
From the cutter the smaller pieces of rubber are delivered to the “ cracking” or washing mills, which consist of two corrugated rolls rotating at different speeds and in opposite directions. The rubber is fed mto the washer between the rolls, which literally tear it to shreds and break it down into a spongy sheet. A perforated water pipe is located directly above the space between the two rolls, and the constant stream of water therefrom washes off all the impurities which are removed from the rubber by the continuous stretching, pulling, and kneading operations performed by the mill. The result is a thick, rough sheet of rubber which is removed from the mill and transferred by means of a hook conveyor or electric trucks to the drying room or to a vacuum dryer in order to eliminate all the moisture retained by the rubber from the washing operations. When thoroughly dry the sheeted rubber is brought back to the mill room, where it is “ broken down” or softened on mills similar to those used for washing the rubber but with smooth instead of corrugated rolls. The “ broken down” sheet of rubber is then delivered to the compounding room to be mixed with such ingredients as sulphur, gas black, etc., which are required for the vulcanization of the rubber.
The process of “ breaking down” the washed rubber and in some plants the entire process of cracking, washing, drying, and breaking down rubber has recently been replaced by a process of “ plasticating” the crude rubber on machines especially designed for this purpose and therefore called plasticators. The crude rubber is delivered to this machine directly from the hydraulic cutter either by means of a chute or a belt conveyor, and is fed into the plasticator through a hopper at the top of the machine. Inside the plasticator the small pieces of rubber are picked up by a revolving worm screw which thoroughly mangles and kneads the rubber. It is then automatically transferred to a lower cylinder where it is picked up by a second screw which forces it through a masticating chamber, from which it is automatically extruded in the form of a continuous rubber tube 7 to 8 inches in diameter. An automatically operated knife cuts the tube into pieces
38
Digitized for FRASER http://fraser.stlouisfed.org/ Federal Reserve Bank of St. Louis

F i g u r e l . — B a t t e r y o f c r u d e - R u b b e r w a s h i n g a n d B r e a k i n g - D o w n M i l l s .
Digitized for FRASER http://fraser.stlouisfed.org/ Federal Reserve Bank of St. Louis

F i g u r e 2 . — S h e e t o f I n d i v i d u a l W e f t l e s s C o r d s G u i d e d b y C e n t r a l . B o a r d a n d G a t h e r i n g c o m b D i r e c t l y i n t o C a l e n d e r .Digitized for FRASER http://fraser.stlouisfed.org/ Federal Reserve Bank of St. Louis

of desired length which are then removed from the machine, usually by means of a moving hook conveyor which travels a certain distance and back in order to cool the rubber. The plasticated rubber is then placed on trucks ready to be delivered to the compounding department.
The immediate result of the change from the average breaking- down mill to a plasticator has been a very large displacement of labor in the milling department. The plasticator was installed in some plants late in 1930 and in other plants, also included in this study, in 1931. Because of its recent installation it was possible to measure precisely the effects of the plasticator on the employment of labor in the milling unit. One plant reported a saving in direct labor amounting to the displacement of 41 men, due to the installation of 3 plastica- ing machines and a belt conveyor from the crude-rubber cutter to the plasticators. Another plant reported a displacement of 26 men resulting from the installation of 2 plasticators. The actual changes and the type of labor displaced were given by a third plant which recently installed a single plasticator and a small belt conveyor leading from the “ pie cutter” to the plasticator. The present labor requirements to attend both the crude-rubber cutter and the plasticator in the plant are:
CHAP. 4.— PREPARATION OF CRUDE RUBBER 39
Crude-rubber cutter:Truckers to open bales and deliver rubber to cutting machine____________1Cutting-knife operators_____________________________________________ ___1Helpers_____________________________________________________________ ___1
Plasticator:Feeders_____________________________________________________________ ___1Men to remove rubber from plasticator to hook conveyor to cool off__ ___1Men to remove cooled-off rubber from conveyor to trucks____________ ___1
Total__________________________________ __________________________ 6Prior to the installation of the plasticator, in order to produce
approximately the same amount of broken-down rubber ready to be delivered to the compounding division, the plant required the following organization:Cutting knife:
Truckers to deliver bales of crude rubber to cutter_______________________1Cutters_____________________________________________________________ ___1Assistants to push pieces of rubber down chute to floor where crackers
and washers were located_____________________________________________1Cracking, washing, and breaking down rubber:
Men to remove pieces of rubber from chute to pile___________________ ___1Cracking-mill operators--------------------------------------------------------------------- ---- 4Washing-mill operators______________________________________________ ___8Men to remove broken-down sheeted rubber to drying kiln___________ ___3Men to remove dried rubber to breaking-down mills__________________ ___2Breaking-down mill operators________________________________________ ___4Men to place broken-down rubber on trucks ready for delivery to
compounding room________________________________________________ ___2
Total___________________________________________________________ 27The change in the method of handling the crude rubber preparatory
for its delivery to the compounding department has resulted in a displacement of 21 men, or nearly three fourths of the force previously used.
Digitized for FRASER http://fraser.stlouisfed.org/ Federal Reserve Bank of St. Louis

40 LABOR PRODUCTIVITY IN AUTOMOBILE TIRE INDUSTRY
Milling, Compounding, and Mixing Rubber
Compounding rubber consists of mixing the crude rubber with various chemical ingredients such as sulphur, gas black, etc., in accordance with a formula required for the proper vulcanization of the rubber. The larger sheets of broken-down or plasticated rubber are cut by hand into smaller pieces and weighed for each individual batch. The scrap rubber, sulphur, gas black, and the several other chemicals are also weighed and placed in the same bin with the rubber or in a similar bin next to it bearing the same number or sign ticket as the bin containing the rubber. The prepared batches are delivered from the compounding room to the mixing division either by means of gravity rollers (which is usually the case when Banbury mixers are used), or on electric trucks (for the ordinary mixing mills). The mixing process consists of first warming up and softening the rubber and then adding thereto the chemical ingredients, one by one, until they are completely absorbed into the plastic mass of hot rubber.
The older and more general method of mixing crude rubber with chemicals was by means of 2-roll, smooth mills similar to those used in breaking down rubber. Formerly 60-inch mills were used, but now the larger 84-inch mills are prevalent. The mill man or mill operator places the broken-down crude rubber between the rolls. A few minutes of grinding suffices to warm up and soften the rubber and thus prepare it to receive the chemical ingredients. Each operator is equipped with a short but very sharp knife with which he time and again cuts the sheet of rubber enveloping the front roll of the mill, rolls it up into a thick mass, and places it back between the rolls for further grinding. Then he dumps the bulk chemicals into the mill, which are gradually absorbed into the mass of rubber. The repeated operations of cutting the sheet of rubber from the rolls and returning it to the mill are required to distribute the chemicals more evenly throughout the entire batch. There is a definite time set for the mixing of each batch, at the end of which the thoroughly compounded rubber is placed on trucks ready for delivery to the stock room to be “ aged ” before it can be used for subsequent operations. The mixing of batches has been expedited and the work of the operators greatly reduced by means of mixing aprons attached to the mills. The apron travels to and fro below the rolls of the mill, picks up the loose ingredients which fall through between the rolls, and delivers them to the front of the mill, where they are readily picked up by the operator and replaced in the mill.
The Banbury mixers, which are now generally used in all large rubber manufacturing plants, consist of an enclosed mixing chamber in which the operations of mixing the rubber with the chemical ingredients are performed by two rotating blades turning at different speeds and in opposite directions. The materials which make up the batch are fed into the mixer through a hopper, which is usually connected with the compounding room by a system of gravity rollers or other conveyors. In the larger plants the compounding room is completely equipped for the automatic handling and weighing of all the ingredients. The dry chemicals are stored in large bins which are provided with chutes for the automatic discharge of the quantities required for a batch. The smaller batch bins or boxes travel automatically from one storage bin to another, reach the hopper of
Digitized for FRASER http://fraser.stlouisfed.org/ Federal Reserve Bank of St. Louis

the Banbury, and the contents are automatically discharged into the mixer. The empty boxes are then automatically conveyed back to start another mixing cycle. At the expiration of the time set for the mixing operations in the Banbury mixer the machine automatically releases a door through which the thoroughly mixed rubber and chemical ingredients are discharged in lumps upon a chute leading directly to a sheeting mill attached to the Banbury mixer. The individual pieces are converted into a soft sheet of compounded rubber by a sheeting operation similar to that performed by a regular mixing mill.
Although the introduction of Banbury mixers can be dated prior to 1922 there are still a number of plants which either have no Banbury mixers at all or use both mixing mills and Banbury mixers. Comparisons of the two mixing methods and the effects of the transition on the employment situation in the compounding and mixing departments are available for the several plants covered by the survey of the Bureau of Labor Statistics and also from other studies made for the purpose of measuring the effectiveness and operation costs of the two processes.
Plant 1 has 5 large and 4 smaller Banbury mixers with an average capacity of 598,400 pounds of batches mixed daily. The labor requirements for the combined compounding and mixing operations of this plant are:
Man-hoursCompounding stock____________ 168Mixing and sheeting batches___ 624
Total___________________ 792To prepare the same amount of batched rubber on regular 84-inch
mixing mills the following labor was required:Man-hours
Compounding stock___________ 294Mixing and sheeting batches___ 1, 299
Miscellaneous_________________ 58
Total___________________ 1,651The total labor saved by the change from regular mills to Banbury
mixers equipped with necessary conveyors is 859 man-hours per day, which is equivalent to 52 percent of the total force formerly used in the compounding and mixing divisions of the plant.
Plant 2 uses a single small Banbury mixer to compound and mix an average of 118,000 pounds of batches required in the preparation of tire-tread stock. Its present operation force consists of 3 compounders and Banbury mixer operators, 1 inspector, and 1 weighman. The quantity of rubber is compounded and mixed in 2.84 shifts of 7% hours each, requiring a total of 106.50 man-hours. Before the installation of the Banbury mixer the same plant operated 3 lines of 84-inch regular mixers attended by 6 compounders and millmen and 3 inspectors. To produce the same amount of batched stock the regular mills were operated 2.73 shifts of 7% hours each, making a total of 184.28 man-hours per day. The change to the Banbury mixer produced a displacement of 78 man-hours which is over 42 percent of the force required by the regular mills.
Plant 3 is a large tire-manufacturing plant where 5 Banbury mixers are now doing the work formerly done by 19 regular mills. The
CHAP. 4.— PREPARATION OF CRUDE RUBBER 41
Digitized for FRASER http://fraser.stlouisfed.org/ Federal Reserve Bank of St. Louis

comparative labor requirements of the two mixing processes per shift are:
42 LABOR PRODUCTIVITY IN AUTOMOBILE TIRE INDUSTRY
5 Banbury units:Operators and inspectors____ __ 3Sheeting-mill operators_________5
Total__________________ ___8
19 regular 84-inch mixing mills:Operators___________________ 19Inspectors__________________ 1
Total__________________ 20The 12 men displaced by the 5 Banbury mixing units constitute
60 percent of the total labor force formerly required per shift to mix stock only. In addition, the Banbury mixers made it possible to install automatic equipment in the compounding department, which resulted in further decreasing the labor requirement in this division. By the old system the stock compounding required 75 compounders and weighers, 12 inspectors, 12 truckers, and 10 additional workers, making a total of 109 workers per day. With the automatic conveyors the same amount of stock now requires only 26 compounders and weighers, 11 inspectors, and 12 additional workers, making a further labor displacement of 60 men or 55 percent of the compounding force formerly used.
Calender Department
The term “ calendering” is applied to the process of sheeting the compounded rubber either alone or in combination with fabric or cord materials. When the rubber is impregnated into every cavity of the cross-section fabric formerly used, or is made to envelop every single strand of the cord fabric used nowadays, the process is known as friction calendering. This is accomplished by applying a different speed for the rubber roll from that used for the fabric. With a uniform speed for all the calender rolls there is produced a smooth sheet of rubber of an even thickness, which covers the entire surface of the fabric and is therefore known as skim-coat calendering.
The average calender machine consists of three large rolls superimposed one on top of the other. The spaces between the rolls determine the thickness of the sheet to be calendered. The compounded rubber is first warmed up and softened on a regular mixing mill, which is located adjacent to the calender and is called a warm-up mill. The soft mass of warm rubber is then carried over to the calender and placed between the upper and the middle rolls which rotate in opposite directions. The sheet of rubber thus formed is driven by the second roll into the space between this and the third roll. The fabric also passes through that space, and the speed and the relative positions of the rubber and the fabric determine whether the rubber is to be impregnated into the fabric or merely skim-coated on one side or the other.
In the early development of pneumatic tires the fabric used in tire construction was square woven. It was not until 1915 that the advantage of the cord type of fabric was established. This type of fabric has very few cross threads or wefts to keep the body of the fabric together. In the weftless cord the cross threads are entirely eliminated. The individual strands or cords are drawn from separate cones and are delivered by means of a guiding board to a central
Digitized for FRASER http://fraser.stlouisfed.org/ Federal Reserve Bank of St. Louis

gathering comb located directly above the calender. (See fig. 2.) The comb determines the exact number of cords to be used and keeps the individual strands distributed at an equal distance from each other. After passing the heating and drying compartments the sheet of properly spaced cords enters the calender simultaneously with a band of soft warmed-up rubber which is also delivered automatically from the warming-up mills. Most plants use 2 sets of 3-roll calenders geared together so that the sheet of cords skim-coated on one side by the first calender is allowed to travel a certain distance and to cool off before it enters the second calender to be skim-coated on the other side. This arrangement of calenders is commonly known in the industry as “ train” or “ tandem” calendering. Upon emerging from the second calender the sheet of rubberized cord or fabric is rolled up between layers of cotton material or “ liners” in order to prevent it from sticking.
Technological Changes and Labor Displacement in Washing, Milling, Compounding, and Calendering Rubber
The effects of some of the major and minor technological changes in the crude rubber, milling, compounding, and calendering departments on the labor employment situation in the respective departments of three tire plants are given in table 18, showing the nature of the technological change and the amount of labor time saved or displaced in the unit affected by the change.
T a b l e I S .— Effect on labor of specified technological changes in the crude rubber, milling, compounding, and calendering departments of 8 tire plants
CHAP. 4.— PREPARATION OF CRUDE RUBBER 43
Technological change
Plant 1—ms-31
New cutter for crude-rubber bales installed............. ......
2 Banbury mixers installed with necessary conveyors and other equipment.
Additional spray-cooled Banbury mixer and 3 spray sheeting nulls installed, together with all accessory equipment.
2 tread calenders equipped with automatic feed devices.Tandem calenders equipped with push-button con
trols.Plant 2-1980-81
3 crude-rubber plasticators installed.......................... ......
A power-driven belt conveyor and a cooling conveyor installed for handling and cooling of plasticated rubber.
4 additional mixing mills installed................... .................
Automatic system installed to deliver compounding ingredients to mill room and Banbury mixers.
Liquid soapstoning devices installed for Banbury mixers.
Compounding unit installed for servicing all Banbury mixers.
Automatic ribbon feeder installed, delivering rubber from warming-up mill to calender.
Tandem and other calenders equipped with automatic operating control.
Large calenders equipped with electric hoist..................Tread calender equipped with mechanical feed con
veyor,
Effect on labor
Crew of 4 men reduced to 2; 16 man-hours saved per day.
960 man-hours saved per day.
480 man-hours saved per day.
6 men eliminated; 48 man-hours saved per day.4 men eliminated; 32 man-hours saved per day.
328 man-hours saved, which is equal to the displacement of 41 men.
11 workers formerly used to handle plasticated rubber eliminated.
Operators required to handle 2 mills per man, with a total saving of 48 man-hours per day.
5 men who used to fill drums with ingredients and deliver them to the mill room, eliminated.
3 men per day, who formerly soapstoned by hand, eliminated.
6 truckers per day eliminated.
6 feeders and truckers eliminated.
4 control men eliminated from calender crew.
1 crane operator per shift eliminated.2 feeders per shift eliminated, making a total dis
placement of 6 men.
Digitized for FRASER http://fraser.stlouisfed.org/ Federal Reserve Bank of St. Louis

44 LABOR PRODUCTIVITY IN AUTOMOBILE TIRE INDUSTRY
T a b l e 18 .— Effect on labor of specified technological changes in the crude rubber, milling, compounding, and calendering departments of 3 tire plants— Continued
Technological change Effect on labor
Plant 8-1929-31
Sliding chute erected leading from crude-rubber cutter to the plasticators.
2 rubber plasticators installed...................................... .......
2 truckers and 2 bale openers per day eliminated.
Total saving, 208 man-hours per day, equivalent to the displacement of 26 men.
3 truckers, 11H mill helpers, and 18 compounders, or a total of 32}4 men displaced.
2 truckmen, 8 millmen, and 6 compounders eliminated. Total saving per day, 128 man- hours.
3 truckers and 6 mill helpers eliminated.5 feeders per shift eliminated.
1XA men per shift eliminated.
Electric elevator and conveyor installed for the direct compounding of ingredients for 5 Banbury mixers.
Banbury mixers installed for 2 tandem calenders______
Additional conveyor installed for Banbury mixers____Tandem calenders equipped with automatic feeding
device.Automatic feed installed for tread calender.... .......... .
Labor Productivity in Washing, Compounding, Milling, and Calendering Rubber
Table 19 contains a composite picture of the operations of washing, compounding, milling, and calendering rubber in the six representative tire plants covered by the survey. The statistics are prepared along the lines of table 5, referring to the total production of the six plants. The figures for the total output in tires produced are the same as in table 5. The man-hours, however, include only the direct productive labor expended in washing, compounding, milling, and calendering departments. In 1922 the average output per man per hour in these departments was 3.83 tires or 68.47 pounds of rubber compounded with fabric. In 1931 the corresponding man-hour output of the same departments was 6.51 tires or 152.57 pounds. Since1922 the tire man-hour output in these departments has nearly doubled and the weight output has more than doubled. With 1926 as a base, the index of man-hour tire output rose from 77.71 in 1922 to 132.15 in 1931. The corresponding index of weight output in these departments rose from 69.86 in 1922 to 155.66 in 1931.
T a b l e 1 9.— Total and man-hour production in washing, compounding, milling, and calendering in 6 representative plants, and index numbers thereof\ 1922 to 1931, by years
Year
Total output
Man-hours
worked
Output per man-hour Index numbers (1926=100)
Number of tires Pounds
Number of tires
PoundsTotal output
Man-hours
Output per man-hour
Tires Pounds Tires Pounds
1922............. . 18,320,000 327,593,000 4,784,000 3.83 68.47 65.69 59.06 84.54 77.71 69.861823_________ 20,631,000 363,028,000 5,037,000 4.10 72.08 73.98 65.44 88.99 83.13 73.541924............. . 23,182,000 394,583,000 5,062,000 4.58 77.95 83.13 71.13 89.44 92.96 79.531925_________ 26,936,000 523,359,000 6,065,000 4.44 86.30 96.59 94.35 107.15 90.16 88.051926_________ 27,887,000 554,716,000 5,660,000 4.93 98.01 100.00 100.00 100.00 100.00 100.001927_________ 31,311,000 657,825,000 6,402,000 4.89 102.76 112.28 118.59 113.11 99.27 104.851928........... . 37,488,000 812,047,000 7,512,000 4.99 108.10 134.43 146.39 132.73 101.30 110.291929_________ 37,783,000 863,518,000 7,399,000 5.11 116.70 135.49 155.67 130.74 103.63 119.071930_________ 29,865,000 726,370,000 5,592,000 5.34 129.89 107.09 130.94 98.81 108.40 132.531931............ 29,001,000 679,578,000 4,454,000 6.51 152.57 103.99 122.51 78.70 132.15 155.66
Digitized for FRASER http://fraser.stlouisfed.org/ Federal Reserve Bank of St. Louis

For the individual plants the man-hour output in washing, milling, compounding, and calendering rubber shows considerably larger variations than those for the six plants combined. In plant 1, which has the largest variation between 1922 and 1931, the index of man- hour tire output ranges from 71.31 in 1922 to 225.56, or more than threefold, in 1931. The corresponding index of weight output of this plant ranges from 60.22 in 1923 to 245.90, or more than fourfold, in 1931.
Plant 2 averaged 2.18 tires or 36.55 pounds handled per man per hour in the washing, milling, compounding, and calendering departments in 1920. The corresponding production in the same plant for 1931 was 6.53 tires and 149.29 pounds of rubber compounded with fabric. The index of man-hour tire output in these departments rose from 44.73 in 1920 to 133.87 in 1931, while the corresponding index of weight output rose from 42.85 in 1920 to 175.01 in 1931. The biggest rise in man-hour output during the entire period occurred between 1930 and 1931, when the index of tire output jumped nearly 30 points and the corresponding index of weight output jumped more than 36 points.
Plant 3 shows a variation in the man-hour output of washing, milling, compounding, and calendering rubber from 7.82 tires or 96.23 pounds in 1921 to 9.40 tires and 173.07 pounds in 1931. The index of man-hour tire output ranges from 91.42 in 1921 to 109.87 in 1931, and the corresponding index of weight output ranges from 81.79 in1921 to 147.10 in 1931. From 1921 through 1930 the changes in man- hour productivity of this plant were very gradual, rising in some years and then declining, but not deviating much from the 1926 level. In 1931, however, the index of man-hour tire productivity in these departments jumped more than 13 points and that of weight output more than 14 points from the 1930 level, thus indicating a technological displacement during the last year considerably larger than during any previous year.
The average man-hour output in washing, milling, compounding, and calendering rubber with cord fabric in plant 4 rose from 2.49 tires or 51.71 pounds in 1919 to 4.61 tires and 141.26 pounds in 1931. The index of man-hour tire output ranges from 54.70 in 1919 to 101.52 in 1931. There was a steady rise in the man-hour output of the washing, milling, compounding, and calendering departments from 1919 through 1926. The Banbury mixers in this plant were installed in 1925, which accounts for the large increase in the man-hour output shown in 1926. A change in the milling and mixing requirements introduced in 1927 resulted in a considerable drop in the man-hour output and kept it comparatively low through 1930. But as in the other plants, the 1931 man-hour output showed a big rise, more than 12 points in the index of tire output and more than 16 points in the index of weight output as compared with the 1930 figures.
Plant 5, which specializes in the production of very large sizes of tires, shows a productivity trend in its washing, milling, compounding, and calendering departments which is decidedly different from all other plants. In 1922 this plant averaged 5.04 tires and 87.30 pounds per man per hour. Since then there has been a slow but gradual drop in the man-hour output measured by the number of tires produced. In 1929 the average man-hour output of these departments was 2.82
171867°—33------i
CHAP. 4.— PREPARATION OF CRUDE RUBBER 45
Digitized for FRASER http://fraser.stlouisfed.org/ Federal Reserve Bank of St. Louis

tires, or about 56 percent of the 1922 figure. In 1931 it was 4.01 tires, or about 80 percent of the 1922 output. The corresponding man-hour output, measured by the weight of rubber compounded with fabric used in the production of tires, shows a range from 87.30 pounds in 1922 to 130.62 pounds in 1931. The rapidly increasing weight of the average tire produced in this plant from 1922 through1929 was the sole reason responsible for the different trends shown by the man-hour output when measured by the number of tires produced and by the weight of the rubber compounded with fabric used in the production of the tires.
Plant 6 has the least variation of the 1931 man-hour output from the 1926 average notwithstanding the fact that it has the largest actual man-hour production measured either by the number of tires or by the weight of the rubber compounded with fabric used in the production of tires. In 1919 this plant, in its washing, milling, compounding, and calendering departments, averaged 6.66 tires or 75.69 pounds per man per hour. The installation of Banbury mixers in1923 and 1924 raised the man-hour output in these departments from 11.80 tires in 1923 to 14.08 in 1924. This was the maximum average produced in this plant so far as the number of tires is concerned. In 1931 the average was only 11.67 tires per man-hour. But the corresponding weight output of these departments shows a different trend from the tire output. Although the rise in 1924 from the previous year amounted to more than 27 pounds per man per hour, the 1924 output did not constitute the maximum for that plant. For a number of years this output showed no decided trend, rising during 1 year and then declining abruptly, only to rise again in another year. In1930 the average man-hour output was 195.07 pounds, the maximum for the entire period between 1919 and 1931.
Table 20 shows data for the individual plants of actual man-hour production and index numbers thereof for washing, compounding, milling, and calendering rubber.
46 LABOR PRODUCTIVITY IN AUTOMOBILE TIRE INDUSTRY
T a b le 30.—Actual man-hour 'production and index numbers of total and man-hour production in washing, milling, compounding, and calendering rubber in 6 specified plants, in specified years, 1919 to 1931
Output per man- hour Index numbers (1926=100)
Plant number and yearNumber of tires Pounds
Total outputMan-hours
Output per man- hour
Tires Pounds Tires Pounds
Plant 1:1922______ ________ _______ 2.21 38.44 70.05 60.33 98.23 71.31 61.421923_____________ ____ ____ 2.21 37.69 73.40 61.94 102.86 71.34 60.221924_______________________ 2.46 41.67 79. 57 66.55 99.94 79.61 66.591925____ ___________ ____ 2.77 52.56 103.18 96.76 115.22 89.56 83.981926_______________________ 3.10 62.59 100.00 100.00 100.00 100.00 100.001927_______________________ 3.55 77.31 75.97 82.77 66.19 114.77 123.521928......................... .............. 3.74 85.40 104.16 117.61 86.18 120.84 136.451929____ __________________ 4.23 99.19 100.42 116.48 73.49 136.64 158.491930.......................................... 5.08 117.71 148.84 170.50 90.65 164.17 188.081931........................................... 6.98 153.90 204.44 222.86 90.63 225.56 245.90
Digitized for FRASER http://fraser.stlouisfed.org/ Federal Reserve Bank of St. Louis

CHAP. 4.— PREPARATION OF CRUDE RUBBER 47T a b le 2 0 .— Actual man-hour 'production and index numbers of total and man-hour
production in washing, milling, compounding, and calendering rubber in 6 specified plants, in specified years, 1919 to 1931— Continued
Plant number and year
Output per man- hour Index numbers (1926=100)
Number of tires Pounds
Total outputMan-hours
Output per man- hour
Tires Pounds Tires Pounds
Plant 2:1920.......... .......... ................... . 2.18 36.55 66.62 63.82 148.96 44.73 42.851921____________ ____ _____ 2.71 45.96 39.22 37.99 70.51 55.62 53.881922_______________________ 3.46 57.42 67.98 64.50 95.83 70.93 67.311923_______________________ 3.64 56.82 76.87 68.58 102.96 74.66 66.611924_______________________ 4.11 63.53 94.46 83.40 111. 99 84.34 74.481925_________ _____________ 4.17 71.26 102.90 100.62 120.44 85.42 83.541926.____ _____ ___________ 4.88 85.31 100.00 100.00 100.00 100.00 100.001927______________ _____ 5.75 105.90 135.42 142.54 114.82 117.94 124.151928................. ................. 5.79 108.83 147.29 158.39 124.16 118.61 127.571929._____ ______ _________ 5.25 105.60 132.66 152.61 123. 28 107.61 123.791930______________ ____ 5.08 118.52 91.87 122. 65 88.28 104. 06 138.941931_______________________ 6.53 149.29 81.08 105.99 60.56 133.87 175.01
Plant 3:1921........ ........ .............. .......... 7.82 96.23 65.87 58.93 72.05 91.42 81.791922____ __________________ 8.24 101.40 67.97 60.81 70.56 96.33 86.191923_____ _______ _________ 9.13 112.26 92.94 83.15 87.15 106.64 95.411924_____ _____ ___________ 9.11 111. 72 93.83 83.70 88.15 106.45 94.961925_______________________ 8.30 115. 79 100.61 102.12 103. 76 96.96 98.421926_____ _______ _________ 8.56 117. 66 100.00 100.00 100.00 100.00 100.001927_______________________ 8.08 115.98 132.98 138.82 140.83 94.43 98.571928____ _____ _______ ____ 8.41 128.78 146. 84 163. 44 149. 32 98.33 109.451929______ _____ __________ 8.06 136.86 184.17 227. 60 195.65 94.13 116. 331930__________ ______ _____ 8.26 156.14 129.97 178.68 134.64 96.53 132.711931______ ________________ 9.40 173.07 116.13 155. 48 105. 69 109.87 147.10
Plant 4:1919_______________________ 2.49 51.71 73.30 67.62 136.47 54.70 49.551920_______________________ 2.52 50.19 64.18 56.77 118. 04 55.36 48.091921_____ _________________ 2.52 54.79 38.01 36.62 69.89 55.49 52.501922_______ _____ _________ 3.07 65.86 63.39 60.24 95.46 67.62 63.111923_______________________ 3.20 69.69 60.11 57.99 86.84 70.47 66.781924___________ _____ _____ 4.16 78.50 72.34 60.57 80.52 91.46 75.221925_______________________ 4.30 89.84 94.36 87.66 101.82 94.37 86.091926_____ _________________ 4.55 104.36 100.00 100.00 100.00 100.00 100.001927_______________________ 4.02 98.54 119.13 129.51 137.16 88.45 94.431928____________ ____ _____ 3.95 101. 30 150.15 170.75 176.07 86.47 97.061929____ __________________ 4.22 114.84 142.83 172.28 156.56 92.89 110.041930_______________________ 4.06 124.45 108.30 147.10 123. 36 89.39 119. 251931_______________________ 4.61 141. 26 90.02 122.20 90.28 101.52 135.35
Plant 5:1922______ ____ ___________ 5.04 87.30 66.00 52.52 61.60 107.14 85.251923_______________________ 4.86 91.49 66.07 57.18 64.00 103.23 89. 351924_______________________ 4.96 94.11 74.57 65.00 70.73 105. 42 91.901925........ .................. .............. 4.82 101.24 93.28 89.94 90.98 102.53 98.861926______________ _____ 4.70 102.40 100.00 100.00 100.00 100.00 100.001927____ __________________ 3.81 99.12 86.32 103. 22 106.64 80.95 96.791928__________________ ____ 3.43 102. 45 84.32 115. 73 115. 68 72.89 100.051929____ ___________ ____ - 2.82 100.59 75.18 122.99 125. 20 60.05 98.231930____ __________________ 3.34 112.49 56.46 87.33 79.49 71.49 109.861931_______________________ 4.01 130. 62 49.33 73.77 57.83 85.31 127.56
Plant 6:1919_______ ______ ________ 6.66 75.69 56.23 49.53 114.72 49.02 43.171920.......................................... 7.98 88.07 54.33 46.51 92.59 58.68 50.241921_________ _____________ 11.53 137. 22 45.26 41.78 53.38 84.78 78.271922____________ ____ _____ 11.23 129.68 60.86 54.51 73.69 82.59 73.971923_______________________ 11.80 136.33 77.56 69.49 89.36 86.79 77.761924_______________________ 14.08 163.62 81.90 73.82 79.09 103.55 93.331925......................................... 12.47 153.37 87.84 83.81 95.80 91.70 87.491926_______________________ 13.59 175.31 100.00 100.00 100.00 100.00 100.001927_______________________ 9.73 129.79 109.67 113.41 153.19 71.59 74.041928_______________________ 9.75 139.12 157.98 174.76 220.23 71.74 79.381929______ _______ ________ 11.84 175.35 172.40 198.05 198.00 87.07 100.021930_______________________ 12.61 195.07 127.60 153.07 137.57 92.75 111. 271931______ ________________ 11.67 187.97 122.81 153.36 143.03 85.87 107.22
Digitized for FRASER http://fraser.stlouisfed.org/ Federal Reserve Bank of St. Louis

C h ap ter 5.—Manufacturing Automobile Tires: Stock Preparation and Carcass Building
The actual process of making or building a pneumatic tire consists in assembling the several constituent elements which make up the body of the tire. The principal parts of a pneumatic tire are: Four to ten plies (or more in the case of the very large tires) of rubberized cord which make up the main support or the body of the tire; a set of two beads to support the tire on the rim of the wheel; the tread, or that part of the tire which comes in direct contact with the road; the sidewalls; and the various strips, chafers, flippers, cushions, and breakers, which are incorporated into the body of the tire at several strategic positions in order to protect the tire and the automobile against unexpected jars and at the same time to increase the resiliency of the tire. Most of these parts require special preparation before they are delivered to the assembly room.
Making Tire Plies
From the calenders the large rolls of calendered sheet stock are transferred to the bias cutting machine. Several types of bias cutters are in use in the different plants, such as, the Birmingham cutter, the Rotary, the Banner bias cutting machine, the Spadone, etc., depending entirely on the layout and the particular needs of the plant. In each machine the cutting knife is set at an angle of about 45° and adjusted to the required width of the ply. As the roll of calendered stock is gradually unwound, the rubberized sheet of cord passes under the knife, which cuts it into bias strips. These are picked up by an operator who hangs them on a conveyor leading directly into the assembly room. In the case of the rotary or horizontal cutters the individual plies travel automatically on a belt leading from the cutter to the building section, where they are picked up by a service man or girl and are placed within easy reach o! the tire builders. In many plants the ply bias cutting machines are located in the tire- building section proper and are so placed that a single cutting machine is used to supply half a dozen or more tire builders. As the plies leave the bias cutter, they are spliced together and then cut to length and placed in special trays located in front of the tire-building machines, or are fed into racks or festoons from which the builder himself tears off the plies of the desired length, as and when he needs them.
For very large tires built by the “ core” process, the plies are prepared by special “ band” builders. Two plies of the desired length are pressed together and their ends joined or stitched together to form an endless band. If necessary the bands are stretched on special stretching machines and then “ booked” to be delivered to the tire builder. The term “ booking” is used because each band is placed
48
Digitized for FRASER http://fraser.stlouisfed.org/ Federal Reserve Bank of St. Louis

f i g u r e 3 . — C r o s s s e c t i o n o f c o r d T i r e .
Digitized for FRASER http://fraser.stlouisfed.org/ Federal Reserve Bank of St. Louis
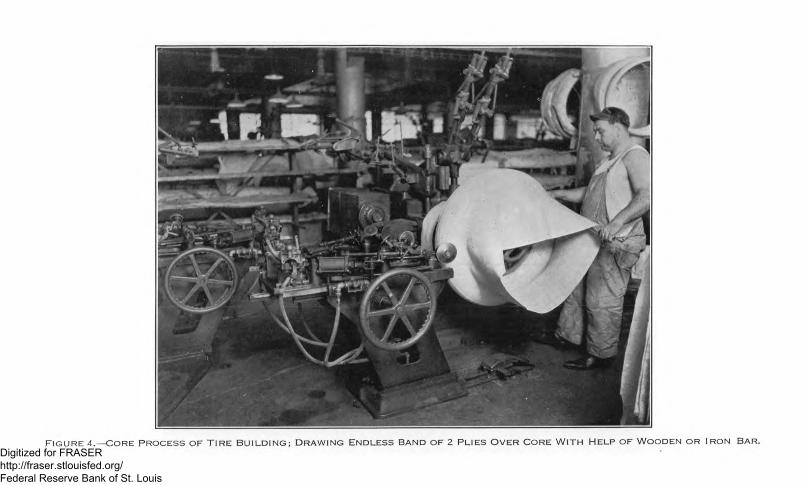
f i g u r e 4 . — C o r e p r o c e s s o f T i r e b u i l d i n g ; D r a w i n g E n d l e s s b a n d o f 2 p l i e s O v e r C o r e w i t h h e l p o f W o o d e n o r i r o n b a r .Digitized for FRASER http://fraser.stlouisfed.org/ Federal Reserve Bank of St. Louis

between two layers of liners, thus preventing the bands from sticking to one another. The large tires require 10 or more plies, and the preparation of bands saves the builder the labor of handling and shaping each individual ply separately.
Making Tire Beads
Since the universal adoption of the drop center wheel rims, the clincher beads, made from pressed rubber, have been replaced by wire beads. In no single tire department can there be found such a variety of processes and methods used as in the wire-beads section. The transition from one process to another has been exceedingly rapid, and in some plants several methods may be found in use side by side, necessitated either by the variety of types and sizes of beads made or simply because the replacement of one process by another has not yet been entirely completed. The bead may be described as a hoop of several strands of insulated and in some cases braided wire, covered with several layers of rubber and rubberized fabric. It is reinforced with an appendage or flipper, also made of rubberized fabric, which enables the bead to be incorporated into the body of the tire, usually between the second and third plies, or between the second and third bands if the tire is built by the “ core” process. In some plants the braiding of the wire, forming the hoop, insulating the ends of the wires, making the flipper, applying it to the bead, buffing the bead, applying an extra layer of gum to the sides, semicuring the bead, etc., are still individual operations performed by hand with the help of semiautomatic equipment. Other plants do not braid their bead wires, the wire being driven automatically through an insulating machine, then to a hoop-forming machine which automatically throws off the insulated hoop to a near-by conveyor. Automatic devices are used in making the flipper, applying it to the bead, and finishing the bead. Nearly all the work in the bead department is performed by women, but these are rapidly being displaced by various labor-saving devices which do the work much faster.
Constructing the Tread and the Side Walls of a Tire
The life of a tire is generally limited to the life of its tread, which alone comes in direct contact with the road and bears the entire wear and tear produced by the friction between the tire and the surface of the road. Special chemical compounds are therefore used to give the tread of the tire the necessary resiliency and firmness to withstand the friction and at the same time to absorb the shocks and spare the body of the tire and the entire automobile. But the making of the tread is not at all complicated. The tread stock, which is compounded and mixed separately from the other tire stock, is warmed up on a regular warming-up mill and then delivered either by a feeder or on an automatic belt to a tubing machine, if a tubing process is used, or to a tread calendering machine, if the tread is calendered. From the tuber or calender, the continuous band of rubber, already shaped to the requirements of a tread (very thick at the center and tapering to sharp edges on both sides), travels on an endless-belt conveyor through a trough of water to be cooled off. Upon emerging from the water the tread is cut to length, either by a male operator or by an auto
CHAP. 5.— STOCK PREPARATION AND CARCASS BUILDING 49
Digitized for FRASER http://fraser.stlouisfed.org/ Federal Reserve Bank of St. Louis

matic knife, is weighed by a male operator or on an automatic scale, and is booked between liners ready to be delivered to the assembly room. Except for the very large or special tires requiring white or fancy side walls, the typical side walls are now tubed or calendered as a part of the tread.
Making Chafers, Cushions, Breakers, etc.
Chafers, cushions, breakers, inserts, etc., are extra strips of rubber or rubberized fabric cut to bias and incorporated into the body of the tire where necessary, either to protect that part of the tire from unexpected jars or to increase the resiliency of the tire. The chafing strips are placed, two on each side of the tire, around the bead and extending to the side wall, thus protecting the body of the tire from the pressure of the beads. The breaker is a ply of rubberized fabric which is placed between the body of the tire and the tread but which is insulated from either side by thick layers of rubber, called cushions. The process of preparing these small strips has undergone considerable change during the last few years, with more and more automatic devices taking the place of hand work. Automatic bias cutters, combinations of several strips prepared simultaneously, automatic units for winding up the stock between liners, etc., have resulted in the large elimination of jobs formerly done by girls. It is in this department, as well as in the bead-making division, that the largest displacement of labor has occurred during the last few years.
Building the Body or Carcass of the Tire
/Two distinct processes of tire building now prevail in most plants— the flat or shoulder drum process, used for the majority of passenger- car tires, and the “core” process, applied only to the very large pas- senger-car and truck tires. In both cases the tires are built by hand with the help of tire-building machines. These have undergone a number of important changes aimed primarily to reduce and lighten the work of the tire builder. Nevertheless, the machines remain semiautomatic in the sense that they are used only to assist the operator, who is called upon to perform the work of assembling the parts of the tire with his own hands, using the machine only as and when needed, by applying the switch or foot pedal.
The “core” process derives its name from the tire-shaped iron or aluminum core upon which the carcass of the tire is built. It is a part of the tire-building machine. Because of the complications due to the differences in the diameters of the outside of the tire and the tire bead, and also because of the peculiar shape of the walls of the tire, the core method of tire building is classified among the most skilled operations in the tire industry. The bands, each containing two plies of rubberized cord, must first be stretched or drawn over the core and properly centered. The next step is to fit the edges of the band over the core. To reduce the diameter of the band when applying it to the bead section of the core, the operator i,s compelled to use special wheel stitchers which enable him to shorten the band without wrinkling the rubber. The same operations are performed for each individual band which must be fitted tightly over the core. Considerable expert stitching is also required to incorporate the bead
50 LABOR PRODUCTIVITY IN AUTOMOBILE TIRE INDUSTRY
Digitized for FRASER http://fraser.stlouisfed.org/ Federal Reserve Bank of St. Louis

F i g u r e 5 . — D r u m P r o c e s s o f T i r e B u i l d i n g ; P l a c i n g a n d a p p l y i n g S e c o n dP l y o f t i r e .
Digitized for FRASER http://fraser.stlouisfed.org/ Federal Reserve Bank of St. Louis

F i g u r e 6 . — S h a p i n g D r u m - B u i l t T i r e s ; P l a c i n g F l a t B a n d i n T i r e - S h a p i n gV a c u u m B o x .
Digitized for FRASER http://fraser.stlouisfed.org/ Federal Reserve Bank of St. Louis

smoothly between the bands. Many of the larger tires have more than 10 plies in addition to the several layers of cushions and inserts, which must be skillfully applied before the tread and the side walls are finally put in their respective positions on the tire. The core is then collapsed, and with considerable effort and hard labor on the part of the tire operator the tire is taken off the machine. The carcass removed from the core looks exactly like a finished tire. Notwithstanding the recent remarkable improvements in the core machines this method of tire building still requires a large amount of training and skill on the part of the tire builder. It is also very laborious, and in many plants only strong men weighing not less than 180 pounds are trained for this kind of work.
The principal characteristic of the core process of tire building is that the tire receives its final shape during the carcass-building operation, which is not the case with the flat or shoulder drum process. The several plies— 4 or 6 as a rule—are placed loosely upon the drum, one on top of the other, with their cords at right angles to one another. The beads are set between the second and third plies and the ends of the plies are turned in over the beads, thus locking them into the carcass, but again without any tension. After the last ply has been applied, the chafers, breaker, and cushion are added and then the tread is put into place. The drum is collapsed and the wide band, which is far from looking like a completed tire, is removed from the machine ready to be delivered to the “ shaping” room. The work of drum tire building is performed very rapidly and requires neither long training nor any particular strength on the part of the tire builder. The process is now completely standardized, as may be seen from the following description of the detailed operations required in building a typical 4-ply tire on a Banner-type machine equipped with turrets for the rolls of stock and with special pans for the plies and tread, which are supplied to the machine by 1 helper servicing 2 tire-building machines.
The supply boy pulls out pan for first ply; places first ply into pan; positions first ply; tears ply to length; performs similar operations for all other plies; positions turret; gets tread; places tread on pan; turns end of tread; swabs ends of tread with benzine; positions tread on pan.
The tire builder gets inside bead from hook; places bead on inside bead ring while drum remains open; starts machine to close drum; applies cement to drum; places outside bead ring in normal position; gets first ply; starts machine with foot switch; applies first ply to drum; splices first ply; positions drum to apply second ply; gets second ply and positions it opposite drum; applies and splices second ply; presses edges of first and second plies together; stitches first and second plies together over shoulder of drum; operates control to apply bead rings to drum; gets combination tools and stitches beads to carcass; releases bead stitchers and swabs stock at beads for tu’rn-up; positions overhead stitchers and makes turn-up; inspects turn-up; gets third ply and positions ends; applies and splices third ply; positions drum for fourth ply; gets and positions fourth ply; applies and splices fourth ply; positions insert and bead cover by means of special guide; applies inserts and bead covers to carcass; cuts off bead cover and insert and stitches them to carcass; swabs carcass for tread; positions tread by means of special guide; skives insert splice; gets end of tread and fits it to carcass; applies tread to carcass; joins ends of tread; presses tread to carcass; starts machine stitcher over tread; skives tread edges and stitches bead cover over beads; stitches tread splice; collapses drum and removes tire; hangs tire band on conveyor.
The simplified operations in the flat or shoulder drum process of tire building enabled one plant to go one step farther toward the mechani
CHAP. 5.— STOCK PREPARATION AND CARCASS BUILDING 51
Digitized for FRASER http://fraser.stlouisfed.org/ Federal Reserve Bank of St. Louis

zation of carcass building. Instead of one builder doing all the work of assembling the tire, a “ merry-go-round” conveyor has been devised which carries the tire from one operator to another, each contributing only a small share of the work involved. The merry-go- round system consists of 19 tire-building machines, connected by means of a continuous conveyor which carries the machines around exactly like the circus merry-go-round, from which it derived its name. Two tire carcasses are completely built each time the unit makes a circle. The operations involved are as follows:
The first operator removes a completed tire from the drum to a hook conveyor leading to the curing division, secures two beads and places them on rings in preparation for the next tire; the second operator expands the drum, applies cement to it, reaches out for the first ply, applies it on the drum and splices it; the third operator applies the second ply, splices it, smoothes and machine stitches the two plies and sets the beads in place; the fourth operator stitches the flippers of the beads and turns back the two plies over the beads; the fifth operator applies and splices the third and fourth plies; the sixth operator adds the chafing strips and the breaker units, cuts and splices them and prepares the tire for the tread; the next three operators in order apply the tread, splice it, smooth it down by hand, stitch the tread and the chafing strips, tuck the third and fourth plies under the toe of the tire, and finally collapse the drum for the tire to be removed by the next operator starting a new cycle.
The entire unit of 19 machines is thus operated by 18 tire builders who need but a week or 10 days of training to learn the particular jobs assigned to them, in contrast to the years of assiduous training formerly required to make a skilled tire builder. The merry-go-round method of drum tire building proved successful only in the production of large quantities of uniform size tires. The lack of standardization and the variety in sizes of tires so far has acted as a check in the general adoption of this by far the most mechanized system of tire building.
Shaping Drum-Built TiresFor technical reasons and chiefly because of the utilization of air or
water bags which are also required for curing purposes, the operation of “ shaping” the flat band into a tire is performed in the curing department. Since “ core” tires when assembled are already shaped, shaping drum-built tires should therefore be classified with the tire- building department. Tire shaping is a very simple operation. The flat band is placed in a vacuum box which, when closed, forms a compartment grooved to the shape of a tire. The exterior of the band fits snugly to the walls of the box. An air or water bag fully inflated is inserted in the band and when the air is withdrawn from the vacuum box, the tire band envelops the air bag and is sucked into the tire compartment, thus at once receiving the desired shape of a tire, which it retains even after being removed from the vacuum box. The air bag is left in the tire, which is then transferred on trucks or by conveyor to the curing presses. There are several other methods used for shaping tires, all comparatively simple. This, however, does not detract from the fact that the operation of shaping tires separately from the building of the carcass is chiefly responsible for the revolutionary change from the core to the drum process of tire building.
52 LABOR PRODUCTIVITY IN AUTOMOBILE TIRE INDUSTRY
Digitized for FRASER http://fraser.stlouisfed.org/ Federal Reserve Bank of St. Louis

Technological Labor Displacement in the Stock-Preparation and Carcass-Building Departments
In addition to the main revolutionary change in tire building due to the transition from core to the flat-drum process, there were other major and minor changes in all the departments engaged in the stock preparation as well as in the building of the carcass of the tire. The result of the technological improvements has been to reduce greatly the labor requirements in these departments. The direct effects of some of these changes on the labor employment situation in the stock-preparation and tire-building departments of three plants are presented in table 21:
T a b l e 31.— Effect on labor of specified technological changes in the stock-prepara- tion and carcass-building departments in 3 tire plants
CHAP. 5.— STOCK PREPARATION AND CARCASS BUILDING 53
Technological change Effect on labor
Plant 1—1928
Machine process replacing hand operations in flippering wire beads.
Hand process of cushioning bands replaced by machine.........Speeding up operations on bead-covering machines- ...............New conveyor installed to supply stock to builders...............New device for covering and flippering beads in one operation. Applying filling gum to bands directly on band-building
machines.Cementing treads on 1 end instead of both...............................
New method of rolling stock in liners.........................................New bead-building machine............. ..........................................Automatic stops installed on 4 stock-cutting machines______
Combination knife and brush installed on a tread conveyor..
Festoon racks installed at several tire-building machines____
Plant 1—i m
Electric controls installed on 3 stock-cutting machines............New method for building tread bands on machines.................Automatic device eliminates need for changing rolls on cutting
machines.8 core-building machines replaced by the shoulder drum proc
ess of tire building.Filling gum devices on band-building units eliminate the
need for rolling filling gum in liners.Banner machine replaces hand unit for forming and covering
beads.Bead flippering machine replaces hand process.........................
Plant 1—1980 and 1931
New process of cutting, splicing and making finishing strips._ Automatic knife eliminates hand cutting on water-cooled
tread unit.Automatic device eliminates feeders on water-cooled tread
unit.New method of “ booking” treads..... ...........................................New bias-cutting unit for flipper stock.......................................New method of building tread bands..........................................Change in the application of cushion stock on large tire bands. Bias cutting machines are equipped to gum and flipper stock
as well as to apply gum strip on the finishing strip.New method of applying gum tip to flipper stock....................New method of servicing plies to tire builders on drum ma
chines.New method of cutting cord fabric for tires...............................Rerolling gum stock on slitting machines eliminated...............
Plant 2—1930 and 1981
Cutting and rerolling departments consolidated and rearranged.
Stock-assembly department consolidated and rearranged-----
Wire unit for making beads rearranged..................................
84 man-hours saved per day.
20 man-hours saved per day.84 man-hours saved per day.100 man-hours saved per day.50 man-hours saved per day.100 man-hours saved per day.
3 men and 3 girls eliminated; 48 man-hours saved per day.
118 man-hours saved per day.48 man-hours saved per day.7 men eliminated; 56 man-hours saved per
day.3 girls and 1 trucker eliminated; 32 man-
hours saved per day.60 man-hours saved per day.
36 man-hours saved per day.80 man-hours saved per day.200 man-hours saved per day.
Do.
30 girls eliminated; 240 man-hours saved per day.
50 man-hours saved per day.
240 man-hours saved per day.
Do.24 man-hours saved per day.
72 man-hours saved per day.
60 man-hours saved per day. Do.
336 man-hours saved per day. 60 man-hours saved per day. 120 man-hours saved per day.
Do.36 man-hours saved per day.
120 man-hours saved per day. 72 man-hours saved per day.
112 man-hours saved per day, equivalent to the displacement of 14 girls.
1 trucker and 1 chief inspector per shift eliminated.
6 girls per day eliminated.
Digitized for FRASER http://fraser.stlouisfed.org/ Federal Reserve Bank of St. Louis

54 LABOR PRODUCTIVITY IN AUTOMOBILE TIRE INDUSTRY
T a b l e £ 1 .— Effect on labor of specified technological changes in the stock-prepara- tion and carcass-building departments in 3 tire plants— Continued
Technological change Effect on labor
Plant 2—1980 and 1981—Continued
Heavy-duty flipper machines installed to eliminate hand application.
3 flipper insulating machines installed. ......................................
Organization of a continuous unit consisting of 1 stock-cutting and several tire-building machines.
Automatic unit, consisting of 19 tire-building machines, 1 stock cutter, and a system of conveyors to deliver stock to builders and to take away the completed tire bands, installed.
Festoons and working platforms erected for the supplying of stock to the automatic unit of tire building.
20 modern shoulder-drum machines installed to replace old flat-drum machines for building tires.
Old core-building machines replaced by modern core machines with India chucks, power stitchers, tread rollers, and adjusters.
Plant 8—1980 and 1981
16 double bead machines installed................................................
All bead machines concentrated in 1 room instead of, as previously, in 4 different locations.
2 new-style tire-dusting machines installed.................................Automatic devices installed to handle gum-stripped liners.6 gum-inserting machines equipped with compensators.........5 side-wall-assembling machines equipped with automatic
soapstoning devices.New bead-building machines installed.......................................
Direct method of tire building installed, using gum-inserting machines, rotary cutters, compensators, liner stands, etc.
Direct method of tire building applied to the heavy-duty unit.
Compensators installed on 40 tire-building machines; tire- building room rearranged to take care of increased output.
Additional 15 tire-building machines equipped with compensators.
24 operators per day, chiefly girls, eliminated.
112 man-hours saved, equivalent to a displacement of 14 girls.
Increased production saves 128 man-hours per day per unit.
More than 350 man-hours saved per day in increased production.
9 supply girls per day eliminated.
More than 400 man-hours saved per day.
Output per machine increased from 35 to 40 percent.
Over 120 man-hours saved in increased production.
6 checkers, truckers, and stock distributors eliminated.
18 men per day eliminated.70 man-hours saved.80 man-hours saved per day.8 men who formerly soapston^d by hand
eliminated.Savings in direct labor 128 man-hours per
day, equal to displacement of 16 men.Replacement of male with female labor;
elimination of lost time of assemblers due to stock changes; direct handling of stock from rotary cutter; elimination of trucking assembled bands to tire room. Total savings in direct labor in normal production, 248 man-hours per day, amounting to displacement of 31 men.
Replacement of male with female labor; elimination of lost time of assemblers due to stock changes; direct handling of stock from rotary cutter; elimination of trucking assembled bands to tire room. Total savings in normal production, 450 man-hours per day, equal to displacement of 57 men.
Total savings in normal production, over 416 man-hours per day (estimated), equivalent to displacement of 52 men.
Increased production per man resulted in average saving of 136 man-hours per day, equal to displacement of 17 men.________
Labor Productivity in the Stock-Preparation and Tire-BuildingDepartments
Table 22 gives a composite picture of the total and man-hour production in the stock-preparation and tire-building departments of 5 representative plants from 1922 through 1924 and of 6 plants from1925 through 1931. The average man-hour output in these departments varies from 1.32 tires weighing 21.15 pounds in 1922 to 2.55 tires weighing 57.09 pounds in 1931. Based on 1926 as 100, the average tire output per man per hour ranges from 82.25 in 1922 to 158.47 in 1931. The corresponding index of weight output ranges from 73.02 in 1922 to 197.09 in 1931. Since 1926 the output per man per hour in the stock-preparation and tire-building departments has increased 58.47 percent in the number_of tires produced and 97.09 percent in the weight of the tires.
Digitized for FRASER http://fraser.stlouisfed.org/ Federal Reserve Bank of St. Louis

CHAP. 5.— STOCK PREPARATION AND CARCASS BUILDING 55T a b l e 2 2 .— Total and man-hour production in stock preparation and lire (car-
cass) building in 6 representative plants, and index numbers thereof, 1922 to 1981, by years
YearTotal output
Man-hoursworked
Output per man-hour
Index numbers (1926=100)
Total outputMan-hours
Output per man-hour
Number of tires Pounds Tires Pounds Tires Pounds Tires Pounds
19221......... ......... 14,034,000 224,106,000 10,594,000 1.32 21.15 (2) (2) (2) 82.25 73.021923 ».................. 15,784,000 248,924,000 10,762,000 1.47 23.13 (2) (2) (2) 91.06 79.851924 i.................. 17,237,000 265,905,000 11,566,000 1.49 22.99 (2) (2) (2) 92.49 79.361925.................... 26,936,000 466,238,000 19,154,000 1.41 24.34 96.59 92.97 110.64 87.27 84.031926___________ 27,887,000 501,513,000 17,312,000 1.61 28.97 100.00 100.00 100.00 100.00 100.001927.................. 31,311,000 599,642,000 17,693,000 1.77 33.89 112.28 119.57 102.20 109.87 116.991928............. . 37,488,000 752,333,000 19,301,000 1.94 38.98 134.43 150.01 111. 49 120.55 134.551929____ ____ 37,783,000 801,725,000 18,844,000 2.01 42.54 135.49 159.86 108.85 124.46 146.861930___________ 29,865,000 684,645,000 13,549,000 2.20 50.53 107.09 136.52 78.26 136.81 174.431931_____ _____ 29,001,000 648,648,000 11,361,000 2.55 57.09 103.99 129.34 65.62 158.47 197.09
1 5 plants only.2 Index numbers not computed as data are for only 5 plants, while the base year, 1926, covers 6 plants.
The variations in man-hour output in stock preparation and tire building are considerably larger for the individual plants, the statistics of which are given in table 23. Plant 1, which shows the largest 1931 index of man-hour output by weight, has a range from 1.38 tires weighing 18.52 pounds in 1919 to 4.65 tires weighing 74.89 pounds in 1931. Since 1919 the man-hour output in the stock-prepa- ration and tire-building departments of this plant has more than tripled if measured by the number of tires produced and more than quadrupled in the weight of the tires. The largest increase in man- hour output occurred in 1921 when the index of tire output rose from 66.86 in 1920 to 112.11 and the corresponding index of weight output rose from 57.25 to 109.76. Another substantial increase took place in 1928 when the index of tire output rose from 116.32 to 155.96 and the index of weight output rose from 120.29 to 182.98, or more than 50 percent.
In plant 2 the average man-hour output in stock preparation and tire building rose from 2.70 tires weighing 33.25 pounds in 1922 to 3.72 tires weighing 68.46 pounds in 1931. There has been very little change in the labor productivity of these departments from 1922 through 1927. The installation of the flat-drum process raised the index of tire output from 101.95 in 1927 to 117.70 in 1928. The corresponding index of weight output rose from 106.45 to 131.02. Since then there has been a noticeable yearly increase in the output per man per hour of these departments, with the result that in 1931 the index of tire output was 51.30 percent and the index of weight output 102.61 percent higher than in 1926.
Plant 3 indicates a range in the man-hour output of stock preparation and tire building from 0.56 tire and 11.69 pounds in 1919 to 1.94 tires and 59.45 pounds in 1931. With 1926 as a base, the man-hour tire output index ranges from 42.64 in 1919 to 147.34 in 1931, which is about three and a half times that of 1919. The corresponding index of weight output ranges from 39.32 in 1919 to 200.03 in 1931, which is slightly more than five times that of 1919,
Digitized for FRASER http://fraser.stlouisfed.org/ Federal Reserve Bank of St. Louis

In 1925 plant 4 had a man-hour output in its stock-preparation and tire-building departments of 1.46 tires weighing 25.02 pounds. The corresponding 1931 output of this plant was 2.66 tires weighing 60.82 pounds. Since 1926 the labor productivity of these departments has risen 30.71 percent, if measured by the number of tires produced, and 70.84 percent if measured by the weight of rubber compounded with fabric used in the production of tires.
Plant 5, which specializes to a very large degree in the production of large sizes of tires, had in 1922 an average man-hour output in its stock-preparation and tire-building departments of 0.98 tire weighing 17.04 pounds. In 1931 the corresponding man-hour output was again 0.98 tire, this time, however, weighing 31.82 pounds due to the change in the average weight of tires which took place since 1922. Compared with 1926, the index of man-hour tire output in these departments shows a rise of 12.45 percent, and the corresponding index of weight output 68.14 percent.
The average man-hour output in the stock-preparation and tire- building departments of plant 6 varies from 0.97 tire weighing 16.91 pounds in 1922 to 2.76 tires weighing 60.73 pounds in 1931. With 1926 as 100, the index of the man-hour tire output ranges from 51.98 in 1922 to 148.04 in 1931, which is nearly three times that of 1922. The corresponding index of weight output ranges from 44.94 in 1922 to 161.61 in 1930, which is nearly four times as much as in 1922.
56 LABOR PRODUCTIVITY IN AUTOMOBILE TIRE INDUSTRY
T a b l e 23.— Actual man-hour production and index numbers of total and man- hour production in stock preparation and tire (carcass) building in 6 specified plants, in specified years, 1919 to 1931
Index numbers (1926=100)
Plant number and year
w u i p u t p e r m a x i - hour
Total outputMan-
Output per man- hour
Number of tires Pounds Tires Pounds
hoursTires Pounds
Plant 1:1919................................. ....... 1.38 18.52 56.23 58.40 104.43 53.86 51.151920______ _______ ________ 1.72 18.96 54.33 46.51 81.24 66.86 57.251921 __________ _____ _____ 2.88 34.28 45.26 41.78 40.37 112.11 109.761922 _____ _____ ________ 2.70 31.23 60.86 54.51 57.80 105.30 94 321923 ______________________ 2.73 31.56 77.56 69.49 72.91 106.35 101.061924 ______________________ 2.67 31.05 81.90 73.82 78.72 104.01 93.771925 _____________ ____ 2.09 25.73 87.84 83.81 107.86 81.43 77.701926_______________ ____ 2.57 33.11 100.00 100.00 100.00 100.00 100.001927 ___________________ 2.99 39.83 109.67 113.41 94.28 116.32 120.291928 ....................................... 4.01 57.15 157.98 174.76 101.27 155.96 182.981929 ........ .............. ................. 4.44 65.57 172.40 198.05 99.81 172.70 198.091930______ ______ _________ 4.27 65.98 127.60 153.07 76.82 166.08 199.251931 ............... .................... 4.65 74.89 122.81 153.36 67.81 181.07 226.16
Plant 2:1922.......... ................................ 2.70 33.25 67.97 60.81 61.80 109.97 98.401923_______________________ 2.77 34.07 92.94 83.15 82.46 112.69 100.831924................................... ....... 2.77 34.00 93.83 83.70 83.18 112.77 100.631925_______ _____ _________ 2.51 35.11 100.61 102.12 98.26 102.36 103.921926..... ............ — __________ 2.46 33.79 100.00 100.00 100.00 100.00 100.001927__________ _________ _ 2.51 35.97 132.98 138.82 130.40 101.95 106.451928_______________________ 2.89 44.27 146.84 163.44 124.74 117.70 131.021929________________ ______ 3.15 53.55 184.17 227.60 143.59 128.23 158.501930_......................................... 3.39 64.07 129.97 178.68 94.23 137.92 189.631931........................................... 3.72 68.46 116.13 155.48 76.74 151.30 202.61
Digitized for FRASER http://fraser.stlouisfed.org/ Federal Reserve Bank of St. Louis

T a b l e 23.— Actual man-hour production and index numbers of total and man- hour production in stock preparation and tire (carcass) building in 6 specified plants, in specified years, 1919 to 1931— Continued
CHAP. 5.— STOCK PREPARATION AND CARCASS BUILDING 57
Index numbers (1926=100)
Plant number and year
v s u t p u b p e r m a n -hour
Total outputMan-
Output per man- hour
Number of tires Pounds Tires Pounds
hoursTires Pounds
Plant 3:1919__.______ _____________ 0.56 11.69 73.30 67.62 171.95 42.64 39.321920__________ _______ ____ .62 12.29 64.18 56.77 137.27 46.74 41.361921_______________________ .86 18.57 38.01 36.62 58.60 64.87 62.491922 ______________________ .98 20.93 63.39 60.24 85.56 74.05 70.411923 ............. ......................... 1.06 23.09 60.11 57.99 74.63 80.50 77.691924_______________________ 1.07 20.12 72.34 60.57 89.46 80.88 67.701925_______________________ 1.10 23.00 94.36 87.66 113.29 83.31 77.371926________ ____ _________ 1.32 29.72 100.00 100.00 100.00 100.00 100.001927_______________________ 1.42 34.74 119.13 129.51 110.82 107.51 116.871928 _____________________ 1.54 39.59 150.15 170.75 128.19 117.15 133.201929________ ______ _______ 1.63 44.31 142.83 172.28 115.58 123.60 149.061930_________________ _____ 1.78 54.38 108.30 147.10 80.40 134.67 182.961931_______________________ 1.94 59.45 90.02 122.20 61.09 147.34 200.03
Plant 4:1925............................ .............. 1.46 25.02 102.90 100.62 143.16 71.89 70.28
100.001926_______________________ 2.04 35.60 100.00 100.00 100.00 100.001927_________ _______ _____ 2.07 38.07 135.42 142.54 133.29 101.62 106.941928_______________________ 2.22 41.75 147.29 158.39 135.04 109.09 117.291929_______________________ 2.35 47.25 132.66 152.61 114.98 115.38 132.731930_______________________ 2.27 53.04 91.87 122.65 82.32 111. 65 149.001931_______________________ 2.66 60.82 81.08 105.99 62.04 130.71 170.84
Plant 5:1922_______________________ .98 17.04 66.00 52.52 58.34 113.14 90.021923_______________________ .90 16.95 66.07 57.18 63.85 103.49 89.561924____________ _______ _ .91 17.35 74.57 65.00 70.91 105.17 91.671925_______________________ .84 17.70 93.28 89.94 96.16 97.01 93.531926_______________________ .87 18.92 100.00 100.00 100.00 100.00 100.00
127.711927_______________________ .93 24.17 86.32 103.22 80.82 106.811928_______________________ .87 26.07 84.32 115.73 84.00 100.38 137.771929_______________________ .63 22.56 75.18 122.99 103.17 72.87 119.211930_______________________ .79 26.58 56.46 87.33 62.18 90.81 140.451931............ ................... .......... .98 31.82 49.33 73.77 43.87 112.45 168.14
Plant 6:1922_______________________ .97 16.91 69.78 60.33 134.24 51.98 44.941923_______________________ 1.21 20.59 73.12 61.94 113.20 64.56 54.72
67.17 91.93
100.00 100.66 96.48
138.79 161.61 161.40
1924_______________________ 1.49 25.27 79.57 66.55 99.08 80.281925_____ ______ __________ 1.82 34.59 103.18 96.76 105.26 98.011926 ____ _________________ 1.86 37.63 100.00 100.00 100.00 100.00
93.501927_______________________ 1.74 37.87 75.97 81.77 81.231928_______________________ 1.59 36.30 104.16 117.61 121.90 85.441929_______________________ 2.23 52.22 100.42 116.48 83.92 119.611930____ _____ ____________ 2.63 60.81 148.84 170.50 105.50 141.051931 _____________________ 2.76 60.73 204.44 222.86 138.08 148.04
Digitized for FRASER http://fraser.stlouisfed.org/ Federal Reserve Bank of St. Louis

C h ap ter 6.—Manufacturing Automobile Tires: Curing, Finishing, and Inspecting Tires
Curing Tires“ Curing” tires consists of subjecting the green carcass, or body of
the tire, to heat under pressure and thus completing the process of vulcanization started in the mixing department. The steam or hot- water pressure is applied to both the outside and the inside of the tire. Before placing the tire in the curing mold a heavy air or water bag, built along the lines of an inner tube, is inserted in the tire. In the case of drum-built tires the air bag is inserted in the carcass before the tire is shaped and is left inside until after the curing has been completed.
Two distinct methods of curing tires can be found in the principal tire-manufacturing plants—the vertical pot heaters, which cure in one vulcanizer from 25 to 40 tires simultaneously, and the “ watch- case” vulcanizers in which each individual tire is cured separately. The pot heaters are the oldest type of vulcanizers and still predominate in nearly all plants. Usually several of these vulcanizers are placed in a row at a certain distance from each other. Tires are cured in heavy steel molds, the two halves of which, when placed one on top of the other, form a space just big enough to enclose the inflated tire. The walls of the enclosed section are engraved with the tire design, which is embedded in the soft rubber of the tread in the course of the curing operation. The set of pot heaters is surrounded in most plants with two lines of conveyors, an upper and a lower, for the transportation of the two halves of the curing mold. The conveyors completely eliminate the need of handling the very heavy molds, whether empty or loaded with tires. The upper and lower conveyors are synchronized so that when a tire is placed in the lower half of the mold, which travels on the lower gravity conveyor, the upper half is automatically lowered over the tire and then released, leaving the complete and loaded, but not entirely closed, mold to travel on the lower conveyor until it passes under a hydraulic press which closes the mold. From the conveyor the loaded mold is diverted toward the particular vulcanizer for which it was intended.
The molds are lowered into the vulcanizer by means of chains and tackle or with the help of a movable platform which moves a certain distance downward into the vulcanizer each time a loaded mold is added to it. The valves in the air bag of each tire are connected with the steam or hot-water supply, and when the precise number of tires used for simultaneous cure have been placed in it the vulcanizer is closed with a heavy lid and locked. Hydraulic pressure is then applied and the exact amount of steam required for the vulcanization turned on. The length of the cure depends on the size of the tires, but chiefly on the type and quantity of chemical accelerators mixed with the rubber in the compounding department. The average cure lasts about one hour. Recently a more effective use of accelerators has reduced the curing time in some plants to half an hour or even less.
58
Digitized for FRASER http://fraser.stlouisfed.org/ Federal Reserve Bank of St. Louis

f i g u r e 7 . — C u r i n g T i r e s ; E x t r a c t i n g c u r e d t i r e f r o m w a t c h c a s eV U L C A N I Z E R .
Digitized for FRASER http://fraser.stlouisfed.org/ Federal Reserve Bank of St. Louis

CHAP. 6.— CURING, FINISHING, ETC., TIRES 59When the cure has been completed the vulcanizer is unlocked, its
heavy lid removed, and the tightly closed molds are lifted, one by one, onto the lower conveyor. Until recently it required two men equipped with iron bars to pry open the mold. Now a pneumatic device is used which enables one man to open it easily. The upper half of the mold is then automatically picked up by the upper conveyor, the cured tire removed to a truck or to a different overhead conveyor, and the lower half of the mold, sprayed and thoroughly cleansed, is started on another curing cycle without ever leaving the gravity conveyor.
The watchcase horizontal vulcanizers owe their name to the rough resemblance of the apparatus to a watch having hinged cases which may be readily opened and closed. During the curing process the hinged parts are locked together and the vulcanizer is heated by steam supplied to the hollow chamber. The apparatus remains heated and as soon as a cured tire is removed from the vulcanizer a green one is inserted. The operation may therefore be considered as continuous. Each vulcanizer is designed for one tire only. Essentially it is but a single mold equipped with all the outlets for steam and pressure required for a complete cure. When open the lower half receives the tire previously inflated with an air bag exactly in the same manner as in the case of pot heaters. By means of electrically operated switches the vulcanizer closes automatically, with the two halves forming an enclosure similar to that in a regular mold.
The work of the operator consists merely in locking and unlocking the mold (if these operations are not performed automatically), removing the cured tire to a traveling hook conveyor and inserting another green tire in the mold. The vulcanizers are conveniently arranged in rows, or batteries, so that the operator can move quickly from one vulcanizer to another. The labor time requirements for these operations are negligible and a single operator can tend as many as 100 vulcanizers, which are so timed that when 1 vulcanizer is closed its immediate neighbor automatically opens to release a cured tire.
A contrast in the type of labor required, the work performed, and the result in man-hour output of the two curing methods is given in the following example, which is based on actual production operations in the same plant:
Pot heaters (4 lines of vulcanizers operating on four 6-hour shifts and curing jg/wwvj. day):
Watchcase vulcanizers (battery of vulcanizers operating on three 8-hour shifts and curing 7,500 tires per day):
Workersrequired
1220441612
104
Pressmen______________Loaders and unloaders __Tire removers__________Tire placers (into molds)Other workers and helpers.
Total. 208
Pressmen 12Helpers.
Total3
15
Digitized for FRASER http://fraser.stlouisfed.org/ Federal Reserve Bank of St. Louis

The pot heaters required 208 men working 1,248 man-hours and averaging 14.4 tires cured per man per hour, while the watchcase vulcanizers required only 15 men working 120 man-hours and averaging 62.5 tires cured per man per hour.
The man-hour output of the watchcase method is over four times that of the pot heaters. In spite of these enormous savings in labor time, the transition from the pot-heater method of curing tires to the watchcase system has been very slow, due chiefly to the enormous expense involved in completely scrapping the old equipment in order to install the new process. Certain plants definitely acLmit the advantages and superiority of the watchcase method of curing tires, but hesitate to undertake the very large capital outlays involved in the change.
From the vulcanizers the cured tires are delivered either on trucks or by conveyors to the air or water bag pulling department. The air bag is extracted either by hand (nowadays only in the case of very large truck tires) or with the help of semiautomatic mechanical devices which in some plants closely approach the automatic stage. The released air bag is then examined, tested, and returned to the press room for another curing cycle, and the tire is delivered by truck or over another conveyor to the finishing and inspecting department. With the exception of the revolutionary change from pot heaters to watchcase vulcanizers, which has begun only recently and which is far from being even half-way completed, the principal change in the curing division has been the very extensive utilization of all types of conveyors to deliver the green carcass of the tire to the curing department, into the vulcanizers, and from there to the bag-extracting division and the finishing department.
Finishing and Inspecting TiresIn the finishing and inspecting departments the tires are first
trimmed of the overflow rubber left by the curing mold. They are then washed and painted a w d thoroughly examined inside and outside for flaws. After weighing and balancing the tires the monograms and stripes are painted on the side walls by means of spray guns. From the finishing room the tires are transported to the storage room, either on trucks, conveyors, or by means of inclined chutes.
The nature of the work performed in the tire finishing and inspecting departments is such as to preclude extensive utilization of any kind of automatic machinery. It is the only department in the entire field of tire manufacturing where labor productivity not only failed to rise rapidly during the last few years* but in some plants actually fell behind. This is chiefly due to the increased care required from the inspectors in examining the tires for flaws. In one plant the average man-hour output of these departments rose from 56.11 tires in 1922 to 64.72 in 1924; it then gradually declined to 48.12 in 1929, and rose again to 55.56 in 1930. In another plant the average man- hour output in the finishing and inspecting departments gradually rose from 19 tires in 1925 to 34.20 in 1927; it then declined rapidly and reached an average of 25.58 tires in 1930.
60 LABOR PRODUCTIVITY IN AUTOMOBILE TIRE INDUSTRY
Digitized for FRASER http://fraser.stlouisfed.org/ Federal Reserve Bank of St. Louis

Utilization of Conveyors in the Tire IndustryThe outstanding characteristic of all tire plants, small and large
alike, is the effective utilization of all types of conveyors in the plant. A conveyor or chute delivers the small pieces of crude rubber to the plasticators or to the washing mills; an overhead hook conveyor carries the plasticated or milled rubber to the cooling chambers and back to the storage room; a system of gravity rollers and conveyors fills the pans with chemical ingredients in the compounding room, delivers them to the Banbury mixers and back again to the compounding room. Conveyors of all kinds carry the individual elements, such as plies, beads, treads, reinforcing strips, etc., from the various stock-preparation sections to the tire assembling or building room; conveyors or chutes deliver the green carcass of the tire from the assembly room to the tire-shaping division and from there to the curing department; gravity rollers and an overhead conveyor combined help to deliver the tire placed in the curing mold to the vul- canizers and from there to the air-bag extracting machine; conveyors and endless belts carry the cured tire to the finishing room and thence through the inspecting division; and finally conveyors or inclined chutes deliver the completed and thoroughly examined tire to the storage division.
In most plants the installation of the various types of conveyors took place between 1924 and 1926, and the immediate effect of this change has been a great reduction in the labor force, as well as a very large increase in the average man-hour output of the plant. The following examples from two separate plants may serve to illustrate the type of change in the labor requirements produced by the installation of the conveyor method of delivering tires from one department to another:
CHAP. 6.— CURING, FINISHING, ETC., TIRES 61
T a ble 24.— Effect on labor of installing a conveyor from curing division to finalinspection department
Number of men required per day
Occupation or operationBefore
installation of
conveyor
After installation of
conveyor
Inspectors_____.............. ........... ..... ............ ............. .................................... ................... 29 2096
Trimmers............. ....................... ............................................. ......................................... 12Sorters____________________________________________________________ - ................. 10Checking inspection .... .... 2 1Trucking rejected tires________________________________________________________ 2 oTrucking tires to inspectors_____________________ _______ ______________ _______ 2 0Trucking tires to elevators after inspection........ .......................... ............................... 2 0
oOther truckings_________ ______________________ ________ - - ____________________ 6Relief inspectors_____________________ ____ ________ ____ - ____ ________________ 0 2Placing tires on conveyor____________________ ___ ______ ________ _________ ___ 0 2H
2HPiling tires at conveyor______________ ____ ________ ________ ______ _____ _____ 0
Total................... .................................................. ..................... .......... .................. 65 43
The conveyor has thus eliminated 22 employees from a force of 65, or about 34 percent of the total force formerly used.
17X867°—33---- 5
Digitized for FRASER http://fraser.stlouisfed.org/ Federal Reserve Bank of St. Louis

62 LABOR PRODUCTIVITY IN AUTOMOBILE TIRE INDUSTRY
T a b le 3 5 .— Effect on labor of installing a hook conveyor carrying tires from building department to curing division and from there to finishing department
Occupation or operation
Men required per day before
installation
Occupation or operation
Men required per day
after installa
tion
Electric truck operators............................Loading and unloading curing conveyor.Making up “ heats” 1................................ .Preparing and delivering heats............... .Elevator operators...........................Trucking tire carcasses from floor to floor. Painting and soapstoning tire carcasses..
Total.................................................. 55
Loading curing conveyor from hookconveyor.................................................
Painting and soapstoning tire carcasses-Sorting tires on conveyor......... ................Heat men........ .............. .......... ...................Other workers................ ............................
Total............................ — ..............
68
1064
34
i Arranging number and order of tires to be placed in a vulcanizer for simultaneous curing.
The hook conveyor eliminated 21 men per day from a total force of 55, or 38 percent of the total.
Technological Displacement of Labor in Curing, Finishing, and Inspecting Tires
The numerous technological changes in curing, finishing, and inspecting tires resulted in large reductions in the labor requirements per unit of output in these departments. The immediate effects of some of the more recent changes in three tire plants on the employment situation in the respective division where they occurred are given below.
T a b l e 36 .— Effect on labor of specified technological changes in curing, finishing, and inspecting tires in 3 tire plants
Technological change Effect on labor
Plant 1-1928-31
Machine for inserting water tubes into core-built tires before curing.
New device eliminating need for soap-stoning tire carcass— Elimination of ringing tires and removing rings from cured
tires by using molds with rings permanently attached. Automatic device for spraying lids of curing molds replacing
hand process on three units.Improved method of removing tires from curing conveyor.Automatic spray for bottom mold on two curing units...........New method of shaping drum-built bands for 1 unit-.............Automatic tire extractor to remove tire from hot mold after
curing.Additional new molds with rings attached, eliminating ne
cessity of ringing tires and removing rings.Automatic mold opener on 1 curing unit....................................New system of balancing tires on belt while inspecting-.........Special process eliminating trimming tires by hand................Revamping and consolidating all white sidewall-handling
operations, such as inspection, buffing, balancing, washing, etc.
Air machine extracting water bags from cured tires.................New system of balancing tires.....................................................
Plant 2-1929-21
Tire conveyor extended from building unit to painting machine.
2 units of curing conveyor replaced with gravity rollers conveyor.
Addition to curing conveyor unit installed........... ..................
24 man-hours saved per day.
48 man-hours saved per day.160 man-hours saved per day.
72 man-hours saved per day.
84 man-hours saved per day.80 man-hours saved per day.118 man-hours saved per day.9 breakout men eliminated; 72 man-hours
saved per day.330 man-hours saved per day.
21 man-hours saved per day.24 man-hours saved per day,36 man-hours saved per day.180 man-hours saved per day.
50 man-hours saved per day. 60 man-hours saved per day.
3 truckers and IH loading men per day eliminated.
6 men per day eliminated.
Do.
Digitized for FRASER http://fraser.stlouisfed.org/ Federal Reserve Bank of St. Louis

CHAP. 6.— CURING, FINISHING, ETC., TIRES 63T a b l e 20.— Effect on labor of specified technological changes in curing, finishing,
and inspecting tires in 8 tire plants— Continued
Technological change Effect on labor
Plant 2-1929-81—Continued
Automatic operating device installed on mold closing press..Additional dusting machine for shoulder-drum-built tires___Machine for extracting water bag from tire changed................Unit vuleanizers installed to replace pot heaters used in cur
ing tires.Plant 8-1980-81
2 new tire expanders added to cuiing room...............................Automatic air-bag connections in 30 jacket molds replaced
with latest automatic device.New type of storage racks installed in drum tire-curing u n it-5 curing units equipped with overhead conveyors, tire re
movers, etc.Curing room rearranged to take care of increased production..
Jacket mold curing unit equipped with a tram rail to handle green and cured tires.
Additional tire starching machines installed.............................
3 men per day eliminated. Do.Do.
40 man-hours saved per day.
35 man-hours saved per day.400 man-hours saved per day, equal to a
displacement of about 50 men.3 tire truckers per day eliminated.120 man-hours saved per day, or 15 men
displaced.173 man-hours saved per day or 22 men dis
placed.3 tire carriers per day eliminated.
3 men per day eliminated.
Labor Productivity in Curing, Finishing, and Inspecting TiresTable 27 gives a composite picture of the labor productivity in the
curing, finishing, and inspecting departments of 5 tire plants from1922 through 1924 and of 6 plants from 1925 through 1931. The average man-hour output of curing, finishing, and inspecting tires in these plants varies from 2.76 tires and 44.14 pounds in 1922 to 5.31 tires and 118.75 pounds in 1931. With 1926 as a base, the tire index of the labor productivity ranges from 75.40 in 1922 to 144.82, or slightly less than double, in 1931. The corresponding weight index ranges from 66.94 in 1922 to 180.09, or nearly threefold, in 1931. From 1926 to 1931 the tire index rose 44.82 percent while the corresponding weight index rose 80.09 percent. The largest yearly increase in both indexes occurred in 1931 when the tire index rose 28.6 points and the weight index rose 32 points.
T a b l e 27.— Total and man-hour production in curing and finishing tires in 6 representative plants and index numbers thereof, 1922 to 1981, by years
YearTotal output Man-
hours worked1
Output per man-hour
Index numbers (1926=100)
Total outputMan-hours
Output per man-hour
Tires Pounds Tires Pounds Tires Pounds Tires Pounds
1922 2.................. 14,034,000 224,106,000 5,077,000 2.76 44.14 (3) (3) (3) 75.40 66.941923 2.................. 15,784,000 248,924,000 5,426,000 2.91 45.88 (3) (3) <*> 79.35 69.581924 2................ 17,237,000 265,905,000 5,429,000 3.18 48.98 (3) (8) (3) 86.61 74.281925............. 26,936,000 466,238,000 8,307,000 3.24 56.12 96.59 92.97 109.22 88.43 85.111926........... ......... 27,887,000 501,513,000 7,606,000 3.67 65.94 100.00 100.00 100.00 100.00 100.001927___________ 31,311,000 599,642,000 8,086,000 3.87 74.16 112.28 119.57 106.31 105.62 112.471928........... ........ 37,488,000 752,333,000 9,339,000 4.01 80.56 134,43 150.01 122.78 109.49 122.171929.................... 37,783,000 801,725,000 9,062,000 4.17 88.48 135.49 159.86 119.14 113.75 134.181930.................... 29,865,000 684,645,000 7,010,000 4.26 97.66 107.09 136.52 92.17 116.20 148.101931— ........... 29,001,000 648,648,000 5,462,000 5.31 118.75 103.99 129.34 71.82 144.82 180.09
. 1 Also includes man-hour time in 1 plant for inspecting inner tubes.2 Data for 5 plants only.* Index numbers not computed as data covers only 5 plants, while 1926, the base year, covers 6 plants.
Digitized for FRASER http://fraser.stlouisfed.org/ Federal Reserve Bank of St. Louis

Plant 1, which has the largest 1931 index of man-hour output in curing, finishing, and inspecting tires, shows a variation from 4.73 tires weighing 58.23 pounds in 1922 to 5.47 tires weighing 100.61 pounds in 1931. From 1922 through 1926 the average output of curing, finishing, and inspecting tires in this plant declined gradually both in the number of tires produced and in the weight of the tires. Both indexes were at their lowest in 1926. Since then, however, the average man-hour output has been rising, at first slowly and then much faster especially in 1930 and 1931. The greatest yearly increase in the man-hour output of curing, finishing, and inspecting tires in this plant occurred in 1931 when the index of tire output rose 33.6 points and the index of weight output rose 40.5 points from the 1930 level.
In 1922 the average man-hour output of curing, finishing, and inspecting tires in plant 2 was 1.39 tires weighing 24.13 pounds. In1931 the corresponding output was 4.71 tires weighing 103.76 pounds. Based on 1926 as 100, the index of the man-hour tire output ranges from 53.89 in 1922 to 183.65, or about three and one half times as much, in 1931. The corresponding index of weight output ranges from 46.55 in 1922 to 200.18, or more than four times as much in 1931. The larger increases in the man-hour output in these departments took place in 1925, due undoubtedly to the installation of a number of conveyors, and again in 1931, due chiefly to the utilization of individual watchcase vulcanizers and additional conveyors in all the divisions of these departments.
The average man-hour output in curing, finishing, and inspecting tires in plant 3 varies from 3.41 tires weighing 58.26 pounds in 1925 to 6.26 tires weighing 143.16 pounds in 1931. The index of tire output based on the 1926 production, ranges from 79.41 in 1925 to 146 in 1931, while the corresponding index of weight output ranges from 77.67 to 190.86. Since 1926 the average man-hour output in the curing, finishing, and inspecting departments of this plant rose 46 percent if measured by the number of tires produced and 90.86 percent if measured by the weight of rubber compounded with fabric used in the production of tires.
In 1919 plant 4 averaged 3.25 tires or 43.59 pounds per man per hour produced in curing, finishing, and inspecting tires. In 1931 the corresponding output was 9.10 tires weighing 146.50 pounds. Based on 1926 as 100, the index of the man-hour tire output in this plant ranges from 53.19 in 1919 to 151.39 in 1930. The corresponding index of weight output ranges from 55.34 in 1919 to 186 in 1931.
The average man-hour output in curing, finishing, and inspecting tires in plant 5 varies from 1.87 tires or 38.91 pounds in 1919 to 5 tires or 153.11 pounds in 1931. Based on the 1926 man-hour output, the index of tire output ranges from 43.99 in 1919 to 117.61 in 1931, and the corresponding index of weight output ranges from 40.58 in 1919 to 159.66 in 1931.
In 1922 the average man-hour output in curing, finishing, and inspecting tires in plant 6, which specializes to a considerable extent in the production of large sizes of tires, was 2.21 tires weighing 38.34 pounds. Its corresponding 1931 output was 2.47 tires weighing 80.26 pounds. From 1922 through 1929 the index of the man-hour tire output, based on 1926 as 100, fluctuated up and down, the lowest
64 LABOR PRODUCTIVITY IN AUTOMOBILE TIRE INDUSTRY
Digitized for FRASER http://fraser.stlouisfed.org/ Federal Reserve Bank of St. Louis

CHAP. 6.— CUEING, FINISHING, ETC., TIRES 65index of 73.78 being reached in 1929. The corresponding index of weight output, however, shows a constantly increasing tendency, the discrepancy between the trends of the two indexes being due primarily to the rapidly increasing weight of the average tire produced in this plant. Since 1929 both the indexes of the man-hour tire and weight output in the curing, finishing, and inspecting division of this plant increased very rapidly, with the result that in 1931 the index of tire output was nearly equal to that of 1926 while the corresponding index of weight output was 36.89 percent higher than in 1926.
T a b l e 38.— Actual man-hour production and index numbers of total and man-hour production in curing and finishing tires in 6 specified plants in specified years, 1919 to 1981
Plant number and year
Plant 1: i 1922._ 1923__1924._1925._ 1926__1927._1928._1929._1930._ 1931__
Plant 2:1922-.1923-_ 1924._ 1925--1926._ 1927__1928-.1929-.
1931__ Plant 3:2
1925 ...1926-_1927-_1928-_ 1929._ 1930-.1931..
Plant 4:1919-_ 1920._ 1921__ 1922.-1923--1924-_1925-_ 1926._1927-_1928-. 1929._1930-_1931-.
Plant 5:1919-.1920—1921..1922..1923..1924..1925..
Output per man- hour Index numbers (1926=100)
Number of tires Pounds
Total outputMan-hours
Output per man- hour
Tires Pounds Tires Pounds
4.73 58.23 67.97 60.81 48.72 139.52 124.814.63 57.02 92.94 83.15 68.04 136.60 122.214.46 54.67 93.83 83.70 71.43 131.39 117.193.73 52.11 100.61 102.12 91.43 110.05 111. 693.39 46.65 100.00 100.00 100.00 100.00 100.003.40 48.75 132.98 138.82 132.87 100.09 104.483.44 52.56 146.84 163.44 145.07 101.24 112.663.82 65.00 184.17 227.60 163.36 112.76 139.324.32 81.70 129.97 178.68 102.03 127.44 175.135.47 100.61 116.13 155.48 72.10 161.10 215.65
1.39 24.13 69.87 60.33 129.61 53.89 46.551.44 24.49 73.22 61.94 131.10 55.84 47.251.67 28.19 79.57 66.55 122.34 65.04 54.392.55 48.31 103.18 96.76 103.81 99.41 93.212.56 51.83 100.00 100.00 100.00 100.00 100.002.40 52.32 75.97 81.77 81.00 93.80 100.952.78 63. 51 104.16 117.61 95.98 108.54 122.542.82 66.15 100.42 116.48 91.27 110.03 127.622.82 65.07 148.84 170.50 135.81 109.60 125.554.71 103.76 204.44 222.86 111.33 183.65 200.18
3.41 58.26 102.90 100.62 129.55 79.41 77.674.29 75.01 100.00 100.00 100.00 100.00 100.005.11 94.04 135.42 142.54 113.70 119.10 125.374.63 87.01 147.29 158.39 136.55 107.86 115.994.79 96.26 132.66 152.61 118.92 111.56 128.334.92 114.90 91.87 122.65 80.07 114.74 153.196.26 143.16 81.08 105.99 55.53 146.00 190.86
3.25 43.59 56.23 58.40 105.53 53.19 55.344.27 47.19 54.33 46.51 77.63 69.89 59.915.79 68.96 45.26 41.78 47.73 94.76 87.556.68 77.12 60.86 54.51 55.67 109.33 97.917.32 84.56 77.56 69.49 64.73 119.80 107.367.45 86.57 81.90 73.82 67.16 121.93 109.916.11 75.24 87.84 83.81 87.74 100.07 95.526.11 78.77 100.00 100.00 100.00 100.00 100.006.38 85.16 109.67 113.41 104.90 104.42 108.126.79 96.81 157.98 174.76 142.19 111. 13 122.918.12 120.28 172.40 198.05 129.70 132.90 152.709.25 143.15 127.60 153.07 84.23 151.39 181.749.10 146.50 122.81 153.36 82.45 148.94 186.00
1.87 38.91 73.30 67.62 166.64 43.99 40.582.03 40.44 64.18 56.77 134.62 47.66 42.172.43 52.81 38.01 36.62 66.50 57.16 55.072.53 54.27 63.39 60.24 106.45 59.53 56.592.82 61.23 60.11 57.99 90.82 66.19 63.853.79 71.47 72.34 60.57 81.27 89.00 74.523.62 75.90 94.36 87.66 110.76 85.19 79.14
1 Data on man-hours for this plant include also the inspection of inner tubes.2 Data for this plant prior to 1925 not available by departments.
Digitized for FRASER http://fraser.stlouisfed.org/ Federal Reserve Bank of St. Louis

6 6 LABOR PRODUCTIVITY IN AUTOMOBILE TIRE INDUSTRY
T a b l e 28.— Actual man-hour 'production and index numbers of total and man-hour production in curing and finishing tires in 6 specified plants in specified years, 1919 to 1981— Continued
Plant number and year
Output per man- hour Index numbers (1926=100)
Number of tires Pounds
Total outputMan-hours
Output per man- hour
Tires Pounds Tires Pounds
Plant 6—Continued.1926........................ .................. 4.25 95.90 100.00 100.00 100.00 100.00 100.001927................................ ......... 4.55 111.54 119.13 129.51 111. 35 106.98 116.311928.......... ............................... 4.62 118.41 150.15 170.75 138.29 108.56 123.471929_....................... ............. . 4.69 127.47 142.83 172.28 129.61 110.18 132.921930........ .............._.............. . 4.66 142.68 108.30 147.10 98.87 109.52 148.791931...................... .................. 5.00 153.11 90.02 122.20 76.54 117.61 159.66
Plant 6:1922........................................ 2.21 38.34 66.00 52.52 74.85 88.17 70.161923.......... _..................... ......... 2.03 38.32 66.07 57.18 81.54 81.00 70.131924..................... .................... 2.08 39.39 74.57 65.00 90.16 82.67 72.091925.......... ................................ 2.01 42.29 93.28 89.94 116. 21 80.24 77.401926.......................................... 2.51 54.64 100.00 100.00 100.00 100.00 100.001927.......... ................... ............ 2.16 56.26 86.32 103.22 100.25 86.10 102.961928......................................... 2.14 63.97 84.32 115.73 98.85 85.30 117.071929.............................. ............ 1.85 65.98 75.18 122.99 101.85 73.78 120.751930..................... .................... 2.11 71.09 56.46 87.33 67.12 84.10 130.111933.......................................... 2.47 80.26 49.33 73.77 50.22 98.21 146.89
Digitized for FRASER http://fraser.stlouisfed.org/ Federal Reserve Bank of St. Louis

C h a p t e r 1.—Manufacture of Inner TubesThe inner tube is an essential part of a pneumatic tire. For this
reason the plants which specialize in the production of tire casings as a rule also manufacture inner tubes. The actual process, however, of making inner tubes is entirely distinct and separate from the manufacturing of tire casings. Even when handled in the same milling and compounding departments with casings, inner tubes require a different quality of crude rubber, different chemical ingredients, and a somewhat different method of compounding than are commonly used in tire casings.
Changes in Process of Making Inner TubesThe change in the type of tire produced, particularly the transition
from high-pressure to balloon tires, greatly affected the production of inner tubes. In the main, however, the manufacturing history of inner tubes followed a trend entirely its own. During the last decade the most important change which has occurred in the production of inner tubes has been the recent general adoption of the “ molded” tube process and the extensive application of systems of conveyors to coordinate the numerous small but distinct operations involved in the process of making inner tubes. The essential difference between molded tubes and any of the several types formerly made is: A molded inner tube, whether made directly on a tubing machine or by means of a calender and a special tube-making device, is first made endless and given its circular shape and then cured in a circular mold, thus permanently retaining its circular shape; in the other processes the tubes are first cured on long round poles or mandrels and afterward spliced to form the endless tube. The molded tube is absolutely smooth and makes a perfect fit when inserted in the tire casing, while the other tubes leave dangerous wrinkles and creases.
The molded-tube process completely revolutionized the manufacturing of inner tubes. In some plants the change occurred very recently and it was possible to make a complete analysis of the effect of this change on the methods of operation, type and quantity of labor used, and average man-hour output in the making of inner tubes by the new and old methods. In 1926 the plant in which this analysis was made specialized in the production of inner tubes by the mandrel process exclusively. Its average output for a 10-hour shift was approximately 30,000 tubes. In 1931 the same plant used the molded process exclusively and averaged approximately 20,000 tubes output during a 10-hour shift. A complete description of the organization and the working force used in 1926 and in 1931 follows.
67
Digitized for FRASER http://fraser.stlouisfed.org/ Federal Reserve Bank of St. Louis

1926— Mandrel processCrude-rubber preparation:
Men to open and clean bales of crude rubber and truck them to saw__ 2 Men to cut bales of crude rubber into slabs and throw pieces down
chute to milling department----------------------------------------------------------- 2Men to receive slabs of rubber at chute and stack them_______________ 1Men to operate 4 cracking machines to break down rubber___________ 4Men to operate 8 washers, sheet the rubber, and place it on screen___ 8Men to weigh sheeted stock, stack it on trucks, and remove to drying
kiln_______________________________________________________________ 3Men to remove dried rubber from kiln to milling department_________ 4
Total_____________________________________________________________ 24
6 8 LABOR PRODUCTIVITY IN AUTOMOBILE TIRE INDUSTRY
Compounding and mixing:Men to cut sheets of rubber into small pieces, weigh them and place in
metal containers----------------------------. ------------------------------- --------------- 4Men to weigh chemical ingredients, prepare the batch, and place it in
metal containers for mixing_______ ________ _______________________ 3Men to truck rubber and chemical ingredients to mixing mills________ 2Men to operate mixing mills_________________________________________ 14Men to fold sheeted, compounded rubber taken from mills, place it on
trucks, weigh it, and deliver to storage department_________________ 5
Total_______________________________________ _______ ______________ 28
Making inner tubes— calendering the stock:Stock men to deliver compounded rubber to calenders and generally
assist in calendering operations____________________________________ 2Men to operate the 5 calenders used_________________________________ 5Men to warm up stock on warming-up mills and deliver it to calenders. 20Men to assist in changing rolls on calenders__________________________ 10Truckers to remove calendered stock to rolling department___________ 5
Total__________________________________________________________ 42Making inner tubes— tube rolling:
Men to cut stock to length for 6 complete units______________________ 24Men to roll stock around straight mandrel___________________________ 24Girls to soapstone tubes after rolling_________________________________ 12Men to cross-wrap tubes in liners preparatory for cure________________ 24Men to load and unload curing trucks________________________________ 24Men to transfer trucks from loading stations to vulcanizers___________ 6Men to tend vulcanizers_____________________________________________ 6Men to strip tubes from mandrels after curing and place them on trucks. 24Men to truck tubes to finishing department__________________________ 6
Total_____________________________________________________________ 150
Finishing inner tubes:Men to skive or put a bevel edge on one end of the tube______________ 6Men to trim tubes to length and punch valve hole by hand___________ 12Men to buff both ends of tubes preparatory for splicing_______________ 12Girls to prepare cement, turn and cement both ends of tubes_________ 34Girls to insert valves in tubes, splice ends together, and place tubes on
trucks_____________________________ _______________________________ 16Men to truck tubes to pounders______________________________________ 2Men to operate splice pounding machines____________________________ 10Men to truck tubes from pounding machines to splice curing heaters. . 2Men to tend splice curing heaters____________________________________ 2Men to assemble bridge washers and tighten hexagon nuts on valves.. 10Girls to inflate tubes and place them on trucks_______________________ 8Men to truck inflated tubes to test pile______________________________ 4Men to truck tested tubes to deflators_______________________________ 4Girls to deflate tested tubes__________________________________________ 10
Digitized for FRASER http://fraser.stlouisfed.org/ Federal Reserve Bank of St. Louis

1926— Mandrel process—Continued
Finishing inner tubes— Continued.Girls to inspect and classify tubes____________________________________ 40Men to sort tubes as to sizes, brands, etc_____________________________ 8Men to truck finished tubes to packing department___________________ 2
Total__________________________________ _______________ _______ 182
Packing inner tubes:Men to check classified and assorted tubes___________________________ 5Men to deliver tubes to washers_____________________________________ 4Girls to wash tubes__________________________________________________ 20Men to deliver tubes to packers______________________________________ 4Girls to pack tubes in cartons________________________________________ 20Men to truck cartons to stacks______________________________________ 2Men to pack cartons in containers and seal containers________________ 6Men to deliver containers to stock room_____________________________ 4
Total_____________________________________________________________ 65
Grand total_________________________________ __________ 491
1981— Molded tubesCrude-rubber preparation:
Men to open and to clean bales of crude rubber, and to truck them to“ pie cutter”______________________________________________________ 1
Men to cut bales into slabs and place them on conveyor leading toplasticator or to stack them______ _________________________________ 2
Men to feed slabs of rubber from conveyor into hoppers of plasticatorsand operate plasticators___________________________________________ 1
Men to pick up sheets of plasticated rubber and hang them on hookconveyor for cooling purposes-____ ________________________________ 1
Men to take off cooled rubber from conveyor and place it on trucks tobe delivered to compounding department---------------------------------------- 1
Total_____________________________________________________________ 6
Compounding and mixing:Men to cut rubber into batches, weigh it, and weigh and add chemical
ingredients to rubber______________________________________________ 4Men to truck batches to mixing mills________________________________ 1Men to operate mixing mills_________________________________________ 9Men to strain compounded rubber of foreign materials________________ 1Men to remill strained rubber, weigh it, and incorporate sulphur into
rubber___________________________ _____ ___________________________ 5Men to fold sheeted rubber on trucks------------------------------------------------ 3Men to transfer stock to tube-making division________________________ 1
Total____________________________________________ ________________ 24
CHAP. 7.—MANUFACTURE OF INNER TUBES 69
Making and curing inner tubes:Men to warm up rubber on warming-up mills and to transfer rubber to
feeding mills which automatically deliver narrow bands of rubber to5 tubing machines_________________________________________________ o
Men to operate 5 tubing machines__________________________ _________ 5Girls to cut tubes to length and to inspect them on convcyor lines lead
ing from 5 tubing machines________________________________________ 5Girls to blow out soapstone from tubes----------------------------------------------- 5Men to punch holes and insert valves in tubes------------------------------------ 5Girls to buff ends of tubes___________________________________________ 10Girls to splice ends__________________________________________________ §Girls to operate splice pounding machines------------------------------------------ 5Girls to buff outside of splice________________________________________ 5Girls to soapstone splice and to feed curing belt---------------------- ----------- 5
Digitized for FRASER http://fraser.stlouisfed.org/ Federal Reserve Bank of St. Louis

1931— Molded tubes— Continued
70 LABOR PRODUCTIVITY IN AUTOMOBILE TIRE INDUSTRY
Making and curing inner tubes— Continued.Men to operate lines of vulcanizers connected with 5 belt conveyors (10
men to form and inflate tubes on forming drums and 10 to place inflated tubes in watchcase molds and remove cured tubes from molds to overhead hook conveyor)________ ______________________ 20
Total__________________ ______________ ____________________________ 75
Finishing inner tubes (tubes are automatically tripped from overhead conveyor to finishing belt):
Men to put in bridges, washers, nuts, etc., in tubes___________________ 7Men to insert valve cores____________________________________________ 8Girls to inflate tubes_________________________________________________ 3Girls to inspect tubes for blemishes__________________________________ 2Girls to watch water test tanks for leaking tubes_____________________ 2Girls to operate the bubble test of tubes_____________________________ 3Girls to deflate tubes_______ _________________________________________ 4Girls to inspect tested tubes_________________________________________ 11Men to assort tubes as to sizes, brands, etc., and place them on large
trucks for delivery to packing department__________________________ 4
Total_________________________________ ___________________________ 44
Packing inner tubes:Men to check and record assorted tubes______________________________ ___2Men to deliver tubes to packers_________________________________________1Girls to pack tubes into small cartons and cartons into containers________9Men to inspect and seal containers______________________________________2Men to place containers on conveyor for automatic delivery to the stor
age room_____________________________________________________________2
Total_____________________________________________________________ 16
Grand total_______________________________________________________ 165
In 1926 a force of 491 men and women was required to produce 30,000 mandrel-made inner tubes in 10 hours of work, thus averaging about 6 tubes per man per hour. In 1931 only 165 men and women were needed to produce an average of 20,000 tubes in 10 hours of work, thus averaging slightly more than 12 tubes per man per hour, or 100 percent more than in 1926.
Technological Displacement of Labor in Manufacturing Inner Tubesand Accessories
Some of the more recent changes in the process of manufacturing inner tubes and other tire accessories in three tire plants and their immediate effects on the labor employment situation in the respective units in which the changes occurred are presented in table 29.
Digitized for FRASER http://fraser.stlouisfed.org/ Federal Reserve Bank of St. Louis

CHAP. 7.— MANUFACTURE OF INNER TUBES 71T a b l e 29.— Effect on labor of specified technological changes in manufacturing inner
tubes and accessories in 3 tire vlants
Technological change Effect on labor
Plant 1-1928-31
Complete unit of molded-built inner tubes displacing the mandrel process.
Rearranging mandrel process of inner tubes for building, wrapping, and stripping operations.
Automatic valve pad punching machine installed on tube calender.
Automatic trimmer installed for inner tubes...........................Automatic device for measuring inner tubes...... ......................Splice presses added to rubber flap conveyor_______________Cutting flaps on utility cutting machine___________ ______Hand stamping of flaps replaced by electric branding_______Machine process for application of gum to flaps and for re
rolling liners for flaps.Tube calender equipped with electric knife........ .....................Changes in system of curing, classifying, and inspecting
mandrel-built tubes.Classifying and water-testing operations of inner tubes
combined.Calender and rolling device method replaces drum process
of building molded inner tubes.Machine replaces hand process of skiving inner tubes..........Automatic strip feeder installed on tubing machine_________Conveyor installed between the 2 test-water tanks on inner
tubes.Final inspection of inner tubes consolidated..................... ........
Change in method of curing molded inner tubes...... ........ ......Inspection and boxing of inner tubes combined_____________
Plant 2-1980-31
3 complete units for manufacture of molded tubes installed.
New system of sorting and assembling tubes installed--------2 conveyor units, 1 for assembling of valves and the other
for testing of the valves, installed.2 nut-tightening machines installed to apply bridge washer
and lock nut in 1 operation.
Plant 8—1929-30
Automatic feeder installed at flap tubing machines........ ........Flap punching machines moved to flap-making division........Tube-sorting conveyor rearranged........ ....................................
Preparation conveyor in tube room moved, and service conveyor and automatic soapstoner rearranged.
Soapstone belt lengthened and 2 automatic soapstone vibrators installed.
Automatic soapstoner installed for flaps..................- .......... —Automatic cutter installed on tube preparation u n it . . . .........3 tube stenciling machines installed...........................................4 additional molds for curing molded tubes installed...... ........
New tray skids purchased for handling of inner tubes and flaps.
380 man-hours saved per day.
240 man-hours saved per day.
3 men eliminated; 24 man-hours saved per day.
24 man-hours saved per day.36 man-hours saved per day.144 man-hours saved per day.30 man-hours saved per day.20 man-hours saved per day.50 man-hours saved per day.
18 man-hours saved per day.252 man-hours saved per day.
16 man-hours saved per day.
230 man-hours saved per day.
120 man-hours saved per day.36 man-hours saved per day.16 man-hours saved per day.
2 inspectors eliminated; 16 man-hours saved per day.
60 man-hours saved .per day.30 man-hours saved per day.
Total saving of 1,340 man-hours, equivalent to displacement of 134 men and women.
8 girls eliminated.5 men and 5 girls per day eliminated.
1 girl and 1 man eliminated per day.
3 feeders per day eliminated.2 inspectors and 2 truckers eliminated. Unnecessary handling of tubes eliminated,
total saving equivalent to displacement of 4 girls.
6 girls eliminated.
3 girls eliminated.
Do.Do.Do.
Output per mold man increased from 8 to10 percent; 1 service girl per shift eliminated.
6 bookers eliminated.
Labor Productivity in Manufacturing Inner TubesTable 30 contains a composite picture of the production of inner
tubes in five representative plants from 1922 through 1931. The method of presentation is similar to that of table 5 (p. 7), dealing with the production of tires. The table shows data of actual production, giving the total output in number of tubes produced and the weight of rubber used for the production of the tubes, the total direct productive man-hours worked, and the average output per man per hour measured by the number of tubes and their weight; produc-
Digitized for FRASER http://fraser.stlouisfed.org/ Federal Reserve Bank of St. Louis

tion data are also expressed in terms of index numbers, with the year 1926 as the base. In 1922 the average man-hour output for the five plants was 5.15 tubes weighing 11.56 pounds. In 1931 the corresponding man-hour output was 8.03 tubes weighing 21.15 pounds. Based on 1926 as 100, the tube output per man per hour ranges from 83 in 1922 to 129.37 in 1931. The corresponding index of weight output varies from 76.73 in 1922 to 140.32 in 1931. Since1926 the man-hour output has increased 29.37 percent if measured by the number of tubes produced and 40.32 percent if measured by the weight of the tubes. The difference in the pace between the two indexes is due to the fact that since 1926 there has also been a considerable increase in the average weight per tube, due to the increases in the sizes of tires produced.
72 LABOR PRODUCTIVITY IN AUTOMOBILE TIRE INDUSTRY
T a b l e 30.— Total and man-hour production of inner tubes in 5 representative plants, and index numbers thereof, 1922 to 1981, by years
Year
Total outputMan-hours
worked
Output per man-hour
Index numbers (1926=100)
Total outputMan-hours
Output per man-hour
Number of tubes Pounds Tubes Pounds Tubes Pounds Tubes Pounds
1922......... 23,062,000 51,737,000 4,474,000 5.15 11.56 68.80 63.61 82.90 83.00 76.731923________ 27,643,000 60,982,000 4,858,000 5.69 12.55 82.47 74.97 90.00 91.63 83.301924............ 30,130,000 67,188,000 5,393,000 5.59 12.46 89.89 82.60 99.93 89.95 82.661925________ 37,272,000 87,231,000 6,571,000 5.67 13.27 111.20 107.24 121.75 91.34 88.081926________ 33,518,000 81,341,000 5,397,000 6.21 15.07 100.00 100.00 100.00 100.00 100.001927________ 35,685,000 89,172,000 5,507,000 6.48 16.19 106.47 109.63 102.03 104.35 107.451928......... 40,162,000 106,458,000 6,248,000 6.43 17.04 119.82 130.88 115.75 103.51 113,071929________ 41,159,000 113,159,000 5,958,000 6.91 18.99 122.80 139.12 110.39 111.24 126.031930________ 35,542,000 95,861,000 5,238,000 6.79 18.30 106.04 117.85 97.05 109.26 121.441931________ 29,838,000 78,535,000 3, 714,000 8.03 21.15 89.02 96.55 68.81 129.37 140.32
The statistics of the individual plants are presented in table 31. Plant 1, which has the largest 1931 indexes of man-hour output both in tubes produced and in their weight, has a range of output from 6.88 tubes and 12.37 pounds in 1922 to 15.87 tubes and 31.90 pounds in 1931. The index of the man-hour tube output in this plant ranges from 94.61 (in 1923) to 220.32 (in 1931), and the corresponding index of weight output ranges from 88.65 (in 1923) to 234.89 (in 1931). There was very little change in the man-hour output of this plant between 1922 and 1928. Since 1929, however, which marked the complete adoption of molded tube manufacturing in this plant the man-hour output has risen rapidly. In 1930 the index of the man-hour tube output rose 48.40 points and in 1931,42.90 points more. The corresponding index of weight output rose 48.97 points in 1930 and an additional 34.96 points in 1931. It will be noticed, however, that the statistics of this plant do not include the finishing and inspection operations, as these could not be segregated from the finishing and inspecting of tire casings.
Digitized for FRASER http://fraser.stlouisfed.org/ Federal Reserve Bank of St. Louis

In 1920 plant 2 averaged 2.71 tubes weighing 5.62 pounds per man per hour. In 1931 the man-hour output o f this plant was 6.60 tubes weighing 17.70 pounds. Based on 1926 as 100, the index of the man-hour tube output ranges from 59.78 in 1920 to 145.45 in 1931. The corresponding index of weight output ranges from 57.06 in 1920 to 179.61 in 1931. The largest increase in the man-hour output of this plant took place in 1931 when the index of tube output jumped from 93.45 to 145.45 and the corresponding index of weight output rose from 122.59 to 179.61. This may be attributed partly to the complete adoption of the molded tube process, but chiefly to the installation of a large number of belt and overhead conveyors in all the divisions engaged in the production of inner tubes.
Plant 3, which specializes in the production of large-size tires and large-size inner tubes, shows a decidedly different trend for the man- hour tube output from the weight output. From 1923 through 1928 the average output, measured by the number of tubes produced per man per hour, gradually decreased, which may be accounted for by the rapid increase in the average weight of tubes produced during that period. Since 1929 both the tube and weight output have been increasing. In 1931 the average man-hour output was 4.13 tubes, which was less than in 1923, while the weight output of 18.31 pounds was more than twice that for 1923. Since 1926 the tube output per man per hour has increased 32.94 percent while the corresponding weight output has increased 54.09 percent. Again, as in the previous plant, the main increase took place in 1931 when the index of tube output rose 38.99 points and the index of weight output rose 20.46 points.
The average man-hour output in the production of tubes in plant 4 varies from 5.64 tubes and 10.43 pounds in 1922 to 9.44 tubes and 23.50 pounds in 1931. With 1926 as 100, the index of the man-hour tube output ranges from 64.87 (in 1922) to 110.55 (in 1929). The corresponding index of weight output ranges from 54.59 (in 1921) to 139.14 (in 1929). In 1931 the average tube output per man per hour was only 8.60 percent higher than in 1926, while the corresponding weight output was 28.73 percent higher.
In 1921 plant 5 produced 6.06 tubes per man per hour weighing 16.36 pounds, while in 1931 the corresponding output of this plant was 8.53 tubes weighing 22.08 pounds. The 1931 man-hour tube output of this plant was onlv 7.77 percent higher than in 1926, while the weight output was only 4.52 percent higher. The difference in the pace between the man-hour output of the last two plants and the other plants is due to the fact that although these plants adopted the molded-tube process much earlier they have not completely abandoned the old mandrel methods of making inner tubes.
CHAP. 7.— MANUFACTURE OF INNER TUBES 73
Digitized for FRASER http://fraser.stlouisfed.org/ Federal Reserve Bank of St. Louis

74 LABOR PRODUCTIVITY IN AUTOMOBILE TIRE INDUSTRY
T a b l e 31.— Actual man-hour production and index numbers of total and man-hour production of inner tubes in 5 specified plants, in specified years, 1920 to 1931
Plant number and year
Output per man- hour Index numbers (1926=100)
Number of tubes Pounds
Total output1
Man-hours
Output per man- hour
Tubes Pounds Tubes Pounds
Plant 1: i1922__ ____ _______________ 6.88 12.37 64.32 61.36 67.35 95.50 91.111923______________ ______ 6.81 12.04 76.63 71.80 80.99 94.61 88.651924__________________ ____ 7.76 13.68 87.57 81.80 81.23 107.79 100.691925_______________________ 7.30 14.37 111.29 116.20 109.82 101.35 105.811926..... ................... ................. 7.20 13.58 100.00 100.00 100.00 100.00 100.001927_________________ _____ 7.12 13.57 115.97 117.23 117.35 98.82 99.901928______ ______ _________ 7.42 15.09 122.54 132.09 118.91 103.04 111.081929_______________________ 9.29 20.50 154.17 180.37 119.48 129.02 150.961930__________________ ____ 12.78 27.15 104.68 117.96 59.00 177.42 199.931931............ ........................... 15.87 31.90 67.53 72.00 30.65 220.32 234.89
Plant 2:1920................................. ......... 2.71 5.62 18.17 17.32 30.36 59.78 57.061921_______________________ 3.32 7.24 46.03 46.18 62.87 73.21 73.451922_______________________ 3.51 8.47 74.92 83.30 96.89 77.31 85.971923__________________ ____ 3.99 9.09 74.80 78.36 84.95 88.05 92.251924_______________________ 4.46 9.05 87.51 81.73 88.99 98.32 91.831925_______________________ 4.34 9.71 104.99 108.03 109.63 95.77 98.551926______ ____ ___________ 4.54 9.85 100.00 100.00 100.00 100.00 100.001927_________________ _____ 4.16 9.84 65.13 70.89 71.01 91.73 99.841928________ _____ ________ 4.25 10.31 95.82 107.12 102.34 93.63 104.681929______ ______ _________ 4.10 10.95 78.40 96.42 86.77 90.34 111. 121930..................... ............ ......... 4.24 12.08 96.89 127.11 103.69 93.45 122.591931___ _______ ___________ 6.60 17.70 111. 74 137.98 76.83 145.45 179.61
Plant 3:1922 ...________ ___________ 3.80 8.10 62.09 41.06 60.21 103.12 68.201923 ..._____ ______________ 4.21 8.97 81.65 54.00 71.53 114.13 75.491924_______________________ 3.79 9.24 94.41 71. 41 91.86 102.77 77.741925_______________________ 3.71 11.20 107.18 100.26 106.40 100.73 94.231926_______________________ 3.69 11.88 100.00 100.00 100.00 100.00 100.001927__________ ____ _______ 3.39 11.58 102.80 110.38 113.28 91.86 97.441928_________ _____ _____ - 3.12 12.85 87.79 112.09 103.67 84.67 108.121929...................................... . 3.20 14.93 75.05 108.64 86.46 86.79 125.661930_______________ _____ 3.46 15.88 61.31 87.21 65.26 93.95 133.631931_______________________ 4.13 18.31 56.60 65.61 42.57 132.94 154.09
Plant 4:1921_______________ _______ (2) 9.97 (2) 42.52 77.88 (2) 54.591922_______________________ 5.64 10.43 74.36 65.48 114.62 64.87 57.131923 ...____ _______________ 6.14 11.28 95.27 83.39 134.99 70.58 61.781924____________ __________ 6.03 11.08 95.72 83.79 138.04 69.35 60.701925_______________________ 6.70 12.27 117.84 102.76 152.90 77.06 67.211926_______________________ 8.69 18.26 100.00 100.00 100.00 100.00 100.001927.____ _________________ 9.58 21.08 124.90 130.90 113.38 110.14 115.451928_______________________ 9.18 22.89 124.00 147.30 117.49 105.53 125.371929_______________________ 9.61 25.41 125. 62 158.10 113.63 110.55 139.141930_______________________ 9.28 23.97 101.79 125.26 95.41 106.68 131.291931_______________________ 9.44 23.50 75.79 89.83 69.79 108.60 128.73
Plant 5:1921_____ _____ ___________ 6.06 16.36 42.29 42.72 55.18 76.64 77.421922_______________ ____ _ 6.82 18.21 66.30 66.27 76.89 86.22 86.191923_______________________ 7.37 19.75 79.97 80.23 85.82 93.19 93.481924_______________________ 6.78 18.55 86.03 88.11 100.35 85.73 87.801925 ..................... ............ . 6.71 17.77 111.29 110.40 131.25 84.80 84.111926_____ _____ ___________ 7.91 21.13 100.00 100.00 100.00 100.00 100.001927_______ ____ __________ 8.31 22.01 112.27 111. 37 106.93 104.99 104.151928_______________________ 8.22 21.86 141.28 140.64 135.92 103.94 103.471929.......... __________ _______ 8.14 21.62 150.83 150.01 146.62 102.88 102.311930_________________ ______ 7.67 19.32 132.73 125.15 136.85 96.99 91.451931........ ................................ 8.53
122.08 108.66 105.37 100.82 107.77 104.52
1 Finishing and inspection not included in data for this plant.2 Not available.
Digitized for FRASER http://fraser.stlouisfed.org/ Federal Reserve Bank of St. Louis