bls_1324_1962.pdf
TRANSCRIPT

INDUSTRY WAGE SURVEYLife Insurance
IM A Y -J U L Y 1961
Bulletin No. 1324
UNITED STATES DEPARTMENT OF LABOR Arthur J. Goldberg, Secretary
1 M fmmBUREAU OF LABOR STATISTICS
Ewan Clague, Commissioner
Digitized for FRASER http://fraser.stlouisfed.org/ Federal Reserve Bank of St. Louis

INDUSTRY WAGE SURVEY
Life Insurance
M A Y -JU L Y 1961
Bulletin No. 1324April 1962
UNITED STATES DEPARTMENT OF LABOR Arthur J. Goldberg, Secretary
BUREAU OF LABOR STATISTICS Ewan Clague, Commissioner
For sale by the Superintendent of Documents, U.S. Government Printing Office, Washington 25, D.G. Price 30 centsDigitized for FRASER http://fraser.stlouisfed.org/ Federal Reserve Bank of St. Louis

Digitized for FRASER http://fraser.stlouisfed.org/ Federal Reserve Bank of St. Louis

Preface
This bulletin summarizes wage and supplementary practice information for nonsupervisory office em ployees in home offices and regional head offices o f the life insurance industry in May—July 1961.
Separate releases for the following areas were issued earlier, usually within a few months of the payroll period to which the data relate: Baltim ore, Boston,Chicago, Dallas, Des Moines, Hartford, Houston, Jacksonv ille , Los Angeles—Long Beach, Minneapolis—St. Paul, New York City, and Philadelphia. Copies of these releases are available from the Bureau of Labor Statistics, Washington 25, D. C. or from any of its regional o ffices.
This report was prepared by Charles M. O ’Connor of the Bureau’ s Division of Wages and Industrial Relations. Field work for the survey was directed by the Assistant Regional D irectors for Wages and Industrial Relations.
Digitized for FRASER http://fraser.stlouisfed.org/ Federal Reserve Bank of St. Louis

Digitized for FRASER http://fraser.stlouisfed.org/ Federal Reserve Bank of St. Louis

Contents
Page
Sum m ary ---------------------------------------------- 1Industry ch a ra c te r is t ics ----------------------------------------------------------------------------------------- 1O ccupational e a rn in g s ---------------------------------------------------------------------------------------------- 2E stab lishm ent p ra ctice s and supplem entary wage p r o v is io n s -------------------------- 4
M inim um entrance sa la r ie s fo r w om en o ff ic e e m p lo y e e s___________________ 4
P aid holidays ___________________________________________________________________ 4
Health, insurance, and pension plans ----------------------------------------------------------- 5
F re e lunches ___________________________________________________________________ 5
T a b les :
A verage w eek ly earn ings:
O ccupational earn ings:
4. C h icago, 111. ____________________________________________________________ 105. D allas, T ex. ____________________________________________________________ 116. Des M oines, I o w a ----------------------------------------------------------------------------------- 127. H artford , Conn. _______________________________________________________ 13
9. J a ck son v ille , F la . ------------------ 1510. L os A ngeles—Long B each , C a lif. ------------------------------------------------------------- 1611. M inneapolis—St. Paul, M in n .____________________________________________ 1712. New Y ork , N .Y . _______________________________________________________ 1813. Philadelphia, Pa. ____________________________________________________ 19
E stablishm ent p ra ctice s and supplem entary wage p ro v is io n s :
14. M inim um entrance sa la r ie s fo r w om en o ff ice em ployees _________ 2015. Scheduled w eek ly hours ___________ _____________________________________ 2216. Paid holidays _____________________________________________________-______ 23
18. H ealth, in su ran ce, and pension plans ________________________________ 2619. N onproduction bonuses _______________________________________________ 27
A ppen dixes:
A. Scope and m ethod o f su rvey ---------------------------------------------------------------------- 29B . O ccupational d escrip tion s _________________________-_____________________ 32
v
Digitized for FRASER http://fraser.stlouisfed.org/ Federal Reserve Bank of St. Louis

Digitized for FRASER http://fraser.stlouisfed.org/ Federal Reserve Bank of St. Louis

Industry W age Survey—
Life Insurance, May—July 1961
A ctuaries (c la ss A ), perform in g highly com plex and sp ecia lized studies, averaged $288 .50 a week in May—July 1961, and w ere highest paid among the 29 occupations cov ered by a study o f sa laries in life insurance com panies con ducted by the Bureau o f Labor S ta t is t ic s .1 Nationwide averages fo r the r e m ainder o f the jobs studied ranged from less than $60 a week fo r routine c le r ica l jobs to $155 fo r experienced underw riters and data p ro cess in g system s analysts, and $190 .50 fo r class B actuaries. Men, accounting fo r about a fourth o f the o ffice em ploym ent in the industry, substantially outnum bered the women in each o f the jobs studied in which average w eekly earnings exceeded $100.
R egionally, as far as com parisons w ere p oss ib le , occupational averages tended to be highest on the P a c ific Coast and low est in the Southeast region ; in the 12 areas studied separately, the highest earnings w ere record ed in New Y ork City and the low est in D allas.
W eekly work schedules o f 51llz hours or le ss applied to five -s ix th s o f the em ployees in M ay—July 1961. Paid holidays and paid vacations w ere provided by all the establishm ents v isited . L ife , hospitalization , su rg ica l, and catastrophe insurance w ere available to nine-tenths o r m ore o f the o ffice em ployees; m ed ica l insurance, sick leave, and other plans w ere also com m only reported . R etirem ent pension plans applied to v irtually all o f the nonsupervisory o ffice em ployees.
Industry C haracteristics
In I960 there w ere 130 m illion life insurance po licyh o ld ers in the United S ta tes .3 To prov ide se rv ice fo r these p o licyh o ld ers , the life insurance industry em ployed m ore than 450,000 e m p lo y e e s .4 The Bureau*s study o f the industry was lim ited to hom e o ffices and regional head o ffice s , which together em ployed an estim ated 107,788 nonsupervisory o ffice em ployees in M ay-Ju ly 1961. N early tw o-fifths o f the nonsupervisory o ffice em ploym ent was in the M iddle Atlantic region , about on e-s ix th each was in the New England and G reat Lakes reg ions, and a tenth o r le ss in each of the rem aining regions.
Home o ffice s and regional head o ffices o f life insurance com panies are located alm ost ex clu s ive ly in m etropolitan areas. The 12 areas studied se p arately accounted fo r th ree-fifth s o f the total non su perv isory o ffice em ploym ent. New Y ork City, the la rgest insurance center, em ployed nearly 29, 000, as c o m pared with 7, 000 to 8, 000 in Boston and H artford, the two next la rgest in su rance areas.
1 See appendix A fo r scope and m ethod o f survey; see appendix B fo r occupational descrip tion s .
2 F or definition o f regions and se lected areas, see table in appendix A.3 Institute of L ife Insurance, L ife Insurance F act Book, 1961, New York,
N .Y . , 1961, p . 15.4 Em ploym ent and E arn ings, N ovem ber 1961, table S B -1, p. 111.
1
Digitized for FRASER http://fraser.stlouisfed.org/ Federal Reserve Bank of St. Louis

2
A pproxim ately three-fourths o f the nonsupervisory o ffice em ployees c o v ered by the Bureau’ s survey w ere wom en. The prop ortion o f women varied from tw o-th irds in the M iddle Atlantic to seven-eighths in the Great Lakes region .
Insurance com panies owned by policyh olders (mutual com panies) accounted fo r approxim ately tw o-th irds o f the em ployees cov ered by the study and fo r the m a jority o f the em ploym ent in the Great Lakes, M iddle Atlantic, M iddle W est, and New England reg ions. Stock com panies em ployed approxim ately fou r-fifth s o f the em ployees in both the Southeast and Southwest reg ions, slightly m ore than tw o-th irds in the P a c ific region , and nearly th ree-fifth s in the B order States.
A pproxim ately tw o-th irds o f the o ffice em ployees in the industry w ere in establishm ents writing other types o f insurance in addition to life insurance. Such establishm ents accounted fo r a m a jority o f the em ployees in all regions except New England and the B order States.
Home o ffices and regional head o ffice s o f life insurance com panies vary greatly in s ize . A pproxim ately tw o-fifths o f the o ffices covered by the study had few er than 100 em ployees, a third em ployed between 100 and 250, and a tenth em ployed between 250 and 500. Several o ffice s em ployed m ore than 1, 000 em ployees; a few o ffice s reported m ore than 5, 000 em ployees.
Establishm ents with labor-m anagem ent contracts covering the m a jority o f their o ffice em ployees accounted for an estim ated 2 percen t o f the industry ’ s em ploym ent; these establishm ents w ere located m ainly in the Great Lakes and Southwest regions.
Slightly m ore than fou r-fifth s o f the em ployees w ere in o ffices with f o r m al pay system s that included ranges o f rates fo r established job c la ss ifica tion s ; v irtually all o f the rem ainder of the em ployees w ere in o ffices in which pay rates w ere determ ined p rim a rily in relation to the qualifications o f the individual em ployee.
Occupational Earnings
The 29 occupational c la ssifica tion s fo r which earnings data w ere o b tained accounted fo r a third o f the 107, 788 nonsupervisory o ffice em ployees in establishm ents within scope of the survey (table 1). Nationwide average weekly sa laries fo r the 14 occupations predom inantly staffed by m en ranged from $77 fo r c lass B tabulating-m achine op era tors , the la rgest occupational group fo r m en studied, to $288 .5 0 fo r c lass A actuaries. C lass C actuaries, the second la rgest group fo r m en, averaged $ 124 .5 0 . Men substantially outnum bered wom en in each o f the jobs with w eekly averages o f m ore than $100. These included such occupations as actuaries, p rog ram m ers, system s analysts, and two c la sses o f underw riters.
The 15 occupations p r im a rily staffed by wom en accounted fo r fou r-fifth s o f the nearly 36, 000 em ployees fo r whom earnings data w ere obtained. A verage weekly earnings fo r these occupations ranged from $ 5 3 .5 0 a week fo r routine (c la ss B) file clerk s to $83 fo r class B correspon d en ce c le rk s . A pproxim ately on e-h alf o f the women accounted fo r by the occupations studied w ere em ployed in four occupations: C lass B file c lerk s ($ 5 3 .5 0 ), class B typists ($ 5 6 .5 0 ),keypunch operators ($ 6 2 .5 0 ), and general stenographers ($ 6 4 .5 0 ).
Digitized for FRASER http://fraser.stlouisfed.org/ Federal Reserve Bank of St. Louis

3
Am ong the occupations studied, average w eekly earnings in the M iddle Atlantic and P a c ific regions w ere usually above the national level; in the Great Lakes and New England reg ions, the earnings tended to be at o r near the industry averages, and in the B order, M iddle W est, Southeast, and Southwest reg ions, w ere m ost com m only below the national average. The high-w age position o f the P a c ific region applied to nearly all o f the c le r ica l jobs but not to the higher paid occupations. Thus, P a c ific Coast averages fo r accounting clerk s (c la ss A ), a c tuaries (c la ss C), and underw riters (c la sses A and B) w ere below the national average.
Am ong 12 areas se lected fo r separate study, highest earnings w ere r e corded in New Y ork City and low est earnings in D allas. As indicated in the f o l lowing tabulation, earnings in the highest paid areas w ere nearly 25 percen t above those in the low est, without any particu lar concentrations in betw een .5
Relative pay levels (United StatesslOO)
New York C ity ---------------------------------------- HOHouston ---------------------------------------------------------- 109C h icago------------------------------------------------- 109Los Angeles—Long Beach --------------------- 107Hartford------------------------------------------------- 106Jacksonville---------------------------------------------------- 98Boston ------------------------------------------------------------ 97Des M oines------------------------------------------------------ 95Minneapolis—St. P a u l-------------------------------------- 93Philadelphia --------------------------------------------------- 91Baltimore ------------------------------------------------------- 90Dallas ------------------------------------------------------------ 89
A verage w eekly earnings fo r the occupations studied are presented by area in tables 2 through 13. The earnings o f wom en class B typists, the num erica lly m ost im portant occupational category studied, averaged from $50 a week in M inneapolis—St. Paul to $68 in H artford. Women em ployed as routine (c lass B) file c le rk s , the next la rgest occupational group studied, had average weekly earnings ranging from $48 in Dallas and Des M oines to $61 .5 0 in H artford.
Earnings o f individuals varied substantially within the sam e job and l o cality . In many instances, weekly earnings o f the highest paid em ployees e x ceeded by $50 or m ore those o f the low est paid in the sam e job and area. Thus, som e em ployees in com paratively low -paid jobs (as m easured by the a v erage fo r all em ployees) earned m ore than som e in jobs fo r which sign ificantly
5 These com parisons are based on occupations fo r which earnings data w ere available in each area. F or each area, average w eekly earnings fo r m en in 11 jobs and fo r women in 14 jobs w ere m ultiplied by the nationwide em ploym ent in these resp ective occupations and the products w ere totaled. These totals are e x p ressed as percentages o f the s im ila r total fo r the Nation.
Digitized for FRASER http://fraser.stlouisfed.org/ Federal Reserve Bank of St. Louis

4
higher averages w ere recorded . F or exam ple, the follow ing tabulation indicates a considerable overlapping of individual sa laries fo r wom en em ployed as class A accounting clerk s and keypunch operators in New Y ork City, despite a $ 22 .50 d ifferen ce in the weekly averages fo r the two job s .
Number of women employed as-
Class A
Average weekly earnings
$50 and under $ 6 0 -----------------------------$60 and under $ 7 0 -----------------------------$70 and under $ 8 0 -----------------------------$80 and under $90 -----------------------------$90 and under $100---------------------------$100 and o v e r -----------------------------------
Total number of workers----------
Average weekly earnings--------------------
accounting Keypunchclerks operators
- 926 345
33 7635 2334 -24 4
132 540
$87.?0 $65.00
Salaries o f individuals perform in g s im ila r tasks a lso showed typical variation within the sam e establishm ent, as the resu lt o f form alized pay system s that included ranges o f rates fo r sp ec ific occupations.
Establishm ent P ra ctice s and Supplem entary Wage P rov is ion s
Data w ere also obtained on m inim um entrance rates, w eekly work sch ed u les, and se lected supplem entary benefits, including paid holidays and vacations, and health, insurance, and pension plans fo r nonsupervisory o ffice em ployees.
M inimum Entrance Salaries for Women O ffice E m ployees. M inimum entrance sa laries o f inexperienced typists and other wom en c le r ica l em ployees w ere determ ined by form a lly established p o lic ies in 9 out o f ev ery 10 establishm ents in the study (table 14). In all but a few instances, beginning w eekly sa laries fo r both occupational cla ssifica tion s w ere within a range o f $40 to $60, and m ost com m only between $45 and $50. Regionally, entrance sa laries tended to be highest in the P a c ific Coast region and low est in the Southeast.
Scheduled W eekly H ours. Weekly w ork schedules of 37% hours or less applied to five - s ixths o f the nonsupervisory o ffice em ployees (table 15). The P a c ific Coast was the only region in which the m a jority o f the em ployees w ere scheduled to w ork 40 hours a week. The average scheduled weekly hours in the various regions w ere as fo llow s: M iddle Atlantic, 36. 5; New England, B order States, and Southeast, 37; Great Lakes, 3 7 .5 ; Southwest and M iddle West, 38 .5 ; and P a c ific , 39. In 8 o f the 12 areas studied separately, the m ajority o f the em ployees w ere scheduled to w ork 37V2 hours a week. In B altim ore , New York City, and Philadelphia, the m ajority o f the em ployees w ere scheduled to work slightly few er hours. Dallas was the only area in which the m a jority o f the em ployees worked m ore than 37^2 hours a week.
Paid H olidays. Paid holidays w ere provided by all establishm ents v isited (table 16J] F ou r-fifth s of the nonsupervisory o ffice em ployees in the M iddle A tlantic region rece iv ed 12 paid holidays annually, a ll o f the em ployees in New England rece iv ed 9 o r m ore days (m ost com m only 9 fu ll-days or 11 fu ll-days and 1 half day), and the m a jority o f the em ployees on the P a c ific Coast rece ived 10,
Digitized for FRASER http://fraser.stlouisfed.org/ Federal Reserve Bank of St. Louis

5
11, or 13 days annually. Holiday p rov is ion s in other regions w ere le ss libera l; em ployees in the Southeast, Southwest, and M iddle W est regions m ost com m only rece iv ed 5 o r 6 days annually.
The m ost com m on prov ision s fo r paid holidays in the 12 areas ranged from 5 or 6 days in Dallas to 12 o r 13 days in Philadelphia.
Paid V acations. Paid vacations after qualifying periods o f se rv ice w ere provided by a ll establishm ents (table 17). P rov is ion s which applied to the m a jo r ity o f the nonsupervisory o ffice em ployees included: 2 w eeks' a fter 1 year,3 w eeks' a fter 15 y ears , and 4 w eeks' after 20 years o f se rv ice . P rov is ion s tended to be m ore lib era l in the M iddle Atlantic region than in the other regions.
M ore than fou r-fifth s o f the o ffice em ployees in all o f the areas, except B altim ore, rece iv ed 2 w eeks' vacation after 1 year o f s e rv ice ; half o r m ore w ere elig ib le fo r 3 weeks after 10 y e a rs ' se rv ice in 5 areas, after 15 y e a rs ' se rv ice in 6 other areas. Four weeks o f vacation w ere m ost com m only provided after 20 years o f s e rv ice in Boston, Houston, Jacksonville , and New York City, and after 25 years in Los Angeles—-Long Beach, M inneapolis—St. Paul, and Philadelphia.
Health, Insurance, and Pension P lan s. L ife , hospitalization , surg ica l, and catastrophe insurance, financed at least in part by the em ployer, w ere availa ble to nine-tenths o r m ore o f the o ffice em ployees (table 18). A ccidental death and d ism em berm ent insurance, m ed ica l insurance, and sick leave (full pay, no waiting period ), w ere a lso com m only reported .
P ension plans providing regular payments fo r the rem ainder o f the e m p loy ee 's life upon retirem ent, in addition to those pensions available under F edera l o ld -a g e , su rv iv o rs ', and disab ility insurance applied to v irtually a ll o f the em p loyees. In all but 1 o f the 12 areas studied separately, m ore than nine-tenths o f the o ffice em ployees w ere in establishm ents having pension plans; in B altim ore , tw o-th irds o f the o ffice em ployees w ere in establishm ents having such plans.
Nonproduction B onuses. Nonproduction bonuses, typ ica lly paid at C h ristm as or yea rend, w ere provided by establishm ents em ploying on e-th ird o f the o ffice em ployees (table 19). Such bonuses w ere m ost com m only reported in Chicago, D allas, H artford, and M inneapolis—St. Paul.
F ree Lunches. Establishm ents em ploying a third o f the em ployees p r o vided free lunches. Although this prov ision was m ost com m on in the M iddle Atlantic region, it was reported by som e establishm ents in nearly a ll regions.
Digitized for FRASER http://fraser.stlouisfed.org/ Federal Reserve Bank of St. Louis

Table 1. Average Weekly Earnings: Selected OccupationsOn
(Number and average straight-time weekly earnings 1 of employees in selected occupations in home offices and regional head offices of life insurance companies, United States and selected regions, May-July 1961)
Regions
Occupation and sex
United States 2New England Middle Atlantic Border States Southeast Southwest Great Lakes Middle West Pacific
Numberof
em ployees
Averageweekly
earning^
Numberof
em ployees
Averageweekly
earnings
Numberof
employees
Averageweekly
earnings
Numberof
em ployees
Averageweekly
earnings
Numberof
em ployees
Averageweekly
earnings
Numberof
em ployees
Averageweekly
earnings
Numberof
em ployees
Averageweekly
earnings
Numberof
em ployees
Averageweekly
earnings
Numberof
em ployees
Averageweekly
earnings
Actuaries, class A (155 men$324.50 $316.00 $254.00and 2 women) --------------- ----------------------- 157 $288.50 35 $286.50 67 $272. 50 - - - - 6 28 6 - -
Actuaries, class B (259 men$172.00and 6 women) __— _____________________ 265 190.50 54 194.00 87 184.50 9 - - 10 172.00 61 208. 00 13 178.00 - -
Actuaries, class C (569 men$112.00 93 $114.00and 75 women) ______ — __ ------------ _ 644 124.50 96 134.50 242 129.00 18 107.00 49 25 115.00 89 128.00 32 120.00
Assem blers (1, 294 women1, 350 58. 50 55 60.50 _ - 8 57.50 - - 98 56.00 77 55.00 94 48. 50 - -
Clerks, accounting, class A ___________ 1, 321 82.00 112 83.50 258 86.50 43 72. 50 272 74.00 109 82. 50 316 87.00 110 82.00 101 76. 50M e n ____ ________________________________________ 235 93.00 18 75.00 53 94.00 - - 38 87.00 23 95.50 62 101.50 28 86.00 8 89.50W om en ___ __ ____ ____ ___ 1, 086 79.50 94 85.00 205 84. 50 38 66.50 234 72.00 86 79.00 254 83.50 82 80. 50 93 75.00
Clerks, accounting, class B ___ ____ 2, 199 60.00 228 62.00 369 61.50 135 60.00 333 58. 00 229 56.50 495 60.50 256 60.50 96 67.50M e n __ ________ ____ — — _ 111 66.00 8 72.00 16 58.00 _ - 8 62.50 - - - - - - - -Women __ __ __ _______ — _____ _ 2, 088 60.00 220 61. 50 353 62.00 131 60.00 325 57.50 225 56.50 450 60. 00 232 59.50 94 67.50
Clerks, correspondence, class A -------- 793 109.50 51 105.50 _ _ 8 112.00 32 94. 50 74 97.00 175 103.50 60 97.00 74 96.50Men ______ _. __ __ __ ------ 463 119.00 23 111.50 _ _ 7 109.00 8 106.00 25 116.00 107 112.00 37 103. 50 22 112.00W omen __ ___________ ,_ _____ 330 96.50 28 100.50 73 117.50 - - 24 90.50 49 87.00 68 89.50 23 86.00 52 90.00
Clerks, correspondence,106 82.50d&SS B mmm. ___ I ■ - |_ L-_ r ii _ .ii. mh jh_ 1, 282 83.00 88 76.00 - _ 18 74. 00 84 62.00 139 66. 50 222 80.00 128 70. 50
Men ____________ _ ____ ___ _____ 319 95.00 12 82.50 _ _ 7 81.00 _ - 21 88. 50 60 88. 50 22 88. 50 - -963 79.00 76 75.00 _ - 11 69.50 83 62.00 118 62.50 162 77.00 106 67.00 97 80.50
Clerks, file, class A (992 womenand 39 men) _____ ___________________ 1, 031 65.00 139 65.50 - - 27 62.50 168 66. 50 98 60.00 160 67. 50 165 58.00 - -
Clerks, file, class B (3, 645 womenand 117 men) .......................... .M 3,762 53.50 390 56.50 1, 107 55.50 102 52. 50 515 50.00 238 48.00 735 54. 00 372 49. 50 255 55.50
Clerks, policy evaluation --------------------- 1, 541 66.00 75 69.50 317 72. 00 106 64.50 235 58. 00 173 65.50 349 65.50 146 60.50 122 72.00Men ........... ..............................................— 144 75.50 11 66.00 40 72.50 - - 7 77.00 11 72. 50 47 88.00 - - - -
1, 397 65.00 64 70.00 277 72.00 81 65.50 228 57. 50 162 65.00 302 62.00 145 60. 50 120 72. 00Clerks, prem ium -ledger-card
165 74 76.00(1, 654 women and 25 men) ------------------ 1,679 60.00 139 63.50 - - 79 59. 50 337 55. 00 139 56.00 338 58.00 55.00Console operators (131 men
98.00 98. 50 35 98.00and 10 women) -------------------------------------- 141 109.50 15 103.50 41 129.00 - - 19 10 - - - -Keypunch operators (3, 072 women
162 69.50and 2 men) ---- --------- ------------------- ---- 3,074 62.50 636 66.00 724 65.00 148 59.50 470 56.50 235 58.00 455 64. 50 212 58. 50Premium acceptors (672 women
66.00 57.00 25 64. 00guy} (jf2 men) ■,........... . ................. . . _ 734 62.50 79 64. 50 104 70.50 - - 111 55.50 88 60.50 208 70Program m ers, electronic data
processing, class A (217 men124.50 16 125.00and 35 women) -------------------------------------- 252 135.50 18 140.00 - - - - 37 134.00 17 111.50 44 - -
Program m ers, electronic data104. 00 14 141.50processing, class B _________ _______ _ 363 113.00 _ - 127 122.50 - - 37 107.00 26 89. 50 55 99.00 21
Men --------- ------- - ---- ------- - 286 116.00 _ - 98 123.50 - - 27 115.00 - - 41 103.50 21 104.00 - -W o m e n ___— _ — ---- — — ------ 77 103. 50 15 110.00 29 120.00 - - - - - - 14 86.50 - - - -
Stenographers, general63.50 59.00 192 75. 50(all women) __________________ _________ 3, 115 64. 50 241 63.50 1, 099 67.00 123 60.50 382 60.00 199 63.50 680 193
Stenographers, technical66 79.00 95 69.00 31 84. 50(all women) _______________________ 471 75.00 66 69.00 117 80.00 13 76.50 43 68. 00 40 77.50
Systems analysts, class A24 160.00 11 142.00(153 men and 13 women) ---------------------- 166 157.50 34 150.50 31 195.50 6 150.50 12 168. 50 - - - -
Systems analysts, class B26 139.00 11 108.00(182 men and 17 women) ------------- -------- 199 147.00 41 127.00 86 171.50
See footnotes at end of table,Digitized for FRASER http://fraser.stlouisfed.org/ Federal Reserve Bank of St. Louis

Table 1. Average Weekly Earnings: Selected Occupations— Continued(Number and average straight-time weekly earnings 1 of employees in selected occupations in home offices and regional head offices of
life insurance companies, United States and selected regions, May—July 1961)
Occupation and sex
United States 2Regions
New England Middle Atlantic Border States Southeast Southwest Great Lakes Middle West Pacific
Numberof
em ployees
Averageweekly
earnings1
Numberof
employees
Averageweekly
earnings
Numberof
em ployees
Averageweekly
earnings
Numberof
em ployees
Averageweekly
earnings
Numberof
em ployees
Averageweekly
earnings
Numberof
em ployees
Averageweekly
earnings
Numberof
em ployees
Averageweekly
earnings
Numberof
em ployees
Averageweekly
earnings
Numberof
em ployees
Averageweekly
earnings
Tabulating-machine operators,clas s A ______ ___________________ _ 568 $94.00 72 $87. 00 187 $95.00 12 $89.00 83 $92.50 19 $86.00 120 $95.50 30 $97. 50 _ _
Men ___________________ _____ 420 95. 50 33 84.50 139 94. 50 8 86.00 55 96.00 17 88. 50 99 98.00 24 101.50 • _ _Women ____________ ____ __ __ ___ 148 89.50 - - 48 96.50 - - 28 85.00 - _ 21 84. 50 - _ _ _
Tabulating-machine operators,class B _____________________________ 1, 473 77.00 373 69.50 434 82.50 46 75.00 148 71. 50 90 76.00 208 78. 50 75 77.00 91 $85.00
Men ........ .............. ..................................... 864 79.00 179 70.50 244 82. 50 33 75.00 72 74. 50 62 78. 50 140 81. 50 58 78.00 68 86.50W omen __________________________ 609 74.50 _ - - - 13 75.50 76 69.00 28 71.00 68 72.50 17 74.00 23 82.00
Tabulating-machine operators,class C __________________________ 1,092 64.00 108 65.00 379 68. 50 54 59.50 139 61.00 73 62. 50 203 59.50 73 61.00 47 63.00
Men ____ ___ ______ _____ _______ _ 505 65.00 48 64.50 212 67.00 13 61.50 65 59.50 37 62.00 82 65.50 28 68. 00 _ _Women __________ __________ ________ 587 63.00 60 65.00 - - 41 59.00 74 62. 50 - - 121 56.00 45 56.50 - _
Typists, class A (all women) _________ 1,977 64.50 123 66.00 861 64. 50 27 61.50 147 59.50 146 61.00 319 68.00 224 60.00 130 69. 50Typists, class B (4, 412 women
and 3 men) ___________________________ 4, 415 56.50 477 58.00 1, 168 58. 50 303 57.00 432 52.00 438 50. 50 883 58.00 369 51.50 329 60.00Underwriters, class A
(30? men and 30 women) _____________ 337 156.50 58 148.50 65 184.50 9 169.00 27 155.50 27 153.50 67 151.00 22 136.50 58 145.00Underwriters, class B _____ _____ 627 129.00 109 122.00 169 151.00 17 125.50 62 119.00 50 126.50 109 118.00 51 115.00 44 122.50
Men _________________ 532 132.00 96 121.50 157 153.00 12 133.50 53 123.00 42 130.50 79 122.00 41 122.00 36 123.00Women ____ __ _______ _________ 95 110.00 13 124.00 12 126.00 - - 9 98. 50 8 104.00 30 108.00 10 86. 50 8 120.50
Underwriters, class C ________________ 596 99.00 56 90.50 128 123.00 55 92.50 98 83.00 37 92.00 103 96.00 41 95.50 _ _M e n --------- --------- __ __ __ . . — 317 110.00 9 102.00 103 128.50 25 97.00 33 104. 50 12 101.00 62 98.00 26 107.00 _ _
279 86.50 47 88.50 25 101.50 30 88. 50 65 72. 00 25 87.50 41 92.50 15 74. 50 31 95.00
1 Average weekly earnings are earnings based on hours for which employees receive their regular straight-time pay; and earnings are rounded to the nearest half dollar.2 Includes data for the Mountain region in addition to those regions shown separately. For definition of regions (or areas) shown in this and subsequent tables, see footnotes 1 and 2, appendix
A table.
NOTE: Dashes indicate no data reported or data that do not meet publication criteria.
Digitized for FRASER http://fraser.stlouisfed.org/ Federal Reserve Bank of St. Louis

Table 2. Occupational Earnings: Baltimore, Md.00
(Number and average straight-time weekly earnings 1 of employees in selected occupations in home offices and regional head offices o f life insurance companies, June 1961)
Occupation and sex
Average Number of workers receiving straight-time weekly earnings of—Number
of Weekly Weekly $40.00 $45 .00 $ 50.00 $ 55. 06 $60 .00 $65. 00 $70.00 $75 .00 $80 .00 $85. 00 $90 .00 $95.workers hours 1 earnings 1 under - - - “ ■ ■ “ ' ~ "
(Standard) (Standard) $45.00 $50 .00 $ 55.00 $60 .00 $65 .00 $70 .00 $75.00 $80 .00 $85 .00 $90 .00 $95 .00 $ 100.
6 37.5 $ 116.00 - - - - - - - - - 1
42 39.0 56.00 11 7 13 5 5 120 38.0 50. 50 1 8 7 4 - - - ■ ■ ” " -21 36. 5 63.50 - 2 2 4 8 1 - " 2 150 38.0 53.00 - 14 19 12 1 3 1 - ■ “ _21 36. 5 50.00 2 12 3 3 1 - - - ■ "47 37. 5 54. 50 - 21 9 8 2 1 6 - ■ ■ "
109 38.0 51. 50 56 28 12 13
$ 1 0 0 .0 0
$ 105.00
'$105700
$ 1 1 0 .0 0
TT1 0 .00
andover
Underwriters, class B _____
Women
Clerks, accounting, class BClerks, file , class B ----------C lerks, policy evaluation —Keypunch operators ------------Premium acceptors ------------Stenographers, general ------Typists, class B -----------------
2 2
1 Standard hours reflect the workweek for which employees receive their regular straight-time salaries and the earnings correspond to these weekly hours. Average weekly hours are rounded to the nearest half hour and average weekly earnings to the nearest half dollar.
2 All w orkers w ere at $ 140 to $ 145.
Digitized for FRASER http://fraser.stlouisfed.org/ Federal Reserve Bank of St. Louis

Table 3. Occupational Earnings: Boston, Mass.(Number and average straight-time weekly earnings1 of employees in selected occupations
in home offices and regional head offices of life insurance companies, June 1961) 1 2
Average Number of workers receiving straight-time weekly earnings of-
Occupation and sex ofworkers
Weekly hours 1
(Standard)
Weeklyearnings1
(Standard)
$45.00and
under$50.00
$50.00
$55.00
$55.00
$60.00
$60.00
$65.00
$65.00
$70.00
$70.00
$75.00
$75.00
$80.00
$80.00
$90.00
$90.00
$100.00
$100.00
$110.00
$110.00
$120.00
$120.00
$130.00
$130.00
$140.00
$140.00
$150.00
$150.00
$160.00
$160.00
$170.00
$170.00
$180.00
$180.00
$190.00
$190.00
$200.00
$200.00
$210.00
$210.00andover
Men
Actuaries, class B ___ 11 37.0 $235.00 2 1 1 1 2 2 4Console operators 6 37.0 111.00 - - _ - - - - - 1 3 - 1 1 - - - - - - - -T abul ating - machine
operators, class A — 15 37.5 82.00 _ . . . j 1 5 6 1 1 _ . _ _ _ . _ _ _ .T abul ating - machine
operators, class B _ 34 37.0 70.50 . . . 7 10 10 5 2 _ . . . _ . _ . _ . . . _T abulating - machine
operators, class C __ 38 37.5 63.00 . . 11 11 12 4 _ . . . . . . . . . _ . . .Underwriters,
class A ____________ 21 37.5 152.50 . . . 2 4 11 3 1U nderwriters,
class B ____________ 36 37.5 126.00 - - - - - - - 2 2 2 9 2 7 12 - - - - - - -
Women
A ssem blers _________ 21 37.0 52.00 6 10 4 1Clerks, correspond
ence, class B ______ 30 37.0 79.50 4 5 4 3 2 7 5Clerks, file,
class A ____________ 38 37.5 56.50 21 2 10 3 2Clerks, file,
class B ____________ 149 37.0 52.00 57 57 26 8 1Clerks, policy
evaluation -________ 8 37.0 75.50 1 2 1 4Keypunch operators __ 88 37.0 61.00 1 8 32 20 20 6 1 - - _ - - - - - - - - - _ .Stenographers,
general ________ ____ 102 37.0 61.00 11 35 21 25 7 2 1Stenographers,
technical _________ 17 37.0 75.00 1 5 1 5 3 2Underwriters,
class B ____________ 10 37.0 126.50 4 2 3 1 * - - - - -
1 Standard hours reflect the workweek for which employees receive their regular straight-time salaries and the earnings correspond to these weekly hours. Average weekly hours are rounded to the nearest half hour and average weekly earnings to the nearest half dollar.
2 W orkers were distributed as follows: 1 at $210 to $220; 1 at $280 to $290; 2 at $400 to $410.
Digitized for FRASER http://fraser.stlouisfed.org/ Federal Reserve Bank of St. Louis

Table 4. Occupational Earnings: Chicago, 111. o(Number and average straight-time weekly earnings 1 of employees in selected occupations
in home offices and regional head offices of life insurance companies, July 1961) 1 2 3 4
Occupation and sexNumber
ofw orkers
Average Number of workers receiving straight-time weekly earnings of
Weekly hour s 1
(Standard)
Weekly earnings 1 (Standard)
$45.00and
under$50.00
$50.00
$55.00
$55.00
$60.00
$60.00
$65.00
$65.00
$70.00
$70.00
$75.00
$75.00
$80.00
$80.00
$85.00
$85.00
$90.00
$90.00
$95.00
$95.00
$100JD0
$100 JOO
$105.00
$105j00
$ 1 1 0 j00
$1100)0
$1150)0
$1150)0
$1200)0
$1200)01
$1250)0
$1250)0
$1300)0
$1300)0
$135.00
$1350)0
$1400)0
$1400)0
$1450)0
$1450)0and
over
Men
Actuaries, class B ____ 14 37.5 $230.50 _ _ _ _ _ _ _ _ _ _ 2 14Actuaries, class C ___ 8 37.0 119.50 - - - - - - . - _ _ 2 _ _ 4 _ 1 _ _ _ 1Clerks, accounting,
class A ______________ 6 38.0 96.00 - - • * - _ 1 _ _ 4 _ _ 1 _ _ _ _ _ _Clerks, correspond-
ence, class A ________ 21 37.5 113.50 - - - - - - - - - 2 4 _ . 5 1 _ 9 _ _ _ _Clerks, policy
evaluation ------------------ 25 37.5 90.50 - - - - 2 3 6 2 1 1 2 2 3 _ _ 3 _ _ _ _ _Console o p e r a to r s ____ 10 37.5 100.00 - - - - - - 1 1 1 1 _ 2 2 1 _ _ 1 _ _ _Systems analysts,
class A ______________ 8 37.5 147.00 - - - - - - - - - - - - _ _ 1 _ 1 1 _ 2 3 3Tabulating -machine
operators, class A 39 37.5 101.00 - - - - - 2 - 3 1 7 14 2 - 1 5 _ _ 3 1 _Tabulating -machine
operators, class B ___ 54 37.5 82.50 - - - - 8 2 12 12 10 6 2 _ 1 - _ 1 _ _ _ > _Tabulating -machine
operators, class C ___ 37 37.0 69.50 - - 4 4 11 9 4 5 - - - - _ _ _ _ , _ _ _ _Underwriters,
class A ___________________ 10 37.0 170.50 - - - - - - - _ _ . - _ _ _ _ _ 1 1 . . 4 8Underwriters,
class B ___________________ 21 37.5 130.50 _ . _ - _ - _ _ _ _ 1 _ 1 2 4 _ 3 1 4 3 2Underwriters,
class C ___________________ 15 37.5 99.00 - - - - - - 2 1 - 1 4 3 2 - 1 1 - - - - -
WomenClerks, accounting,
class A ___________________ 54 38.0 92.50 - - - - 1 3 8 3 5 16 4 1 4 6 3 _ _ _ _ _Clerks, accounting,
class B ___________________ 37 37.5 73.00 - _ 4 7 5 5 6 6 _ 1 2 _ _ 1 _ _ _ _ _ _Clerks, correspond
ence, class A ________ 27 37.5 89.50 - - - . - 3 1 7 6 1 4 3 1 _ _ 1 _ _ _ _ _Clerks, correspond
ence, class B ----------------- 42 37.5 80.50 - - - 1 3 1 10 18 6 3 - _ _ _ _ _ _ _ _ _ _Clerks, file,
class A ------------------------------ 63 37.5 69.50 - - 12 11 13 9 8 6 1 3 - _ _ _ _ _ _ _ _ _Clerks, file,
class B --------------------- 204 37.5 59.00 8 37 76 52 23 5 3 _ _ _ _ _ _ _ _ _ _ _ _ _ _Clerks, policy
evaluation ___________ 62 37.5 71.00 - 2 2 14 20 9 5 2 3 1 3 - 1 _ _ _ _ _ _ _ _Clerks, prem ium-
ledger-card — 75 37.0 65.50 - 10 6 27 11 13 2 6 - - - _ _ _ _ _ _ _ _ _ _Keypunch operators ___ 125 38.0 73.50 - 4 2 16 23 18 35 15 4 7 - 1 _ _ _ _ _ _ _ _ _Premium acceptors ---- 26 37.5 63.50 - 8 8 1 2 3 1 - - 3 - _ _ _ _ _ _ _ _ _ _Stenographers,
general --------------------- 192 37.0 70.50 - - 8 45 48 35 29 18 5 4 - - - _ _ _ _ _ - _ _Tabulating -machine
operators, class B __ 13 38.0 77.50 - - 2 2 - - - 5 2 1 1 _ _ _ _ _ _ _ _ _ _Typists, class A ______ 110 38.0 77.00 - - - 8 18 21 21 21 10 8 2 1 _ _ _ _ _ _ _ _ _Typists, class B ______ 337 38.0 63.00 3 28 71 .109 76 29 16 5 _ _ _ _ - _ _ _ _ _ _Underwriters,
class B ---------------------- 9 38.0 112.00 - - - _ _ _ _ . 1 1 _ 1 _ 1 2 2 _ _ _ 1 _Underwriters,
class C --------------------- 17 37.5 90.50 ■ • 2 1 3 - 5 - 4 1 1 - - - - -
1 Standard hours reflect the workweek for which employees receive their regular straight-time salaries and the earnings correspond to these weekly hours. Average weekly hours are rounded to the nearest half hour and average weekly earnings to the nearest half dollar.
2 Workers were distributed as follows: 4 at $ 170 to $ 190; 2 at $ 190 to $ 210; 4 at $230 to $250; 4 at $250 and over.3 Workers w ere distributed as follow s: 2 at $ 160 to $ 165; 1 at $ 185 to $ 190.4 Workers were distributed as follows: 1 at $ 145 to $ 150; 3 at $ 150 to $ 155; 2 at $ 170 to $ 175; 2 at $ 185 and over.
Digitized for FRASER http://fraser.stlouisfed.org/ Federal Reserve Bank of St. Louis

(Number and average straight-time weekly earnings 1 of employees in selected occupations in home offices and regional head offices of life insurance companies, May 1961)
Tabic 5. Occupational Earnings: Dallas, Tex.
Occupation and sex
Average Number of workers receiving straight-time weekly earnings of—
ofworkers
Weekly hours 1
(Standard)
Weekly earnings 1 (Standard)
$40.00and
uiider$45.00
$45.00
$50.00
$50.00
$55.00
$55.00
$60.00
$60.00
$65.00
$65.00
$70.00
$70.00
$75.00
$75.00
$80.00
$80.00
$85.00
$85.00
$90.00
$ 9 0 .0 0
$95.00
$95.00
$ 1 0 0 .0 0
$ 1 0 0 .0 0
$ 105.00
$105.00
$ 1 1 0 .0 0
$ 1 1 0 .0 0
$115.00
$115.00
$ 1 2 0 .0 0
$ 1 2 0 .0 0
$ 125.00
Men
Actuaries, class C ---- ------------------------- 9 39.5 $ 108.50 _ 2 1 2 . 3 1Clerks, accounting, class A ___________ 7 39.0 84.00 - - - - - 1 - 1 2 1 1 - 1 - - - -Clerks, correspondence, class B _____ 11 39.5 83.00 - - - 1 - 1 - - 2 5 2 - - - - - -C lerks, policy ev a lu a tion _____________ _ 8 38.0 79.00 - 1 - - - - - 2 1 3 1 - - - - - -Tabulating-machine operators,
class A _________ ________________ ____ _ 9 38.5 80.00 - - - - 1 - 2 3 1 - - 2 - - - - -Tabulating-machine operators,
class B ___ ___________ __ „ _ — — ___ 2 2 39.0 6 8 .0 0 - - - 4 5 5 2 4 1 1 - - - - - - -Tabulating-machine operators,
class C . . , _____________ 15 39.0 57.00 - 4 1 6 3 - - - 1 - - - - - - - -Underwriters, class B _______ ____________ 11 38.5 106.00 - - _ - - - - - - 1 2 1 2 2 - - 3Underwriters, class C _____________ ____ 9 38.5 97.00 ' - - - - 1 ■ 4 1 1 " 1 1 ”
Women
Assem blers ________________________________ ____ 21 39.5 52.50 2 7 6 4 . 1 . 1 _ _ _ _ _ _ _ _ _Clerks, accounting, class A __________ 23 39.0 72.50 - - 3 1 3 - 10 2 1 1 - - 1 - - 1 -C lerks , accounting, class B __________ 73 39.0 54.50 8 14 24 13 4 6 - 2 1 1 - - - - - - -Clerks, correspondence, class A 7 39.5 87.00 - - - - - 2 - 1 - - - 2 2 - - - -Clerks, correspondence, class B _______ 48 38.5 64.00 - - 6 14 13 5 1 3 4 1 1 - - - - - -Clerks, file , class A __ ____ __ __ __ 30 39.0 54.50 _ 6 14 5 4 1 - - - - - - - - - - -Clerks, file , cla ss B ________-______________ 111 39.0 48.00 2 0 63 26 2 - - - - - - - - - - - - -Clerks, policy evaluation ___ ________ 46 38.5 63.50 - - 1 2 8 10 8 1 2 1 2 2 - - - - - -Clerks, p re m iu m -le d g e r -ca rd ________ 34 39.0 54.50 - 9 15 2 5 3 - - - - - - - - - - -Keypunch operators ____________________ 80 39.0 58.00 - 15 16 17 13 11 8 - - - - - - - - - -Premium acceptors ________________ ___ 23 39.5 60.00 - 2 4 6 8 - 1 1 - - 1 - - - - - -Stenographers, general ______________________ 49 39.0 63.50 - 2 10 14 7 1 2 6 5 2 - - - - - - -Typists, class A ______ __ _j. __ ____ 57 39.0 61.50 - - 7 18 2 0 6 5 - 1 - - - - - - - -Typists, class B _______________________ 168 39.0 51.50 9 54 72 28 1 - 4 - - - - - - - - - -Underwriters, class C ________ ________ 12 38.5 77.00 2 2 2 4 1 1
1 Standard hours reflect the workweek for which employees receive their regular straight-time salaries and the earnings correspond to these weekly hours, rounded to the nearest half hour and average weekly earnings to the nearest half dollar.
Average weekly hours are
Digitized for FRASER http://fraser.stlouisfed.org/ Federal Reserve Bank of St. Louis

Table 6. Occupational Earnings: Des Moines, Iowa(Number and average straight-time weekly earnings 1 of employees in selected occupations
in home offices and regional head offices of life insurance companies, June 1961)
Occupation and sex
Average Number of workers receiving straight-time weekly earnirlgs of—
of Weekly W eekly $40.00 $45.00 $50.00 $55.00 $60.00 $65.00 $70.00 $75.00 $80.00 $85.00 $90.00 $95.00 $ 1 0 0 .0 0 $105.00 $ 1 1 0 .0 0 $115.00 $ 1 2 0 .0 0 $125.00 $130.00 $135.00
w orkers hour s 1 earnings 1 - - - - ■ " ■ " " ■ ■ ■ “ ~ _ " -(Standard] (Standard) $45.00 $50.00 $55.00 $60.00 $65.00 $70.00 $75.00 $80.00 $85.00 $9 0 .0 0 $95.00 $ 1 0 0 .0 0 $105.00 $ 1 1 0 .0 0 $115.00 $ 1 2 0 .0 0 $125.00 $130.00 $135.00 $140.00
9 37.5 $ 127.50 1 1 1 1 5
8 37.5 99.50 - - - - - - - - - 1 4 - 1 - - 2 - - - -
16 37.5 77.00 _ _ _ _ _ 3 5 3 2 1 2 - - - - - - - - -10 38.0 115.50 2 2 2 1 1 2
8 37.5 78.00 2 3 1 2 . . . _ _ _ _ _ .
33 37.5 56.50 - 5 10 6 8 2 2 - - - - - - - - - - - - -
16 37.5 72.00 _ 1 2 2 1 2 1 3 - 2 1 - - 1 - - - - - -12 37.5 6 6 .0 0 - 1 - 1 3 4 2 - 1 - - - - - - - - - - -
103 37.5 48.00 11 71 17 2 2 - ~ " " • “ ■ ' ' "2 2 37.5 61.50 - 3 7 3 2 1 4 - - 1 1 - - - - - - - - -
31 37.5 52.50 _ 9 14 4 4 - - - - - - - - - - - - - - -44 37.5 58.50 . 3 14 14 5 1 3 4 - - - - - - - - - - - -51 37.5 60.50 - 4 10 14 7 10 3 2 - - 1 • " • ■ ■ “ “
28 37.5 72.50 - - 2 1 3 7 6 3 1 - 3 1 1 - - - - - - -
19 37.5 57.50 1 3 6 _ 5 3 1 - - - - - - - - - - - - -2 2 37.5 61.00 - 1 3 4 8 3 2 1 - - - - - - - - - - - -73 37.5 50.50 41 2 2 9 1
Men
Actuaries, class C ------------Tabulating-machine opera
tors, class A --------------------Tabulating-machine opera
tors, class BUnderwriters, class B
Women
Clerks, accounting, class A .
Clerks, accounting, class B .
Clerks, correspondence,class B ___________________
Clerks, file, class A ---------C lerks, file, class B ---------Clerks, policy
evaluation ------------------------C lerks, prem ium-
ledger-card —Keypunch operators ----------Stenographers, g e n e r a l-----Stenographers,
technical --------------------------Tabulating-machine opera
tors, class C -------------------Typists, class A ------------—Typists, class B ---------------
1 Standard hours reflect the workweek for which employees receive their regular straight-time salaries and the earnings correspond to these weekly hours. Average weekly hours are rounded to the nearest half hour and average weekly earnings to the nearest half dollar.
Digitized for FRASER http://fraser.stlouisfed.org/ Federal Reserve Bank of St. Louis

Table 7. Occupational Earnings: Hartford, Conn.(Number and average straight-time weekly earnings 1 of employees in selected occupations
in home offices and regional head offices of life insurance companies, June 1961)
Average Number o f workers receiving straight-time weekly earnings of—
Occupation and sexNumber
ofworkers
Weekly hours 1
(Standard
Weekly earnings 1 (Standard)
$50.00and
under$55.00
$55.00
$60.00
$60.00
$65.00
$65.00
$70.00
$70.00
$75.00
$75.00
$80.00
$80.00
$85.00
$85.00
$90.00
$90.00
$95.00
$95.00
$ 1 0 0 j0 0
$ 1 0 0 .0 0
$1 1 0 .0 0
$ 1 1 0 .0 0
$ 1 2 0 .0 0
$ 1 2 0 .0 0
$130.00
$ 130.00
$140.00
$140.00
$150.00
$150.00
$160.00
$160.00
$170.00
$170.00
$180.00
$180.00
$ 1 9 0 .0 0
$ 1 9 0 .0 0
$2 0 0 .0 0
$2 0 0 .0 0
andover
Men
Actuaries, class B ___ 35 37.0 $ 182.50 2 5 14 6 3 2 5Actuaries, class C ___ 62 37.0 132.50 3 7 15 2 2 8 5 1 . 1Clerks, correspond-
ence, class A ______ _ 2 0 36.5 113.50 _ - _ _ . 1 1 3 1 4 3 3 2 _ 1 1 _ _ _Clerks, correspond-
ence, class B ______ _ 9 37.0 84.00 - 1 1 _ - 1 2 1 _ _ 3 _ _ _ _ _ _ _ _ _Systems analysts,
class A _____________ 23 37.0 145.50 2 1 2 3 4 7 2 1 1 _ _Systems analysts,
class B _____ ________ 27 37.5 127.50 - - - _ _ - _ _ 1 2 6 2 3 6 3 2 1 1 _ _T abulating-machine
operators, class B __ 131 37.5 71.00 - 12 26 41 19 7 10 9 7 _ _ _ _ _ _ _ _ _ _ _Underwriters,
class A _____________ 2 1 36.5 158.00 _ _ _ _ _ _ _ _ _ _ _ _ 1 2 3 5 3 5 2 _Underwriters,
class B _____________ 45 37.0 120.50 - - - - 1 - 2 2 1 1 5 7 14 3 6 3 - - - -
Women
A ssem blers __ _ ____ 30 36.0 65.50 2 8 4 7 5 4Clerks, accounting,
class A ___ __ __ 41 37.0 86.50 - 1 1 2 4 5 3 10 3 6 4 2 _ _ _ _ _ _ _ _Clerks, accounting,
class B ______ _______ 52 37.0 67.00 3 7 17 5 8 7 1 4 _ _ _ _ _ _ _ _ _ _ _Clerks, correspond
ence, class A _______ 14 37.0 105.50 - - _ - _ _ _ 2 2 3 3 2 _ 1 _ 1 _ _ _ _ _Clerks, correspond
ence, class B _______ 29 37.0 75.50 - 2 3 8 3 4 3 _ 3 1 2 _ _ _ _ _ _ _ _ _Clerks, file,
class B _____________ 194 37.0 61.50 40 42 47 48 14 2 1 _ _ _ _ _ _ _ _ _ _Clerks, policy
evaluation ___________ 32 36.5 71.50 _ 6 6 4 6 2 1 3 2 2 _ _ _ _ _ _ _ _ _ _ _Keypunch o p e r a to r s__ 498 37.5 67.50 42 67 87 119 90 43 30 19 1 - _ _ _ _ _ _ _ _ _ _ _Prem ium acceptors __ 40 37.0 64.00 1 11 15 4 3 6 _ _ _ > _ _ _ _ _ _ _ _ _ _ _Stenographers,
general _____________ 135 37.0 65.50 4 40 28 24 17 8 7 7 _ . _ _ _ _ _ _ _ _ _ _ _Tabulating-machine
operators, class C __ 29 36.5 68.50 5 3 2 5 3 6 5 _ _ _ _ _ _ _ _ _ _ _ _ _ _Typists, class A _____ 6 8 37.0 71.50 1 5 15 16 8 7 8 5 3 _ _ _ _ _ _ _ _ _ _ _ _Typists, class B _____ 168 37.0 6 8 .0 0 8 2 0 30 50 27 19 12 2 _ _ _ _ _ _ _ _ _ _ _ _U nde r wr iters,
class C ______ _______ 21 37.0 86.50 2 4 6 2 2 2 3
1 Standard hours reflect the workweek for which employees receive their regular straight-time salaries and the earnings correspond to these weekly hours. Average weekly hours are rounded to the nearest half hour and average weekly earnings to the nearest half dollar.
2 W orkers w ere distributed as follows: 1 at $ 200 to $210; 2 at $210 to $220; 1 at $220 to $230; 1 at $230 to $240.
Ctf
Digitized for FRASER http://fraser.stlouisfed.org/ Federal Reserve Bank of St. Louis

Table 8. Occupational Earnings: Houston, Tex.(Number and average straight-time weekly earnings 1 of employees in selected occupations
in home offices and regional head offices of life insurance companies, June 1961)
Occupation and sexNumber
ofworkers
Average
Weekly hours 1
(Standard) (i
Weeklyearnings'Standard)
$40.00and
under$45.00
Number of workers receiving straight-time weekly earnings of—$45.00|$50.00|$55.00j$60.00|$6$.00
$50.00 $55.00 $60.00 $65.00 $70.00
[$7061
$75.00
$75.00
$80.00
$86 .oq$85 .oq :
$85.001$90.00!
$907661
$95.00 $100.PC $110.00
$95.0q$100.00 $110.00|$l20.00|$130.00
$120.00 $130.00 $140.00
$140.60($150T66j$l60.00|$170.00|$180.00 and
$150.00j$l60.00j$170.00i$180.00| over
Clerks, accounting,class A ____________
Tabulati ng - mac hi ne operators, class B .
Tabulating -machine operators, class C .
Underwriters,class A ____________
Underwriters, class B ____________
Clerks, accounting, class B .
Clerks, correspondence, class B -------
Clerks, file,class B ------------------
Clerks, policy evaluation
Clerks, premium-ledger-card — ------
Keypunch operators . Premium acceptors . Stenographers,
general --------- -— —Typists, class A ----Typists, class B ----
7
196
11
13
48
19
56
33
5134 26
386250
38.0
37. 5
38. 5
38.0
38. 5
38.0
38. 5
37. 5
37.5
37. 5 37. 5 37. 5
38.0 37. 037.0
$ 120 .00
97.00
72.00
184.00
152.50
65. 50
70. 50
52. 00
76.00
61. 50 6 8 . 50 70.50
69.6062. 50 55. 00
1 Standard hours reflect the workweek for which employees receive their regular straight-time salaries and the earnings correspond to these weekly hours. Average weekly hours are rounded to the nearest half hour and average weekly earnings to the nearest half dollar.
2 Workers were distributed as follows: 3 at $ 180 to $ 190; 1 at $200 to $210; 1 at $250 to $260.3 Workers were distributed as follows: 1 at $ 190 to $200; 2 at $210 to $220.
Digitized for FRASER http://fraser.stlouisfed.org/ Federal Reserve Bank of St. Louis

Table 9. Occupational Earnings: Jacksonville, Fla.(Number and average straight-time weekly earnings * of employees in selected occupations
in home offices and regional head offices of life insurance companies, June 1961)
Occupation2Number
ofworkers
Average Number of workers receiving straight-time weekly earnings of—
Weeklyhours1
(Standard)
Weekly earnings 1 (Standard)
$35. 00 and under
$40.00
$40. 0 0
$45.00
$45. 00
$50.00
$50. 00
$55.00
$55. 00
$60.00
$60. 0 0
$65.00
$65. 00
$70.00
$70.00
$75.00
$75. 00
$80.00
$80. 0 0
$85.00
$85. 00
$ 9 0 . 0 0
$90.00
$95.00
$95.00
$ 1 0 0 .0 0
Clerks, accounting, class A _____ __________ 11 37.0 $78.00 2 6 2Clerks, accounting, class B ________________ 15 37.0 63.00 - - 1 2 2 5 2 2 - - - 1 -Clerks, correspondence, class B __________ 18 37.0 60.50 - - 1 3 4 3 5 1 1 - - - -Clerks, file, class A _____ . . — — ____ — 12 37. 5 56.50 - - 1 4 3 3 1 - - - - - -Clerks, file, class B -------- — ----------- — — 71 37.0 47. 50 2 13 35 16 1 2 2 - - - - - -Clerks, policy evaluation ------------------------- 28 37. 5 72.00 - - - 1 3 3 4 4 5 4 4 - -Clerks, prem ium -ledger-card --------------------- 2 0 37.0 55.00 2 3 - 5 3 2 4 1 - - - - -Keypunch operators ------ ----- ----- --------- 95 37.0 59.00 4 3 4 26 12 13 14 13 6 - - - -Premium acceptors __________________________ 6 36.5 6 8 . 0 0 - - - 1 - 3 - - 1 - - - 1Stenographers, general ______ __ ____ — 67 37.0 60.00 3 3 3 14 9 9 7 1 2 5 2 - - -Tabulating-machine operators, class C ------- 34 37.0 64. 50 - - - - 11 7 11 3 2 - - - -Typists, class B _ — __ ... __ ____ __ 59 37.0 51.50 29 18 9 2 1
1 Standard hours reflect the workweek for which employees receive their regular straight-time salaries and the earnings correspond to these weekly hours. Average weekly hours are rounded to the nearest half hour and average weekly earnings to the nearest half dollar.
2 All women w orkers.
Digitized for FRASER http://fraser.stlouisfed.org/ Federal Reserve Bank of St. Louis

Table 10. Occupational Earnings: Los Angeles—Long Beach, Calif.(Number and average straight-time weekly earnings 1 of employees in selected occupations
in home offices and regional head offices of life insurance companies, June 1961)
Occupation and sexNumber
ofw orkers
Average
Weeklyhours1
(Standard)
Weekly earnings 1 (Standard)
6 38.5 $94.00
42 39.0 87.00
30 39.0 118.00
72 39.0 67.50
76 38.5 76.5092 38.5 71.00
99 38.5 76.50
29 39.0 84.5075 38.5 69.50
173 38.5 61.50
8 38.0 120.50
$50.01andunder
g55.0f
Number of workers receiving straight-time weekly earnings of—
0 $55,
hO $60,
$60.00 $65.00 $70.00 $75.00 $80.00 $85.00 $90.i
$65.00 $70.00 $75.00 $80.00 $85.00 $9 0 .0 0 $95.i
1 1 2
- - -
5 8 15 9
24 1 0 8 12 9_ 10 13 41 3 4 2
26 1 2 13 18 2 0 - ~10 17 12 28 19 5 5_ 1 _ 6 8 7 6
25 1 0 17 14 3 3 -93 29 1 1 -
$95 .0(
$100.0(
i0$100.0<
C$105.0(
I0$105.0i
I0$110.0'
10.01
15.01
0$115.0<
0 $ 120 . 0 (
C $ 1 2 0 .0
0$125.0<
C$125.0l
C$130.0'
C$130.0'
C$135.01
C $ 13 5.0<
0$140.0(
C$140.00
C$145.00
Clerks, accounting,class A ____________
Tabulating-machine operators, class B .
Underwriters, class B ____________
Clerks, accounting,'class B ___________
Clerks, correspondence, class B ____
Keypunch operators Stenographers,
general ___________Stenographers,
t e c h n ic a l_________Typists, class A ___Typists, class B ___Underwriters,
class B ___________
1 Standard hours reflect the workweek for which employees receive their regular straight-time salaries and the earnings correspond to these weekly hours. Average weekly hours are rounded to the nearest half hour and average weekly earnings to the nearest half dollar.
Digitized for FRASER http://fraser.stlouisfed.org/ Federal Reserve Bank of St. Louis

Table 11. Occupational Earnings: Minneapolis—St. Paul, Minn.(Number and average straight-time weekly earnings 1 of employees in selected occupations
in home offices and regional head offices of life insurance companies, May 1961) 1 2 3 4 5
Occupation and sexNumber
ofworkers
Avei age Number of w orkers receiving straight-time weekly earnings of—Weeklyhours1
(Standard)
Weeklyearnings1(Standard)
$45.00and
under$50.00
$50.00
$55.00
$55.00
$60.00
$60.00
$65.00
$65.00
$70.00
$70.00
$75.00
$75.00
$80.00
$80.00
$85.00
$85.00
$9 0 .0 0
$9 0 .0 0
$95.00
$95.00
$1 0 0 .0 0
$ 1 0 0 .0 0
$105.00
$105.00
$ 1 1 0 .0 0
$1 1 0 .0 0
$115.00
$115.00
$ 1 2 0 .0 0
$ 1 2 0 .0 0
$125.00
$125.00
$130.00
$130.0C
$135.0(
3 $ 13 5.0C
$140.0(
)$140.0(
$145.0(
)$145.00andover
Men
Actuaries, class A __ 6 37. 5 $264.50 2 6Actuaries, class B __ 6 38.0 185.50 _ _ _ _ _ _ _ _ _ l 3 5Actuaries, cla ss C __ 16 38.0 114.50 _ _ _ _ _ _ _ _ 1 2 j 1 1 j 4 2 2Tabulating -machine
operators, class B __ 26 38.0 81.00 _ _ _ _ 4 4 6 3 3 4 2Underwriters,
class A ____________ 8 38.0 150.00 _ _ _ _ _ _ _ _ _ 1 2 1 44Underwriters,class B ____________ 1 2 37. 5 127.50 - - - - - - - - - - 2 - - 1 2 - 3 2 2 -
Women -
Assem blers _________ 17 38.0 53.50 3 9 3 1 1Clerks, accounting,
class A ____________ 41 38.0 73.50 _ _ 3 3 10 11 4 2 8 _ _ _ _Clerks, correspond
ence, class A ______ 2 0 38. 0 84. 00 _ _ _ 1 1 2 1 3 5 7Clerks, correspond
ence, class B ______ 30 38. 0 70. 50 _ 4 1 3 5 3 9 4 1Clerks, file,
class A ____________ 14 38.0 63.00 _ 2 4 4 2 1 _ _ _ 1Clerks, file,
class B ____________ 44 38.0 48.50 36 7 1 _ _ _ _ _ _Clerks, policy
evaluation 29 37.5 67.00 3 7 2 4 2 _ 4 2 3 _ 2 _ _Clerks, prem ium -
ledger-card ________ 52 37. 5 57.00 14 11 11 6 4 4 _ 1 1 _ _ _ _Keypunch operators __ 78 38.0 57.50 15 19 15 13 9 4 3 _ _ _ _ _Stenog raphe r s ,
general ____________ 51 38.0 60.00 1 8 14 19 6 2 1 _ _ _ _ _ _Stenographers,
technical __ 19 38.0 80.50 _ _ _ 1 1 4 4 4 2 1 1 1Tabulating-machine
operators, class C — 17 38.0 56.50 4 4 4 4 _ _ _ 1 _ _ _ _ _Typists, class A ____ 46 38.0 59.00 _ 10 17 15 4 _ _ _ _ _ _ _Typists, class B ____ 45 37. 5 50.00 23 21 1 _ _ _ _ _ _ _Underwriters,
class A ____________ 6 38.0 130.00 _ _ _ _ _ _ _ _ 2 1 5 3Underwriters,
class B ____________ 9 38.0 98.50 _ _ _ _ _ 3 _ _ 1 1 1 1 2 1Underwriters,
class C ____________ 8 38.0 90.50 1 1 2 1 1 1
' '
"
1 Standard hours reflect the workweek for which employees receive their regular straight-time salaries and the earnings correspond to these weekly hours. Average weekly hours are rounded to the nearest half hour and average weekly earnings to the nearest half dollar.
2 W orkers w ere distributed as follows: 1 at $200 to $205; 1 at $230 to $235; 4 at $280 to $285.3 W orkers w ere distributed as follows: 1 at $155 to $160; 1 at $180 to $185; 1 at $195 to $200; 1 at $210 to $215; 1 at $240 to $245.4 W orkers w ere distributed as follow s: 1 at $ 150 to $ 155; 1 at $ 160 to $ 165; 2 at $ 170 to $ 175.5 W orkers w ere distributed as follows: 1 at $ 145 to $ 150; 1 at $ 155 to $ 160; 1 at $ 170 to $ 175.
Digitized for FRASER http://fraser.stlouisfed.org/ Federal Reserve Bank of St. Louis

Table 12. Occupational Earnings: New York, N.Y.(Number and average straight-time weekly earnings 1 of employees in selected occupations
in home offices and regional head offices of life insurance companies, June 1961) 1 2 3 4 5
Occupation and sex
Average Number of workers receiving straight-time weekly earnings of—
ofworkers
Weekly hours 1
(Standard]
Weekly earnings 1 (Standard)
$50.00and
under$55.00
$55.00
$60.00
$60.00
$65.00
$65.00
$70.00
$70.00
$75.00
$75.00
$80.00
$80.00
$85.00
$85.00
$90.00
$90.00
$95.00
$95.00
$100j00
$100j00
$110.00
$110.00
$120.00
$120 J00
$130.00
$130 J00
$140.00
$140.00
$150.00
$150 J00
$160.00
$160.00
$170.00
$170.00
$180.00
$180.00
$190.00
$190.00
$200.00
$200.00andover
Men
Actuaries, class A __ 44 36.0 $277.50 _ . . . . . _ 1 2 43Actuaries, class B __ 53 36.0 191.00 _ _ _ . _ _ _ _ _ _ _ _ 2 _ _ 3 2 8 8 10 3 20Actuaries, class C __ 189 36.5 129.50 - _ - - - _ _ _ _ 12 25 24 53 30 10 6 16 13Clerks, accounting,
class A __ _ 41 35.5 97.00 - _ _ 1 4 1 3 _ 5 6 18 3 _ _ _ _ _ _ _Clerks, file ,
class B ____ ______ 37 35.5 57.00 4 28 5 _ _ _ _ _ _ _ _ _ _ _ _ _ _ _ _Clerks, policy
evaluation __________ 29 35.5 74.00 - 2 2 6 9 4 3 _ _ 3 _ _ _ _ _ _ _ _ _Console operators ___ 25 36.0 139.50 - - - . . _ _ _ _ _ 1 2 7 4 3 3 _ 5 _ _Program m ers, e le c
tronic data p ro c essing, class A ___ 19 35.5 150.00 - - - . - _ _ . _ _ _ 1 3 5 7 2 1 _ _
Program m ers, e le c tronic data p ro c essing, class B ___ 38 36.0 129.00 - - - - - _ _ _ _ _ 5 _ 15 11 3 4 _ _ _ _
Systems analysts,class A _______ 14 36.5 190.00 - _ _ _ _ _ _ _ _ _ _ _ 1 1 1 1 _ 1 1 1 4 7
Tabulating -machineoperators, class A _. 63 35.5 98.00 - - - _ _ . 5 6 15 14 17 4 2 _ _ _ _ _ _ _
Tabulating -machineoperators, class B__ 159 36.0 85.00 - - 2 6 11 26 47 25 12 11 18 1 _ _ _ _ _ _ _
Tabulating -machineoperators, class C „ 173 36.0 68.50 1 18 29 63 25 25 10 2 _ _ _ _ _ _ _ _ _
Underwriters,class A ________ ____ 39 36.0 198.50 - - - - - - - - - - - - - - 1 2 - 3 8 6 5 19
Women
Clerks, accounting,class A ---------------- 132 35.5 87.50 - - 3 3 14 19 14 21 23 11 22 _ 2 _ _ _ _ _ _ _ _
Clerks, correspondence, class A ______ 55 36.5 121.00 - - _ - _ _ 1 2 2 1 5 6 24 14 _ _ _ _ _ _
Keypunch operators „ 540 36.5 65.00 5 87 201 144 45 31 14 9 _ _ 4 _ _ _ _ _ _ _ _ _Premium a ccep tors__ 49 36.0 74.00 - 2 3 13 10 7 12 _ 2 _ _ _ _ _ _ _ _ _ _ _Program m ers, e le c
tronic data p ro c essing, class B ___ 21 36.0 124.00 - - - - - - _ _ - _ 4 1 10 5 _ 1 _ _ _ _ _
Stenographers,general -___________ 854 36.5 68.00 5 96 220 262 124 74 42 19 6 4 2 _ _ _ _ _ _ _ _ _ _
Stenographers,technical ___________ 89 36.0 84.00 - _ 1 12 13 9 11 20 4 4 15 _ _ _ _ _ _ _ _ _ _
Typists, class A ____ 747 36.5 65.00 2 149 247 221 59 34 26 8 1 _ _ _ _ _ _ _ _ _ _ _ _Typists, class B ____ 856 36.0 60.00 108 400 191 76 48 22 5 3 3 - - - ~ - - -
1 Standard hours reflect the workweek for which employees receive their regular straight-time salaries and the earnings correspond to these weekly hours. Average weekly hours are rounded to the nearest half hour and average weekly earnings to the nearest half dollar.
2 Workers were distributed as follows: 4 at $200 to $210} 4 at $210 to $250; 19 at $250 to $290; 9 at $290 to $330; 6 at $330 to $370; 1 at $370 to $410.3 W orkers were distributed as follow s: 11 at $200 to $210; 5 at $210 to $220; 2 at $220 to $230; 2 at $240 to $250.4 Workers were distributed as follows: 2 at $200 to $210; 4 at $210 to $230; 1 at $230 to $250.5 Workers were distributed as follow s: 8 at $200 to $210; 6 at $210 to $230; 5 at $230 to $250.
Digitized for FRASER http://fraser.stlouisfed.org/ Federal Reserve Bank of St. Louis

Table 13. Occupational Earnings: Philadelphia, Pa.(Number and average straight-time weekly earnings 1 of employees in selected occupations
in home offices and regional head offices of life insurance companies, June 1961)
Occupation and sexNumber
ofworkers
Average
Weekly hour8 1
(Standard)
Weeklyearnings1(Standard)
13 36.5 $115.00
21 34. 5 40. 50
7 35.0 68.00
11 36.0 98. 50
7 36.0 164.00
21 36.0 124.00
13 37.0 91.00
7 36.0 48.00
51 36.0 53. 00
9 36.0 69.00
13 34.0 49.0057 36. 5 56. 0018 34. 5 59. 50
104 35.0 58. 50
16 36. 5 72. 0038 35.0 56.00
127 36.0 50. 50
$35.00and
under$40.00
$40.00|$45.00
$45.00 $50.00
$50.00
$55.00
Number of workers receiving straight-time weekly earnings of— $55.00|$60.00|$65.00|$70.00
$60.0C $65.00 $70.00 $75.00
$75.00
$80.00
$80.00
$85.00
$85.00
$90.00
$90.00
$95.00
■$95~.00|
$ 100.00
$ioo.oopio5.oopiio.odpii5.0o|$iZO'a$'i30.0(l|$i40.6fl|$
$105.0( $110.00$115.00 $120.00$130.00$140.0C($150.00
TSTTWand
Actuaries, class C ... C lerks, file,
class B — ---------------C lerks, policy
evaluation -— -_____Tabulating - machine
operators, class A-. Underwriters,
class A ------------------U nderwriters,
class B . Underwriters,
class C _____
A s s e m b le r s _______ _Clerks, accounting,
class B ___________—Clerks, file ,
class A -------------------Clerks, prem ium-
ledger-card _____ ___Keypunch o p e ra to rs__Premium a cce p to rs__Stenographers,
g e n e r a l___—_____ ___Tabulating - mac hi ne
operators, class B __Typists, class A ____Typists, class B ___ _
2
29
1
4163
554
1 Standard hours reflect the workweek for which employees receive their regular straight-time salaries and the earnings correspond to these weekly hours. Average weekly hours are rounded to the nearest half hour and average weekly earnings to the nearest half dollar.
2 W orkers were distributed as follows: 2 at $ 150 to $ 160; 2 at $ 160 to $ 170; 2 at $ 180 to $ 190.3 W orkers were distributed as follows: 3 at $ 160 to $ 170; 1 at $ 170 to $ 180.
Digitized for FRASER http://fraser.stlouisfed.org/ Federal Reserve Bank of St. Louis

Table 14. Minimum Entrance Salaries for Women Office Employees o
(Number of home offices and regional head offices of life insurance companies studied by minimum entrance sa lary1 for women in selected occupations, United States, selected regions, and areas, May—July 1961)
Minimum rate 1 (weekly straight-time salary) United States 2
Regions
New England Middle Atlantic Border States Southeast Southwest Great Lakes Middle West Pacific
Establishments studied _____________________________ 187 14 29 19 28 27 39 19 10
Inexperienced typists
Establishments having a specifiedminim um 3 ________ ____ __ „ _______ _______ 168 14 25 17 25 24 35 19 8
$ 35.00 and under $ 40.00 _____________ __ _ ___ 6 - 1 _ 4 1 - . _$ 40.00 and under $ 45.00 ____________ ____ __ 40 1 3 6 11 11 . 8 .$ 45.00 and under $ 50.00 -_______________________ 75 7 6 8 9 10 22 11 1$ 50.00 and under $ 55.00 ________________________ 27 5 10 1 1 1 6 - 3$ 55.00 and under $ 60.00 -_______________________ 18 1 5 2 - 1 5 _ 4$ 60.00 and under $65.00 ______ _____ ____________ 1 - - - - - 1 -$65.00 and under $ 70.00 -___________ ___________ _ - - _ - _ _ _$ 70.00 and under $ 75.00 ________ _______________ 1 - - - - - 1 -
Establishments having no specifiedminimum ___________ -__-__-_____________ _______ 7 1 - 2 1 2 1
Establishments which did not hireemployees in this category _______________________ 12 3 2 1 2 2 1
Other inexperienced clerica l em ployees4
Establishments having a specifiedminimum 3 ____________________ _________ _______ 176 14 27 17 26 26 36 19 9
$ 35.00 and under $ 40.00 -------- ------------------------ 8 - 2 1 4 1 _ . _$ 40.00 and under $ 45.00 ____________ __________ 55 2 4 5 13 17 4 9 _$ 45.00 and under $ 50.00 ________________________ 73 8 10 8 8 6 21 10 1$ 50.00 and under $ 55.00 ______________ ________ 24 4 7 2 1 1 6 _ 3$ 55.00 and under $ 60.00 ________________________ 14 - 4 1 _ 1 4 _ 4$ 60.00 and under $ 65.00 ________________________ 1 _ . _ _ _ _ . 1$ 65.00 and under $ 70.00 ________________________ 1 - - - - - 1 . _$ 70.00 and under $ 75.00 ____ ____ . . ______ - - - _ _ _ _
Establishments having no specifiedmini m um ._____ __________________ _____________ _ 8 1 - 2 1 3
Establishments which did not hireemployees in this category ------------------------------- — 3 1 2
See footnotes at end of table.
Digitized for FRASER http://fraser.stlouisfed.org/ Federal Reserve Bank of St. Louis

Table 14. Minimum Entrance Salaries for Women Office Employees— Continued(Number of home offices and regional head offices of life insurance companies studied by minimum entrance sa lary1 for women
in selected occupations, United States, selected regions, and areas, May—July 1961)
Minimum rate 1 (weekly straight-time salary)
Areas
Baltimore Boston Chicago Dallas Des Moines Hartford Houston Jacksonville Los A ngeles- Long Beach
Minneapolis— St. Paul
New York City Philadelphia
Establishments studied ---- ----------- — 7 5 10 10 7 5 7 6 5 8 10 9
Inexperienced typists
Establishments having a specifiedm inim um 1 2 3 ____________________________ 6 5 10 9 7 5 6 5 4 7 9 6
$ 35.00 and under $ 40.00 ___________ - - - - - - - 1 - - - -$ 40.00 and under $ 45.00 ___________ 2 - - 4 5 - 1 - - - - 2$ 45.00 and under $ 50.00 ___________ 4 4 2 5 2 - 3 4 - 7 1 2$ 50.00 and under $ 55.00 _____ ____ _ 1 2 - - 4 1 - 2 - 3 2$ 55.00 and under $ 60.00 ___________ - - 5 - - 1 1 - 2 - 5 -$ 60.00 and under $ 65.00 ___________ - - 1 - - - - - - - - -$ 65.00 and under $ 70.00 ___________ - - - - - - - - - - - -$ 70.00 and under $75.00 ___________ - - - - - - - - - - - -
Establishments having no specifiedminimum __ . __ ______ ___ _____ - - - 1 - - - 1 - 1 1 -
Establishments which did not hireem ployees in this category ____ __ _ 1 1 1 3
Other inexperienced c lerica l employees 4
Establishments having a specifiedminim um 3 __ _ ________ ___ ___ 5 5 10 9 7 5 7 5 5 7 9 8
$ 35.00 and under $ 40.00 ____ _____ _ - _ _ - - _ 1 - - - 1$ 40.00 and under $ 45.00 ___________ 1 - . 7 6 - 3 1 - 2 - 3$ 45.00 and under $ 50.00 ____ _____ 4 5 3 2 1 1 2 3 _ 5 2 4$ 50.00 and under $ 55.00 ___________ _ - 3 _ _ 4 1 - 2 _ 3 _$ 55.00 and under $ 60.00 ____________ - - 4 - - - 1 - 2 - 4 _$ 60.00 and under $ 65.00 ___________ - - - - - - - - 1 - - _$ 65.00 and under $ 70.00 ___________ _ - - _ _ _ _ - - _ _$ 70.00 and under $ 75.00 ____________ - - - - - - - - - - _
Establishments having no specifiedminimum ____ __ ____ _ ____ ___ - 1 - - 1 1 1
Establishments which did not hireem ployees in this category ___________ 2
1 Lowest form ally established salary rate.2 Includes data for the Mountain region in addition to the regions shown separately.3 Regular straight-time salary corresponding to employee’ s standard workweek.4 Rates applicable to m essengers, office girls, or similar subclerical jobs are not considered.
Digitized for FRASER http://fraser.stlouisfed.org/ Federal Reserve Bank of St. Louis

Table 15. Scheduled Weekly Hourstsdto
(Percent of nonsupervisory office employees in home offices and regional head offices of life insurance companiesby scheduled weekly hours 1 United States, selected regions, and areas, May—July 1961)
Weekly hours 1Regions
States 2 NewEngland
MiddleAtlantic
BorderStates Southeast Southwest Great
LakesMiddleWest Pacific
100 100 100 100 100 100 100 100 100
111
- 317 20 16
-12 2 (3)
1 5 - - 3 - - -13 15 20 14 9 5 8 3 -5 10 6 6 8 - (3) - -
14 - 38 8 - - - -1 - - 6 2 2 1 - -
39 70 15 13 48 45 59 40 415 - 1 24 6 23 4 21 -
11 - (3) 9 9 26 15 34 59
37.0 37.0 36. 5 37.0 37. 0 38. 5 37. 5 38. 5 3 9 . 0
A ll nonsupervisory office employees
Under 35 hours 35 hours351/*, 36 hours ____________3 6 V4 hours ____ —___—_____3 6 V2 . 36* 1 2/s hours __________37 hours ____________________37V4, 37V$ hours __________37 V2 hours38 and under 40 hours 40 hours —_____ _______
Average weekly hours __
A ll nonsupervisory office employees ___
Under 35 hours -----------35 h o u r s ______—----------3 5 V4 » 36 hours -----------36V4 h o u r s ___________36V2 , 36z/i h o u r s --------37 hours _______—---------37V4 , 37V3 hours _____37l/2 hours ___________38 and under 40 hours .40 hours ______________ _
Baltimore Boston Chicago Dallas Des Moines Hartford Houston Jacksonville Los A n geles- Long Beach
Minneapolis— St. Paul
New York City
Philadelphia
100 100 100 100 100 100 100 100 100 100 100 100
3 1015 - - - -
1220
- 3 <*) - 20 14. 5 13 _ _ 20 12 _ _ 27 _- 19 - - - 5 - - - 2 - 46
28 - - - - - - - - - 50 2121 - 6 7 - - - 7 - - - -
3 76 70 6 98 63 60 78 59 78 - 3- - - 65 - - 3 - - 20 - 6
32 12 22 2 17 40
1 Data relate to the predominant work schedule in each establishment.2 Includes data for the Mountain region in addition to the regions shown separately.3 Less than 0. 5 percent.
NOTE: Because of rounding, sums of individual items may not equal 100.
Digitized for FRASER http://fraser.stlouisfed.org/ Federal Reserve Bank of St. Louis
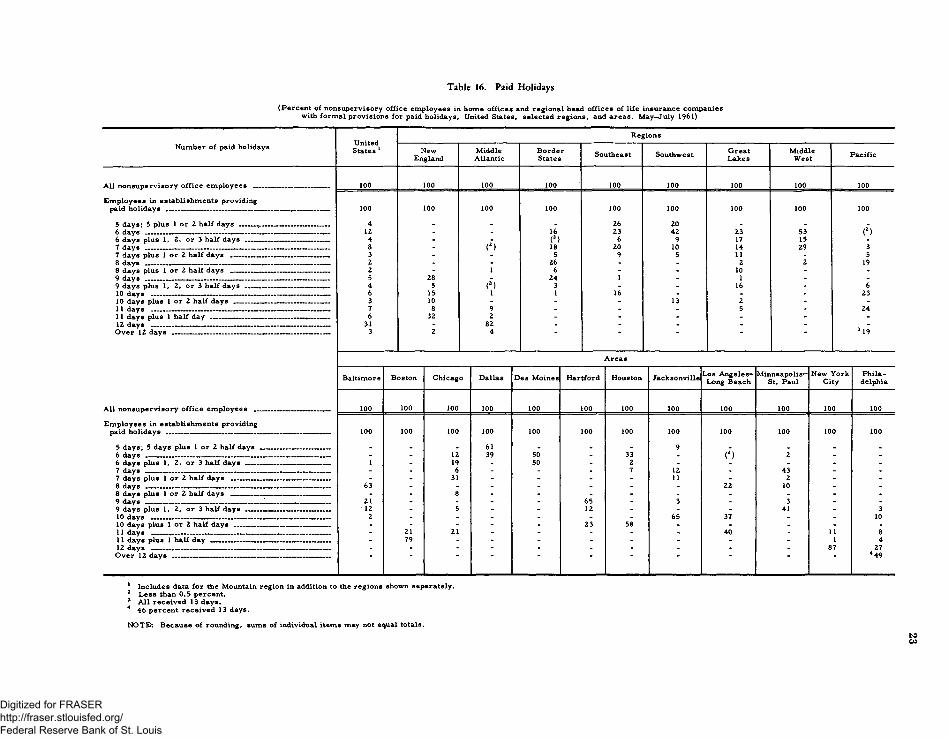
Table 16. Paid Holidays(Percent of nonsupervisory office employees in home offices and regional head offices of life insurance companies
with formal provisions for paid holidays, United States, selected regions, and areas, May—July 1961)
Number of paid holidays United States 1
Regions
NewEngland
MiddleAtlantic
BorderStates Southeast Southwest Great
LakesMiddle
West Pacific
A ll nonsupervisory o ffice employees ---------- --------------------- 1 0 0 1 0 0 1 0 0 1 00 1 0 0 1 0 0 1 0 0 1 0 0 1 00
Employees in establishments providing paid holidays ----------------------------------------------- - r. ___ ____
5 days; 5 plus 1 or 2 half days _____,___________________
6 days plus 1, 2, or 3 half days ____. . . ____ _________
1 0 0
4124 83 2 2546 3 7 6
313
1 0 0
285
1510
832
2
1 0 0
(1 2 3 4‘ )
1
(*>1
92
824
1 0 0
16(2)185
266
2431
1 0 0
2623
62 09
1
16
1 0 0
2 042
9105
13
1 0 0
23171411
210
116
25
1 00
531529
2
1 00
(2)
35
19
623
24
3 19
7 days plus 1 or 2 half days . . . --------------------------------------
8 days plus 1 or 2 half days ____________________ _______
9 days plus 1, 2, or 3 half days -----------------------------------
10 Hays plus 1 or 2 half d a y s _ ___ ________ ___ __11 days ------------------- ---- -------- ---------------- ---------------11 days plus 1 half day _________________________—______
Over 12 days ----------------------------------- --------- ---- -------
A ll nonsupervisory office employees _____________________
Areas
Baltimore Boston Chicago Dallas Des Moines Hartford Houston Jacksonville Los A ngeles- Long Beach
Minneapolis— St. Paul
New York City
Philadelphia
1 0 0 1 0 0 1 0 0 1 00 1 0 0 1 0 0 1 0 0 1 0 0 1 0 0 1 0 0 1 00 100
Employees in establishments providingpaid holidays ______ „ ------------ . -------- ---------- ---- 1 0 0 1 0 0 100 100 1 0 0 1 0 0 1 00 1 0 0 1 0 0 1 0 0 1 00 1 0 0
5 days; 5 days plus 1 or 2 half days -------- ---- ----------- _ _ . 61 _ . . 9 _ _ _ _
6 d a y s _______________ ____________________ ____ _______ _ - - 12 39 50 - 33 - (2) 2 - -6 days plus 1, 2, or 3 half days ________________________________ 1 - 19 - 50 - 2 - - - -
7 days __ _________ ____ __ -------------------------------- -------- -------- ----------------- - - 6 - - - 7 12 - 43 - -7 days plus 1 or 2 half days ____________________ _________________ - - 31 - - - - 11 - 2 - -ft H a y s , __ . . T. . T. _ . 63 - - - - - - - 2 2 10 - -
8 days plus 1 or 2 half days ________________ __________ - - 8 - - - - - - - - -
9 days _______________________________________ ------------------------------------------------------------ 2 1 - - - - 65 - 3 - 3 - -9 days plus 1 , 2, or 3 half days ____ ____ ___ ______ 12 - 5 - - 12 - - - 41 - 310 days ---------- ----------------- --------------------------------------------------------------------- — — 2 - - - - - 65 37 - - 1010 days plus 1 or 2 half days _____ ____ ____________ _ - - - - 23 58 - - - - -
11 days - 1 ... I. - - r . ...... .................. . , - ........ - 21 21 - - - - - 40 - 11 811 days plus 1 half day ------------------------------_ ----------------- —_________________ - 79 - - - - - - - 1 412 days ---------------------------------------------------------------------- ------------ -------------------------------- _ - - - - - - - - - 87 27Over 12 d a y s ___ ______ ,_________________ ____ ____ — ______ 4 49
1 Includes data for the Mountain region in addition to the regions shown separately.2 Less than 0.5 percent.3 A ll received 13 days.4 46 percent received 13 days.
NOTE: Because of rounding, sums of individual items may not equal totals.
Digitized for FRASER http://fraser.stlouisfed.org/ Federal Reserve Bank of St. Louis

Table 17. Paid Vacationsto
(Percent of nonsupervisory office employees in home offices and regional head offices of life insurance companies with formal provisions for paid vacationsafter selected periods of service, United States, selected regions, and areas, May—July 1961)
Vacation policy United States 1Regions
New England Middle Atlantic Border States Southeast Southwest Great Lakes Middle West Pacific
All nonsupervisory office employees _____________ _ 100 100 100 100 100 100 100 100 100
Method of payment
Employees in establishments providing paidvacations __________ ___ _____ __ __ __ __ 100 100 100 100 100 100 100 100 100
Length-of-tim e payment _______ — __ ______ 100 100 100 100 100 100 100 100 100
Amount o f vacation pay 2
After 6 months of service:Under 1 week _____________________________________ 16 20 19 9 21 13 12 7 61 week __ __ __ ___ ___ ____ _________ 51 48 44 56 55 51 57 64 60Over 1 and under 2 weeks ------------------------------------ 21 11 34 28 5 19 21 12 -2 weeks __________ ________ ____ — — ____ 5 21 3 - 6 - 3 - -
After 1 year of service:1 week and under 2 weeks __- _ _ - ---- 3 - 1 16 14 - 6 7 -2 weeks ___ ______________ ____ __ __ ___ ___ 96 100 99 84 86 98 94 93 100Over 2 weeks ___ ___________ . . . __ . . — (3) - (3) - - 2 - - -
After 3 years of service:Under 2 w e e k s _______ ____ ___ _________ ___ (3) - (3) (3) 3 - - - -2 weeks _____ — ______________ — ------------ 99 100 99 100 97 98 100 96 100Over 2 weeks ____________ ____ — ------ — ___ 1 - 1 - “ 2 " 4 -
After 5 years of service:2 weeks ______ _________ ___ _______ _ __ 53 64 17 72 81 80 87 90 40Over 2 and under 3 weeks ------- ---- ---- — 46 36 83 25 19 18 13 6 603 weeks or m ore _________________________________ 1 - (3) 3 - 2 - 4 (3)
After 10 years of service:2 weeks ___ ___ __ _ --- ------ 31 27 10 35 66 73 29 54 40Over 2 and under 3 weeks _______ __ ____ ___ 36 41 63 15 4 10 10 12 323 weeks _____________________ _____________________ 33 32 27 50 30 17 61 29 28Over 3 weeks _____ ___ __ ____ (3) - (3) - - - - 4 -
After 15 years of service:2 w e e k s __________________ _______ _______ _____ 8 - 1 12 25 32 7 41 -Over 2 and under 3 weeks ________________________ 4 21 (3) - 2 10 - - -3 weeks --------- ------- — — ------- — - ---- 71 74 77 70 58 45 78 52 77Over 3 and under 4 weeks ________________________ 15 5 22 18 16 13 13 - 234 weeks or m ore ----------- ——_ — — — ______ - 1 - - - - - 2 7 -
After 20 years o f service:2 weeks -------- --------- — — — __ — — — - 5 - 1 4 17 21 6 7 -Over 2 and under 3 weeks ------------- __ -_ ------ 2 8 (3) - 1 5 - - -3 weeks ____ ____ — — - ------- ---- ---- 41 51 10 59 48 58 61 87 58Over 3 and under 4 weeks __________________ _____ 2 10 - - - - 3 - -4 weeks -------- — ------ - ----- - — — — 51 31 89 37 34 16 30 2 42Over 4 weeks __ ---- -_ — -_ — -_ ------ - (3) - - - - - ' 4 -
After 25 years of service:2 weeks ------------- — ----------------- ----- — — 5 - 1 4 17 21 6 4 -Over 2 and under 3 weeks — -— ---------------- (3) - (3) - - 5 - - -3 weeks ---- — ------------ — --------- ---- --- 30 46 3 48 39 52 38 77 47Over 3 and under 4 weeks ____ __ _____ _ 1 - - - - 5 3 - -4 weeks _____________________________ -__-_________ 59 54 95 48 28 4 41 15 53Over 4 w e e k s --------------------------------------------------------- 5 " 2 " 16 13 12 4 •
See footnotes at end of table,
Digitized for FRASER http://fraser.stlouisfed.org/ Federal Reserve Bank of St. Louis

Table 17. Paid Vacations— Continued(Percent of non.upervi.ory office employee, in home office, and regional head office, of life insurance companies noth formal provisions for paid vacations
after selected periods of service, United States, selected regions, and areas, May—July 1961)
Vacation policyBaltimore Boston Chicago Dallas Des Moines Hartford Houston Jacksonville Los A n geles-
Long BeachMinneapolis—
St. PaulNew York
City Philadelphia
All nonsupervisory office employees . 1 0 0 1 0 0 1 0 0 1 0 0 1 0 0 1 0 0 1 0 0 1 0 0 1 0 0 1 0 0 1 0 0 1 0 0Method of payment
Employees in establishments providingpaid vacations — __ — 1 0 0
1 0 01 0 01 0 0
1 AA 1 0 01 0 0
1 0 01 0 0
1 0 0 1 0 01 0 0
1 0 0 1 0 0 1 0 0 1 0 01 0 0 1 0 0 1 0 0 1 0 0 1 0 0 1 0 0Amount o f vacation pay2
After 6 months of service:335015
_40122 028
58 651 w e e k ___ " 989
2
- 41 - 50Over 1 and under 2 weeks _______ _______2 weeks _ _ __ 2 2
546 42
1923
21 44 489
5743
126
After 1 year o f service: ' ■ - - - 301 week and under weeks 56
44128 8
152 weeks _ _ _ _ 1 0 0 no 991 1 0 0
- - 2 - 5Over 2 weeks _ 1 0 0 1 0 0 85 1 0 0 98 99 95
After 3 years o f service: ~ ” - - (3) -Under 2 weeks __ 12 weeks 99 1 0 0 1 nn 1 0 0 1 0 0
- 3 - - - .Over 2 weeks 100 1 0 0 1 0 0 97 1 0 0 1 0 0 98 1 0 0
After 5 years o f service: ’ ■ 2 -2 w e e k s _ __ _ 8 8
1 2O'* , AA 98 40
6 042 35Over 2 and under 3 weeks ...... 7 26
100 40 59 9 943 weeks or m ore 2 58 65 59 41 91 2
After 10 years o f service: ' (3) - - 42 weeks __ ____ _ 56 y A A 63
2314
4060
36Over 2 and under 3 weeks 1979
4084 1 A 7 40 28 1 94
3 weeks ..r,, 44 643 2 2 - 87 2
Over 3 weeks __ 50 ■ 91 38 72 12 4After 15 years o f service: ~ ” - - -
1 weeks ____ 32 8Over 2 and under 3 weeks __ 4 35 16
633263
7 - - _ 1 03 weeks — — _ _ 6 8 La 4 9 37
- 3 - - (3) .Over 3 and under 4 weeks _ __ yo
7DO21
3458
26 63 59 93 904 weeks or m ore __ 5 65 37 41 7
After 20 years o f service: " _ ■ - -2 weeks __ 3Over 2 and under 3 weeks . 4 28 9 ~ 8 7 - - - 103 weeks 65 •a CL 91 95
- - - - (3)1
_Over 3 and under 4 weeks 19
78
00 67 34 15 63 56 904 weeks _ _ 32 ~ - 5 ■ - - - - _Over 4 weeks 40 “ ■ 58 78 37 44 99 _
After 25 years o f service: " " " - - -2 weeks 3Over 2 and under 3 w e e k s ____________ _ ” 8 7 - - - 103 weeks ̂ _ _ 50 51
16100 83
- ~ - - (3) _Over 3 and under 4 weeks _____ ... _ 27 15 44 11 1 114 weeks __ __ 47 100 71 17 “ ~ - - - _Over 4 weeks __ __ ... ■ 7 14 56 48 97 7921 58 65 41 2
Includes data for the Mountain region in addition to the regions shown separately.
to " aeC* ' he Pr° ViSi° nS £° r Pr0greSei°™ ' For — «*•■ *»*■«•■ proportions indicated a, 5 year, ofservice may include changes in provi Less than 0. 5 percent.
occurring after 4 years.
NOTE: Because of rounding, sums of individual items may not equal totals.
Digitized for FRASER http://fraser.stlouisfed.org/ Federal Reserve Bank of St. Louis

Table 18. Health, Insurance, and Pension Plans(Percent of nonsupervisory office employees in home offices and regional head offices of life insurance companies with specified
health, insurance, and pension plans, United States, selected regions, and areas, May—July 1961)
Type of plan1 United States2Regions
New England Middle Atlantic Border States Southeast Southwest Great Lakes Middle West Pacific
All nonsupervisory o ffice em ployees . — ---- 100 100 100 100 100 100 100 100 100
Employees in establishments providing:Life insurance _ -------------- __ ----------- 98 100 100 97 96 100 92 96 100Accidental death and dismemberment
in su ra n ce___ ____ ________ . . . 48 55 43 34 65 56 53 37 40Sickness and accident insurance
or sick leave or both3____________________ 90 82 99 78 87 82 82 85 95Sickness and accident insurance _______ 55 35 91 29 18 29 41 2 87Sick leave (full pay, no
waiting period) ____ —-_________ .— 84 79 97 71 81 64 68 75 95Sick leave (partial pay or
waiting period) ___ __ -------- . ---- 2 - - 3 1 - 5 10 -Hospitalization insurance __ --------- ------- 96 100 99 71 88 99 95 88 100Surgical in su ra n ce_________ ______________ 95 100 99 71 88 99 89 88 100Medical insurance _ _ __ _____ ____ __ 70 100 59 68 50 76 63 88 81Catastrophe insurance ____ __ __ „ 89 98 94 83 78 83 84 81 81Retirement pension ____ ____ __ ------ 96 100 99 83 91 82 94 94 100No health, insurance, or
pension p la n s --- ------- — — . — -
All nonsupervisory office em p lo y e e s__
Employees in establishments providing:Life insurance ------------------------------------Accidental death and dismemberment
in su ra n ce --------------------- —-------- — ---- -Sickness and accident insurance
or sick leave or both3 ____________Sickness and accident in su ra n ce __Sick leave (full pay, no
waiting p e r io d ) ----------------------------Sick leave (partial pay or
waiting p e r io d ) ----------------------- —Hospitalization in su ra n ce -------------------Surgical in su ra n ce___________________Medical insurance ------------------------------Catastrophe insurance _ __________ «...Retirement p e n s io n -------- --------------------No health, insurance, or
pension p la n s __—___________________
Baltimore Boston Chicago Dallas Des Moines Hartford Houston Jacksonville Los A ngeles- Long Beach
Minneapolis— St. Paul
New York City Philadelphia
100 100 100 100 100 100 100 100 100 100 100 100
100 100 87 100 100 100 100 100 100 98 100 100
35 78 61 46 50 20 90 86 41 41 37 2
39 97 91 68 50 60 80 100 99 98 100 952 76 35 6 - - 3 - 96 42 100 -
39 89 86 68 50 60 77 97 99 52 97 95_ _ 6 _ _ _ _ 3 _ 3 _ _
70 100 96 99 90 100 100 100 100 80 99 9070 100 87 99 90 100 100 100 100 80 99 9070 100 82 59 90 100 97 88 100 80 47 7397 100 74 78 100 100 100 97 100 98 99 8368 100 96 95 100 100 92 91 100 95 100 98
" ■ • ■ ~ “ ~ " ~ ■ “
Includes only those plans for which at least part o f the cost is borne by the employer and excludes legally required plans, such as workmen's compensation and social security. Includes data for the Mountain region in addition to the regions shown separately.Unduplicated total o f em ployees receiving sick leave or sickness and accident insurance shown separately.
Digitized for FRASER http://fraser.stlouisfed.org/ Federal Reserve Bank of St. Louis

Table 19. Nonproduction Bonuses(Percent o£ nonsupervisory office employees in home offices and regional head offices of life insurance companies
with specified types of nonproduction bonuses,! United States, selected regions, and areas, May—July 1961)
RegionsType of bonus United States1
New England Middle Atlantic Border States Southeast Southwest Great Lakes Middle West Pacific
All nonsupervisory office employees -------------------------------- 100 100 100 100 100 100 100 100 100
Employees in establishments with nonproductionbonuses _____ ___ ____ _ ___________ ____ ___ 33 30 18 35 36 67 54 49 23
Christmas or yearend _________________________ _________ 24 18 3 31 36 66 44 49 23Profit sharing ______________________________ __________ 3 9 - 3 - - 8 - -Other ------------------------------------------------------------------------------ 6 4 15 - - 2 2 - -
Employees in establishments with nononproduction bonuses _ __ __ __ ______________ __ __ _ 67 70 82 65 64 33 46 51 77
Baltimore Boston Chicago Dallas Des Moines Hartford Houston Jacksonville Los Angeles- Long Beach
Minneapolis— St. Paul
New York City
Philadelphia
All nonsupervisory office employees _ ___ __ __ _______ 100 100 100 100 100 100 100 100 100 100 100 100
Employees in establishments with nonproductionbonuses _____ _ ____ __ ______ __ __ __ __ __ _ 37 2 65 77 48 60 42 3 22 54 - 28
Christmas or yearend _________________________________ 37 2 30 .77 48 40 36 3 22 45 _ 28Profit sharing ________ __ __ ______ __ __ ____ _ - - 27 - - 20 - - - 9 - -Other ___ __ __ __ __ ____ _______ __ __ __ __ __ _ - - 8 - " - 7 - - - - “
Employees in establishments with nononproduction bonuses __________________________________ 63 98 35 23 52 40 58 97 78 46 100 72
1 Includes data for the Mountain region in addition to the regions shown separately.
NOTE: Because of rounding, sums of individual items may not equal totals.
IS9-a
Digitized for FRASER http://fraser.stlouisfed.org/ Federal Reserve Bank of St. Louis

Digitized for FRASER http://fraser.stlouisfed.org/ Federal Reserve Bank of St. Louis

Appendix A: Scope and Method of Survey
Scope of Survey
The study covered home offices and regional head offices of life insurance companies, (part of industry group 631 as defined in the 1957 edition of the Standard Industrial Classification Manual, prepared by the Bureau of the Budget).
The establishments studied were selected from those employing 50 or more employees at the time of reference of the data used in compiling the universe lists.
The number of establishments and employees actually studied by the Bureau as well as the number estimated to be within the scope of the survey during the payroll period studied are shown in the following table:
Estimated number of establishments and employees within scope of survey and number studied, life insurance industry, May-July 1961
Region1 and a rea2
Number of establishments3 Employees in establishments
Within scope of study StudiedWithin scope of study StudiedT otal4
Nonsupervisoryoffice
employees Total
United States 5 -------------------------------------------- 331 j 187 144,851 107,788 , 129,438
New England ----------------------------------------------- 16 14 21,875 17,772 21,385Boston --------------------------------------------------- - 5 5 8,274 7,179 8,274Hartford — — — — — - — ------ — -------- 5 5 9,342 7,574 9,342Middle A tlan tic-------------------------------------------- 41 29 52,810 39,930 51,386New York C i ty ------------------------------------------- 12 10 37,669 28,756 37,106P hiladelphia---------------------------------------------- 14 9 4,875 3,555 4,401
Border S ta te s ----------------------------------------------- 30 19 5,172 3,434 4,349B altim ore-------------------------------------------------- 13 7 1,515 954 1,135S o u th e a s t----- . . . . . . --------------- ------------- -------- 55 28 13,694 10,435 10,389Jack son v ille ---------------------------------------------- 7 6 2,989 2, 520 2,889Southw est--------------------------------------------------- 52 27 8,876 6,770 6,541D a lla s ------------------------------------------------------ 17 10 3,031 2,160 2, 555Houston --------------------------------------------------- 8 7 1,814 1,536 1,758Great L a k e s ------------------------------------------------ 72 39 24,270 15,917 20,964
Chicago --------------------------------------------------- 16 10 6,707 4,019 5,923Minneapolis—St. Paul --------------------------------- 8 8 3,784 2,578 3,784Middle West ------------------------------------------------ 35 19 8,093 6,074 6,171Des Moines ----------------------------------------------- 7 7 2,189 1,831 2,189
P ac ific ------------------------------------------------------- 20 10 8,915 6,596 7,992Los Angeles-Long B each --------------------------- 5 5 5,680 4,008 5,680
The regions used in this study include: New England— Connecticut, Maine, M assachusetts, New Hampshire, Rhode Island, and Vermont; Middle Atlantic— New Jersey, New York, and Pennsylvania: Border States— Delaware, District of Columbia, Kentucky, Maryland, Virginia, and West Virginia; Southeast— Alabama, Florida, Georgia, Mississippi, North Carolina, South Carolina, and Tennessee; Southwest— Arkansas. Louisiana, Oklahoma, and Texas; Great Lakes—Illinois, Indiana, Michigan, Minnesota, Ohio, and Wisconsin: Middle West—Iowa, Kansas, Missouri, Nebraska, North Dakota, and South Dakota; and P acific—California, Nevada, Oregon, and Washington.
2 Standard Metropolitan Statistical Areas as defined by the U.S. Bureau of the Budget, except the following: Chicago (Cook County); New York City (the 5 boroughs); and Philadelphia (Philadelphia and Delaware Counties, Pa., and Camden County, N.J.).
3 Includes only establishments with 50 or more employees at the time of reference of the universe data.4 Includes executive, professional, and other employees excluded from the nonsupervisory office employee category.
Includes data for the Mountain region in addition to the regions shown separately. Alaska and Hawaii were not included in the study.
29
Digitized for FRASER http://fraser.stlouisfed.org/ Federal Reserve Bank of St. Louis

30Method of Study
Data were obtained by personal visits of Bureau field economists under the direction of the Bureau’s Assistant Regional Directors for Wages and Industrial Relations. The survey was conducted on a sample basis. To obtain appropriate accuracy at minimum cost, a greater proportion of large than of small establishments was studied. In combining the data, however, all establishments were given their appropriate weight. All estimates are presented, therefore, as relating to all establishments in the industry group, excluding only those below the minimum size at the time of reference of the universe data.
Establishment Definition
An establishment, for purposes of this study, is defined as a single physical location where the operations of the home office or a regional head office are performed. A regional head office is defined as one having all or nearly all of the normal life insurance administrative functions, including underwriting. An establishment is not necessarily identical with the company, which may consist of one or more establishments.
EmploymentThe estimates of the number of employees within the scope of the study are intended
as a general guide to the size and composition of the labor force included in the survey. The advance planning necessary to make a wage survey requires the use of lists of establishments assembled considerably in advance of the payroll period studied.
Nonsupervisory Office Employees
The term "nonsupervisory office employees, " as used in this report, includes all nonsupervisory employees of the establishment, except those engaged in custodial, maintenance, and related work. Administrative and executive employees were excluded.
Occupations Selected for Study
Occupational classification was based on a uniform set of job descriptions designed to take account of inter establishment and interarea variations in duties within the same job. (See appendix B for these descriptions. ) The occupations were chosen for their numerical importance, and their representativeness of the entire job scale in the industry. Working supervisors, apprentices, learners, beginners, trainees, the handicapped* part-time, temporary, and probationary workers were not reported in the selected occupations.
Average Weekly Hours and Earnings
Average weekly hours were rounded to the nearest half hour and average weekly earnings to the nearest half dollar. Standard hours reflect the workweek for which employees receive their regular straight-time salaries; earnings correspond to these weekly hours. 6 Cost-of-living bonuses were included as part of the employee's regular salary, but nonproduction bonus payments, such as Christmas or yearend bonuses, were excluded.
Establishment Practices and Supplementary Wage Provisions
Supplementary benefits and practices were treated statistically on the basis that if formal provisions for supplementary benefits and practices were applicable to half or more of the nonsupervisory office employees in an establishment, the practice or benefit was considered applicable to all such employees. Similarly, if fewer than half were covered, the practice or benefit was considered nonexistent in the establishment. Because of length-of- service and other eligibility requirements, the proportion of employees receiving the benefits may be smaller than estimated. Because of rounding, sums of individual items may not equal totals.
6 Ayerage weekly earnings for each occupation were obtained by weighting each rate (or weekly earnings) by the number of workers receiving the rate.
Digitized for FRASER http://fraser.stlouisfed.org/ Federal Reserve Bank of St. Louis

31
Established Minimum Rates, The tabulations for established minimum rates refer to the entrance rates for women in two occupational groups: (1) Inexperienced typists and(2) other inexperienced clerical employees (such as file clerks or junior clerks). For the purposes of this study, inexperienced employees are defined as those who at the time of employment either lack previous work experience or whose previous work experience has little or no transferability to the job for which they are hired. Rates applicable to messengers, office girls, or similar subclerical jobs were excluded; special rates for summer vacation workers were also excluded.
Weekly Hours. Data refer to the predominant work schedule for full-time nonsu- pervisory office employees employed on the day shift.
Paid Holidays. Paid holiday provisions relate to full-day and half-day holidays provided annually.
Paid Vacations. The summary of vacation plans is limited to formal arrangements, excluding informal plans whereby time off with pay is granted at the discretion of the employer or the supervisor. The periods of service for which data are presented were selected as representative of the most common practices, but they do not necessarily reflect individual provisions for progressions. For example, the changes in proportions indicated at 5 years of service include changes in provisions which may have occurred after 4 years.
Health, Insurance, and Pension Plans. Data are presented for all health, insurance, and pension plans for which all or a part of the cost is borne by the employer, excluding only programs required by law, such as workmen's compensation and social security. Among the plans included are those underwritten by a commercial insurance company and those paid directly by the employer from his current operating funds or from a fund set aside for this purpose.
Death benefits are included as a form of life insurance. Sickness and accident insurance is limited to that type of insurance under which predetermined cash payments are made directly to the insured on a weekly or monthly basis during illness or accident disability. Information is presented for all such plans to which the employer contributes at least a part of the cost.
Tabulations of paid sick-leave plans are limited to formal plans which provide full pay or a proportion of the employee's pay during absence from work because of illness; informal arrangements have been omitted. Separate tabulations are provided according to (1) plans which provide full pay and no waiting period, and (2) plans providing either partial pay or a w a i t i n g period.
Medical insurance refers to plans providing for complete or partial payment of doctors' fees. Such plans may be underwritten by a commercial insurance company or a nonprofit organization, or they may be self-insured.
Catastrophe insurance, sometimes referred to as extended medical insurance, includes the plans designed to cover employees in case of sickness or injury involving an expense which goes beyond the normal coverage of hospitalization, medical, and surgical plans.
Tabulations of retirement pensions are limited to plans which provide regular payments upon retirement for the remainder of the employee's life.
Nonproduction Bonuses. Nonproduction bonuses are defined for this study as bonuses that depend on factors other than the output of the individual employee or of a group of employees. Plans that defer payments beyond 1 year were excluded.
Digitized for FRASER http://fraser.stlouisfed.org/ Federal Reserve Bank of St. Louis

Appendix B: Occupational Descriptions
The primary purpose of preparing job descriptions for the Bureau's wage surveys is to assist its field staff in classifying into appropriate occupations workers who are employed under a variety of payroll titles and different work arrangements from establishment to establishment and from area to area. This is essential in order to permit the grouping of occupational wage rates representing comparable job content. Because of this emphasis on interestablishment and interarea comparability of occupational content, the Bureau's job descriptions may differ significantly from those in use in individual establishments or those prepared for other purposes. In applying these job descriptions, the Bureau's field economists are instructed to exclude working supervisors, apprentices, learners, beginners, trainees, handicapped, part-time, temporary, and probationary workers.
ACTUARY
Performs life insurance actuarial studies and assignments, applying actuarial theory and practice. Work involves any or a combination of the following: Determines actuarialbasis for premium rates, dividends, reserves, and nonforfeiture benefits; conducts mortality, statistical, underwriting, or expense allocation studies; prepares gain and loss exhibits; and drafts and files insurance and annuity contract forms. Does not include company officers.
For wage study purposes, actuaries are to be classified as follows:
Class A—Performs highly complex and specialized actuarial studies, including the development of new life insurance products. Provides technical instruction and advice to lower level actuaries. May lead a group of actuaries in accomplishing actuarial projects. Position requires attainment of Fellow in the Society of Actuaries.
Class B—Performs complex actuarial studies and projects such as mortality investigations, competitive comparisons, loading and expense studies, etc. Provides technical assistance and advice to lower level actuaries and clerks. Position requires several years insurance experience, successful completion of at least the first _5 Society of Actuary examinations or attainment of Associate in the Society of Actuaries.
Class C—Performs portions of actuarial assignments such as mortality investigations, competitive comparisons, expense allocation studies, etc. Receives assignments and technical instruction from a high level actuary. An entrance level position. Requires a college degree with math major.
ASSEMBLER
Assembles applications, forms, status information, correspondence and other necessary data to be used by others.
CLERK, ACCOUNTING
Class A—Under general direction of a bookkeeper or accountant, has responsibility for keeping one or more sections of a complete set of books or records relating to one phase of an establishment's business transactions. Work involves posting and balancing subsidiary ledger or ledgers such as accounts receivable or accounts payable; examining
32
Digitized for FRASER http://fraser.stlouisfed.org/ Federal Reserve Bank of St. Louis

33
CLERK, ACCOUNTING— Continuedand coding invoices or vouchers with proper accounting distribution; and requires judgment and experience in making proper assignations and allocations. May assist in preparing, adjusting and closing journal entries; and may direct class B accounting clerks.
Class B—Under supervision, performs one or more routine accounting operations such as posting simple journal vouchers or accounts payable vouchers, entering vouchers in voucher registers; reconciling bank accounts; and posting subsidiary ledgers controlled by general ledgers, or posting simple cost accounting data. This job does not require a knowledge of accounting and bookkeeping principles but is found in offices in which the more routine accounting work is subdivided on a functional basis among several workers.
CLERK, CORRESPONDENCE
Composes and writes letters to policyholders, other individuals, or other business establishments in reply to correspondence received or to requests for information.
Class A—Conducts correspondence with policyholders, field representatives, lawyers, doctors, and other individuals regarding complaints, inquiries relating to various branches of the insurance business, contractual provisions, and other related matters. Work requires detailed knowledge of policy contracts and interpretation of company policy.
Class B—Conducts correspondence with policyholders and field representatives regarding inquiries of various kinds; and quotes values and issues instructions regarding the completion of forms for surrenders, loans, policy changes, reinstatements, claims, and other related matters. Work requires knowledge of standard company practices and regulations regarding policy contracts that are embodied in manuals or other written materials.
CLERK, FILE
Class A—In an established filing system containing a number of varied subject matter files, classifies and indexes correspondence or other material; and may also file this material. May keep records of various types in conjunction with files or may supervise others in filing and locating material in the files. May perform incidental clerical duties.
Class B—Performs routine filing, usually of material that has already been classified or which is easily identifiable, or locates, or assists in locating material in files. May perform incidental clerical duties.
CLERK, POLICY EVALUATION
Calculates cash surrender and loan value of policies. Work involves: Determining the kind of insurance and record of payments made from card file; looking up rate in book, and making calculations; and entering amount on a special form. In addition, may handle reinsurance data.
CLERK, PREMIUM-LEDGER CARD
Keeps card records or other records of all premium transactions and changes in type of policy. Work involves: Transcribing premium payments from daily listings, andkeeping a check on the due date so as to put through records for cancellation if premiums are not paid. May check and send out premium payments. Does not include general clerks.
Digitized for FRASER http://fraser.stlouisfed.org/ Federal Reserve Bank of St. Louis

34
CONSOLE OPERATOR
Monitors and controls a large-scale electronic computer by operating a central control unit known as a console. Has a general knowledge of programming. Work consists of most of the following: Studies program instruction sheet to determine equipment setup;mounts reels of tape on designated magnetic tape units which extract input or record output data; switches auxiliary equipment into circuit to close loop and effect feedback of data; starts and operates electronic computer that reads and processes data; makes corrections to computer to overcome operating problems or special conditions; reviews machine error messages, reports machine malfunctioning to supervisor; and maintains operating records. May assist programmer in testing and debugging program.
KEYPUNCH OPERATOR
Under general supervision and with no supervisory responsibilities, records accounting and statistical data on tabulating cards by punching a series of holes in the cards in a specified sequence, using an alphabetical or a numerical keypunch machine, following written information on records. May duplicate cards by using the duplicating device attached to machine. May keep files of punch cards. May verify own work or work of others.
PREMIUM ACCEPTOR
Accepts, records, and proves remittances received from policyholders and the field offices in connection with premiums, interest on policy loans or to cancel or reduce policy loans. Endorses checks, issues receipts, and maintains records of remittances held pending adjustments. May conduct correspondence with field offices regarding such remittances.
PROGRAMMER, ELECTRONIC DATA PROCESSING
Class A—Under general supervision, prepares difficult and complex programs for solutions of problems or processing of business data by means of a large-scale electronic computer. May act as leader over subordinate programmers. Work consists of most of the following: Analyzes problems outlined by superior or systems analyst and designs detailed programs, flow chart, and diagrams indicating mathematical computations and sequence of machine operations necessary to copy and process data, and print solution; codes, tests, and debugs programs; corrects program errors by revising instructions or altering sequence of operations; and prepares instruction sheet to guide computer operator during run. Position usually requires 3 years of programming experience.
Class B—Under supervision, prepares comparatively simple programs or single phase of complex programs for solution by means of a large-scale electronic computer. Prepares flow charts and diagrams; and codes, tests, and debugs programs. Position usually requires a college degree, preferably in mathematics, or equivalent experience. Does not include workers with less than 1 year programming experience.
STENOGRAPHER, GENERAL
Primary duty is to take dictation from one or more persons, either in shorthand or by Stenotype or similar machine, involving a normal routine vocabulary, and to transcribe this dictation on a typewriter. May also type from written copy. May also set up and keep files in order, keep simple records, etc. Does not include transcribing-machine work.
STENOGRAPHER, TECHNICAL
Primary duty is to take dictation from one or more persons, either in shorthand or by Stenotype or similar machine, involving a varied technical or specialized vocabulary such as in legal briefs or reports on scientific research and to transcribe this dictation on a typewriter. May also type from written copy. May also set up and keep files in order, keep simple records, etc. Does not include transcribing-machine work.
Digitized for FRASER http://fraser.stlouisfed.org/ Federal Reserve Bank of St. Louis

35
SYSTEMS ANALYST
Primarily responsible for devising computer system requirements and layout, and developing procedures to process data by means of a large-scale electronic computer system. Work consists of most of the following: Confers with other technical personnel to determine problem and type of data to be processed. Analyses problem in terms of equipment capacity to determine technique and formulate computer system requirements most feasible for processing data. Prepares definition of problem together with recommendations for equipment needed for its solution from which programmer prepares flow charts and computer instructions. Directs and coordinates installation of computer system. Devises data verification methods, and establishes standards for preparation of operating instructions. May schedule data processing activities and supervise preparation of program. Does not include workers primarily engaged in programming (see programmer).
For wage study purposes, systems analysts are to be classified as follows:
Class A—Responsible for complex projects which usually include several computer programs.
Class B-—Under supervision, responsible for less complex projects or segments of complex projects.
TABULATING-MACHINE OPERATOR
Class A—Operates a variety of tabulating or electrical accounting machines, typically including such machines as the tabulator, calculator, interpreter, collator and others. Performs complete reporting assignments without close supervision, and performs difficult wiring as required. The complete reporting and tabulating assignments typically involve a variety of long and complex reports which often are of irregular or nonrecurring type requiring some planning and sequencing of steps to be taken. As a more experienced operator, is typically involved in training new operators in machine operations, or partially trained operators in wiring from diagrams and operating sequences of long and complex reports. Does not include working supervisors performing tabulating machine operations and day-to-day supervision of the work and production of a group of tabulating machine operators.
Class B—Operates more difficult tabulating or electrical accounting machines such as the tabulator and calculator, in addition to the sorter, reproducer and collator. This work is performed under specific instructions and may include the performance of some wiring from diagrams* The work typically involves, for example, tabulations involving a repetitive accounting exercise, a complete but small tabulating study, or parts of a longer and more complex report. Such reports and studies are usually of a recurring nature where the procedures are well established. May also include the training of new employees in the basic operation of the machine.
Class C—Operates simple tabulating or electrical accounting machines such as the sorter, reproducing punch, collator, etc., with specific instructions. May include simple wiring from diagrams and some filing work. The work typically involves portions of a work unit, for example, individual sorting or collating runs, or repetitive operations.
TYPIST
Uses a typewriter to make copies of various material or to make out bills after calculations have been made by another person. May include typing of stencils, mats, or similar materials for use in duplicating processes. May do clerical work involving little special training, such as keeping simple records, filing records and reports, or sorting and distributing incoming mail.
Digitized for FRASER http://fraser.stlouisfed.org/ Federal Reserve Bank of St. Louis

36
TYPIST— Continued
Class A—Performs one or more of the following: Types material in final formwhen it involves combining material from several sources or responsibility for correct spelling, syllabication, punctuation, etc. , of technical or unusual work or foreign language material; and plans layout and typing of complicated statistical tables to maintain uniformity and balance in spacing. May type routine form letters varying details to suit circumstances.
Class B—Performs one or more of the following: Types copy from rough or clear drafts; types routine forms, insurance policies, etc. ; and sets up simple standard tabulations, or copies more complex tables already set up and spaced properly.
UNDERWRITER
Reviews, evaluates, and takes action to approve, or decline, applications for new insurance, changes of plan and reinstatement of benefits where no major medical impairment is involved.
For wage study purposes, underwriters are classified as follows:
Class A-—Reviews and approves life insurance applications which normally do not exceed $60,000; reviews and recommends approval on applications above these limits; and recommends declinations on applications up to $60, 000 and concurs on lower level declinations. Answers insurance inquiries from the field offices. May determine extra premium rate for out of ordinary applications. Position usually requires at least 5 years life insurance experience and may require sucessful completion of several insurance courses given by HOLU or LOMA. May also direct work of underwriters at lower clas sifications.
Class B—Reviews and approves life insurance applications which normally do not exceed $30, 000; reviews and recommends approval on applications above these limits. Declinations must be concurred in by another underwriter. May determine extra premium rate for out of ordinary applications. Position usually requires at least 2 years life insurance experience and successful completion of at least 2 specialized courses given by HOLU or LOMA.
Class C—Reviews and approves life insurance applications which are clear cut and do not exceed $15,000. May review applications above $15, 000 and recommend approval. Declinations require concurrence by another underwriter, generally at a higher level. Does not include trainees with less than 6 months experience in underwriting.
Digitized for FRASER http://fraser.stlouisfed.org/ Federal Reserve Bank of St. Louis

INDUSTRY WAGE STUDIES
The following reports cover part of the Bureau’s program of industry wage surveys. These reports cover the period 1950 to (fete and may be obtained free upon request as long as a supply is available. However, those for which a price is shown are available only from the Superintendent of Documents, U.S. Government Printing Office, Washington 25, D.C., or any of its regional sales offices.
I. Occupational Wage Studies
ManufacturingA££* *rel:Men's Dress Shirts and Nightwear, 1950 —
Series 2, No. 80* Men’s and Boys' Dress Shirts and Nightwear, 1954
BLS Report No. 74Men’s and Boys* Shirts (Except Work Shirts) and
Nightwear, 1956 - BLS Report No. 116 Men's and Boys' Suits and Coats, 1958 —
BLS Report No. 140Women's and M isses' Coats and Suits, 1957 —
BLS Report No. 122 Women's and Misses* D resses, I960 —
BLS Report No. 193Work Clothing, 1953 - BLS Report No. 51
*Work Shirts, 1955 and 1956 - BLS Report No. 115* Work Shirts, 1957 - BLS Report No. 124
Chemicals and Petroleum:Fertilizer, 1949*50 - Series 2, No. 77
* Fertilizer Manufacturing, 1955 and 1956 — BLS Report No. I l l* Fertilizer Manufacturing, 1957 — BLS Report No. 132
Industrial Chemicals, 1951 — Series 2, No. 87 Industrial Chemicals, 1955 — BLS Report No. 103 Paints and Varnishes, 1961 — BLS Bull. 1318 (30 cents) Petroleum Production and Refining, 1951 —
Series 2, No. 83Petroleum Refining, 1959 — BLS Report No. 158 Synthetic Fibers, 1958 — BLS Report No. 143Food:Candy and Other Confectionery Products, I960 —
BLS Report No. .195* Canning and Freezing, 1955 and 1956 — BLS Report No. 117* Ginning and Freezing, 1957 — BLS Report No. 136
Distilled Liquors, 1952 — Series 2, No. 88Fluid Milk Industry, I960 - BLS Report No. 174 *Raw Sugar, 1955 and 1956 - BLS Report No. 117 *Raw Sugar, 1957 - BLS Report No. 136
Leather:Footwear, 1953 - BLS Report No. 46
* Footwear, 1955 and 1956 - BLS Report No. 115 Footwear, 1957 — BLS Report No. 133 Leather Tanning and Finishing, 1954 —
BLS Report No. 80Leather Tanning and Finishing, 1959 —BLS Report No. 150
Lumber and Furniture:Household Furniture, 1954 — BLS Report No. 76 Lumber in die South, 1949 and 1950 — Series 2, No. 76 Southern Lumber Industry, 1953 — BLS Report No. 45
* Southern Sawmills, 1955 and 1956 - BLS Report No. 113* Southern Sawmills, 1957 - BLS Report No. .130
West Coast Sawmilling, 1952 - BLS Report No. 7 West Coast Sawmilling, 1959 — BLS Report No. 156 Wood Household Furniture, Except Upholstered, 1959 -
BLS Report No. 152* Wooden Containers, 1955 and 1956 - BLS Report No. 115* Wooden Containers, 1957 - BLS Report No. 126
Paper and Allied Products:Pulp, Paper, and Paperboard, 1952 — Series 2, No. 91Primary Metals, Fabricated Metal Products and Machinery: Basic Iron and Steel, 1951 — Series 2, No. 81 Fabricated Structural Steel, 1957 — BLS Report No. 123 Gray Iron Foundries, 1959 — BLS Report No. 151 Nonferrous Foundries, 1951 — Series 2, No. 82 Nonferrous Foundries, I960 — BLS Report No. 180 Machinery Industries, 1953*54 — BLS Bull. No. 1160 (40 cents) Machinery Industries, 1954*55 - BLS Report No. 93 Machinery Manufacturing, 1955*56 - BLS Report No. 107 Machinery Manufacturing, 1957-58 — BLS Report No. 139 Machinery Manufacturing, 1958-59 — BLS Report No. 147 Machinery Manufacturing, 1959*60 - BLS Report No. 170 Machinery Manufacturing, 1961 — BLS Bull. No. 1309(30 cents) Radio, Television, and Related Products, 1951 —
Series 2, No. 84Steel Foundries, 1951 — Series 2, No. 85
Rubber and P lastics Products:Miscellaneous P lastics Products, I960 — BLS Report No. 168 Stone, Clay, and G lass:Pressed or Blown Glass and Glassware, I960 —
BLS Report No. 177Structural Clay Products, 1954 — BLS Report No. 77 Structural Clay Products, I960 — BLS Report No. 172Textiles:Cotton Textiles, 1954 — BLS Report No. 82 Cotton Textiles, I960 — BLS Report No. 184 Cotton and Synthetic Textiles, 1952 — Series 2, No. 89 Hosiery, 1952 - BLS Report No. 34 Miscellaneous Textiles, 1953 — BLS Report No. 56
* Processed Waste, 1955 and 1956 — BLS Report No. 115* Processed Waste, 1957 — BLS Report No. 124* Seamless Hosiery, 1955 and 1956 - BLS Report No. 112* Seamless Hosiery, 1957 — BLS Report No. 129
Synthetic Textiles, 1954 — BLS Report No. 87 Synthetic Textiles, I960 — BLS Report No. 192Textile Dyeing and Finishing, 1956 — BLS Report No. 110 Textile Dyeing and Finishing, 1961 - BLS Bull. 1311(35 cents) Woolen and Worsted T extiles, 1952 — Series 2, No. 90 Wool Textiles, 1957 — BLS Report No. 134
Tobacco:Cigar Manufacturing, 1955 - BLS Report No. 97
* Cigar Manufacturing, 1956 — BLS Report No. 117 Cigar Manufacturing, 1961 - BLS Bull. 1317 (30 cents) Cigarette Manufacturing, I960 — BLS Report No. 167
* Tobacco Stemming and Redrying, 1955 and 1956 —BLS Report No. 117
* Tobacco Stemming and Redrying, 1957 — BLS Report No. 136 Transportation:Motor Vehicles and P arts, 1950 - BLS Bull. No. 1015(20cents) Motor Vehicles and Motor Vehicle Parts, 1957 —
BLS Report No. 128 Railroad Cars, 1952 — Series 2, No. 86
* Studies of the effects of Hie #1 minimum wage.
Digitized for FRASER http://fraser.stlouisfed.org/ Federal Reserve Bank of St. Louis

NonmanufacturingI. Occupational Wage Studies— Continued
Auto Dealer Repair Shops, 1958 - BLS Report No. 141 Banking Industry, I960 - BLS Report No. 179 Crude Petroleum and Natural Gas Production, I960 —
BLS Report No. 181Department and Women’s Ready-to-Wear Stores, 1950 -
Series 2» No. 78
Electric and Gas U tilities, 1950 — Series 2, No. 79 Electric and Gas U tilities, 1952 — BLS Report No. 12 Electric and Gas U tilities, 1957 — BLS Report No. 135 Hotels, I960 - BLS Report No. 173 Power Laundries and Dry Cleaners, I960 —
BLS Report No. 178
II. Other Industry Wage Studies
Communications Workers, Earnings in October 1956 — BLS Report No. 121 Communications Workers, Earnings in October 1957 — BLS Report No. 138 Communications Workers, Earnings in October 1958 - BLS Report No. 149 Communications Workers, Earnings in October 1959 - BLS Report No. 171 Communications, October I960 - BLS Bull. No. 1306 (20 cents)Factory Workers' Earnings — Distributions by Straight-Time Hourly Earnings, 1954 — BLS Bull. No. 1179 (25 cents) Factory Workers' Earnings - 5 Industry Groups, 1956 — BLS Report No. 118Factory Workers' Earnings — Distribution by Straight-Time Hourly Earnings, 1958 — BLS Bull. No. 1252 (40 cents) Factory Workers' Earnings — Selected Manufacturing Industries, 1959 — BLS Bull. No. 1275 (35 cents)Wages in Nonmetropolitan Areas, South and North Central Regions, October I960 — BLS Report No. 190
Retail Trade, Employee Earnings in October 1956:Initial Report - BLS Report No. 119 (30 cents)Building Materials and Farm Equipment Dealers - BLS Bull. No. 1220-1 (20 cents) General Merchandise Stores - BLS Bull. No. 1220*2 (35 cents)Food Stores - BLS Bull. No. 1220*3 ( 30 cents)Automotive Dealers and Gasoline Service Stations — BLS Bull. No. 1220*4 (35 cents) Apparel and Accessories Stores - BLS Bull. No. 1220*5 (45 cents)Furniture, Home Furnishings, and Appliance Stores - BLS Bull. No. 1220*6 (35 cents) Drug Stores and proprietary Stores - BLS Bull. No. 1220-7 (15 cents)Summary Report — BLS Bull. No. 1220 (55 cents)
Regional Offices
U.S. Department of Labor Bureau of Labor Statistics 18 Oliver Street Boston 10, Mass.
U.S. Department of Labor Bureau of Labor S tatistics 341 Ninth Avenue New York 1, N.Y.
U.S. Department of Labor Bureau of Labor Statistics 1371 Peachtree Street, NE. Atlanta 9, Ga.
U.S. Department of Labor Bureau of Labor S tatistics 105 West Adams Street Chicago 3, 111.
U.S. Department of Labor Bureau of Labor S tatistics 630 Sansome Street San Francisco 11, Calif.
* U.S. G O V E R N M E N T PRINTING OFFICE : 1962 0 — 637385
Digitized for FRASER http://fraser.stlouisfed.org/ Federal Reserve Bank of St. Louis