bls_1459_1965.pdf
TRANSCRIPT
l q , 3: 1451
^ ° ^ « c ’ubraryMontgomery Co.
*U s5 H *
j j 5 S9©
INDUSTRY WAGE SURVEYStructural Clay Products
J U L Y -A U G U S T 1964
Bulletin No. 1459
UNITED STATES DEPARTMENT OF LABOR W. Willard Wirtz, Secretary
BUREAU OF LABOR STATISTICS Ewan Clogue, Commissioner
Digitized for FRASER http://fraser.stlouisfed.org/ Federal Reserve Bank of St. Louis

Digitized for FRASER http://fraser.stlouisfed.org/ Federal Reserve Bank of St. Louis
INDUSTRY WAGE SURVEY
Structural Clay Products
JU L Y -A U G U ST 1964
Bulletin No. 1459
September 1965
UNITED STATES DEPARTMENT OF LABOR W. Willard Wirtz, Secretary
BUREAU OF LABOR STATISTICS Ewan Clague, Commissioner
n r
For sale by the Superintendent of Documents, U.S. Government Printing Office, Washington, D.C., 20402 - Price cents
Digitized for FRASER http://fraser.stlouisfed.org/ Federal Reserve Bank of St. Louis

Digitized for FRASER http://fraser.stlouisfed.org/ Federal Reserve Bank of St. Louis

Preface
This bulletin sum m arizes the results of a Bureau of Labor Statistics survey of wages and supplem entary benefits in structural clay products m anufacturing industry group in July—August 1964.
Separate State re leases w ere issued ea rlie r , usually within a few months of the payroll period studied, for selected product branches within the group as fo llow s: B rick and structural clay tile— C alifornia, G eorgia, Illinois, North Carolina, Ohio, Pennsylvania, and Texas; ceram ic wall and flo o r tile— C alifornia and Ohio; clay re fra ctories— M issou ri, Ohio, and Pennsylvania; and clay sew er pipe— Ohio. Copies of these re leases are available from the Bureau of Labor S tatistics, Washington, D .C ., 20212, orany of its regional o ffices .
This study was conducted in the B ureau's Division of Occupational Pay, Toivo P. Kanninen, Chief, under the general d irection of L . R. L insenm ayer, A ssistant C om m iss ion er , Wages and Industrial R elations. The analysis was prepared by Charles M. O 'Connor, under the im m ediate supervision of L. Earl Lew is. F ield w ork for the survey was d irected by the A ssistant Regional D irectors for Wages and Industrial Relations.
Other reports available from the B ureau's p r o gram of industry wage studies as w ell as the addresses of the B ureau's six regional o ffices are listed at the end of this bulletin.
iii
Digitized for FRASER http://fraser.stlouisfed.org/ Federal Reserve Bank of St. Louis

Digitized for FRASER http://fraser.stlouisfed.org/ Federal Reserve Bank of St. Louis

Page
Summary-----------------------------------------------------------------------------------------Industry characteristics---------------------------------------------------------------
Products and processes—_____________________________________Location-------------------------------------------------------------------------------------Establishment s ize -------------------------------------------------------------------Union contract coverage----------------------------------------------------------Method of wage payment----------------------------------------------------------
Average hourly earnings---------------------------------------------------------------Occupational earnings-------------------------------------------------------------------Establishment practices and supplementary wage provisions-
Scheduled weekly hours-----------------------------------------------------------Shift provisions and practices------------------------------------------------
Paid vacations_________________________________________________Health, insurance, and pension plans------------------------------------Nonproduction bonuses------------------------------------------------------------
T ables:
111233445 7 7 7 778 8
Average hourly earnings:1. By selected characteristics__________________________________________ 9
Earnings distribution:2. Structural clay products---------------------3. Brick and structural clay tile ------------4. Ceramic wall and floor tile ---------------5. Clay refractories--------------------------------6. Clay sewer pipe-----------------------------------
1011121313
Occupational averages:7. Structural clay products---------------------------------------------------------------------- 148. Brick and structural clay tile ------------------------------------------------------------- 159. Ceramic wall and floor tile ----------------------------------------------------------------- 16
12. By labor-management contract coverage and
13. By labor-management contract coverage and
14. By method of wage payment__________ _______________________________ 23
Occupational earnings:Brick and' structural clay tile—
16. Georgia-------------------------------------------------17. Illinoi s ------- ------------------------------------------18. North Carolina--------------------------------------19. Ohio----------- --------------------------------------------
24252627282930
v
Digitized for FRASER http://fraser.stlouisfed.org/ Federal Reserve Bank of St. Louis
Contents— Continued
Page
Table s— Continued
Occupational earnings— Continued Ceram ic wall and floor tile—
22. C alifor nia — -------------------------------------------------------------------------- —— — 31
Clay refractories—
2 5. Ohi o____ — --------------------------------------------------------------------- ------ 3 4
Clay sewer pipe—
Establishment practices and supplementary wage provisions:Method of wage payment:
28. Structural clay products---------------------------------------------------------------- 3729. Selected structural clay products--------------------------------------------—— 38
Scheduled weekly hours:30. Structural clay products---- ----------------------------------------------------------- 3931. Selected structural clay products------------------------------------------------- 40
Shift differential provisions:32. Structural clay products —-_________________________ 4233. Selected structural clay products — _____________________________ 43
Shift differential practices:34. Structural clay products---------------------------------------------------------------- 4535. Selected structural clay products —------------------- 46
Paid holidays:36. Structural clay products______ ___—_______________________________ 4837. Selected structural clay products------------------------------------------------- 49
Paid vacations:38. Structural clay products---------------------------------------------------------------- 5139. Selected structural clay products______________ 54
Health, insurance, and pension plans:40. Structural clay products---------------------------------------------------------------- 6041. Selected structural clay products____________•____________________ 61
Nonproduction bonuses:42. Structural clay products---- ---— _________________________________ - 6343. Selected structural clay products_________________________________ 64
Appendixes:A. Scope and method of surveyB. Occupational descriptions—
vi
Digitized for FRASER http://fraser.stlouisfed.org/ Federal Reserve Bank of St. Louis
Industry W age Survey-----
Structural Clay Products, July—August 1964
Summary
Straight-time hourly earnings of production workers in structural clay products manufacturing establishments averaged $ 2 .0 8 in July^-August 1964. Nearly all of the 51, 324 production workers covered by the Bureau of Labor Statistics su rvey1 had earnings within a range of $ 1 .2 5 to $3 .50 an hour; the middle half earned between $1.61 and $ 2 .4 4 . Regional averages ranged from $1.51 an hour in the Southwest to $ 2. 43 in the P acific States.2 In the Great Lakes region, where employment concentration was greatest, the average was $ 2 .2 9 .
Among the four m ajor product branches studied separately, nationwide averages were $1.91 in brick and structural clay tile, $1 .97 in ceram ic wall and floor tile, $2 .21 in clay sewer pipe, and $2. 51 in clay refractories.
Of the occupations studied separately, nationwide averages were lowest fo r janitors and finishers ($1.77 and $1.78) and highest for maintenance machinists and electricians ($2 .67 and $2 .68 ). O ff-bearers, nearly 4, 000 in number, averaged $ 1 .9 8 an hour.
A large m ajority of the workers were in establishments providing paid holidays, paid vacations, and at least part of the cost of various health and insurance benefits.
Industry Characteristics
Establishments within scope of the survey employed 51, 324 production and related workers in July-August 1964. This was approximately 10 percent below the employment in April—June I960, the date of the Bureau1 s previous study of the structural clay products industries.3 Despite this general decline in employment, production of m ost types of m aterial had increased substantially during this period. According to the Bureau of the Census, the production of unglazed brick increased 12 percent; clay wall and floor tile, 20 percent; and clay sewer pipe, 1 p ercen t.4 Much of the increased production resulted from technological improvements, including the increased use of tunnel kilns and the installation of improved m aterials handling equipment.
Men com prised m ore than nine-tenths of the production workers in July—August 1964. They accounted for virtually all of the workers in each of the product branches studied separately, with the exception of ceram ic wall and floor tile plants in which slightly m ore than a third were women.
Products and P ro ce sse s . Data are presented for all establishments within scope of the study and separately for establishments manufacturing 1 of the 4 m ajor products. When combined, these establishments accounted for all
1 See appendix A for scope and method of survey.2 For definition of regions used in this study, see footnote 1 in appendix A table.3 See Wage Structure: Structural Clay Products. April—June I960 (ELS Report 172, 1961).4 Source: U. S. Bureau of the Census, Current Industrial Reports. Clay Construction Products, Series M32D
(61) - 13 and M32D (64) - 8 and 9.
1
Digitized for FRASER http://fraser.stlouisfed.org/ Federal Reserve Bank of St. Louis
2
but a small proportion of the total work fo r c e .5 Most establishments specialized in one type of product, although there were some exceptions. Establishments prim arily engaged in the manufacture of brick and structural clay tile employed 45 percent o f the production workers covered by the study; those manufacturing ceram ic wall and floor tile, 19 percent; clay refractories, 18 percent; and clay sewer pipe, 14 percent. As indicated in the following sections of this report, there was considerable variation among these four product branches with respect to several characteristics that influence wages.
The basic processes of mining, forming, drying, and burning are com m on to the production of all structural clay products. Clay and shale m ost commonly are mined by power shovels. Pick mining, however, was reported by some establishments, particularly those extracting fire (refractory) clay which is mined at deeper levels than other clays.
Practically all structural clay products are form ed by machine. The three principal form ing methods are the "stiff-m ud, " "soft-m ud, " and "d ry -p ress" p rocesses . Most widely used is the stiff-m ud process, which requires clay containing only sufficient m oisture and plasticity to perm it extrusion through a die. This method was used to produce m ost of the brick and structural clay tile and sewer pipe at the time of the study. The soft-m ud process, molding clay too wet for extrusion, was used to some extent in manufacturing brick and structural clay tile, clay refractories, and clay sewer pipe, but was not the predominant method in any of the four product branches. The d ry -press process, molding clay in a nearly dry condition, was predominant among plants manufacturing ceram ic wall and floor tile and clay re fractories .
P rior to the burning operation, which is one of the m ost specialized steps in the manufacture of clay products, dryers rem ove m ost of the excess m oisture. Burning is then accom plished in one of several types of kilns. Scove kilns are form ed by the units to be burned; thus, a new kiln is constructed for each burning. In periodic kilns, the dried units are set by hand in a manner which perm its the free circulation of the hot kiln gases. In a tunnel kiln, the units are loaded on cars which travel through the kiln1 s various temperature zones at a prescribed speed, thereby permitting continuous use of the kiln. At the time of the study, tunnel kilns were the predominant type used in burning brick and structural clay tile, ceram ic wall and floor tile, and clay re fractories ; periodic kilns were p re dominant in burning clay sewer pipe; and scove kilns were used to some extent in m ost regions for brick and structural clay tile. During drawing— the process of unloading a kiln after cooling— the units are sorted, graded, and taken to storage or loaded for delivery.
Location. Structural clay products are manufactured throughout m ost of the country. The source of raw m aterials and the desire to locate as near as possible to the m ajor consum ers appear to be the principal determinants of plant locations. Regionally, the largest employment concentrations were in the Great Lakes (28 percent), Southeast (19 percent), and Middle Atlantic (15 percent). Ohio not only accounted for m ore employees than any other State, but was the m ost diversified from the standpoint of products. Other important producing States w ere: Pennsylvania, California, Texas, M issouri, Georgia, Illinois, andNorth Carolina.
As indicated in table 1, the four m ajor product branches of the industry were distributed quite differently among the regions. Thus, the Great Lakes region accounted fo r nearly one-half of the employees in plants manufacturing
5 Establishments primarily engaged in the manufacture of products not tabulated separately (e.g., terra cotta and roofing tile) employed only about 3 percent of the workers in the industry group.
Digitized for FRASER http://fraser.stlouisfed.org/ Federal Reserve Bank of St. Louis
3
clay sewer pipe, one-third of the workers in plants making ceram ic wall and floor tile, and about one-fifth of the workers in each of the other branches. The Southeast region employed nearly three-tenths of the workers in the brick and structural clay tile branch, compared with a sixth or less in the other branches. The Middle West region employed three-tenths of the workers in the clay re fractories branch, but less than a tenth in the other branches.
Metropolitan areas accounted for about half the employees covered by the study. Among the regions, the approximate proportions ranged from a fourth in the Middle West to nine-tenths in the Mountain and Pacific. Three-fifths o fthe ceram ic wall and floor tile workers, about half of the brick and structural clay tile w orkers, and slightly less than two-fifths of the clay refractories and clay sewer pipe workers were employed in metropolitan areas. Among the regions, there was no consistency by [product branch. In clay refractories, for example, m etropolitan areas accounted for a sixth of the workers in the Middle Atlantic and about two-fifths in the Great Lakes; in brick and structural clay tile, the corresponding proportions were about three-fifths and tw o-fifths; and in ceram ic wall and floor tile the proportions were identical— slightly m ore than half in both regions.
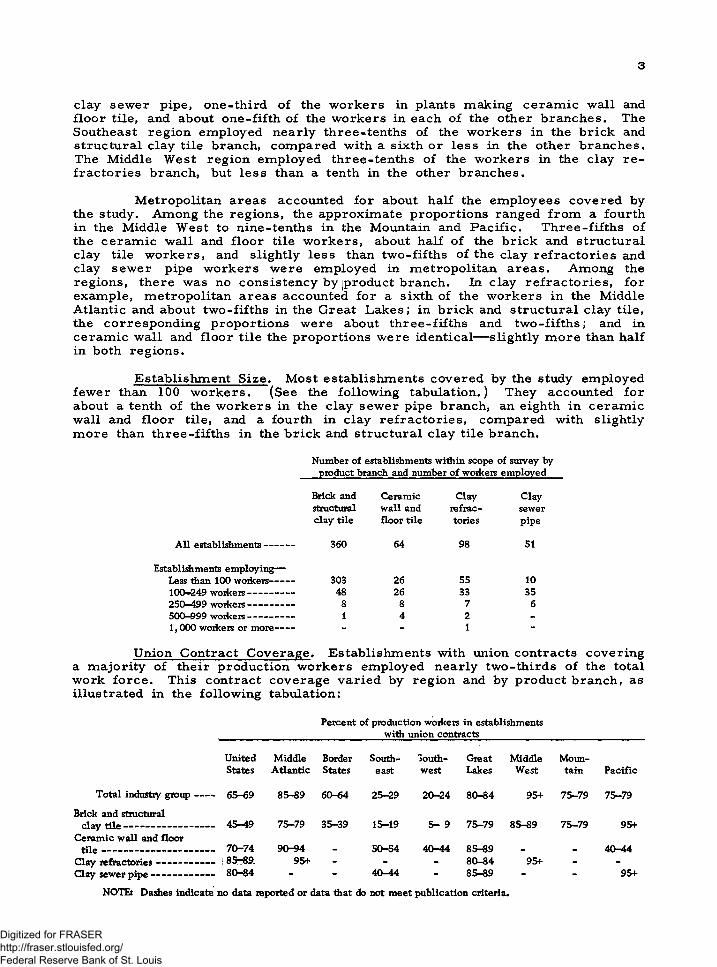
Establishment S ize. Most establishments covered by the study employed fewer than 100 w orkers. (See the following tabulation.) They accounted for about a tenth of the workers in the clay sewer pipe branch, an eighth in ceram ic wall and floor tile, and a fourth in clay refractories, compared with slightly m ore than three-fifths in the brick and structural clay tile branch.
Number of establishments within scope of survey by product branch and number of workers employed
Brick and Ceramic Clay Claystructural wall and refrac sewerclay tile floor tile tories pipe
All establishments-------- 360 64 98 51
Establishments employing—Less than 100 workers------ 303 26 55 10100-249 workers------------ 48 26 33 35250—499 workers------------ 8 8 7 6500-999 workers------------ 1 4 2 -
1,000 workers or more----- - - 1 -
Union Contract Coverage. Establishments with union contracts covering a m ajority of their production workers employed nearly two-thirds of the total work force . This contract coverage varied by region and by product branch, as illustrated in the following tabulation:
Percent of production workers in establishments _____________________________with union contracts_____________________________
UnitedStates
MiddleAtlantic
BorderStates
Southeast
Southwest
GreatLakes
MiddleWest
Mountain Pacific
Total industry group----- 65-69 85-89 60-64 25-29 20-24 80-84 95+ 75-79 75-79Brick and structural
clay tile--------------------- — 45-49 75-79 35-39 15-19 5- 9 75-79 85-89 75-79 95+Ceramic wall and floor
tile------------------------------ 70-74 90-94 - 50-54 40-44 85-89 - - 40-44Clay refractories------------ — :85H89. 95+ - - - 8CL84 95+ - -
Clay sewer pipe------------------ 80-64 - - 40-44 - 85-89 - - 95+NOTE: Dashes indicate no data reported or data that do not meet publication criteria.
Digitized for FRASER http://fraser.stlouisfed.org/ Federal Reserve Bank of St. Louis
4
The United Brick and Clay W orkers o f A m erica was the m ajor union in brick and structural clay tile, clay refractories, and clay sewer pipe. United Glass and Ceram ic W orkers of North Am erica was the m ajor union in ceram ic wall and floor tile.
Method of Wage Payment. Nearly seven-tenths of the production workers were paid on a tim e-rated basis (table 28). Typically, these workers were paid according to form ally established wage system s providing a single rate for specified job categories. In the Southeast and Southwest, however, workers m ost commonly were paid according to their individual qualifications. Incentive pay system s, m ost commonly group piece, applied to about three-tenths of the w orkers. Jobs predominantly paid on this basis included die pressers, glazing- machine feeders, kiln drawers and setters, m olding-machine operators, and pattern mounters. A method of wage payment generally referred to as "stint w ork" or "task work" applied to 3 percent of the w orkers. This system p ro vides a fixed daily rate for a predetermined amount of work, regardless of the actual time taken to com plete the task. Kiln drawers and setters, m olders, and off-bearers were among the jobs som etim es paid under this system . In this study, stint workers were classified as tim eworkers in the tabulations of earnings by method of wage payment.
Among the product branches, the approximate proportions of tim e-rated workers were three-fifths in ceram ic wall and floor tile, two-thirds in brick and structural clay tile, and three-fourths in both clay refractories and clay sewer pipe (table 29). Incentive workers constituted a m ajority only in ceram ic wall and floor tile in the Middle Atlantic and Great Lakes regions.
Average Hourly EarningsStraight-time earnings of the 51, 324 production workers covered by the
study averaged $2. 08 an hour in July—August 1964.6 This represented an 8.3 p ercent increase since April—June I960, when the Bureau conducted a sim ilar study.7
Regionally, averages ranged from $ 2 .4 3 in the P acific to $1 .51 an hour in the Southwest. Workers in the Great Lakes, Southeast, and Middle Atlantic regions (the three num erically m ost important regions) averaged $2 .29 , $1 .54 , and $2 .38 an hour, respectively. These regional variations in pay were partly due to differences in the m ix of the industry branches with disparate pay levels. The comparatively high average recorded for the Middle West region ($2 . 36), for example, reflects the relatively high proportion of workers in clay refractories establishments. In each of the regions permitting com parisons, workers in these establishments averaged substantially m ore than those in the other branches of the industry.
6 Hie straight-time average hourly earnings in this bulletin differ in concept from the gross average hourly earnings published in the Bureau's monthly hours and earnings series ($2.22 in August 1964). Unlike the latter, the estimates presented here exclude premium pay for overtime and for woik on weekends, holidays, and late shifts. Average earnings were calculated by summing individual hourly earnings and dividing by the number of individuals; in the monthly series, the sum of the man-hour totals reported by establishments in the industry was divided into the reported payroll totals.
The estimate of the number of production woxkers within scope of the study is intended only as a general guide to the size and composition of the labor force included in the survey. They differ from the number published in the monthly series (60.2 thousand in August 1964) by the exclusion of establishments employing fewer than 20 woikers and because the advance planning necessary to make the survey requires the use of lists of establishments assembled considerably in advance of data collection. Thus, establishments new to the industry are omitted, as are establishments originally classified in the structural clay products industry group but found to be in other industries at the time of the survey. Also omitted are establishments manufacturing structural clay products, but classified incorrectly in other industries at the time the lists were compiled.
7 BLS Report 172, op. cit. The Federal minimum hourly wage for manufacturing establishments engaged in interstate commerce was increased from $1 to $1.15 effective Sept. 3, 1961, and to $1.25 effective Sept. 3, 1963.
Digitized for FRASER http://fraser.stlouisfed.org/ Federal Reserve Bank of St. Louis
5
Nationwide, earnings of workers in brick and structural clay tile plants averaged $1 .91 an hour, compared with $1 .97 in ceram ic wall and floor tile plants, $2 .21 in plants manufacturing clay sewer pipe, and $2.51 in those making clay re fractories . These nationwide pay relationships, however, were not consistent among the regions. For example, in both the Middle Atlantic and Great Lakes regions workers in plants manufacturing brick and structural clay tile averaged substantially m ore than workers in plants producing ceram ic wall and floor tile; this relationship, however, was reversed in the Southeast and Southwest regions.
Men com prised almost the entire work force in 3 of the 4 industry branches studied separately. Women, accounting for slightly m ore than a third of the workers in plants manufacturing ceram ic wall and floor tile, averaged $1 .79 an hour, compared with $2 .08 for men in this branch of the industry. The large m ajority of the women were employed in jobs requiring comparatively little skill or training whereas men were distributed over a much wider range of skills.
Earnings data were also tabulated according to community size, establishment size, and labor-management contract status. Nationwide, average hourly earnings were higher in m etropolitan areas than in sm aller communities ($2 .11 and $2 .05 ), higher in establishments employing 100 workers or m ore than in sm aller establishments ($2 .11 and $2 .02), and higher in establishments with union agreements covering a m ajority o f their production workers than in establishments without such contract coverage ($2 .31 and $1 .66 ). The nationwide earnings relationship for size of community held in 3 of 6 regions p ermitting com parisons; for size of establishments, in 6 of 7 regions; and for labor-management contract status, in the 5 regions where com parisons were possible.
In considering the wage differences noted in the preceding paragraphs and in a following discussion of occupational earnings, it must be emphasized that in a study such as this it is not possible to isolate the influence of each factor as a determinant of wages. To illustrate their interrelationship, establishments with labor-management contracts accounted for a greater proportion of the workers in metropolitan areas than in sm aller communities in half the regions and for a greater proportion of workers in larger than in sm aller establishments in all regions. Furthermore, as indicated previously, the extent of labor-management contract coverage was greatest in the relatively high-wage clay refractories branch of the industry.
Earnings of nearly all production workers were within a range of $1 .25 to $3 .50 an hour, with the middle half of the workers earning between $1.61 and $ 2 .4 4 (table 2). Regionally, the proportions of workers earning less than $1 .50 ranged from nearly two-thirds in the Southwest and three-fifths in the Southeast to less than 1 percent in the Pacific States. Among the m ajor product branches, the distribution of workers within the earnings array varied considerably (tables 3—6). In the Great Lakes region, for example, the relative d ispersions (computed by dividing the interquartile ranges by the rhedians) were 11 p ercent for clay sewer pipe, 22 percent each for brick and structural clay tile and clay refractories, and 27 percent for ceram ic wall and floor tile.
Occupational EarningsThe occupational classifications fo r which data are provided in table 7 a c
counted for nearly three-fifths of the production workers covered by the study. Among these occupations, nationwide averages were lowest for janitors and finishers ($1 .77 and $1 .78 ) and highest for maintenance machinists and e le c tricians ($2 .6 7 and $ 2 .6 8 ).
Digitized for FRASER http://fraser.stlouisfed.org/ Federal Reserve Bank of St. Louis

6
A fifth of the production workers were employed as kiln loaders (placers or setters), unloaders or drawers, and firem en— jobs relating to the burning or "firin g1' of the product. Nationwide, average hourly earnings were nearly identical fo r periodic kiln setters and drawers ($2 .41 and $2. 39) and for tunnel kiln placers and unloaders ($ 2 .1 5 and $ 2 .1 6 ); firem en, workers regulating the temperatures of these kilns, averaged $2 and $1 .96 , respectively. Firem en of periodic and tunnel kilns also averaged less than those loading and unloading such kilns in all regions, except the P acific. In m ost regions, setters of periodic kilns averaged m ore than drawers, while unloaders of tunnel kilns averaged m ore than the p lacers.
O ff-bearers, nearly 4,000 in number, averaged $1 .98 an hour. Regional averages for o ff-bearers, workers handling products both before and after the burning process, ranged from $ 1.44 in the Southwest and $ 1. 45 in the Southeast to $2 .39 in the Great Lakes.
With few exceptions, incentive workers averaged m ore than tim e-rated workers in the same occupational classification (table 14). Regionally, incentive workers usually averaged at least 30 cents an hour m ore than counterpart workers paid on an hourly rate basis.
Occupational averages varied among the product branches studied separately (tables 8 through 11). In the Great Lakes, the only region permitting com parisons for all four product branches, occupational averages usually were higher in clay refractories or brick and structural clay tile than in ceram ic wall and floor tile or clay sewer pipe. A sim ilar relationship held even when com parisons were lim ited to a single State, as illustrated in the following tabulation for selected occupations in Ohio.
Pay relatives for selected occupations in Ohio (Clay sewer pipe average hourly eamings=100)
OccupationsBrick and structural
Ceramic wall and Clay
(men) clay tile floor tile refractories
Dry-pan operators------------- 118 123 113Kiln firemen (tunnel)--------- 104 91 111Kiln placers (tunnel)---------- 114 120 110Kiln unloaders (tunnel)------- 123 107 115Maintenance men, general
utility-------------------------- 104 105 112Off-bearers---------------------- 134 106 117Pugmill men------------------- 129 114 110Truckers, hand---------------- 120 95 114Truckers, power
(foiklift)......................... - 114 97 117
Occupational averages were usually higher in metropolitan areas than in sm aller communities in the Southeast and Great Lakes regions. In the Middle Atlantic, Southwest, and Middle West, the other regions where com parisons could be made, the reverse was usually true (table 12). Averages for workers in the same job classification were usually higher in larger than in sm aller establishments (table 13), and in establishments with a m ajority of their workers covered by labor-m anagem ent agreements than in those without such coverage even when com parisons were lim ited to the same community or establishment size group.
Digitized for FRASER http://fraser.stlouisfed.org/ Federal Reserve Bank of St. Louis
7
Earnings of individual workers varied greatly within the same job and State (tables 15—27). F or some jobs, particularly those typically paid under incentive system s, there was considerable earnings dispersion even in the same establishment. In several instances, the difference between the highest and lowest paid worker in the same establishment and job exceeded $ 1 an hour.
Establishment Practices and Supplementary Wage Provisions
Data were also obtained on certain establishment practices, including shift differentials for production workers, work schedules, and selected supplementary wage benefits such as paid holidays; paid vacations; and health, insurance, and pension plans for production and office w orkers.
Scheduled Weekly Hours. Work schedules of 40 hours a week were in effect in plants employing approximately four-fifths of the production and office workers in the industry at the time of the study (table 30). Work schedules tended to be somewhat longer in brick and structural clay tile plants than in the other branches of the industry (table 31).
Shift Provisions and P ractices . Provisions for late shifts, usually p ro viding differential pay, were recorded in establishments employing slightly m ore than three-fourths of the production workers (table 32). Such provisions were less frequently recorded in brick and structural clay tile than in the other branches (table 33).
Only an eighth of the workers covered by the survey were employed on late shifts at the time of the survey (table 34). These workers usually received differentials, m ost commonly 8 cents an hour for the second shift and 12 cents for third or other late shifts. Among the four product branches, the proportions of workers on late shifts, as well as the differentials paid, varied considerably (table 35). In the Great Lakes region, for example, the proportions of workers on late shifts ranged from less than a tenth in brick and structural clay tile to a fifth in ceram ic wall and floor tile; also in this region, shift differentials were usually paid in ceram ic wall and floor tile and clay refractories, but not in the other two groups.
Paid Holidays. Paid holidays, usually 6 or 7 annually, were provided by establishments employing slightly m ore than four-fifths of the production workers and m ore than nine-tenths of the office workers (table 36). Regionally, the proportions of production workers in such establishments ranged from three- fifths in the Southeast and Southwest to all or nearly all in the Middle Atlantic, Middle West, and P acific. Paid holiday provisions usually applied to a sm aller proportion in brick and structural clay tile than in the other branches (table 37). This relationship is illustrated in the Southeast, where holiday provisions applied to approximately two-fifths of the workers in brick and structural clay tile, compared with m ore than nine-tenths in ceram ic wall and floor tile and clay sewer pipe.
Paid Vacations. Paid vacations after qualifying periods of service were available to slightly m ore than nine-tenths of the production workers covered by the study (table 38). A large m ajority were eligible for 1 week's pay after 1 year of service and 2 weeks' pay after 5 years. Slightly m ore than half of the workers were eligible for at least 3 weeks' pay after 15 years of service . Vacation provisions, usually 2 weeks' pay after 1 year and at least 3 weeks' pay after 15 years, applied to almost all of the office w orkers.
Digitized for FRASER http://fraser.stlouisfed.org/ Federal Reserve Bank of St. Louis
8
Virtually all of the production workers in three of the product branches and about seven-eighths of those in brick and structural clay tile were in establishments providing paid vacations (table 39). In the latter branch, the prop ortions ranged from two-thirds in the Southwest to virtually all in the Middle Atlantic, Great Lakes, and P acific regions. The amount of vacation pay in each branch also varied among the regions. In brick and structural clay tile, for example, provisions for m ore than 2 weeks were not found in the Border States and Southwest; provisions for 3 weeks or m ore after 15 years* service, however, applied to about seven-eighths of the workers in the Pacific region.
Vacation payments usually were based on the employee* s regular pay for a specified length of time in brick and structural clay tile and ceram ic wall and floor tile; a percentage of earnings usually was the basis for payment in clay refractories and clay sewer pipe.
Health, Insurance, and Pension Plans. Life, hospitalization, and surgical insurance, for which em ployers paid all or part of the cost, were available to at least nine-tenths of the production workers (table 40). Accidental death and dismemberment insurance, sickness and accident insurance, and m edical insurance applied to about two-thirds. These benefits generally applied to sim ilar proportions of the office w orkers. Catastrophe insurance, however, applied to two-fifths of the office workers compared with one-fifth of the production w orkers; and sick leave with full pay and no waiting period covered three-tenths of the office w orkers, but rarely covered production w orkers.
Pension plans, providing regular payments upon retirem ent for the re mainder of the worker* s life (in addition to Federal socia l security benefits) were provided by establishments employing two-fifths of the production workers and one-half of the office w orkers.
The incidence of these health, insurance, and pension plans varied by region and by product branch (table 41). In ceram ic wall and floor tile, for example, establishments providing sickness and accident insurance, employed a fourth of the production workers in the Southeast and seven-eighths in the Great Lakes; corresponding proportions in clay sewer pipe were slightly m ore than two-fifths and virtually all of the w orkers.
Nonproduction Bonuses. Nonproduction bonuses, usually Christmas or yearend, were provided by establishments employing slightly m ore than a third of the production workers and nearly two-fifths of the office workers (table 42). Provisions fo r nonproduction bonuses applied to a m ajority of the production workers in ceram ic wall and floor tile and clay sewer pipe, compared with a third of the workers in brick and structural clay tile and less than a tenth in clay refractories (table 43). In ceram ic wall and floor tile, nonproduction bonuses were recorded principally in the Middle Atlantic, Southwest, and Great Lakes regions; in clay sewer pipe, they were recorded principally in the Great Lakes.
Digitized for FRASER http://fraser.stlouisfed.org/ Federal Reserve Bank of St. Louis

Table 1. Average Hourly Earnings: By Selected Characteristics
(N um ber and a vera g e stra ig h t-t im e hourly e a rn in g s1 o f p ro d u c tio n w o rk e r s in stru ctu ra l c la y p ro d u c ts m anufacturing esta b lish m en tsby se le c te d c h a r a c te r is t ic s , United States and s e le c te d re g io n s , J u ly -A u gu st 1964)
United States2 Middle At lant ic B o r d e r States Southeast Southwest G re a t Lakes Midd le West Mountain P a c i f i c
ItemN u m berof
w o r k ers
A v e r age
hour lye a r n ings
Num berof
w o r k ers
A v e r - age
hou r ly e a r n ings
N u m bero f
w o r k ers
A v e r age
hour lye a r n ings
N u m b erof
w o r k ers
A v e r age
hou r ly e a r n ing s
N u m bero f
w o r k e rs
A v e r - age
hour ly e a r n ing s
N u m berof
w o r k e rs
A v e r - age
hou r ly e a r n ings
N u m berof
w o r k ers
A v e r age
hour lye a r n ings
N u m bero f
w o r k e rs
A v e r age
hou r lye a r n ings
N u m b erof
w o r k er s
A v e r - age
hour ly e a rn ings
A l l w o r k e r s 3________________________________________ 51 ,3 24 $2. 08 7 ,644 $2. 38 3, 307 $2. 07 9 ,9 2 9 $1. 54 5 ,4 3 7 $1. 51 14,561 $2. 29 4, 542 $2. 36 1 ,610 $2. 27 3, 832 $2. 43M e n __________________________________ _____ _______ 47 ,5 77 2. 10 6, 825 2. 44 3, 199 2. 09 9, 247 1. 54 4, 981 1. 51 13, 335 2. 33 4 ,5 1 8 2. 36 1,609 2. 27 3, 444 2. 49W o m e n ___________________________________________ 3, 747 1. 78 819 1. 94 108 1. 63 682 1. 48 456 1. 42 1, 226 1. 90 24 1. 87 - - 388 1. 98
M a j o r produc t :B r i c k and s t r u c b i r a l c lay ti le . _ 23, 274 1. 91 2,830 2. 41 1, 669 1. 74 6 ,491 1. 46 3, 632 1. 44 4, 839 2. 39 1,041 1. 89 1, 264 2. 24 1, 144 2. 52C e r a m i c w a l l and f l o o r ti le 9 ,8 05 1. 97 2, 046 2. 12 - - 1,601 1. 66 1 ,022 1. 49 3, 260 2. 08 _ _ _ 1 ,414 2. 24C lay r e f r a c t o r i e s ______________________________ 9 ,421 2. 51 2, 218 2. 61 - - - - _ _ 2, 093 2. 46 2, 727 2. 59 _ _C lay s e w e r p i p e ________________________________ 7, 277 2. 21 * - " - 1,151 1. 63 - - 3, 309 2. 35 - - - 1 ,046 2. 56
Siz e o f com m unity :M e tr o p o l i ta n a r e a s 4 ___ 2 3,463 2. 11 3, 104 2. 32 1 ,620 2. 03 4, 647 1. 57 2, 026 1. 51 5 ,5 41 2. 39 1, 242 2. 26 1 ,486 2. 27 3, 520 2 .4 2No n m e tro po l it a n a r e a s .... . . 27,861 2. 05 4, 540 2. 42 1 ,687 2. 11 5, 282 1. 51 3,411 1. 50 9, 020 2. 23 3, 300 2. 40
Size o f e s tabl is hm ent :20—99 w o r k e r s _ _ ............ . ... . 18,449 2. 02 2, 711 2. 36 1, 524 1. 85 1 ,449 1. 64 3, 233 1 .40 6, 099 2. 25 1, 331 1. 97 _ _ 1, 181 2. 39100 w o r k e r s o r m o r e ......................... 32,875 2. 1 1 4 ,9 33 2. 39 1, 783 2. 26 8 ,4 80 1. 52 2, 204 1. 67 8, 462 2. 33 3, 211 2. 52 - - 2, 651 2. 45
L a b o r - m a n a g e m e n t co n tr ac ts : E s ta b l i sh m e n t s with—
M a j o r i t y o f w o r k e r s c o v e r e d _____________ 33, 241 2. 31 6, 820 2. 43 2, 125 2. 25 2, 560 1. 80 1, 271 1. 74 11,585 2. 34 4, 392 2. 38 1, 268 2. 33 2, 947 2. 51None o r m in o r i t y o f w o r k e r s c o v e r e d ___ 18,083 1. 66 1, 182 1. 76 7, 369 1. 45 4, 166 1. 44 2, 976 2. 11
'
885 2. 19
1 E x c lu d e s p r e m iu m pay f o r o v e r t i m e and fo r w o rk on w eekend s, ho l id ays , and late shi fts.2 Inc ludes data fo r New England reg ion in addition to those shown se parate ly .3 Inc ludes data fo r m a j o r p r o d u c t c las s i f i c a t i o n s in addition to those shown sep arate ly .4 Standard M e tr o p o l i ta n S tati st i ca l A r e a s as def ined by the U.S . Bur eau o f the Budget in 1961.
NO TE: D ashes in dic ate no data re p o r t e d or data that do not m e e t pu bl ica t ion c r i t e r ia .
CD
Digitized for FRASER http://fraser.stlouisfed.org/ Federal Reserve Bank of St. Louis
Table 2. Earnings Distribution: Structural Clay Products o(Percent distribution of production 'orkers in structural clay products manufacturing establishments by average straight-tim e hourly earn in gs,1
United States and selected regions, July—August 1964)
Average hourly earnings1
United States2MiddleAtlantic
BorderStates Southeast Southwest Great
LakesMiddle
W est Mountain PacificTotal Men Women
Under $1. 2 5 ................ .................................. .......... 0. 4 0. 4 0. 1 _ 0. 1 3. 6 _ _ - -
$1. 25 and under $1. 30_____________________ 9. 7 9. 7 10. 4 0. 6 6. 3 30. 4 28. 9 0. 8 0. 2 0. 1 0. 1$1. 30 and under $ 1 .3 5 _____________________ 2 .9 2. 8 3. 0 . 2 5. 7 7. 5 8. 3 . 4 . 2 - -$1. 35 and under $1. 40_____________________ 3. 1 2. 7 7. 7 . 6 1. 3 9. 0 9. 8 . 4 . 3 . 2 (3)$1. 40 and under $1. 45 ___ _ _____ 2. 6 2. 3 6. 4 1. 0 2. 4 6. 1 9. 4 . 2 . 3 . 2 . 1$1. 45 and under $1. 50_ _ _ ______ 2. 1 2. 0 3. 6 . 2 1.9 5. 8 4. 9 . 8 . 9 . 5 (3)
$1. 50 and under $1. 60_____________________ 3. 9 3. 6 8. 0 1. 4 4. 6 8. 2 7. 4 2. 6 1. 1 . 7 1. 7$1. 60 and under $1. 70_____________________ 4. 5 4. 4 5. 0 1. 1 7. 2 9. 1 7. 4 1.9 5. 7 4. 8 1. 3$1. 70 and under $1. 80_____________________ 4. 4 4. 0 9. 7 2. 7 8. 5 6. 1 4. 3 4. 0 4. 2 3. 6 2. 4$ 1 .8 0 and under $1. 9 0 _____________________ 4. 5 4. 1 9. 0 2. 1 7. 7 4. 5 4. 3 4. 6 8. 3 2. 9 2. 2$1. 90 and under ’$2. 00_____________________ 5. 0 5. 0 4. 9 7. 1 5. 7 2. 7 2. 5 7. 0 2. 6 6. 9 3. 7
$2. 00 and under $2. 10_____________________ 8. 2 8. 1 9. 2 13. 7 3. 3 2. 0 2. 3 14. 9 3. 9 5. 7 5. 8$2. 10 and under $2. 20_____________________ 8. 7 8. 7 9. 0 10. 6 4. 1 1. 7 1. 3 14. 8 3. 1 27. 7 1 1. 8$2. 20 and under $2. 30_____________________ 6. 4 6. 5 4. 7 6. 5 8. 6 1. 2 1. 9 8. 6 10. 7 10. 7 8. 0$2. 30 and under $2. 40____________ _________ 5. 8 6. 0 3. 6 7. 8 '6. 0 1. 0 . 8 7. 7 11. 3 4. 2 8. 3$2. 40 and under $2. 50_____________________ 6. 3 6. 7 1. 8 7. 5 4. 9 1 .0 . 5 7. 0 14. 1 8. 0 14. 6
$2. 50 and under $2. 60_____________________ 5. 5 5. 8 1. 8 9 .4 7. 0 1. 3 . 5 5. 6 7. 6 8. 5 11. 1$2. 60 and under $2. 70_____________________ 3. 6 3. 8 . 5 5. 8 3. 3 . 6 . 3 4. 0 7. 4 5. 3 5. 4$2. 70 and under $2. 80_____________________ 2. 5 2. 6 . 6 2. 9 3. 0 . 7 . 1 2. 5 3. 7 3. 5 6. 7$2. 80 and under $2. 90_____________________ 2. 1 2. 2 . 7 4. 1 1. 0 . 2 . 1 2. 3 3. 6 1. 3 4. 8$2. 90 and under $3. 00_____________________ 1 .9 2. 0 . 2 3. 4 2. 1 . 3 . 3 2. 1 3. 3 1. 0 3. 0
$3. 00 and under $3. 10--------------------------------- 1. 1 1. 2 . 1 2. 5 . 3 . 1 . 1 1. 3 1. 5 1. 0 1. 9$3. 10 and under $3. 20--------------------------------- 1. 1 1. 2 . 1 3. 0 . 5 . 1 (3) 1. 3 1. 0 . 7 1. 8$3. 20 and under $3. 30-------------------------------- . 9 . 9 - 1. 7 . 8 . 1 . 1 1. 0 . 8 . 1 2. 1$3. 30 and under $3. 40--------------------------------- . 6 . 7 - .9 . 7 0
. 1 . 8 1. 1 . 7 . 9$3. 40 and under $3. 50--------------------------------- . 3 . 4 . 9 . 8 (3) (3) . 2 . 5 . 3 . 5
$3. 50 and over---------------------------------------------- 1 .9 1.9 _ 2. 4 2. 5 . 1 . 6 3. 3 2. 4 1. 2 1. 6
T o t a l__________________________________ 100. 0 100. 0 100. 0 100. 0 100. 0 100. 0 100. 0 100. 0 100. 0 100. 0 100. 0
Number of w orkers-------------------------------------- 51, 324 47 ,577 3, 747 7 ,6 4 4 3, 307 9 ,9 29 5 ,4 37 14,561 4, 542 1,610 3, 832A verage hourly earnings1--------------------------- $2. 08 $2. 10 $1. 78 $2. 38 $2. 07 $1. 54 $1. 51 $2. 29 $2. 36 $2. 27 $2. 43
1 Excludes premium pay for overtim e and for work on weekends, holidays, and late shifts.2 Includes data for New England region in addition to those shown separately.3 L ess than 0. 05 percent.
N O T E : B e ca u se o f rou n d in g , sum s o f in d iv idu a l item s m ay not equal totals.
Digitized for FRASER http://fraser.stlouisfed.org/ Federal Reserve Bank of St. Louis
Table 3. Earnings Distribution: Brick and Structural Clay Tile
(P e rc e n t d is tr ib u tio n of p rodu ction w o rk e rs in b r ic k and stru ctu ra l c la y t ile m anufacturing e s ta b lish m en ts by a vera g e s tra ig h t-t im e h ou r ly ea rn in gs , 1United States and s e le c te d re g io n s , July—A ugust 1964)
Average hourly earnings 1United States 2
MiddleAtlantic
BorderStates Southeast Southwest Great
LakesMiddle
W est Mountain PacificT otal Men W omen
Under $ 1 .2 5 ---------------------------------------------------- 0.7 0.6 2.7 _ . 0.1 4.0 .
$ 1.25 and under $ 1 .30---------------------------------- 18.4 18.1 83.6 0.2 12.4 41.9 36.8 0.2 0.1$ 1 .3 0 and under $ 1 .35___________________ __ 5.1 5.1 .9 _ 11.3 9.9 9.6 _ 0.8 _$ 1 .3 5 and under $ 1 .40______________________ 3.7 3.7 5.5 .3 2.5 7.7 8.2 _ 1.4 .3 _$ 1.40 and under $ 1 .45______________________ 3.2 3.2 1.8 _ 4.7 5.8 7.5 . 1 1.2 .3$ 1.45 and under $ 1 .50______________________ 2.8 2.8 - 3.8 4.5 4.4 1.7 3.9 .6 -
$ 1.50 and'under $ 1 .60_____________________ 4.9 4.9 . 1.5 9.1 6.7 8.5 2.7 4.2 .9$ 1 .6 0 and under $ 1.70______________________ 5.3 5.3 _ 1.3 10.8 7.1 5.6 1.0 21.9 6.2 _$ 1.70 and under $ 1 .80.......................................... 4 .0 4.0 1.8 3.2 8.6 4.7 3.4 1.7 9.5 4.6 _$ 1.80 and under $ 1 .90____ _______ _______ 3.8 3.9 .9 2.4 10.4 2.1 4.2 1.0 24.2 3.7 _$ 1 .9 0 and under $ 2 .0 0______ _________ 4.7 4.8 .9 9.4 6.7 2.0 2.2 7.4 5.6 7.7 -
$ 2.00 and under $ 2 .1 0______________________ 5.8 5.8 1.8 17.2 2.4 2.0 2.5 9.0 4.8 2.8 2.6$ 2 .1 0 and under $ 2 .2 0______________________ 9.0 9.0 - 9.4 6.5 1.5 1.2 15.6 5.5 32.3 24.7$ 2.20 and under $ 2 .3 0______________________ 4.4 4.4 - 3.9 1.9 1.1 .7 10.1 4.9 6.7 9.4$ 2.30 and under $ 2 .4 0__ ___ __ ___ __ 3.5 3.5 - 3.4 2.4 .3 .5 9.0 2.8 3.1 9.3$ 2.40 and under $ 2 .5 0________ _______ _ _ 4.1 4.2 - 5.7 1.3 .5 .2 10.5 2.3 8.1 5.8
$ 2 .50 and under $ 2 .6 0_________ ___________ 4.1 4.1 _ 11.1 .7 1.0 .2 5.4 1.3 8.8 13.8$ 2.60 and under $ 2 .7 0______________________ 2.4 2.4 _ 5.7 .2 .3 .2 4.8 2.6 4.2 3.9$ 2.70 and under $ 2 .8 0____________________ _ 1.5 1.5 _ 2.0 .5 .2 _ 2.5 .3 3.2 9.9$ 2.80 and under $ 2 .9 0______________________ 2.1 2.1 _ 7.1 .2 .1 _ 3.5 .6 1.4 6.9$ 2.90 and under $ 3 .00__ _________ ______ 1.2 1.2 - 1.8 - . 1 - 3.4 1.1 .2 2.4
$ 3.00 and under $ 3 .1 0______________________ 1.2 1.2 _ 4.0 . .1 (3) 2.3 .2 1.3 1.0$ 3 .1 0 and under $ 3 .2 0-------------------- ----------- 1.2 1.2 _ 3.5 .7 . 1 2.5 _ .6 2.1$ 3.20 and under $ 3 .30______________________ . 9 . 9 _ 1.8 1. 1 . 1 .1 1.7 .3 . 2 2.4$ 3.30 and under $ 3 .4 0---------------------------------- .4 .4 _ .5 . 2 _ .1 . 9 _ . 9 2.0$ 3.40 and under $ 3 .5 0---------------------------------- .4 .4 - 2.1 .4 - - .3 .3 .4 1.0
$ 3 .5 0 and over_______________________________ 1.4 1.4 _ 2.7 1.3 (3) . 1 3.0 .3 1.4 2.7
T otal____________________________________ 100.0 100.0 100.0 100.0 100.0 100.0 100.0 100.0 100.0 100.0 100.0
Number of w orkers__________________________Average hourly earnings 1__________ _____
23 ,274 $ 1.91
23, 164 $ 1.91
n o $ 1 . 2 9
2, 830 $ 2.41
1, 669 $ 1.74
6, 491 $ 1.46
3, 632 $ 1.44
4, 839 $ 2.39
1, 041 $ 1.89
1, 264 $ 2.24
1, 144 $ 2.52
1 E x clu d es p re m iu m pay fo r o v e rt im e and fo r w ork on w eekends, h o lid a y s , and late sh ifts .2 Includes data fo r New E ngland re g io n in addition to those shown se p arate ly .3 L e ss than 0.05 p e rce n t.
N O T E : B e ca u se of rounding, sum s of individual item s m ay not equal tota ls .
Digitized for FRASER http://fraser.stlouisfed.org/ Federal Reserve Bank of St. Louis

Table 4. Earnings Distribution: Ceramic Wall and Floor Tile 10(Percent distribution of production workers in ceram ic wall and floor tile manufacturing establishments by average
straight-tim e hourly earnings,1 United States and selected regions, July—August 1964)
Average hourly earnings1United States2
MiddleAtlantic Southeast Southwest Great
Lakes PacificTotal Men W omen
Under $ 1 .2 5 ............................ _ . . . . . . .
$ 1 .2 5 and under $1. 30 _ . ... . . . 4. 5 2. 7 7. 9 1. 9 5. 9 22. 1 2. 5 0. 4$1. 30 and under $1. 35 2. 0 1. 4 3. 0 . 5 3. 5 10. 0 . 8 _$1. 35 and under $1. 40 _ __ 4. 7 2. 9 7. 9 2. 0 19. 4 9. 1 . 5 . 1$1. 40 and under $1. 45 .. _ _ 4. 7 3. 6 6. 7 3. 7 9. 3 20. 7 . 8 . 1$ 1 .4 5 and under $ 1 .5 0 . _ 2 .9 2. 5 3. 7 . 9 11. 6 4. 6 1. 0 . 1
$1. 50 and under $1. 60____________________________ 6. 0 4. 8 8. 3 2. 8 11. 1 6. 0 6. 9 4. 6$1. 60 and under $1. 70 5. 8 6. 3 5. 0 2. 1 9. 7 9 .7 4. 7 3. 4$1. 70 and under $1. 80____________________________ 7. 5 6. 3 9. 8 5. 5 5. 0 6. 8 8. 8 6. 4$1. 80 and under $1. 9 0 ____________________________ 6. 7 5. 4 9. 2 4. 5 2. 6 4. 5 10. 4 4. 7$ 1 .9 0 and under $2. 00____________________________ 7. 3 8. 7 4. 9 9. 0 2. 7 1. 5 8. 7 9. 5
$2. 00 and under $2. 10 10. 2 10. 5 9. 6 15. 5 2. 4 1. 5 12. 3 12. 2$2. 10 and under $2. 20 _ _ 8. 8 8. 4 9. 4 15. 3 2. 6 . 6 9. 7 11. 5$2. 20 and under $2. 3 0 ____ _ 5. 5 5. 8 4. 9 8. 0 1. 6 . 6 5. 4 11. 5$2. 30 and under $2. 40 5. 1 6. 0 3. 6 5. 8 3. 4 . 5 7. 4 5. 2$2. 40 and under $2. 50 _ _ 4. 0 5. 1 1.9 6. 5 3. 1 . 2 3. 6 5. 2
$2. 50 and under $2. 60______________________ ______ 4. 2 5. 5 1. 9 5. 0 2. 4 1. 2 4. 6 5. 9$2. 60 and under $2. 70____________________________ 2. 2 3. 2 . 6 2. 5 . 7 . 4 3. 0 3. 7$2. 70 and under $2. 80____________________________ 2. 2 3. 0 . 6 3. 3 1. 3 . 2. 1 3. 8$2. 80 and under $2. 90 1. 6 2. 0 . 8 1. 4 . 8 . 1 2. 5 2. 1$2. 90 and under $3. 00 1. 5 2. 3 . 2 1. 4 . 2 - 2. 4 2. 8
$3. 00 and under $3. 10 . 8 1. 2 . 1 . 9 . 1 . 1 . 7 2. 2$3. 10 and under $3. 20 _ . _ _ . . 4 . 6 . 1 . 2 . 2 _ . 4 1. 3$3. 20 and under $3. 30____________________________ . 3 . 5 _ . 4 . 1 _ . 2 . 9$3. 30 and under $3. 40____________________________ . 3 . 4 _ . 3 . 2 _ . 4 . 4$3. 40 and under $3. 50 ... .. _ __ . 2 . 2 - . 4 . 1 - (3) . 3
$3. 50 and over . . . . 5 . 7 _ . 3 _ _ . 4 1. 8
Total__________________________________________ 100. 0 100. 0 100. 0 100. 0 100. 0 100.0 100. 0 100. 0
Number of w orkers________________________________ 9 ,8 05 6, 288 3, 517 2, 046 1,601 1,0 22 3, 260 1 ,414Average hourly earnings1_________________________ $1 .97 $2. 08 $1. 79 $2. 12 $1. 66 $1 .49 $2. 08 $2. 24
1 Excludes premium pay for overtime and for work on weekends, holidays, and late shifts.2 Includes data for regions in addition to those shown separately.3 L ess than 0. 05 percent.
N O T E : B e ca u s e o f rou n d in g , sum s o f in d iv idual item s m ay not equal to ta ls .
Digitized for FRASER http://fraser.stlouisfed.org/ Federal Reserve Bank of St. Louis
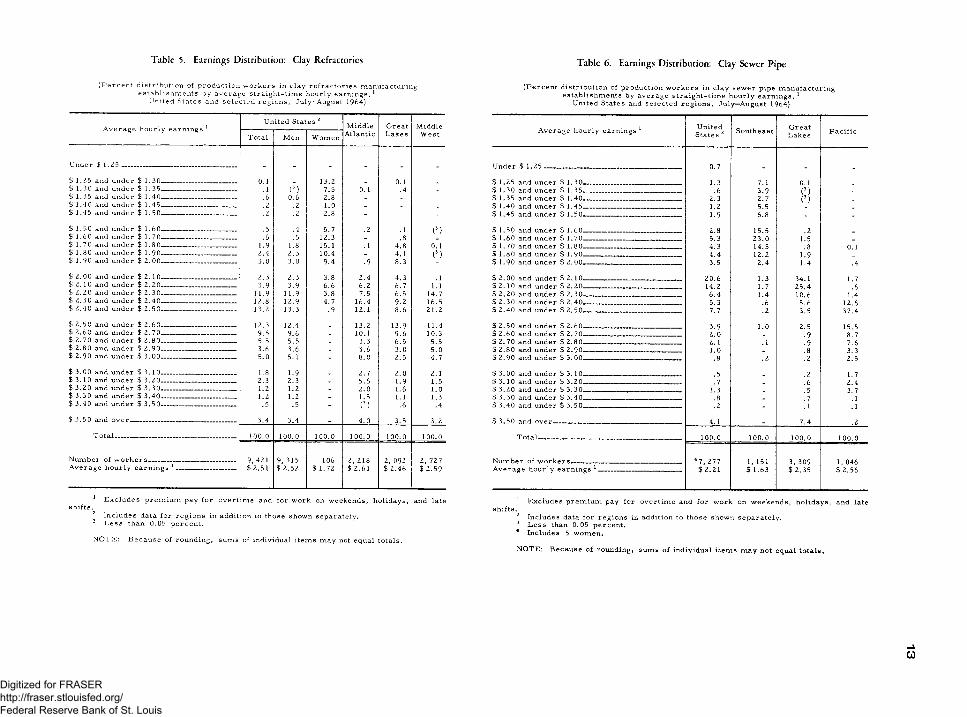
Table 5. Earnings Distribution: Clay Refractories
(P e rc e n t d is tr ib u tio n of p ro d u c tio n w o rk e rs in cla y re fr a c to r ie s m anufacturing esta b lish m e n ts by a vera g e stra ig h t-t im e h ou rly earn in gs , 1
U nited States and s e le c te d re g io n s , July—August 1964)
Average hourly earnings 1United States 2 Middle
AtlanticGreatLakes
MiddleWestTotal Men W omen
Under $ 1 .2 5 _____________________________ .
$ 1.25 and under $ 1.30______________________ 0.1 13 .Z 0.1$ 1.30 and under $ 1.35______________________ .1 (3") 7.5 0.1 .4 _$ 1.35 and under $ 1.40______________________ .6 0.6 Z.8 _ _ _$ 1.40 and under $ 1 .45___________________ __ .Z .Z 1.0 _ _ _$ 1.45 and under $ 1 .50 . ____________________ .z .2 Z.8 - - -
$ 1.50 and under $ 1.60_ __ .5 .4 5.7 .2 .1 (3)$ 1 .6 0 and under $ 1.70__ _ ...... .6 .5 1Z. 3 _ .8$ 1 .7 0 and under $ 1.80 ... .. 1.9 1.8 15.1 .1 4.8 0.1$ 1 .8 0 and under $ 1.90 _ ... . Z.4 Z. 3 10.4 _ 4.1 (3)$ 1.90 and under $ Z .00______________________ 3.0 3.0 9.4 .9 8.3
$ Z. 00 and under $ Z. 1 0______________________ Z. 3 Z. 3 3.8 Z.4 4.3 .1$ Z. 1 0 and under $ Z. Z0___________ _________ 3.9 3.9 6.6 6.Z 6.7 1.1$ Z.Z0 and under $ Z .30______________________ 11.9 11.9 3.8 7.5 6.5 14.7$ Z.30 and under $ Z .40______________________ 1Z.8 1Z.9 4.7 16.4 9.Z 16.5$ Z.40 and under $ Z .50______________________ 13.Z 13.3 .9 1Z.1 8.6 Zl.Z
$ Z.50 and under $ 2.80 . _ 1Z.3 1 Z.4 13 .Z 13.9 11.4$ Z.60 and under $ Z.70 _ . .. 9.5 9.6 _ 10.1 9.6 10.3$ Z.7 0 and under $ Z .80______________________ 5.5 5.5 . 3.3 6.5 5.5$ Z.80 and under $ Z .90______________________ 3.6 3.6 _ 3.6 3.0 5.0$ Z.90 and under $ 3 .0 0______________________ 5.0 5.1 - 8.0 Z. 5 4.7
$ 3 .0 0 and under $ 3 .1 0 _________________T____ 1.8 1.9 Z.7 Z.O Z. 1$ 3 .1 0 and under $ 3. Z0______________________ Z. 3 Z. 3 _ 5.6 1.9 1.5$ 3.Z0 and under $ 3.30_ l.Z l.Z _ Z.O 1.6 1.0$ 3.30 and under $ 3 .4 0______________________ l.Z l.Z _ 1.5 1.1 1.3$ 3.40 and under $ 3 .5 0____________________ _ .5 .5 - (3) .6 .4
$ 3 .5 0 and o v e r ________ - . . .. . . . 3.4 3.4 4.0 3.5 3. Z
Total---------------- ------------------------------------ 100.0 100.0 100.0 100.0 100.0 100.0
Number of w orkers___ __ ________ ______ 9, 4Z1 9, 315 106 Z, Z18 Z, 093 Z, 7Z7Average hourly earnings 1____________ ___ $ Z.5 1 $ Z.5Z $ 1.7Z $ Z.61 $ Z.46 $ Z.59
1 E x clu d e s p re m iu m pay fo r o v e rtim e and fo r w ork on w eekends, h o lid a y s , and latesh ifts .
2 In clu des data fo r r e g io n s in addition to those show n sep arate ly .3 L e s s than 0.05 p e rce n t.
N O T E : B e ca u se o f roun din g, sum s o f individual item s m ay not equal tota ls .
Table 6. Earnings Distribution: Clay Sewer Pip<
(P e rc e n t d istr ib u tio n o f p ro d u ction w o rk e r s in c la y se w e r pipe m anufacturing e s ta b lish m en ts by a vera g e s tra ig h t -t im e h o u r ly ea rn in gs , 1
U nited States and s e le c te d re g io n s , July—August 1964)
A v e ra g e h ou r ly earn in gs 1 United States 2 S outheast G reat
L akes P a c if ic
Under $ 1 .Z 5 .................................................................... ........ 0.7 .
$ 1.Z5 and under $ 1 .30______ _________________ 1.3 7.1 0.1$ 1.30 and under $ 1 .35___________ ______ ______ .6 3.9 (3) _$ 1.35 and under $ 1 .40_____ ______ _________ Z. 3 Z.7 (3) _$ 1 .4 0 and under $ 1 .45___________________ ____ _ l.Z 5.5 _$ 1 .4 5 and under $ 1.50_____________________________ 1.9 6.8 - -
$ 1 .5 0 and under $ 1 .60_____________________________ Z.8 15.5 . 2$ 1 .6 0 and under $ 1 .70_____________________________ 5.3 Z3.0 1.5 _$ 1 .7 0 and under $ 1 .80_____________________________ 4.3 14.5 .8 0.1$ 1 .8 0 and under $ 1 .90____ ___ ___ 4.4 1Z.Z 1.9 _$ 1.90 and under $ Z. 00 . _ _ _____ _____ ______ _ 3.5 Z.4 1.4 .4
$ Z.00 and under $ Z .10___________ _________ ____ Z0.6 1.3 34.1 1.7$ Z. 10 and under $ Z.Z0____ ___________ _____________ 14. Z 1.7 Z5.4 .6$ Z.Z0 and under $ Z .30_____ ____________________ 6.4 1.4 10.6 1.4$ Z.30 and under $ Z .40_____________ ______________ 5.3 .6 5.6 12.6$ Z.40 and under $ Z .50_____________________________ 7.7 . 2 3.5 37.4
$ Z.50 and under $ 2 .80 3.9 1.0 Z. 5 15.5$ Z.60 and under $ Z .70_________ ________________ Z.O _ .9 8.7$ Z.70 and under $ Z .80_____________________________ Z .l .1 .9 7.6$ Z .80 and under $ Z .90___ ______ ______ „ ____ 1.0 _ .8 3.3$ Z .90 and under $ 3 .00__________________________ __ .8 . 2 . 2 2.5
$ 3 .0 0 and under $ 3 .1 0 -------- _ ________________ .5 . 2 1.7$ 3 .10 and under $ 3 .Z0______ _ _____ ______ ___ .7 _ .6 2.4$ 3.Z0 and under $ 3 .30____________ _________________ 1.3 _ .5 3.7$ 3 .30 and under $ 3 .40___________ _____ _____ ___ .8 _ .7 .1$ 3 .40 and under $ 3 .50_____________________________ . 2 - .1 .1
$ 3.50 and o v e r ______________________________________ 4.1 _ 7.4 .2
T o ta l___________________________________________ 100.0 100.0 100.0 100.0
N um ber o f w o r k e r s _________________________________ 4 7, 2 1 1 $ Z.Z1
1, 151 3, 309 1, 046A v e ra g e h ou r ly ea rn in gs 1______________ _ $ 1.63 $ Z. 35 $ 2.56
1 E x clu d es p re m iu m pay fo r o v e rtim e and fo r w ork on w eek en d s, h olida ys, and latesh ifts .
2 Includes data fo r re g io n s in addition to those show n sep a ra te ly .3 L e s s than 0.05 p e rce n t.4 Includes 5 w om en .
N O TE: B e ca u se o f roun din g, sum s o f in d iv idua l item s m ay not equal to ta ls .
Digitized for FRASER http://fraser.stlouisfed.org/ Federal Reserve Bank of St. Louis

Table 7. Occupational Averages: Structural Clay Products
(Number and average straight-time hourly earnings 1 of workers in selected occupations in structural clay products manufacturing establishments,United States and selected regions, July—August 1964)
Occupation and sex
United States 2 Middle Atlantic Border States Southeast Southwest Great Lakes Middle West Mountain PacificNumberof
workers
A verage
hourlyearnings
Numberof
workers
A verage
hourlyearnings
Numberof
workers
A v erage
hourlyearnings
Numberof
workers
A v erage
hourlyearnings
Numberof
workers
A v erage
hourlyearnings
Numberof
workers
A verage
hourlyearnings
Numberof
workers
A verage
hourlyearnings
Numberof
workers
A verage
hourlyearnings
Numberof
workers
A v erage
hourlyearnings
Clay m akers (all men) __ ____________________ 347 $ 2. 23 114 $ 2 .43 26 $ 1 .9 4 43 $ 1.62 21 $ 1. 76 94 $ 2. 31 34 $ 2. 57 14 $ 2. 30Die p ressers (686 men and 19 women)- 705 2. 31 161 2. 51 - - 57 1.69 98 1.73 157 2. 42 97 2. 51 22 $ 2. 34 78 2. 39D ry-pan operators (all men) _____ __________ 554 2. 13 83 2. 37 33 2. 09 58 1.7 0 81 1. 50 155 2. 31 68 2. 30 37 2. 20 35 2. 59E lectrician s, maintenance (all men) —______ _ 201 2. 68 30 2. 90 10 2. 90 38 2. 30 7 2. 11 63 2. 57 33 2. 90 _ _ 14 3. 20Finishers _ ------ -------------------------------------------- 731 1.78 95 1.98 - - 149 1.47 146 1. 38 222 2. 01 28 2. 09 _ _ 41 2. 01
Men — — — ----- -------- ------ 232 2. 12 27 2 .3 4 - - - - 15 1. 53 112 2. 20 21 2. 18 _ _ _ _Vrom en _______________ _____________________________ 499 1.62 68 1. 83 - - 128 1 .46 131 1. 37 110 1.81 _ _ _ _ 36 1.96
Glazing-m achine fe e d e rs__________________________ 388 1.98 94 2. 09 - - 44 1 .82 51 1.4 0 124 2. 18 _ _ _ _ 47 2. 07M en ------------------------------------------------------------------------- 177 2. 12 - - - - 25 2. 00 36 1.43 84 2. 37 _ _ _ _ 23 2.41Women ___ ___ ______________ ____ 211 1.86 92 2. 09 - - 19 1. 59 - - - _ _ _ _ _ 24 1.75
Grinders, clay (all men) ____________________ 519 1.96 57 2. 28 80 2. 09 112 1.46 72 1.45 108 2. 32 56 2. 22 13 2. 01 19 2 .4 6H elpers, maintenance trades (all men) ____ 128 1.89 15 2. 11 - - 35 1. 55 15 1. 54 26 2. 18 15 1.92 _ _ _Janitors (398 men and 51 women) ___ _____ 449 1.77 64 1.93 70 1. 85 80 1.48 57 1. 29 94 1. 83 46 2. 19 10 1. 76 28 2. 06Kiln drawers (periodic kiln) (all m en )---------------- 1, 696 2 .3 9 297 2. 73 74 3. 09 305 1. 54 195 1. 58 639 2. 80 84 2. 35 67 2. 33 35 2. 49Kiln firem en (periodic kiln) (all men) 1, 224 2. 00 262 2. 21 56 2. 07 153 1. 51 86 1.41 458 2. 07 88 1. 89 74 2. 25 35 2. 72Kiln firem en (scove kiln) (all men) — _ _ 124 2. 26 - - - - - - 24 1. 33 29 2. 41 _ _ _ _ 22 2. 15Kiln firem en (tunnel kiln) (all men)---------------------- 1, 394 1 .96 202 2. 25 147 1. 93 343 1. 52 167 1. 55 283 2. 19 99 2. 22 31 2. 12 111 2. 62Kiln loaders (scove kiln) (all m en)- ___ _____ 292 2. 08 - - _ - - - 64 1. 29 56 2. 44 _ _ _ _ 32 3. 26Kiln placers (tunnel kiln) (1, 667 men
and 62 women) __ ----------------------- --------- 1, 729 2. 15 195 2.71 127 1.95 450 1.59 135 1. 67 437 2. 36 249 2. 54 10 2. 78 123 2. 44Kiln setters (periodic kiln) (all men)------------------- 1, 649 2. 41 338 2. 87 101 2. 50 290 1. 52 155 1. 52 553 2. 83 91 2. 38 51 2. 46 55 2. 60Kiln unloaders (tunnel kiln) (1, 804 men
and 4 women) _ — - — ------ — -------- 1, 808 2. 16 214 2. 83 256 2. 07 493 1. 62 232 1. 71 335 2.41 164 2. 98 18 2. 15 93 2. 36M achinists, maintenance (all men) _ ______ 370 2. 67 68 2. 96 40 2. 66 57 2. 28 14 2. 45 89 2. 50 75 2. 85 _ _ 14 3. 23Maintenance men, general utility (all men) —__ 1, 111 2. 22 170 2. 54 111 2. 28 168 1.70 145 1. 66 339 2. 38 69 2. 37 27 2. 36 58 2. 82M echanics, automotive (maintenance)
(all m en). ----- — - ------------- -------------------- _ 271 2. 36 15 2. 37 15 2. 20 71 1.88 18 1. 87 82 2. 41 24 2. 82 6 2. 75 36 3. 07M echanics, maintenance (all m en)----------------------- 283 2. 60 50 2. 70 10 2. 19 55 2. 37 15 1 .7 4 60 2. 50 52 2. 91 10 2. 86 31 2. 99M olders, hand (478 men and 1 woman) __ _ 479 2. 37 118 2. 64 42 2. 10 90 1.6 4 27 1. 75 95 2. 54 79 2. 94 11 2. 29 17 2. 42M olding-machine operators (all men) - _______ 332 2. 48 72 2.4 8 - - 7 1.48 29 1. 41 -62 2. 52 43 2. 69 _ _ 47 2. 71O ff-b e a rers——----------------------------------------------------------- 3, 986 1. 98 363 2. 33 254 2. 03 1, 024 1 .4 5 474 1 .4 4 1, 008 2. 39 223 2. 20 128 2. 10 449 2. 28
Men — —------------------------------------------------------------------ 3, 565 2. 01 346 2. 34 254 2. 03 ‘ 859 1.47 436 1. 45 904 2. 41 220 2. 20 128 2. 10 358 2. 37W om en___ — — _______— _______ _________________ 421 1. 72 - - - - 165 1 .3 5 38 1. 30 104 2. 19 - _ _ _ 91 1. 93
P ackers------------------------------------------------------------------------ 631 1 .98 133 2. 15 - - 78 1 .45 51 1. 37 278 2. 03 26 2. 76 _ _ 14 1.99Men _ — — — — ------ -------- ------ — 409 2. 08 54 2. 23 - - 78 1. 45 7 1. 36 197 2. 16 26 2. 76 _ _ _W om en------------------------------------------------------------------- 222 1 .80 - - - - - - 44 1. 37 81 1.71 _ . _ _ 9 1.91
Pattern mounters (448 women and 2 m en )--------- 450 1 .86 172 1. 82 - - - - - - 174 1 .94 _ _ _ _Pipe turners (all men) --------------- ------------------- 52 2. 37 - - - - - - - - 36 2. 59 . _ _ _ _ _Pow er-shovel operators (all m e n )— - --------- 407 2. 16 31 2. 82 45 2. 39 109 1.7 4 69 1. 63 89 2. 41 20 2. 36 - _ 19 2 .9 3P ressm en, automatic (537 men
and 3 women)— ---------------------------------—------------------- 540 2. 24 94 2. 57 26 2. 40 99 1.81 46 1.65 237 2. 33 _ _ _ _ 23 2. 70Pugm ill men (all men)--------------------------------------------- 739 2. 10 123 2. 43 64 2 .1 5 142 1. 55 90 1. 53 189 2. 41 52 2. 13 31 2. 20 43 2. 56Sorters, brick (681 men and 46 women)------------- 727 1 .85 - - - - 228 1.31 146 1.45 106 2.97 54 2. 06 99 2. 26 40 2. 40Sorters, tile (742 women and 81 m en )---------------- 823 1 .8 0 - - - - 182 1 .39 89 1. 33 267 1.95 _ _ _ _ 141 2. 04'Truckdrivers (all men) 3----------------------------------------- 1, 355 2. 01 81 2. 37 89 1.89 404 1. 56 157 1.4 5 246 2. 33 92 2. 15 163 2. 38 96 3. 01
Light (under IV2 tons) (all m e n )---------------------- 80 2. 04 - - 8 2. 05 6 1. 61 _ _ 32 2. 02 _ _ _ 6 2. 39Medium ( 1 V2 to and including 4 tons)
(all men)_________________________________________ 434 1.88 14 2. 37 23 2. 25 115 1.43 67 1. 39 89 2. 27 49 2. 22 59 2. 09 10 2. 54Heavy (over 4 tons, tra iler type)
(all men)-------------------------------------------------------------- 382 2. 10 - - - - 112 1. 63 68 1.48 42 1. 97 - - 37 2. 71 67 3. 19Heavy (over 4 tons, other than tra iler type)
(all men)________ -____________—___________ ___ 439 2. 05 47 2. 33 33 1.41 171 1. 60 13 1. 55 83 2. 69 11 2. 19 65 2. 47 7 2. 72T ruckers, hand (all m en)------------------------------------- 610 2. 03 51 2. 34 - - 55 1.47 127 1.41 281 2. 27 60 2. 44 _ _ 6 2. 30Truckers, power (forklift) (all m e n )------------------- 2, 353 2. 04 227 2. 31 106 1. 85 450 1.49 270 1. 57 601 2. 25 275 2. 30 108 2. 21 299 2. 45T ru ckers, pawer (other than forklift)
(all m en)------------------------------------------------------------------- 529 2. 17 62 2. 52 70 2. 31 84 1. 50 48 1.47 136 2. 31 86 2. 46 " - 28 2. 63
1 Excludes premium pay for overtim e and for work on weekends, holidays, and late shifts.2 Includes data for New England region in addition to those shown separately.3 Includes drivers operating a combination of the types and sizes of trucks shown separately.
NOTE: Dashes indicate no data reported or data that do not meet publication criteria.
Digitized for FRASER http://fraser.stlouisfed.org/ Federal Reserve Bank of St. Louis
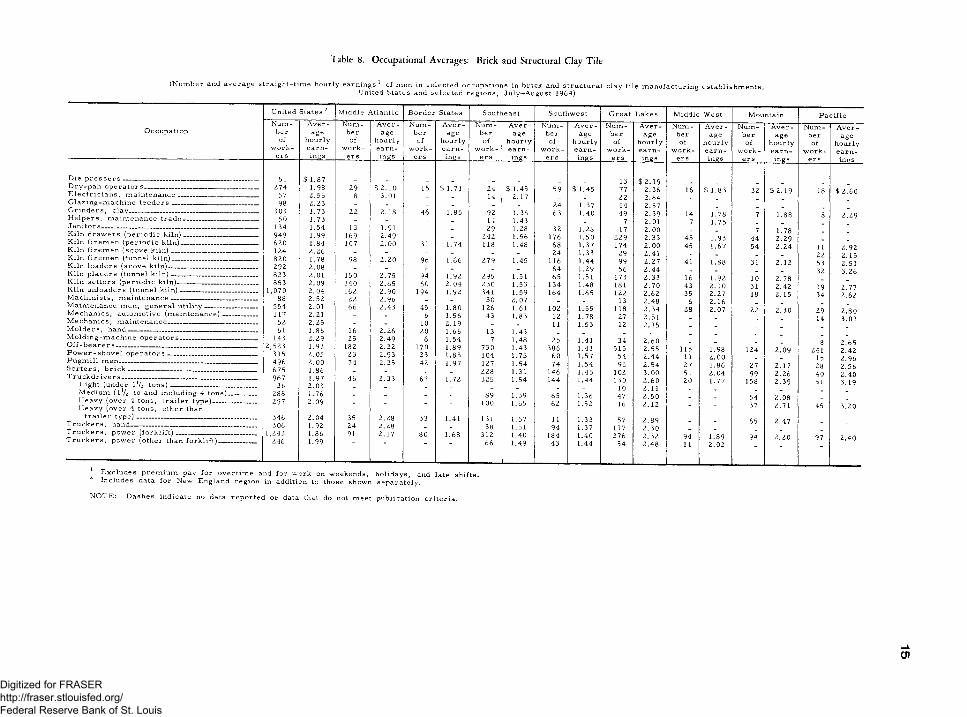
Table 8. Occupational Averages: Brick and Structural Clay Tile
(N um ber and a vera g e s tra igh t-tim e h ou rly e a rn in g s1 o f m en in se le c te d occu p a tion s in b r ick and stru ctu ra l c la y tile m anufacturing e s ta b lish m en ts ,United States and s e le c te d re g io n s , July—August 1964)
O ccu p a tion
United States 2N um
berof
w orke rs
A ver - age
hourly e a rn -
in g s
D ie p r e s s e r s ________________________________________D ry -p a n o p e r a t o r s __________________________________E le c t r ic ia n s , m a in te n a n ce ________________________G la z in g -m a ch in e f e e d e r s __________________________G rin d e rs , c la y _______________________________________H e lp e rs , m a in tenance tr a d e s _____________________J a n ito rs_______________________________________________K iln d ra w e rs (p e r io d ic k i ln )______________________K iln f ir e m e n (p e r io d ic k iln )_______________________K iln f ir e m e n (s c o v e k i ln ) __________________________K iln fir e m e n (tunnel k iln )__________________________K iln lo a d e rs (s co v e k iln )___________________________K iln p la c e r s (tunnel k i ln )__________________________K iln se tte r s (p e r io d ic k iln )________________________K iln u n lo a d e rs (tunnel k i ln )_______________________M a ch in is ts , m a in te n a n ce ---------------------------------------M ain ten ance m en , g e n e ra l u t i l i t y ________________M e ch a n ics , a u tom otive (m a in te n a n ce )__________M e ch a n ics , m a in ten a n ce___________________________M o ld e r s , h a n d _______________________________________M o ld in g -m a ch in e o p e r a t o r s _______________________O ff-b e a r er s __________________________________________P o w e r -s h o v e l o p e r a t o r s ___________________________P u g m ill m en _________________________________________S o r te r s , b r i c k _______________________________________T ru c k d r iv e r s ________________________________________
L ight (under 1 V2 t o n s ) __________________________M edium (lV 2 to and in clu din g 4 to n s )________H eavy (o v e r 4 tons, t r a ile r ty p e )_____________H eavy (o v e r 4 ton s, oth er than
t r a ile r t y p e )____________________________________T r u c k e r s , hand______________________________________T r u c k e r s , pow er ( f o r k l i f t )________________________T r u c k e r s , p ow er (o th er than fo r k li f t )___________
51 274
5798
30350
134949620124820292823853
1,07088
554117
52 61
1432,523
315496675967
36288297
346306
1,243246
$ 1.871.98 2.56 2.231.731.73 1.541.99 1.84 2.26 1.78 2.08 2.012.092.04 2.52 2.01 2.21 2.25 1.86 2.29 1.932.05 2.00 1.86 1.972.03 1.762.09
2.04 1.92 1 .861.99
Middle \tlantic Border States Southeast Southwest Great Lakes Middle West Mountain PacificNum- A ver- Num- A ver Num A ver Num A ver Num A ver Num A ver Num A ver Num A ver-ber age ber age ber age ber age ber age ber age ber age ber ageof hourly of hourly of hourly of hourly of hourly of hourly of hourly of hourlywork- earn- work- earn work earn work earn- work earn work earn work earn work earners -IPS 5 ers ings ers ings ers - inKs ers ings er s ings ers ings ers ings
13 $ 2.1929 $ 2.10 15 $ 1.71 24 $ 1.45 59 $ 1.45 77 2.36 16 $ 1.83 32 $ 2.19 18 $ 2.608 3.01 - - 14 2.17 - - 22 2.64 _ _ _
- - - - - - 24 1.37 54 2.57 _ _ _22 2.18 46 1.85 92 1.36 63 1.40 49 2.39 14 1.78 7 1.88 8 2.29- - - - 14 1.43 - - 7 2.01 7 1.75 _13 1.91 - - 29 1.28 32 1.28 17 2.00 _ _ 7 1.78
169 2.49 - - 242 1.56 176 1.50 229 2.33 45 1.93 44 2.29107 2.00 31 1.74 118 1.48 68 1.37 174 2.00 45 1.67 54 2.24 11 2.92- - - - - - 24 1.33 29 2.41 _ _ _ _ 22 2.1598 2.20 96 1.66 279 1.45 116 1.44 99 2.27 41 1.88 31 2.12 53 2.51- - - - - - 64 1.29 56 2.44 _ _ _ _ 32 3.26150 2.75 94 1.92 295 1.51 65 1.51 173 2.33 16 1.92 10 2.78140 2.65 60 2.04 230 1.53 134 1.48 181 2.70 43 2.10 31 2.42 19 2.77162 2.90 194 1.92 341 1.59 164 1.65 122 2.62 35 2.27 18 2.15 34 2.6222 2.96 - - 30 2.07 - - 13 2.48 6 2.16
66 2.43 45 1.80 126 1.61 102 1.55 118 2.34 28 2.07 22 2.30 29 2.80- - 6 1.56 43 1.83 12 1.78 27 2.51 _ _ _ _ 14 3.03- - 10 2.19 - - 11 1.53 12 2.15 _ _
16 2.26 20 1.66 13 1.43 _ _ _25 2.49 6 1.54 7 1.48 25 1.41 34 2.60 _ _ 8 2.65182 2.32 170 1.89 730 1.43 386 1.41 515 2.55 115 1.98 124 2.09 241 2.4223 2.93 23 1.83 104 1.75 60 1.57 54 2.44 11 2.00 15 2.9674 2.35 42 1.97 127 1.54 74 1.54 92 2.54 27 1.86 27 2.17 28 2.56
- - - - 228 1.31 146 1.45 102 3.00 51 2.04 99 2.26 40 2.4046 2.33 67 1.72 325 1.54 144 1.44 130 2.60 20 1.77 158 2.39 51 3.19- - - - - - - - 10 2.11 _ _ _ _- - - - 89 1.39 65 1.36 47 2.50 _ _ 54 2.08" " " - 100 1.65 62 1.52 16 2.12 - - 37 2.71 45 3.20
35 2.28 33 1.41 131 1.57 11 1.33 57 2.89 65 2.4724 2.28 - - 38 1.51 94 1.37 117 2.30 _ _91 2.17 80 1.68 312 1.40 184 1.40 276 2.32 94 1.89 94 2.20 97 2.4066 1.49 43 1.44 54 2.48 11 2.02
' '
2 E x clu d e s p re m iu m pay fo r o v e rtim e and fo r w ork on w eekends, h o lid a y s , and late sh ifts . Includes data fo r New England re g io n in addition to those shown sep arate ly .
N O T E : D ashes in d ica te no data re p o rte d or data that do not m eet pu b lica tion c r ite r ia .
Digitized for FRASER http://fraser.stlouisfed.org/ Federal Reserve Bank of St. Louis

Table 9. Occupational Averages: Ceramic Wall and Floor Tile 0)(Number and average straight-time hourly earnings 1 of workers in selected occupations in ceramic wall and floor tile manufacturing establishments,
United States and selected regions, July—August 1964)
United States 2 Middle Atlantic Southeast Southwest Great Lakes Pacific
Occupation and sex Numberof
workers
Averagehourly
earnings
Numberof
workers
Averagehourly
earnings
Numberof
workers
Averagehourly
earnings
Numberof
workers
Averagehourly
earnings
Numberof
workers
Averagehourly
earnings
Numberof
workers
Averagehourly
earnings
Men
Clay m akers_________________________________________ 119 $1.92 . . 28 $1.68 _ _ 31 $2.07 11 $2.23Die p r e s s e r s ________________________________________ 347 2.07 - - 54 1.69 45 $1.72 92 2.15 56 2.34D ry-pan operators_________________________________ 27 2.10 - - - - - - 10 2.58 - -E lectricians, m aintenance_______________________ 39 2.62 8 $2.73 - - - - 22 2.46 - -Glazing-m achine fe e d e rs_________________________ 73 1.96 - - - - 12 1.55 26 1.96 21 2.41G rinders, clay______________________________________ 35 2.10 - - - - - - 23 2.27 - -H elpers, maintenance trades____________________ 28 1.89 - - - - - - 11 2.18 - -Janitors______________________________________________ 127 1.74 25 1.85 27 1.78 17 1.32 34 1.72 - -Kiln firem en (tunnel kiln)_________________________ 289 2.04 69 2.21 4 4 1.83 29 1.66 106 1.98 25 2.69Kiln placers (tunnel k iln )________________________ 3 384 2.13 33 2.61 94 1.63 53 1.46 90 2.57 88 2.40Kiln unloaders (tunnel k iln )______________________ 318 1.91 24 2.54 97 1.72 50 1.39 82 2.24 4 4 1.99M achinists, m aintenance_________________________ 92 2.56 - - 9 2.84 - - 36 2.32 - -Maintenance men, general u tility ---------------- ------ 153 2.28 - - 18 1.96 23 1.80 72 2.37 25 2.82M echanics, maintenance__________________________ 87 2.44 25 2.52 36 2.27 - - - - 11 2.90Off -b e a re rs__________________________________________ 342 2.00 - - 63 1.75 32 1.48 106 2.15 4 4 1.95P ackers________________________ ______________________ 103 1.99 10 1.91 - - - - 65 2.11 - -Pressm en, automatic--------------------------------------------- 237 2.05 38 2.06 38 1.74 32 1.61 116 2.22 13 2.50Pugmill men_________________________________________ 23 2.25 - - - - - - 12 2.43 - -Sorters, tile-------------------------------------------------------------- 54 2.33 - - - - - - - - 4 3 2.33Truckdrivers3 _ ----------------------------------------------------- 46 1.99 - - - - - - 23 1.92 9 2.35
Medium ( l l/2 to and including 4 tons)------------ 18 1.96 - - - - - - 12 1.95 - -Truckers, hand_____________________________________ 72 1.83 - - - - 12 1.43 35 2.02 6 2.30Truckers, power (fork lift)---------------------------------- 133 2.00 17 1.99 22 1.69 " 70 2.06 19 2.22
Women
Fin ishers------------------------------, ------------------------------------ 452 1.60 68 1.83 128 1.46 111 1.36 83 1.72 36 1.96Glazing-m achine fe e d e r s ----------------------------------- - 211 1.86 92 2.09 19 1.59 - - - - 24 1.75O ff-b e a rers---------------------------- ------------- -------------------- 364 1.80 - - 110 1.40 36 1.31 104 2.19 91 1.93P ackers______________________________________________ 194 1.82 - - - - 36 1.35 61 1.69 9 1.91Pattern m ou nters__________________________________ 448 1.86 172 1.82 - - - - 172 1.94 - -Sorters, tile_________________________________________ 742 1.75 179 1.39 87 1.34 242 1.90 94 1.89
1 Excludes premium pay for overtim e and for work on weekends, holidays, and late shifts.2 Includes data for regions in addition to those shown separately.3 Includes all drivers regardless of size and type of truck operated.
NOTE: Dashes indicate no data reported or data that do not meet publication criteria.
Digitized for FRASER http://fraser.stlouisfed.org/ Federal Reserve Bank of St. Louis
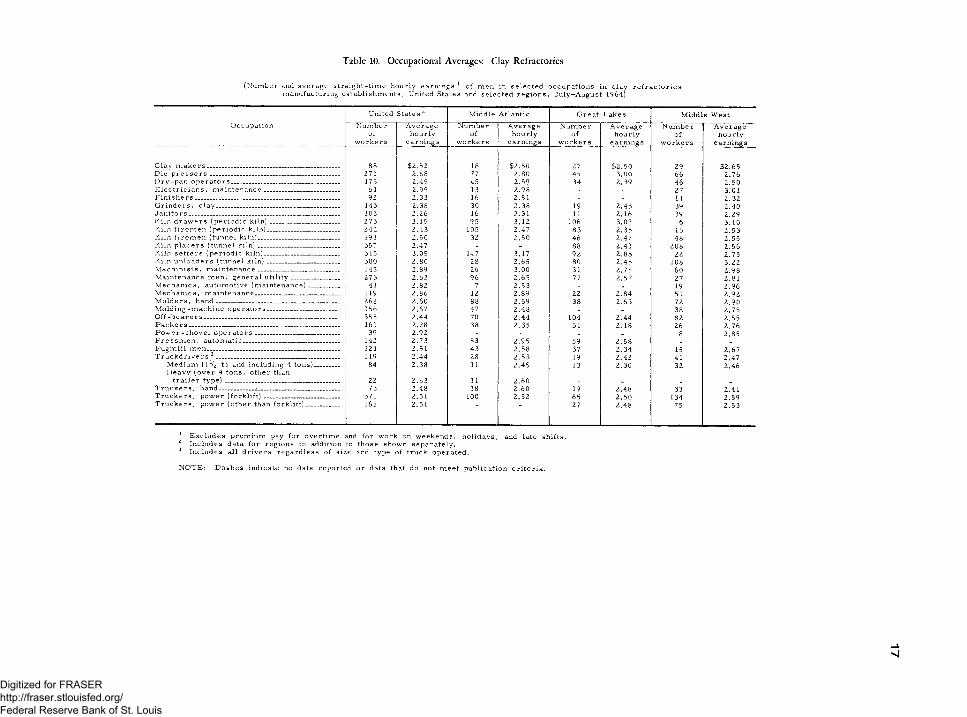
Table 10. Occupational Averages: Clay Refractories
(N um ber and average stra igh t-t im e h ou rly earn in gs 1 o f m en in s e le c te d occu p a tio n s in c la y r e f r a c t o r ie s m anufacturing e s ta b lish m en ts , United States and se le c te d re g io n s , July—A ugust 1964)
United States 2 M iddle A tlantic G reat L akes M iddle W estO ccupation N um ber
ofw orke rs
A v era g eh ou rly
earn ings
N um bero f
w o rk e rs
A v era g eh ou rly
earn ings
N um bero f
w o rk e rs
A v e ra g eh ou rly
earn ings
N u m bero f
w o rk e r s
A v era g eh ou r ly
earn ings
C lay m a k e r s ________________________________________ 88 $2.52 18 $2.50 27 $2.50 29 $2.65D ie p r e s s e r s _______________________________________ 271 2.68 77 2.80 45 3.00 66 2.76D ry -p a n o p e r a t o r s ________________________________ 175 2.45 45 2.59 34 2.39 46 2.50E le c t r ic ia n s , m a in te n a n ce _______________________ 61 2.95 13 2.98 _ _ 27 3.01F in is h e r s ___________________________________________ 92 2.33 16 2.51 _ _ 11 2.32G rin d e r s , c la y _____________________________________ 143 2.38 30 2.38 19 2.45 39 2.40J a n ito rs_____________________________________________ 103 2.26 16 2.31 11 2.16 39 2.29K iln d r a w e r s (p e r io d ic k i ln )_____________________ 273 3. 15 95 3.12 106 3.07 6 3.10K iln f ir e m e n (p e r io d ic k iln )______________________ 242 2.43 105 2.47 83 2.35 15 2.53K iln f ir e m e n (tunnel k iln )________________________ 191 2.50 32 2.50 46 2.47 48 2.55K iln p la c e r s (tunnel k i ln )________________________ 357 2.47 - _ 88 2.41 208 2.56K iln se tte r s (p e r io d ic k iln )______________________ 315 3.05 147 3.17 92 2.88 22 2.75K iln u n lo a d e rs (tunnel k i ln )______________________ 300 2.80 28 2.65 80 2.45 108 3.22M a ch in ists , m a in te n a n ce .. 145 2.89 26 3.00 31 2.75 60 2.98M aintenance m en , g en era l u t i l it y ______________ 273 2.63 96 2.65 77 2.57 27 2.81M e ch a n ics , au tom otive (m a in te n a n ce )_________ 41 2.82 7 2.53 _ _ 19 2.96M e ch a n ics , m a in ten a n ce_________________________ 119 2.86 12 2.89 22 2.84 51 2.92M o ld e r s , h a n d _____________________________________ 262 2.60 88 2.59 38 2.63 72 2.90M o ld in g -m a ch in e o p e r a to r s ______________________ 156 2.67 47 2.48 _ _ 38 2.75O ff - b e a r e r s ________________________________________ 355 2.44 70 2.44 104 2.44 82 2.55P a c k e r s _____________________________________________ 161 2.28 38 2.35 51 2.18 26 2.76P o w e r -s h o v e l o p e r a to r s _ _ ............. 39 2.92 - _ _ _ 8 2.85P re s s m e n , a u to m a tic_____________________________ 142 2.73 53 2.95 59 2.58 _ _P u gm ill m e n ________________________________________ 121 2.51 43 2.58 37 2.34 15 2.67T ru c k d r iv e rs 3 _____________________________________ 119 2.44 28 2.53 19 2.42 41 2.47
M edium (1 V? to and including 4 tons) H eavy (o v e r 4 ton s , other than
84 2.38 11 2,45 13 2.30 32 2.46
t r a ile r t y p e )__________________________________ 22 2.63 11 2.60 _ _ _ _T r u c k e r s , hand__________ j________________________ 73 2.48 18 2.60 19 2.48 33 2.41T r u c k e r s , p ow er ( f o r k l i f t )______________________ 371 2.51 100 2.52 65 2.50 134 2.59T r u c k e rs , p ow er (o th er than fo r k li f t ) . ......... ........ 165 2.51 27 2.48 75 2.53
1 E x clu d e s prem iu m pay fo r o v ertim e and fo r w ork on w eek en d s, h o lid a y s , and late sh ifts .2 Includes data fo r reg ion s in addition to those shown sep a ra te ly .3 Includes a ll d r iv e rs re g a rd le ss o f size and type o f tru ck op erated .
N O T E : D ash es in dicate no data rep orted o r data that do not m eet pu blica tion c r ite r ia .
Digitized for FRASER http://fraser.stlouisfed.org/ Federal Reserve Bank of St. Louis
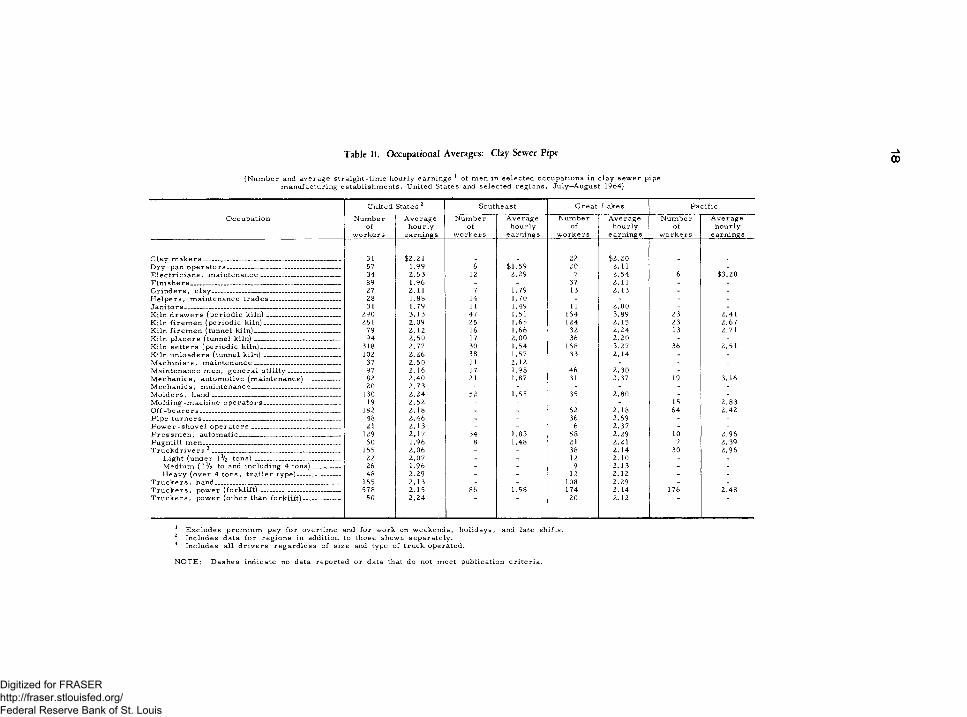
Table 11. Occupational Averages: Clay Sewer Pipe 00(Number and average straight-time hourly earnings 1 of men in selected occupations in clay sewer pipe
manufacturing establishments, United States and selected regions, July—August 1964)
United States 2 S outheast G rea t L akes P a c if icO ccu p a tion N um ber
ofw o rk e rs
A v e ra g eh ou r ly
earn ings
N u m berof
w o rk e rs
A v e ra g eh ou r ly
earn ings
N u m bero f
w o rk e r s
A v era g eh o u r ly
ea rn in gs
N u m berof
w o rk e r s
A v e ra g eh o u r ly
ea rn in gs
C lay m a k e r s _________________________________________ 31 $2.21 22 $2.20D ry -p a n o p e r a t o r s __________________________________ 57 1.99 6 $1.59 20 2.11 - -E le c t r ic ia n s , m a in te n a n ce ________________________ 34 2.53 12 2.29 7 2.54 6 $3.20F in is h e r s _____________________________________________ 89 1.96 - - 37 2.11 - -G r in d e r s , c la y ---------------------------------------------------------- 27 2.11 7 1.79 13 2.13 - -H e lp e r s , m ain ten an ce t r a d e s -------------------------------- 28 1.88 14 1.70 - - - -J a n ito rs ----------------------------------------------------------------------- 31 1.79 11 1.49 11 2.00 - -K iln d r a w e r s (p e r io d ic k i ln ) --------------------------------- 290 3.13 47 1.51 164 3.89 23 2.41K iln f ir e m e n (p e r io d ic k iln )----------------------------------- 251 2.09 25 1.65 124 2.15 23 2.67K iln f ir e m e n (tunnel k iln )__________________________ 79 2.12 16 1.66 32 2.24 13 2.71K iln p la c e r s (tunnel k i ln ) --------------------------------------- 94 2.50 17 2.00 36 2.20 - -K iln se tte r s (p e r io d ic k iln )________________________ 318 2.77 30 1.54 168 3.27 36 2.51K iln u n lo a d e rs (tunnel k i ln ) ----------------------------------- 102 2.26 38 1.57 33 2.14 - -M a ch in is ts , m a in te n a n ce --------------------------------------- 37 2.50 11 2.12 - - - -M ain ten ance m en , g e n e ra l u t i l i t y _______________ 97 2.16 17 1.98 46 2.30 - -M e ch a n ics , a u tom otive (m a in te n a n ce )---------------- 82 2.40 21 1.87 31 2.37 19 3.16M e ch a n ics , m a in ten a n ce__________________________ 20 2.73 - - - - - -M o ld e r s , h a n d ______________________________________ 130 2.24 52 1.55 35 2.80 - -M o ld in g -m a ch in e o p e r a t o r s _______________________ 19 2.52 - - - - 15 2.83O ff - b e a r e r s __________________________________________ 182 2.18 - - 62 2.18 64 2.42P ip e t u r n e r s _________________________________________ 48 2.46 - - 36 2.59 - -P o w e r -s h o v e l o p e r a t o r s __________________________ 21 2.13 - - 6 2.37 - -P r e s s m e n , a u tom a tic______________________________ 129 2.17 34 1.83 58 2.29 10 2.96P u gm ill m e n _________________________________________ 60 1.96 8 1.48 21 2.21 7 2.39T ru c k d r iv e rs 3 ______________________________________ 155 2.06 - - 38 2.14 30 2.96
L ight (under 1 V2 t o n s )_________________________ 22 2.07 - - 12 2.10 - -M ed ium (1 V2 to and in clu d in g 4 to n s )________ 26 1.96 - - 9 2.13 - -H eavy (o v e r 4 ton s , t r a ile r ty p e )_____________ 48 2.29 - - 12 2.12 - -
T r u c k e r s , hand_____________________________________ 155 2.13 - - 108 2.29 - -T r u c k e r s , p ow er ( f o r k l i f t ) ________________________ 578 2.15 86 1.58 174 2.14 176 2.48T r u c k e r s , p ow er (o th e r than fo r k li f t )___________ 50 2.24 20 2.12
1 Excludes premium pay for overtime and for work on weekends, holidays, and late shifts.2 Includes data for regions in addition to those shown separately.3 Includes all drivers regardless of size and type of truck operated.
N O T E : D ash es in d ica te no data rep o rte d o r data that do not m eet pu b lica tion c r ite r ia .
Digitized for FRASER http://fraser.stlouisfed.org/ Federal Reserve Bank of St. Louis
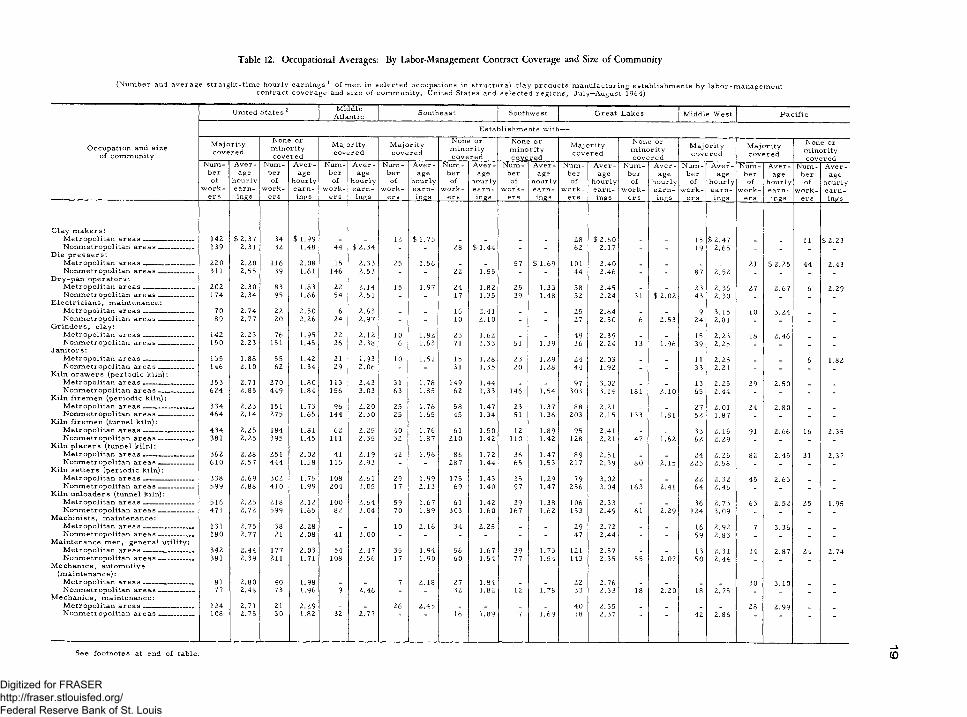
Table 12. Occupational Averages: By Labor-Management Contract Coverage and Size o f Community
(N um ber and a v e ra g e s tra ig h t -t im e h ou rly e a r n in g s 1 of m en in s e le c te d occu p a tion s in s tru ctu ra l c la y p ro d u cts m anufacturing e s ta b lish m en ts by la b o r-m a n a g e m e n t con tract co v e ra g e and s ize o f com m unity , United States and se le c te d re g io n s , July—August 1964)
O ccu p a tion and s iz e o f com m u n ity
United States 2 M iddleA tlantic Southeast Southw est G reat L akes M iddle W est P a c if i c
E sta b lish m en ts w ith—
M a jccov e
rityre d
Nonm inecove
orrityre d
M a jo rityco v e re d
M a jo r ityc o v e re d
None or m in o r ity c o v e re d
Non<m inocov e
3 o r ir ity :red
M a jo r ityc o v e re d
None or m in o r ity c o v e re d
M a jo r ityco v e r e d
M a jo r ityc o v e re d
None or m in or ity co v e re d
N um b e ro f
w o r k e rs
A v e r age
h ou rlye a rn ings
N um berof
w o rk e rs
A v e r age
hourlye a rn -
.. f o g s .
Num b erof
w o rk er s
A v e r age
h o u r lye a rn ings
N um b erof
w o r k e rs
A v e r age
h ou rlye a rn -
, ...
N um b erof
w o rk e rs
A v e r age
h ou rlye a r n ings
N um b erof
w o rk e rs
A v e r age
h o u r lye a rn -ings
N um b erof
w o r k er s
A v e r age
h ou r lye a rn ings
N um b erof
w o r k e rs
A v er - age
h ou rlye a rn ings
N um b erof
w o r k er s
A v e r age
h ou r lye a rn ings
N um b erof
w o rk e rs
A v e r age
h ou rlye a rn ings
N um b erof
w o r k e rs
A v e r age
hourlye a rn ings
C lay m a k e rs :M e tro p o lita n a r e a s ----------------------- 142 $ 2.37 34 $ 1.99 _ _ 12 $ 1.75 _ _ _ _ 28 $ 2.60 _ _ 15 $ 2.47 _ _ 11 $ 2.23N o n m etrop o lita n a r e a s __________ 139 2.31 32 1.48 44 $ 2.34 - - 28 $ 1.44 _ _ 62 2.17 _ _ 19 2.65 _ _ _
D ie p r e s s e r s :M etro p o lita n a re a s ________ _____ 220 2.20 116 2.08 15 2.33 25 1.56 - _ 57 $ 1.69 101 2.40 _ _ _ _ 21 $ 2.25 44 2.43N o n m etrop o lita n a r e a s __________ 311 2.55 39 1.61 146 2.53 - _ 22 1.55 _ _ 44 2.46 _ _ 87 2.52 _ _ _ _
D ry -p a n o p e r a to r s :M e tro p o lita n a re a s __ ________ __ 202 2.30 83 1.83 22 2.14 15 1.97 24 1.82 25 1.33 58 2.45 _ _ 23 2.36 27 2.67 6 2.29N o n m etrop o lita n a r e a s __________ 174 2.34 95 1.66 54 2.51 _ - 17 1.35 39 1.48 52 2.24 31 $ 2.02 43 2.30 _ _ _
E le c t r ic ia n s , m a in ten a n ce :M e tro p o lita n a r e a s __________ __ 70 2.74 22 2.50 6 2.63 _ _ 16 2.41 . _ 25 2 .64 _ _ 9 3.15 10 3.24 _N o n m etrop o lita n a r e a s __________ 89 2.77 20 2.26 24 2.97 _ _ 10 2.10 _ _ 27 2.50 6 2.53 24 2.81 _ _ _
G r in d e r s , c la y :M e tro p o lita n a r e a s ___________ __ 142 2.23 76 1.95 22 2.12 10 1.82 25 1.62 _ _ 49 2.39 _ _ 15 2.23 18 2.46 _N o n m etrop o lita n a r e a s ___ _____ 150 2.23 151 1.45 26 2.38 6 1.63 71 1.33 51 1.39 36 2.24 13 1.96 39 2.25 _ _ _
J a n ito rs :M e tro p o lita n a r e a s _______________ 135 1.88 55 1.42 21 1.93 10 1.51 15 1.28 23 1.29 24 2.03 _ _ 11 2.25 _ _ 6 1.82N on m e tro p o lita n a r e a s __________ 146 2.10 62 1.34 29 2.06 _ _ 31 1.35 20 1.28 44 1.92 _ _ 33 2.21 _ _
K iln d r a w e r s (p e r io d ic k iln ):M e tro p o lita n a r e a s ___ _____ ___ 353 2.71 270 1.80 113 2.43 31 1.78 149 1.44 . _ 97 3.02 _ _ 13 2.25 29 2.50 _ _N on m e tro p o lita n a r e a s ----- ----------- 624 2.85 449 1.84 156 3.03 63 1.85 62 1.33 146 1.54 303 3.14 181 2.10 65 2.44 _ _ _
K iln fir e m e n (p e r io d ic k iln ):M e tro p o lita n a r e a s __ _______ __ 334 2.23 151 1.73 96 2.20 25 1.76 58 1.47 23 1.37 88 2.21 _ _ 27 2.01 24 2.80 _ _N on m e tro p o lita n a r e a s __________ 464 2.14 275 1.65 144 2.30 25 1.65 45 1.34 51 1.36 203 2.15 133 1.81 52 1.87 _ _ _ _
K iln f ir e m e n (tunnel k iln ) :M e tro p o lita n a r e a s _______________ 434 2.25 184 1.81 62 2.25 40 1.76 61 1.50 12 1.89 95 2.41 _ _ 33 2.16 91 2.66 16 2.35N on m e tro p o lita n a r e a s __ ______ 381 2.25 395 1.45 111 2.35 32 1.87 210 1.42 110 1.42 128 2.21 47 1.62 62 2.29 _ _ _
K iln p la c e r s (tunnel k iln ):M e tro p o lita n a re a s — ------ 362 2.28 251 2.02 41 2.19 42 1.96 86 1.72 36 1.47 89 2.51 _ _ 24 2.25 82 2.45 31 2.37N o n m etrop o lita n a r e a s __________ 610 2.57 444 1.58 115 2.93 _ _ 287 1.44 65 1.53 217 2.39 80 2.15 225 2.58 _ _ _
K iln s e tte r s (p e r io d ic k iln ):M e tro p o lita n a r e a s ______ _____ 338 2.69 302 1.75 108 2.61 29 1.99 175 1.43 35 1.29 79 3.02 _ _ 22 2.32 45 2.63 _ _N on m e tro p o lita n a r e a s __________ 599 2.88 410 1.99 204 3.05 17 2.13 69 1.40 97 1.47 256 3.04 163 2.41 64 2.46 _ _ _ _
K iln u n lo a d e rs (tunnel k iln ):M e tro p o lita n a r e a s _________ ____ 516 2.25 218 2.12 100 2.64 59 1.67 61 1.42 29 1.38 106 2.33 _ _ 36 2.73 63 2.52 25 1.95N on m e tro p o lita n a r e a s __________ 471 2.72 599 1.65 82 3.04 70 1.89 303 1.60 167 1.62 153 2.49 61 2.29 124 3.09 _ _ _
M a ch in is ts , m a in ten a n ce :M e tro p o lita n a re a s _ __ _ __ __ 131 2.75 38 2.28 _ _ 10 2.16 34 2.25 _ _ 29 2.72 _ _ 16 2.92 7 3.36 _ _N on m e tro p o lita n a r e a s ___ _____ 180 2.77 21 2.08 41 3.00 _ _ _ _ _ _ 47 2.44 _ _ 59 2.83 _ _ _ _
M ain ten ance m en , g e n e ra l u tility :M e tro p o lita n a r e a s _____ ___ 342 2.44 177 2.03 54 2.47 35 1.94 56 1.67 39 1.73 121 2.57 _ _ 13 2.31 34 2.87 24 2.74N on m e tro p o lita n a re a s _ _ _____ 381 2.39 211 1.71 108 2.56 17 1.90 60 1.54 77 1.54 143 2.35 55 2.07 50 2.44 _ _ _ _
M e c h a n ics , au tom otiv e(m a in te n a n ce ):
M e tro p o lita n a r e a s _______________ 81 2.80 40 1.98 - _ 7 2.18 27 1.84 _ _ 22 2.76 _ _ _ _ 30 3.10 _N on m e tro p o lita n a r e a s __________ 77 2.48 73 1.96 9 2.46 _ - 32 1.82 12 1.78 33 2.33 18 2.20 18 2.75 _ _ _ _
M e c h a n ics , m a in ten a n ce :M e tro p o lita n a r e a s _______________ 124 2.71 21 2.29 - - 26 2.45 _ _ - _ 40 2.55 _ _ _ _ 28 2.99 _ _N on m e tro p o lita n a r e a s ___________ 108 2.75 30 1.82 32 2.77 16 1.89 7 1.69 18 2.37 42 2.86
S ee fo o tn o te s at end o f tab le . (0
Digitized for FRASER http://fraser.stlouisfed.org/ Federal Reserve Bank of St. Louis

Table 12. Occupational Averages: By Labor-Management Contract Coverage and Size o f Community— Continued
(Number and average straight-time hourly earnings* of men in selected occupations in structural clay products manufacturing establishments by labor-managementcontract coverage and size of community, United States and selected regions, July-August 1964)
United States 2 MiddleAtlantic Southeast Southwest Great Lakes Middle West
Establishments with—
O ccu p a tion and s ize o f com m u n ity
M a jo r ityc o v e r e d
None or m in o r ity c o v e re d
M a jo rityco v e re d
M a jo rityco v e re d
None or m in o r ity c o v e re d
N one o r m in o r ity co v e r e d
M a jo r ityc o v e re d
Nomminecove
e or )r ity :re d
M a jo r ityc o v e re d
M ajccove
>rity;red
Nonem inecove
2 or >rity ired
N u m b e ro f
w o r k e rs
A v e r age
h o u r lye a rn ings
N u m b e ro f
w o r k e rs
A v e r age
hou rlye a rn ings
N um berof
w o rk e rs
A v e r age
h ou rlye a rn ings
N um berof
w o rk ers
A v e r age
h o u r lye a rn ings
N um b erof
w o r k e rs
A v e r age
h ou rlye a rn i n g 8 ,-
N um b e ro f
w o r k e rs
A v e r age
h ou r lye a rn ings
N u m b e rof
w o rk e rs
A v e r age
h ou r lye a rn -
., ing-s_-
N u m b e rof
w o rk e rs
A v e r age
h ou rlye a rn -
N um b e rof
w o r k e rs
A v e r age
h ou rlye a rn -
- J i l g S -
N u m b erof
w o r k e rs
A v e r age
h ou rlye a rn ings
N um b erof
w o r k e rs
A v e r age
h ou rlye a rn ings
M o ld e r s , hand:$ 1.73 $ 2.49 $ 2.92M e tro p o lita n a r e a s ------------------------ 132 $ 2.41 56 $ 1.77 16 $ 2.46 15 $ 2 .00 35 - - 56 - - 14 - - - -
N on m e tro p o lita n a r e a s ----------------- 218 2.73 72 1.66 92 2.70 - - - - - - 33 2.68 - - 65 2.95 " ■M o ld in g -m a ch in e o p e r a to r s :
$ 1.36 20 2.7 5 24 2.63 40 $ 2.68M e tro p o lita n a r e a s --------------------- — 125 2.59 42 2.02 34 2.38 - - - - 16 - - - -N on m e tro p o lita n a r e a s ----------------- 121 2.65 44 2.12 31 2.66 - - - 13 1.48 31 2. 37 8 $ 2.20 “ ~
M e tro p o lita n a r e a s ------------------------ 1,168 2.27 607 1.67 130 2.48 135 1.70 300 1.38 67 1.36 265 2.49 - - 84 2.16 277 2.43 41 $ 1.91N o n m e tro p o lita n a r e a s ----------------- 832 2 .34 958 1.62 175 2.36 73 1.78 351 1.41 298 1.41 343 2.49 232 2.12 120 2.29 - - - -
P o w e r -s h o v e l o p e r a to r s :2.61 2.41 18 2.93M e tro p o lita n a r e a s ------------------------ 120 2.58 76 1.79 - - 7 1.83 44 1.75 17 1.42 31 - - 9 - -
N o ijm e tro p o lita n a r e a s ----------------- 71 2.52 140 1.80 18 2.70 - - 53 1.72 43 1.63 24 2.48 28 2.07 9 2.36 - -P r e s s m e n , a u tom a tic :
10 2.96 13 2.50M e tro p o lita n a r e a s ------------------------ 163 2.33 65 1.98 22 2.28 25 2.13 - - 24 1.50 65 2.41 - - - -N on m e tro p o lita n a r e a s ----------------- 218 2 .50 91 1.64 58 2.91 - - 45 1.51 - - 134 2.38 - - - - - -
P u g m ill m en :16 35 2.59 2.43M e tro p o lita n a r e a s ------------------------ 207 2.33 122 1.83 42 2.38 17 1.82 47 1.48 17 1.45 59 2.50 - - 1.91 7
N on m e tro p o lita n a r e a s ----------------- 222 2.38 188 1.68 . 68 2.50 11 1.85 67 1.48 58 1.52 72 2.48 45 2.12 32 2.30 - - " -S o r te r s , b r ic k :
30 2.33 40 2.40M e tro p o lita n a r e a s ------------------------ 220 2.51 60 1.56 - - - - - - 41 1.55 - - - - - -N o n m etrop o lita n a r e a s ----------------- 88 2.29 313 1.35 - - - - 210 1.29 78 1.27 24 3.45 ~ - -
T r u c k d r iv e r s : 32.29 3.15 2.25M e tro p o lita n a r e a s ------------------- 404 2 .60 262 T .65 29 2.42 19 1.74 137 1.57 42 1.37 119 2. 70 - - 17 80 11
N o n m etrop o lita n a r e a s ------------ 236 2.21 453 1.60 34 2.44 14 1.51 234^ 1.54 107 1.45 73 2.14 50 1.72 73 2.14 - - - -M ed ium ( 1 V2 to and in clu din g
4 ton s):M e tro p o lita n a re a s — --------------- 89 2.41 106 1.62 _ _ . _ 26 1.55 34 1.43 43 2.58 - - 11 2.33 - - - -N o n m etrop o lita n a r e a s ------------ 106 2 .30 133 1.41 14 2.37 - - 81 1.37 30 1.29 28 2.16 17 1.68 38 2.19 - - -
H eavy (o v e r 4 ton s, t r a ile r ty p e ):
2.26 66 3.20M etro p o lita n a r e a s ------------------- 118 2.89 32 1.74 - - - - - - - - 8 - - - - - -N on m e tro p o lita n a r e a s ------------ 37 2 .14 195 1.69 - - - - 94 1.65 60 1.53 18 2.20 16 1.57 " - - “ - -
H eavy (o v e r 4 ton s , oth er than t r a ile r ty p e ):
1.60 2.95M etro p o lita n a re a s _ -------- — 161 2.57 120 1.64 15 2.42 8 1.73 97 - - 59 - - - - - - - -N o n m etrop o lita n a re a s — -------- 44 2.21 114 1.68 14 2.46 8 1.48 58 1.62 11 1.33 - - - “ - “ - - -
T r u c k e r s , hand:1.56 34 130 2.29M e tro p o lita n a r e a s ---------------------- - 229 2.21 72 1.68 30 2.16 - - 14 1.27 - - - - - - - -
N on m e tro p o lita n a re a s —--------------- 182 2 .29 127 1.52 21 2.59 11 1.65 19 1.35 69 1.41 114 2.31 18 1.70 - " - - - -T r u c k e r s , p o w e r (fo rk lif t ) :
160 2.42 87 2.26 238 2.45 16 2.24M e tro p o lita n a r e a s ------------------------N o n m etrop o lita n a r e a s -----------------
743 2 .29 311 1.70 44 2.35 74 1.82 148 1.43 33 1.47 - -864 2 .24 435 1.48 152 2.37 58 1.66 170 1.34 146 1.39 338 2.22 69 1.98 174 2.38 - - - -
T r u c k e r s , p ow er (o th er than fo r k l i f t ) :
66 28 2.40M etro p o lita n a r e a s ------------------------ 164 2.30 31 1.57 - - 7 1.82 17 1.45 11 1.55 2.27 - - - - - -N o n m etrop o lita n a r e a s ----------------- 257 2.37 77 1.46 " 19 1.74 41 1.36 22 1.38 58 2.41 12 2.00 58 2.49 ' ' ' ‘
1 Excludes premium pay for overtim e and for work on weekends, holidays, and late shifts.2 Includes data for regions in addition to those shown separately.3 Includes all drivers regardless of size and type of truck operated.
NOTE: Dashes indicate no data reported or data that do not meet publication criteria.
Digitized for FRASER http://fraser.stlouisfed.org/ Federal Reserve Bank of St. Louis

Table 13. Occupational Averages: By Labor-Management Contract Coverage and Size o f Establishment
(Number and average straight-time hourly earnings1 of men in selected occupations in structural clay products manufacturing establishments by labor-managementcontract coverage and size of establishment, United States and selected regions, July—August 1964)
United S ta tes2 M iddleA tlantic
O c c u p a t io n a n d s i z e o f e s t a b l i s h m e n t
M ajoco v e
rityred
Nonminecov<
e or jr ity ;r e d
M a jorityco v e re d
N u m b e ro f
w o r k e r s
A v e r age
hou rlye a rn in g 5
N um b ero f
w o r k e r s
A v e r - age
hourly e a rn ings
Numberof
w o rk ers
A v e r - age
h ou rly e a rn ings
C l a y m a k e r s :2 0 —9 9 w o r k e r s _ _ 24 $2. 29 24 $1. 83 _ _100 w o r k e r s o r m o r e _______________ 257 2. 34 42 1. 69 100 $ 2 .4 5
D ie p r e s s e r s :20—99 w o r k e r s __________________________ 113 2. 56 63 2. 02 _ _100 w o r k e r s o r m o r e _______ _ 418 2. 37 92 1 . 9 2 127 2. 36D r y - p a n o p e r a t o r s :
2 0 —9 9 w o r k e r s 165 2. 23 128 1. 71 . _100 w o r k e r s o r m o r e . _ ... . . 211 2. 38 50 1. 83 34 2. 49E l e c t r i c i a n s , m a in t e n a n c e :
2 0 —9 9 w o r k e r s ___ 17 2 .9 6 10 2. 52 _ _100 w o r k e r s o r m o r e _______ 142 2. 73 32 2. 34 20 2. 83G r i n d e r s , c l a y :
2 0 —9 9 w o r k e r s __ _____________________ 102 2. 10 158 1. 64 _ _100 w o r k e r s o r m o r e . 190 2. 30 69 1. 54 28 2. 34J a n i t o r s :
2 0 - 9 9 w o r k e r s ________ . . . 56 1. 75 55 1. 33 _ _100 w o r k e r s o r m o r e _______________ 225 2. 05 62 1. 42 41 2. 03K i ln d r a w e r s ( p e r i o d i c k i ln ) :
2 0 —9 9 w o r k e r s 564 2. 59 447 1. 87 _ _100 w o r k e r s o r m o r e __ 413 3. 08 272 1. 75 52 2. 98K i ln f i r e m e n ( p e r i o d i c k i ln ) :
2 0 —9 9 w o r k e r s ___ 404 2. 13 322 1. 66 _ _100 w o r k e r s o r m o r e . 394 2. 22 104 1. 73 86 2. 30K i ln f i r e m e n ( t u n n e l k i ln ) :
2 0 —9 9 w o r k e r s - 295 2. 23 272 1. 53 . _100 w o r k e r s o r m o r e 520 2. 26 207 1. 62 99 2. 35K i ln p l a c e r s ( tu n n e l k i ln ) :
20 —9 9 w o r k e r s __________________________ 259 2. 37 320 1. 74 . _100 w o r k e r s o r m o r e . . . 713 2. 50 • 375 1. 74 59 2. 78K i ln s e t t e r s ( p e r i o d i c k i ln ) :
2 0 —9 9 w o r k e r s _____ 500 2. 64 456 1. 97 _ _100 w o r k e r s o r m o r e - . 437 3. 01 256 1. 75 98 2. 94K i ln u n l o a d e r s ( tu n n e l k i ln ) :
2 0 —9 9 w o r k e r s ____ 360 2. 44 429 1. 80 . _100 w o r k e r s o r m o r e ____ 627 2. 49 388 1. 75 67 2. 72M a c h i n i s t s , m a in t e n a n c e :
2 0 —9 9 w e a k e r s __ 4 2 2. 84 _ _ _ _100 w o r k e r s o r m o r e _____ ______ 2 6 9 2. 75 50 2. 21 47 2. 94M a i n t e n a n c e m e n , g e n e r a l u t i l i t y :
2 0 - 9 9 w o r k e r s __________________________ 295 2. 39 247 1. 87 _ _1 0 0 w o r k e r s o r m o r e _ . .. 428 2. 43 141 1. 83 93 2. 67M e c h a n i c s , a u t o m o t iv e
( m a in t e n a n c e ) :2 0 —9 9 w o r k e r s ____ __ ___ 29 2. 70 45 2. 03 _ _100 w o r k e r s o r m o r e _ 129 2. 63 68 1 .92 . _
M e c h a n i c s , m a in t e n a n c e :2 0 —9 9 w o r k e r s _ 46 2. 64 26 1. 98 . _100 w o r k e r s o r m o r e _ ....... 186 2. 75 25 2. 05 31 2. 70
S outheast Southwe st G rea t Lake s M idd le W est P a c if ic
E sta b lish m en ts with—
M a jo rityco v e re d
None or m in o r ity co v e re d
M a jo rityc o v e re d
None or m in o r ity co v e re d
M a jo rityco v e re d
None o r m in o r ity c o v e re d
M a jo rity c o v e r ed
M a jorityco v e re d
N um - A v e r - N u m A v e r N um A v e r N um A v e r - N u m A v e r - N u m A v e r - N u m A v e r - N um A v er -b er age b er age b er age b er age b er age b er age b er age b er ageo f h ou rly o f h ou rly o f h ou rly of hourly of hou rly o f hourly o f hou rly of hourly
w o rk - e a rn - w o r k e a rn w o r k e a rn w o r k e a rn w o r k e a rn w o r k e a rn w o r k e a rn w o rk e a rn ers m gs ers ings e rs ings e rs ings e rs ings er s ings e rs ings e rs ings
6 $2. 3912 $2. 03 24 $1. 46 " - " 85 $2. 30 - - 28 2. 61 - -- - - - . _ 26 $1. 47 _ _ 10 $2. 36 37 2. 12
29 1. 78 22 1. 55 " - 123 2. 32 - - 59 2. 77 21 $2. 25
- - 25 1. 43 - _ 43 1. 35 55 2. 27 40 2. 22 18 1. 94 16 2. 65" " " “ " " 21 1. 56 55 2. 43 - - 48 2. 46 13 2. 66
- - - - _ _ _ _ _ _ 8 2. 6512 2. 32 24 2. 31 " - - - 49 2. 54 ‘ - 30 2. 94 13 3. 21
- - 57 1. 30 7 $1. 92 32 1. 40 29 2. 30 19 2. 30 15 1. 85 10 2. 449 1 .8 8 39 1. 56 " " 25 1. 37 56 2. 34 - - 39 2. 40 9 2. 48
- - - - _ _ 26 1. 28 9 1. 85 _22 1. 93 35 1. 36 6 1. 38 17 1. 30 59 1. 97 - 39 2. 26 - -
- - 108 1. 41 _ _ 107 1. 50 213 2. 53 158 2. 30 58 2. 3064 1. 81 103 1. 41 13 2. 24 75 1. 58 187 3. 76 81 2. 27 20 2. 72 23 2. 41
- - 57 1. 34 _ _ 61 1. 37 142 2. 12 130 1. 84 50 1. 72 11 2. 9232 1. 82 46 1. 50 12 1. 71 13 1. 33 149 2. 21 37 2. 11 29 2. 26 21 2. 73
- - 137 1. 36 16 1. 97 83 1. 44 51 2. 47 49 1.71 45 2. 03 52 2. 6154 1. 87 134 1. 53 39 1. 67 39 1. 54 ' 172 2. 24 - - 50 2. 43 43 2. 74
- - 123 1. 44 _ _ 33 1. 54 60 2. 35 69 2. 16 27 2. 1555 2. 16 250 1. 54 25 2. 43 68 1. 50 246 2. 44 20 2. 63 222 2. 59 72 2. 43
- - 107 1. 48 _ _ 106 1. 41 154 2. 65 142 2. 56 54 2. 30 15 2. 8022 2. 30 137 1. 37 23 2. 08 26 1. 45 181 3. 36 76 2. 45 32 2. 64 37 2. 55
- - 118 1. 53 18 2. 28 94 1. 49 86 2. 41 54 2. 31 33 2. 45 34 2. 62120 1. 80 246 1. 59 18 2. 51 102 1. 68 173 2. 43 18 2. 56 127 3. 15 34 2. 41
- - - - _ _ _ _ _ _ . 10 2. 2814 2. 51 40 2. 20 9 2. 54 - 71 2. 51 - - 65 2. 93 12 3. 14
- - 50 1. 49 _ _ 78 1. 59 86 2. 56 55 2. 13 28 2. 12 33 2. 8733 1. 98 66 1. 69 20 1. 73 38 1. 63 178 2. 40 20 2. 18 35 2. 64
_ _ 15 1. 86 . 7 1 .77 14 2. 20 13 3. 0512 2. 12 44 1. 82 7 1. 90 51 2. 53 13 2. 23 22 2. 88 22 3. 10- _ - - _ _ 13 1. 60 21 2. 32
38 2. 59 17 1. 89 37 2. 59 52 2 .91 25 2. 98
S e e f o o t n o t e s a t e n d o f t a b le . 10
Digitized for FRASER http://fraser.stlouisfed.org/ Federal Reserve Bank of St. Louis
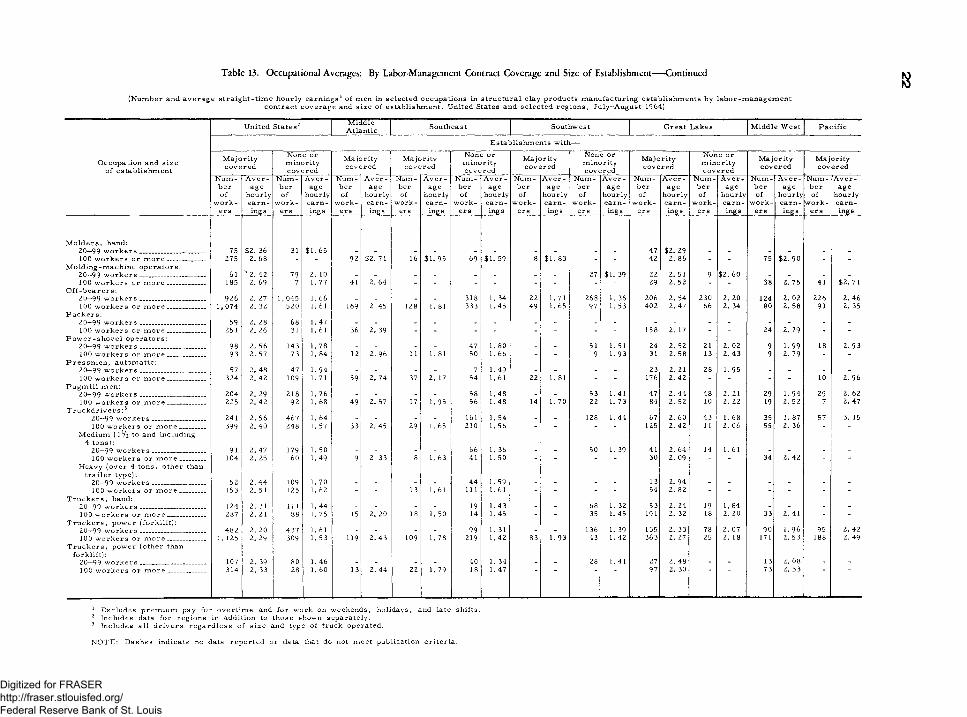
Table 13. Occupational Averages: By Labor-Management Contract Coverage and Size o f Establishment— Continued
(N um ber and a v e r a g e s tr a ig h t -t im e h ou r ly e a rn in g s1 o f m en in se le c te d o ccu p a tio n s in s tru ctu ra l c la y p ro d u cts m anufacturing esta b lish m en ts by la b o r-m a n a g e m e n tc o n tr a c t c o v e ra g e and s ize o f esta b lish m en t, U nited States and se le c te d r e g io n s , July—A ugust 1964)
U nited S ta te s1 2 M idd leA tlantic Southeast Southw est G rea t L ak es M idd le W est
E sta b lish m en ts w ith—
O ccu p a tio n and s iz e o f esta b lish m e n t
M a jo r ityc o v e r e d
None or m inority- co v e re d
M a jo rityco v e re d
M a jo rityc o v e re d
N one o r m in o r ity c o v e re d
M a jo rityc o v e re d
None or m in o r ity co v e re d
M a jo rityco v e re d
N one o r m in o r ity c o v e re d
M a jo r ityc o v e re d
M a jo r ityc o v e re d
N u m b e ro f
w o r k e rs
A v e r age
h o u r lye a r n ings
N u m b e ro f
w o r k e rs
A v e r age
hourlye a rn ings
N um b erof
w o r k ers
A v e r - age
hourly e a rn ings
N um berof
w o rk ers
A v e r age
hou rlye a rn -ings
N u m b ero f
w o r k e rs
A v e r - age
h ou rly e a rn ings
N u m b ero f
w o r k e rs
A v e r age
hou rlye a rn ings
N u m b ero f
w o r k e rs
A v e r age
hourlye a rn ings
N um b ero f
w o r k e rs
A v e r age
hou rlye a rn ings
N u m b ero f
w o r k e rs
A v e r •p age
hou rly e a rn ings
N u m b ero f
w o r k e rs
A v e r age
h ou r lye a rn ings
N u m b e ro f
w o r k e rs
A v e r age
h ou rlye a rn ings
M o ld e r s , hand:20—99 w o r k e r s ____________________ 75 $2. 36 31 $1. 65 - - - - _ - - - - - 47 $2. 29 - - - - - -100 w o r k e r s o r m o r e ___________ 275 2. 68 - - 92 $2. 71 16 $1. 95 69 $1. 59 8 $1. 83 - - 42 2. 86 - - 75 $2. 90 - -
M o ld in g -m a c h in e o p e r a to r s :$1. 39 $2. 6020—99 w o r k e r s ___________________ 61 2. 42 79 2. 10 - - - - - - - - 27 22 2. 51 9 - - - -
100 w o r k e r s o r m o r e ___________ 185 2. 69 7 1. 77 41 2. 64 - - - - - - - - 29 2. 52 - - 38 2. 75 41 $2. 71O f f -b e a r e r s :
20—99 w o rk e r s . ....___ 926 2. 27 1 ,045 1. 66 _ - - - 318 1. 34 22 1. 71 268 1. 36 206 2. 54 230 2. 20 124 2. 02 226 2. 46100 w o r k e r s o r m o r e ___________ 1 ,0 7 4 2. 32 520 1. 61 169 2. 45 128 1. 81 333 1. 45 49 1. 65 97 1. 53 402 2. 47 66 2. 34 80 2. 58 91 2. 35
P a c k e r s :20—99 w o r k e r s ___________________ 59 2. 28 68 1. 47 - - - - - - - - - - - - - - - - - -100 w o r k e r s o r m o r e ___________ 251 2. 26 31 1. 61 36 2. 39 - - - - - - - - 158 2. 17 - - 24 2. 79 - -
P o w e r -s h o v e l o p e r a to r s :20—99 w o r k e r s ____________________ 98 2. 56 143 1. 78 - - - - 47 1. 80 - - 51 1. 51 24 2. 52 21 2. 02 9 1 .99 18 2. 93100 w o r k e r s o r m o r e ___________ 93 2. 57 73 1. 84 12 2. 96 11 1. 81 50 1. 66 - - 9 1 .9 3 31 2. 58 13 2. 43 9 2. 79 - -
P r e s s m e n , a u tom atic :20—99 w o r k e r s ___________________ 57 2. 48 47 1. 94 - - - - 7 1. 49 - - - - 23 2. 21 28 1. 95 - - - -100 w o r k e r s o r m o r e ___________ 324 2. 42 109 1. 71 59 2. 74 37 2. 17 54 1. 61 22 1. 81 - - 176 2. 42 - - - - 10 2. 96
P u g m ill m en :2. 6220—99 w o r k e r s _________ ____ _____ 204 2. 29 218 1. 76 - - - - 58 1. 48 - - 53 1. 41 47 2. 44 48 2. 21 29 1. 94 29
100 w o r k e r s o r m o r e ___________ 225 2. 42 92 1. 68 49 2. 57 17 1. 95 56 1. 48 14 1. 70 22 1. 73 84 2. 52 10 2. 22 19 2. 52 7 2 .4 7T r u c k d r iv e r s :3
20—99 w o r k e r s .............................. 241 2. 56 467 1. 64 - - - - 161 1. 54 - - 128 1. 44 67 2. 60 43 1. 68 35 1. 87 57 3. 15100 w o r k e r s o r m o r e ________ 399 2. 40 248 1. 57 33 2. 45 29 1. 65 210 1. 56 - - - - 125 2. 42 11 2. 06 55 2. 36 - -
M ed ium (1 l/z to and inclu din g 4 tons):
20—99 w o r k e r s ________________ 91 2. 47 179 1. 50 - - - - 66 1. 36 - - 50 1. 39 41 2. 64 14 1. 61 - - - -100 w o r k e r s o r m o r e ________ 104 2. 25 60 1. 49 9 2. 33 8 1. 63 41 1. 50 - - - - 30 2. 09 - - 34 2. 42 - -
H eavy (o v e r 4 to n s , o th er than t r a ile r ty p e ) :
20—99 w o r k e r s ________________ 52 2. 44 109 1. 70 - - - - 44 1. 59 - - - - 13 2. 94 - - - - - -100 w o r k e r s o r m o r e ------------ 153 2. 51 125 1. 62 - - 13 1. 61 111 1. 61 - - - - 54 2. 82 - - - - - -
T r u c k e r s , hand:20—99 w o r k e r s ________-___________ 124 2. 31 111 1. 44 - - - - 19 1. 43 - - 68 1. 32 53 2. 24 19 1. 84 - - - -100 w o r k e r s o r m o r e ___________ 287 2. 21 88 1. 75 15 2. 20 18 1. 50 14 1. 45 - - 35 1. 45 191 2. 32 18 2. 20 33 2. 41 - -
T r u c k e r s , p o w e r (fo rk lif t ) :20—99 w o r k e r s ___________________ 482 2. 20 437 1. 61 - - - - 99 1. 31 - - 136 1. 39 135 2. 33 78 2. 07 90 1 .9 6 95 2. 42100 w o rk e r s o r m o r e ----------------- 1, 125 2. 29 309 1. 53 119 2. 43 109 1. 78 219 1. 42 83 1. 93 43 1. 42 363 2. 27 25 2. 18 171 2. 53 188 2. 49
T r u c k e r s , p o w e r (o th er than fo r k li ft ) :
20—99 w o r k e r s ___________________ 107 2. 39 80 1. 46 - - - - 40 1. 34 - - 28 1. 41 27 2. 48 - - 13 2. 08 - -100 w o rk e r s o r m o r e ___________ 314 2. 33 28 1. 60 13 2. 44 22 1. 79 18 1. 47 97 2. 30 73 2. 53
1 E x clu d es p re m iu m pay fo r o v e r t im e and fo r w ork on w eeken d s, holida ys, and late sh ifts .2 Includes data fo r re g io n s in add ition to th ose shown sep arate ly .3 Includes a ll d r iv e r s r e g a r d le s s o f s iz e and type o f truck operated .
N O TE: D ashes in d ica te no data re p o r te d o r data that do not m eet pu blica tion c r ite r ia .
Digitized for FRASER http://fraser.stlouisfed.org/ Federal Reserve Bank of St. Louis

Table 14. Occupational Averages: By Method o f Wage Payment
(N u m ber and a verage stra ig h t-t im e h ou rly earn ings 1 o f m en in s e le c te d o ccu p a tio n s in stru ctu ra l c la y p rodu cts m anufacturing e s ta b lish m en tsby m ethod o f wage paym ent, United States and s e le c te d re g io n s , July—A ugust 1964)
O ccu p a tion
United States 2
T im e w o rk e rsN um ber
ofw o rk e rs
A v era g e h ou rly
earning s
Incentivew o rk e rs
N um bero f
w o rk e rs
A v e ra g eh ou r ly
earn in gs
M iddle A tlantic
T im e w o rk e rsNumbe r
o fw o rk e rs
A v e ra g eh ou rly
earn in gs
Incentivew o rk e rs
N um bero f
w o rk e rs
A ve r age h ou r ly
earn ings
B o r d e r States
T im e w o rk e rsN um ber
ofw o rk e r s
A v e ra g eh ou r ly
earn ings
Incentivew o rk e rs
N um bero f
w o rk e r s
A vera gehou rly
earnings
D ie p r e s s e r s _____________________________D ry -p a n o p e r a t o r s ______________________K iln d ra w e rs (p e r io d ic k i ln )__________K iln p la ce rs (tunnel k i ln )______________K iln se tte rs (p e r io d ic k iln )____________K iln u n lo a d e rs (tunnel k i ln )___________M o ld e r s , h a n d ___________________________M o ld in g -m a ch in e o p e r a t o r s ___________O ff -b e a r e r s ______________________________P r e s s m e n , a u tom atic .'__________________P u g m ill m e n ______________________________S o r t e r s , b r i c k ___________________________T r u c k e r s , hand__________________________T r u c k e r s , p ow er ( f o r k l i f t ) ____________T r u c k e r s , p ow er (o th e r than fo rk lift )
311 $2.05432 2.11563 1.87987 1.93500 1.95754 1.79312 2. 18154 2.24
2, 080 1.83298 2.09531 2.00319 1.59387 1.96
1 ,940 1.97461 2.11
375 $2.52122 2.22
1, 133 2.64680 2.49
1, 149 2.621, 050 2.42
166 2.73178 2.68
60 2.66239 2.42208 2.35362 2.10223 2.14413 2.37
68 2.55
53 $2.6267 2.3040 2.96
117 2.3973 2.5060 2.1597 2.5145 2.37
147 2.27
94 2.36
32 2.13223 2.29
108 $2.4616 2.65
257 2.6978 3.20
265 2.97154 3.09
21 3.23
199 2.3969 2.4829 2.64
19 2.69
28 $2.13
28 1.76
147 1.76
112 1.86
48 2.21
97 1.7870 2.31
74 $3.0989 2.0987 2.64
109 2.5024 1.83
142 2.16
16 1.95
- :
D ie p r e s s e r s -------------------- --------- -------------D ry -p a n o p e r a t o r s ______________________K iln d ra w e rs (p e r io d ic k i ln )__________K iln p la c e r s (tunnel k i ln )______________K iln se tte r s (p e r io d ic k iln )____________K iln u n load ers (tunnel k i ln ) -----------------M o lde r s , h a n d ___________________________M o ld in g -m a ch in e o p e r a t o r s ___________O f f - b e a r e r s ______________________________P r e s s m e n , a u to m a tic -----------------------------P u g m ill m e n ---------------------------------------------S o r t e r s , b r i c k ___________________________T r u c k e r s , hand___ *______________________T r u c k e r s , p o w e r ( f o r k l i f t ) ____________T r u c k e r s , p o w e r (o th e r than fo rk lift ) 1
Southeast Southw est G reat L akes M iddlei W est
T im e w o rk e rs Incentivew o rk e rs T im e w o rk e rs Incentive
w o rk e rs T im e w o rk e rs Incentivew o rk e rs T im e w o rk e rs Incentive
w o rk e rsN um ber A vera g e N um ber A v era g e N um ber A v e ra g e N um ber A v e ra g e N um ber A v e ra g e N um ber A v e ra g e N um ber A v e ra g e N um ber A vera g eo f hou rly of hou rly o f h ou rly o f h ou rly o f hou rly o f h ou rly o f h ou r ly o f hou rlyw o rk e rs earnings w ork ers earn ings w o rk e rs earn in gs w o rk e r s earn ings w o rk e rs earn ings w o rk e rs earn in gs w o rk e rs earn ings w o rk e r s earnings
33 $1.51 21 $1.96 50 $1.66 . . 83 $2.06 74 $2.82 45 $2.16 52 $2.8249 1.74 - - 48 1.41 33 $1.63 117 2.20 38 2.64 53 2.30 15 2.32177 1.43 128 1.69 42 1.28 153 1.66 193 1.96 446 3.17 23 1.79 61 2.56299 1.40 141 1.99 88 1.43 47 2.11 238 2.17 157 2.72 _ 126 2.66137 1.40 153 1.62 65 1.27 90 1.69 120 2.24 433 3.00 15 2.26 76 2.40199 1.43 294 1.75 79 1.35 153 1.90 154 2.09 177 2.70 1 4 4 3.1482 1.62 - - 14 1.62 12 1.96 58 2.31 37 2.91 33 2.40 46 3.337 1.48 - - 21 1.37 8 1.52 40 2.39 22 2.74 _ 33 2.77648 1.39 211 1.73 247 1.34 189 1.59 428 2.21 476 2.59 90 1.97 130 2.3565 1.59 33 2.26 35 1.58 11 1.87 128 2.17 109 2.52113 1.49 29 1.80 59 1.38 31 1.82 107 2.19 82 2.69 37 2.02 15 2.41
- - - - 101 1.29 45 1.81 - - 92 3.09 19 1.96 34 2.1241 1.43 14 1.60 54 1.23 73 1.54 215 2.17 66 2.59 33 2.28386 1.44 64 1.80 209 1.40 61 2.18 481 2.17 120 2.59 140 2.13 135 2.4877 1.42 7 2.37 44 1.46 110 2.22 26 2.69 59 2.41 27 2.58
1 E x clu d es p re m iu m pay fo r o v e r t im e and fo r w ork on w eekends, h o lid a y s , and late sh ifts . Includes data fo r re g io n s in add ition to those show n sep arate ly .
N O TE: D ash es in d ica te no data re p o rte d o r data that do not m eet p u b lica tion c r ite r ia .
Digitized for FRASER http://fraser.stlouisfed.org/ Federal Reserve Bank of St. Louis

Table 15. Occupational Earnings: Brick and StructuraJ Clay Tile— California
(N u m ber and averag e stra ig h t-t im e hou rly earn in gs 1 o f w o rk e r s in se le c te d o ccu p a tio n s , A ugust 1964)
10*
Number of workers receiving straight-tim e hourly earnings of—
O c c u p a t io nJN u m b e r
o fw o r k e r s
A v e r a g e h o u r ly
e a r n in g s 1$ 2 . 0 0
a n d u n d e r $ 2 . 10
$ 2 . 10
$ 2 . 2 0
$ 2 . 20
$ 2 . 30
$ 2 . 3 0
$ 2 . 4 0
$ 2 . 4 0
$ 2 . 50
$ 2 . 5 0
$ 2 . 6 0
$ 2 . 6 0
$ 2 . 7 0
$ 2 . 7 0
$ 2 . 8 0
$ 2 . 8 0
$ 2 . 9 0
$ 2 . 9 0
$ 3 . 0 0
$ 3 . 0 0
$ 3 . 10
$ 3 . 10
$ 3 . 2 0
$ 3 . 20
$ 3 . 3 0
$ 3 . 3 0
$ 3 . 4 0
$ 3 . 4 0
$ 3 . 50
$ 3 . 50
$ 3 . 6 0
$ 3 . 6 0
$ 3 . 7 0
$ 3 . 7 0
$ 3 . 8 0
$ 3 . 8 0
$ 3 . 9 0
$ 3 / 9 0
$ 4 . 0 0
$4. 00
and o v e r
A l l p r o d u c t io n w o r k e r s 2 — ~ 1 , 0 1 6 $ 2 . 53 3 0 2 8 3 1 07 4 4 4 5 1 4 6 36 1 0 3 7 4 2 4 8 2 3 2 8 2 2 12 1 - 10 10 6 4
S e le c t e d o c c u p a t io n s 2
D r y - p a n o p e r a t o r s 3 4 5 a / — — _ — 15 2 . 61 _ _ 5 . . 1 . 2 7 - - - - - - - - - - - -
G r i n d e r s , c l a y 3 a / __ __ ------------ 7 2 . 2 3 - 2 2 3 - - - - - - - - - - - - - - - - -K i l n f i r e m e n ( p e r i o d i c k i ln ) 3 a / — 11 2 . 9 2 - - - - - 2 - - 4 - - 5 - - - - - - - - -K i ln f i r e m e n ( s c o v e k iln ) 3 a / ------------- 2 2 2 . 15 12 2 5 3 - - - - - - - - - - - - - - - - -K i l n f i r e m e n ( tu n n e l k i l n ) T a / ------------ 34 2 . 5 0 - - - 8 6 16 - - - 4 - - - - - - - - - - -K i l n l o a d e r s ( s c o v e k iln ) 3T 7 — — 32 3 . 2 6 - 7 - - - - - - 5 - - - - - 4 - - 6 4 6 -K i ln s e t t e r s ( p e r i o d i c k iln ) 3 a / _____ 17 2 . 7 4 - - - 1 - 3 - 7 6 - - - - - - - - - - - -K i ln u n l o a d e r s ( t u n n e l k i l n ) ^ ° a / -------- 23 2 . 7 3 - - - - - - 17 - 6 - - - - - - - - - - -M a i n t e n a n c e m e n , g e n e r a l
u t i l i t y 3 a / — ------ 2 0 2 . 8 6 - - - 2 3 - - 9 3 - 1 - - - - - - - - 4 2M e c h a n i c s , a u t o m o t iv e
(m a in t e n a n c e ) 3 a / ------------------------------------ 14 3 . 0 3 - - - - 4 1 - 1 - 3 - 1 - - - - - 2 2 - -O f f • 'b e a r e r s — — ---------------------------------- 2 1 3 2 . 4 2 - 97 16 6 5 34 5 2 0 10 2 - - - 18 - - - - - - -
T i m e ------------ ------ ------ — — — 171 2 . 3 2 - 97 4 6 - 34 - 2 0 10 - - - - - - - - - - - -P o w e r - s h o v e l o p e r a t o r s 3 a / --------------- 15 2 . 9 6 - - - - - 3 1 4 - - 2 3 - - - - - 2 - - -P u g m i l l m e n 3 a / ------------------------------------------ 2 4 2 . 59 - 6 2 3 2 3 - 2 2 2 - - - - - - - - - - 2S o r t e r s , b r i c k 1 a / -------------------------------------- 2 9 2 . 4 1 - 7 10 - - - - 10 2 - - - - - - - - - - - -T r u c k d r i v e r s 3 aTs -------------------------------------- 4 9 3 . 19 - - - - 4 - - - - - - 9 2 6 4 6 - - - - - -
H e a v y ( o v e r 4 t o n s , t r a i l e rt y p e ) * a / -------------------------------------------------- 4 4 3 . 2 0 - - - - 4 - - - - - - 4 2 6 4 6 - - - - - -
T r u c k e r s , p o w e r ( f o r k l i f t ) 3 a / ---------- 8 8 2 . 3 9 18 2 8 7 6 16 3 5 5
1 Excludes premium pay for overtim e and for work on weekends, holidays, and late shifts.2 A ll production workers were men.3 Insufficient data to warrant presentation of separate averages by method of wage payment; (a) all or predominantly tim ew orkers, and (b) all or predominantly incentive workers.4 W orkers were at $4. 30 to $ 4 .4 0 .5 Includes a ll drivers regardless of size and type of truck operated.
Digitized for FRASER http://fraser.stlouisfed.org/ Federal Reserve Bank of St. Louis
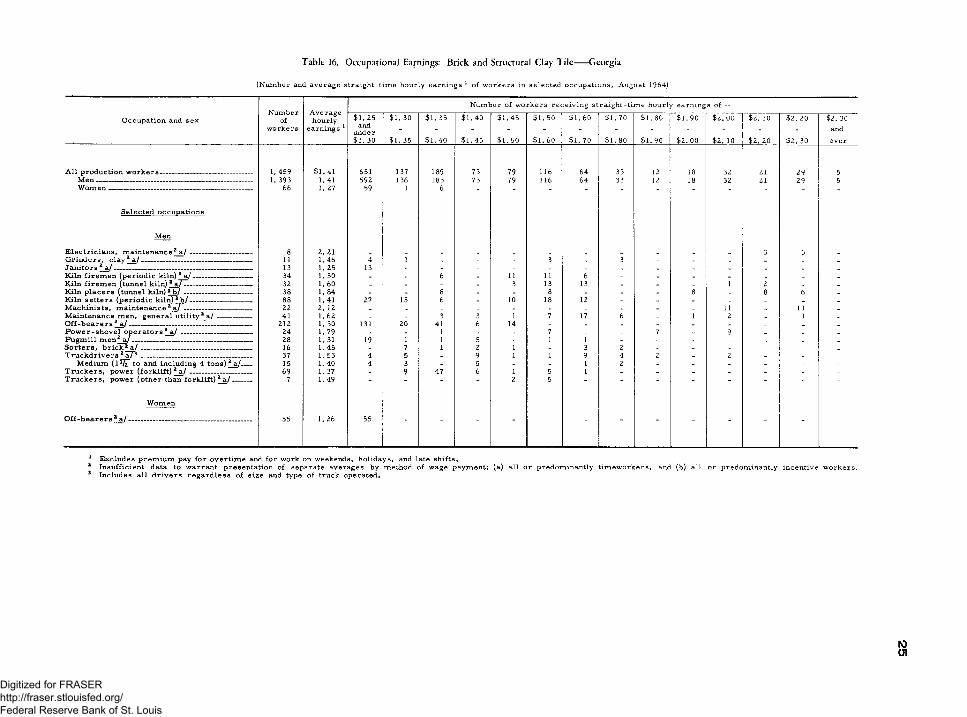
(Number and average straight-time hourly earnings 1 of workers in selected occupations, August 1964)
Table 16. Occupational Earnings: Brick and Structural Clay Tile-----Georgia
Number of workers receiving straight-tim e hourly earning s of—N u m b e r
o fA v e r a g eh o u r lyO c c u p a t io n an d s e x $ 1 . 2 5
and$ 1 . 30 $ 1 . 35 $ 1 . 4 0 $ 1 . 4 5 $ 1 . 5 0 $ 1 . 6 0 $ 1 . 7 0 $ 1 . 8 0 $ 1 . 9 0 $ 2 . 0 0 $ 2 . 10 $ 2 . 2 0 $ 2 . 30
w o r k e r s e a r n in g s 1 - - - - - - - - - - - - and$ 1 . 30 $ 1 . 35 $ 1 . 4 0 $ 1 . 4 5 $ 1 . 5 0 $ 1 . 6 0 $ 1 . 70 $ 1 . 8 0 $ 1 . 9 0 $ 2 . 0 0 $ 2 . 10 $ 2 . 2 0 $ 2 . 30 over
A l l p r o d u c t io n w o r k e r s ---------------------- ----------------- ------------- 1, 4 5 9 $ 1 . 41 6 5 1 1 3 7 189 7 3 79 1 1 6 6 4 33 12 18 32 21 2 9 5M e n __________________________________________________________ 1, 3 9 3 1 .4 1 5 9 2 1 36 1 83 73 79 1 16 6 4 33 12 18 32 21 29 5
6 6 1. 27 59 1 6
S e le c t e d o c c u p a t io n s
M e n
E l e c t r i c i a n s , m a i n t p n a n r p ^ a / 8 2. 21 3 5C lrin d e r R , r l a y 2 a / 1 1 1. 4 6 4 1 3 3J a n i t o r s * a / _____ _____ ________ _ _ 13 1 . 2 5 13
"K i ln f i r e m e n ( p e r i o d i c k iln ) 2 a / ______________________ 34 1 . 50 _ 6 I 11 11 6 _ I I I
K i ln f i r e m e n (tu n n e l k i ln ) 2 aj~l------------------------------------- 32 1 . 60 _ _ _ . 3 13 13 _ _ _ 1 2 _ _K i l n p l a r p r s ( t u n n e l k i l n ) 2 h / 38 1 . 8 4 8 8 8 8 6K i ln s e t t e r s ( p e r i o d i c k i l n j ^ b / ------------------------------------ 88 1 . 41 27 15 6 _ 10 18 12 _ _ _ _M a ch in is ts , m a in ten a n ce* a / _ _ _ 22 2. 12 11 11
1M a i n t e n a n c e m e n , g e n e r a l u t i l i t y 2 a / _____________ 41 1 . 6 2 _ _ 3 3 1 7 17 6 _ 1 2 _ _O f f - b e a r e r s 2 a / ----------------------------------------------------------------------- 2 1 2 1. 30 131 20 41 6 14 _ _ _ _ _ _ _ _ _P o w e r - s h o v e l o p e r a t o r s 2 a / ___________________________ 2 4 1 . 79 _ _ 1 _ _ 7 _ _ 7 _ 9 _ _ _P u g m i l l m e n 2 a / -------------------------------------------------- _ 2 8 1 . 31 19 1 1 5 _ 1 1 _ _ _ _ _ _ _S o r t e r s , b r i c k * a / ........... _ 16 1 . 4 5
1 . 537 1 2 1 3 2
T r u c k d r i v e r s 2 a7 "3 __________________________________________ 37 4 5 9 1 1 9 4 2 _ 2 _ I IM e d iu m ( l ^ ~ to a n d in c lu d in g 4 t o n s ) 2 a / -----
T r u c k e r s , p o w e r ( f o r k l i f t ) 2 a / ----------------------------1569
1 . 4 0 1 . 37
4 39 47
56 1 5
11
2 " - - - -
T r u c k e r s , p o w e r ( o t h e r th a n f o r k l i f t ) 2 a / ----------- 7 1. 49 - - - - 2 5 - - - - - -
W o m e n
O f f - b e a r e r s 2 a / ----------------------------------------------------------------------- 55 1 . 26 55
1 Excludes premium pay for overtim e and for work on weekends, holidays, and late shifts.2 Insufficient data to warrant presentation of separate averages by method of wage payment; (a) all or predominantly tim eworkers, and (b) all or predominantly incentive workers.3 Includes all drivers regardless of size and type of truck operated.
1001
Digitized for FRASER http://fraser.stlouisfed.org/ Federal Reserve Bank of St. Louis
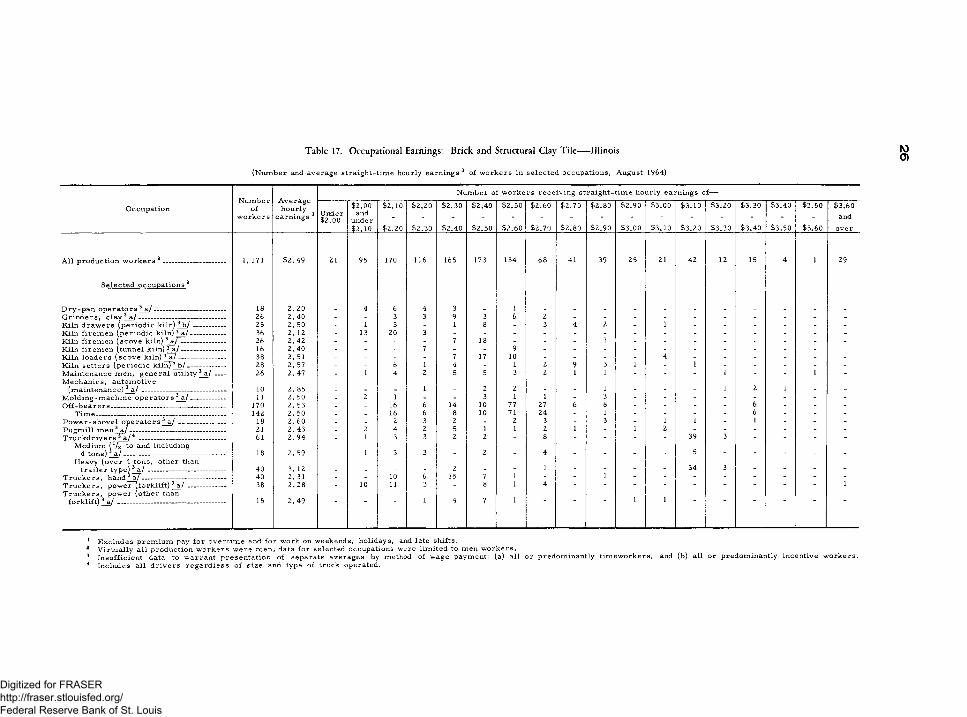
(Number and average straight-tim e hourly earnings 1 of workers in selected occupations, August 1964)
Table 17. Occupational Earnings: Brick and Structural Clay Tile— Illinois
O ccu p a tionN u m ber
o fw o rk e r s
A v e ra g e h ou r ly
ea rn in gs 1
N um ber o f w o rk e r s re c e iv in g s tra ig h t -t im e h ou rly ea rn in gs o f—
Under$2.00
$2.00and
under$2.10
$2.10
$2.20
$2.20
$2.30
$2.30
$2.40
$2.40
$2.50
$2.50
$2.60
$2.60
$2.70
$2.70
$2.80
$2.80
$2.90
$2.90
$3.00
$3.00
$3.10
$3.10
$3.20
$3.20
$3.30
$3.30
$3.40
$3.40
$3.50
$3.50
$3.60
$3.60and
o v e r
A ll p ro d u c tio n w o rk e r s 2 ......... ............. - .......... 1, 171 $ 2 .4 9 21 95 170 116 165 173 134 68 41 39 25 21 42 12 15 4 1 29
S e le c te d o c c u p a t io n s 2
D ry -p a n o p e r a to r s 3 a / --------------------------------- 18 2. 20 _ 4 6 4 3 _ 1 _ _ _ _ _ _ _ _ _ _ _G rin d e rs ; c la y 3 a / - ............................- ................ 26 2. 40 - - 3 3 9 3 6 2 - - - - - - - - - -K iln d r a w e r s (p e r io d ic kiln) 3 b / ................. 25 2. 50 - 1 5 - 1 8 - 3 4 2 - 1 - - - - - -K iln f ir e m e n (p e r io d ic kiln) 3 a / ---------------- 36 2. 12 - 13 20 3 - - - - - - - - - - - - - -K iln fir e m e n (s c o v e kiln) 3 a /T l ----------------- 26 2. 42 - - - - 7 18 - - - 1 - - - - - - - -K iln f ir e m e n (tunnel kiln) 3 a / -------------------- 16 2. 40 - - - 7 - - 9 - - - - - - - - - - -K iln lo a d e rs (s c o v e kiln) 3"a7.......................... 38 2. 51 _ - - - 7 17 10 - - - - 4 - - - - - -K iln se tte rs (p e r io d ic kiln)"3 b / ----------------- 28 2. 57 - - 6 1 4 - 1 2 9 3 1 - 1 - - - - -M ain ten ance m en , g e n e ra l u tility 3 a / ----- 26 2. 47 - 1 4 2 5 5 3 2 1 1 - - - 1 - - 1 -M e ch a n ics , au tom otiv e
(m a in ten a n ce) 3 a / -------------------------------------- 10 2. 85 - - - 1 - 2 2 - - 1 - - - 1 2 1 - -M o ld in g -m a ch in e o p e r a to r s 3 a / ---------------- 11 2. 50 - 2 1 - - 3 1 1 - 3 - - - - - - - -O f f -b e a r e r s ...... ............. - ..................... —............. — 170 2. 53 - - 16 6 14 10 77 27 6 8 - - - - 6 - - -
T im e ----------------------------------------------------------- 142 2. 50 _ _ 16 6 8 10 71 24 - 1 - - - - 6 - - -P o w e r -s h o v e l o p e r a to r s 3 a / --------------------- 18 2. 60 - - 2 3 2 - 2 3 - 3 - 1 1 - 1 - - -P u g m ill m e n 3 a/ -------------------------------------------- 21 2. 43 - 2 4 2 5 1 1 2 1 - 1 2 - - - - - -T ru ck d r iv e r s T a / 4 ....................- .......................... 61 2. 94 - 1 3 3 2 2 - 8 - - - - 39 3 - - - -
M ed ium and in clu din g4 tons) a / —------------------------------------------- 18 2. 59 - 1 3 3 - 2 - 4 - - - - 5 - - - - -
H eavy (o v e r 4 tons, o th er thant r a ile r type) 3 a / — .................................... - 40 3. 12 - - - - 2 - - 1 - - - - 34 3 - - - -
T ru ck e r s , hand 3 aT -------------------------------------- 40 2. 31 - - 10 6 15 7 1 - - 1 - - - - - - - -T ru c k e rs , p o w e r"! fo r k li ft ) 3 a / ........... .......... 38 2 .2 8 - 10 11 3 - 8 1 4 - - - - - - - - - 1T ru c k e rs , p o w e r (o th e r than
fo r k lift ) 3 a/ — - ................................. .................... 15 2 .4 9 1 4 7 1 1 1
1 Excludes premium pay for overtim e and for work on weekends, holidays, and late shifts.2 Virtually all production workers were men; data for selected occupations were limited to men workers.3 Insufficient data to warrant presentation of separate averages by method of wage payment; (a) all or predominantly tim eworkers, and (b) all or predominantly incentive workers.4 Includes all drivers regardless of size and type of truck operated.
Digitized for FRASER http://fraser.stlouisfed.org/ Federal Reserve Bank of St. Louis
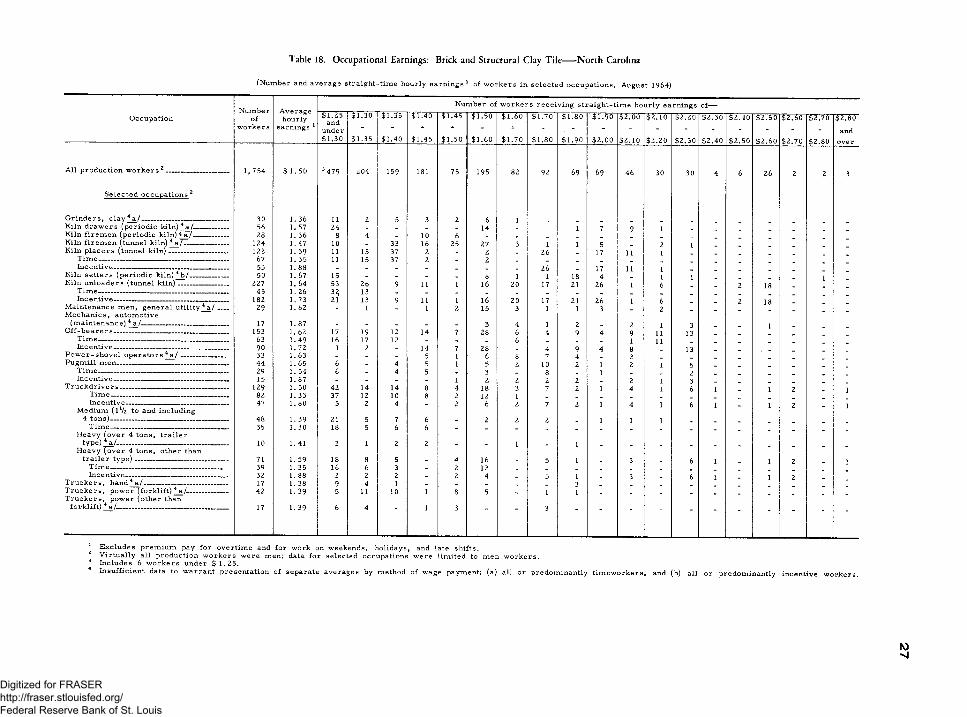
Table 18. Occupational Earnings: Brick and Structural Clay Tile-----North Carolina
(N um ber and a vera g e stra ig h t-t im e h ou rly e a r n in g s 1 o f w o rk e r s in s e le c te d o ccu p a tio n s , A ugust 1964)
O ccu p a tionN um ber
o fwo rk e rs
A v era g e hourly
earn ings 1
N um ber o f w o rk e r s re c e iv in g s tra ig h t-t im e h ou r ly ea rn in gs o f—$1.25
andunder$1 .30
$1 .30
$1.35
$1.35
$1.40
$1.40
$1.45
$1.45
$1 .50
$1.50
$1 .60
$1 .60
$1 .7 0
$1.70
$1 .80
$1 .80
$1 .90
$1 .90
$2 .00
$2.00
$2.10
$2.10
$2 .20
$2.20
$2 .30
$2.30
$2.40
$2 .40
$2 .50
$2 .50
$2 .60
$2.60
$2 .70
$2.70
$2.80
$2.80
ando v e r
A ll p ro d u c tio n w o rk e r s 2 3_______________ __ 1, 754 $ 1. 50 3 479 204 159 181 75 195 82 92 69 69 46 30 30 4 6 26 2 2 3
S e le c te d o ccu p a tio n s 2
G rin d e r s , c l a y 4 a / __________________________ 30 1 .36 11 2 5 3 2 6 1K iln d r a w e r s (p e r io d ic k i ln )4 a /__________ 56 1. 57 24 _ _ _ _ 14 _ 1 7 9 1K iln f ir e m e n (p e r io d ic kiln ) 4 a / __________ 28 1. 36 8 4 _ 10 6 _ _K iln f ir e m e n (tunnel kiln) 4 a J Z i_________ - 124 1 .47 10 _ 33 16 25 27 3 1 1 5 2 1K iln p la c e r s (tunnel k i ln )__________________ 122 1 .59 11 15 37 2 _ 2 _ 26 17 11 1
T im e ______ __________ __________ __ ___ 67 1. 35 11 15 37 2 _ 2 _ _ _In cen tive_________ _____________ _______ 55 1 .8 8 _ _ _ _ _ _ _ 26 _ 17 11 1
K iln s e tte r s (p e r io d ic k i ln )4b / 50 1 .67 15 _ _ _ _ 8 1 1 18 4 1 1 1K iln u n lo a d e rs (tunnel k i ln )___________ __ 227 1. 64 53 26 9 11 1 16 20 17 21 26 1 6 2 18T im e ---------------- ------------------- __ _____ _ 45 1 .2 6 33 13 _ _ _ _ _ _ _ _ _
In cen tive____________ ________________ 182 1 .73 21 13 9 11 1 16 20 17 21 26 1 6 2 18M ain ten ance m en , g e n e ra l u tility 4 a / ___ 29 1 .6 2 _ 1 _ 1 2 15 3 1 1 3 2M e ch a n ics , a u tom otive
(m a in ten a n ce ) 4 a /__________________________ 17 1 .87 - . _ _ _ 3 4 1 2 _ 2 1 3 1O f f - b e a r e r s ______ ___ 153 1 .6 2 17 19 12 14 7 28 6 4 9 4 9 11 13 _T im e ----------------------- ------------- 63 1 .49 16 17 12 _ _ _ 6 _ _ 1 11In cen tive____________ ___ .. 90 1 .72 1 2 _ 14 7 28 _ 4 9 4 8 13P o w e r -s h o v e l o p e r a to r s 4 a / 33 1 .63 - _ _ 5 1 6 8 7 4 2 _
P u g m ill m e n _________ ________________ _ __ 44 1 .6 5 6 _ 4 5 1 5 2 10 2 1 2 1 5T im e ----------------------------------------------------------- 29 1. 54 6 _ 4 5 _ 3 _ 8 1 2In ce n tiv e ----------------------------- 15 1 .87 _ _ _ _ 1 2 2 2 2 2 1 3
T r u c k d r iv e r s ________ ___ _________________ 129 1. 50 42 14 14 8 4 18 3 7 2 1 4 1 6 1 1 2 1T im e -------------------- ---- ------------- ------ 82 1. 33 37 12 10 8 2 12 1 _ _ _ _In cen tive— - _ __ _____ _______ 47 1 .8 0 5 2 4 _ 2 6 2 7 2 1 4 1 6 1 1 2 1
M edium ( 1 V2 to and in clu d in g4 to n s )---------------------------------------- 48 1 .39 21 5 7 6 _ 2 2 2 _ 1 1 1
T im e ---------------- ----------- 35 1 .30 18 5 6 6 _ _ _ _ _H eavy (o v e r 4 ton s , t r a ile r
type) 4 a / --------------------------------------------------- 10 1.41 3 1 2 2 _ _ 1 _ 1 _ _H eavy (o v e r 4 ton s , o th e r than
tr a ile r t y p e ) ------------------------------------------ 71 1. 59 18 8 5 _ 4 16 _ 5 1 _ 3 _ 6 1 1 2 1T im e __________ ______________________ 39 1. 35 16 6 3 _ 2 12 _ _ _ _ _In cen tive______ „ ___________________ 32 1 .8 8 2 2 2 _ 2 4 _ 5 1 _ 3 6 1 1 2 1
T r u c k e r s , h a n d 4 a / _________________________ 17 1. 38 9 4 1 _ _ _ _ 3T r u c k e r s , p ow er~ (fork lift) 4 a /____________ 42 1 .3 9 5 11 10 1 8 5 _ 1 1 _
T r u c k e r s , p ow er (o th e r thanfo r k lift ) 4 a / . ..................... ....................................... 17 1 .39 6 4 1 3 3
1 E x clu d es p rem iu m pay fo r ov e rtim e and fo r w ork on w eekend s, h o lid a y s, and late sh ifts .V ir tu a lly a ll p rod u ction w o r k e r s w ere m en; data fo r se le cted occu p a tion s w ere lim ite d to m en w o rk e r s .
3 Includes 6 w o rk e r s under $ 1 .2 5 .In su ffic ien t data to w arra n t p resen ta tion o f sep arate a vera g es by m ethod o f w age paym ent; (a) a ll o r p redom in an tly t im e w o rk e rs , and (b) a ll o r p redom in an tly in cen tiv e w o rk e rs .
10
Digitized for FRASER http://fraser.stlouisfed.org/ Federal Reserve Bank of St. Louis
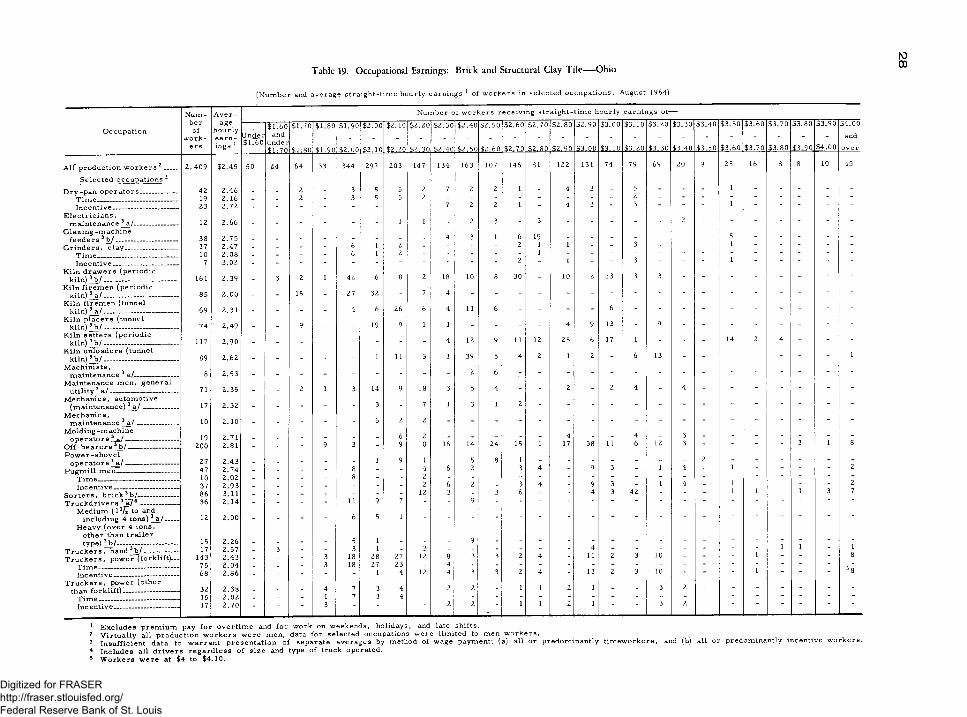
Table 19. Occupational Earnings: Brick and Structural Clay Tile— Ohio
(Number and average straight-time hourly earnings 1 of workers in selected occupations, August 1964)
N u m - A v e r - N um ber o f w o rk e rs re ce iv in g stra ig h t- tim e h ou rly ea rn in gs o f-b er age $1.60 $1.70 $1.80 $1.90 $2.00 $2.10 $2.20 $2.30 $2.40 $2.50 $2.60 $2.70 $2.80 $2.90 $3.00 $3.10 $3.20 $3.30 $3.40 $3.50 $3.60 $3.70 $3.80 $3.90 $4.00
O ccu p a tion o fw o rk -
h ou rlye a rn - Under
$1.60and
$3.70 $4.00and
e r s m gs 1 $1.70 $1:80 $1.90 $2.00 $2.10 $2.20 $2.30 $2.40 $2.50 $2.60 $2.70 $2.80 $2,90 $3.00 $3.10 $3.20 $3.30 $3.40 $3.50 $3.60 $3.80 $3.90 o v e r
A l f p ro d u c tio n w o rk e r s 2 ------ 2, 409 $2.45 50 24 64 33 344 297 203 147 134 163 107 146 81 122 131 74 79 69 20 9 25 16 8 8 10 45
S e le c te d occu p a tio n s 242 2.46 _ _ 2 _ 3 5 5 2 7 2 2 1 - 4 3 - 5 - - - 1 - - - - -19 2.16 _ 2 3 5 5 2 223 2.72 _ _ _ _ _ _ _ _ 7 2 2 1 - 4 3 - 3 - - - 1 - - - - -
E le c t r ic ia n s ,12 2.66 _ _ - _ - _ 1 1 - 2 3 - 3 - - - - - 2 - - - - - " ■
G la z in g -m a ch in e1938 2.75 _ _ - - - - 4 3 1 6 - - - - - - 5 ~ - “
17 2.47 _ _ _ _ 6 1 2 - - - - 2 1 1 - - 3 - - - 1 - - - - -10 2.08 _ _ _ _ 6 1 2 - - - - - 1 - - - - - - - - - - - - -
7 3.02 _ _ _ _ _ _ - - - - - 2 - 1 - - 3 - - - 1 - - - - -
30 10 13161 2.39 _ 3 2 1 42 6 8 2 18 10 8 - 2 3 3 - - - - - - “ “K iln f ir e m e n (p e r io d ic
85 2.00 _ _ 15 - 27 32 - 7 4 " “K iln f ir e m e n (tunnel
26 11k i l r ) 3 a / 69 2.31 _ _ _ - 4 6 6 4 6 - - - 6 - - “ “ “ "K iln p la c e r s (tunnel 13| pj h / ... . _ ____ 74 2.49 _ _ 9 - - 19 9 1 1 - - - - 4 9 9 - “ “ _ “ _ “K iln se tte r s (p e r io d ic
11 12 25 17 14k i ln )3h / - 117 2.90 _ _ _ _ _ - - 4 12 9 6 1 - - - 2 4 “ “ "K iln u n lo a d e rs (tunnel
39 13|r-j In) H / ___ ______ _____ 89 2.62 _ _ _ - - 1 11 3 1 5 4 2 1 2 - 6 ■ - “ " 1M a ch in is ts ,
YY yntpnanrp a / 8 2.53 _ _ _ _ - 2 6 “M ain ten ance m en , g e n e ra l
u tility 3 a / ------------------------------- 71 2.35 - “ 2 1 3 14 9 18 3 5 4 - - 2 - 2 4 ■ 4 " _ _ ~ “ “M ech an ic s , au tom otive
(tT) aintpnanrft) a./ _ 17 2 .32 _ _ _ - - 3 - 7 1 3 1 2M e ch a n ics ,
p y j ^ a / 10 2. 10 _ _ _ _ - 6 2 2 - ■M old ing -m a ch in e
o p e r a to r s 3 a / ________________ 19 2.71 6 2 . . _ _ _ 4 _ _ 4 _ 3 _ _ - - - - -O f f -b e a r e r s 3 b / --------------------- -P ow e r - sh o v e l
200 2.81 - 9 3 " 9 10 16 14 24
8
15 i 17 38 11 6 12 3 3 1 8
y > p e r s a/ _ _ ___ _ 27 2.43 _ _ - - 1 9 1 - 5 1 - - - - - - - 2 - ■ ■ - “ “Pug-m ill m en ____ ______ 47 2 .74 _ _ _ _ 8 _ - 4 6 2 - 3 4 - 9 3 - 1 4 - i - - - - 2
810 2.02 2In cen tive _______________ 37 2.93 _ _ _ _ _ - 2 6 2 - 3 4 - 9 3 - 1 4 - i - - - - 2
S orter® , 86 3.11 _ _ _ _ _ _ - 12 3 - 3 6 - - 4 3 42 - - - i i - 1 3 7rp r u c ^ d r i - 36 2. 14 _ 11 9 7 _ _ 9 _ - - - - - - - - - - - - - - -
M edium ( l ^ t o andin clu d in g 4 tons) 3 a / ------
H eavy (o v e r 4 ton s ,- - - - 6 5 1 - -12 2.00
oth er than t r a ile r type) ^ b /--------------------------- 15 2.26 _ _ _ _ 5 1 - - - 9 - - - - - - - - - - - - - - - -
T ru c k e rs h a n d^ h / 17 2.57 3 3 1 3 4T r u c k e r s , pow er~ (fork lift)— 143 2.43 - - - 3 18 28 27 12 8 3 3 2 4 - 11 2 3 10 - - - i - " 8
75 2 .04 _ 3 18 27 23 4Incpntiv^ - ,»ir, __ 68 2.86 _ _ _ _ _ 1 4 12 4 3 3 2 4 - 11 2 3 10 - - - i - - - 5 8
T r u c k e r s , p ow er (o th er3than fo rk lift ) -r ____ 32 2.38 _ 4 7 4 2 2 1 1 2 1 - 3 2
15 2.02 _ _ _ 1 7 3 4 - -
In ce n tiv e -------------------------------------- 17 2.70 - - - 3 “ " " " 2 2 1 1 2 1 ■ '3 2
1 Excludes premium pay for overtim e and for work on weekends, holidays, and late shifts.2 Virtually all production workers were men; data for selected occupations were limited to men workers.3 Insufficient data to warrant presentation of separate averages by method of wage payment; (a) all or predominantly tim ew orkers, and (b) all or predominantly incentive workers.4 Includes all drivers regardless of size and type of truck operated.5 W orkers were at $4 to $4.10.
Digitized for FRASER http://fraser.stlouisfed.org/ Federal Reserve Bank of St. Louis

Table 20. Occupational Earnings; Brick and Structural Clay Tile— Pennsylvania
(N um ber and averag e s tra ig h t-t im e hou rly ea rn in gs 1 o f w o rk e rs in s e le c te d occu p a tio n s , July 1964)
O ccu p a tion
N um b erof
w o rk e rs
A v e r -age
hourly e a rn ings 1
1, 860 $2. 34
26 2. 0919 2. 1913 1.91
169 2 .4 9107 2 .0 0
56 2. 1263 3. 17
140 2. 65129 3. 12
6 2. 39
44 2 .2 616 2. 2610 2 .4 8
118 2. 3696 2. 4312 2 .4 739 2 .2 922 2. 0417 2. 6326 2 .4 4
24 2 .4 324 2. 2813 2 .4 866 2. 05
N um ber o f w o rk e rs re c e iv in g s tra ig h t -t im e h ou rly earn in gs of—
$1.50 $1.60 $1.70 $1.80 $1.90 $2.00 $2.10 $2.20 $2.30 $2.40 $2 .50 $2 .60 $2.70 $2.80 $2.90 $3.00 $3.10 $3.20 $3.30 $3.40 $3.50 $3.60 $3.70 $3.80and
under - - - - - - - - - - - - - - - - - - - - - and
$1.60 $1.70 $1.80 $1.90 $2,00 $2,10 $2.20 $2 .30 $ 2 ,j0 $?.5Q $2.60 1 1 . 2 0 $2.80 .$2,30. $3.00 $3.10 $3.20 $3.30 $3.40 $3.50 $3.60 $3.70 $3.80 o v e r
3 53 30 51 35 218 383 202 ID 7 88 153 100 90 32 35 33 68 56 38 10 9 5 11 29 24
1 9 7 5 2 1 1_ _ _ 2 _ 10 3 - - 1 - - - 3_ 2 _ _ 8 3 _ _ __ _ _ _ _ 1 - 30 27 63 3 19 15 - - 2 2 7 - - - - - -
18 . _ _ 3 39 41 5 1_ _ _ 6 _ 8 33 _ 9_ _ _ _ _ 10 _ _ . _ _ 1 _ - - 5 19 4 - - - 9 15 -_ _ _ _ _ 6 2 _ 3 26 36 22 10 9 _ 26- - - - 10
1 512 12 21 19 23 6 8 - 8 10
14 14 13 2 1_ _ _ _ _ 2 _ 9 4 1_ _ 1 _ . _ _ _ 1 _ 4 4_ _ _ _ 25 19 3 _ 5 18 32 - - - 16 - - - - - - - - -_ _ _ _ 25 _ _ _ 5 18 32 _ - - 16_ _ _ _ _ 1 _ 4 _ 4 _ _ - _ - 3- - - 1
13 21
21- - 1 - 5 2 - - 3 1 1 1 - - - - - -
3 1 I 5 2 " _ 3 1 1 1 _ _ _ _ _ _
- - - 3 - 6 4 - - - 4 8 1
3 5 4 _ . . 4 8_ _ _ _ 2 8 1 _ 3 5 3 2 -
3 5 3 27 2 6 17 26 8
A ll production workers 1 2 3-----------------
Selected occupations2
D ry-pan operators 4 a / ---------------------Grinders, c la y 4 a / ----------------------------Janitors 4 a / ----------------------------------------Kiln drawers (periodic kiln) 4b / — Kiln firem en (periodic kiln) 4 a / —Kiln firem en (tunnel kiln) 4 a / —-----Kiln placers (tunnel kiln) 4b / --------Kiln setters (periodic k iln j^ b /-----Kiln unloaders (tunnel kiln)"*b/ —Machinists, maintenance 4 a7T-------Maintenance men, general
utility 4 a/ -----------------------------------------M olders, hand 4 a / ----------------------------M olding-m achine operators4b / —O ff-b e a rers----------------------------------------
Incentive---------------------------------------Pow er-shovel operators 4 a / ---------Pugm ill men_________________________
T im e_______________________________Incentive__________________________
Truckdrivers 4 a / 5 ----------------------------Heavy (over 4 tons, other than
trailer type) 4 a / -----------------------Truckers, hand---------------------------------
Incentive----------------------------------------Truckers, power (forklift) 4 a / -----
1 E x clu d e s p re m iu m pay fo r o v e r t im e and fo r w ork on w eekends, h o lida y s , and late sh ifts .2 A ll p r o d u c t io n w o rk e r s w e re m en .3 In clu des 6 w o rk e r s at $ 1. 25 to $ 1. 30, and 8 at $ 1. 35 to $ 1. 40.4 In su ff ic ie n t data to w arra n t p re se n ta tio n o f sep arate a verag es by m ethod o f w age paym ent; (a) a ll o r p redom in an tly t im e w o rk e rs , and (b) a ll o r predom in an tly in cen tiv e w o rk e rs .5 In clu d es a ll d r iv e r s r e g a r d le s s o f s ize and type o f tru ck operated .
10( 0
Digitized for FRASER http://fraser.stlouisfed.org/ Federal Reserve Bank of St. Louis
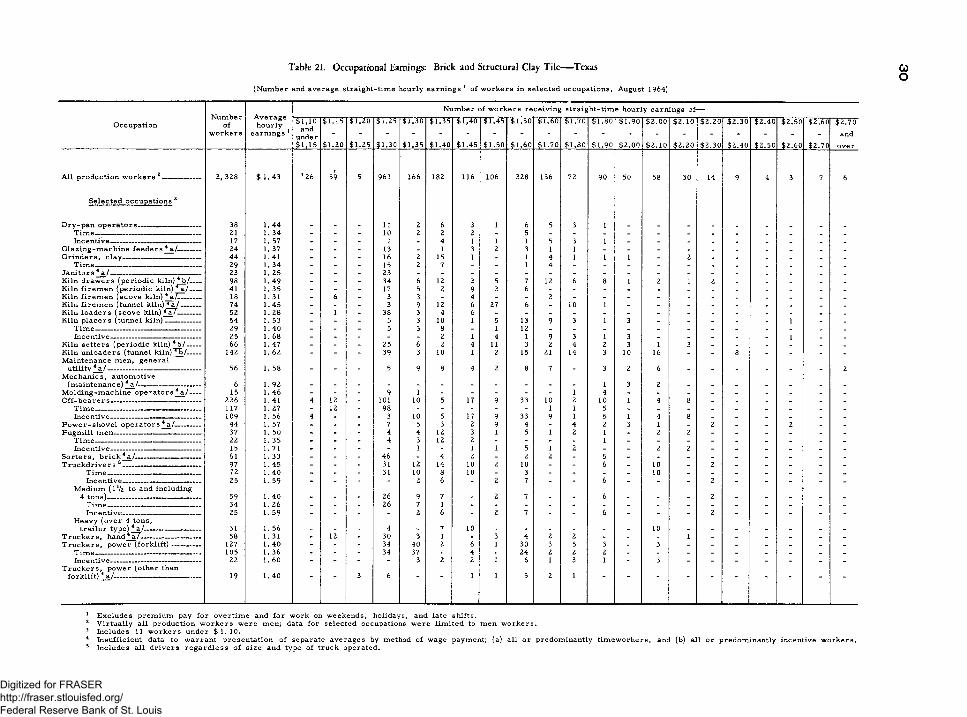
( N u m b e r a n d a v e r a g e s t r a i g h t - t i m e h o u r ly e a r n i n g s 1 o f w o r k e r s in s e l e c t e d o c c u p a t io n s , A u g u s t 1 9 6 4 )
Table 21. Occupational Earnings: Brick and Structural Clay Tile— Texas
O c c u p a t io nN u m b e r
o fw o r k e r s
A v e r a g e h o u r l y
e a r n in g s 1
N u m b e r o f w o r k e r s r e c e iv i n g s t r a i g h t - t i m e h o u r ly e a r n in g s of-
$ 1 ,1 0an d
u n d e r$ 1 .1 5
$ 1 .1 5
$ 1 .2 0
$ 1 .2 0
$ 1 .2 5
$ 1 .2 5
$ 1 .3 0
$ 1 ,3 0
$ 1 .3 5
$ 1 .3 5
$ 1 .4 0
$ 1 ,4 0
$ 1 .4 5
$ 1 .4 5
$ 1 .5 0
$ 1 .5 0
$ 1 .6 0
$ 1 .6 0
$ 1 .7 0
$ 1 .7 0
$ 1 .8 0
$ 1 .8 0
$ 1 .9 0
$ 1 .9 0
$ 2 .0 0
$ 2 . 0 0
$ 2 .1 0
$ 2 .1 0
$ 2 .2 0
$ 2 .2 0
$ 2 .3 0
$ 2 .3 0
$ 2 .4 0
$ 2 .4 0
$ 2 .5 0
$ 2 .5 0
$ 2 .6 0
$ 2 .6 0
$ 2 .7 0
$ 2 .7 0
a n d
o v e r
A l l p r o d u c t io n w o r k e r s 2 3 — __________ 2 , 3 2 8 $ 1 . 4 3 3 2 6 59 5 961 166 1 8 2 116 106 2 2 8 1 3 6 7 2 9 0 50 58 3 0 14 9 4 3 7 6
S e le c t e d o c c u p a t io n s 2
D r y - p a n o p e r a t o r s — —---------------------------- 3 8 1 . 4 4 _ _ _ 11 2 6 3 1 6 5 3 1 . .
T i m e ------ - ------ - _ -------- 21 1 . 3 4 - - - 10 2 2 2 - 5 - - - _ - _ _ _ _ _ _ _In c e n t i v e _____ ______ ____________________ 17 1 . 57 _ _ - 1 _ 4 1 1 1 5 3 1 _ _ _ _ _ _ _ _ _
G l a z i n g - m a c h i n e f e e d e r s 4 a / ------------- 2 4 1 . 3 7 - - - 13 - 1 3 2 3 1 1 - _ _ _ _ _ _ _ _ _G r i n d e r s , c l a y -------------------------------------- ------- 4 4 1 . 4 1 - - - 16 2 15 1 - 1 4 1 1 1 _ 2 _ _ _ _ _ _
T i m e _______________ ________________ ______ 2 9 1 . 3 4 _ _ _ 15 2 7 _ _ 1 4 _ _ _ _ _ _ _ _ _ _ _J a n i t o r s 4 a / __- ________- __________ __________ 23 1 . 2 5 - _ - 23 - - _ - - _ _ _ _ _ _ _ _ _ _ _ _K i ln d r a w e r s ( p e r i o d i c k i l n ) 4 b / ____ 9 8 1 . 4 9 _ _ _ 3 4 6 12 2 5 7 12 6 8 1 2 1 2 _ _ _ _ _K i ln f i r e m e n ( p e r i o d i c k iln ) <i,/ ------ 41 1 . 3 5 _ _ - 17 5 2 9 2 6K i ln f i r e m e n ( s c o v e k iln ) 4 a 7IZ.-------- 18 1 . 3 1 _ 6 _ 3 3 _ 4 _ _ 2 _ _ _ _ _ _ _ _ _ _ _K i ln f i r e m e n ( tu n n e l k iln ) 4 a / _______ 7 4 1 . 4 5 _ _ - 3 9 12 6 27 6 _ 10 1 _ _ _ - _ _ _ _ _K i ln l o a d e r s ( s c o v e k iln ) 4 a / ------------- 5 2 1 . 2 8 - 1 - 3 8 3 4 6 - - - - _ _ _ _ _ _ _ _ _ _K i ln p l a c e r s ( tu n n e l k i l n ) --------------------- 5 4 1 . 5 3 _ _ _ 5 3 10 1 5 13 9 3 1 3 _ _ _ _ _ 1 _ _
T i m e ________________________________________ 2 9 1 . 4 0 _ _ - 5 3 8 _ 1 12I n c e n t i v e ----------------------------- --------------- 2 5 1.68 - _ - _ _ 2 1 4 1 9 3 1 3 _ _ _ . _ 1 _ _
K i ln s e t t e r s ( p e r i o d i c k i l n ) 4 b / -------- 66 1 . 4 7 _ _ _ 2 5 6 2 4 11 3 2 4 2 3 1 3 _ _ _ _ _ _K i ln u n l o a d e r s ( tu n n e l k i ln ) "5^ / -------- 1 4 2 1 . 6 2 - - - 3 9 3 10 1 2 15 21 14 3 10 16 _ - 8 _ _ _ _M a in t e n a n c e m e n , g e n e r a l
u t i l i t y 4 a / ___________________________________ 5 6 1 . 5 8 - - - 5 9 8 4 2 8 7 - 3 2 6 - - - - - _ 2M e c h a n i c s , a u t o m o t iv e
(m a in t e n a n c e ) 4 a / ------------------------------- - 6 1 . 9 2 - - - - - - - - - - - 1 3 2 - - - - - - -M o l d i n g -m a c h i n e o p e r a t o r s 4 a / ------ 15 1. 4 6 - - - 9 1 - - - - - 1 4 - - - - - - - _ -O f f - b e a r e r s ------------------------------------------ --------- 2 2 6 1 . 4 1 4 12 - 101 10 5 17 9 3 3 10 2 10 1 4 8 - _ _ - _ _
T i m e ---------------------------- - — - - 1 1 7 1 . 27 - 12 - 9 8 - - - - - 1 1 5 - - - - _ _ _ _ _I n c e n t i v e ---------------------------------------------------- 1 0 9 1 . 5 6 4 - - 3 10 5 17 9 33 9 1 5 1 4 8 _ _ _ _ _ _
P o w e r - s h o v e l o p e r a t o r s 4 a / --------------- 4 4 1 . 57 - - - 7 5 3 2 9 4 - 4 2 3 1 - 2 _ _ 2 _ _P u g m i l l m e n ------------------------------------------------- 37 1 . 5 0 - - - 4 4 12 3 1 5 1 2 1 - 2 2 - - - - - -
T i m e _______ - _____________ __________ _____ 22 1 . 3 5 - - - 4 3 12 2 - - - - 1 - - - - - - _ _ _In c e n t iv e ______ ____________________ _____ 15 1 .7 1 - - - - 1 - 1 1 5 1 2 - - 2 2 _ _ _ _ _ _
S o r t e r s , b r i c k 4 a / -------------------------------------- 61 1 . 3 3 - _ - 4 6 - 4 2 - 2 2 - 5 _ _ _ _ _ _ _ _ .T r u c k d r i v e r s 5 ------ - ------- — - 97 1 . 4 5 _ _ - 31 12 14 10 2 10 _ _ 6 _ 10 _ 2 _ _ _ _ _
T i m e --------------- — ---------- 7 2 1 . 4 0 - - - 31 10 8 10 - 3 - - - - 10 - - _ _ _ _ _I n c e n t i v e --------------------------------------------- 2 5 1 . 5 9 - - - - 2 6 - 2 7 - - 6 - _ _ 2 _ _ _ _ _
M e d iu m ( 1 V2 to a n d in c lu d in g4 t o n s ) ------------------------------------------------------ 5 9 1 . 4 0 - - - 26 9 7 - 2 7 - - 6 - - - 2 - - - - .
T i m e ---------------------------------------------- — 3 4 1. 2 6 - - - 2 6 7 1 - - - - - - - - - - - - - - _I n c e n t i v e --------------------------------------------- 2 5 1 . 5 9 - - - - 2 6 - 2 7 - - 6 - - - 2 - _ _ _ _
H e a v y ( o v e r 4 t o n s ,t r a i l e r ty p e ) 4 a / --------------------------------- 31 1 . 5 6 - - - 4 - 7 10 - - - - - - 10 - - - - - _ _
T r u c k e r s , h a n d 4 a 7 ---------------------------------- 58 1 . 31 _ 12 _ 3 0 3 1 _ 3 4 2 2 _ _ _ 1 _ _ _ _ _ _T r u c k e r s , p o w e T ~ (fo r k lift ) — — 1 2 7 1 . 4 0 - - - 3 4 4 0 2 6 1 3 0 3 5 3 - 3 - - - - _ - _
T i m e ------------------------------------------------------------- 1 0 5 1 . 3 6 - - - 3 4 37 - 4 - 2 4 2 2 2 - - _ _ _ _ _ _ _I n c e n t i v e ---------------------------------------------------- 22 1 . 6 0 - - - - 3 2 2 1 6 1 3 1 _ 3 _ _ _ _ _ _ _
T r u c k e r s , p o w e r (o t h e r th a nf o r k l i f t ) l a / - ----------------------------------------- ------- 19 1 . 4 0 3 6 1 1 5 2 1
1 E x c l u d e s p r e m iu m p a y f o r o v e r t i m e a n d f o r w o r k o n w e e k e n d s , h o lid a y s , a n d l a t e s h i f t s .2 V i r t u a l l y a l l p r o d u c t io n w o r k e r s w e r e m e n ; d a ta f o r s e le c t e d o c c u p a t io n s w e r e l i m i t e d to m e n w o r k e r s .3 In c lu d e s 11 w o r k e r s u n d e r $ 1 . 1 0 .4 I n s u f f i c ie n t d a ta to w a r r a n t p r e s e n t a t i o n o f s e p a r a t e a v e r a g e s b y m e th o d o f w a g e p a y m e n t ; (a ) a l l o r p r e d o m in a n t ly t i m e w o r k e r s , a n d (b ) a l l o r p r e d o m in a n t ly in c e n t iv e w o r k e r s .5 In c lu d e s a l l d r i v e r s r e g a r d l e s s o f s i z e a n d ty p e o f tr u c k o p e r a t e d .
Digitized for FRASER http://fraser.stlouisfed.org/ Federal Reserve Bank of St. Louis
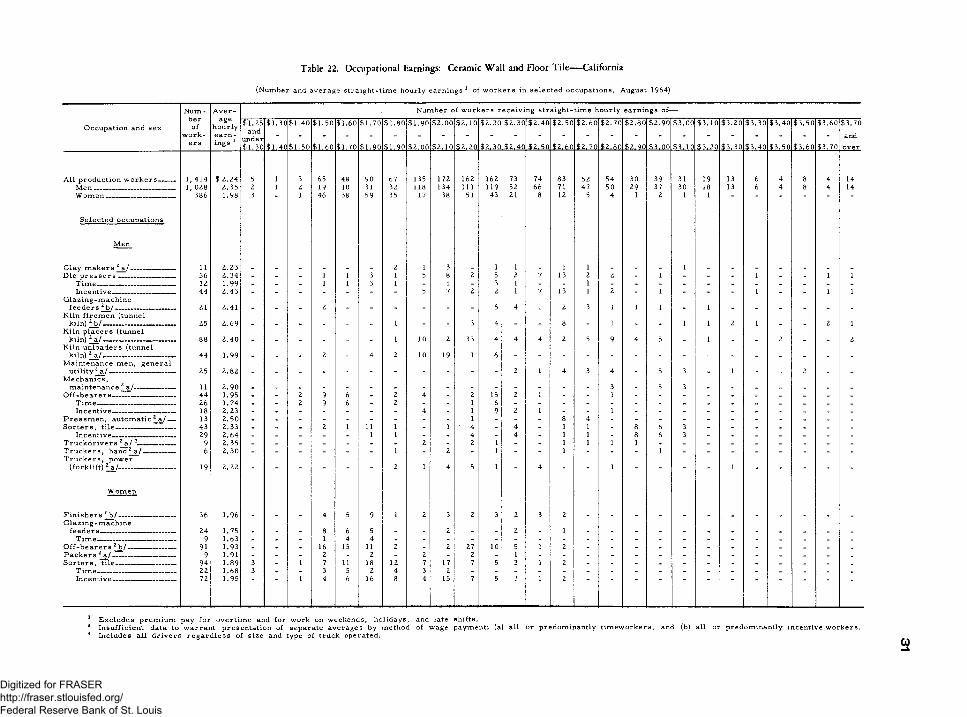
Table 22. Occupational Earnings: Ceramic W all and Floor T ile— California
(Number and average straight-time hourly earnings 1 of workers in selected occupations, August 1964)
O ccu p a tion and se x
N u m - A v e r - N um ber o f w o rk e rs re c e iv in g stra ig h t- tim e h ou rly ea rn in gs o f-
o fage
h ou rly $1.25 $1.30 $1.40 $1.50 $1.60 $1 .7 0 $1 .80 $1 .90 $ 2.00 $ 2.10 $ 2.20 $2 .30 $2 .4 0 $2 .50 $2 .60 $2 .70 $2 .8 0 $2 .90 $3 .00 $3 .10 $3 .20 $3 .30 $3 .40 $3 .50 $3.60 $3.70w o rk - under and
c r a $1.30 $1 .40 $1.50 $1.60 $1.70 $1 .80 $1 .90 $ 2.00 $ 2.10 $ 2.20 $2.30 $2 .40 $2 .50 $ 2,.6 Q $.2,79 $2 .8 0 $2 .90 $3 .00 $3 .1 0 $3 .20 $3 .30 $3 .40 $3 .50 $3 .60 $3.70 over
1, 414 $ 2 .24 5 1 3 65 48 90 67 135 172 162 162 73 74 83 52 54 30 39 31 19 13 6 4 8 4 141, 028 2.35 2 1 2 19 10 31 32 118 134 111 119 52 66 71 47 50 29 37 30 18 13 6 4 8 4 14
386 1.98 3 1 46 38 59 35 17 38 51 43 21 8 12 5 4 1 2 1 1
11 2.23 2 1 3 1 1 1 1 156 2 .34 _ _ _ 1 1 3 1 5 8 2 5 2 7 13 2 2 _ 1 _ _ _ 1 _ _ 1 112 1.99 _ _ _ 1 1 3 1 _ 1 - 3 1 - - 144 2.43 - - - - - - - 5 7 2 2 1 7 13 1 2 - 1 - - - 1 - - 1 1
21 2.41 - - - 2 - - - - - - 5 4 1 2 3 1 1 1 - 1 - - - - - -
25 2 .69 - - - - - - 1 - - 3 4 - - 8 - 1 - - 1 1 2 1 - - 2 1
88 2 .40 - - - - - - 1 10 2 33 4 4 4 2 5 9 4 5 - 1 - - 2 - - 2
44 1.99 - - - 2 - 4 2 10 19 1 6
25 2.82 2 1 4 3 4 - 5 3 - 1 - - 2 - -
11 2.90 3 _ 5 3 _ _ _ _ _ _ _44 1.95 _ _ 2 9 6 _ 2 4 - 2 15 2 1 - - 126 1.74 _ _ 2 9 6 2 _ _ 1 618 2.23 _ - _ _ - - - 4 - 1 9 2 1 - _ 113 2 .50 _ _ - _ . - _ - - 1 - - - 8 443 2.33 _ _ _ 2 1 11 1 - 1 4 _ 4 - 1 1 - 8 6 3 _ _ - _ _ _ _29 2 .64 _ _ _ _ - 1 1 - _ 4 - 4 - 1 1 _ 8 6 3 _ _ _ _ _ _ _
9 2.35 _ _ _ _ _ _ - 2 _ 2 1 _ _ 1 1 1 16 2 .30 - - - - - 1 - 2 - 1 - - 1 “ - - 1 - - - - - -
19 2.22 - - - - 2 1 4 5 1 - 4 - - 1 - 1 - - -
36 1.96 4 5 9 1 2 3 2 3 2 3 2
24 1.75 _ _ _ 8 6 5 _ _ 2 _ _ 2 _ 19 1.63 _ _ - 1 4 4
91 1.93 - - - 16 15 11 2 - 2 27 10 5 1 29 1.91 - - - 2 - 2 - 2 - 2 - 1
94 1.89 3 _ 1 7 11 18 12 7 17 7 5 3 1 222 1.68 3 _ _ 3 5 2 4 3 272 1.95 1 4 6 16 8 4 15 7 5 3 1 2
A ll p ro d u c tio n w o r k e r s . .
W o m e n -------------------------
S e le c te d occu p a tio n s
C lay m a k e rs 2 a / -D ie p r e s s e r s ________________
In cen tive ---------------------------G la zin g -m a ch in e
fe e d e r s 2b / . ________________K iln f ir e m e n (tunnel
kiln) 2 b /- .K iln p la c e r s (tunnel
kiln) 2 a / -------------------------K iln u n lo a d e rs (tunnel
kiln) 2 a / -M ain ten ance m en , g e n e ra l
M e ch a n ics , m a in ten a n ce 2 a /—
O ff -b e a r e r s --------------------------
In ce n tiv e --------------------------P r e s s m e n , a u tom atic 2 a /~S o r t e r s , t i l e -------------------------
In cen tive_________________T r u c k d r iv e r s 2 a / 3__________T r u c k e r s , h a n d 2 a / —______T r u c k e r s , p o w e r
(fo rk lift) 2 a / -----------------------
F in is h e r s 2 b / _____G la z in g -m a ch in e
fe e d e r s — ——____T im e -----------------
O f f -b e a r e r s 2b / —P a c k e r s 2 a / ----------S o r te r s , t i l e ---------
T im e -----------------In ce n tiv e ----------
E x c lu d e s p r e m iu m pay fo r o v e rt im e and fo r w ork on w eekends, h o lid a y s , and late sh ifts .In su ffic ie n t data to w a rra n t pre se n ta tio n of sep arate a verag es by m ethod o f w age paym ent; (a) a ll o r pred om in an tly t im e w o rk e rs , and (b) a ll or p redom in an tly in cen tive w o rk e rs . In clu des a ll d r iv e r s r e g a r d le s s o f s iz e and type o f tru ck operated .
CO
Digitized for FRASER http://fraser.stlouisfed.org/ Federal Reserve Bank of St. Louis
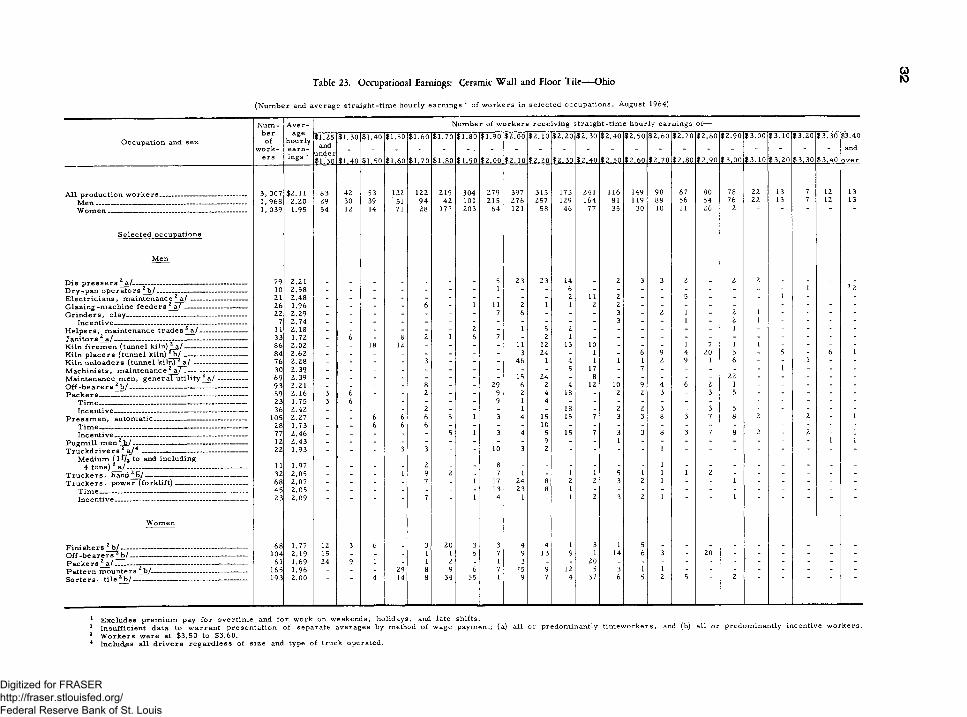
Table 23. Occupational Earnings: Ceramic W all and Floor Tile— Ohio
(Number and average straight-time hourly earnings 1 of workers in selected occupations, August 1964)
O ccu p a tion and se x
A ll p r o d u c tio n w o rk e r s .. M e n ____________________W o m e n _________________
S e le c te d o ccu p a tio n s
D ie p r e a s e r s 1 2 3 a / -----------------------------------D ry -p a n o p e r a to r s 2b / -------------------- —E le c t r ic ia n s , m a in ten a n ce 2 a / ---------G la z in g -m a ch in e fe e d e r s 2 a T ------------G r in d e r s , c la y --------------------------------------
In ce n tiv e _____________________________H e lp e r s , m a in ten a n ce tra d e s 2 a / -----J a n itors 2 a /K iln f ir e m e n (tunnel kiln) 2 a / ----------------K iln p la c e r s (tunnel kiln) 2b / ----------------K iln u n lo a d e rs (tunnel k iln ) 2 a / ------------M a ch in is ts , m ain ten a n ce 2 a /3 --------------M ain ten ance m en , g e n e ra l u t i l ity ^ a / -O f f -b e a r e r s 2 b / -----------------------------------------P a c k e r s -------------------------------------------------------
T im e ____________________________________In ce n tiv e _____________
P r e s s m e n , au tom atic .. T im e --------------------------In cen tive ..
P u g m ill m e n 2 b /T r u c k d r iv e r s 2 a / 4 .
M ed ium ( l ^ t o and in clu d in g4 tons) 2 a /. .
T r u c k e r s , h a n d 2b / --------------T r u c k e r s , pow er~ (fork lift) _
T im e -----------------------------------
F in ish e r s 2 b / -----O f f -b e a r e r s 2b /_ P a c k e rs 2 a / .P attern m o u n te rs 2b /._ S o r t e r s , t i l e 2b / ----------
N u m b e ro f
w o rk -e rs
A v e r -age
h ou rly
ings 1
3, 007 $2.111 ,9 6 8 2.201, 039 1.95
79 2.2110 2.5821 2.4826 1.9622 2.29
7 2.7411 2.1833 1.7286 2.0284 2.6276 2.2830 2.3969 2.3993 2.2159 2.1623 1.7536 2.42
105 2.2728 1.7377 2.4612 2.4322 1.93
11 1.9732 2.0568 2.0745 2.0523 2.09
68 1.77104 2.19
61 1.69165 1.96193 2.00
N um ber o f w o rk e r s re c e iv in g s tra ig h t-t im e h ou r ly ea rn in gs o f—
$1.25 $1.30 $1.40 $1.50 $1.60 $1.70 $1.80 $1.90 $2.00 $2.10 $2.20 $2.30 $2.40 $2.50 $2.60 $2 .70 $2.80 $2.90 $3.00 $3.10 $3.20 $3.30 $3.40and
underand
$1.30 $1.40 $1.50 $1.60 $1.70 $1.80 $1.90 $2.00 $2 .10 $2.20 $2.30 $2.40 $2.50 $2.60 $2.70 $2.80 $2.90 $3 .00 $3 .10 $3.20 $3 .30 $3 .40 o v e r
83 42 53 122 122 219 304 279 397 315 175 241 116 149 98 67 80 78 22 13 7 12 1329 30 39 .51 94 42 101 215 276 257 129 164 81 119 88 56 54 76 22 13 7 12 1354 12 14 71 28 177 203 64 121 58' 46 77 35 30 10 11 26 2
5 23 23 14 2 3 3 2 2 2_ _ _ _ _ _ . 1 _ _ 6 - _ _ _ - _ _ - - 1 - 3 2
2 11 2 - - 5 - - - 1 - - -_ _ _ . 6 _ 1 11 2 1 1 2 2- - - - - - - 7 6 - " - 3 - 2 1
l- 2
21l
- - -
I 2 _ 1 5 2 _ _ _ _ _ 1 _ _ . __ 6 _ 8 2 1 6 7 - 2 1_ _ 18 12 _ _ _ _ 11 12 13 10 _ _ - 1 7 1 1 - - - -_ _ _ . _ _ _ _ 3 24 _ 1 _ 6 9 4 20 5 - 5 - 6 1_ _ _ . 3 _ _ _ 46 1 4 1 1 1 2 9 1 6 - - 1 - -
5 17 _ 7 - - - - - 1 - - -15 24 _ 8 _ - - - - 22 - - - - -_ _ _ . 8 _ _ 29 6 2 4 12 10 9 4 6 2 1 - - - - -
3 6 _ . 2 _ _ 9 2 4 18 - 2 2 3 - 3 5 - - - - -3 6 _ . _ _ - 9 1 4_ _ _ . 2 - _ - 1 - 18 - 2 2 3 - 3 5 - - - - -_ _ 6 6 6 5 1 3 4 15 15 7 3 3 8 3 7 8 2 - 2 - 1_ _ 6 6 6 _ _ - _ 10 _ - - - - - - - - - - - -
- - - - - 5 1 3 4 5 15 7 3 3 8 3 7 8 2 21
1
’ - - 3 3 - ’ 10 3 2 - - - ' 1 - - - - - -
- - -1
29 2
- 87 1
-1 1 5 1
11 1 2
- - : -
_ _ _ _ 7 . 1 17 24 8 2 2 3 2 1 - - 1 - - - - -_ _ . . - _ - 13 23 8 1
7 1 4 1 1 2 3 2 1 1
12 3 6 3 20 3 3 4 4 1 3 1 515 _ . . 1 1 5 7 9 13 9 1 14 6 3 - 20 - - - - - -24 9 1 . 1 2 _ 1 3 _ - 20 - - - - - - - - - - -
_ _ _ 29 8 9 6 7 75 9 12 5 3 1 14 14 8 34 55 1 9 7 4 37 6 5 2 5 2
1 E x c lu d e s p re m iu m pay fo r o v e r t im e and fo r w ork on w eeken d s, holida ys, and late sh ifts .2 In su ffic ie n t data to w a rra n t p re se n ta tio n o f sep arate a vera g es by m ethod o f w age paym ent; (a) a ll o r predom in an tly t im e w o rk e rs , and (b) a ll o r p redom in an tly in cen tiv e w o rk e r s .3 W o rk e rs w e re at $3.50 to $3.60.4 In clu d es a li d r iv e r s re g a r d le s s o f s iz e and type o f tru ck op erated .
Digitized for FRASER http://fraser.stlouisfed.org/ Federal Reserve Bank of St. Louis
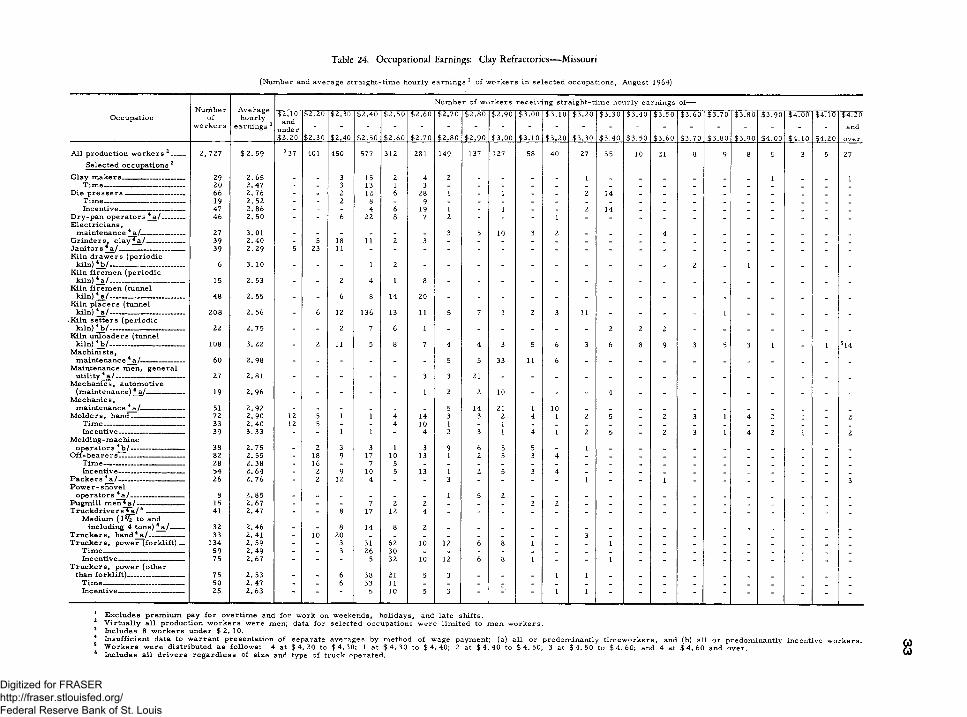
Table 24. Occupational Earnings: Clay Refractories— Missouri
(N um ber and a verage s tra ig h t-t im e h ou rly ea rn in gs 1 o f w o rk e r s in s e le c te d occu p a tio n s , August 1964)
N u m ber o f w o rk e rs re c e iv in g s tra ig h t-t im e h ou r ly earn in gs of-
O ccu pa tionNurnbe r
o fw o rk e r s
A vera g e hourly
earn ings 1
$ 2.10and
under$ 2.20
$ 2.20
$2.30
$2.30
$2.40
$2.40
$2.50
$2 .50
$2.60
$ 2.60
$2.70
$2 .70
$2 .80
$2.80
$2 .90
$2.90
$3.00
$3.00
$3.10
$3.10
$3.20
$3.20
$3.30
$3 .30
$3.40
$3.40
$3.50
$3.50
$3.60
$3 .60
$3 .70
$3 .70
$3 .80
$3 .80
$3 .90
$3 .90
$4.00
$4.00
$4.10
$4.10
$4.20
$4.20and
ov e r
A ll p ro d u ctio n w o r k e r s 2 3------ 2, 727 $ 2 .5 9 3 37 401 450 577 312 281 149 137 127 58 40 27 35 10 21 8 9 8 5 3 5 27S e le c te d o ccu p a tio n s 2
C la y m a k e rs ___________________ 29 2. 65 _ _ 3 15 2 4 2 _ _ _ _ 1 _ _ _ _ _ 1 1T im e ------ - - - - - - ----- 20 2 .4 7 - - 3 13 1 3 - - _ _ _ _ _ _ _ _ _ _ _ _ _
D ie p r e s s e r s — — ------------ 66 2 .7 6 _ _ 2 12 6 28 1 _ 1 _ _ 2 14 _ _ _ _ _ _ _ _ _T im e___ _____ — — 19 2. 52 - _ 2 8 _ 9 _ _ _ _ _ _ _ _ _ _ _ _ _ _ _ _In cen tive— ____ — — _ 47 2 .8 6 - - - 4 6 19 1 _ 1 _ _ 2 14 _ _ _ _ _ _ _ _ _
D ry -p a n o p e r a to r s 4 5 a / ---------- 46 2. 50 - - 6 22 8 7 2 - - - 1E le c t r ic ia n s ,
m a in tenance 4 a /— ___ ____ 27 3. 01 _ _ _ _ _ _ 3 5 10 3 2 _ _ _ 4 _ _ _ _ _ _G rin d e r s , c l a y ^ a / ------------- - 39 2 .4 0 _ 5 18 11 2 3 _ _ _ _ _ _ _ _ _ _ _ _ _ _ _ _J an itors 4 a / ___________________ 39 2 . 29 5 23 11K iln d ra w e rs (p e r io d ic
k iln ) 4b / —____________________ 6 3. 10 _ _ _ 1 2 2 _ 1 _ _ _ _K iln f ir e m e n (p e r io d ic
k iln ) 4 a / ---------------------- ----- 15 2. 53 - - 2 4 1 8 - - _ _ _ _ _ _ _ _ _ _ _ _ _ _K iln fir e m e n (tunnel
k iln ) 4 a / — ______ __ ____ 48 2. 55 _ _ 6 8 14 20 _ _ _ _ _ _ _ _ _ _ _ _ _ _ _K iln p la c e r s (tunnel
kiln ) 4 a / ------------------- -------- _ 208 2. 56 - 6 12 136 13 11 5 7 1 2 3 11 _ _ _ _ 1 _ _ _ _ _*Kiln se tte r s (p e r io d ic
k iln ) 4 b / ------ ---- ---- _ _ 22 2 .7 5 _ _ 2 7 6 1 _ _ _ _ _ _ 2 2 2 _ _ _ _ _ _ _K iln u n lo a d e rs (tunnel
k iln ) 4J o l______________________ 108 3. 22 - 2 11 5 8 7 4 4 3 5 6 3 6 8 9 3 5 3 1 _ 1 514M a ch in is ts ,
60 2 .9 8 5 5 33 11 6M ain ten ance m e n , g e n e ra l
u tility 4 a / ------------------------------- 27 2 . 81 - - - - - 3 3 21 - - - - - _ _ _ _ _ _ _ _ _M e ch a n ics , au tom otiv e
(m a in ten a n ce) 4 a /— _ 19 2. 96 - - - - - 1 2 2 10 - - _ 4 _ - _ _ _ _ _ _ _M e ch a n ics ,
m aintfinanrfi 4 a / 51 2 . 92 _ 5 14 21 1 101M o ld e r s , h a n d ------------------------ 72 2 .9 0 12 5 1 1 4 14 3 3 2 4 2 5 _ 2 3 1 4 2 1 2
Tim fl 33 2. 40 12 5 4 10 1 1In cen tive ------------------------------ 39 3. 33 1 1 4 2 3 1 4 1 2 5 _ 2 3 1 4 2 1 _ 2
M o ld in g -m a ch in eo p e r a to r s 4b / ------------------------ 38 2 .7 5 - 2 3 3 1 3 9 6 5 5 _ 1 _ _ _ _ _ _ _ _ _ _
O ff -b e a r e r s ___________________ 82 2. 55 - 18 9 17 10 13 1 2 5 3 4T im a 28 2. 38 16 7 5In cen tive ------------------------------ 54 2 .6 4 _ 2 9 10 5 13 1 2 5 3 4
P a c k e r s 4a / ------------------------------ 26 2. 76 - 2 12 4 _ _ 3 _ _ _ _ 1 _ _ 1 _ _ _ _ _ _ 3P o w e r -s h o v e l
n p sra tn rs 4 * ! 8 2. 85 _ 1 5 2P u gm ill m#»n ♦ a / _ _ _ 15 2. 67 7 2 2
"2 2
T ru ck d r iv ers~ r a / 6 ----------------- 41 2 .4 7 _ _ 8 17 12 4 I IM ed ium ( l ^ T t o and
in clu d in g 4 ton s) 4 a / ------ 32 2 .4 6 - - 8 14 8 2 - - - _ _ _ _ _ _ _ _ _ _ _ _ _T r u c k e r s , h a n d 4 a / ---------------- 33 2 .41 _ 10 20 _ _ _ _ _ _ _ _ 3 _ _ _ _ _ _ _ _T r u c k e r s , p ow er” (fo r k l if t ) — 134 2 . 59 - - 3 31 62 10 12 6 8 1 _ _ 1 _ _ _ _ _ _ _ _ _
T im fi 59 2. 49 3 26 30In cen tive— _ — __ 75 2 .6 7 _ _ 5 32 10 12 6 8 1 _ _ 1 _ _ _ _ _ _
T r u c k e r s , p o w e r (o th e rthan fo r k li f t ) -------------------------- 75 2. 53 - _ 6 38 21 5 3 _ _ _ 1 1 _ _ _ _ _ _ _ _ _ _
T im e 50 2. 47 6 33 11In cen tive— _ — _ ___ 25 2 .6 3 - - 5 10 5 3 - - 1 1 _ _ _ _ _ _ _ _ _ _
1 E x clu d e s p re m iu m pay fo r o v e rt im e and fo r w ork on w eekends, h o lid a y s , and late sh ifts .2 V ir tu a lly a ll p ro d u c tio n w o r k e r s w ere m en; data fo r s e le c te d o ccu p a tion s w ere lim ite d to m en w o rk e r s .3 Includes 8 w o rk e r s und er $ 2 .1 0 .4 In su ffic ie n t data to w a rra n t p resen ta tion o f sep arate averag es by m ethod o f w age paym ent; (a) a ll o r predom in an tly t im e w o rk e rs , and (b) a ll o r p redom in an tly in cen tiv e w o rk e rs .5 W o rk e rs w e re d is tr ib u te d as fo l lo w s : 4 at $ 4 .2 0 to $ 4 .3 0 ; 1 at $ 4 .3 0 to $ 4 .4 0 ; 2 at $ 4 .4 0 to $ 4 .5 0 ; 3 at $ 4 .5 0 to $ 4 . 60 ; and 4 at $ 4 .6 0 and o v e r .6 Includes a ll d r iv e r s r e g a r d le s s o f s iz e and type o f tru ck o p era ted .
Digitized for FRASER http://fraser.stlouisfed.org/ Federal Reserve Bank of St. Louis
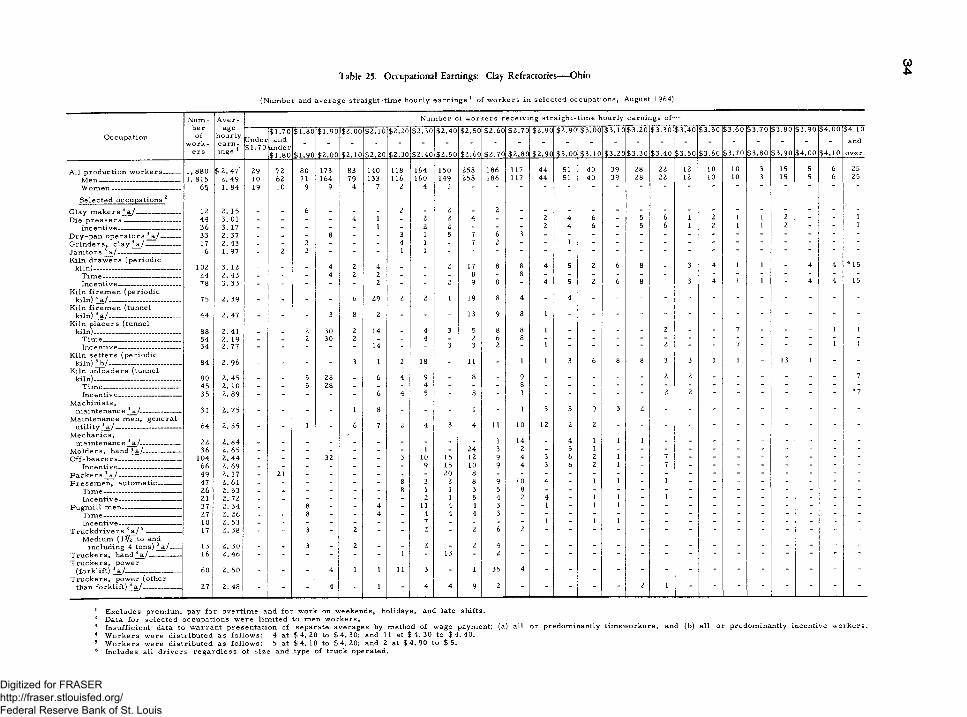
Table 25. Occupational Earnings: Clay Refractories— Ohio
(N u m ber and a verag e stra ig h t-t im e h ou r ly ea rn in gs 1 o f w o rk e r s in s e le c te d o c cu p a tio n s , August 1964)
N u m - A v e r - N um ber o f w o rk e rs re ce iv in g stra igh t- tim e hou rly earn in gs o f-
O ccu pa tionb ero f
w o r k e r s
agehou rly e a r n ings 1
Under$1 .70
$1 .7 0and
under$ 1 .8 0
$1.80
$1.90
$ 1.90
$ 2.00
$ 2.00
$ 2.10
$ 2.10
$ 2.20
$ 2.20
$2.30
$2 .30
$2 .40
$2 .40
$2 .50
$2.50
$2.60
$2 .60
$2 .70
$2 .70
$2 .80
$2 .80
$2 .90
$2.90
$3.00
$3 .00
$3 .10
$3 .10
$3.20
$3 .20
$3 .30
$3 .30
$3 .40
$3 .40
$3 .50
$3 .50
$3 .60
$3 .60
$3 .70
$3 .70
$3 .80
$3 .80
$3 .90
$3 .90
$4 .00
$4 .00
$4 .10
$4.10and
o v e r
1, 880 $ 2. 47' 29 72 80 173 83 140 118 164 150 258 186 117 44 51 40 39 28 22 12 10 10 3 15 5 6 25M e n ------------------------------------- 1, 815 2. 49 10 62 71 164 79 133 116 160 149 258 186 117 44 51 40 39 28 22 12 i 0 10 3 15 5 6 25W o m e n ------------------------------- 65 1 .8 4 19 10 9 9 4 7 2 4 1
S e le c te d occu p a tio n s 2C lay m a k e rs 3 a / __________ — 12 2. 15 _ _ 6 - - - 2 - 2 - 2 - - - - - - - - - - - - - - ' -D ie p r e s s e r s ------------------------- 44 3. 01 - - - - 4 1 - 2 2 4 - - 2 4 6 - 5 6 1 2 1 1 2 - - 1
In ce n tive ---------------------------- 36 3. 17 - - - - - 1 - 2 2 - - - 2 4 6 - 5 6 1 2 1 1 2 - “ 1D ry -p a n o p e r a to r s 3 a / --------- 33 2. 37 - - - 8 - - 3 1 5 7 6 3G rin d e r s , c l a y 3a / ---------------- 17 2 .4 3 - - 2 - - - 4 1 - 7 2 - ~ 1 ■ ■ “ _ _ ~ _ ” “ " “J a n itors 3 a / ---------------------------- 6 1 .97 - 2 2 - - - 1 1 "K iln d r a w e r s (p e r io d ic
k iln )_____________ ____ -______ 102 3. 12 - - - 4 2 4 - - 2 17 8 8 4 5 2 6 8 - 3 4 1 1 _ 4 4 4 15Ti ttv _______________________ 24 2. 43 - - - 4 2 2 - - - 8 - 8 - - - - - - - ~ - “ ~In cen tive ---------------------------- 78 3. 33 - - - - - 2 - - 2 9 8 - 4 5 2 6 8 - 3 4 1 1 - 4 4 15
K iln fir e m e n (p e r io d ickiln ) 3 a / ------------------- ---------- 75 2 . 39 - - - - 6 29 2 2 1 19 8 4 - 4
K iln fir e m e n (tunnel8kiln) 3 a / -------------------------------- 44 2. 47 - - - 3 8 2 - - - 13 9 1 “
K iln p la c e r s (tunnelk iln )............................ .................... 88 2. 41 - - 2 30 2 14 - 4 3 5 8 8 1 - - - - 2 - - 7 - - - 1 1
T im e _______________________ 54 2. 19 _ _ 2 30 2 - - 4 - 2 6 8In cen tive ---------------------------- 34 2. 77 - - - - - 14 - - 3 3 2 - 1 - - - - 2 - 7 _ " 1 1
K iln se tte r s (p e r io d ic1 13kiln) 3 b / --------------------------------- 84 2. 96 - - - - 3 1 2 18 - 11 1 1 3 6 8 8 3 3 1 - 1 - “
K iln u n lo a d e rs (tunnelk iln )--------------------------------------- 80 2. 45 - - 5 28 - 6 4 9 - 8 - 9 - - - - - 2 2 ■ “ ■ - 7
T im e _______________________ 45 2. 10 - - 5 28 - - - 4 - - - 8 - - - - - - - - - ■ - - -In cen tive ------------------- ------ 35 2. 89 - - - - - 6 4 5 - 8 - 1 - - - - - 2 2 - " - - - 5 7
M a ch in is ts ,m ain ten an ce 3 a / ------------------ 31 2. 75 - - - - 1 8 - - - 1 - 1 3 3 9 3 2
M ain ten ance m en , g e n e ra l12u tility 3 a / ------------------------------
M e ch a n ics ,64 2. 55 - " 1 " 6 7 2 4 3 4 11 10 2 2
m ain ten a n ce 3 a / ------------------ 22 2. 84 1 14 - 4 1 1 1 - “ - - " - " " "M o ld e r s , hand 3 a /----------------- 36 2. 65 - - - - - - - 1 - 24 3 2 - 5 1O f f -b e a r e r s ---------------------------- 104 2 .4 4 _ _ - 32 - - 3 10 15 12 9 4 3 6 2 1 - 7 - - - - - - - -
In cen tive ---------------------------- 66 2 . 69 - - - - - - - 9 15 10 9 4 3 6 2 1 - 7 - - - - - - - -P a c k e rs 3 a / ---------------------------- 49 2. 17 - 21 - - - - - - 20 8P r e s s m e n , a u to m a tic ---------- 47 2. 61 - - - - - - 8 3 2 8 9 10 4 - 1 1 - 1 - - - - - - - -
T im e ----------------------------------- 26 2. 53 - - - - - - 8 1 1 3 5 8In cen tive ---------------------------- 21 2. 72 - - - - - - - 2 1 5 4 2 4 - 1 1 - 1 - - - - - - - -
P u g m ill m e n --------------------------- 37 2. 34 - - 8 - - 4 - 11 4 4 3 - 1 - 1 1T i m e____________________ 27 2 . 26 - - 8 - - 4 - 4 4 4 3In cen tive ---------------------------- 10 2. 53 - - - - - - - 7 - - - - 1 - 1 1
T ru c k d r iv e rs 3 a / 6 ---------------- 17 2. 38 - - 3 - 2 - - 2 - 2 6 2M edium ( 1V2 to and
in clu d in g 4 tons) 3 a / ----- 13 2. 30 - - 3 - 2 - - 2 - 2 4T r u c k e r s , hand 3 a / -------------- 16 2. 46 - - - - - - 1 - 13 - 2 - - - - - - - - _ ■ ~ ■ ■T r u c k e r s , p ow er
(fo rk lift) 3 a / ------------------------- 60 2. 50 - - - 4 1 1 11 3 - 1 35 4T r u c k e r s , p ow er (oth er
than fo r k li ft ) 3 a / ___________ 27 2. 48 " " 4 1 ■ 4 4 9 2 ' “ ' 2 1
1 E x clu d e s p re m iu m pay fo r o v e r t im e and fo r w ork on w eeken d s, holida ys, and late sh ifts .2 Data fo r s e le c te d o ccu p a tio n s w e re lim ite d to m en w o rk e r s .3 In su ffic ien t data to w a rra n t p re se n ta tio n o f sep arate a ve ra g e s by m ethod o f w age paym ent; (a) a ll o r p redom in an tly t im e w o rk e rs , and (b) a ll o r pred om in an tly in cen tiv e w o rk e r s .4 W o rk e rs w e re d is tr ib u te d as fo l lo w s : 4 at $ 4 ,2 0 to $ 4 .3 0 ; and 11 at $ 4. 30 to $ 4 .4 0 .5 W o rk e rs w e re d is tr ib u te d as fo l lo w s : 5 at $ 4 .1 0 to $ 4 .2 0 ; and 2 at $ 4 .9 0 to $ 5 .6 Includes a ll d r iv e r s r e g a r d le s s o f s iz e and type o f tru ck o p erated .
Digitized for FRASER http://fraser.stlouisfed.org/ Federal Reserve Bank of St. Louis
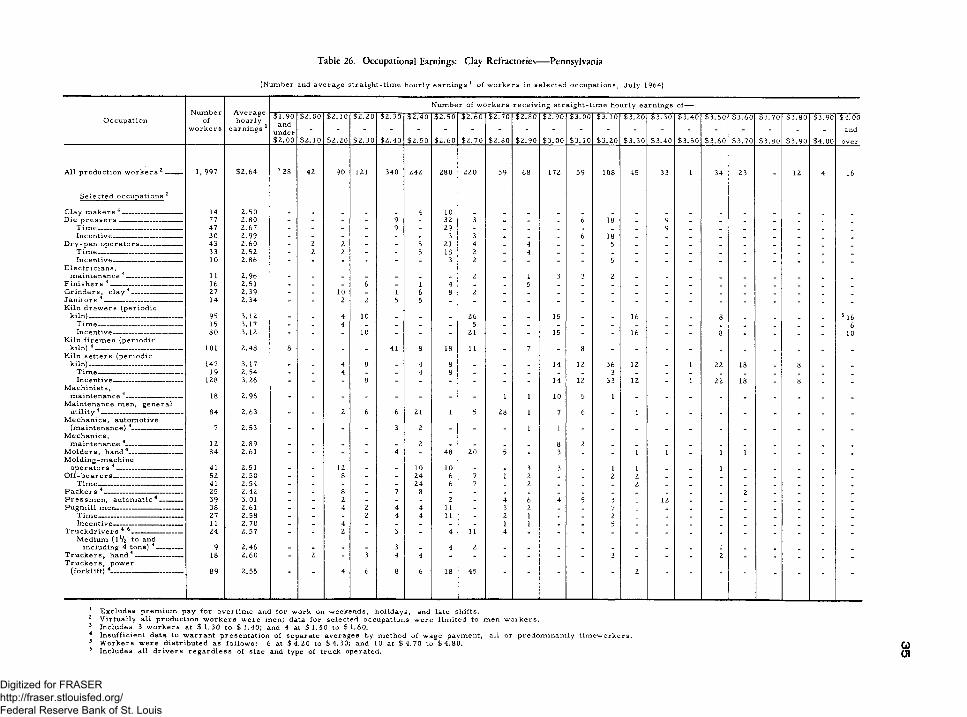
(N um ber and averag e s tra ig h t-t im e h ou rly e a r n in g s 1 o f w o rk e r s in se le c te d o ccu p a tion s , July 1964)
Table 26. Occupational Earnings: Clay Refractories— Pennsylvania
O ccu p a tionN um ber
ofw o rk e r s
A v era g e h ou rly
ea rn in gs 1
Num ber o f w o rk e rs re c e iv in g s tra ig h t-t im e h ou rly earn in gs of—$1.90
andunder$2.00
T> 2 . oo
$2.10
$2.10
$2.20
$2.20
$2 .30
$2 .30
$2.40
$2 .40
$2 .50
$ 2 .5 0
$2 .6 0
$ 2 .6 0
$2 .7 0
$2 .70
$2 .80
$2 .80
$2 .90
$2 .90
$3 .00
$3 .00
$3 .10 -w-
^
o
o $ 3 .2 0
$3 .30
$3 .3 0
$3 .40
$3 .40
$3 .50
$3 .5 0
$3 .60
$3 .60
$3 .70
$3 .70
$3.80
$3 .80
$3 .90
$3.90
$4.00
$4.00and
over
A ll p ro d u c tio n w o r k e r s 2 -------- 1, 997 $2.64 3 28 42 90 121 340 242 280 220 59 68 172 59 108 45 33 1 34 23 _ 12 4 16
S e le c te d occu p a tio n s 2
C lay m a k e rs 4 ---------------------- 14 2.50 _ _ _ _ _ 4 10 _ . _ . . .D ie p r e s s e r s ________________ __ 77 2.80 - - - - 9 - 32 3 - - _ 6 18 _ 9 _ _ _ _ _ _ _
T im e_____ _____ ________ _____ 47 2.67 - _ _ _ 9 _ 29 _ _ _ _ _ _ _ 9 _ _ _ _ _ _ _In c e nt i v e - _______________ _ 30 2.99 - - - - _ _ 3 3 - _ _ 6 18 _ _ _ _ _ _ _ _ _
D ry -p a n o p e r a t o r s ------------------- 43 2.60 - 2 2 - _ 5 21 4 _ 4 _ _ 5 _ _ _ _ _ _ _ _ _T im e ____________________ 33 2.52 - 2 2 - _ 5 18 2 _ 4 _ _ _ _ _ _ _ _ _ _ _ _In ce n tiv e___ _____ — — 10 2.86 - - - - - - 3 2 - - - _ 5 _ _ _ _ _ _ _ _ _
E le c t r ic ia n s ,m ain ten a n ce 4_________________ 11 2.96 - _ _ _ _ _ _ 2 _ 1 3 3 2 _ _ _ _ _ _ _ _ _
F in is h e r s 4 ___________________ _ 16 2.51 - _ _ 6 _ 1 4 _ _ 5 _ _ _ _ _ _ _ _ _ _ _ _G rin d e r s , c la y 4_______________ 27 2.39 - _ 10 _ 1 6 8 2 _ _ _ _ _ _ _ _ _ _ _ _ _ _J a n ito rs 4_______________________ 14 2.34 _ _ 2 2 5 5 _ _ _ _ _ _ _ _ _ _ _ _ _ _ _ _K iln d ra w e rs (p e r io d ic
k iln )_____________ _________ 95 3.12 - - 4 10 - - - 26 _ _ 15 _ _ 16 _ _ 8 _ _ _ _ 5 16T im e ______ __ ______ __ ___ __ 15 3.17 - - 4 - - _ _ 5 _ _ _ _ _ _ _ _ _ _ _ _ _ 6In c e nt ive _______________________ 80 3.12 _ _ _ 10 _ _ _ 21 _ _ 15 _ _ 16 _ _ 8 _ _ _ _ 10
K iln fir e m e n (p e r io d ickiln) 4__________________________ 101 2.48 8 - - - 41 8 18 11 _ 7 _ 8 _ _ _ _ _ _ _ _ _ _
K iln se tte r s (p e r io d ickiln) ____________________________ 147 3.17 - - 4 8 - 4 8 _ _ - 14 12 36 12 _ 1 22 18 _ 8 _ _
T im e — ______________________ 19 2.54 - - 4 - - 4 8 _ _ _ - _ 3 _ _ _ _ _ _ _ _ _In ce n tive —___________________ 128 3.26 - _ _ 8 _ _ _ _ _ _ 14 12 33 12 _ 1 22 18 _ 8 _ _
M a ch in is ts ,m ain ten a n ce 4_________________ 18 2.96 _ _ _ - - _ _ _ 1 1 10 5 1 _ _ _ _ _ _ _ _ _
M ain ten ance m en , g e n e ra lu t i l i t y 4___________ ___ _____ 84 2.63 - _ 2 6 6 21 1 5 28 1 7 6 _ 1 _ _ _ _ _ _ _ _
M e ch a n ics , au tom otiv e(m a in ten a n ce) 4- ---------------------- 7 2.53 - - - - 3 2 - - - 1 1 - _ _ _ _ _ _ _ _ _ _
M e ch a n ics ,m ain ten a n ce 4— --------------------- 12 2.89 _ - - _ - 2 _ _ _ _ 8 2 _ _ _ _ _ _ _ _ _ _
M o ld e r s , h a n d 4------------- ---------- 84 2.61 - - _ _ 4 _ 48 20 5 _ 3 _ _ 1 1 _ 1 1 _ _ _ _M o ld in g -m a ch in e
o p e r a t o r s 4 _______ ____ — _ 41 2.51 - - 12 - - 10 10 - - 3 3 - 1 1 _ - 1 _ _ _ _ _O ff -b e a r e r s -------------------------- 52 2.50 - _ 8 - - 24 6 7 1 2 _ _ 2 2 _ _ _ _ _ _ _ _
T im e -______________________ 41 2.54 - - _ _ - 24 6 7 _ 2 _ _ _ 2 _ _ _ _ _ _ _ _P a c k e r s 4____________________ __ 25 2.42 - - 8 _ 7 8 _ _ _ _ _ _ _ _ _ _ _ 2 _ _ _ _P r e s s m e n , a u tom a tic 4 ------ ---- 39 3.01 - - 2 - - _ 2 _ 4 6 4 5 3 1 12 _ _ _ _ _ _ _P u g m ill m en ____________________ 38 2.61 - - 4 2 4 4 11 - 3 2 _ _ 7 1 _ _ _ _ _ _ _ _
T im e ----------------------- ----- 27 2.58 - _ - 2 4 4 11 _ 2 1 _ _ 2 1 _ _ _ _ _ _ _ _In c e n tiv e—— — — — — — 11 2.70 _ _ 4 _ _ _ _ _ 1 1 _ _ 5 _ _ _ _ _ _ _ _
T r u c k d r iv e r s 4 6_ -------- 24 2.57 - _ 2 _ 3 _ 4 11 4 _ _ _ _ _ _ _ _ _ _ _ _ _M ed ium (lV 2 to and
in clu d in g 4 tons) 4------------ 9 2.46 - - - - 3 - 4 2 - - _ - - - _ _ _ _ _ _ _ _T r u c k e r s , h a n d 4 ---------------------- 18 2.60 - 2 - 3 4 4 - - _ _ _ _ 3 _ _ _ 2 _ _ _ _ _T r u c k e r s , p ow er
o' ►i £ | i 1 ! i i 89 2.55 4 6 8 6 18 45 2
1 E x c lu d e s p r e m iu m pay fo r o v e rt im e and fo r w ork on w eekends, h o lid a y s , and late sh ifts .2 V ir tu a lly a ll p ro d u c t io n w o rk e r s w e re m en; data fo r s e le cte d occu p a tion s w e re lim ite d to m en w o rk e r s .3 In clu des 3 w o r k e r s at $ 1 .3 0 to $ 1 .4 0 ; and 4 at $ 1 .5 0 to $ 1 .6 0 .4 In su ffic ie n t data to w a rra n t p re se n ta tio n o f sep arate a verag es by m ethod o f w age paym ent, a ll or pred om in an tly t im e w o rk e rs .5 W o rk e rs w e re d is tr ib u te d as fo l lo w s : 6 at $ 4 .2 0 to $ 4 .3 0 ; and 10 at $ 4 .7 0 to $ 4 .8 0 .6 In clu des a ll d r iv e r s r e g a r d le s s o f s ize and type o f truck operated .
Digitized for FRASER http://fraser.stlouisfed.org/ Federal Reserve Bank of St. Louis
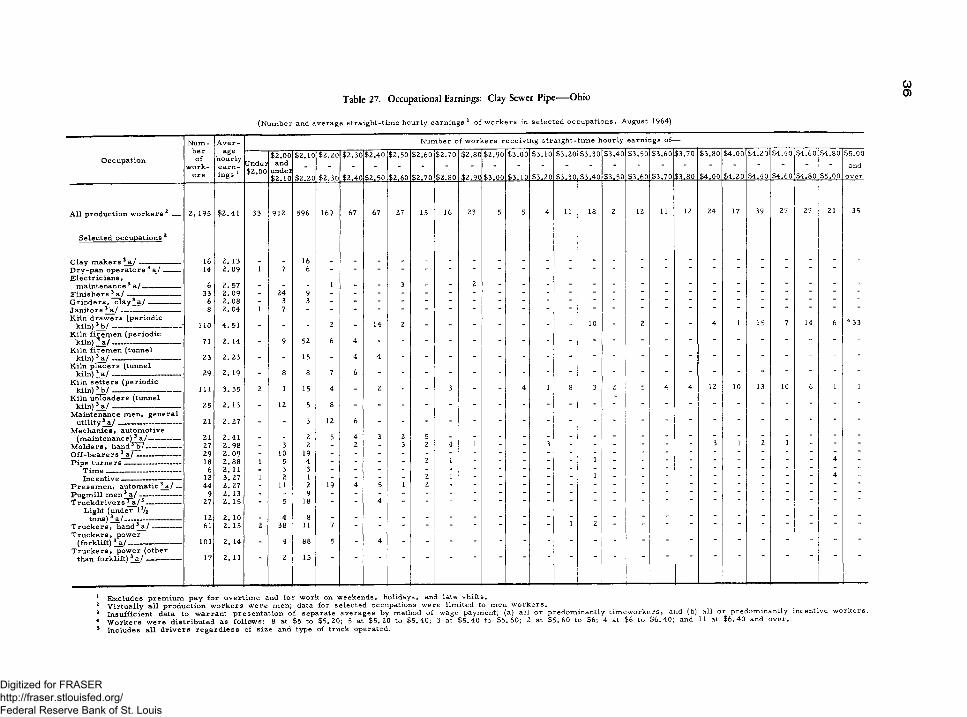
(N u m ber and a verag e s tra ig h t-t im e h ou r ly e a r n in g s 1 o f w o rk e r s in s e le c te d o c cu p a tio n s , August 1964)
Table 27. Occupational Earnings: Clay Sewer Pipe— Ohio
O ccu p a tio n
N u m b e ro f
w o r k e r s
A v e r age
h ou r ly e a r n ings 1
N um ber o f w o rk e rs re c e iv in g stra ig h t- tim e h ou r ly ea rn in gs o f-
Under$ 2.00
$ 2.00and
under$ 2.10
$2.10
$2.20
$ 2.20
$2.30
$2.30
$2.40
$2.40
$2.50
$2.50
$2.60
$2.60
$2.70
$2.70
$2.80
$2.80
$2.90
$2.90
$3.00
$3.00
$3.10
$3.10
$3.20
$3.20
$3.30
$3.30
$3.40
$3,40
$3.50
$3.50
$3.60
$3.60
$3.70
$3.70
$3.80
$3.80
$4.00
$4.00
$4.20
$4.20
$4.40
$4.40
$4.60
$4.60
$4.80
$4.80
$5.00
$5.00and
o v e r
A l l p ro d u c tio n w o r k e r s 2 — 2, 195 $ 2 .4 1 33 912 596 169 67 67 27 15 16 23 5 5 4 11 18 2 12 11 12 24 17 39 27 27 21 35
S e le c te d o ccu p a tio n s 2
C la v m a k e rs 3 4 a / — -------- - 16 2. 13D ry -p a n o p e r a to r s 3 a / -------- 14 2 . 09 1 7 6E le c t r ic ia n s ,
m a in ten a n ce 3 a / ----------------- 6 2. 57 - - - 1 - - 3 - - 2 - - - - - ■ “ ~ ~ - ~ ~F in ish e r s 3 a / ------------------------ 33 2 . 09 - 24 9G r in d e r s , c l a y 3 a / --------------- 6 2 . 08 - 3 3J a n ito rs 3 a / --------------------------- 8 2. 04 1 7Kirin d r a w e r s (p e r io d ic
k iln ) 3 b / ................................... - 110 4 . 51 - - - 2 - 14 2 - - - - - - - 10 - 2 - _ 4 1 15 7 14 6 4 33
K iln f ir e m e n (p e r io d ick iln ) 3 a / ------------------------------- 71 2. 14 - 9 52 6 4
K iln fir e m e n (tunnelk iln ) 3 a / -------- - 23 2. 23 - - 15 - 4 4
K iln p la c e r s (tunnelkiln ) 3 a / ------------------------------- 29 2 . 19 - 8 8 7 6
K iln s e tte r s (p e r io d ick iln ) 3 b / - - 111 3. 55 2 1 15 4 - 2 - - 3 - - 4 1 8 3 2 5 4 4 12 10 13 10 6 1 i
K iln u n lo a d e rs (tunnelk iln ) 3 a / 25 2. 13 - 12 5 8
M ain ten ance m en , g e n e ra lu t i l ity 3 a / ----------------------------- 21 2. 27 - - 3 12 6
M e c h a n ics , au tom otiv e(m a in ten a n ce ) 3 a / --------------- 21 2 .4 1 - - 2 5 4 3 2 5
M o ld e r s , hand 3~b7---------------- 27 2 .9 8 - 3 2 - 2 - 3 2 4 1 ■ - 3 " " “ " " 3 1 2 1O ff -b e a r e r s 3 a / -------------------- 29 2 . 09 - 10 19P ip e t u r n e r s -------------------------- 18 2 .8 8 1 5 4 - - - - 2 1 - - - - - 1 _ ~ ~ ■ “ “ “ ' 4 ■
T im e ---------------------------------- 6 2 . 11 - 3 3I n ce n t iv e --------------------------- 12 3. 27 1 2 1 - - - - 2 1 - - - - “ 1 ~ " “ “ ~ _ 4 ■
P r e s s m e n , a u tom atic 3 a / — 44 2. 27 - 11 2 19 4 5 1 2P u g m ill m e n 3 a / ------------------- 9 2. 13
r u ck d r iv e r 8~s~a/ 5---------------- 27 2. 15 - 5 18L ight (und er ll/2
tons) 3 a / -------------------------- 12 2 . 10 - 4 8T r u c k e r s , h a n d 3 a / ------------- 61 2. 15 2 38 11 7 1 2T r u c k e r s , p o w e r
(fo rk lif t ) i a / ------------------------ 101 2. 14 - 4 88 5 - 4T r u c k e r s , p o w e r (o th er
than fo r k li ft ) 3 a / ---------------- 17 2. 11 2 15
1 E x clu d e s p re m iu m p a y fo r o v e r t im e and fo r w ork on w eeken d s, h o lid a y s , and late sh ifts .2 V ir tu a lly a ll p ro d u c tio n w o rk e r s w e re m en ; data fo r s e le c te d occu pation s w e re lim ite d to m en w o r k e r s . . . .3 In su ffic ie n t data to w arra n t p re se n ta tio n o f sep arate a v e ra g e s by m ethod o f w age paym ent; (a) a ll o r p red om in an tly t im e w o rk e rs , and (b) a ll o r p red om in an tly in cen tive4 W o rk e rs w e re d is tr ib u te d as fo l lo w s : 8 at $5 to $ 5 .2 0 ; 5 at $ 5 .2 0 to $ 5 .4 0 ; 3 at $ 5 .4 0 to $ 5 .6 0 ; 2 at $ 5 .6 0 to $6 ; 4 at $6 to $ 6 .4 0 ; and 11 at $ 6 .4 0 and o v e r .5 In clu des a ll d r iv e r s r e g a r d le s s o f s iz e and type o f tru ck operated .
Digitized for FRASER http://fraser.stlouisfed.org/ Federal Reserve Bank of St. Louis
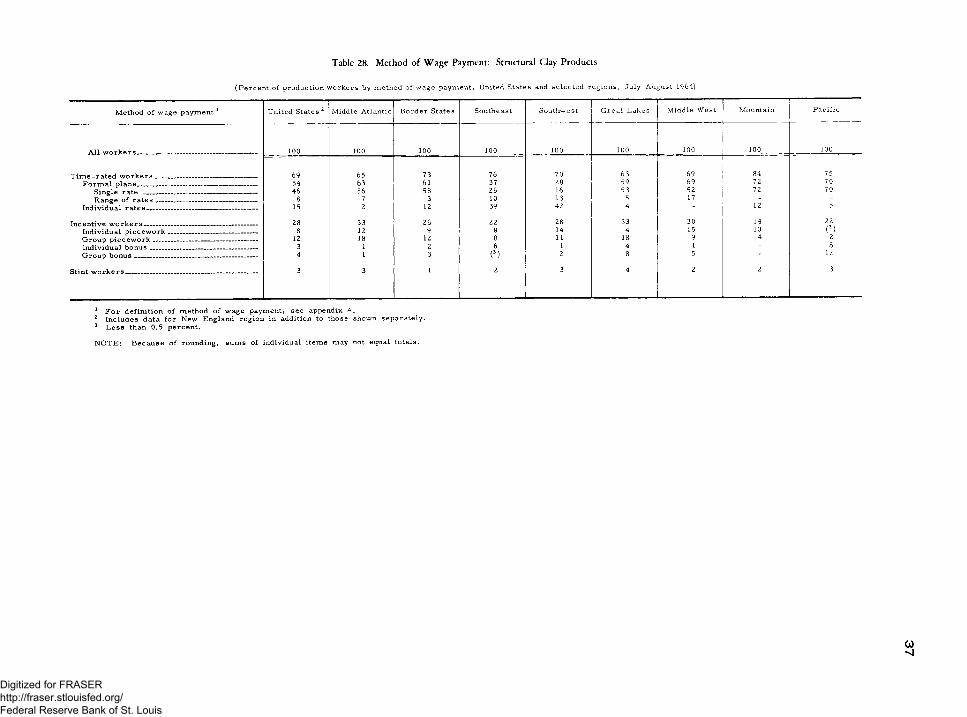
(P e rc e n t o f p rodu ction w o rk e rs by m ethod o f w age paym ent, United States and s e le c te d re g io n s , July—A ugust 1964)
Table 28. Method o f W age Payment: Structural Clay Products
M ethod o f w age paym ent 1 United States 2 M iddle A tlantic B o rd e r States Southeast Southw est G reat L akes M iddle W est M ountain P a c ific
A ll w o r k e r s _________________________________ —- 100 100 100 100 100 100 100 100 100
T im e -r a te d w o r k e r s ______________________________ 69 65 73 76 70 63 69 84 75F o rm a l p la n s____________________________________ 54 63 61 37 28 59 69 72 70
Sin gle ra te ---------------------------------------------------- 46 56 58 26 16 53 52 72 70R ange o f r a t e s ---------------------------------------------- 8 7 3 10 13 5 17 - -
Individual r a t e s -------------------------------------------------- 15 2 12 39 42 4 ' 12 5
In centive w o r k e r s ---------------------------------------------------- 28 33 26 22 28 33 30 14 22Individual p ie c e w o r k ___________________________ 8 12 9 8 14 4 15 10 (3)G rou p p ie c e w o r k ------------------------------------------------ 12 18 12 8 11 18 9 4 2Individual b o n u s ________________________________ 3 1 2 6 1 4 1 - 8G rou p b o n u s _______________________________ ___ 4 1 3 (3 ) 2 8 5 " 12
Stint w o r k e r s _______________________________________ 3 3 1 2 3 4 2 2 3
1 F o r d e fin it io n o f m eth od o f w age paym ent, see appendix A,2 In clu des data fo r New England reg ion in addition to those show n se p arate ly .3 L e s s than 0.5 p e rce n t.
N O T E : B e ca u se o f roun din g, sum s o f individual ite m s m ay not equal to ta ls .
CO■Nj
Digitized for FRASER http://fraser.stlouisfed.org/ Federal Reserve Bank of St. Louis

(P e r c e n t o f p rod u ction w o rk e rs by m ethod o f w age paym ent, United States and se le c te d re g io n s , July—A ugust 1964)
Table 29. Method o f W age Payment: Selected Structural Clay Products
M ethod o f w age paym ent 1
B r ick and s tru ctu ra l c la y tile C e r a m ic w a ll and f lo o r tile
United S tates 2
M iddleA tlantic
B o rd e rStates Southeast Southw est G rea t
L akesM iddle
Wfest M ountain P a c if ic United States 2
M idd leA tlantic Southeast Southw est G reat
L akes P a c if ic
A l l w o r k e r s ____________________________________ 100 100 100 100 100 100 100 100 100 100 100 100 100 100 100
T im e -r a te d w o r k e r s ----------------------------------------------F o r m a l p la n s____________________________________
S in gle r a t e -------------------- ---------------------------------R ange o f r a t e s ____ ________________________
Individual r a t e s _________________________________
Incentive w o r k e r s ----------------------------------------------------Individual p i e c e w o r k ___________________________G rou p p ie c e w o r k _______________________________Trt -i rirln al hnnnfi
684542
4 23
279
1611
5
716762
54
283
24
(3")
1
674439
523
331914
733130
142
249
123
(3)
3
6618
81048
301513(3)
1
4
575552
23
324
25 (3)2
11
595951
7
379
22
7
5
846969
15
13104
3
838383
9(3)522
9
5847321412
428
111210
42412715
1
58321844
7444222230
26
26
9047192843
10712
49493514
511
2215 13
554141
14
45(3)
11430G rou p b o n u s _____________________________________
Stint w o r k e r s ________________________________________
C lay r e f r a c to r ie s C lay sew er pipe
United S tates 2 M iddle A tlantic G reat L akes M idd le W est United States 2 S outheast G reat L akes P a c if ic
A ll w o r k e r s ____________________________________ 100 100 100 100 100 100 100 100
T im e -r a te d w o r k e r s ---------------------------------------------- 76 74 73 76 77 82 77 99F o rm a l p la n s____________________________________ 73 74 60 76 69 37 77 99
Sin gle r a t e ----------------------------------------------------- 58 71 56 51 67 27 76 99R ange o f r a t e s ---------------------------------------------- 15 3 4 25 2 10 (3 ) -
Individual r a t e s --------------------------------------------------- 3 12 " 8 45 (3 ) -
Incentive w o r k e r s ---------------------------------------------------- 22 21 27 23 23 18 23 (*)Individual p i e c e w o r k ----------------------------------------- 10 7 10 16 8 16 3 (3)G rou p p ie c e w o r k ---------- ------------------------------------- 9 15 12 3 5 2 6Individual b o n u s ------------------------------------------------- 1 - 3 1 1 - (3) (3 )G rou p b o n u s -------------------------------------------------------- 2 - 2 4 8 - 14 -
Stint w o r k e r s ________________________________________ 2 5 (3) 1 1 " ( 3 )
1 F o r de fin it io n o f m eth od o f w age paym ent, see appendix A.2 Includes data fo r re g io n s in a ddition to th ose shown sep arate ly .3 L e s s than 0.5 p e rce n t.
NOTE: Because of rounding, sums of individual items may not equal totals.
Digitized for FRASER http://fraser.stlouisfed.org/ Federal Reserve Bank of St. Louis
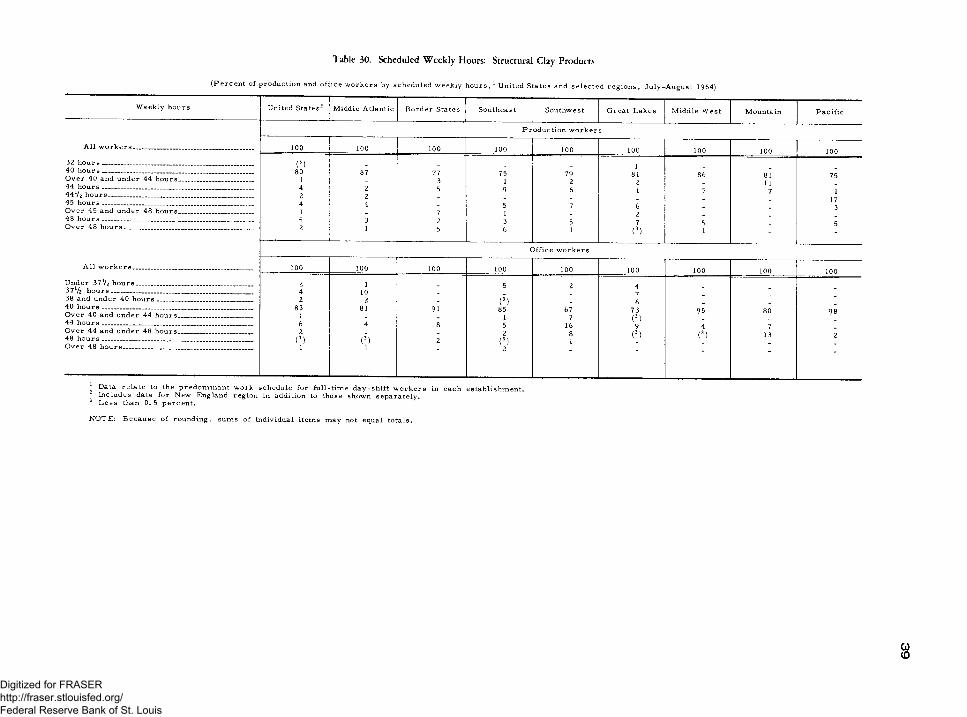
(P e rc e n t o f p rod u ction and o ff ic e w o rk e rs by sch edu led w eek ly h o u rs , 1 U nited States and s e le c te d re g io n s , July—A ugust 1964)
Table 30. Scheduled W eekly Hours: Structural Clay Products
W eekly h ou rs United S ta tes2 M iddle A tlan tic B o rd e r States Southeast Southw est G rea t L akes M idd le W est M ountain P a c if ic
A l l w o r k e r s _______________________
P ro d u ct io n w o rk e r ;s
100 100 100 100 100 100 100 100 10032 h ou rs _ (3)40 h o u r s __________________________ ___O v e r 40 and u nd er 44 hours44 h o u r s _____________________4 4 ll z h o u r s_________________________________45 h o u r s ____________________O ver 45 and und er 48 h o u r s_________
8014241
87
224
7735
7
7519
51
7926
7
8121
62
86
7
8111
7
75
117
348 h o u r s ______________________________ 5 3 2 3 5 7 ~ ~ "O ver 48 h o u r s________________ 2 1 5 6 1 (>) 1
5
O ffice w o rk e r s
A l l w o r k e r s . . . 100 100 100 100 100 100 100 100 100U nder 37V? h o u r s _______________ 2 1 5 2 437V2 h o u r s ----------------------------------------- _ 4 10 7 “ “38 and under 40 hou rs ... . 2 2 (3) "40 h o u r s _____ _ .O ver 40 and under 44 hou rs _ ...........
8 31
81 91 851
677
73 9 5 80 9844 h o u r s _____ 6 4 8 5 16
i > 9 4 7
O ver 44 and under 48 hours 48 h o u r s ___________________________ _
2(3) ( 3) 2
2(3)
81 0 (3) 13 2
O ver 48 h o u r s . . . ____ 1 1 2
:“
2 Data re la te to the p red om in a n t w ork schedu le fo r fu ll-t im e d a y -s h ift w o rk e r s in ea ch esta b lish m en t. Includes data fo r New E ngland reg ion in addition to those show n se p a ra te ly .
3 L e s s than 0. 5 p e r ce n t .
N O TE: B e ca u s e o f rou n d in g , sum s o f individual item s m ay not equal to ta ls .
COCD
Digitized for FRASER http://fraser.stlouisfed.org/ Federal Reserve Bank of St. Louis
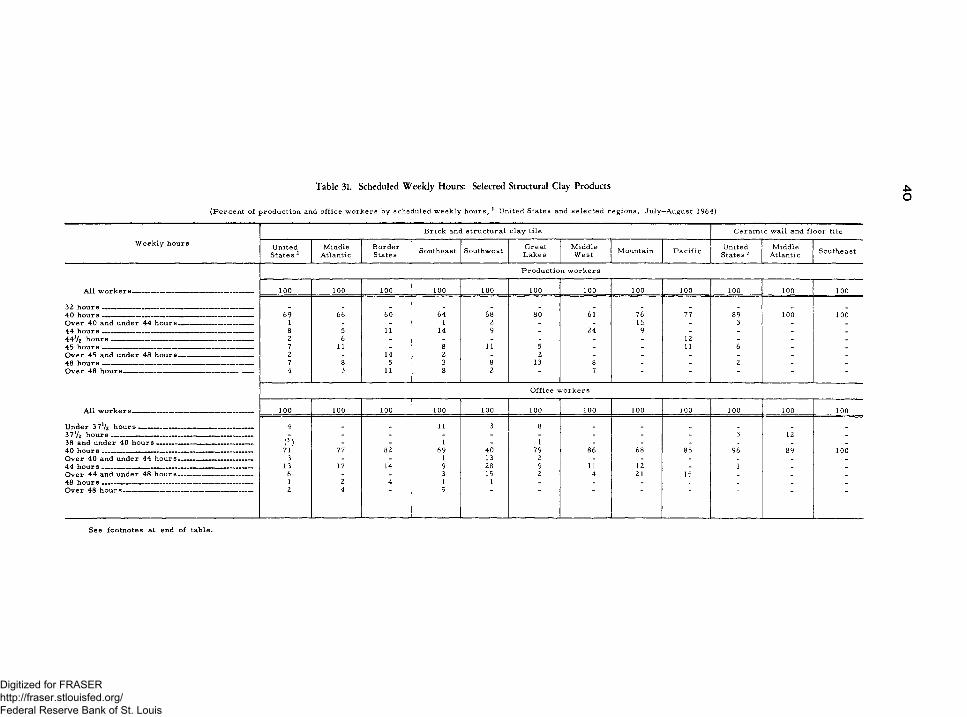
(P e rc e n t o f p r o d u c tio n and o ff ic e w o rk e rs by schedu led w eek ly h ou rs , 1 United States and s e le c te d re g io n s , July—A ugust 1964)
Table 31. Scheduled W eekly Hours: Selected Structural Clay Products
W eek ly h ou rsB r ick and s tru ctu ra l c la y tile C e r a m ic w all and f lo o r tile
U nited S ta tes 2
M iddleA tlantic
B ord erStates Southeast Southw est G reat
L ak esM idd leW est M ountain P a c if ic United
States 2M idd le
A tlantic Southeast
P ro d u ctio n w o rk e r s
A ll w o r k e r s ------------------------------------------------------- 100 100 100 100 100 100 100 100 100 100 100 100
32 h o u rs — _ — _ _ _ -----40 h ou rs _______ _..____... — ____ ___i__________ 69 66 60 64 68 80 61 76 77 89 100 100O v e r 40 and under 44 h o u rs ----- - _ — — 1 - - 1 2 - - 15 - 3 _ _44 h ou rs _ __ , . _ ........ . , , _________ 8 5 11 14 9 - 24 9 - - _ _4 4 V2 h o u r s ----------------------------------------------------------------- 2 6 - - - - - - 12 - _ _45 hour s -_________ __ ________________________________ 7 11 - 8 11 5 - - 11 6 _ _O v e r 45 and under 48 h o u r s - ~ - - 2 - 14 2 - 2 - - - - _ -48 h o u r s - ----- _ - - — - - _ _ _ 7 8 5 3 8 13 8 - - 2 _ _O ver 48 h o u r s ----------------------------------------------------------- 4 3 11 8 2 - 7 " -
O ffice w o rk e r s
AU w o r k e r s ____________________________________ 100 100 100 100 100 100 100 100 100 100 100 100
U nder 37x/2 h o u rs _ _ _ _ - - - - - 4 . . 11 3 8 . _ . .37V2 h ou rs - — - - — - — _ - - - - - - - - - - 3 12 -38 and under 40 h o u r s -------------------------------------------- (3) - - 1 - 1 - - - - - -40 h o u r s - — _ — - - - — -------- 71 77 82 69 40 79 86 68 85 96 89 100O ver 40 and under 44 h o u r s ------------------------------— 3 - - 1 13 2 - - - - _ _44 h ou rs _ _ — — - - -------- 13 17 14 9 28 9 11 12 _ 1 _ _O ver 44 and under 48 h o u r s ----------------------- —-------- 6 - - 3 15 2 4 21 15 _ _ _48 hour 8 _ - - -------- — - - 1 2 4 1 1 - _ - _ _ _ _O ver 48 h o u r s - — - - - — 2 4 5
See footnotes at end of table.
Digitized for FRASER http://fraser.stlouisfed.org/ Federal Reserve Bank of St. Louis

(P e rce n t o f p rodu ction and o ff ic e w o rk e rs by sch edu led w eek ly h ou rs , 1 U nited States and s e le c te d re g io n s , J u ly -A u gu st 1964)
Table 31. Scheduled W eekly Hours: Selected Structural Clay Products— Continued
W eek ly hoursC e ra m ic w a ll and flo o r t ile — C ontinued C lay r e f r a c t o r ie s C lay se w e r pipe
Southwest G reatLakes P a c if ic United
States 2M iddle
A tlanticG reatL ak es
M iddleW est
United States 2 Southeast G reat
L akes P a c ific
P ro d u ctio n w o rk e r s
AU w o r k e r s ____________________________________ 100 100 ,1 0 0 100 100 100 100 100 100 100 100
32 h ou rs _ ---------------------- - — -------- ----- . . 2 _ 5 _40 h o u r s ------ — — - -------- -------- -------- — - 100 72 87 100 100 100 100 83 91 89 52O ver 40 and under 44 h o u r s ------------------------------- - 10 - - - - - 1 - - -44 h o u r s -------------------------------------------------------------------- - - - - - - - - - - -4 4 V2 h o u r s ---------------------------------------------------------------- - - - - - - - 7 - - 4845 hour s __ _ — _ _ _ _ — _ - — - 18 - - - - - - - - -O ver 45 and under 48 h o u r s ---------------------------------- - - - - - - - - - - -48 h ou rs — - — ------ - - — — - - - 13 - - - - 6 9 6 -O ver 48 h o u r s ----------------------------------------------------------- - “ " _ ■ " _ _
O ffice w o rk e r s
A ll w o r k e r s — _ _ — - ~ 100 100 100 100 100 100 100 100 100 100 100
U nder 37x/2 h o u r s ------------------------------------------------— 2 4 737V2 h o u r s ________________ ___ _________ _____ - - - 10 19 31 - - - - -38 and under 40 h o u r s -------------------------------------------- - - - 3 - 15 - 3 - - -40 h o u r s _____________________________________________ 100 95 100 83 76 43 100 89 100 88 100O ver 40 and under 44 h o u r s ----- ---------------------------- - - - - - - - - - - -44 hour s _ _ ----- — _ ------------ - - - 5 - 1 - 4 - 7 - 12 -O ver 44 and under 48 h o u r s ---------------------------------- - - - - - - - - - - -48 hour s --------------------------------------------------------------------- - - - - - - - - - - -O ver 48 h ou rs - — — - -
1 Data re la te to the pred om in an t w ork schedu le fo r fu ll- t im e d a y -sh ift w o rk e rs in ea ch esta b lish m en t.2 In clu des data fo r r e g io n s in a ddition to those shown sep arate ly .3 L e s s than 0.5 p e r ce n t .
N O T E : B e ca u se o f roun din g, sum s o f individual it >.ms m a y not equal to ta ls .
Digitized for FRASER http://fraser.stlouisfed.org/ Federal Reserve Bank of St. Louis
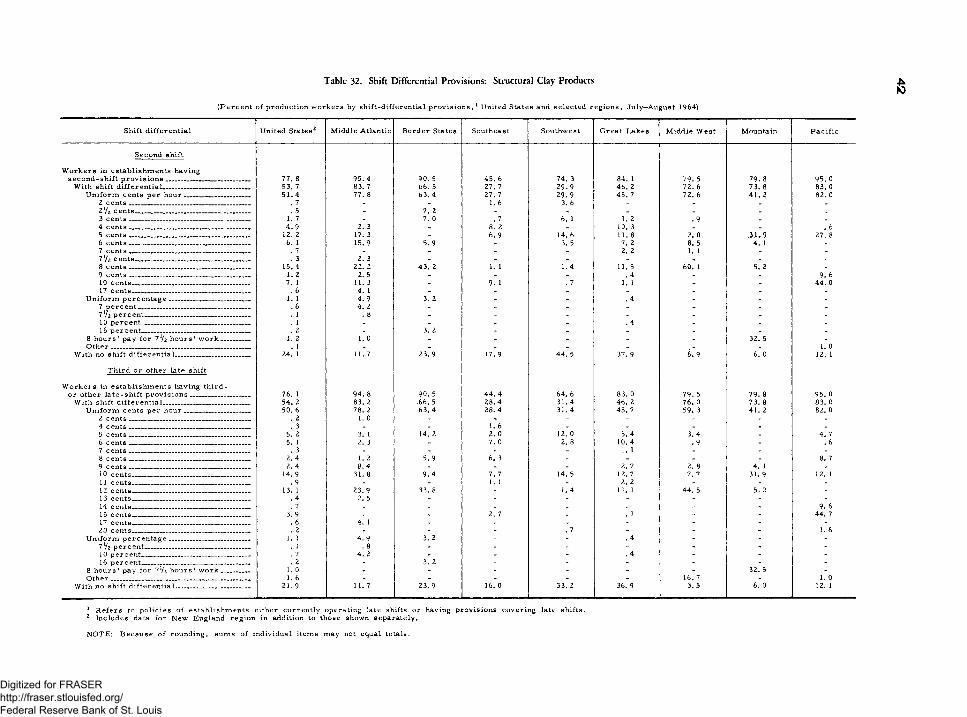
Table 32. Shift Differential Provisions: Structural Clay Products
(P e r c e n t o f p ro d u c tio n w o rk e rs by sh ift -d if fe re n t ia l p r o v is io n s , 1 U nited S tates and s e le c te d r e g io n s , July—A ugust 1964)
S h ift d if fe re n t ia l U nited S ta tes2 M idd le A tlantic B o rd e r States S outheast Southw est G re a t L ak es M idd le W est M ountain P a c if ic
S econ d sh ift
W o rk e rs in esta b lish m e n ts havings e c o n d -s h if t p r o v is i o n s _________________________ 77. 8 95. 4 90. 5 45. 6 74. 3 84. 1 79. 5 79. 8 95. 0
W ith sh ift d i f fe r e n t ia l__________________________ 53. 7 83. 7 66. 5 27. 7 2 9 .9 46. 2 72. 6 7 3. 8 83. 0U n ifo rm ce n ts p e r h o u r ___________________ 51. 4 77. 8 63. 4 27. 7 2 9 .9 45. 7 72. 6 41. 2 82. 0
2 c e n t s ____________________________________ . 7 - - 1. 6 3. 6 _ - _ _Z l( z c e n ts ______________ ____________________ . 5 _ 7. 2 _ - _ _ _ _3 c e n t s ____________________________________ 1. 7 - 7. 0 . 7 6. 1 1. 2 .9 _ _4 ce n ts __________________________________ 4 .9 2. 3 _ 8. 2 _ 10. 3 _ _ . 65 c e n t s ____________________________________ 12. 2 17. 3 _ 6 .9 14. 6 11. 8 2. 0 3 1 .9 27. 86 c e n t s ____________________________________ 6. 1 15.9 5 .9 - 3. 5 7. 2 8. 5 4. 1 .7 c e n t s ____________________________________ . 7 - - - - 2. 2 1. 1 _ _7 Vz c e n ts __________________________________ . 3 2. 3 _ _ _ _ _ _8 c e n t s ____________________________________ 15. 4 22. 2 43. 2 1. 1 1 .4 11. 5 60. 1 5. 2 _9 c e n t s ______________________ ___________ 1. 2 2. 5 _ _ _ . 4 _ _ 9. 610 ce n ts ___________________________________ 7. 1 11. 3 _ 9. 1 . 7 1. 1 _ - 44. 017 c e n ts ___________________________________ . 6 4. 1 - _ - _ _ _ _
U n ifo rm p e r c e n t a g e ________________________ 1. 1 4 .9 3. 2 - - . 4 - - -7 p e r c e n t _________________________________ . 6 4. 2 - - - - - - -7 72 p e r c e n t _______________________________ . 1 . 8 - - - - - - -10 p e r ce n t _ _ _ ______ . 1 - - - - . 4 - - -16 p e r c e n t ________________________________ . 2 - 3. 2 - - - - - -
8 h o u r s ' pay fo r 7 lf z h o u r s ' w o r k _________ 1. 2 1. 0 - - - - - 32. 5 -O t h e r __________________________________________ . 1 - - - _ _ _ _ 1. 0
W ith no sh ift d i f fe re n t ia l______________________ 24. 1 11.7 2 3 .9 17. 9 44. 5 37. 9 6. 9 6. 0 12. 1
T h ird o r o th er la te sh ift
W o rk e rs in esta b lish m e n ts having th ir d -o r o th er la te -s h ift p r o v is io n s __________________ 76. 1 94. 8 90. 5 44. 4 64. 6 83. 0 79. 5 79. 8 95. 0
W ith sh ift d if fe re n t ia l__________________________ 54. 2 83. 2 •66. 5 2 8 .4 31. 4 46. 2 76. 0 73. 8 83. 0U n ifo rm ce n ts p e r h o u r ____________________ 50. 6 78. 2 63. 4 28. 4 31. 4 45. 7 59. 3 41. 2 82. 0
2 c e n t s ____________________________________ . 2 1. 0 - - - - - - -4 c e n t s ____________________________________ . 3 - - 1. 6 - - - - -5 c e n t s ____________________________________ 5. 2 3. 1 14. 2 2. 0 12. 0 5. 4 3. 4 - 4. 76 c e n t s ____________________________________ 5. 1 2. 3 - 7. 0 2. 8 10. 4 .9 - . 67 c e n t s ____________________________________ . 3 - - - - 1. 1 - - -8 c e n t s .... ....................- ................ ...... ................ 2. 4 1. 2 5 .9 6. 3 - - _ - 8. 79 c e n t s ____________________________________ 2. 4 8 .4 - - - 2. 7 2. 8 4. 1 _10 ce n ts ___________________________________ 14. 9 31. 8 9 .4 7. 7 14. 5 12. 7 7. 7 31. 9 12. 111 c e n ts __________________________________ . 9 _ _ 1. 1 - 2. 2 _ - -12 c e n ts ___________________________________ 13. 1 2 3 .9 33. 8 - 1. 4 11. 1 44. 5 5. 2 -13 ce n ts ___________________________________ . 4 2. 5 - - - - - - -14 ce n ts ___________________________________ . 7 - - - - - - - 9. 615 c e n ts ___________________________________ 3 .9 - - 2. 7 - . 1 - - 44. 717 ce n ts ___________________________________ .6 4. 1 - - - - - - -20 ce n ts ___________________________________ . 2 - - - . 7 - - - 1. 6
U n iform p e r c e n t a g e _______________________ _ 1. 1 4 .9 3. 2 - - . 4 - - -7 1/ z p e r c e n t_______________________________ . 1 . 8 - - - - - - -10 p e r c e n t________________________________ . 7 4. 2 - - - . 4 - - -16 p e r c e n t________________________________ . 2 - 3. 2 - - - - - -
8 h o u r s ' pay fo r 7 l! z h o u r s ' w o r k _________ 1. 0 - - - - - - 32. 5 -O th e r __________________________________________ 1. 6 - - - - - 16. 7 - 1. 0
W ith no sh ift d i f fe re n t ia l______________________ 2 1 .9 11. 7 23 .9 16. 0 33. 2 36. 9 3. 5 6. 0 12. 1
1 R e fe r s to p o l ic ie s o f es ta b lish m e n ts e ith er cu rre n tly operating late shifts o r having p r o v is io n s co v e r in g late sh ifts .2 Includes data fo r N ew E ngland re g io n in addition to th ose shown sep a ra te ly .
N O TE: B e c a u s e o f rou n d in g , su m s o f in d iv idua l item s m ay not equal tota ls .
Digitized for FRASER http://fraser.stlouisfed.org/ Federal Reserve Bank of St. Louis

(P e rc e n t o f produ ction w o rk e rs by sh ift -d if fe re n t ia l p r o v is io n s , 1 United States and se le c te d re g io n s , July—August 1964)
Table 33. Shift Differential Provisions: Selected Structural Clay Products
Shift d if fe re n t ia lB r ick and s tru ctu ra l c la y tile C e r a m ic w a ll and f lo o r tile
United States 2
M iddleA tlantic
B o rd e rStates Southeast Southw est G reat
L akesM iddle
W est M ountain P a c if ic United States 2
M iddleA tlantic Southeast
S econ d sh ift
W o rk e rs in e s ta b lish m e n ts havings e c o n d -s h if t p r o v is i o n s _________________________ 61.4 100.0 81.1 29.4 64.5 68.5 42.5 74.2 85.7 96.8 93.6 91.7
W ith sh ift d if f e r e n t ia l------------- ------------------------ - 28.9 68.4 46.1 7.3 11.4 29.4 12.5 70.7 52.6 86.9 93.6 77.0U n iform cen ts p e r h o u r ___________________ 24.8 57.2 39.8 7.3 11.4 29.4 12.5 29.3 52.6 86.1 89.8 77.0
2 c e n t s ____________________________________ .7 - - 2.4 _ _ _ _ _ _2 V? c e n t s _____ _ _ _ _ „ 1.0 - 14.2 _ _ _ _ _ _ _3 c e n t s ____________________________________ 1.5 - 13.9 1.1 - _ 3.8 _ _ 1.8 _ _4 c e n t s ____________________________________ 5.8 4.7 - 1.8 - 22.2 _ _ 2.0 3.6 _ 12.05 c e n t s ____________________________________ 9.0 20.5 - 1.9 11.4 1.5 8.6 29.3 31.8 25.5 22.0 8.06 c e n t s ____________________________________ 2.9 10.9 11.7 - - 3.4 _ _ _ 16.2 27.97 c e n t s ____________________________________ - - - _ _ _ _ _ 3.9l l/ z c e n t s _________________________________ _ _ - _ _ _ _ _ _8 ce n ts __ _ _ 1.2 9.9 - - - - _ _ _ 10.3 _9 c e n t s ____________________________________ - - - _ - _ _ _ _ 3.8 _10 c e n ts ________________________________ 1.4 - - - 2.3 - - 18.8 21.1 39.9 56.9
U n iform p e r c e n t a g e ________________________ 1.8 11.2 6.3 _ _ _ _ I I7 p e r c e n t _______ ________________________ 1.4 11.2 - - - - _ _ _ _ _ _10 p e r c e n t________________________________ - - - - - - _ _ _ _ _ _16 p e r ce n t________________________________ .5 - 6 .3 - - _ _ _ _ _ _ _
8 h o u r s ' pay fo r 7 V2 h o u r s ' w o r k . . .______ 2.2 _ - - _ _ _ 41.5 _ .8 3.8O ther . . _ . _ - _ _ _ _ _ _ _ _
W ith no sh ift d if f e r e n t ia l______________________ 32.5 31.5 35.0 22.1 53.1 39.2 30.0 3.5 33.0 9.9 - 14.8
T h ird o r o th e r la te sh ift
W o rk e rs in e s ta b lish m e n ts having t h ir d - o ro th e r la te -s h ift p r o v is io n s _ _______ __ __ 58.8 100.0 81.1 27.6 51.0 68.5 42.5 74.2 85.7 96.8 93.6 91.7
W ith sh ift d i f f e r e n t ia l__________________________ 30.2 68.4 46.1 8.4 13.8 29.4 27.3 70.7 52.6 86.9 93.6 77.0U n iform cen ts p e r h o u r ___________________ 26.2 57.2 39.8 8.4 13.8 29.4 27.3 29.3 52.6 86.9 93.6 77.0
2 c e n t s ____________________________________ - - - - - - _ _ _ .8 3.8 _4 c e n t s ____________________________________ .7 - - 2.4 - - _ _ _ _ _ _5 c e n t s ____________________________________ 4.6 - 28.1 3.0 4.7 1.5 14.8 _ _ 6 .2 _ _6 c e n t s ____________________________________ 7.0 4.7 - 2.9 - 25.6 3.8 - 2.0 _ _ _7 c e n t s ______________________________ ____ - - - - - - - _ _ 1.7 _ _8 c e n t s ----------------------------------------------- ----- 2.7 3.3 11.7 - - - _ _ 29.2 1.9 _ 12.09 c e n t s ________ _______________________ ___ 1.3 10.9 - - - . _ _ _ 3.3 _ _10 c e n ts ___________________________________ 6.8 20.5 - - 9 .0 2.3 8.6 29.3 2.6 50.8 78.9 48.111 c e n t s ___________________________________ - - - - - - _ _ _ 3.3 _ _12 c e n t s __________________________________ _ .8 6.7 - - - - _ _ _ 7.8 10.9 _13 c e n t s ___________________________________ - - _ _ _ _ _ _ _ _ _14 c e n t s ____________________________ _____ - - - - _ - _ _ _ 3.8 _ _15 c e n t s ___________________________________ .9
1.4 I l l- - - - - - 18.8 6.1 - 16.9
20 c e n ts ___________________________________ _ _ _ _ I 1.0U n iform p e r c e n t a g e ________________________ 1.8 11.2 6.3 - - - - _ _ _ _ .
10 p e r c e n t________________________________ 1.4 11.2 - - - - _ - _ _ _ _16 p e r c e n t___ _____________________________ .5 - 6 .3 _ _ _ _ _ _
8 h o u r s ' pay fo r 7 l/ z h o u r s ' w o r k _______ 2.2 _ _ _ _ _ . 41.5 _ _ _ _O t h e r ________ ________________________________ _ _ _ _ _ _ _ _ _
W ith no sh ift d if fe re n t ia l _ _ _ . _ _ . 28.6 31.5 35.0 19.2 37.2 39.2 15.2 3.5 33.0 9.9 ' 14.7
See footnotes at end of table.
*CD
Digitized for FRASER http://fraser.stlouisfed.org/ Federal Reserve Bank of St. Louis
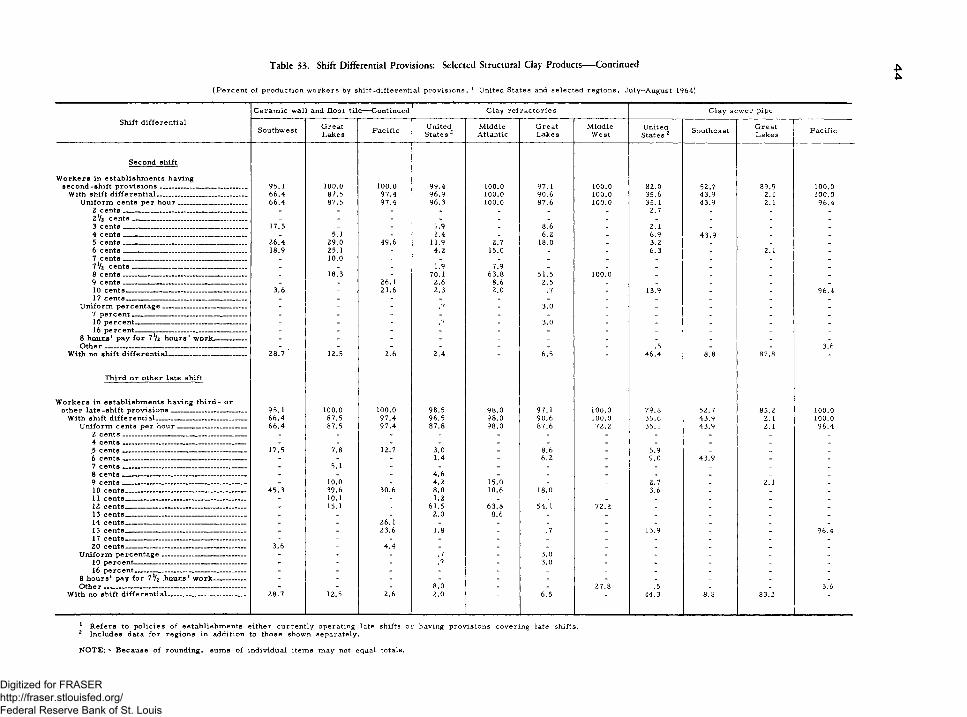
Table 33. Shift Differential Provisions: Selected Structural Clay Products— Continued **
(P e r c e n t o f p ro d u ctio n w o rk e rs by sh ift -d if fe re n tia l p r o v is io n s , 1 United States and s e le c te d re g io n s , July—A ugust 1964)
C e r a m i c w a l l a n d f l o o r t i l e — C o n tin u e d C l a y r e f r a c t o r i e s C l a y s e w e r p ip e
S h if t d i f f e r e n t i a lS o u t h w e s t G r e a t
L a k e s P a c i f icU n ite d
S t a t e s 2M id d le
A t la n t icG r e a tL a k e s
M id d leW e s t
U n ite d S t a t e s 2
S o u t h e a s tG r e a tL a k e s
P a c i f ic
S e c o n d sh ift .
W o r k e r s in e s t a b l i s h m e n t s h a v in gs e c o n d - s h i f t p r o v i s i o n s -------------------------------------------------- 9 5 .1 1 0 0 .0 1 0 0 .0 9 9 .4 1 0 0 .0 9 7 .1 1 0 0 .0 8 2 .0 5 2 .7 8 9 .9 1 0 0 .0
W it h s h i f t d i f f e r e n t i a l ---------------------------------------------------- 6 6 .4 8 7 .5 9 7 .4 9 6 .9 1 0 0 .0 9 0 .6 1 0 0 .0 3 5 .6 4 3 .9 2 .1 1 0 0 .0U n i f o r m c e n t s p e r h o u r __________________________ 6 6 .4 8 7 .5 9 7 .4 9 6 .3 1 0 0 .0 8 7 .6 1 0 0 .0 3 5 .1 4 3 .9 2 .1 9 6 .4
2 c e n t s ___________________________________________ __ - - - - - - - 2 .7 - - -2 V2 c e n t s __ ___________________________________ _ - - - - - - - - - _ -3 c e n t s _________________________ _ ________________ 1 7 .5 - - 1 .9 - 8 .6 - 2 .1 _ - _4 c e n t s _______ — _______________________ ____ - 5 .1 - 1 .4 - 6 .2 - 6 .9 4 3 .9 _ _5 c e n t s ______ _____ _____ _____ __________ ____ ______ 2 6 .4 2 9 .0 4 9 .6 1 1 .9 2 .7 1 8 .0 _ 3 .2 - _ _6 c e n t s ______________ _______ ____ _________ _ 1 8 .9 2 5 .1 - 4 .2 1 5 .0 - _ 6 .3 _ 2 .1 _7 c e n t s ____ ________________________________________ - 1 0 .0 - - - - _ _ _ _ _7 V2 c e n t s ________________ _______________ _____ _ - - 1 .9 7 .9 _ - _ _ _ _8 c e n t s _____ ____________________ ____________ ______ - 1 8 .3 - 7 0 .1 6 3 .8 5 1 .5 1 0 0 .0 _ _ _ _9 c e n t s ____________ ________________________________ _ _ 2 6 .1 2 .6 8 .6 2 .5 _ _ _ _ _10 c e n t s - ____________________ ,______________ - ________ 3 .6 - 2 1 .6 2 .3 2 .0 .7 _ 1 3 .9 _ _ 9 6 .417 c e n t s _____________________ _________________ __ - - - - - _ - _ _ _ _
U n i f o r m p e r c e n t a g e _______________________________ - - - .7 - 3 .0 - - - - -7 p e r c e n t — ______ _____ _____________________ - - - - - - - - - - -10 p e r c e n t ___________________________ ____________ - - - .7 - 3 .0 - - - - -16 p e r c e n t ________ _________— __________ _________ - - - - - - - - - - -
8 h o u r s ' p a y f o r 7 V2 h o u r s ' w o r k -------------------- - - - - - _ _ _ _ _ _O t h e r - -------- ---------- --------------- ------------------- — - - - - - - - .5 - - 3 .6
W it h n o s h i f t d i f f e r e n t i a l — ------------------------------------ 2 8 .7 ’ 1 2 .5 2 .6 2 .4 6 .5 - 4 6 .4 8 .8 8 7 .8 -
T h ir d o r o t h e r l a t e s h i f t
W o r k e r s in e s t a b l i s h m e n t s h a v in g t h i r d - o ro t h e r l a t e - s h i f t p r o v i s i o n s ____________________________ 9 5 .1 1 0 0 .0 1 0 0 .0 9 8 .5 9 8 .0 9 7 .1 1 0 0 .0 7 9 .8 5 2 .7 8 5 .2 1 0 0 .0
W it h s h i f t d i f f e r e n t i a l __________________________________ 6 6 .4 8 7 .5 9 7 .4 9 6 .5 9 8 .0 9 0 .6 1 0 0 .0 3 5 .6 4 3 .9 2 .1 1 0 0 .0U n i f o r m c e n t s p e r h o u r _____ _____________________ 6 6 .4 8 7 .5 9 7 .4 8 7 .8 9 8 .0 8 7 .6 7 2 .2 3 5 .1 4 3 .9 2 .1 9 6 .4
2 c e n t s ------------------------------------------------------------------------ - - - - - - - - - - -4 c e n t s ____ ______ _____- ___ - ___- ______ ___ - - - - - - - - - - -5 c e n t s --------------------------- ---------------------------------------- 1 7 .5 7 .8 1 2 .7 3 .0 - 8 .6 - 5 .9 _ _ _6 c e n t s — — ---------------------------------------- ---------- - - - 1 .4 - 6 .2 - 9 .0 4 3 .9 _ -7 c e n t s _______________________ ____________________ - 5 .1 - - - - - - _ _ _8 c e n t s ___ _ — ------------ ------ — -------- — - - - 4 .6 - - - - - - -9 c e n t s _______ ____ _________________ _______________ - 1 0 .0 - 4 .2 1 5 .0 - - 2 .7 - 2 .1 -10 c e n t s _____________________________________________ 4 5 . 3 3 9 .6 3 0 .6 8 .0 1 0 .6 1 8 .0 _ 3 .6 _ _ _11 c e n t s _____________________________________________ _ 1 0 .1 - 1 .2 _ _ _ - _ _ _12 c e n t s . --------------- — ------------------------------------- - 1 5 .1 - 6 1 .5 6 3 .8 5 4 .1 7 2 .2 - - _ _13 c e n t s ___- _________ ______________________________ - - - 2 .0 8 .6 - - - - - -14 c e n t s ____________________________ _______________ - - 2 6 .1 - - - - - - - -15 c e n t s ---------------------------------------------------------------------- - - 2 3 .6 1 .8 - .7 - 1 3 .9 - - 9 6 .4
2 0 c e n t s ---------------------------------------------------------------------- 3 .6 : 4 .4~ - “ ~ “ " ~
U n i f o r m p e r c e n t a g e ------------------------------------------------- - - - .7 - 3 .0 - - - - -10 p e r c e n t --------------- — ----------,- --------------- - - - .7 - 3 .0 - - - - -16 p e r c e n t _______________________________ _______ - - - - - - - - - - -
& h o u r s ' p a y f o r 7 V2 h o u r s ' w o r k ------------------- - - - - - - - - - - -O t h e r ---------------------------------------------------------------------------------- - - - 8 .0 - - 2 7 .8 .5 - - 3 .6
W i t h n o s h i f t d i f f e r e n t i a l --------------------------------------------- 2 8 .7 1 2 . 5 2 .6 2 .0 6 .5 4 4 .3 8 .8 8 3 .2
1 R e fe rs to p o l ic ie s o f e s ta b lish m e n ts e ith e r cu rre n t ly operating late shifts o r having p ro v is io n s co v e r in g late sh ifts .2 In clu des data fo r r e g io n s in a ddition to th ose shown sep arate ly .
N O T E : ' B e c a u s e o f roun din g , sum s o f in d iv idu a l item s m ay not equal totals.
Digitized for FRASER http://fraser.stlouisfed.org/ Federal Reserve Bank of St. Louis

(P e rce n t o f p rodu ction w o rk e rs em ploy ed on late sh ifts , United States and s e le c te d re g io n s , July—A ugust 1964)
Table 34. Shift Differential Practices: Structural Clay Products
Shift d iffe re n t ia l United States 1 M iddle A tlantic B o rd e r States S outheast Southw est G rea t L akes M idd le W est M ountain P a c if ic
S e co n d sh ift
W o rk e rs e m p loy ed on se co n d sh ift____________ _ 8 .9 10. 7 11. 3 6. 0 6. 4 8. 5 15. 4 3. 5 10. 8R e ce iv in g sh ift d i f fe r e n t ia l___________________ 7. 2 10. 3 9. 7 4. 4 3. 1 5. 8 15. 0 3. 2 10. 4
U n iform cen ts p e r h o u r ___________________ 7. 1 9 .9 9. 5 4. 4 3. 1 5. 8 15. 0 2. 5 10. 42 c e n t s ............................ .................................... . 1 _ _ . 1 . 5 _ _ _ _2 V2 ce n ts __________________________________ ( 2 ) - . 4 _ _ _ _ _ _3 cen ts __________________________________ . 2 - . 7 . 3 . 3 . 1 _ _ _4 c e n t s ____________________________________ . 4 . 1 _ 1 .4 _ . 5 _ . _5 cen ts ____ _ ________ 1. 4 2. 7 _ . 8 1. 5 1. 4 _ 1. 7 2. 26 c e n t s ____________________________________ . 8 2. 0 . 5 _ . 5 1. 0 1. 3 . 6 _7 c e n t s ____________________________________ . 2 _ _ _ _ . 6 . 1 _7 V2 c e n ts __________________________________ ( 2 ) . 3 . . _ _ _8 c e n t s ____________________________________ 3. 0 4. 3 8. 0 . 2 . 3 2. 1 13. 6 . 2 _9 c e n t s ____________________________________ . 2 _ _ _ _ ( 2 ) _ _ 2. 210 ce n ts ___________________________________ . 8 . 3 _ 1. 7 ( 2) (2) _ _ 6. 017 ce n ts_______________________________ — (2) . 2 _ _ _ _
U n ifo rm p e r c e n t a g e ________________________ . 1 . 3 . 2 - _ _ _ . _7 p e r c e n t _________________________________ (?) . 2 - _ _ _ _ _ _7 7 ? p e r c e n t _ _ ____ ( ) ( 2 ) - - _ _ _ _ _16 p e r c e n t— _ ____ ( ?) - . 2 - _ _ _ _ _
8 h o u r s ' pay fo r 7 V2 h o u r s 1 w o r k ___ _____ ( 2 ) . 2 - _ _ _ _ . 7 _R e ce iv in g no sh ift d if fe re n t ia l________________ 1. 7 . 4 1. 6 1. 6 3. 3 2. 7 . 4 . 2 . 4
T h ird o r o th er la te sh ift
W o rk e rs em p lo y e d on th ird o r oth erlate sh ift— — _ 3. 1 3. 1 2. 8 2. 4 2. 3 2. 7 5. 8 1. 2 5 .9
R e ce iv in g sh ift d i f fe re n t ia l___________________ 2. 4 2. 8 1.9 1. 9 1. 3 1. 2 5. 7 1. 0 5. 6U n ifo rm ce n ts p e r hour __ 2. 1 2. 5 1. 7 1. 9 1. 3 1. 2 3. 7 1. 0 5. 5
2 c e n t s ____________________________________ ( 2 ) ( 2 ) - _ _ _ _ _ .5 cen ts „ . 2 . 1 . 2 ( 2 ) . 4 . 1 . 1 _ . 56 c e n t s ____________________________________ . 2 . 1 _ . 6 . 2 . 2 _ _ .7 c e n t s ____ ( 2 ) _ _ _ _ ( 2 ) _ _ _8 cen ts ______ _ ___ . 1 ( 2 ) . 1 . 3 _ _ . 59 c e n t s ____________________________________ . 1 . 2 _ . _ ( 2 ) ( 2 ) . 210 ce n ts ___________________________________ . 4 . 7 . 1 . 8 . 6 . 2 . 2 . 6 . 511 ce n ts ___________________________________ . 1 - - - . . 2 _ _ .12 ce n ts_______ . 7 1. 1 1. 3 _ . 1 . 5 3. 4 . 2 _14 ce n ts___ _ _ ...... . 1 _ _ _ _ _ _ _ . 815 cen ts — . 3 . _ . 2 _ _ _ _ 3. 217 ce n ts ___________________________________ ( 2 ) . 2 _ _ _ _ _ _ _20 ce n ts — ___ ( 2 ) _ _ _ ( 2 ) . _ _ . 1
U n iform p e r c e n t a g e ________________________ . 1 . 3 . 2 _ _ _ _ _7 V2 p e r c e n t_______________________________ 0 ( 2) - - _ _ _ . .10 p e r c e n t ________________________________ (?) . 2 - - _ _ _ _ .16 p e r c e n t________________________________ (2) - . 2 - - - _ . -
O t h e r _____________ i___________________________ . 2 _ _ _ _ _ 2. 0 _ (2)R e ce iv in g no sh ift d if fe re n t ia l________________ . 8 . 3 . 9 . 5 1. 0 1. 4 . 1 . 2 . 4
1 Includes data fo r New England re g io n in addition to those shown sep a ra te ly .2 L e s s than 0. 05 p e r ce n t . *
NOTE: Because of rounding, sums of individual items may not equal totals.
*01
Digitized for FRASER http://fraser.stlouisfed.org/ Federal Reserve Bank of St. Louis

(P e r c e n t o f p ro d u ction w o rk e rs em ployed on late sh ifts , United States and s e le c te d re g io n s , July—A ugust 1964)
Table 35. Shift differential Practices: Selected Structural Clay Products A0 )
B r ic k and s tru ctu ra l c la y tile C e r a m ic w a ll and flo o r tileShift d iffe re n t ia l U nited
S ta te s1M idd leA tlantic
B o rd e rStates Southeast Southw est G rea t
L ak esM idd leW est M ountain P a c if i c United
States 1M idd leA tlan tic Southeast
S econ d sh ift
W o rk e rs em p lo y e d on se co n d sh ift______________ 4. 0 9. 5 6. 0 1. 8 4. 3 3. 8 1. 6 3. 1 3. 2 14. 5 8. 4 17. 3R e ce iv in g sh ift d if fe re n t ia l____________________ 2. 3 8. 5 3. 4 . 5 1. 5 1. 4 - 3. 1 2. 4 13. 0 8. 4 13. 5
U n iform cen ts p e r h o u r ____________________ 2. 1 7 .9 3. 1 . 5 1. 5 1. 4 - 2. 1 2. 4 12.9 7. 8 13. 52 c e n t s ____________________________________ ( 2) - - . 1 - - - - - - - -2V2 c e n ts __________________________________ . 1 - . 7 - - - - - - - - -3 c e n t s ____________________________________ . 2 - 1. 4 . 4 - - - - - . 1 _ -4 c e n t s ____________________________________ . 2 . 3 - (2) _ 1. 0 _ - _ . 5 _ 3. 05 c e n t s ____________________________________ 1. 1 5. 0 - 1. 5 . 3 _ 2. 1 1. 6 2. 9 1. 8 _6 c e n t s ____________________________________ . 2 . 8 1. 0 - - - - - - 2. 7 5. 0 -7- c e n t s ____________________________________ - - - - - - - - - 1. 0 - -7 V2 c e n ts __________________________________ - - - - - - - - - - _ -8 c e n t s ____________________________________ . 2 1. 3 - - - - - - - 2. 5 - -9 c e n t s ____________________________________ - - - - - - - - - . 9 - -10 c e n ts ___________________________________ . 1 - - - - . 1 - - . 8 2. 3 1. 1 10. 517 c e n ts ___________________________________ . 1 . 5 - - - - - - - - _ -
U n iform p e r c e n t a g e ________________________ . 1 . 6 . 4 - - - - - - - - -'7 p e r c e n t _________________________________ . 1 . 6 - - - - - - - - -16 p e r c e n t ________________________________ (2) - . 4 - - - - - - - - -
8 h o u r s ' pay fo r h o u r s ' w o rk _________ . 1 - - - - - - 1. 0 - . 1 . 6 -R e ce iv in g no sh ift d i f fe r e n t ia l________________ 1. 7 1. 0 2. 6 1. 3 2. 8 2. 4 1. 6 _ . 9 1. 5 - 3. 8
T h ird o r oth er late sh ift
W o rk e rs em p lo y e d on th ird o r oth erlate sh ift________ __________________________________ 1. 7 4. 0 2. 1 . 6 1. 2 2. 2 . 8 . 7 3. 0 3. 8 2. 2 6. 8
R e ce iv in g sh ift d if fe re n t ia l____________________ . 8 3. 1 1. 0 . 1 . 4 . 7 . 4 . 7 2. 1 3. 5 2. 2 6. 4U n iform cen ts p e r h o u r ____________________ . 7 2. 5 . 6 . 1 . 4 . 7 . 4 . 7 2. 1 3. 5 2. 2 6 .4
2 c e n t s ____________________________________ - - - - - - - - - ( 2) . 1 -5 c e n t s ____________________________________ . 1 - . 4 . 1 . 2 - . 4 - - . 2 - -6 c e n t s ____________________________________ . 2 . 2 - ( 2) - . 7 - - - - - -7 c e n t s ____________________________________ - - - - - - - - - 0 - -8 c e n t s ____________________________________ . 1 (2) . 2 - - - - - 1. 6 ( ) - . 29 c e n t s ____________________________________ ( 2) . 2 - - - - - - - ( 2) - -10 c e n ts ___________________________________ . 1 . 5 - - . 2 - - . 7 - 1. 8 1. 6 4. 811 ce n ts ___________________________________ - - - - - - - - - . 3 - -12 c e n ts ___________________________________ . 1 1.0 - - - - - - - . 2 . 5 -14 ce n ts ___________________________________ - - - - - - - - - . 3 - -15 ce n ts ___________________________________ ( 2) - - - - - - - . 5 . 6 - 1. 417 c e n ts ___________________________________ . 1 . 5 - - - - - - - - - -20 ce n ts ___________________________________ - - - - - - - - - . 1 - -
U n iform p e r c e n t a g e ________________________ . 1 . 6 . 4 - - - - - - - - -10 p e r c e n t ________________________________ . 1 . 6 - - - - - - - - - -16 p e r c e n t________________________________ (2) - . 4 - - - - - - - - -
O th e r .............. ............. ................................................. - - - - - - - - - - - -R ece iv in g no sh ift d i f fe r e n t ia l________________ .9 . 9 1. 1 . 5 . 9 1. 5 . 4 . 9 . 4 . 4
See footnotes at end of table.
Digitized for FRASER http://fraser.stlouisfed.org/ Federal Reserve Bank of St. Louis

(P e rc e n t o f p rod u ction w o rk e rs em ploy ed on late sh ifts , U nited States and s e le c te d re g io n s , July—A ugust 1964)
Table 35. Shift Differential Practices: Selected Structural Clay Products— Continued
C e ra m ic w all and flo o r t i le — Continued C lay r e f r a c t o r ie s C lay se w e r p ipeShift d iffe re n t ia l
Southw est G reatLakes P a c if i c United
S ta te s1M idd leA tlantic
G rea tL ak es
M idd leW est
UnitedS ta te s1 Southeast G rea t
L akes P a c ific
S econ d sh ift
W o rk e rs e m p loy ed on se co n d sh ift______________ 11. 4 18. 3 13. 2 16. 3 16. 2 9. 6 22. 7 8. 6 8. 9 7. 1 14. 9R e ce iv in g sh ift d i f f e r e n t ia l___________________ 5. 8 17. 3 13. 1 16. 1 16. 2 9. 3 22. 7 5. 0 7. 8 . 3 14. 9
U n iform cen ts p e r hour 5. 8 17. 3 13. 1 16. 1 16. 2 9. 3 22. 7 5. 0 7. 8 . 3 14. 92 c e n t s ____________________________________ - - - - - - - . 4 - - _2V2 c e n ts __________________________________ - - _ _ - _ _ _ _ _ _3 c e n t s ____________________________________ . 6 - - . 2 - . 8 - . 1 _ _ _4 c e n t s ____________________________________ - . 2 _ . 2 _ 1. 0 _ 1. 2 7. 8 _ _5 c e n t s ____________________________________ 2. 3 4. 9 4. 6 1. 3 . 8 1. 1 _ . 1 _ _ _6 c e n t s ____________________________________ 2. 7 4. 1 _ . 4 1 .4 _ . . 9 _ . 3 _7 c e n t s ____________________________________ - 2. 8 _ _ _ _ _ _ _ _ _7 V2 c e n ts —......................................................... - - _ . 2 .9 _ . _ _ _ _8 c e n t s ____________________________________ - 5. 3 - 13. 5 i 3. 1 6. 4 22. 7 - - - -9 c e n t s ____________________________________ - - 6. 0 (2) - ( 2) _ _ _ _ _10 c e n ts ___________________________________ . 2 - 2. 5 . 3 - - 2. 1 - - 14. 917 ce n ts . - - - - - - - - - - -
U n iform p e r ce n ta g e - - - - - - - - - - -7 p e r c e n t _________________________________ - - - - - - - - - - -16 p e r c e n t________________________________ - - - - - - - -1 - - -
8 h o u r s ' pay fo r 7 V2 h o u r s ' w o r k ________ - - - - - - - - - - -R e ce iv in g no sh ift d i f fe r e n t ia l________________ 5. 6 1. 0 . 1 . 2 “ . 4 “ 3. 7 1. 0 6. 8 -
T h ird o r oth er late sh ift
W o rk e rs em p lo y e d on th ird o r otherlate sh ift___________________________________________ 4. 9 1. 9 7. 4 5. 2 2 .9 4. 1 8. 9 4. 3 6. 3 3. 5 6. 7
R e ce iv in g sh ift d i f fe r e n t ia l___________________ 3. 3 1. 6 7. 3 5. 2 2. 9 3. 9 8. 9 2. 4 5. 2 . 2 6. 7U n iform cen ts p e r h o u r ___________________ 3. 3 1. 6 7. 3 4. 2 2. 9 3. 9 5. 6 2. 4 5. 2 . 2 6. 6
2 c ent s ____________________________________ - - - - - - - - - - -5 c e n t s ____________________________________ . 6 - 1. 3 . 1 - . 4 _ . 3 - - -6 c e n t s ____________________________________ - - - _ - - _ 1. 0 5. 2 - -7 c e n t s ____________________________________ - . 1 - - - - - - - - -8 c e n t s ____________________________________ - - - . 3 - - - - - - -9 c e n t s ____________________________________ - . 1 - . 1 . 4 - _ . 1 _ . 2 -10 ce n ts ___________________________________ 2. 6 . 5 1. 5 . 2 . 4 . 3 _ . 1 - - -11 c e n ts ___________________________________ - . 8 - _ - _ _ - _ - -12 ce n ts ___________________________________ ■ _ . 1 - 3. 4 2. 2 3. 2 5. 6 - - - -14 ce n ts ___________________________________ - - 2. 1 - - - - - - - -15 c e n ts ___________________________________ - - 2. 2 . 2 - - - . 9 - - 6. 617 cen ts _ _ _ _ _ _ _ _ _ _ _ -20 c e n ts ___________________________________ . 1 - . 3 - - - - - - - -
U n ifo rm p e r c e n t a g e ________________________ - - - - - - - - - - -10 p e r c e n t___ -_______ - ____________________ - - - - - - - - - - -16 p e r c e n t ________________________________ - - - - - - - - - - -
O t h e r ____ ____ ________________________________ - - - 1. 0 - - 3. 3 (2) - - . 1R e ce iv in g no sh ift d i f fe r e n t ia l________________ 1. 6 . 3 . 1 . 1 . 2 1 .9 1. 0 3. 3
1 Includes data fo r re g io n s in a ddition to those shown sep arate ly .2 L e ss than 0. 05 p e r ce n t .
NOTE: Because of rounding, sums of individual items may not equal totals.
Digitized for FRASER http://fraser.stlouisfed.org/ Federal Reserve Bank of St. Louis
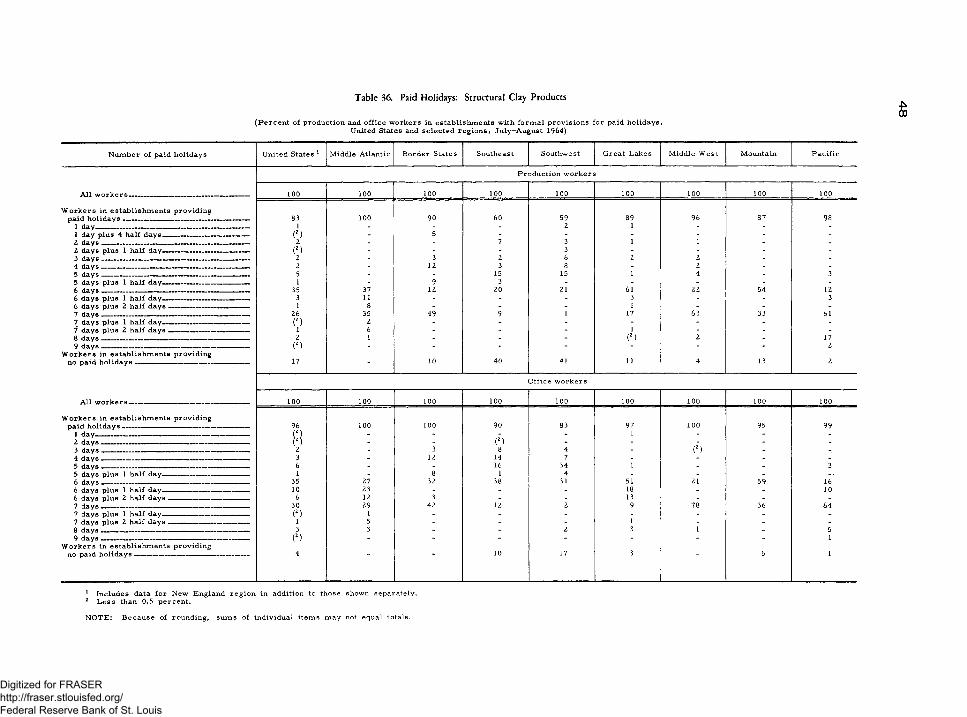
Table 36. Paid Holidays: Structural Clay Products*00
(P e rc e n t o f p ro d u ction and o ff ic e w o rk e rs in e s ta b lish m en ts w ith fo r m a l p r o v is io n s fo r pa id h o lid a y s , United States and s e le c te d r e g io n s , July—A ugust 1964)
N u m b er o f pa id h o lid a y s U nited States 1 M iddle A tlantic B ord er States Southeast Southw est G reat L akes M idd le W est M ountain P a c if ic
A ll w o r k e r s --------- _ - - — - -
P ro d u ctio n w o rk e rs
100 100 100 100 100 100 100 100 100
W o rk e rs in e s ta b lish m e n ts p ro v id in gpa id h o l id a y s ---------------------------------------------------------- 83 100 90 60 59 89 96 87 98
1 d a y . ------ — . ------ - — — — 1(2)
- - - 2 1 - - -1 day p lus 4 h a lf d a y s - ----- — — - - 5 - - - - - -2 days - . -------- — - . - ----- 2 - - 7 3 1 1 - -2 days p lus 1 h a lf da y - - - ----- — (2 ) - - - 3 - - - -3 days _ - ------ - --------- 2 - 3 2 6 2 2 - -4 days _ — _ _ 2 - 12 3 8 - 2 - -5 days _ _ __ — - 5 - - 15 15 1 4 - 35 days p lus 1 h a lf day - - - _ _ - 1 - 9 3 - - - - -6 days . . . - — — 35 37 12 20 21 61 22 54 126 days p lu s 1 h a lf day ---------------------------------- ----- 3 11 - - - 3 - - 36 days p lus 2 ha lf d a y s ----------------------------------- - 1 8 - - - 1 - - -7 days _ _ _ _ _ 26 35 49 9 1 17 63 33 617 days p lu s 1 h a lf day ---------------------------------------- (2 ) 2 - - - - - - -7 days p lu s 2 h a lf d a y s ------------------------------------- 1 6 - - - 1 - - -8 days - _ - - - - ----- 2 1 - - - (2 ) 2 - 179 d a y s ------------------------------------------------------------------- (2 ) - - - - - - - 2
W o rk e rs in e s ta b lish m e n ts p ro v id in gno pa id h o l id a y s ---------------------------------------------------- 17 _ 10 40 41 11 4 13 2
O ffice w o rk e r s
A ll w o rk e r s - — - - 100 100 100 100 100 100 100 100 100
W o rk e rs in esta b lish m e n ts p ro v id in gp a id h o lid a y s ----------------------------------------------------- — 96 100 100 90 83 97 100 95 99
1 day ---------------------------------------------------------------------- (2) - - - - 1 - - -2 d a y s -------------------------------------------------------------- ----- (2 ) - - (2 ) - - - - -3 d a y s ------------------------------------------------------------------- 2 - 3 8 4 - (2) -4 days _ - 3 - 12 14 7 - - - -5 days - — — - - - — — 6 - - 16 34 1 - - 35 days p lu s 1 h a lf day ---------------------------------------- 1 - 8 1 4 - - - -■6 d a y s _________________________________ __________ 35 27 32 38 31 51 21 59 166 days p lus 1 h a lf day---------------------------------------- 10 23 - - - 18 - - 106 days p lus 2 h a lf d a y s ------------------------------------- 6 12 3 - - 13 - - -7 d a y s ------------------------------------------------------------------- 30 29 42 12 2 9 78 36 647 days p lus 1 h a lf day---------------------------------------- (2 ) 1 - - - - - - -7 days p lus 2 h a lf d a y s ------------------------------------- 1 5 - - - 1 - - -8 d a y s ___________________________________________ - 3 3 - - 2 3 1 - 59 d a y s ------------------------------------------------------------------- (2 ) - - - - - - - 1
W o rk e rs in es ta b lish m e n ts p ro v id in gno paid h o l id a y s ---------------------------------------------------- 4 10 17 3 5 1
1 Includes data fo r New E ngland r e g io n in a ddition to those shown sep arate ly .2 L e s s than 0.5 p e rce n t.
NOTE: Because of rounding, sums of individual items may not equal totals.
Digitized for FRASER http://fraser.stlouisfed.org/ Federal Reserve Bank of St. Louis
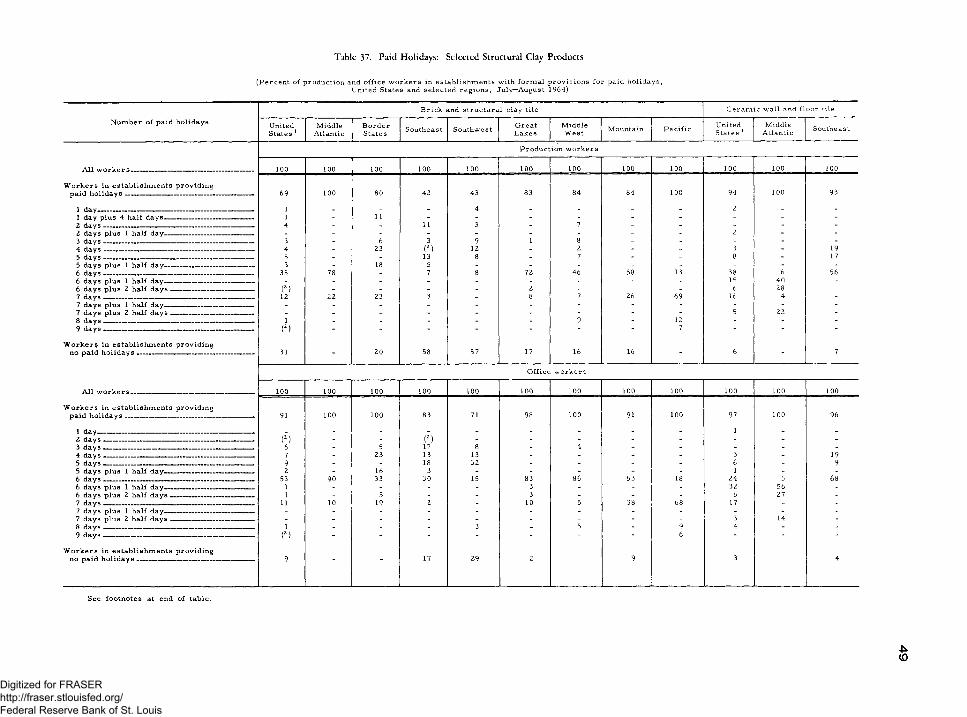
Table 37. Paid Holidays: Selected Structural Clay Products
(P e rce n t o f produ ction and o ff ic e w o rk e rs in e s ta b lish m en ts w ith fo r m a l p r o v is io n s fo r paid h o lid a y s , United States and s e le c te d re g io n s , July—August 1964)
N u m ber o f pa id ho lida y sB r ick and stru ctu ra l c lay tile C e r a m ic w a ll and f lo o r tile
United States 1
M iddleAtlantic
B o rd e rStates Southeast Southw est G reat
L akesM iddleW est M ountain P a c if ic United
States 1M iddle
A tlantic Southeast
P ro d u ctio n w o rk e r s
A ll w o r k e r s — _ _ _ ___ _ — ----- 100 100 100 100 100 100 100 100 100 100 100 100
W o rk e rs in e s ta b lish m e n ts p ro v id in gpa id h o lid a y s —— ------ ------------------------- —----- —-----— 69 100 80 42 43 83 84 84 100 94 100 93
1 day 1 _ _ . 4 _ - - - 2 - -1 day plus 4 ha lf d a y s------ -------------------- - 1 - 11 - - - - - - - - -2 d a y s ___ — ______ ___ _____________________________ 4 - - 11 3 - 7 - - - - -2 days p lus 1 h a lf day----------------------------------------- - - - - - - - - - 2 - -3 d a y s ____ _____ _____ ________________ ______ __ ____ 3 - 6 3 9 1 8 - - - - -4 d a y s __________________________________ _________ 4 - 23 (2) 12 - 2 - - 3 - 195 days -- ___ ____,__ . ____- _______ 5 - - 13 8 - 7 - - 8 - 175 days p lus 1 h a lf day ----------------------------------------- 3 - 18 5 - - - - - - - -6 days - -------- - - _ -------- - — - — 35 78 - 7 8 72 46 58 13 38 6 566 days plus 1 ha lf day----------------------------------------- - - - - - - - - - 15 40 -6 days p lu s 2 h a lf d a y s -------------------------------------- (2 ) - - - - 2 - - - 6 28 -7 days - - - - - - ----- — — - 12 22 23 3 - 8 7 26 69 16 4 -7 days p lus 1 h a lf day ----------------------------------------- - - - - - - - - - - - -7 days p lus 2 ha lf d a y s -------------------------------------- - - - - - - - - - 5 22 -ft days 1 - - - - - 9 - 12 - - -9 days _ _ - — - - (2 ) - - ~ - - - 7 - - "
W o rk e rs in e s ta b lish m e n ts p ro v id in gno pa id h o l id a y s ----------------------------------------------------- 31 _ 20 58 57 17 16 16 6 7
O ffice : w o rk e r s
A ll w o r k e r s __ ____ _ _ 100 100 100 100 100 100 100 100 100 100 100 100
W o rk e rs in e s ta b lish m e n ts p rov id in gpa id h o l id a y s ----------------------------------------------------------- 91 100 100 83 71 98 100 91 100 97 100 96
1 day_______________________________________________ _ _ _ _ _ - - - - 1 - -2 days - - - — — - — — — - — - (2 ) - - (2) - - - - - - - -3 d a y s ________ , ,__ ,________ ......... _ 6 - 5 17 8 - 4 - - - - -4 days - — — ---------- ----- - ---------- 7 _ 23 13 13 - - - - 3 - 195 days — _ ------ 9 - - 18 32 - - - - 6 - 95 days p lus 1 ha lf day— —— — -------- - 2 - 16 3 - - - - - 1 - -6 days — . . . — T.,.,,----- „..------- --- ------- 53 90 33 30 15 83 86 53 18 24 5 686 days p lus 1 h a lf day----------------------------------------- 1 - - - - 3 - - - 32 56 -6 days p lus 2 ha lf d a y s _________________________ 1 - 5 - - 3 - - - 6 27 -7 days -- --------- - _____ _ -------- _ _ 11 10 19 2 - 10 5 38 68 17 - -7 days plus 1 ha lf day ----------------------------------------- - - - - - - - - - - - -7 days p lus 2 h a lf days — ------------- - - - - - - - - - 3 14 -8 days - ____ _ - _ _ ____ _ 1 - - - 3 - 5 - 9 4 - -9 days - „ — — — — __ — (2) - - - - - - 6 " -
W o rk e rs in e s ta b lish m e n ts p ro v id in gno pa id h o lid a y s 9 17 29 2 9 3 4
See footnotes at end of table.
■u<0
Digitized for FRASER http://fraser.stlouisfed.org/ Federal Reserve Bank of St. Louis

Table 37. Paid Holidays: Selected Structural Clay Products— Continued
(P e rc e n t o f p rodu ction and o ff ic e w o rk e rs in e s ta b lish m en ts w ith fo r m a l p r o v is io n s fo r pa id h o lid a y s , United States and s e le c te d re g io n s , July—August 1964)
N u m b er o f pa id h o lid a y sC e r a m ic w a ll and flo o r tilt C ontinued C lay r e f r a c t o r ie s C lay sew er pipe
Southw est G reatLakes P a c if ic United
States 1M idd le
A tlanticG reatL ak es
M iddleW est
United States 1 Southeast G reat
L akes P a c if ic
P ro d u ctio n w o rk e rs
A ll w o r k e r s ____________________ _____ _____ 100 100 100 100 100 100 100 100 100 100 100
W o rk e rs in esta b lish m e n ts p ro v id in gpaid h o lid a y s _____ ___ —___ ______ __________ __ 86 94 94 100 100 100 100 95 100 90 100
1 day_____________________ — --------— ----------------- - 6 _ _ _ _ _ _ _ _ _1 day p lus 4 h a lf d a y s --------- ----- ---------- ----- - - - - - - - - - - -2 days ___ - -------- -------------------------- — — _ - - - 2 - 9 - 1 - - -2 days p lus 1 ha lf day__________________________ 14 - - - - - - - - - -3 days _ -------- ------------------------------------ -------- - - - 2 - 9 - - - - -4 d a y s -------- ----------- ---------- -------- - — _ — - - - - - - - - - _ _5 d a y s -----------------------------_*--------------------------------- 40 - 6 3 - 6 - 6 36 - 45 days plus 1 h a lf day --------- --------------------------- - - - - - - - - - - -6 d a y s --------------------------------- -----------------------------r_ 31 57 16 7 3 21 - 69 53 85 -6 days plus 1 ha lf day-------- ----------------------------- - 15 8 - - - - - - - -6 days plus 2 ha lf d a y s ------------------------------------- - - - (2 ) 2 - - - - - -7 d a y s ----------------------- — - -------------------------- - - 15 63 82 87 44 100 13 11 6 487 days plus 1 ha lf day - -------- - — _ — - - - 2 8 - - - - - -7 days p lus 2 h a lf d a y s ------ ----------------------- _ - - - 2 - 8 - - - - -8 d a y s --------------------------- ----------- ----- ----------- - - - - 1 - 3 - 7 - - 489 d a y s ---------------------------------------------- ----- ---------- - - - - - - - - - -
W o rk e rs in esta b lish m e n ts p ro v id in gno paid h o lid a y s — _ ------------ ------ ----------------- 14 6 6 - - - 5 - 10 -
O ffice w o rk e r s
A ll w o r k e r s -------------------- ------------------------------- 100 100 100 100 100 100 100 100 100 100 100
W o rk e rs in esta b lish m e n ts p ro v id in gpaid h o l id a y s ---------------- ------------------------------------------ 98 93 98 100 100 100 100 100 100 100 100
1 day ---------- -------------------------------------- ------------ - 4 - - - - - - - - -
3 d a y s -------------------------- ------ ------------- ------------ _ _ - - - - - . _ _ _4 d a y s ------------------------------------------ --------------------- - - - - - - - - - - -5 d a y s ------------------------------------------------------------------- 56 - 1 2 - 4 - 9 45 - 195 days plus 1 ha lf day---------------------------------------- 14 - - - - - - - - - _6 d a y s ------------------------------------------------------------------- 29 23 17 11 3 30 _ 70 47 78 _6 days plus 1 ha lf day__________________________ - 59 15 - - - - 5 - 12 -6 days plus 2 ha lf d a y s ------------------------------------- - - - 8 4 34 - 2 - 4 -7 days _ — ------------------------------------------ ------------ - 7 66 74 89 16 100 10 9 6 507 days plus 1 ha lf day---- ----------------------- ------ - - - 1 4 - - - - - -7 days p lus 2 ha lf d a y s ------------ -----.------------ - - - - 1 - 4 - - - - -8 d a y s ------------------------------------------------------------------- - - - 3 - 12 - 3 - - 319 d a y s ------------------------------------------------------------------- - - - - - - ~ - - -
W o rk e rs in esta b lish m e n ts p rov id in gno pa id h o l id a y s ---------------------------------------------------- 2 7 2
1 Includes data fo r re g io n s in a ddition to th ose shown sep arate ly .2 L e ss than 0.5 p e rce n t.
N O T E : B eca u se o f rounding, sum s of in d iv idua l item s m ay not equal totals.
Digitized for FRASER http://fraser.stlouisfed.org/ Federal Reserve Bank of St. Louis

Table 38. Paid Vacations: Structural Clay Products
(P e rc e n t o f p rod u ction and o ff ic e w o rk e rs in esta b lish m en ts w ith fo r m a l p r o v is io n s fo r pa id v a ca tio n s a fte r s e le c te d p e r io d s o f s e r v ic e ,U nited States and s e le c te d re g io n s , Ju ly—A ugust 1964)
V a ca tio n p o l ic y United S ta te s1 M iddle A tlantic B o r d e r States Southeast Southw est G rea t L ak es M idd le W est Mounta in P a c if ic
P ro d u ctio n w o rk e r s
A l l w o r k e r s . _ ..... 100 100 100 100 100 100 100 100 100
M ethod o f paym ent
W o rk e rs in esta b lish m e n ts p ro v id in gpaid v a ca tion s ,_____________________________________ 93 100 89 87 78 97 98 87 98L e n g t h -o f-t im e paym ent .. .. 54 53 43 76 58 44 15 75 72
P e rce n ta g e p a y m en t____________________________ 38 47 46 11 19 50 83 13 26O ther _ 1 _ _ _ 3W o rk e rs in es ta b lish m e n ts p ro v id in g
no pa id v a ca t io n s ....................... 7 - 11 13 22 3 2 13 2
A m ou n t o f v a ca tio n p a y 2
A fte r 1 y e a r o f s e r v ic e :U nder 1 w eek 1 _ _ 1 3 11 w eek . ....... 89 100 89 82 65 91 97 79 98O ve r 1 and under 2 w e e k s ____________________ 1 _ _ _ _ 42 w e e k s _ 1 - - - - 1 - 9 -
A fte r 2 y e a r s o f s e r v ic e :U nder 1 w eek 1 _ _ 3 _ 11 w eek . _.. 70 67 64 76 73 85 40 79 35O v e r 1 and under 2 w eek s 11 24 9 3 2 5 51 22 w e e k s _ 10 9 16 3 - 7 7 9 62
A fte r 3 y e a r s o f s e r v ic e :U nder 1 w eek (3) _ _ 1 11 w eek 58 55 53 73 65 68 32 63 2O ver 1 and under 2 w eek s 14 26 13 4 5 12 572 w e e k s ___ ._ . . _ 20 19 23 6 5 16 10 25 96
A fte r 5 y e a r s o f s e r v ic e :U nder 1 w eek ............... (3) _ _ _ ( 3)1 w eek 17 10 8 38 42 8 1 3 1O ver 1 and under 2 w eek s 1 _ _ 1 _ 12 w eek s 71 80 60 48 33 84 97 84 95O ver 2 and under 3 w eek s 3 10 _ _ 43 w eek s _ 2 - 21 - - - - 2
A fter 10 y e a r s o f s e r v ic e :1 w e e k 15 10 8 35 42 5 1 1O ve r 1 and und er 2 w eeks .... . 1 _ _ 1 _ 12 w e e k s 57 56 51 41 28 81 30 87 69O v e r 2 and under 3 w eek s . ... ... 12 21 6 4 5 6 583 w eek s _ 8 13 3 6 3 4 9 _ 28O ver 3 and under 4 w eek s 1 - 21 - - - -
A fte r 15 y e a r s o f s e r v ic e :1 w e e k . _ .......... 15 10 8 35 42 5 1 _ 12 w eek s _ 25 16 35 32 28 29 14 2 25O ver 2 and under 3 w e e k s . _ 1 4 _ 1 _ 1 23 w eek s _ _ ............ 45 51 25 19 8 58 78 85 68O ver 3 and under 4 w eek s _ ............ 4 18 _ _ _ 5 34 w e e k s . _. 2 21 4
See footnotes at end of table, 01
Digitized for FRASER http://fraser.stlouisfed.org/ Federal Reserve Bank of St. Louis
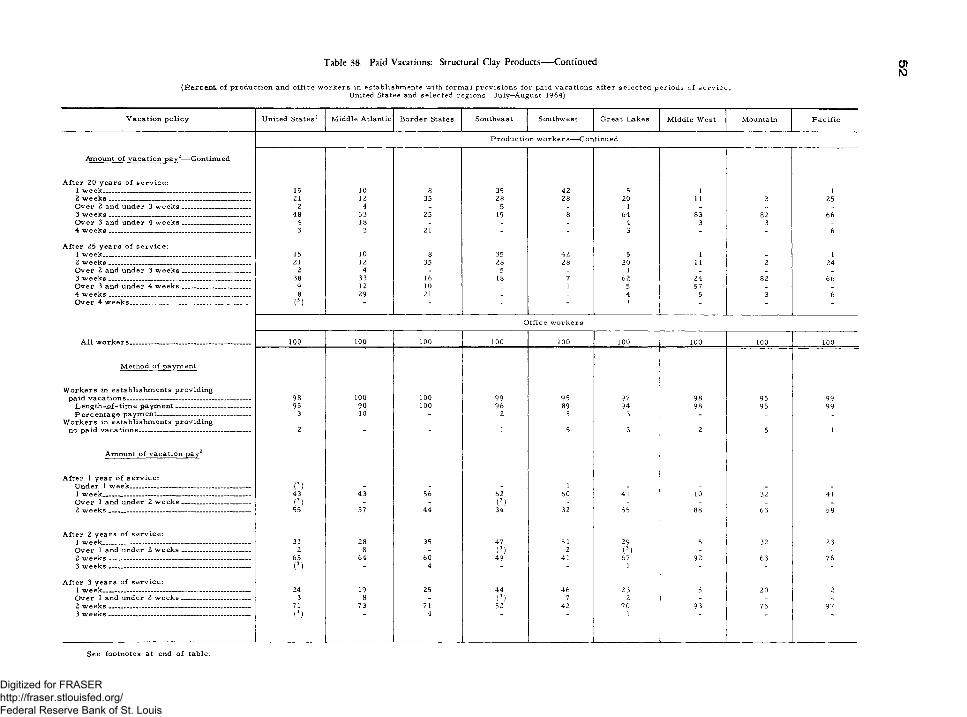
Table 38. Paid Vacations: Structural Clay Products— Continued
(Percent of production and office workers in establishments with formal provisions for paid vacations after selected periods of service,United States and selected regions, July—August 1964)
V a ca tio n p o l ic y U nited S ta te s1 M idd le A tlantic B o rd e r States S outheast Southw est G rea t L akes M idd le W est M ountain P a c if i c
P ro d u ct io n w o r k e r s —-C on tin u ed
Am ount o f v a ca tio n p a y 2— Continued
A fte r 20 y e a r s o f s e r v ic e :1 w eek _ . . 15 10 8 35 42 5 1 _ 12 w eek s ___ _ _ 21 12 35 28 28 20 11 2 25O v e r 2 and und er 3 w e e k s ____________________ 2 4 _ 5 _ 1 _ _ _3 w e e k s __________________________________________ 48 53 25 19 8 64 83 82 66O v e r 3 and under 4 w e e k s ____________________ 4 18 _ _ _ 4 3 3 _4 w e e k s ___ .______________________________________ 3 3 21 - - 3 - - 6
A fte r 25 y e a r s o f s e r v ic e :1 w e e k .. _________________________________________ 15 10 8 35 42 5 1 _ 12 w e e k s __________________________________________ 21 12 35 28 28 20 11 2 24O v e r 2 and under 3 w e e k s ____________________ 2 4 _ 5 _ 1 _ _ _3 w e e k s __________________________________________ 38 33 16 18 7 62 24 82 66O v e r 3 and und er 4 w e e k s ____________________ 9 12 10 1 1 5 57 _ _4 w e e k s __________________________________________ 8 29 21 _ _ 4 5 3 6O v e r 4 w e e k s ____________________________________ (3) " - - " 1 " -
O ffic e w o rk e r s
A l l w o r k e r s __________________________________ 100 100 100 100 100 100 100 100 100
M ethod o f paym ent
W o rk e rs in es ta b lish m e n ts p ro v id in gpa id v a c a t io n s _____________________________________ 98 100 100 99 95 97 98 95 99
L en gth -_o f-tim e paym ent ......... ....................... . 95 90 100 96 89 94 98 95 99P e rce n ta g e p a ym en t------------------------------------------ 3 10 - 2 5 3 - - -
W o rk e rs in esta b lish m e n ts p ro v id in gno pa id v a c a t io n s _________________________________ 2 " - 1 5 3 2 5 1
A m ount o f v a ca tio n p a y 2
A fte r 1 y e a r o f s e r v ic e :U nder 1 w e e k ____________________________________ (3) - - - 1 - - _ -1 w e e k ____________________________________________ 43 43 56 62 60 41 10 32 41O v e r 1 and under 2 w e e k s ------------------------------- (3) - - ( 3) - - _ _ _2 w e e k s __________________________________________ 55 57 44 34 32 55 88 63 58
A fte r 2 y e a r s o f s e r v ic e :1 w e e k ____________________________________________ 31 28 35 47 51 29 5 32 23O ve r 1 and under 2 w e e k s ____________________ 2 8 _ ( 3) 2 (3) _ _ _2 w e e k s ---------------------------------------------------------------- 65 64 60 49 41 67 92 63 763 w e e k s ---------------------------------------------------------------- (3) - 4 " - 1 - - "
A fte r 3 y e a r s o f s e r v ic e :1 w e e k ____________________________________________ 24 19 25 44 46 23 5 20 2O v e r 1 and under 2 w e e k s ____________________ 3 8 - ( 3) 7 2 - _ -2 w e e k s __________________________________________ 71 73 71 52 42 70 93 75 973 w e e k s ---------------------------------------------------------------- (3) 4 1
See footnotes at end of table.
Digitized for FRASER http://fraser.stlouisfed.org/ Federal Reserve Bank of St. Louis
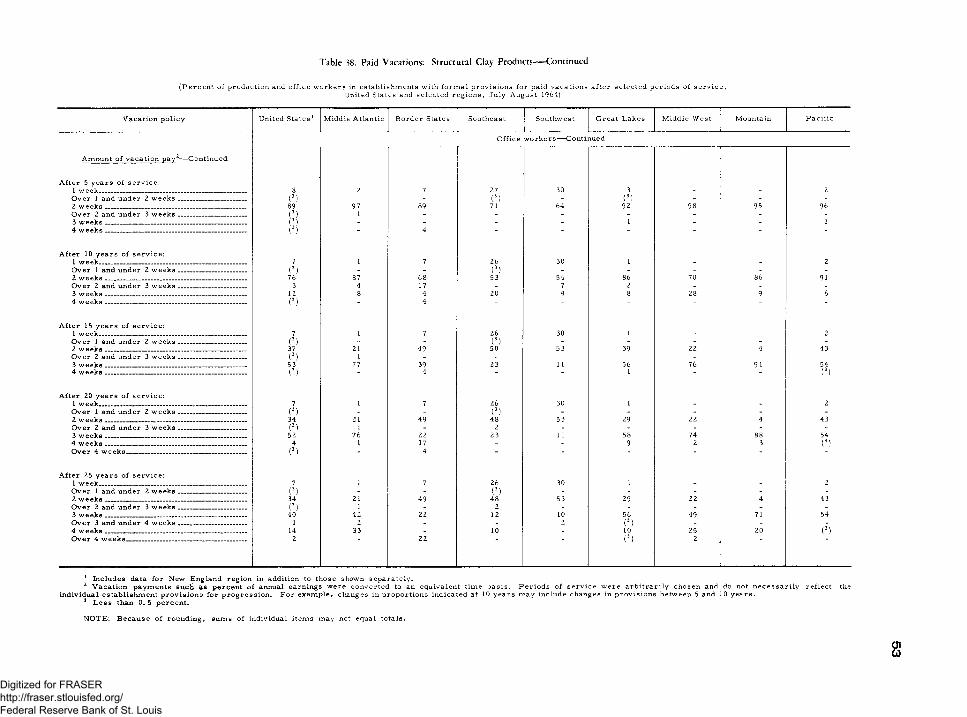
Table 38. Paid Vacations: Structural Clay Products— Continued
(Percent of production and office workers in establishments with formal provisions for paid vacations after selected periods of service,United States and selected regions, July—August 1964)
V a ca tio n p o l ic y United S ta tes1 M iddle A tlan tic B o rd e r States Southeast Southw est G rea t L akes M idd le W est M ountain P a c if ic
O ffice w o r k e r s — C ontinued
A m ount o f v a ca tio n p a y 2— C ontinued
A fte r 5 y e a r s o f s e r v ic e :1 w e e k ____________________________________________ 8 2 7 27 30 3 - - 2O ve r 1 and under 2 w e e k s ____________________ (3) - - (3) - ( 3) - - -2 w e e k s __________________________________________ 89 97 89 71 64 92 98 95 96O ve r 2 and under 3 w e e k s ____________________ (3) 1 - - - - - - -3 w e e k s __________________________________________ ( )
(3)- - - - 1 - - 1
4 w e e k s __________________________________________ - 4 - - ■ - - -
A fte r 10 y e a r s o f s e r v ic e :1 w e e k ____________________________________________ 7 1 7 26 30 1 - - 2O ve r 1 and under 2 w e e k s ____________________ (3) - - (3) - - - - -2 w e e k s __________________________________________ 76 87 68 53 54 86 70 86 91O ve r 2 and under 3 w e e k s ____________________ 3 4 17 - 7 2 - - -3 w e e k s __________________________________________ 12 8 4 20 4 8 28 9 64 w e e k s __________________________________________ (3) - 4 " - - - - "
A fte r 15 y e a r s o f s e r v ic e :1 w e e k ____________________________________________ 7 1 7 26 30 1 - - 2O ve r 1 and under 2 w e e k s ____________________ (3) - - (3) - - - - -2 w e e k s __________________________________________ 37 21 49 50 53 39 22 4 43O ver 2 and under 3 w e e k s ____________________ (3) 1 - - - - - - -3 w e e k s __________________________________________ 53 77 39 23 11 56 76 91 544 w e e k s __________________________________________ (3) " 4 " ” 1 ■ " (3)
A fte r 20 y e a r s o f s e r v ic e :1 w e e k ____________________________________________ 7 1 7 26 30 1 - - 2O ver 1 and und er 2 w e e k s ____________________ (3) - - (3) - - - - -2 w e e k s __________________________________________ 34 21 49 48 53 29 22 4 43O ver 2 and under 3 w e e k s ____________________ (3) 1 - 2 - - - - -3 w e e k s __________________________________________ 52 76 22 23 11 58 74 88 544 w e e k s __________________________________________ 4 1 17 - - 9 2 3 (3)O v e r 4 w e e k s ____________________________________ (3) - 4 - - “ " - -
A fte r 25 y e a r s o f s e r v ic e :1 w e e k ____________________________________________ 7 1 7 26 30 1 - - 2O ve r 1 and under 2 w e e k s ____________________ (3) - - ( 3 ) - - - - -2 w e e k s __________________________________________ 34 21 49 48 53 29 22 4 43O v e r 2 and under 3 w e e k s ____________________ ( 3 ) 1 - 2 - - - - -3 w e e k s __________________________________________ 40 42 22 12 10 56 49 71 54O v e r 3 and und er 4 w e e k s ____________________ 1 2 - - 2 ( 3 ) - - -4 w e e k s __________________________________________ 14 33 _ 10 - 10 25 20 ( 3 )O v e r 4 w e e k s____________________________________ 2 22 ( 3 ) 2
1 In clu des data fo r New E ngland reg io n in addition to th ose shown sep a ra te ly .2 V a ca tio n p a ym en ts su ch a$ p e rce n t o f annual earn ings w ere co n v e r te d to an equ ivalen t tim e b a s is . P e r io d s o f s e r v ic e w e re a r b it r a r i ly ch o se n and do not n e c e s s a r i ly r e f le c t the
in d iv idu a l e sta b lish m en t p r o v is io n s fo r p r o g r e s s io n . F o r ex am p le , changes in p ro p o r tio n s in d icated at 10 y e a rs m ay in clu de changes in p r o v is io n s b etw een 5 and 10 y e a r s .3 L e s s than 0. 5 p e r ce n t .
NOTE: Because of rounding, sums of individual items may not equal totals.
0103
Digitized for FRASER http://fraser.stlouisfed.org/ Federal Reserve Bank of St. Louis
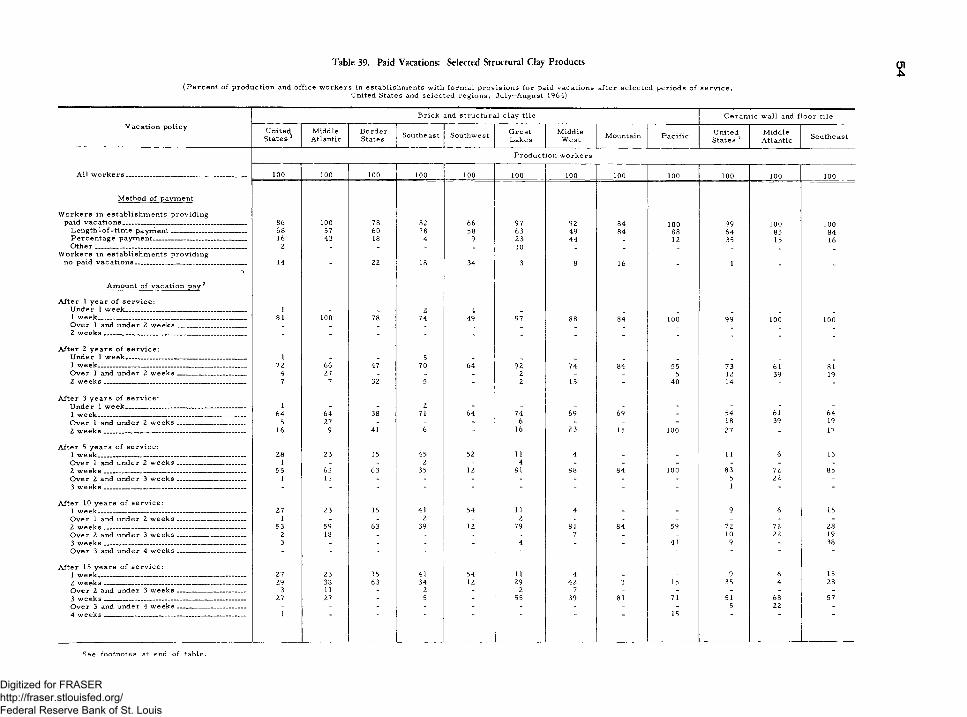
Table 39. Paid Vacations: Selected Structural Clay Products 01-U
(Percent of production and office workers in establishments with formal provisions for paid vacations after selected periods of service,United States and selected regions, July—August 1964)
V a ca tio n p o l ic yB r ick and stru ctu ra l c la y tile C e ra m ic w a ll and f lo o r tile
U nited States 1
M iddleAtlantic
B o rd e rStates Southeast Southw est G rea t
L akesM iddle
W est M ountain P a c if ic United. States 1
M iddleA tlantic Southeast
P ro d u ctio n w o rk e r s
A ll w o r k e r s _ _ 100 100 100 100 100 100 100 100 100 100 100 100
M ethod o f paym ent
W o rk e rs in e s ta b lish m e n ts p rov id in gpaid v a c a t i o n s ____ 86 100 78 82 66 97 92 84 100 99 100 100
L e n g th -o f-t im e p a y m e n t---------------------------------- 68 57 60 78 58 63 49 84 88 64 85 84P e rce n ta g e p a ym en t____________________________ 16 43 18 4 9 23 44 _ 12 35 15 16O t h e r _____________________________________________ 2 - _ _ _ 10 _ _ _ _
W o rk e rs in esta b lish m e n ts p rov id in gno paid v a c a t io n s _________________________________
•>14 22 18 34 3 8 16 " 1 - -
A m ount o f v a cation pay 2
A fte r 1 y e a r o f s e r v ic e :U nder 1 w e e k ______________ _ 1 - 2 4 _1 w eek _ _ 81 100 78 74 49 97 88 84 100 99 100 100O ve r 1 and und er 2 w eek s _ _ _ _2 w e e k s __________________________________________ - - - - - - - - - - - -
A fte r 2 y e a r s o f s e r v ic e :U nder 1 w e e k ___ _______________________________ 1 - - 5 _ _ _ _ _ _1 w eek _ ____ _ 72 66 47 70 64 92 74 84 55 73 61 81O v e r 1 and u nd er 2 w e e k s ____________________ 4 27 - - - 2 _ _ 5 12 39 192 w e e k s __________________________________________ 7 7 32 5 2 15 - 40 14
A fte r 3 y e a r s o f s e r v ic e :U nder 1 w e e k _________________________________ - 1 - - 2 - - - - - - - -1 w e e k ____________________________________________ 64 64 38 71 64 74 69 69 - 54 61 64O ver 1 and und er 2 w e e k s ------------------------------- 5 27 - - - 6 - - - 18 39 192 w e e k s ___________________________________ _______ 16 9 41 6 “ 16 23 15 100 27 - 17
A fte r 5 y e a r s o f s e r v ic e :1 w e e k ___________ ________________________________ 28 23 15 45 52 11 4 - - 11 6 15O v e r 1 and u n d er 2 w e e k s ------------------------------- 1 _ - 2 - 4 - - - - - -2 w e e k s __________________________ -_______________ 55 65 63 35 12 81 88 84 100 83 72 85O ver 2 and und er 3 w e e k s ------------------------------- 1 11 - - - - - - - 5 22 -3 w e e k s __________________________________________ - - ~ ~ - - - 1
A fte r 10 y e a r s o f s e r v ic e :1 w e e k ____________________________________________ 27 23 15 41 54 11 4 - - 9 6 15O ve r 1 and under 2 w e e k s ------------------------------- 1 - - 2 - 2 - - - - - -2 w e e k s ---------------------------------------------------------------- 53 59 63 39 12 79 81 84 59 72 72 28O ve r 2 and u nd er 3 w e e k s ------------------------------- 2 18 - - - - 7 - - 10 22 193 w e e k s __________________________________________ 3 - - - - 4 - - 41 9 - 38O ve r 3 and under 4 w e e k s ------------------------------- “ - ' - “ - - - - - -
A fte r 15 y e a r s o f s e r v ic e :1 w e e k ____________________________________________ 27 23 15 41 54 11 4 - - 9 6 152 w e e k s __________________________________________ 29 38 63 34 12 29 42 3 15 35 4 28O ver 2 and und er 3 w e e k s ------------------------------- 3 11 - 2 - 2 7 - - - - -3 w e e k s ---------------------------------------------------------------- 27 27 - 5 - 55 39 81 71 51 68 57O ver 3 and und er 4 w e e k s ____________________ - - - - - - - - - 5 22 -4 w e e k s __________________________________________ 1 15
See footnotes at end of table.
Digitized for FRASER http://fraser.stlouisfed.org/ Federal Reserve Bank of St. Louis
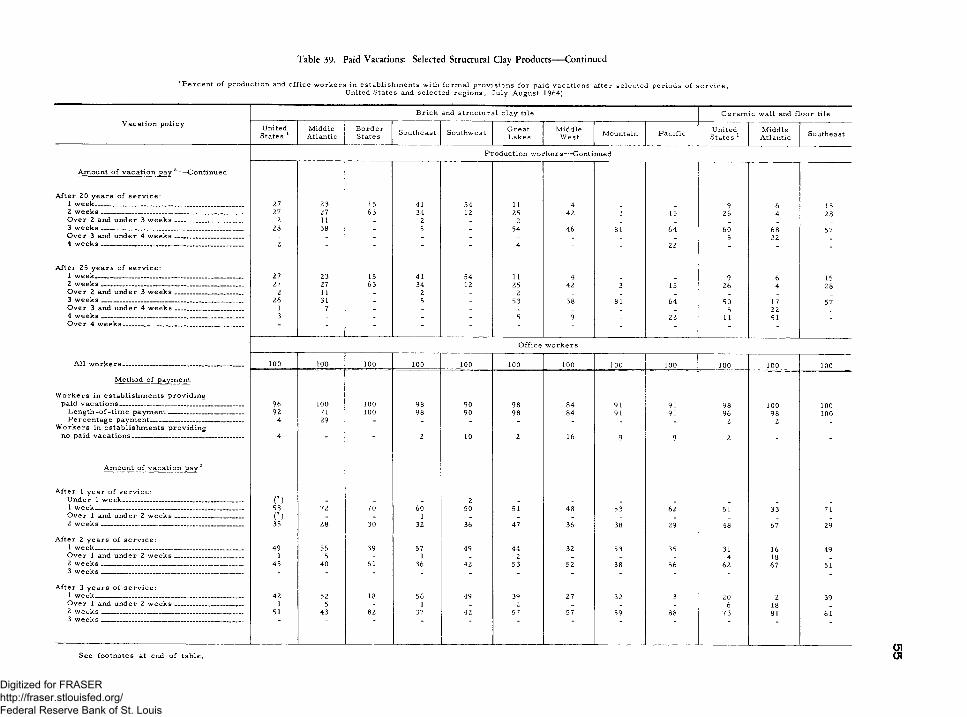
Table 39. Paid Vacations: Selected Structural Clay Products— Continued
^ P ercen t o f p rod u ction and o ff ic e w o rk e rs in e sta b lish m en ts with fo r m a l p ro v is io n s fo r paid v a cation s a fter s e le c te d p e r io d s o f s e r v ic e ,United States and se le c te d re g io n s , Ju ly—A ugust 1964)
V a ca tio n p o l ic yB r ick and stru ctu ra l c la y tile C e ra m ic w a ll and f lo o r tile
United States 1
M iddleA tlantic
B o rd e rStates Southeast Southw est G reat
L akesM iddle
W est M ountain P a c ific United States 1
M iddleA tlantic Southeast
P ro d u ctio n w o r k e r s — Continued
A m ount o f v a ca tio n p a y 2— C ontinued
A fte r 20 y e a r s o f s e r v ic e :1 w e e k ____________________________________________ 27 23 15 41 54 11 4 _ _ 9 6 152 w e e k s __________________________________ ________ 27 27 63 34 12 25 42 3 15 26 4 28O ver 2 and under 3 w e e k s ____________________ 2 11 - 2 _ 2 _ _ _ _3 w e e k s ___________________ _____ 28 38 _ 5 _ 54 46 81 64 60 68 57O ve r 3 and und er 4 w e e k s ____________________ - _ _ _ _ _ _ _ _ 5 224 w eek s _ _ _ 2 - - - - 4 - - 22 -
A fte r 25 y e a r s o f s e r v ic e :1 w e e k ____________________________________________ 27 23 15 41 54 11 4 _ _ 9 6 152 w e e k s __________________________________________ 27 27 63 34 12 25 42 3 15 26 4 28O ver 2 and u n d er 3 w eek s 2 11 _ 2 _ 2 _ _ _3 w eek s _ _ . _ _ 26 31 - 5 _ 53 38 81 64 50 17 57O ver 3 and und er 4 w e e k s ____________________ 1 7 _ _ _ _ _ _ _ 5 224 w e e k s ___________________________________________ 3 - - _ _ 5 9 _ 22 11 51O ver 4 w e e k s _ _ __ ■ - - " - - - - -
O ffice w o rk e r s
A ll w o r k e r s ____________________________________ 100 100 100 100 100 100 100 100 100 100 100 100
M ethod o f paym ent
W o rk e rs in esta b lish m e n ts p ro v id in gpaid v a ca tio n s .... 96 100 100 98 90 98 84 91 91 98 100 100
L e n g th -o f-t im e p a y m e n t______________________ 92 71 100 98 90 98 84 91 91 96 98 100P e rce n ta g e paym ent 4 29 - - - _ _ . _ 2 2 _
W o rk e rs in es ta b lish m e n ts p ro v id in gno pa id v a c a t io n s --------------------------------------------------- 4 ' 2 10 2 16 9 9 2 - -
A m ount o f v a ca tio n pay 2
A fte r 1 y e a r o f s e r v ic e :U nder 1 w e e k ____________________ _____ _________ (3 ) - - _ 2 _ _ _ _ _ _ _1 w e e k ____________________________________________ 58 72 70 60 50 51 48 53 62 51 33 71O ver 1 and under 2 w eek s (3) _ _ 1 _ _ _ _ _2 w e e k s ____ ____________________________________ 35 28 30 32 36 47 36 38 29 48 67 29
A fte r 2 y e a r s o f s e r v ic e :1 w e e k ____________________________________________ 49 55 39 57 49 44 32 53 35 31 16 49O ve r 1 and under 2 w eek s _ _ 1 5 - 1 _ 2 _ _ _ 4 182 w eek s __________________________________________ 45 40 61 36 42 53 52 38 56 62 67 513 w eek s _ _ . .. - - - - - - - - - -
A fte r 3 y e a r s o f s e r v ic e :1 w e e k ____________________________________________ 42 52 18 56 49 39 27 32 3 20 2 39O ver 1 and u nd er 2 w e e k s ____________________ 1 5 _ 1 _ 2 _ _ _ 6 182 w e e k s _____________ ___________________________ 51 43 82 37 42 57 57 59 88 73 81 613 w e e k s __________________________________________
See footnotes at end of table.
Digitized for FRASER http://fraser.stlouisfed.org/ Federal Reserve Bank of St. Louis
Table 39. Paid Vacations: Selected Structural Clay Products— Continued
(P e r c e n t o f p ro d u c tio n and o f f ic e w o rk e rs in esta blish m en ts w ith fo r m a l p r o v is io n s fo r paid v a cation s a fter s e le c te d p e r io d s o f s e r v ic e ,United States and se le c te d re g io n s , July—A ugust 1964)
V a ca tio n p o l ic y
B r ick and stru ctu ra l c la y tile C e r a m ic w a ll and f lo o r tile
United S tates 1
M iddleA tlantic
B ord erStates Southeast Southw est G re at
L akesM iddle
W est M ountain P a c if ic United States 1
M iddleA tlantic Southeast
O ffice w o r k e r s — C ontinued
A m ount o f v a ca tio n p a y 2— Continued
A fte r 5 y e a r s o f s e r v ic e :1 w e e k ______________ . . 21 8 13 47 43 4 - - 3 4 - 11O ve r 1 and under 2 w e e k s _________________ — 1 - - 1 - 2 - - - - - -2 w e e k s ______________________ _____ __ _____ ___ _ 73 87 87 50 47 91 84 91 88 94 100 89O ve r 2 and under 3 w e e k s ____________________ 1 5 - - - - - - - - - -3 w e e k s ____ — ------------------------------------------------ (3) - - - - 1 - - - (3) - -4 w e e k s __________________________________________ " ' “ ■ ~ ~ “ “ - ~
A fte r 10 y e a r s o f s e r v ic e :1 w e e k ____________________________________________ 20 3 13 44 43 4 - - 3 4 - 11O ver 1 and und er 2 w e e k s ------------------------------- (3 ) - - 1 - - - - - - - -2* w e e k s ------------------- ------------------------------------- 71 84 87 53 47 84 84 91 76 83 87 51O v e r 2 ahd und er 3 w e e k s ------------------------------ 2 13 - - - - - - - 1 - -3 w e e k s ---------------------------------------------------------------- 3 - - - - 10 - - 12 10 14 384 w e e k s __________________________________________ - “ " " “ " " - " “
A fte r 15 y e a r s o f s e r v ic e :1 w e e k — ------------------- --------------- ---------------- 20 3 13 44 43 4 - - 3 4 - 11O ver 1 and under 2 w e e k s ---------- ------------------ (3) - - 1 - - - - - - - -2 w e e k s ------------------- ---------------- ----------------------- 43 29 87 50 47 38 61 6 26 41 5 51O ver 2 and under 3 w e e k s ------------------------------- 1 5 - - - - - - - - - -3 w e e k s __________________________________________ 30 63 - 3 - 53 23 85 59 54 96 384 w e e k s ----------------------------------------------------------------- 1 " " ■ " 3 “ “ 3 ~ - “
A fte r 20 y e a r s o f s e r v ic e :1 ijrPflV - - 20 3 13 44 43 4 - - 3 4 - 11O v e r 1 and und er 2 w e e k s --------------------------- _ (3) - - 1 - - - - - - - -2 w e e k s ---------------------------------------------------------------- 42 29 87 50 47 34 61 6 26 34 5 51& v er 2 and under 3 w e e k s ------------------------------- 1 5 - - - - - - - - - -3 w e e k s ---------------------------------------------------------------- 30 63 - 3 - 54 23 81 59 61 96 384 w e e k s __________________________________________ 2 - - - - 6 - 4 3 - - -O v e r 4 w e e k s ------------------------------------------------------- " ■ ' ~ “ “ “ “ “ " '
A fte r 25 y e a r s o f s e r v ic e :1 w e e k — ____ „ —-------------------- -------------------- 20 3 13 44 43 4 - - 3 4 - 11O v e r 1 and under 2 w e e k s ------------------------------- (3 ) - - 1 - - - - - - - -2 w e e k s __________________________________________ 42 29 87 50 47 34 61 6 26 34 5 51O v e r 2 and under 3 w e e k s ------------------------------- 1 5 - - - - - - - - - -3 w eek s —— ___________ _____________ _________ 28 55 - 3 - 52 23 68 59 45 31 38O ver 3 and under 4 w e e k s ------------------------------- 1 8 - - - - - - - - - -4 w e e k s __________________________________________ 3 - - - - 8 - 18 3 16 65 -O v e r 4 w e e k s -------------------------------------------------------
See footnotes at end of table.
Digitized for FRASER http://fraser.stlouisfed.org/ Federal Reserve Bank of St. Louis
Table 39. Paid Vacations: Selected Structural Clay Products-----Continued
(P e r c e n t o f p rodu ction and o ff ic e w o rk e rs in esta b lish m en ts with fo r m a l p r o v is io n s fo r paid vacation s a fter se le c te d p e r io d s o f s e r v ic e ,United States and se le c te d re g io n s , July—A ugust 1964)
C e ra m ic w a ll and f lo o r t i le — Continued C lay r e f r a c t o r ie s C lay se w e r pipe
V a ca tio n p o lic ySouthw est G reat
Lakes P a c ific United States 1
M iddleA tlantic
G reatL akes
M iddleW est
United States 1 Southeast G rea t
L akes P a c ific
P ro d u ctio n w o rk e rs
A ll w o r k e r s ------------------------------------------------------- 100 100 100 100 100 100 100 100 100 100 100
M ethod o f paym ent
W o rk e rs in es ta b lish m e n ts p rov id in gpaid v a c a t io n s _____________________________________ 100 100 95 100 100 100 100 100 100 100 100
Length - o f -t im e p a y m e n t---------------------------------- 73 30 71 25 19 42 - 32 47 22 52P e rce n ta g e pa y m en t--------- -------------------------- - 27 70 24 75 81 58 100 68 53 78 48O th e r _______________ _____________________ — - - - - - - - - - - - -
W o rk e rs in e s ta b lish m e n ts p rov id in gno paid v a c a t io n s _________________________________ 5 ~ “ “ " " '
A m ount o f v a ca tio n p a y 2
A fte r 1 y e a r o f s e r v ic e :U nder 1 w e e k ____________________________________ - - - - - - - - - - -1 w e e k __ ______________________________________ 100 100 95 93 100 76 100 95 100 91 100O v e r 1 and u n d er 2 w e e k s ---------- ----------------- - - - 4 - 18 - 3 - 6 -2 w e e k s ________________________________________— - - - 2 - - - 2 - 4
A fte r 2 y e a r s o f s e r v ic e :U nder 1 w e e k ------------------------------------------------------ - - - - - - - - - - -1 w e e k — ------ --------------------- ------------------------ 95 79 45 53 63 73 10 79 100 91 -O ver 1 and un d er 2 w e e k s __ _______ ________ 5 _ _ 34 13 18 84 4 - 6 -2 w e e k s ____________ — ------------- — ------------ - 21 50 11 24 3 6 16 - 4 100
A fte r 3 y e a r s o f s e r v ic e :U nder 1 w e e k ------------------------------------------------------- - - - - - - - - - - -1 w e e k __ — ----------------------- — ------------- 68 57 3 32 30 41 - 74 100 86 -O ve r 1 and un d er 2 w e e k s ------------------------------- 19 15 - 45 18 37 94 4 - 6 -2 w e e k s __________________________________________ 13 27 92 21 51 16 6 22 - 8 100
A fte r 5 y e a r s o f s e r v ic e :1 w e e k __ ___________________ _________ ____ 42 6 3 4 - 17 - 7 47 - -O ver 1 and u n d er 2 w e e k s ____________________ - - - - - - - - - - -2 w e e k s __________________________ ______________ 58 94 86 84 100 65 100 89 53 94 100O ve r 2 and und er 3 w eek s _ ------------ — ------ - - - 4 - 18 - 3 - 6 -3 w e e k s __________________ __________ _ ------ - - 6 7 - - - - - -
A fte r 10 y e a r s o f s e r v ic e :(3)1 w e e k _______ ___ — ------------- -------- — 24 6 3 - 2 - 8 47 - -
O ver 1 and un d er 2 w e e k s ____________________ - - - - - - - - - - -2 w e e k s __________________________________________ 43 94 86 29 28 45 - 80 53 94 52O ver 2 and un d er 3 w e e k s --------- ------------------- 19 - - 47 29 42 94 - - - -3 w e e k s _______ ___ — -------------------------- - — 14 - 6 15 43 11 6 12 - 6 48O v e r 3 and un d er 4 w e e k s ---------------- ------------ - - - 7 - " - - - -
A fte r 15 y e a r s o f s e r v ic e :(3 )1 w e e k ______________ __ ____ ____ _____ ________ _ 24 6 3 - 2 - 8 47 - -
2 w e e k s _______ ____ _________________________ ____ 43 50 48 7 3 22 - 25 44 17 4O ve r 2 and un d er 3 w e e k s ____________________ _ - - - - - - - - - -3 w eek s . .................................................... 33 43 44 67 56 44 94 67 9 83 96O ve r 3 and u n d er 4 w e e k s ______ ____ ____ - - - 18 41 32 6 - - - -4 w e e k s -------- --------------------- ------------------------ 7
See footnotes at end of table,01
Digitized for FRASER http://fraser.stlouisfed.org/ Federal Reserve Bank of St. Louis

Table 39. Paid Vacations: Selected Structural Clay Products— Continued
(P e r c e n t o f p r o d u c tio n and o ff ic e w o rk e r s in esta b lish m en ts w ith fo r m a l p r o v is io n s fo r paid v a cation s a fter s e le c te d p e r io d s o f s e r v ic e ,United States and s e le c te d re g io n s , Ju ly—A ugust 19-6.4)
V a ca tio n p o l ic yC e r a m ic w a ll and flo o r t ile — Continued C lay r e f r a c t o r ie s C lay se w e r pipe
Southw est G reatLakes P a c ific United
States 1M idd leA tlantic
G reatL akes
M iddleW est
United States 1 Southeast G rea t
L akes P a c if ic
P ro d u ctio n w o rk e r s —-C ontinued
A m ount o f v aca tio n pay 2 — Continued
A fte r 20 y e a r s o f s e r v ic e :1 w e e k ____________________________________________ 24 6 3 (3) - 2 - 8 47 - -2 w e e k s ____________________ _______________ ____ _ 43 24 48 5 3 13 - 17 11 15 4O ver 2 and und er 3 w e e k s ------------------------------- - - - - - - - 5 33 - -3 w e e k s __________________________________________ 33 70 44 65 45 49 94 69 9 85 96O ver 3 and under 4 w e e k s ------------------------------- - - - 18 41 28 6 - - - -4 w e e k s __________________________________________ " - 12 11 8 - “ " “
A fte r 25 y e a r s o f s e r v ic e :1 w e e k ____________________________________________ 24 6 3 (3) - 2 - 8 47 - -2 w e e k s __________________________________________ 43 24 48 5 3 13 - 17 11 15 4O ver 2 and under 3 w e e k s ____________________ - - - - - - - 5 33 - -3 w e e k s __________________________________________ 33 70 44 26 33 32 - 69 9 85 96O ver 3 and und er 4 w e e k s ____________________ - - - 43 13 35 94 - - - -4 w e e k s __________________________________________ - - - 25 52 14 6 - - - -O ver 4 w e e k s ____________________________________ " " 1 " 4 " ■ "
O ffice w o rk e r s
A ll w o r k e r s ------------------------------------------------------- 100 100 100 100 100 100 100 100 100 100 100
M ethod o f paym ent
W o rk e rs in esta b lish m e n ts p rov id in gpaid v a c a t io n s -------------------------------------------------------- 100 93 100 100 100 100 100 99 100 99 100
L e n g th -o f-t im e p a y m e n t______________________ 79 93 100 99 100 96 100 88 79 87 100P e rce n ta g e pa ym en t------------------------------------------ 21 - - 1 - 4 - 12 21 12 -
W o rk e rs in esta b lish m e n ts p rov id in gno paid v a c a t io n s --------------------------------------------------- ~ 7 " " " " " (3) " 1
A m ount o f v a ca tio n pay 2
A fte r 1 y e a r o f s e r v ic e :U nder 1 w e e k ------------------------------------------------------- - - - - - - - - - - -1 w e e k ____________________________________________ 100 43 37 11 22 22 1 42 100 27 50O ver 1 and under 2 w e e k s ------------------------------- - - - - - - - - - - -2 w e e k s __________________________________________ - 50 63 88 78 73 99 58 - 72 50
A fte r 2 y e a r s o f s e r v ic e :1 w e e k ____________________________________________ 95 9 24 8 18 19 - 22 55 20 -O ver 1 and under 2 w e e k s ------------------------------- 2 - - (3) - - - - - - -2 w e e k s __________________________________________ 3 84 76 90 82 77 100 76 45 75 1003 w e e k s __________________________________________ - " - 1 - - - 2 ■ 4 ■
A fte r 3 y e a r s o f s e r v ic e :1 w e e k ____________________________________________ 75 5 2 5 8 11 - 18 55 12 -O ver 1 and under 2 w e e k s ------------------------------- 19 - - 2 - 8 - - - - -2 w e e k s ---------------------------------------------------------------- 6 89 98 91 92 77 100 80 45 83 1003 w e e k s __________________________________________ 1 2 4
S ee foo tn o te s at end o f ta b le .
Digitized for FRASER http://fraser.stlouisfed.org/ Federal Reserve Bank of St. Louis
Table 39. Paid Vacations: Selected Structural Clay Products— Continued
(P e r c e n t o f p rodu ction and o ff ic e w o rk e rs in esta b lish m en ts w ith fo r m a l p r o v is io n s fo r paid v a cation s a fter s e le c te d p e r io d s o f s e r v ic e ,U nited States and s e le c te d re g io n s , July—A ugust 1964)
V a ca tio n p o l ic yC e ra m ic w a ll and flo o r t i le — Continued C lay r e f r a c t o r ie s C lay ;sew er pipe
Southw est G reatLakes P a c if ic United
States 1M iddle
A tlan ticG reatL akes
M iddleW est
United States 1 S outheast G rea t
L ak es P a c ific
O ffice w o r k e r s — C ontinued
A m ount o f v a ca tio n p a y 2— C ontinued
A fte r 5 y e a r s o f s e r v ic e :1 w eek 24 - 2 2 _ 11 _ 1 9 _ _O ver 1 and u n d er 2 w e e k s ------------------------------- - - - - - _ _ _ _ _2 w eek s _ .... _ 76 93 97 97 100 89 100 97 91 96 100O ver 2 and und er 3 w e e k s ____________________ - - - _ _ _ _ _3 w e e k s __________________________________________ _ _ 1 _ _ _ _ 2 _ 4 _4 w e e k s __________________________________________ - - " 1 - - - - -
A fte r 10 y e a r s o f s e r v ic e :1 w e e k ____________________________________________ 24 - 2 _ _ _ _ 1 9 _ _O ver 1 and u n d er 2 w e e k s ____________________ - - _ _ _ _ _ _ _ _2 w e e k s __________________________________________ 43 93 97 65 88 73 64 92 91 91 69O ve r 2 and und er 3 w e e k s ____________________ 19 - - 6 3 8 _ _ _ _3 w e e k s __________________________________________ 14 - 1 28 10 19 36 7 - 8 314 w e e k s ________________ ________________________ " - " 1 - - - - " -
A fte r 15 y e a r s o f s e r v ic e :1 w e e k ____________________________________________ 24 . 2 _ _ _ _ 1 9 _ _O ver 1 and u nd er 2 w e e k s ____________________ - - - _ _ _ _ _ _ _ _2 w e e k s __________________________________________ 43 51 52 13 42 18 3 66 83 62 19O ver 2 and u nd er 3 w e e k s ____________________ - . _ _ _ _ _ _ _ _3 w e e k s __________________________________________ 33 42 45 86 58 82 97 32 9 38 814 w e e k s __________________________________________ - " 1 - - - " - -
A fte r 20 y e a r s o f s e r v ic e :1 w e e k ____________________________________________ 24 - 2 _ _ _ _ 1 9 _ _O ver 1 and und er 2 w e e k s ____________________ - - - _ _ _ _ _ _ _ _2 w e e k s __________________________________________ 43 24 52 12 42 11 3 63 66 59 19O ver 2 and und er 3 w e e k s ____________________ - _ - _ _ _ _ 3 173 w e e k s __________________________________________ 33 70 45 76 54 60 94 33 9 40 814 w eek s _ __ _ _ - - _ 12 4 29 2 _ _ _ _O ver 4 w e e k s _ _ _ - - - 1 " - - - - -
A fte r 25 y e a r s o f s e r v ic e :1 w e e k ____________________________________________ 24 - 2 - - _ - 1 9 _ _O ver 1 and u n d er 2 w e e k s ____________________ - - - _ _ _ _ _ _ _ _2 w e e k s ______________ ___________________________ 43 24 52 12 42 11 3 63 66 59 19O ver 2 and und er 3 w e e k s ------------------------------- - - - - - _ _ 3 17 _3 w eek s __________________________________________ 33 70 45 51 36 55 60 31 9 36 81O ver 3 and und er 4 w e e k s ____________________ - - - 1 _ 2 _ _ _ _ _4 w e e k s __________________________________________ - - _ 31 22 30 34 2 _ 4 _O ver 4 w e e k s ____________________________________ 6 2 2
1 In clu des data fo r re g io n s in addition to those show n sep arate ly .2 V a ca tio n paym ents such as p e rce n t o f annual earn in gs w ere co n v e r te d to an equ iva len t tim e b a s is . P e r io d s o f s e r v ic e w e re a r b it ra r ily ch o se n and do not n e c e s s a r i ly re f le c t in d i
v id u al e s ta b lish m e n t p r o v is io n s fo r p r o g re s s io n . F o r exam p le , changes in p ro p o r tio n s in d ica ted at 10 y e a r s m ay in clu de changes in p ro v is io n s b etw een 5 and 10 y e a r s .3 L e s s than 0.5 p e rce n t.
N O T E : B e ca u se o f rou n d in g , sum s o f in d iv idua l ite m s m ay not equal to ta ls .
Digitized for FRASER http://fraser.stlouisfed.org/ Federal Reserve Bank of St. Louis
Table 40. Health, Insurance, and Pension Plans: Structural Clay Products 8(P e r c e n t o f p rodu ction and o ff ic e w ork ers in esta b lish m en ts w ith s p e c ifie d health , in su ra n ce , and pen sion p lans,
United States and s e le c te d re g io n s , July—August 1964)
T ype o f p lan 1 United States 2 M iddle A tlantic B o rd e r States Southeast Southw est G reat L akes M iddle W est M ountain P a c if i c
P ro d u ctio n w o rk e r s
A ll w o r k e r s -------------------------------------------------------- 100 100 100 100 100 100 100 100 100
W o rk e rs in es ta b lish m e n ts p ro v id in g :
L ife in s u r a n c e ___________________________________ 90 99 90 88 77 94 87 85 90A c c id e n ta l death and d ism e m b e rm e n t
ins ur an c e ________ ____*___ _________ ___ _____ 65 69 69 49 48 71 81 66 75S ick n e ss and a cc id e n t in su ra n ce
o r s ick le a v e or b o t h 3— — ------------------------ 71 98 81 36 28 89 85 65 78S ick n e s s and a cc id e n t in su ra n ce - ------------ 65 98 77 35 28 89 85 65 8S ick le a v e (fu ll pay, no
w aiting p e r io d ) --------------------------------------------- 2 - 3 1 - - - 5 14S ick le a v e (p a rtia l pay or
w aitin g p e r io d ) -____________________ -_-____ 5 - - 1 1 - - - 57H o sp ita liza tio n in su ra n ce ---------------------------------- 92 99 94 93 72 96 92 79 97S u rg ica l in su ra n ce ---------------------------------------------- 92 97 94 92 73 95 90 79 97M e d ic a l in s u r a n c e ----------------------------------------------- 64 68 74 70 60 41 82 79 97C a tastrop h e in su ra n ce ---------------------------------------- 19 22 12 16 30 11 20 10 42R e tire m e n t p e n s io n ------ _ ----- --------- -------- 40 64 39 14 16 51 67 8 30No p la n s ----------------------------------------------------------------- 5 " 3 5 15 3 8 12 3
O ffice w o rk e r s
A ll w o r k e r s ------------------------------------------------------- 100 100 100 100 100 100 100 100 100
W o rk e rs in esta b lish m e n ts p ro v id in g :
L ife in s u r a n c e ----------------------------------------------------- 91 97 83 89 80 93 93 95 90A cc id e n ta l death and d ism e m b e rm e n t
in su ra n ce —---------------------------------------------------------- 65 51 61 57 62 65 78 64 83S ick n e ss and a cc id e n t in su ra n ce
o r s ick le a v e or b o th 3 ------------------------------------- 72 99 87 39 40 76 79 63 81S ick n e ss and a cc id e n t in su ra n ce ---------------- 60 98 70 31 34 72 69 54 14S ick le a v e (fu ll pay, no
w aiting p e r io d )--------------------------------------------- 29 16 25 9 11 26 63 13 72S ick le a v e (p artia l pay or
w aiting p e r io d )--------------------------------------------- 1 - - 1 - - 1 - 8H o sp ita liza tio n in su ra n ce ---------------------------------- 93 97 89 97 82 93 96 70 96S u rg ica l in su ra n ce ----------------------------------------------- 93 96 89 97 82 93 96 70 96M e d ica l in s u r a n c e ----------------------------------------------- 72 68 68 85 69 52 92 70 96C a tastrop h e in su ra n ce - — -------- — — ------ 41 61 11 42 53 25 46 16 66R e tire m e n t p e n s io n --------------- --------------- --------- 51 68 35 43 25 45 80 23 56No p la n s ----------------------------------------------------------------- 4 2 11 5 3 4 3
1 In clu des on ly th ose p lans fo r w h ich at le a s t part o f the co s t is borne by the e m p lo y e r and e x clu d e s le g a lly re q u ire d p lans such as w o rk m e n 's co m p en sa tion and s o c ia l s e cu r ity ; h o w e v e r , p lans re q u ire d by State te m p o r a r y d isa b ility in surance law s are in cluded if the em p lo y e r con tr ib u tes m o re than is le g a lly r e q u ire d or the e m p loy ee r e c e iv e s b en e fits in e x c e s s of the le g a l re q u ire m e n ts .
2 In clu des data fo r New E ngland r e g io n in addition to those shown sep arate ly .3 U n dup licated to ta l o f w o rk e r s r e c e iv in g s ick leave or s ick n e ss and acciden t in su ra n ce show n sep a ra te ly .
Digitized for FRASER http://fraser.stlouisfed.org/ Federal Reserve Bank of St. Louis
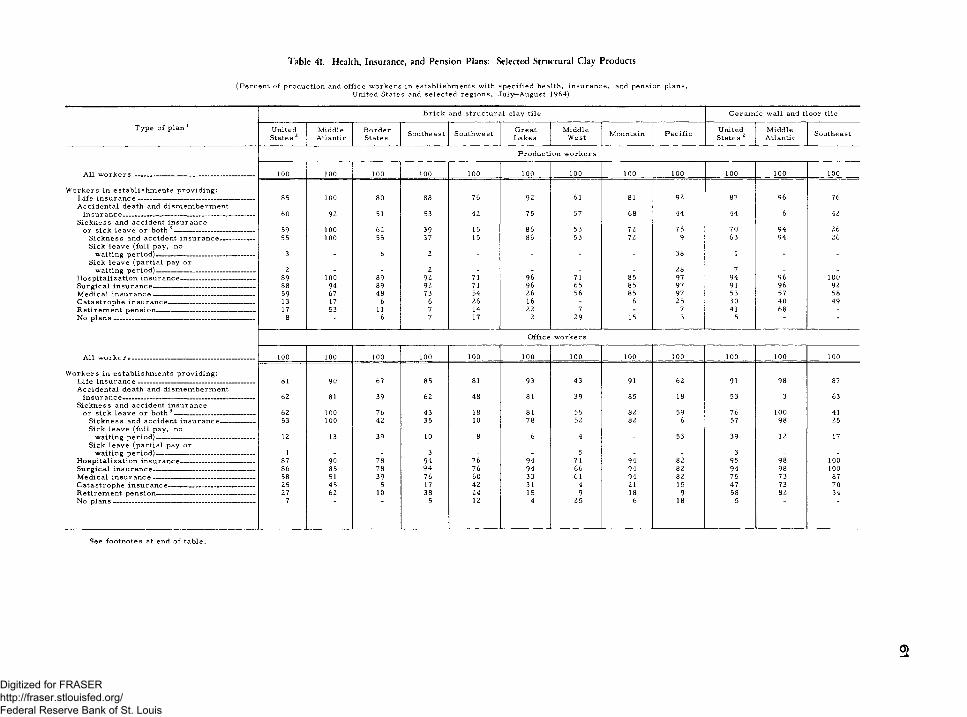
Table 41. Health, Insurance, and Pension Plans: Selected Structural Clay Products
(P e rce n t o f p rodu ction and o ff ic e w o rk e rs in e s ta b lish m en ts with sp e c ifie d health, in su ra n ce , and pen sion plans, United States and s e le c te d re g io n s , July—August 1964)
T yp e o f plan 1
B r ick and s tru ctu ra l c la y tile C e r a m ic w all and f lo o r tile
United States 2
M iddleA tlantic
B o rd e rStates Southeast Southwe st G reat
L akesM iddle
W est M ountain P a c if ic United States 2
M iddleA tlantic Southeast
P ro d u ctio n w o rk e rs
A ll w o r k e r s ---------------------------------------------------- - 100 100 100 100 100 100 100 100 100 100 100 100
W o rk e rs in esta b lish m e n ts p rov id in g :L ife in s u r a n c e ------------- ---------------------------------------- 85 100 80 88 76 92 61 81 92 87 96 76A ccid e n ta l death and d ism e m b e rm e n t
in su ra n ce ------------------------------------------------------------ 60 92 51 53 42 75 57 68 44 44 6 42S ick n ess and a ccid en t in su ra n ce
o r s ick lea v e o r b o th 3------------------------------------- 59 100 62 39 15 86 53 72 75 70 94 26S ick n ess and a ccid en t in s u ra n ce ---------------- 55 100 55 37 15 86 53 72 9 63 94 26S ick lea v e (fu ll pay, no
w aiting p e r io d )--------------------------------------------- 3 - 6 2 - - - - 38 1 - -S ick lea v e (p artia l pay o r
w aiting p e r io d )--------------------------------------------- 2 - - 2 - - - - 28 7 - -H osp ita liza tion in su ra n ce ---------------------------------- 89 100 89 92 71 96 71 85 97 94 96 100S u rg ica l in su ra n ce ---------------------------------------------- 88 94 89 92 71 96 65 85 97 91 96 92M ed ica l in s u r a n c e ---------------------------------------------- 59 67 48 73 54 26 56 85 97 53 57 58C atastroph e in su ra n ce --------------------------------------- 13 17 6 6 26 16 - 6 25 30 40 49R e tire m e n t p e n s io n --------------------------------------------- 17 53 11 7 14 22 7 - 7 41 68 -No p la n s ---------------------------------------------------------------- 8 - 6 7 17 2 29 15 3 5 " "
O ffice w o rk e rs
A11 w o r k e r s _____________________________________ 100 100 100 100 100 100 100 100 100 100 100 100
W o rk e rs in es ta b lish m e n ts pro v id in g :L ife in s u r a n c e ----------------------------------------------------- 81 90 67 85 81 93 43 91 62 91 98 87A c c id e n ta l death and d ism e m b e rm e n t
in su ra n ce ------------------------------------------------------------ 62 81 39 62 48 81 39 85 18 53 3 63S ick n ess and a cc id e n t in su ra n ce
o r s ick le a v e o r b o t h 3 ---------------------------------- 62 100 76 43 18 81 55 82 59 76 100 41S ick n e ss and a cc id e n t in su ra n ce ---------------- 53 100 42 35 10 78 52 82 6 57 98 25S ick le a v e (fu ll pay, no
w aiting p e r io d ) ____________________________ 12 13 39 10 8 6 4 - 53 39 12 17S ick le a v e (p a r tia l pay o r
w aiting p e r io d )- ----------------------------------------- 1 - - 3 - - 5 - - 3 - -H o sp ita liza tio n in su ra n ce _______________ _____ 87 90 78 94 76 94 71 94 82 95 98 100S u rg ica l in su ra n ce ______________________________ 86 85 78 94 76 94 66 94 82 94 98 100M e d ica l in s u r a n c e ---------------------------------------------- 58 51 39 76 60 33 61 94 82 75 73 87C a tastrop h e in su ra n ce --------------------------------------- 25 45 5 17 42 31 4 21 15 47 73 70R e tire m e n t p e n s io n --------------------------------------------- 27 62 10 38 24 15 9 18 9 58 82 34No p la n s ---------------------------------------------------------------- 7 5 12 4 25 6 18 5
See fo o tn o te s at end o f ta b le .
Digitized for FRASER http://fraser.stlouisfed.org/ Federal Reserve Bank of St. Louis

Table 41. Health, Insurance, and Pension Plans: Selected Structural Clay Products— Continued
(P e r c e n t o f p rod u ction and o ff ic e w o rk e rs in e s ta b lish m en ts w ith s p e c ifie d health , in su ra n ce , and pen sion plans, United States and s e le c te d re g io n s , J u ly -A u gu st 1964)
T ype o f p lan 1C e r a m ic w all and flo o r t ile — Continued C lay r e f r a c t o r ie s C lay se w e r pipe
Southw est G reatL ak es P a c ific United
States 2M idd leA tlan tic
G reatL ak es
M iddleW est
United States 2 S outheast G reat
L ak es P a c if ic
A l l w o r k e r s --------------------------------------------------------
P ro d u ctio n w o rk e r s
100 100 100 100 100 100 100 100 100 100 100
W o rk e rs in es ta b lish m e n ts p ro v id in g :L ife in s u r a n c e ___________________________________ 63 94 85 100 100 100 100 97 100 98 96A c c id e n ta l death and d ism e m b e rm e n t
in s u ra n ce ------------------------------------------------------------- 63 38 83 84 91 84 91 81 45 89 96S ick n e ss and a cc id e n t in su ra n ce
o r s ick le a v e o r both 3------------------------------------- 41 88 65 93 100 100 100 85 45 96 100S ick n e ss and a cc id e n t in s u ra n ce ---------------- 41 88 13 91 100 100 100 71 45 96 -S ick le a v e (fu ll pay, no
w aiting p e r io d )-------------------------------------- ------- - - 4 1 - - - 1 - - 4S ick le a v e (p a r tia l pay o r
w aiting p e r io d )--------------------------------------------- - - 47 2 - - - 15 - - 96H o s p ita liza tio n in su ra n ce ---------------------------------- 76 94 95 97 100 91 100 96 100 98 100S u rg ica l in su ra n ce ----------------------------------------------- 81 88 95 98 100 100 100 96 100 98 100M e d ica l in s u r a n c e ----------------------------------------------- 67 20 95 82 86 46 94 72 64 68 100C a tastrop h e in su ra n ce ---------------------------------------- 42 10 41 24 16 5 28 14 - 6 52R e t ire m e n t pen sion ---------------------------------------------- 12 65 30 81 77 59 100 61 36 83 48No p la n s ----------------------------------------------------------------- 19 6 5 " ' ■ " 1 “ 2 "
O ffice w ork e i:s
A ll w o r k e r s -------------------------------------------------------- 100 100 100 100 100 100 100 100 100 100 100
W o rk e rs in esta b lish m e n ts p ro v id in g :L ife in s u r a n c e ------------------------------------------------------ 63 89 96 100 100 100 100 97 100 97 81A c c id e n ta l death and d ism e m b e rm e n t
in s u ra n ce ------------------------------------------------------------ 63 46 95 72 83 56 84 77 53 76 81S ick n e ss and a cc id e n t in su ra n ce
o r s ick le a v e o r b o th 3________________________ 46 84 83 76 97 63 84 79 53 75 100S ick n e ss and a cc id e n t in s u ra n ce ---------------- 43 74 20 68 97 62 73 66 53 73 -S ick le a v e (fu ll pay, no
w aiting p e r io d )____ ____ _ ___________ 3 70 71 46 18 27 80 18 - 4 100S ick le a v e (p a rtia l pay o r
w aiting p e r io d )------------- --------------------------------- - - 12 - - - - - - - -H o sp ita liza tio n in su ra n ce ---------------------------------- 79 89 98 95 100 93 100 99 100 97 100S u rg ica l in su ra n ce ----------------------------------------------- 81 84 98 96 100 100 100 99 100 97 100M e d ica l in s u r a n c e ----------------------------------------------- 67 46 98 84 88 60 98 79 100 65 100C a ta s trop h e in su ra n ce ---------------------------------------- 59 - 72 56 68 46 57 43 45 36 69R e tire m e n t pen sion --------------------------------------------- 10 76 59 79 68 51 100 49 45 48 81No p la n s ----------------------------------------------------------------- 19 11 2 1 3
1 In clu des on ly th ose p lans fo r w h ich at le a s t part o f the co s t is born e by the e m p lo y e r and e x c lu d e s le g a lly re q u ire d plans such as w o rk m e n 's com p e n sa tio n and s o c ia l s e cu r ity ; h o w e v e r , p lans re q u ire d by State te m p o r a r y d isa b ility in su ra n ce law s are in cluded i f the e m p lo y e r co n tr ib u te s m o re than is le g a lly re q u ire d o r the e m p loy ee r e c e iv e s b en e fits in e x c e s s o f the le g a l re q u ire m e n ts .
* In clu des data fo r r e g io n s in addition to th ose shown sep a ra te ly .3 U n dup licated tota l o f w o rk e r s r e c e iv in g s ick lea ve o r s ick n e ss and acciden t in su ra n ce show n se p a ra te ly .
Digitized for FRASER http://fraser.stlouisfed.org/ Federal Reserve Bank of St. Louis

Table 42. Nonproduction Bonuses: Structural Clay Products
(P e rce n t of p ro d u ction and o ff ic e w o rk e r s in e s ta b lish m en ts w ith s p e c ifie d types o f non p rodu ction b on u ses , United States and se le c te d re g io n s , July—August 1964)
T ype o f bonus United States 1 M iddle A tlantic B o rd e r States S outheast Southwe st G reat L akes M iddle W est M ountain P a c ific
P ro d u ctio n w o rk e r s
A ll w o r k e r s -------------------------------------------------------- 100 100 100 100 100 100 100 100 100
W o rk e rs in es ta b lish m e n ts w itnn on p rod u ction b o n u s e s ____________________________ 35 33 28 37 59 46 11 _ 12
C h r is tm a s or y e a r e n d ___ _______________ ___ 32 31 24 35 51 43 11 10P r o fi t sh a rin g _____________ _________ _ ______ 2 1 5 2 5 3 2O t h e r _______ _____________________________________ 1 1 _ _ 3 1 _
W o rk e rs in e s ta b lish m e n ts w ith non o n p rod u ction b o n u s e s ____________________________ 65 67 72 63 41 54 89 100 88
O ffice w o rk e r s
A ll w o r k e r s ---------------------- --------------- ------------- 100 100 100 100 100 100 100 100 100
W o rk e rs in es ta b lish m e n ts w ithn o n p rod u ction b o n u s e s _________ ________________ 38 58 30 31 69 47 13 _ 25
C h r is tm a s or y e a r e n d ---------------------------------- __ 32 47 25 29 62 36 13 _ 25P r o f i t sh a rin g ___ _______________ _____________ 5 9 5 2 5 11
/2 \ - -© r
W o rk e rs in e s ta b lish m e n ts w ith no 2 “n o n p rod u ction b o n u s e s ------------------------------------------ 62 42 70 69 31 53 87 100 75
1 In clu des data fo r New England re g io n in addition to those shown sep a ra te ly .2 L e s s than 0.5 p e rce n t.
N O T E : B e ca u se o f roun din g, sum s of individual item s m ay not equal to ta ls .
0)CO
Digitized for FRASER http://fraser.stlouisfed.org/ Federal Reserve Bank of St. Louis
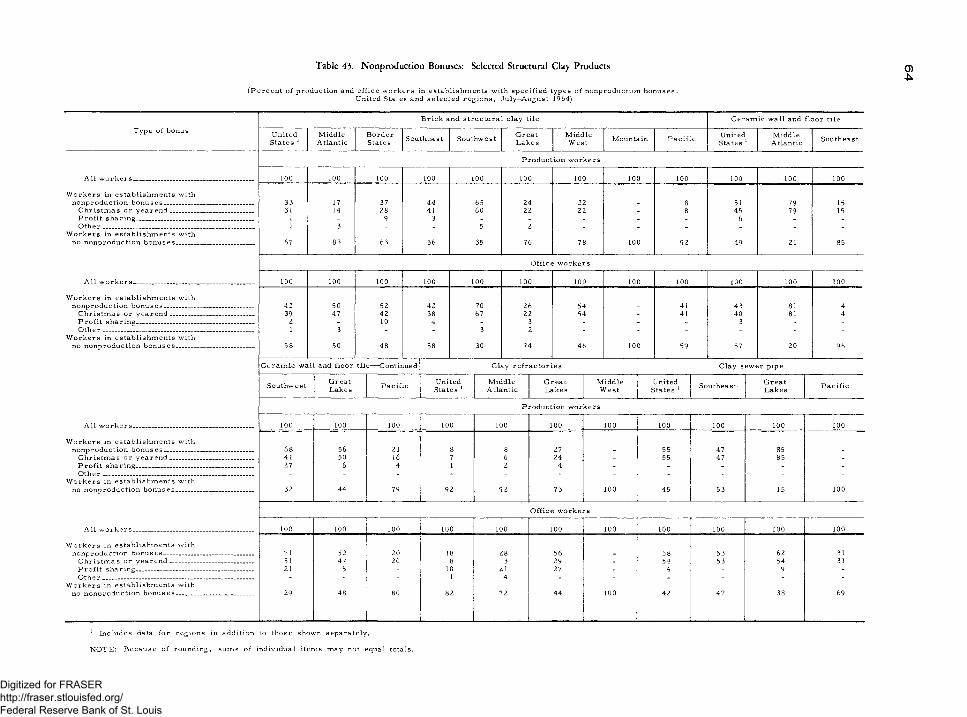
Table 43. Nonproduction Bonuses: Selected Structural Clay Products 0)*
(P e rc e n t o f p rod u ction and o ff ic e w o rk e rs in esta b lish m en ts w ith s p e c if ie d types o f n on p rodu ction b o n u se s , United States and se le c te d re g io n s , July—A ugust 1964)
T yp e o f bonusB r ick and stru ctu ra l c la y tile C e ra m ic w a ll and flo o r t ile
U nited S tates 1
M iddleA tlantic
B o rd e rStates S outheast Southw est G rea t
L ak esM idd leW est M ountain P a c if i c United
States 1M idd leA tlan tic Southeast
P ro d u ct io n w o rk e rs
A ll w o r k e r s ____________________________________ 100 100 100 100 100 100 100 100 100 100 100 100
W o rk e rs in esta b lish m e n ts w ithn on p rodu ction b o n u se s___________________________ 33 17 37 44 65 24 22 - 8 51 79 15
C h r is tm a s o r y e a r e n d _________________________ 31 14 28 41 60 22 22 - 8 45 79 15P r o f i t sh a rin g _ .. 1 - 9 3 - - - - - 6 _ _O th e r _____________________________________________ 1 3 _ _ 5 2 _ _ _ _ _ _
W o rk e rs in esta b lish m e n ts w ithno n o n p rod u ction b o n u s e s _______________________ 67 83 63 56 35 76 78 100 92 49 21 85
O ffice w o rk e rs
A l l w o r k e r s ____________________________________ 100 100 100 100 100 100 100 100 100 100 100 100
W o rk e rs in esta b lish m e n ts w ithn on p rod u ction b o n u se s___________________________ 42 50 52 42 70 26 54 _ 41 43 81 4
C h r is tm a s o r y e a r e n d _________________________ 39 47 42 38 67 22 54 - 41 40 81 4P r o f i t sh a rin g ___________________________________ 2 - 10 4 - 3 _ - _ 3 - -O th e r _____________________________________________ 1 3 - _ 3 2 - - - - - -
W o rk e rs in esta b lish m e n ts w ithno n o n p rod u ction b o n u se s_______________________ 58 50 48 58 30 74 46 100 59 57 20 96
C e r a m ic w a ll and f lo o r t ile — Continued C lay r e f r a c t o r ie s C lay s ew er p ipe
Southw est G reatLakes P a c if ic United
States 1M idd le
A tlan ticG rea tL akes
M idd leW est
United States 1 Southeast- G rea t
L akes P a c if ic
P ro d u ct io n w o rk e rs
A l l w o r k e r s ____________________________________ 100 100 100 100 100 100 100 100 100 100 100
W o rk e rs in esta b lish m e n ts w ithn on p rod u ction b o n u se s___________________________ 68 56 21 8 8 27 - 55 47 85 -
C h r is tm a s o r y e a r e n d .--------------------- -------------- 41 50 16 7 6 24 - 55 47 85 -P r o f i t sh a rin g — ........................................... ................ 27 6 4 1 2 4 - - - - -O t h e r ________________________ ____ ______ ____ _____ - - _ - - - - - - - -
W o rk e rs in esta b lish m e n ts w ithno n on p rod u ction b o n u se s_______________________ 32 44 79 92 92 73 100 45 53 15 100
O ffice W ork ers
A l l w o r k e r s ____________________________________ 100 100 100 100 100 100 100 100 100 100 100
W o rk e rs in e sta b lish m en ts w ithn on p rod u ction b o n u se s ----------------------------------------- 71 52 20 18 28 56 - 58 53 62 31
C h r is tm a s o r y e a r e n d ------------------ ------------------- 51 47 20 8 3 29 - 54 53 54 31P r o f i t sh a rin g ................................................................. 21 5 - 10 21 27 - 4 - 9 -O th e r ______________________________________ _____ — - - - 1 4 - - - - - -
W o rk e rs in esta b lish m e n ts w ithno n on p rod u ction b o n u se s ----------------------------------- 29 48 80 82 72 44 100 42 47 38 69
Includes data fo r re g io n s in add ition to th ose shown sep arate ly .
N O TE: B e ca u se o f rou n d in g , sum s o f in d iv idua l item s m ay not equal tota ls .
Digitized for FRASER http://fraser.stlouisfed.org/ Federal Reserve Bank of St. Louis
Appendix A. Scope and Method of Survey
Scope of Survey
The survey included establishm ents prim arily engaged in the manufacture of s tru ctural clay products (industry group 325 as defined in the 1957 edition of the Standard Industria l C lassification Manual and 1963 Supplement, prepared by the U.S. Bureau of the Budget). Important products of such establishm ents include: B rick and structural clay tile , ceram ic wall and floor tile , clay fireb rick , and other heat resisting clay products, and clay sew er pipe.
The establishm ents studied w ere selected from those employing 20 w orkers or m ore at the tim e of re feren ce of the data used in com piling the universe lis ts .
The number of establishm ents and w orkers actually studied by the Bureau, as well as the number estim ated to be within the scope of the survey during the payroll period studied, are shown in the table on the follow ing page.
Method of Study
Data w ere obtained by personal v isits of Bureau fie ld econom ists under the d irection of the Bureau's A ssistant Regional D irectors for Wages and Industrial Relations. The survey was conducted on a sample basis. To obtain appropriate accuracy at minimum cost, a greater proportion of large than of sm all establishm ents was studied. In com bining the data, however, all establishm ents w ere given their appropriate weight. A ll estim ates are presented, th ere fore , as relating to all establishm ents in the industry group, excluding only those below the minimum size at the tim e of referen ce of the universe data.
Establishm ent Definition
An establishm ent, fo r purposes of this study, is defined as a single physical location where industrial operations are perform ed. An establishm ent is not n ecessa rily identical with the company, which m ay consist of one or m ore establishm ents.
EmploymentThe estim ates of the number of w orkers within the scope of the study are intended
as a general guide to the size and com position of the labor fo rce included in the survey. The advance planning n ecessa ry to make a wage survey requ ires the use of lists of establishm ents assem bled considerably in advance of the payroll period studied.
Production W orkers
The term "production w orkers, " as used in this bulletin, includes working forem en and all nonsupervisory w orkers engaged in nonoffice functions. A dm inistrative, executive, professiona l and technical personnel, and force -a ccou n t construction em ployees, who were utilized as a separate w ork fo rce on the firm 's own p roperties , w ere excluded.
O ffice W orkers
The term "o ffice w o r k e r s ," as used in this bulletin, includes a ll nonsupervisory o ffice w orkers and excludes adm inistrative, executive, p rofessiona l, and technical em ployees.
Occupations Selected for Study
Occupational c la ss ifica tion was based on a uniform set of job descriptions designed to take account of interestablishm ent and interarea variations in duties within the same job. (See appendix B for these job descriptions.) The occupations w ere chosen fo r their num erical im portance, their usefulness in co llective bargaining, or their representativeness of the entire job scale in the industry. Working su perv isors, apprentices, learn ers, beginners, trainees, handicapped, p art-tim e, tem porary, and probationary w orkers w ere not reported in the data for selected occupations, but w ere included in the data fo r all production w orkers.
65
Digitized for FRASER http://fraser.stlouisfed.org/ Federal Reserve Bank of St. Louis
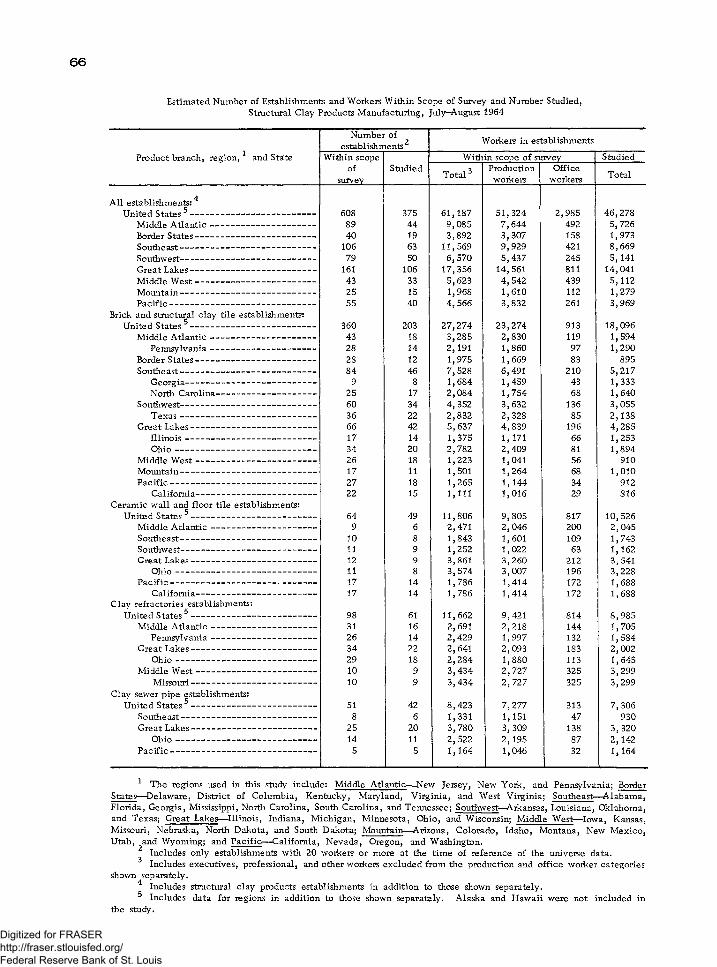
66
Estimated Number of Establishments and Workers Within Scope of Survey and Number Studied, Structural Clay Products Manufacturing, July-August 1964
Number of establishments 1 2 Workers in establishments
Product branch, region,1 and State Within scope Within scope of survey Studiedof
surveyStudied
Total3 4Production
woikersOffice
workers Total
4All establishments:
United States ®------------------------------------------------ 608 375 61,187 51,324 2,985 46,278Middle A tlantic---------------------------------------- 89 44 9,085 7,644 492 5,726Border States---------------------------------------------- 40 19 3,892 3,307 158 1,973Southeast---------------------------------------------------- 106 63 11,569 9,929 421 8,669Southwest---------------------------------------------------- 79 50 6,570 5,437 245 5,141Great Lakes------------------------------------------------ 161 106 17,356 14,561 811 14,041Middle W est---------------------------------------------- 43 33 5,623 4,542 439 5,112Mountain---------------------------------------------------- 25 15 1,968 1,610 112 1,279Pacific-------------------------------------------------------- 55 40 4,566 3,832 261 3,969
Brick and structural clay tile establishments:United States ®------------------------------------------------ 360 203 27,274 23,274 913 18,096
Middle Atlantic---------------------------------------- 43 18 3,285 2,830 119 1,594Pennsylvania---------------------------------------- 28 14 2,191 1,860 97 1,290
Border States---------------------------------------------- 28 12 1,975 1,669 83 895Southeast---------------------------------------------------- 84 46 7,528 6,491 210 5,217
Georgia-------------------------------------------------- 9 8 1,684 1,459 43 1,333North Carolina-------------------------------------- 25 17 2 ,084 1,754 68 1,640
Southwest---------------------------------------------------- 60 34 4,352 3,632 136 3,055Texas---------------------------------------------------- 36 22 2,832 2,328 85 2,138
Great Lakes------------------------------------------------ 66 42 5,637 4,839 196 4,285Illinois-------------------------------------------------- 17 14 1,375 1,171 66 1,253O hio------------------------------------------------------ 34 20 2,782 2,409 81 1,894
Middle W est---------------------------------------------- 26 18 1,223 1,041 56 910Mountain---------------------------------------------------- 17 11 1,501 1,264 68 1,010Pacific-------------------------------------------------------- 27 18 1,265 1,144 34 912
California---------------------------------------------- 22 15 1,111 1,016 29 816Ceramic wall and floor tile establishments:
United States ®------------------------------------------------ 64 49 11,806 9,805 817 10,526Middle Atlantic---------------------------------------- 9 6 2,471 2,046 200 2,045Southeast---------------------------------------------------- 10 8 1,843 1,601 109 1,743Southwest---------------------------------------------------- 11 9 1,252 1,022 63 1,162Great Lakes------------------------------------------------ 12 9 3,861 3,260 212 3,541
O hio------------------------------------------------------ 11 8 3,574 3,007 196 3,228Pacific-------------------------------------------------------- 17 14 1,786 1,414 172 1,688
California---------------------------------------------- 17 14 1,786 1,414 172 1,688Clay refractories establishments:
United States 5 ------------------------------------------------ 98 61 11,662 9,421 814 8,985Middle Atlantic---------------------------------------- 31 16 2,691 2,218 144 1,705
Pennsylvania---------------------------------------- 26 14 2,429 1,997 132 1,584Great Lakes------------------------------------------------ 34 22 2,641 2,093 183 2,002
O hio------------------------------------------------------ 29 18 2,284 1,880 113 1,645Middle W est---------------------------------------------- 10 9 3,434 2,727 325 3,299
Missouri------------------------------------------------ 10 9 3,434 2,727 325 3,299Clay sewer pipe establishments:
United States ®------------------------------------------------ 51 42 8,423 7,277 313 7,306Southeast---------------------------------------------------- 8 6 1,331 1,151 47 930Great Lakes------------------------------------------------ 25 20 3,780 3,309 138 3,320
O hio------------------------------------------------------ 14 11 2,522 2,195 87 2,142Pacific-------------------------------------------------------- 5 5 1,164 1,046 32
.1,164
1 The regions used in this study include: Middle Atlantic— New Jersey, New York, and Pennsylvania; Border States— Delaware, District of Columbia, Kentucky, Maryland, Virginia, and West Virginia; Southeast—Alabama, Florida, Georgia, Mississippi, North Carolina, South Carolina, and Tennessee; Southwest—Arkansas, Louisiana, Oklahoma, and Texas; Great Lakes— Illinois, Indiana, Michigan, Minnesota, Ohio, and Wisconsin; Middle West— Iowa, Kansas, Missouri, Nebraska, North Dakota, and South Dakota; Mountain— Arizona, Colorado, Idaho, Montana, New Mexico, Utah, and Wyoming; and Pacific— California, Nevada, Oregon, and Washington.
Includes only establishments with 20 workers or more at the time of reference of the universe data.Includes executives, professional, and other workers excluded from the production and office worker categories
shown separately.4 Includes structural clay products establishments in addition to those shown separately.5 Includes data for regions in addition to those shown separately. Alaska and Hawaii were not included in
the study.
Digitized for FRASER http://fraser.stlouisfed.org/ Federal Reserve Bank of St. Louis

67
Wage Data
The wage information relates to average straight-time hourly earnings, excluding premium pay for overtime and for work on weekends, holidays, and late shifts. Incentive payments, such as those resulting from piecework or production bonus systems, and cost-of- living bonuses were included as part of the workers' regular pay; but nonproduction bonus payments, such as Christmas or yearend bonuses, were excluded.
Average hourly rates or earnings for each occupation or other group of workers, such as men, women, or production workers, were calculated by weighting each rate (or hourly earnings) by the number of workers receiving the rate, totaling, and dividing by the number of individuals. The hourly earnings of salaried workers were obtained by dividing straight-time salary by normal rather than actual hours.
Size of Community
Tabulations by size of community pertain to metropolitan and nonmetropolitan areas. The term "metropolitan area, " as used in this bulletin, refers to the Standard Metropolitan Statistical Areas as defined by the U.S. Bureau of the Budget in 1961.
Except in New England, a Standard Metropolitan Statistical Area is defined as a county or group of contiguous counties which contains at least one city of 50, 000 inhabitants or more. Contiguous counties to the one containing such a city are included in a Standard Metropolitan Statistical Area, if, according to certain criteria, they are essentially metropolitan in character and are socially and economically integrated with the central city. In New England, where the city and town are administratively more important than the county, they are the units used in defining Standard Metropolitan Statistical Areas.
Labor-Management Agreements
Separate wage data are presented, where possible, for establishments with (1) a majority of the production workers covered by labor-management contracts, and (2) none or a minority of the production workers covered by labor-management contracts.
Method of Wage Payment
Tabulations by method of wage payment relate to the number of workers paid under the various time and incentive wage systems. Formal rate structures for time-rated workers provide single rates or a range of rates for individual job categories. In the absence of a formal rate structure, pay rates are determined primarily with reference to the qualifications of the individual worker. A single rate structure is one in which the same rate is paid to all experienced workers in the same job classification. Learners, apprentices, or probationary workers may be paid according to rate schedules which start below the single rate and permit the workers to achieve the full job rate over a period of time. Individual experienced workers may occasionally be paid above or below the single rate for special reasons, but such payments are regarded as exceptions. Range-of-rates plans are those in which the minimum and/or maximum rates paid experienced workers for the same job are specified. Specific rates of individual workers within the range may be determined by merit, length of service, or a combination of various concepts of merit and length of service. Incentive workers are classified under piecework or bonus plans. Piecework is work for which a predetermined rate is paid for each unit of output. Production bonuses are based on production in excess of a quota or for completion of a job in less than standard time.
Stint workers are classified separately. Stint work, also called "task work" is a method of wage payment akin to a wage incentive. It provides a fixed daily rate for a predetermined amount of work regardless of the actual time required and the worker is at liberty to leave the plant whenever the task is completed.
Scheduled Weekly Hours
Data on weekly hours refer to the predominant work schedule for full-time production workers (or office workers) employed on the day shift.
Digitized for FRASER http://fraser.stlouisfed.org/ Federal Reserve Bank of St. Louis

68
Shift Provisions and PracticesShift provisions relate to the policies of establishments either currently operating
late shifts or having formal provisions covering late-shift work. Practices relate to workers employed on late shifts at the time of the survey.
Supplementary Wage ProvisionsSupplementary benefits were treated statistically on the basis that if formal provisions
were applicable to half or more of the production (or office) workers in an establishment, the benefits were considered applicable to all such workers. Similarly, if fewer than half of the workers were covered, the benefit was considered nonexistent in the establishment. Because of length-of-service and other eligibility requirements, the proportion of workers receiving the benefits may be smaller than estimated.
Paid Holidays. Paid-holiday provisions relate to full-day and half-day holidays provided annually.
Paid Vacations. The summaries of vacation plans are limited to formal arrangements, excluding informal plans whereby time off with pay is granted at the discretion of the employer or the supervisor. Payments not on a time basis were converted; for example, a payment of 2 percent of annual earnings was considered the equivalent of 1 week's pay. The periods of service for which data are presented were selected as representative of the most common practices, but they do not necessarily reflect individual establishment provisions for progression. For example, the changes in proportions indicated at 10 years of service may include changes which occurred between 5 and 10 years.
Health, Insurance, and Pension Plans. Data are presented for health, insurance, and pension plans for which all or a part of the cost is borne by the employer, excluding programs required by law, such as workmen's compensation and social security. Among the plans included are those underwritten by a commercial insurance company and those paid directly by the employer from his current operating funds or from a fund set aside for this purpose.
Death benefits are included as a form of life insurance. Sickness and accident insurance is limited to that type of insurance under which predetermined cash payments are made directly to the insured on a weekly or monthly basis during illness or accident disability. Information is presented for all such plans to which the employer contributes at least a part of the cost. However, in New York and New Jersey, where temporary disability insurance laws require employer contributions, 8 plans are included only if the employer (1) contributes more than is legally required or (2) provides the employees with benefits which exceed the requirements of the law.
Tabulations of paid sick leave plans are limited to formal plans which provide full pay or a proportion of the worker's pay during absence from work because of illness; informal arrangements have been omitted. Separate tabulations are provided according to (1) plans which provide full pay and no waiting period, and (2) plans providing either partial pay or a waiting period.
Medical insurance refers to plans providing for complete or partial payment of doctors' fees. Such plans may be underwritten by a commercial insurance company or a nonprofit organization, or they may be self-insured.
Catastrophe insurance, sometimes referred to as extended medical insurance, includes the plans designed to cover employees in case of sickness or injury involving an expense which goes beyond the normal coverage of hospitalization, medical, and surgical plans.
Tabulations of retirement pensions are limited to plans which provide, upon retirement, regular payments for the remainder of the worker's life.
Nonproduction Bonuses. Nonproduction bonuses are defined for this study as bonuses that depend on factors other than the output of the individual worker or group of workers. Plans that defer payments beyond 1 year were excluded.
The temporary disability insurance laws in California and Rhode Island do not require employer contributions.
Digitized for FRASER http://fraser.stlouisfed.org/ Federal Reserve Bank of St. Louis

Appendix B. Occupational Descriptions
The primary purpose of preparing job descriptions for the Bureau's wage surveys is to assist its field staff in classifying into appropriate occupations workers who are employed under a variety of payroll titles and different work arrangements from establishment to establishment and from area to area. This permits the grouping of occupational wage rates representing comparable job content. Because of this emphasis on interestablishment and inter - area comparability of occupational content, the Bureau's job descriptions may differ significantly from those in use in individual establishments or those prepared for other purposes. In applying these job descriptions, the Bureau's field economists are instructed to exclude working supervisors, apprentices, learners, beginners, trainees, handicapped, part-time, temporary, and probationary workers.
CLAY MAKER
(Blunger-machine operator; clay mixer; clay washer; slip maker; slip mixer; slipman; wet mixer)
Blends and mixes various clays into a thin, semiliquid form in a blunger (mixing machine). Work involves the following: Starting and operating the blunger, blending andmixing the various clays with water for the required time; running and regulating flow of slip from mixer through lawn (very fine screen made of silk or metal), and over magnets which remove iron particles from the slip; and cleaning lawn and washing magnets. Additional duties may include removing excess water from slip by filter press; and measuring clay and other ingredients according to formula.
DIE PRESSER
Operates a screw press or hydraulic press to squeeze and shape clay into various clay products. Work involves: Filling bottom die with ground or pulverized damp clay;forming ware by operating a press which causes the upper die to descend into the lower die thus squeezing the clay into the proper shape; and removing the formed ware. In addition, may set the dies in the press.
DRY-PAN OPERATOR
(Dry-mill operator)
Tends or directs the loading of one or more dry pans which grinds clay, shale or brick to a fine powder preparatory to screening and tempering. Work involves most of the following: Loading or directing the loading of clay into the hoppers of dry pans; regulatingflow of clay or shale into dry pans; breaking up or removing large lumps of material and loosening clogged material in machine; and lubricating and making minor repairs or adjustments to the machine.
ELECTRICIAN, MAINTENANCE
Performs a variety of electrical trade functions such as the installation, maintenance, or repair of equipment for the generation, distribution, or utilization of electric energy in an establishment. Work involves most of the following: Installing or repairing any of a varietyof electrical equipment such as generators, transformers, switchboards, controllers, circuit breakers, motors, heating units, conduit systems, or other transmission equipment; working from blueprints, drawings, layouts, or other specifications; locating and diagnosing trouble in the electrical system or equipment; working standard computations relating to load
69
Digitized for FRASER http://fraser.stlouisfed.org/ Federal Reserve Bank of St. Louis
70
ELECTRICIAN, MAINTENANCE— Continued
requirements of wiring or electrical equipment; using a variety of electrician's handtools and measuring and testing instruments. In general, the work of the maintenance electrician requires rounded training and experience usually acquired through a formal apprenticeship or equivalent training and experience.
FINISHER
(Fettler; shaper: sponger; trimmer)Removes rough edges from greenware. Work involves: Scraping dirt, mold marks,
rough edges, and other irregularities from ware with fettling knife, stick felt, or emery. In addition, may rub dampened sponge over ware to give it a smooth surface.
GLAZING-MACHINE FEEDER
Feeds structural clay products into a machine that sprays an even coat of glaze on the material as it passes through.
GRINDER, CLAY
(Crusher; crusherman; crusher operator; granulator; pulverizer; rock grinder; shale grinder)
Tends and directs the loading of one or more crushing or grinding machines (other than dry or wet pans) which grind pieces of rock, clay, or shale into fine particles or dust. Work involves most of the following: Loading and/or directing the loading of the feedinghopper; watching the material being fed to the machine by a conveyor or by a helper; breaking up large pieces of raw materials and loosening clogged material in machine with a slice-bar or maul; regulating the water valve which drips water into the machine to settle the dust; and lubricating and making minor repairs and adjustments to the machine.
HELPER, MAINTENANCE TRADES
Assists one or more workers in the skilled maintenance trades, by performing specific or general duties of lesser skill, such as keeping a worker supplied with materials and tools; cleaning working area, machine, and equipment; assisting worker by holding m aterials or tools; and performing other unskilled tasks as directed by journeyman. The kind of work the helper is permitted to perform varies from trade to trade: In some trades the helper is confined to supplying, lifting, and holding materials and tools and cleaning working areas; and in others he is permitted to perform specialized machine operations, or parts of a trade that are also performed by workers on a full-time basis.
JANITOR
(Sweeper; charwoman; janitress)Cleans and keeps in an orderly condition factory working areas and washrooms, or
premises of an office, apartment house, or commercial or other establishment. Duties involve a combination of the following: Sweeping, mopping or scrubbing, and polishing floors; removing chips, trash, and other refuse; dusting equipment, furniture, or fixtures; polishing metal fixtures or trimmings; providing supplies and minor maintenance services; and cleaning lavatories, showers, and restrooms. Workers who specialize in window washing are excluded.
KILN DRAWER (Periodic Kiln)
(Bisque-kiln drawer; bisque-kiln remover; glost-kiln drawer; glost-kiln remover; round- kiln drawer)
Removes ware and saggers from kiln after ware has been fired. Work involves most of the following: Tearing down door bung and handing top saggers to doorman; removingsaggers and ware from kiln; unloading ware from saggers and placing it on trucks or in baskets for removal to other departments; scraping wads from saggers with a trowel; and stacking saggers for future use. In addition, may shovel and sweep all broken materials from kiln, and may use handtruck to remove broken saggers.
Digitized for FRASER http://fraser.stlouisfed.org/ Federal Reserve Bank of St. Louis
71
KILN FIREMAN (Periodic Kiln)
(Kiln burner; kiln operator; kiln tender)
Operates a periodic kiln used to fire brick, tile, or other clay products. Work involves the following: Prepares (or directs helper) firebox and lights fires; regulates tem perature by adjusting drafts and controlling fuel supply; and observes pyrometric cones and/or rings through peepholes to determine by inspection the rate at which burning is proceeding.
KILN FIREMAN (Scove Kiln)
(Fireman; burner)
Supervises the firing of a scove kiln used to fire common brick. Instructs helpers or other workers in kindling and maintaining fires.
KILN FIREMAN (Tunnel Kiln)
(Fireman, continuous kiln; tunnel kiln fireman)
Operates a tunnel or continuous kiln to fire ware. Work involves maintaining the proper temperature in the kiln at all times by controlling fuel intake and checking drafts and recording temperatures periodically. In addition, may push the tunnel kiln car into the intake chamber of the kiln and remove it from the other end after the ware has been fired and cooled.
KILN LOADER (Scove Kiln)
(Kiln setter; kiln placer)
Places dried bricks into position for firing in a scove kiln. Uses power equipment (usually a crane or lift truck) to stack unburned brick into a proper pile which assumes the shape of a kiln.
KILN PLACER (Tunnel Kiln)
(Tunnel-kiln-car setter)
Loads ware or saggers filled with ware (green or glazed bisque) on automatic conveyor car that carries ware through kiln for firing. Work involves setting ware and saggers in proper section of car according to the firing requirements of each type of ware.
KILN SETTER (Periodic Kiln)
(Kiln loader; kiln stacker; pipe setter)
Stacks brick or tile products in the kiln for burning. Work involves the following: Piling the material in rows and tiers, spacing and arranging it so that hot air will circulate freely during burning; and spreading sand on the floor and between the layers to prevent products adhering to one another.
KILN UNLOADER {Tunnel Kiln)
(Kiln-car unloader; tunnel-kiln drawer)
Unloads ware, or saggers filled with fired ware, from tunnel-kiln cars. Work involves: Removing ware from cars or saggers and placing it on trucks or in baskets fortransfer to other departments.
Digitized for FRASER http://fraser.stlouisfed.org/ Federal Reserve Bank of St. Louis

72
MACHINIST, MAINTENANCE
Produces replacement parts and new parts in making repairs of metal parts of mechanical equipment operated in an establishment. Work involves most of the following: Interpreting written instructions and specifications; planning and laying out of work; using a variety of machinist's handtools and precision measuring instruments; settingup and operating standard machine tools; shaping of metal parts to close tolerances; making standard shop computations relating to dimensions of work, tooling, feeds, and speeds of machining; knowledge of the working properties of the common metals; selecting standard materials, parts, and equipment required for his work; and fitting and assembling parts into mechanical equipment. In general, the machinist's work normally requires a rounded training in machine-shop practice, usually acquired through a form al apprenticeship or equivalent training and experience.
MAINTENANCE MAN, GENERAL UTILITY
Keeps the machines, mechanical equipment and/or structure of an establishment (usually a small plant where specialization in maintenance work is impractical) in repair. Duties involve the performance of operations and the use of tools and equipment of several trades, rather than specialization in one trade or one type of maintenance work only. Work involves a combination of the following: Planning and laying out of work relating to repairof buildings, machines, mechanical and/or electrical equipment; repairing electrical and/or mechanical equipment; installing, alining, and balancing new equipment; and repairing buildings, floors, and stairs, as well as making and repairing bins, cribs, and partitions.
MECHANIC, AUTOMOTIVE (MAINTENANCE)
Repairs automobiles, buses, motortrucks, and tractors of an establishment. Work involves most of the following: Examining automotive equipment to diagnose source of trouble; disassembling equipment and performing repairs that involve the use of such handtools as wrenches, gages, drills, or specialized equipment in disassembling or fitting parts; replacing broken or defective parts from stock; grinding and adjusting valves; reassembling and installing the various assemblies in the vehicle and making necessary adjustments; and alining wheels, adjusting brakes and lights, or tightening body bolts. In general, the work of the automotive mechanic requires rounded training and experience usually acquired through a form al apprenticeship or equivalent training and experience.
MECHANIC, MAINTENANCE
Repairs machinery or mechanical equipment of an establishment. Work involves most of the following: Examining machines and mechanical equipment to diagnose source oftrouble; dismantling or partly dismantling machines and performing repairs that mainly involve the use of handtools in scraping and fitting parts; replacing broken or defective parts with items obtained from stock; ordering the production of a replacement part by a machine shop or sending of the machine to a machine shop for m ajor repairs; preparing written specifications for m ajor repairs or for the production of parts ordered from machine shop; reassembling machines; and making all necessary adjustments for operation. In general, the work of a maintenance mechanic requires rounded training and experience usually acquired through a formal apprenticeship or equivalent training and experience. Excluded from this classification are workers whose primary duties involve setting up or adjusting machines.
MOLDER, HAND
(Brick m older, hand; tile m older, hand; pipe-fittings molder)
Molds brick, tile, or other clay products by hand. Work involves the following: Kneading moist clay until it is of the desired consistency and placing or throwing it forcibly into the mold; packing clay firm ly in the mold by hand or with a mallet, or by means of a jogger operated by com pressed air; and cutting off or removing excess clay projecting from the mold. In addition, may remove the form from the mold after it has been allowed to dry and shrink slightly.
Digitized for FRASER http://fraser.stlouisfed.org/ Federal Reserve Bank of St. Louis
73
MOLDING-MACHINE OPERATOR
(Brick molder, machine; brickmaker, machine; molder, machine; tilemaker, machine; tile molder, machine)
Tends a machine that automatically molds brick, tile, or other clay products. Work involves seeing that the machine is operating properly and that proper pressure is being applied to the ware. In addition, may place molded ware on trays or on conveyors and may lubricate, adjust, or make minor repairs to the machine.
OFF-BEARER
(Hacker; racker; stacker)
Bears off, carries, or removes the unfinished or finished brick, tile, or other clay products from a machine conveyor or handtruck and piles or sets products on conveyor, floor, drying rack, or handcar. In addition, may remove formed ware from molds.
PACKER
Prepares finished products for shipment or storage by placing them in shipping containers, the specific operations performed being dependent upon the type, size, and number of units to be packed, the type of container employed, and method of shipment. Work requires the placing of items in shipping containers and may involve one or more of thefollowing: Knowledge of various items of stock in order to verify content; selection of appropriate type and size of container; inserting enclosures in container; using excelsior or other material to prevent breakage or damage; closing and sealing container; and applying labelsor entering identifying data on container. Packers who also make wooden boxes or cratesare excluded.
PATTERN MOUNTER (Floor and Wall Tile)
Assembles ceramic tiles in pattern and mounts them on heavy paper to preserve the arrangement for installation. Work involves: Placing tiles on board, face down, following a previously designed pattern; gluing sheet of mounting paper to base of tiles; and removing completed assembly and placing it in position for drying.
PIPE TURNER (Sewer Pipe)
Removes sections of green (newly formed) sewer pipe from the pipe press, turns them socket end up, and places them on trucks.
POWER-SHOVEL OPERATOR
(Dragline operator; shovel operator; shovel runner)
Excavates or moves materials with a power shovel or crane equipped with a dragline bucket. Manipulates levers and pedals to move the machine and control the position of the bucket or dipper in order to move and deposit materials.
PRESSMAN, AUTOMATIC
(Press operator; pressman)
Operates an automatic powered press to form tempered clay into sewer pipe, tile, or other clay products. Work involves the following: Manipulating a lever which causes themachine to press out form automatically, after the feed hopper has been charged (usually by conveyor) with tempered clay; and operating or directing another worker to operate a lever to actuate mechanism for cutting pipe into sections. In addition, may change press dies with the assistance of other workers.
Digitized for FRASER http://fraser.stlouisfed.org/ Federal Reserve Bank of St. Louis

74
PUGMILL MAN
(Clay pugger; mixing mill operator; pugmill operator; pugmiller; pugger)
Prepares ground, sifted, or filtered clay for molding by mixing it with water in a pugmill. Work involves most of the following: Feeding clay to the machine; regulating theflow of water to mixing chamber; and examining mixed clay for consistency as it is forced out of the pugmill in a continuous form. In addition, may make minor repairs to the machine; operate an auger mill or cutting machine in connection with the pugmill; and may cut the continuous form into convenient lengths, stacking cut lengths end up on a truck.
SORTER
(Brick sorter; tile sorter; shader)
Sorts burned brick or tile according to color, hardness, or size. For wage study purposes, sorters are classified according to product:
Sorter, brick Sorter, tile
TRUCKDRIVER
Drives a truck within a city or industrial area to transport materials, merchandise, equipment, or men between various types of establishments such as: Manufacturing plants,freight depots, warehouses, wholesale and retail establishments, or between retail establishments and customers' houses or places of business. May also load or unload truck with or without helpers, make minor mechanical repairs, and keep truck in good working order.
For wage study purposes, truckdrivers are classified by size and type of equipment, as follows: (Tractor-trailer should be rated on the basis of trailer capacity.)
Truckdriver (combination of sizes listed separately)Truckdriver, light (under 1 V2 tons)Truckdriver, medium ( 1 V2 to and including 4 tons)Truckdriver, heavy (over 4 tons, trailer type)Truckdriver, heavy (over 4 tons, other than trailer type)
TRUCKER, HAND
(Transfer man)
Pushes or pulls handtrucks, cars, or wheelbarrows used for transporting goods and materials of all kinds about a warehouse, manufacturing plant, or other establishment. May load or unload, stack materials in storage, and maintain records.
TRUCKER, POWER
(Transfer man, power)
Operates a manually controlled gasoline- or electric-powered truck or tractor to transport goods and materials of all kinds about a warehouse, manufacturing plant, or other establishment.
For wage study purposes, workers are classified by type of truck, as follows:
Trucker, power (forklift)Trucker, power (other than forklift)
Digitized for FRASER http://fraser.stlouisfed.org/ Federal Reserve Bank of St. Louis
Industry Wage Studies
The most recent reports for industries included in the Bureau's program of industry wage surveys since January 1950 are listed below. Those for which a price is shown are available from the Superintendent of Documents, U.S. Government Printing Office, Washington, D.C., 20402, or any of its regional sales offices. Those for which a price is not shown may be obtained free as long as a supply is available, from the Bureau of Labor Statistics, Washington, D.C., 20212, or from any of the regional offices shown on the inside back cover.
I. Occupational Wage Studies
Manufacturing
Basic Iron and Steel, 1962. BLS Bulletin 1358 (30 cents).Candy and Other Confectionery Products, I960. BLS Report 195.
^Canning and Freezing, 1957. BLS Report 136.Cigar Manufacturing, 1964. BLS Bulletin 1436 (30 cents).Cigarette Manufacturing, I960. BLS Report 167.Cotton Textiles, 1963. BLS Bulletin 1410 (40 cents).Distilled Liquors, 1952. Series 2, No. 88.
Fabricated Structural Steel, 1957. BLS Report 123.Fertilizer Manufacturing, 1962. BLS Bulletin 1362 (40 cents).Flour and Other Grain Mill Products, 1961. BLS Bulletin 1337 (30 cents).Fluid Milk Industry, I960. BLS Report 174.Footwear, 1962. BLS Bulletin 1360 (45 cents).Hosiery, 1962. BLS Bulletin 1349 (45 cents).
Industrial Chemicals, 1955. BLS Report 103.Iron and Steel Foundries, 1962. BLS Bulletin 1386 (40 cents).Leather Tanning and Finishing, 1963. BLS Bulletin 1378 (40 cents).Machinery Manufacturing, 1964. BLS Bulletin 1429 (35 cents).Meat Products, 1963. BLS Bulletin 1415 (75 cents).Men's and Boys' Shirts (Except Work Shirts) and Nightwear, 1964,
BLS Bulletin 1457 (40 cents).Men's and Boys' Suits and Coats, 1963. BLS Bulletin 1424 (65 cents). Miscellaneous Plastics Products, 1964. BLS Bulletin 1439 (35 cents). Miscellaneous Textiles, 1953. BLS Report 56.Motor Vehicles and Motor Vehicle Parts, 1963. BLS Bulletin 1393 (45 cents).Nonferrous Foundries, I960. BLS Report 180.Paints and Varnishes, 1961. BLS Bulletin 1318 (30 cents).Petroleum Refining, 1959. BLS Report 158.Pressed or Blown Glass and Glassware, 1964. BLS Bulletin 1423 (30 cents).
^Processed Waste, 1957. BLS Report 124.Pulp, Paper, and Paperboard M ills, 1962. BLS Bulletin 1341 (40 cents).Radio, Television, and Related Products, 1951. Series 2, No. 84.Railroad Cars, 1952. Series 2, No. 86.
*Raw Sugar, 1957. BLS Report 136.Southern Sawmills and Planing M ills, 1962. BLS Bulletin 1361 (30 cents). Structural Clay Products, I960. BLS Report 172.Synthetic Fibers, 1958. BLS Report 143.Synthetic Textiles, 1963. BLS Bulletin 1414 (35 cents).Textile Dyeing and Finishing, 1961. BLS Bulletin 1311 (35 cents).
^Tobacco Stemming and Redrying, 1957. BLS Report 136. *
* Studies of the effects of the $1 minimum wage.
Digitized for FRASER http://fraser.stlouisfed.org/ Federal Reserve Bank of St. Louis
I. Occupational Wage Studies— Continued
Manufacturing— C ontinue d
West Coast Sawmilling, 1959. BLS Report 156.Women's and M isses' Coats and Suits, 1962. BLS Bulletin 1371 (25 cents). Women's and M isses' Dresses, 1963. BLS Bulletin 1391 (30 cents).Wood Household Furniture, Except Upholstered, 1962. BLS Bulletin 1369
(40 cents).*Wooden Containers, 1957. BLS Report 126.
Wool Textiles, 1962. BLS Bulletin 1372 (45 cents).Work Clothing, 1964. BLS Bulletin 1440 (35 cents).
N onmanuf actur ing
Auto Dealer Repair Shops, 1964. BLS Bulletin 1452 (30 cents).Banking Industry, I960. BLS Report 179.Bituminous Coal Mining, 1962. BLS Bulletin 1383 (45 cents).Communications, 1963. BLS Bulletin 1426 (20 cents).Contract Cleaning Services, 1961. BLS Bulletin 1327 (25 cents).Crude Petroleum and Natural Gas Production, I960. BLS Report 181. Department and Women's Ready-to-Wear Stores, 1950. Series 2, No. 78. Eating and Drinking Places, 1963. BLS Bulletin 1400 (40 cents).Electric and Gas Utilities, 1962. BLS Bulletin 1374 (50 cents).Hospitals, 1963. BLS Bulletin 1409 (50 cents).Hotels and Motels, 1963. BLS Bulletin 1406 (40 cents).Laundries and Cleaning Services, 1963. BLS Bulletin 1401 (50 cents).Life Insurance, 1961. BLS Bulletin 1324 (30 cents).
II. Other Industry Wage Studies
Factory Workers' Earnings— Distribution by Straight-Time Hourly Earnings, 1958. BLS Bulletin 1252 (40 cents).
Factory Workers' Earnings— Selected Manufacturing Industries, 1959.BLS Bulletin 1275 (35 cents).
Retail Trade:Employee Earnings in Retail Trade, June 1962 (Overall Summary of the
Industry). BLS Bulletin 1380 (45 cents).Employee Earnings at Retail Building Materials, Hardware, and Farm
Equipment Dealers, June 1962. BLS Bulletin 1380-1 (25 cents).Employee Earnings in Retail General Merchandise Stores, June 1962.
BLS Bulletin 1380-2 (45 cents).Employee Earnings in Retail Food Stores, June 1962. BLS Bulletin 1380-3
(40 cents).Employee Earnings at Retail Automotive Dealers and in Gasoline Service
Stations, June 1962. BLS Bulletin 1380-4 (40 cents).Employee Earnings in Retail Apparel and Accessory Stores, June 1962.
BLS Bulletin 1380-5 (45 cents).Employee Earnings in Retail Furniture, Home Furnishings, and Household
Appliance Stores, June 1962. BLS Bulletin 1380-6 (40 cents).Employee Earnings in Miscellaneous Retail Stores, June 1962.
BLS Bulletin 1380-7 (40 cents).
Employee Earnings in Nonmetropolitan Areas of the South and North Central Regions, June 1962. BLS Bulletin 1416 (40 cents).
* Studies of the effects of the $1 minimum wage. ☆ U. S. GOVERNMENT PRINTING O FF IC E : 1965 O - 788-446
Digitized for FRASER http://fraser.stlouisfed.org/ Federal Reserve Bank of St. Louis

BUREAU OF LABOR STATISTICS REGIONAL OFFICES
Digitized for FRASER http://fraser.stlouisfed.org/ Federal Reserve Bank of St. Louis