bmc bioinformatics biomed central -...
TRANSCRIPT
BioMed CentralBMC Bioinformatics
ss
Open AcceSoftwareXRate: a fast prototyping, training and annotation tool for phylo-grammarsPeter S Klosterman1, Andrew V Uzilov1, Yuri R Bendaña1, Robert K Bradley1, Sharon Chao1, Carolin Kosiol2,3, Nick Goldman2 and Ian Holmes*1Address: 1Department of Bioengineering, University of California, Berkeley CA, USA, 2European Bioinformatics Institute, Hinxton, Cambridgeshire, UK and 3Department of Biological Statistics and Computational Biology, Cornell University, Ithaca NY, USA
Email: Peter S Klosterman - [email protected]; Andrew V Uzilov - [email protected]; Yuri R Bendaña - [email protected]; Robert K Bradley - [email protected]; Sharon Chao - [email protected]; Carolin Kosiol - [email protected]; Nick Goldman - [email protected]; Ian Holmes* - [email protected]
* Corresponding author
AbstractBackground: Recent years have seen the emergence of genome annotation methods based onthe phylo-grammar, a probabilistic model combining continuous-time Markov chains and stochasticgrammars. Previously, phylo-grammars have required considerable effort to implement, limitingtheir adoption by computational biologists.
Results: We have developed an open source software tool, xrate, for working with reversible,irreversible or parametric substitution models combined with stochastic context-free grammars.xrate efficiently estimates maximum-likelihood parameters and phylogenetic trees using a novel"phylo-EM" algorithm that we describe. The grammar is specified in an external configuration file,allowing users to design new grammars, estimate rate parameters from training data and annotatemultiple sequence alignments without the need to recompile code from source. We have usedxrate to measure codon substitution rates and predict protein and RNA secondary structures.
Conclusion: Our results demonstrate that xrate estimates biologically meaningful rates and makespredictions whose accuracy is comparable to that of more specialized tools.
BackgroundHidden Markov models [HMMs], together with relatedprobabilistic models such as stochastic context-free gram-mars [SCFGs], are the basis of many algorithms for theanalysis of biological sequences [11,8,10,16]. An appeal-ing feature of such models is that once the general struc-ture of the model is specified, the parameters of the modelcan be estimated from representative "training data" withminimal user intervention (typically using the Expecta-tion Maximization [EM] algorithm [14]). Combined withthe continuous-time Markov chain theory of likelihood-
based phylogeny, stochastic grammar approaches arefinding similarly broad application in comparativesequence analysis, in particular the annotation of multi-ple alignments [83,26,53,46,74,80] (and, in some cases,simultaneous alignment and annotation [2,58]). Thiscombined model has been dubbed the phylo-grammar. Bycontrast to the single-sequence case (for which there ismuch prior art in the field of computational linguistics[72,51]), the automated parameterization of phylo-gram-mars from training data is somewhat uncharted territory,partly because the application of the EM algorithm to phy-
Published: 03 October 2006
BMC Bioinformatics 2006, 7:428 doi:10.1186/1471-2105-7-428
Received: 24 February 2006Accepted: 03 October 2006
This article is available from: http://www.biomedcentral.com/1471-2105/7/428
© 2006 Klosterman et al; licensee BioMed Central Ltd. This is an Open Access article distributed under the terms of the Creative Commons Attribution License (http://creativecommons.org/licenses/by/2.0), which permits unrestricted use, distribution, and reproduction in any medium, provided the original work is properly cited.
Page 1 of 25(page number not for citation purposes)

BMC Bioinformatics 2006, 7:428 http://www.biomedcentral.com/1471-2105/7/428
logenetics is a recent addition to the theoretical toolbox.The phylo-grammar approaches that have been used todate have often used approximate and/or inefficient ver-sions of EM to estimate parameters [59,81], or have beenlimited to particular subclasses of model, e.g. reversible orotherwise constrained models [9,38].
Previously, we showed how to apply the EM algorithm toestimate substitution rates in a phylogenetic reversiblecontinuous-time Markov chain model [38]. This EM algo-rithm is exact and without approximation, using an eigen-vector decomposition of the rate matrix to estimatesummary statistics for the evolutionary history. We referto this version of EM as "phylo-EM".
Here, we report several extensions to the phylo-EMmethod. Specifically, we give a version of the phylo-EMalgorithm for the fully general, irreversible substitutionmodel on a phylogenetic tree (noting that the irreversiblemodel is a generalisation of the reversible case). We thenpresent a flexible package for multiple alignment annota-tion using phylo-HMMs and phylo-SCFGs that imple-ments these algorithms and is similar, in spirit, to theDynamite package for generic dynamic programmingusing HMMs [5].
Using this package, it is extremely easy to design, train andapply a novel phylo-grammar, since new models can beloaded from an external, user-specified grammar file. Ourhope is that the algorithms and software presented herewill aid in the establishment of phylo-grammars in bioin-formatics and that such methods will be as widelyadopted for comparative genomics as HMMs and SCFGshave been.
OverviewIn 1981, Felsenstein published dynamic programming(DP) recursions for computing the likelihood of a phylo-genetic tree for aligned sequence data, given an underly-ing substitution model [21]. Together with seminalpapers by Neyman [64] and DayhofF et al.[12,13], thiswork heralded the widespread use probabilistic models inbioinformatics and molecular evolution. Felsenstein'sunderlying model is a finite-state continuous-timeMarkov chain, as described e.g. by Karlin and Taylor [43].It is characterised by an instantaneous rate matrix Rdescribing the instantaneous rates Rij of point substitu-tions from residue i to j. In the unifying language of con-temporary "Machine Learning" approaches, Felsenstein'strees are recognisable as a form of graphical model [66] orfactor graph [50], and the DP recursions an instance of thesum-product algorithm. (The connection to graphicalmodels has been made more explicit with recentapproaches that model other stochastic processes on phy-logenetic trees, such as the evolution of molecular func-
tion [20].) Many parametric versions of this model havebeen explored, such as the "HKY85" model [32].
Beginning in the late 1980s, another class of probabilisticmodels for biological sequence analysis was developed.These models included HMMs for DNA [11] and proteins[8], and SCFGs for RNA [78,18]. Collectively, such modelsform a subset of the stochastic grammars. Originally usedto annotate individual sequences, stochastic grammarswere soon also combined with phylogenetic models toannotate alignments. Thus, trees have been combinedwith HMMs and/or SCFGs to predict genes [68] and con-served regions [23] in DNA sequences, secondary struc-tures [83,26] and transmembrane topologies [53] inprotein sequences, and basepairing structures in RNAsequences [46]. We refer to such hybrid models as phylo-grammars. Associated with these advances were novelmethods to approximate context dependence of substitu-tion models, such as CpG and other dinucleotide effects[81,55]. The phylo-grammars can also be viewed as a sub-class of the "statistical alignment" grammars[34,37,60,36], which are derived from more rigorousassumptions about the underlying evolutionary model,including indels [84].
A compelling attraction of stochastic grammars (andprobabilistic models in general) is that parameters can besystematically "learned" from data by maximum likeli-hood (ML). One reasonably good, general, albeit greedyand imperfect, approximation to ML is the EM algorithm[14]. EM applies to models which generate both "hidden"and "observed" data; e.g., the transcriptional/translationalstructure of a gene (hidden) and the raw genomicsequence (observed). The applications of EM to trainingHMMs (the Baum-Welch algorithm) [4] and SCFGs(Inside-Outside) [51] are well-established (reviewed in[16]), but what of phylo-grammars? While a limited ver-sion of EM for substitution models was published in 1996[9,31], the full derivation for the general reversible ratematrix did not appear until 2002 [38]. The phylo-EMalgorithm for rate matrices has since been further devel-oped [94,35]. (Various alternatives to phylo-EM, such aseigenvector projections [3] and the "resolvent" [63], havealso been used to estimate rate matrices; some approxi-mate versions of phylo-EM have also been described[81,82].)
Conceptually, EM is straightforward: one simply alter-nates between imputing the hidden data (the "E-step")and optimizing the parameters (the "M-step"). The E-steptypically results in a set of "expected counts" which areintuitively easy to interpret. (For example, the E-step forphylogenetic trees returns the number of times each sub-stitution is expected to have occurred on each branch.)The EM algorithm has been intensely scrutinized and has
Page 2 of 25(page number not for citation purposes)

BMC Bioinformatics 2006, 7:428 http://www.biomedcentral.com/1471-2105/7/428
been shown to be versatile, adaptable and fast [25,57],particularly the special case of phylo-EM [94]. We there-fore argue that there are strong advantages to combiningthe form of EM used to train stochastic grammars (i.e. theBaum-Welch and Inside-Outside algorithms [16]) withthe phylo-EM form used for parameterizing substitutionmodels on phylogenetic trees [38].
Previous applications of phylo-grammarsThe program we have developed can handle a broad classof phylo-grammars within one framework. The followingis a brief review of prior work that either uses phylo-gram-mars, or is ideally suited to the phylo-grammar frame-work.
This section is subclassified according to the complexity ofthe grammar, beginning with the simplest. Generallyspeaking, a phylo-grammar can be used to annotate amultiple sequence alignment in any context where a sto-chastic grammar could be used to annotate an individualsequence. The applications span DNA, RNA and proteinsequence annotation.
Point substitution modelsA subset of the class of phylo-grammars is the class ofhomogeneous substitution models, where the mutationrate is not a function of position but rather is identical forevery site. Such models can be represented as a single-statephylo-HMM. Examples include
The Jukes-Cantor model [41], Kimura's two-parametermodel [44], the HKY85 model [32], the general reversi-ble model [92], and the general irreversible model [91].In the case of the Kimura and HKY85 models, the ratematrices are formulated para-metrically: that is, each sub-stitution rate is expressed as a function of a small set ofrate and/or probability parameters (e.g. in Kimura'smodel, there are two rate parameters: the transition rateand the transversion rate).
Variable-rate models, where the evolutionary rate isallowed to vary from site to site [90]. Yang used a finitenumber of discrete, fixed rate categories to approximate acontinuous gamma distribution over site-specific rates. Inessence, this can be viewed as special cases of the phylo-HMM of Felsenstein and Churchill [23], with the autocor-relation explicitly set to zero.
Hidden-state models [48,38]. A relative of the variable-rate model, the hidden-state model allows a variety of dif-ferent substitution rate matrices to be used, depending ona hidden state variable that specifies the structural contextof the site [48]. For example, a hydrophobically-inclinedrate matrix might be used for buried amino acids and ahydrophilic matrix for exposed amino acids. An extension
to the hidden-state model allows the hidden state variableitself to change over time at some slow rate, modeling rarechanges in structural context [38]. An alternative exten-sion allows correlations between hidden state variables atadjacent sites: this is essentially the idea behind the phylo-HMM, described below.
Models for synonymous/nonsynonymous substitutionratio measurement; empirical rate matrices for codonevolution [27,87]. Codon substitution matrices such asWAG [87] can be used to measure the ratio r of synony-mous to nonsynonymous substitution rates, which maybe indicative of purifying (r < 1), neutral (r = 1) or diver-sifying (r > 1) selection. These models are also related tothe exon prediction phylo-HMMs in EVOGENE [68] andEXONIPHY [80], described below.
Amino acid substitution models [12,28]. Likelihood cal-culations using these models can, as with the other substi-tution models discussed above, be viewed as trivialapplications of phylo-grammars.
Context-sensitive substitution models [81]. Siepel andHaussler introduced several alternate approximations forcalculating the likelihood of alignments assuming a near-est neighbor substitution model, suitable for capturingthe context-sensitivity of the substitution process that isobserved in real sequence alignments (most notoriouslyin genomes wherein CpG methylation is used as a mech-anism of epigenetic regulation, leading to elevated ratesfor the mutations CpG→TpG and CpG→ApG). Siepel andHaussler's method ignores longer-range correlationsinduced by nearest-neighbor effects, but is effective inpractice. (It may be regarded as an approximation to themore rigorous analysis of Lunter and Hein [55].)
Many of these models can be expressed using the GeneralParametric Substitution Model, which we define as thesubstitution model wherein all substitution rates and ini-tial probabilities can be expressed as simple functions of a(reduced) set of rate and probability parameters. As anexample, Kimura's two-parameter model [44] is shown(see figure 1) along with the HKY85 six-parameter model[32] (see figure 2).
As long as each parameter in a parametric substitutionmodel can be interpreted either as a rate (such as Kimura'stransition and transversion rates) or a probability (such asthe HKY85 equilibrium distribution over nucleotides),the phylo-EM algorithm can be adapted to estimate suchparameters via the computation of expected event counts.A formal description of the sets of allowable rate andprobability functions is given in the Supplementary Mate-rial [see Additional file 1].
Page 3 of 25(page number not for citation purposes)

BMC Bioinformatics 2006, 7:428 http://www.biomedcentral.com/1471-2105/7/428
Although the particular models used above (Kimura andHKY85) are reversible, matrices of allowable rate func-tions can in general be irreversible. Our General Paramet-ric Model may thus be regarded as a generalisation of theGeneral Irreversible Model.
Phylo-HMMsPhylo-HMMs form a class of models slightly more com-plex than point substitution models. In a phylo-HMM,each column (or group of adjacent columns) is associatedwith a hidden state, representing the evolutionary contextof the site. Each hidden state is conditionally dependentupon the immediately preceding state (the Markov prop-erty).
Tasks that have been addressed using phylo-HMMsinclude:
Measurement of variation of evolutionary rate amongsites in DNA [23]. Felsenstein and Churchill construct anHMM with three states. Each state generates an alignmentcolumn according to a point substitution process on a tree[21]. The overall evolutionary rate for the columndepends on the state from which it is emitted: each state
thus corresponds to a "rate category" (the relative rates forthe three states are 0.3, 2.0 and 10.0). The use of an HMMallows for an autocorrelated model of rate variation.
Modeling site-specific residue usage in proteins[9,31].While site-specific profiles are familiar tools in bioinfor-matics, early tools such as Gribskov profiles [29] and hid-den Markov models [8] ignored phylogenetic correlationsin the dataset, leading to biased sampling. Phylo-gram-mars incorporate these correlations directly. In thesepapers, Bruno et al. introduced an initial EM algorithm forestimating rate matrices.
Prediction of secondary structure in proteins[83,26]. Ina similar manner to Felsenstein and Churchill, a three-state HMM is constructed wherein each state emits analignment column using a substitution rate matrix. Here,however, the states correspond to different units of sec-ondary structure (loop, α-helix and β-sheet). The substitu-tion rate matrix for each state reflects the frequencydistribution and substitution patterns for that secondarystructural class. The method performs less well than estab-lished secondary structure prediction algorithms, butshows promise, in particular given the simplicity of themodel (three states only). Later work expanded thenumber of states in the phylo-HMM to eight (correspond-ingly increasing the number of parameters). Note that, asmore parameters are introduced into this kind of phylo-HMM, the problem of "training" those parameters growsin importance.
Prediction of exons and protein-coding gene structuresin DNA [68,80]. The basis for the gene prediction pro-grams EVOGENE and EXONIPHY, respectively, thesephylo-HMMs are based on substitution models for codontriplets with 43 = 64 states. The paper by Siepel and Haus-sler introduced the term "phylo-HMM" and used anapproximate version of the EM algorithm introduced byHolmes and Rubin for parameterization [38].
Detection, modeling and annotation of transcriptionfactor binding sites in DNA [62]. Here, the EM algorithmand other formulae of Bruno and Halpern [9,31] is usedto model site-specific residue frequencies in alignments ofpromoter regions (rather than proteins, as addressed byBruno and Halpern).
Detection of conserved regions in multiple alignmentsof genomic DNA [79]. Phylo-HMMs to detect conservedregions can be viewed as extensions of Felsenstein andChurchill's original model with more rate categories. Thisapproach has been used to detect highly-conservedregions in vertebrate, insect, nematode and yeastgenomes. Approaches measuring the substitution rate per
Kimura's two-parameter modelFigure 1Kimura's two-parameter model. The state order is {A, C, G, T}. Each entry is a function of the reduced parameter set (α, β) where α and β are rates.
Hasegawa et al's six-parameter modelFigure 2Hasegawa et al's six-parameter model. The state order is {A, C, G, T}. The negative on-diagonal elements have been omit-ted for brevity (they are constrained by the requirement that each row sums to zero). Each entry is a function of the reduced parameter set (α, β, πA, πC, πG, πT) where (α, β) are rates and (πA, πC, πG, πT) are probabilities.
Page 4 of 25(page number not for citation purposes)

BMC Bioinformatics 2006, 7:428 http://www.biomedcentral.com/1471-2105/7/428
site [79,85], the local indel rate [54] and/or the CpGmutation bias [81,55] have all shown merit.
Analogously to some of the point substitution models,many phylo-HMMs can be expressed parametrically. Anexample of such a model is the one used by Siepel'sPHASTCONS program, whose phylo-HMM has ten statesranging from slow to fast overall substitution rate. Movingfrom one state to another, the relative substitution ratesbetween different nucleotides do not change (i.e. the ratioRij/Rkl is constant for any i, j, k, l ∈ {A, C, G, T}); only theoverall substitution rate varies (i.e. the absolute value Rij isnot constant). Such consistency across states can beachieved by writing the rate matrices for the ten states ask1R, k2 × R, k3 × R... k10 × R where the ki are scalar multipli-ers and R is a relative rate matrix shared by all the states.Similarly, the rate matrices of Felsenstein and Churchill'sthree-state phylo-HMM can be written 0.3 × R, 2 × R and10 × R. Both are examples of the general parametricphylo-HMM.
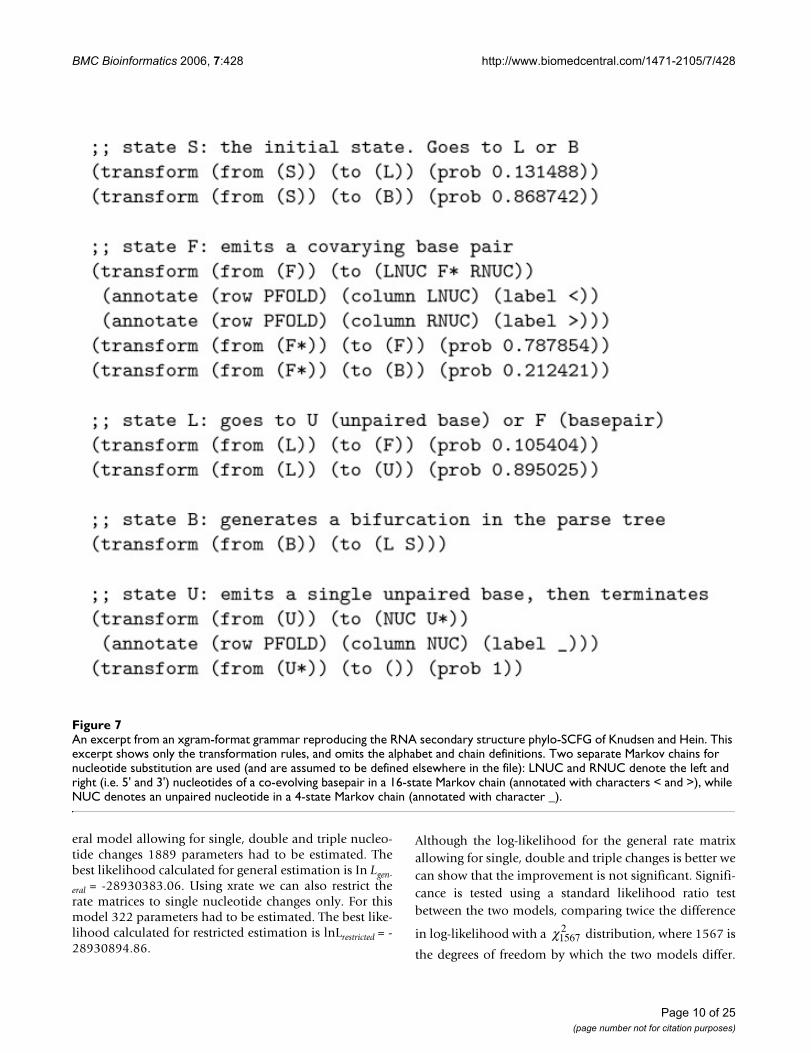
Phylo-SCFGsThe most complex class of phylo-grammar consideredhere is the phylo-SCFG. Most commonly used to modelRNA secondary structure, these grammars are capable ofmodeling covariation between paired sites. In an SCFG,covarying sites must be strictly nested, allowing the mod-eling of foldback structures but not pseudoknots, kissingloops or other topologi-cally elaborate RNA structures[45].
Tasks that have been addressed using phylo-SCFGsinclude:
Prediction of RNA secondary structure [46,47]. ThePfold program in this paper introduced the first phylo-SCFG, combining stochastic context-free grammars (usedto model RNA structure) with evolutionary substitutionmodels. Since HMMs are a subset of SCFGs, the frame-work of phylo-SCFGs includes the previously discussedphylo-HMMs. The Pfold program also allowed for user-specified grammars; however, it lacked a fast EM-like algo-rithm for estimating grammar parameters from data (bycontrast, the non-phylogenetic SCFGs used elsewhere inbioinformatics can be rapidly trained using the Inside-Outside algorithm [16]). A key feature of these models isthe use of 16-state "basepair models" for modeling thesimultaneous coevolution of functional base-pairs in RNAstructures. Again, fast and effective parameterization ofthe model is an important issue.
Detection of noncoding RNA genes [67]. A similarmodel to Pfold was used by the Evofold program, whichuses a phylo-SCFG to parse genomic alignments into non-coding RNA and other features [67].
Detection of RNA secondary structure within exons[69]. The RNA-Decoder program uses a parametric phylo-SCFG to model exonic regions in which there is simulta-neous selection on both the translated protein sequenceand the secondary structure of the pre-mRNA. Suchregions have been found in viral genomes and hypothe-sized to fulfil a regulatory role [69]. Due to the complexityof these models and the sparsity of training data, paramet-ric rate functions are required to limit the number of freeparameters that must be estimated.
Detection of accelerated selection in human noncodingRNA [70]. Pollard et al used phylo-HMMs and phylo-SCFGs to identify a neurally-expressed RNA gene, HARF1,that had undergone recent accelerated evolution in thelineage separating humans from the human-chimp ances-tor.
ImplementationIn practice, users of phylo-grammars need to do a similarcore set of tasks in order to perform data analysis. Thesetasks may include model development, structured param-eterization, estimation of parameter values and applica-tion of the model to annotate alignments. Using theframework of phylo-grammars, an implementation ena-bling all these tasks is possible. The EM algorithm pro-vides a general and consistent approach to parameterestimation, while standard "parsing" algorithms (theViterbi and Cocke-Younger-Kasami (CYK) algorithms[16]) address the problem of annotation.
We have implemented EM and Viterbi/CYK parsing algo-rithms in our software. The general irreversible phylo-EMalgorithm, using eigenvector decompositions, is describedin the Supplementary Material to this paper [see Addi-tional file 1]. (Note that this model is more general thanthe "general reversible model" [92], which can beregarded as a special case wherein the rates obey a detailedbalance symmetry so that πiRij = πjRji.) The main advanceover previous descriptions of this algorithm [38,81] is acomplete closed-form solution for the M-step of EM forirreversible models, including a full algebraic treatment ofthe complex conjugate eigenvector pairs [see Additionalfile 1]. This closed-form solution for the M-step eliminatesthe need for numerical optimization code as part of EM.The Viterbi and CYK algorithms are described in full else-where [16].
The essential idea of EM is iteratively to maximize theexpected log-likelihood with respect to the rate parameters,where the expectation is taken over the posterior distribu-tion of the missing data using the current parameters. Inthe case of phylo-EM, the missing data are the sequencesancestral to the observed sequence data.
Page 5 of 25(page number not for citation purposes)

BMC Bioinformatics 2006, 7:428 http://www.biomedcentral.com/1471-2105/7/428
As with many instances of EM, the posterior distributionover the missing data in phylo-EM can be summarized viaa representative set of "counts" that, being expectations,have convenient additive properties.
These counts have the following intuitive meaning withrespect to the ancestral states of the evolutionary process:(i) the expected residue composition at the root node ofthe tree; (ii) the expected number of times each type ofpoint mutation occurred; (iii) the expected amount ofevolutionary time each residue was extant.
Each of these counts is summed over all branches of thephylogenetic tree and then over all columns in the align-ment (or groups of columns). The sum over columns isweighted by the posterior probability that each column(or group of columns) was generated by a particular state.
Note that it is relatively easy to obtain naive estimates forthe phylo-EM counts (e.g. using parsimony), but that suchnaive estimates are in general systematically biased. Inparticular, they tend to underestimate the number of sub-stitutions that actually occurred.
A stochastic grammar consists of a set of "nonterminal"symbols (equivalent to the "states" of an HMM), a set of"terminal" symbols and a set of "production rules" fortransforming nonterminals. In a context-free grammar,each production rule transforms a single nonterminal intoa (possibly empty) sequence of terminals and/or nonter-minals. The iterative application of such rules can be rep-resented as a tree structure known as the "parse tree" [16].In biological applications, there is typically a largenumber of parse trees that can explain the observed data.This contrasts with applications in computational linguis-tics, where there are typically only a small number ofparses consistent with the data.
To apply EM to a stochastic grammar, one must computethe expected number of times each production rule wasused in the derivation of the observed alignment. Theseexpected counts are summed over the posterior distribu-tion of parse trees, and are calculated using the Inside-Outside algorithm.
The set of terminal symbols for a phylo-grammar is the setof possible alignment columns (in contrast to a single-sequence grammar, where the set of terminal symbols cor-responds to the residue alphabet). The phylo-EM algo-rithm is used to estimate the rate parameters associatedwith the emission of these symbols by the grammar.
ProgramsThe following open source software tools, implementingthe algorithms and models described in this paper, arefreely available (see Availability and Requirements).
xgram – a implementation of the EM algorithm for train-ing phylo-grammars, i.e. the Inside-Outside and Forward-Backward algorithms combined with the EM algorithmfor the general irreversible (and reversible) substitutionmodels. This program implements the general irreversibleEM algorithm described in the Supplementary Material[see Additional file 1], along with the general reversibleEM algorithm described previously [38]. The grammarcan be user-specified via an extensible file format,described below. Parametric grammars are allowed (sothat individual substitution rates and/or rule probabilitiescan be constrained to arbitrary functions of a smaller setof model parameters). The xgram tool is capable of repro-ducing most of the phylo-grammar models listed in thispaper. In its generic applicability, xgram is similar to thedynamic programming engine Dynamite [5], althoughthe class of models is different (phylo-grammars vs single-and pair-HMMs) and the functionality broader (includingparameterization by phylo-EM, as well as Viterbi and CYKannotation codes). Also included is an implementation ofthe neighbor-joining algorithm for fast estimation of treetopologies [77], and another version of the EM algorithmfor rapidly optimising branch lengths of trees with fixedtopology [24]. The model underlying xgram also allowsfor dynamically evolving "hidden states" associated witheach site, again as previously described [38].
xrate – a version of xgram including several "preset" gram-mars for point substitution models, including the generalirreversible and reversible substitution models.
xfold – a version of xgram including several "preset" gram-mars for RNA analysis, including that of the Pfold pro-gram [46].
xprot – a version of xgram including several "preset"grammars for protein analysis, including a grammar sim-ilar to that used by Thorne et al. for protein secondarystructure prediction [83].
All of the above programs can be driven by any user-spec-ified phylo-grammar. Having specified a grammar, or cho-sen one of the presets, the user can
• Estimate the ML parameterization of the grammar forthe training set via EM, using Inside-Outside or Forward-Backward algorithms (auto-selected by program) [16],together with the phylo-EM algorithm described in theSupplementary Material [see Additional file 1];
Page 6 of 25(page number not for citation purposes)

BMC Bioinformatics 2006, 7:428 http://www.biomedcentral.com/1471-2105/7/428
• Find the maximum likelihood (ML) parse tree, usingCocke-Younger-Kasami (CYK) or Viterbi algorithms(auto-selected by program) [16], with phylogenetic likeli-hoods calculated by pruning [21];
• Annotate the alignment, column-by-column, with user-specified labels, using the ML parse tree;
• Find the posterior probability of each node in the MLparse tree.
The parse tree can also be constrained, completely or par-tially, by including complete or partial annotations in theinput alignment. For example, one can annotate severalknown examples of a TF binding site in a multiple align-ment. One can then allow the grammar to "learn" theseexamples and predict new binding sites.
File formatsThe input and output format for sequence alignment datais the Stockholm format, as used by PFAM and RFAM. Thewildcard character is the period ".". Annotation of col-umns with the wildcard character allows for incompletelylabeled data and hence partially supervised learning. If agiven annotation is specified in the grammar but absentfrom the training data, it will be treated as a string of wild-cards and all compatible possibilities will be summedover.
Any phylo-grammar can be specified, using a formatbased on LISP S-expressions [56,75]. The format ishuman-readable and succinct, while being machine-par-seable and extensible.
Phylo-grammar specification files contain several ele-ments:
• An alphabet, describing valid sequence tokens (e.g.nucleotides or amino acids) along with any degenerate or(in the case of nucleotides) complementary tokens.
• One or more chains, each describing a finite-state contin-uous-time Markov chain, including rate parameters;
• Optionally (for parametric models) a set of rate andprobability parameter values;
• A set of transformation rules, which also serve to definethe nonterminals in the grammar.
As an example, the grammar for the Kimura two-parame-ter rate matrix is shown (see figure 3). A more completeand up-to-date description of the format can be foundonline [88], as can discussion of the latest version of xrateand its companion programs [89].
Results and discussionWe illustrate the potential of xrate as a quick tool for pro-totyping phylo-grammars by re-implementing severalprior applications and testing on real and simulated data.
An xgram-format grammar for Kimura's two-parameter modelFigure 3An xgram-format grammar for Kimura's two-parameter model.
;; The grammar.;; For Kimura’s two-parameter model, the concept of a phylo-grammar;; is a bit superfluous, but necessary "boilerplate code" to do this;; sort of thing in xrate.(grammar(name KimuraTwoParameterModel)
;; Transformation rules. These follow the pattern for a null model;; with rate matrix X.;; There is one emit state, corresponding to emissions from matrix X.(transform (from (S)) (to (X S*)));; A hacky (but common) way of conditioning on the observed alignment;; length is to set both transition probs from the emit state to one:(transform (from (S*)) (to (S)) (prob 1))(transform (from (S*)) (to ()) (prob 1));; Finally we clear a flag, indicating we don’t want to re-estimate;; the rule probabilities during EM training:(update-rules 0)
;; Here are the parameters for Kimura’s model.(params((alpha 4)) ;; transition rate((beta 1)) ;; transversion rate) ;; end params
;; Now here is the algebraic structure of the rate matrix.(chain;; The state of this chain is a single symbol from alphabet DNA.;; Call this symbol X.(terminal (X));; The following line indicates that the initial probabilities;; and mutation rates should be treated as fixed parametric functions,;; not free variables.(update-policy parametric)
;; initial probability distribution(initial (state (a)) (prob 0.25))(initial (state (c)) (prob 0.25))(initial (state (g)) (prob 0.25))(initial (state (t)) (prob 0.25))
;; mutation rates(mutate (from (a)) (to (c)) (rate beta))(mutate (from (a)) (to (g)) (rate alpha))(mutate (from (a)) (to (t)) (rate beta))(mutate (from (c)) (to (a)) (rate beta))(mutate (from (c)) (to (g)) (rate beta))(mutate (from (c)) (to (t)) (rate alpha))(mutate (from (g)) (to (a)) (rate alpha))(mutate (from (g)) (to (c)) (rate beta))(mutate (from (g)) (to (t)) (rate beta))(mutate (from (t)) (to (a)) (rate beta))(mutate (from (t)) (to (c)) (rate alpha))(mutate (from (t)) (to (g)) (rate beta))) ;; end chain X) ;; end grammar
;; Define the standard DNA alphabet with IUPAC degeneracies(alphabet(name DNA)(token (a c g t))(complement (t g c a))(extend (to n) (from a) (from c) (from g) (from t))(extend (to x) (from a) (from c) (from g) (from t))(extend (to u) (from t))(extend (to r) (from a) (from g))(extend (to y) (from c) (from t))(extend (to m) (from a) (from c))(extend (to k) (from g) (from t))(extend (to s) (from c) (from g))(extend (to w) (from a) (from t))(extend (to h) (from a) (from c) (from t))(extend (to b) (from c) (from g) (from t))(extend (to v) (from a) (from c) (from g))(extend (to d) (from a) (from g) (from t))(wildcard *)) ;; end alphabet DNA
Page 7 of 25(page number not for citation purposes)

BMC Bioinformatics 2006, 7:428 http://www.biomedcentral.com/1471-2105/7/428
As applications we choose firstly a codon substitutionmodel which is both computationally intensive andparameter-rich (due to the size of the rate matrix). Sec-ondly, we compare xrate's performance in predicting pro-tein structure to a previously used phylo-HMM. Thirdly,we compare xrate to a previously used phylo-SCFG forpredicting RNA secondary structure.
To visualize rate matrices, we use figures that we refer to as"bubble-plots" (see figure 11). In a bubbleplot, the area ofa circle in the main matrix is proportional to the rate of
the corresponding substitution, with the grey circle in theupper-left repesenting the scale. The offset row shows theequilibrium probability distribution over states: here, thearea of a circle is proportional to the equilibrium proba-bility of the corresponding state. Additional color-codingis used on a case-by-case basis.
Fitting codon modelsIn the past, various amino acid substitution models havebeen estimated using ML techniques (e.g., mtREV [15],WAG [87]). An ML estimation of codon substitution
An excerpt from an xgram-format grammar reproducing the protein secondary structure phylo-HMM of Goldman, Thorne and JonesFigure 4An excerpt from an xgram-format grammar reproducing the protein secondary structure phylo-HMM of Goldman, Thorne and Jones. This excerpt shows only the transformation rules, and omits the alphabet and chain definitions. Three separate Markov chains for amino acid substitution are used (and are assumed to be defined elsewhere in the file): alpha_col denotes an amino acid in an alpha helix (annotated with character H), beta_col denotes an amino acid in a beta sheet (annotated with char-acter E) and loop_col denotes an amino acid in a loop region (annotated with character L).
Page 8 of 25(page number not for citation purposes)

BMC Bioinformatics 2006, 7:428 http://www.biomedcentral.com/1471-2105/7/428
models, however, has seemed infeasible for a long timebecause of the computational burden involved with suchparameter-rich models. This section shows that xrate iscapable of tackling the problem. The full results of a par-ticular study are being published elsewhere (Kosiol, Hol-mes and Goldman, in prep.); here, we will restrictattention to simulation results showing that xrate can dothese sorts of analyses reliably.
The number of independent parameters for a reversiblesubstitution model with N character states can be calcu-
lated as . This means that for the estimation
of a 20-state amino acid model, 208 independent param-eters need to be calculated. In contrast, to estimate a 61-state codon model (excluding stop codons), 1889 inde-pendent parameters have to be determined.
To test the robustness of xrate's ability to fit parameter-rich models to aligned sequence data, we simulated a dataset using all phylogenies of the Pandit database of proteindomain alignments [86], using a standard model ofcodon evolution (the MO model [93] [see Additional file1]). In this model, rates of substitutions involving changesto multiple nucleotides are zero, so that the rate matrix issparsely populated.
xrate is able to recover M0 well from this 'artifical' Panditdatabase. The true rates used in the simulation are shown(see figure 8). These may be compared with the recoveredrates (see figure 9).
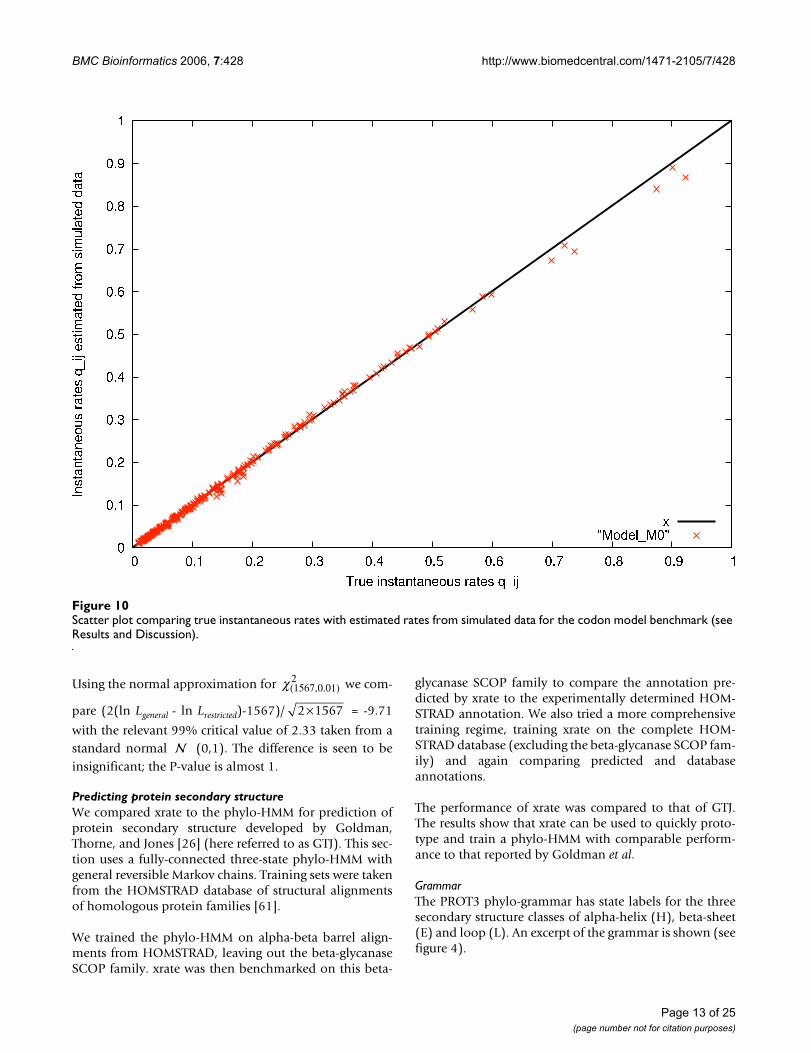
A scatter plot of true vs estimated rates allows a moredetailed analysis (see figure 10). This plot shows the true
instantaneous rates of M0 plotted versus the
instantaneous rates estimated from data simulated
from M0. If = the points would lie on the
bisection line y = x. Thus the deviation of the points fromthe bisection line indicates how different the rates are.
If one is interested in drawing biological conclusions fromthe estimated rate parameters, then it is of interest to con-sider xrate's estimates of rates which are zero in the truemodel, xrate sometimes inferred erroneously very smallnon-zero values for the instantaneous rates of double andtriple changes from the simulated data set (in the M0model, which was used to generate the data, such substi-tutions have zero rate). However, this error can be cor-rectly identified by comparing log-likelihoods calculatedby xrate under the following nested models: For the gen-
N N( )+ −1
22
qijtrue( )
qijest( )
qijtrue( ) qij
est( )
Example Stockholm-format input file for the protein second-ary structure grammar (see figure 4)Figure 5Example Stockholm-format input file for the protein second-ary structure grammar (see figure 4). The alignment is of the pancreatic hormone family.
# STOCKHOLM 1.0#=GF ID pp#=GF CLASS small#=GF FAMILY pancreatic hormone1bba APLEPEYPGDNATPEQMAQYAAELRRYINMLTRPRY1ppt GPSQPTYPGDDAPVEDLIRFYDNLQQYLNVVTRHRY1ron YPSKPDNPGEDAPAEDMARYYSALRHYINLITRQRY//
Example Stockholm-format output using the protein secondary structure grammar (see figure 4) and the pancreatic hormone alignment (see figure 5)Figure 6Example Stockholm-format output using the protein secondary structure grammar (see figure 4) and the pancreatic hormone alignment (see figure 5). Line numbers have been added for reference; note the embedded New Hampshire-format tree at line 2, the Viterbi bit-score at line 3 and the Viterbi secondary structure annotation at line 7.
1 # STOCKHOLM 1.02 #=GF NH (1ron:0.1274,(1bba:0.5087,1ppt:0.5034)node_3:0.1122)root;3 #=GF SC_max_PROT3 -352.2094 1bba APLEPEYPGDNATPEQMAQYAAELRRYINMLTRPRY5 1ppt GPSQPTYPGDDAPVEDLIRFYDNLQQYLNVVTRHRY6 1ron YPSKPDNPGEDAPAEDMARYYSALRHYINLITRQRY7 #=GC DSSP LLLLLLLLLLLLLLHHHHHHHHHHHHHHHHHHHLLL8 //
Page 9 of 25(page number not for citation purposes)
BMC Bioinformatics 2006, 7:428 http://www.biomedcentral.com/1471-2105/7/428
eral model allowing for single, double and triple nucleo-tide changes 1889 parameters had to be estimated. Thebest likelihood calculated for general estimation is In Lgen-
eral = -28930383.06. Using xrate we can also restrict therate matrices to single nucleotide changes only. For thismodel 322 parameters had to be estimated. The best like-lihood calculated for restricted estimation is lnLrestricted = -28930894.86.
Although the log-likelihood for the general rate matrixallowing for single, double and triple changes is better wecan show that the improvement is not significant. Signifi-cance is tested using a standard likelihood ratio testbetween the two models, comparing twice the difference
in log-likelihood with a distribution, where 1567 is
the degrees of freedom by which the two models differ.
χ15672
An excerpt from an xgram-format grammar reproducing the RNA secondary structure phylo-SCFG of Knudsen and HeinFigure 7An excerpt from an xgram-format grammar reproducing the RNA secondary structure phylo-SCFG of Knudsen and Hein. This excerpt shows only the transformation rules, and omits the alphabet and chain definitions. Two separate Markov chains for nucleotide substitution are used (and are assumed to be defined elsewhere in the file): LNUC and RNUC denote the left and right (i.e. 5' and 3') nucleotides of a co-evolving basepair in a 16-state Markov chain (annotated with characters < and >), while NUC denotes an unpaired nucleotide in a 4-state Markov chain (annotated with character _).
Page 10 of 25(page number not for citation purposes)

BMC Bioinformatics 2006, 7:428 http://www.biomedcentral.com/1471-2105/7/428
Page 11 of 25(page number not for citation purposes)
True codon mutation rate matrix for the M0 mechanistic codon mutation model benchmark (see Results and Discussion)Figure 8True codon mutation rate matrix for the M0 mechanistic codon mutation model benchmark (see Results and Discussion). These rates were used to generate simulated data; rates were then estimated from these data and compared to the true rates (see figure 9).

BMC Bioinformatics 2006, 7:428 http://www.biomedcentral.com/1471-2105/7/428
Page 12 of 25(page number not for citation purposes)
Estimated codon mutation rate matrix for the codon model benchmark (see Results and Discussion)Figure 9Estimated codon mutation rate matrix for the codon model benchmark (see Results and Discussion). These rates were esti-mated by xrate from simulated data, generated using a mechanistic rate model (see figure 8).
BMC Bioinformatics 2006, 7:428 http://www.biomedcentral.com/1471-2105/7/428
Using the normal approximation for we com-
pare (2(ln Lgeneral - ln Lrestricted)-1567)/ = -9.71
with the relevant 99% critical value of 2.33 taken from astandard normal (0,1). The difference is seen to beinsignificant; the P-value is almost 1.
Predicting protein secondary structureWe compared xrate to the phylo-HMM for prediction ofprotein secondary structure developed by Goldman,Thorne, and Jones [26] (here referred to as GTJ). This sec-tion uses a fully-connected three-state phylo-HMM withgeneral reversible Markov chains. Training sets were takenfrom the HOMSTRAD database of structural alignmentsof homologous protein families [61].
We trained the phylo-HMM on alpha-beta barrel align-ments from HOMSTRAD, leaving out the beta-glycanaseSCOP family. xrate was then benchmarked on this beta-
glycanase SCOP family to compare the annotation pre-dicted by xrate to the experimentally determined HOM-STRAD annotation. We also tried a more comprehensivetraining regime, training xrate on the complete HOM-STRAD database (excluding the beta-glycanase SCOP fam-ily) and again comparing predicted and databaseannotations.
The performance of xrate was compared to that of GTJ.The results show that xrate can be used to quickly proto-type and train a phylo-HMM with comparable perform-ance to that reported by Goldman et al.
GrammarThe PROT3 phylo-grammar has state labels for the threesecondary structure classes of alpha-helix (H), beta-sheet(E) and loop (L). An excerpt of the grammar is shown (seefigure 4).
χ(1567,0.01)2
2 1567×
Scatter plot comparing true instantaneous rates with estimated rates from simulated data for the codon model benchmark (see Results and Discussion)Figure 10Scatter plot comparing true instantaneous rates with estimated rates from simulated data for the codon model benchmark (see Results and Discussion).
Page 13 of 25(page number not for citation purposes)

BMC Bioinformatics 2006, 7:428 http://www.biomedcentral.com/1471-2105/7/428
Page 14 of 25(page number not for citation purposes)
Bubbleplot of amino acid substitution rates for alpha-helicesFigure 11Bubbleplot of amino acid substitution rates for alpha-helices. See Results and Discussion for color-coding and explanation of bubbleplots.

BMC Bioinformatics 2006, 7:428 http://www.biomedcentral.com/1471-2105/7/428
Page 15 of 25(page number not for citation purposes)
Bubbleplot of amino acid substitution rates for beta-sheetsFigure 12Bubbleplot of amino acid substitution rates for beta-sheets. See Results and Discussion for color-coding and explanation of bubbleplots.

BMC Bioinformatics 2006, 7:428 http://www.biomedcentral.com/1471-2105/7/428
Page 16 of 25(page number not for citation purposes)
Bubbleplot of amino acid substitution rates for loop regionsFigure 13Bubbleplot of amino acid substitution rates for loop regions. See Results and Discussion for color-coding and explanation of bubbleplots.

BMC Bioinformatics 2006, 7:428 http://www.biomedcentral.com/1471-2105/7/428
An example of usage for this grammar follows. We alsoshow an alignment from HOMSTRAD, too small to pre-dict secondary structure with any confidence, but usefulfor illustrative purposes (see figure 5). Suppose we wantto: (1) read in this alignment from a file named ' pp. stk';(2) load a point substitution matrix from a file named'dart/data/nullprot.eg' (this is an amino-acid matrix dis-tributed with xrate; the filename path assumes that theDART package was downloaded to the current workingdirectory); (3) use the above point substitution matrix toestimate a phylo-genetic tree (by neighbor-joining fol-lowed by EM on the branch lengths); (4) load the PROT3model from a file named 'dart/data/prot3.eg' (again, thisis distributed with xrate); and (5) use the PROT3 model topredict secondary structure classes for this protein family,printing the annotated alignment to the standard output.The following command-line syntax achieves this:
xrate pp.stk --tree dart/data/nullprot.eg --grammar dart/data/prot3.eg
The output of this command is shown (see figure 6).
More such examples can be found in DART (the softwarelibrary with which xrate is distributed) and on the wikipages for the xrate program [89]. A full list of command-line options for xrate can be obtained by typing xrate –help or, equivalently, xrate -h.
ResultsBoth xrate and the GTJ program were evaluated on thexylanase alignment used by GTJ, hereafter referred to asgtjxyl. xrate was trained on the subset of HOMSTRAD cor-
responding to alpha-beta barrel structures, with membersof the beta-glycanase SCOP family (which includes thegtjxyl proteins) removed to prevent overlap between thetraining and test sets.
We report the prediction accuracy collectively for all sec-ondary structure categories, and the sensitivity and specifi-city with respect to each individual category. These metricsare defined as follows
Sensitivity(n) = TPn/(TPn + FNn)
Speciflcity(n) = TPn/(TPn + FPn)
Accuracy = ( )/( + FNn)
where (for secondary structure class n) TPn is the numberof true positives (columns correctly predicted as class n),FNn is the number of false negatives (columns that shouldhave been predicted as class n but were not) and FPn is thenumber of false positives (columns that were incorrectlypredicted as class n).
Bubbleplots were used to visualize the amino acid substi-tution rates. Substitutions are colored red if between aro-matic amino acids, green if between hydrophobics andblue if between hydrophilics. Substitutions from one suchgroup to another (e.g. from hydrophobic to hydrophilic)are colored gray.
Figures 11, 12 and 13 show the amino acid substitutionmatrices for the alpha-helix, beta-sheet and loop states,respectively. The relative rates displayed in the figures ingeneral agree with what one would expect from each ofthose states: the alpha-helix and beta-sheet states substi-tute more slowly (and thus amino acid conservation ishigher) than for the loop states (loop regions being morevariable in structure [7]).
Table 1 shows the log likelihood scores of the trainingalignments, log P(D|θ), along with the log-posterior prob-ability of the HOMSTRAD reference annotation, logP(A|D, θ). In this case, maximum-likelihood training alsoyields an increase in the annotation posterior probability
TPnn∑ TPn
n∑
Table 1: Log-likelihood scores of training sets and log-posterior probabilities of the true annotations for the PROT3 benchmark. Here D denotes the training alignment data (the HOMSTRAD database without the beta-glycanase SCOP family), A denotes the DSSP annotations of the alignment data, θD denotes the model with parameters obtained from training on D, and θG
denotes the model with parameters obtained from the GTJ datafiles.
θ log2 P(A, D|θ) log2 P(D|θ) log2 P(A|D, θ)
θD -173038 -162491 -10547θG -238632 -227979 -10653
Table 2: Effect of tightening the EM convergence criteria for the PROT3 benchmark. The "mininc" parameter is the minimum fractional log-likelihood increase per iteration of EM. Accuracies for the gtjxyl benchmark alignment are reported, along with log-likelihoods. See Table 1 for additional notation.
mininc Runtime/min Acc(gtjxyl) log2 P(A, D|θD) log2 P(D|θD) log2 P(A|D, θD)
le-3 14 64.1 -2696469 -2549947 -146522le-4 35 64.7 -2686598 -2539908 -146690le-5 84 68.0 -2682667 -2536849 -145818
Page 17 of 25(page number not for citation purposes)

BMC Bioinformatics 2006, 7:428 http://www.biomedcentral.com/1471-2105/7/428
P(A|D, θ). This is not in general a guaranteed result of theEM algorithm, and alternative training procedures (suchas maximum-discrimination training [19]) have beenproposed to achieve this effect. It appears in this case thatsuch procedures are not required.
Table 2 reports likelihoods, accuracies and runtimes fortraining set 2 as the EM convergence criteria are tightened.As expected, the likelihood increases as the convergencecriteria are made more stringent. The annotation accuracyfor the gtjxyl benchmark alignment also consistentlyincreases.
Table 3 summarizes the results of running xrate and theGTJ program on all the test cases. In general the accuracyof xrate is comparable to or even slightly better than theaccuracy of the GTJ program.
Predicting RNA secondary structureTo illustrate the capability of xrate as a tool for RNA sec-ondary structure prediction/annotation, we compare it toPfold, a phylo-SCFG developed by Knudsen and Hein[46,47].
There are two goals of this section: (1) to see if xrate canexactly emulate the Pfold phylo-grammar using the sameparameters as Pfold, and (2) to see if the EM algorithmcan estimate parameters that yield comparable perform-ance to those produced by other methods.
We benchmarked the Pfold phylo-SCFG running on xrateagainst the original Pfold program using alignments fromthe Rfam database [30]. To address goal (2), we used xrateto estimate the substitution rates and initial frequencies ofbasepairs and single nucleotides from annotated Rfamalignments.
Our results show that the Pfold phylo-SCFG is effectivelyemulated by xrate, that the EM algorithm can estimate amore likely parameterization for a given training set andthat the parameters so obtained are comparable in per-formance to the Pfold program itself. We conclude thatxrate is a suitable platform for developing, parameteriz-ing, and testing phylo-grammars without the necessity ofwriting source code or performing manual parameteriza-tion.
GrammarThe PFOLD grammar is taken from the Pfold program andis described in the paper by Knudsen and Hein [46].
An excerpt of the grammar, containing the productionrules, is seen in figure 7 .
ResultsWe report the sensitivity and positive predictive value (PPV)of basepair predictions. These accuracy metrics aredefined as follows
Sensitivity = TP/(TP + FN)
PPV = TP/(TP + FP)
where TP is the number of true positives (base pairs thatare predicted correctly per the Rfam annotation), FN thenumber of false negatives (base pairs that are not pre-dicted but are in the Rfam annotation) and FP the falsepositives (predicted base pairs that are not in the Rfamannotation).
Training and testing sets were obtained by selecting the148 RNA gene families in Rfam version 7 with experimen-tally-determined structures, discarding pseudoknots,removing excessively gappy columns (as this step is alsoperformed by Pfold), grouping the families into super-families and randomly partitioning these superfamiliesinto two sets [see Additional file 1]. This yielded a trainingset of 71 alignments and a testing set of 77 alignments.
The benchmark results, shown in Table 4, indicate that thesensitivity and PPV of the Pfold program and its emula-tion on xrate are comparable. It should be noted, how-ever, that the sets of base pairs predicted by the twoprograms are slightly different [see Additional file 1]. After
Table 3: Summary of prediction performance for the PROT3 benchmark. "Sn" and "Sp" are the sensitivity and specificity for each secondary structure category; "Acc" is the overall accuracy.
Program Sn (α) Sp (α) Sn (β) Sp (β) Sn (L) Sp (L) Acc
GTJ 66.7 91.3 63.5 84.0 73.5 77.3 69.6xrate 71.6 95.7 82.7 79.0 65.2 81.2 70.2
Table 4: Accuracy of RNA secondary structure prediction. Comparison of sensitivities and PPVs for the Pfold program, its phylo-SCFG running on xrate with its original rates, and its phylo-SCFG running on xrate with rates estimated from Rfam by the phylo-EM algorithm.
Sensitivity PPV
Pfold 45.0% 58.3%xrate emulating Pfold 44.4% 61.7%
xrate trained on Rfam 42.8% 58.2%
Page 18 of 25(page number not for citation purposes)

BMC Bioinformatics 2006, 7:428 http://www.biomedcentral.com/1471-2105/7/428
examination, we attribute this to differences in implemen-tation and loss of precision due to numerical calculations.
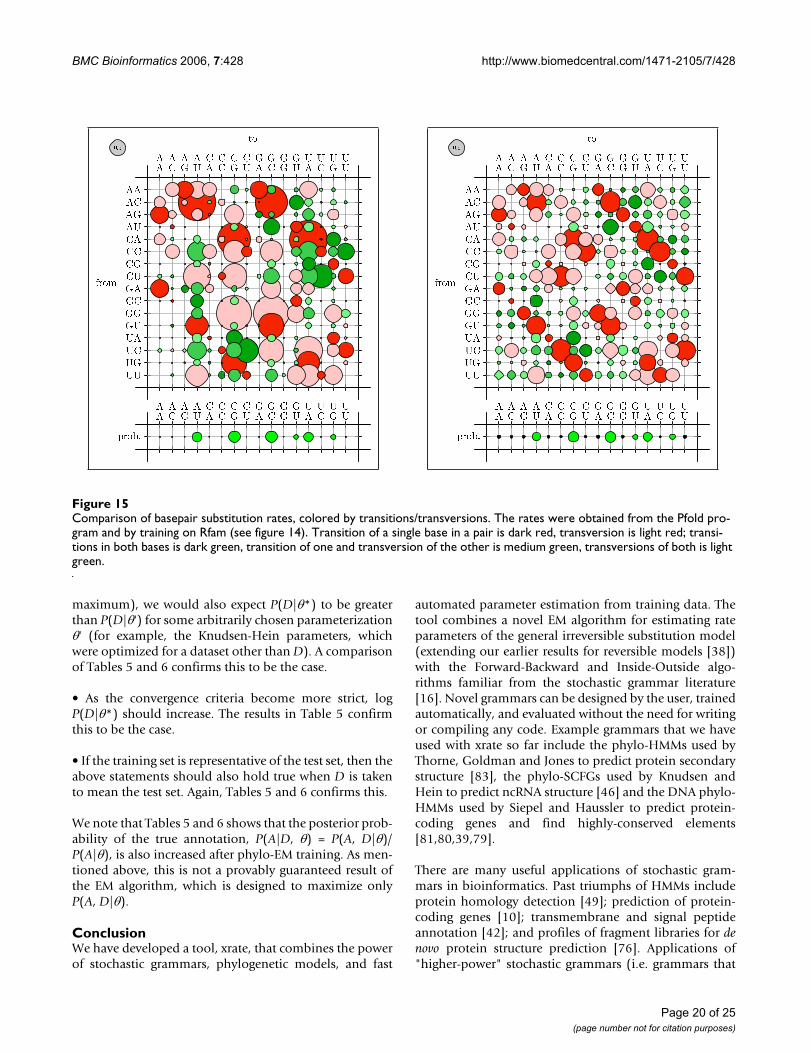
We also tested whether parameterizing the phylo-SCFGusing the EM algorithm is comparable to the Pfold param-eterization [46]. A comparison of Pfold's original rateswith the EM-estimated rates is shown in Figures 14–16.Both sets of parameters display similar trends. Substitu-tions that create or preserve canonical base pairs are morefrequent than substitutions that destroy basepairs (see fig-ure 14). Transitions are more common than transver-sions, both within basepairs (see figure 15) and unpairedsites (see figure 16). There is a difference in the magnitudeof many of the rates, which we attribute to differences inthe training sets.
The predictive accuracy of Pfold is compared to that of thexrate-trained phylo-SCFG in Table 4, while log-likeli-hoods are compared in Tables 5 and 6. The results are sim-ilar, indicating that the combination of training set andxrate-implemented EM is comparable to the training pro-cedure used in the development of Pfold.
An important point to check is whether the EM algorithmactually performs as designed. We expect to see certainphenomena if the algorithm is indeed working asexpected:
• The algorithm, over the course of its iterations, shouldrefine the parameter set (denoted at the n'th iteration byθ(n)) to maximize the likelihood of the alignment data Dand (if supplied) the annotation A. Therefore, the log-like-lihood log P(D|θ(n)) should increase with n towards anasymptotic maximum value. This is indeed observed to bethe case for this example (see figure 17).
• In practice, the EM algorithm is not run for an infinitenumber of iterations; rather, the algorithm stops whensome "convergence criteria" are met (relating to the frac-tional increase of the log-likelihood) and the parametersat this point are considered to be the "convergent param-eters". We denote this convergent parameter set by θ*.
• If the EM algorithm is performing effectively (i.e. findinga parameterization whose likelihood is close to the global
Comparison of basepair substitution rates, colored by basepairing conservation, gain, or lossFigure 14Comparison of basepair substitution rates, colored by basepairing conservation, gain, or loss. Rates and equilibrium frequencies from the Pfold phylo-SCFG (left panel) are compared with those estimated by the phylo-EM algorithm from Rfam (right panel). Substitutions from non-canonical to canonical basepairs are blue (pairing gain), canonical to canonical are red (pairing conserva-tion), non-canonical to non-canonical are black (unpaired and no change), and canonical to non-canonical are yellow (pairing loss).
Page 19 of 25(page number not for citation purposes)
BMC Bioinformatics 2006, 7:428 http://www.biomedcentral.com/1471-2105/7/428
maximum), we would also expect P(D|θ*) to be greaterthan P(D|θ') for some arbitrarily chosen parameterizationθ' (for example, the Knudsen-Hein parameters, whichwere optimized for a dataset other than D). A comparisonof Tables 5 and 6 confirms this to be the case.
• As the convergence criteria become more strict, logP(D|θ*) should increase. The results in Table 5 confirmthis to be the case.
• If the training set is representative of the test set, then theabove statements should also hold true when D is takento mean the test set. Again, Tables 5 and 6 confirms this.
We note that Tables 5 and 6 shows that the posterior prob-ability of the true annotation, P(A|D, θ) = P(A, D|θ)/P(A|θ), is also increased after phylo-EM training. As men-tioned above, this is not a provably guaranteed result ofthe EM algorithm, which is designed to maximize onlyP(A, D|θ).
ConclusionWe have developed a tool, xrate, that combines the powerof stochastic grammars, phylogenetic models, and fast
automated parameter estimation from training data. Thetool combines a novel EM algorithm for estimating rateparameters of the general irreversible substitution model(extending our earlier results for reversible models [38])with the Forward-Backward and Inside-Outside algo-rithms familiar from the stochastic grammar literature[16]. Novel grammars can be designed by the user, trainedautomatically, and evaluated without the need for writingor compiling any code. Example grammars that we haveused with xrate so far include the phylo-HMMs used byThorne, Goldman and Jones to predict protein secondarystructure [83], the phylo-SCFGs used by Knudsen andHein to predict ncRNA structure [46] and the DNA phylo-HMMs used by Siepel and Haussler to predict protein-coding genes and find highly-conserved elements[81,80,39,79].
There are many useful applications of stochastic gram-mars in bioinformatics. Past triumphs of HMMs includeprotein homology detection [49]; prediction of protein-coding genes [10]; transmembrane and signal peptideannotation [42]; and profiles of fragment libraries for denovo protein structure prediction [76]. Applications of"higher-power" stochastic grammars (i.e. grammars that
Comparison of basepair substitution rates, colored by transitions/transversionsFigure 15Comparison of basepair substitution rates, colored by transitions/transversions. The rates were obtained from the Pfold pro-gram and by training on Rfam (see figure 14). Transition of a single base in a pair is dark red, transversion is light red; transi-tions in both bases is dark green, transition of one and transversion of the other is medium green, transversions of both is light green.
Page 20 of 25(page number not for citation purposes)

BMC Bioinformatics 2006, 7:428 http://www.biomedcentral.com/1471-2105/7/428
are situated further up the Chomsky hierarchy, such asTree-Adjoining Grammars [40]) include beta-sheet pre-diction [1]; RNA genefinding [74], homology detection[17] and structure prediction [73]; and operon prediction[6].
There are also many useful applications of phylogeneticmodels. These include reconstruction of phylogenetictrees [22], measurement of Ka/Ks ratios [27], modeling res-idue usage [9,31], modeling covariation [71], detecting ofconserved residues [90] and sequence alignment[84,33,37]. Furthermore, there are many applications ofprobabilistic modeling in sequence analysis, e.g. "evolu-tionary trace" [52] or prediction of deleterious SNPs [65],that are either directly related to the above kinds of mod-els or might productively be linked.
xrate and associated tools comprise an up-to-date,friendly implementation of these models for the advanced
user. We believe these are powerful tools with broad util-ity. Our results show that the performance of xrate is com-parable to previously described phylo-HMM and phylo-SCFG implementations customized to specific tasks, andfurthermore that the rate estimates produced by xrate canbe interpreted in a biologically meaningful way. In releas-ing this general implementation, our hope is that we andothers will use these computational tools to further theapplication of molecular evolution in biomedicalresearch.
Availability and requirementsProject name : xrate
Project home page : http://biowiki.org/dart
Operating system(s) : Platform independent
Programming language : C++
Table 5: Log-likelihoods of alignments, and log-posteriors of alignment annotations, for training and testing datasets under various EM convergence regimes in the PFOLD benchmark. The "mininc" parameter is the minimal fractional increase in the log-likelihood that is considered by our EM implementation to be an improvement, while the "forgive" parameter is the number of iterations of EM without such an improvement that will be tolerated before the algorithm terminates. The default settings are mininc = le-3, forgive = 0. Here D denotes the alignment data, A denotes the RFAM secondary structure annotations of the alignment data and θ denotes the model with parameters optimized for the training set using the specified EM convergence criteria.
Dataset "mininc" "forgive" log2 P(D, A|θ) log2 P(D|θ) log2 P(A|D, θ)
Training set le-3 0 -466330.6649 -453589.9251 -12740.7398Training set le-4 0 -465397.0642 -453403.7081 -11993.3561Training set le-5 0 -465397.0642 -453403.7081 -11993.3561Training set le-3 2 -465821.5239 -453476.0389 -12345.4850Training set le-3 4 -465565.9224 -453437.5353 -12128.3871Training set le-3 6 -465397.0642 -453403.7081 -11993.3561Training set le-3 8 -465291.1983 -453356.6841 -11934.5142Training set le-4 4 -465147.9174 -453318.4543 -11829.4631Training set le-4 10 -465010.8431 -453209.0744 -11801.7687Test set le-3 0 -360472.7960 -343832.6014 -16640.1946Test set le-4 0 -360190.7940 -344117.5123 -16073.2817Test set le-5 0 -360190.7940 -344117.5123 -16073.2817Test set le-3 2 -360148.9090 -343841.2775 -16307.6315Test set le-3 4 -360178.4500 -344016.2558 -16162.1942Test set le-3 6 -360190.7940 -344117.5123 -16073.2817Test set le-3 8 -360092.2930 -344078.8868 -16013.4062Test set le-4 4 -360057.4880 -344116.5923 -15940.8957Test set le-4 10 -360108.0100 -344166.2108 -15941.7992
Table 6: Log-likelihoods of alignments, and log-posteriors of alignment annotations, for training and testing datasets using the original Pfold program. Comparison with Table 5 shows that EM training increases all probabilities, as desired.
Dataset log2 P(D, A|θ) log2 P(D|θ) log2 P(A|D, θ)
Training set -487422.5964 -464828.9148 -22593.6816Test set -370490.5284 -348550.7516 -21939.7768
Page 21 of 25(page number not for citation purposes)

BMC Bioinformatics 2006, 7:428 http://www.biomedcentral.com/1471-2105/7/428
Other requirements : gcc version 3.3 or higher; GNUbuild tools (make, ar)
License : GNU GPL
Restrictions to use : None
AbbreviationsCYK : Cocke-Younger-Kasami
DP : Dynamic Programming
EM : Expectation Maximization
HMM : Hidden Markov Model
ML : Maximum Likelihood
PPV : Positive Predictive Value
SCFG : Stochastic Context-Free Grammar
Authors' contributionsPK implemented the irreversible phylo-EM algorithm andcontributed to the supplementary material describing thealgorithm. NG and RB developed the bubbleplot code. CKand NG performed the codon benchmark. YB performedthe protein secondary structure benchmark. AU per-formed the RNA secondary structure. RB and SC per-formed additional benchmarks and testing of xrate. IHdeveloped the remaining code and drafted the manu-script. IH, CK, NG, YB and AU contributed to the final ver-sion of the manuscript.
Additional material
Additional File 1XRate: a fast prototyping, training and annotation tool for phylo-gram-mars. Supplementary material. A full description of the phylo-EM algo-rithm for irreversible substitution models. Also contains details of experimental procedures.Click here for file[http://www.biomedcentral.com/content/supplementary/1471-2105-7-428-S1.pdf]
Comparison of substitution rates of nucleotides in unpaired alignment columnsFigure 16Comparison of substitution rates of nucleotides in unpaired alignment columns. Rates and equilibrium frequencies from the Pfold phylo-SCFG (left panel) are compared with those estimated by the phylo-EM algorithm from Rfam (right panel). Transitions are green, transversions are black.
Page 22 of 25(page number not for citation purposes)

BMC Bioinformatics 2006, 7:428 http://www.biomedcentral.com/1471-2105/7/428
AcknowledgementsRichard Goldstein, Gerton Lunter and Dawn Brooks gave helpful feedback during the development of xrate.
IH, AU and YB were funded in part by NIH/NHGRI grant 1R01GM076705-01. R.B was supported under a National Science Foundation Graduate Research Fellowship. YB was supported in part by the UC Berkeley Grad-uate Opportunity Fellowship. CK is a member of Wolfson College, Univer-sity of Cambridge, and was funded by a Wellcome Trust Prize Studentship and an EMBL predoctoral fellowship. NG was partially supported by a Well-come Trust fellowship.
References1. Abe N, Mamitsuka H: Prediction of beta-sheet structures using
stochastic tree grammars. In Proceedings Genome InformaticsWorkshop V Universal Academy Press; 1994:19-28.
2. Alexandersson M, Cawley S, Pachter L: SLAM cross-species genefinding and alignment with a generalized pair hidden Markovmodel. Genome Research 2003, 13(3):496-502.
3. Arvestad L, Bruno WJ: Estimation of reversible substitutionmatrices from multiple pairs of sequences. Journal of MolecularEvolution 1997, 45(6):696-703.
4. Baum LE: An equality and associated maximization techniquein statistical estimation for probabilistic functions of Markovprocesses. Inequalities 1972, 3:1-8.
5. Birney E, Durbin R: Dynamite: a flexible code generating lan-guage for dynamic programming methods used in sequencecomparison. In Proceedings of the Fifth International Conference onIntelligent Systems for Molecular Biology Edited by: Gaasterland T, KarpP, Karplus K, Ouzounis C, Sander C, Valencia A. Menlo Park, CA,AAAI Press; 1997:56-64.
6. Bockhorst J, Qiu Y, Glasner J, Liu M, Blattner F, Craven M: Predict-ing bacterial transcription units using sequence and expres-sion data. In Proceedings of the Eleventh International Conference onIntelligent Systems for Molecular Biology Menlo Park, CA, AAAI Press;2003:34-43.
7. Branden C, Tooze J: Introduction to Protein Structure Garland, NewYork; 1991.
8. Brown M, Hughey R, Krogh A, Mian IS, Sjölander K, Haussler D:Using Dirichlet mixture priors to derive hidden Markovmodels for protein families. In Proceedings of the First International
Figure 17Log-likelihoods (log2 P(alignment, annotation|parameters), red line) increase as the EM algorithm optimizes the model parame-ters on the training set. The accuracy results for this parameterization are reported in Table 4. The blue line represents the asymptotic best log-likelihood, reached at iteration 27.
Page 23 of 25(page number not for citation purposes)

BMC Bioinformatics 2006, 7:428 http://www.biomedcentral.com/1471-2105/7/428
Conference on Intelligent Systems for Molecular Biology Edited by: HunterL, Searls DB, Shavlik J. Menlo Park, CA, AAAI Press; 1993:47-55.
9. Bruno WJ: Modelling residue usage in aligned proteinsequences via maximum likelihood. Molecular Biology and Evolu-tion 1996, 13(10):1368-1374.
10. Burge C, Karlin S: Prediction of complete gene structures inhuman genomic DNA. Journal of Molecular Biology 1997,268(1):78-94.
11. Churchill GA: Stochastic models for heterogeneous DNAsequences. Bulletin of Mathematical Biology 1989, 51:79-94.
12. Dayhoff MO, Eck RV, Park CM: A model of evolutionary changein proteins. In Atlas of Protein Sequence and Structure Volume 5. Editedby: Dayhoff MO. National Biomedical Research Foundation, Washing-ton, DC; 1972:89-99.
13. Dayhoff MO, Schwartz RM, Orcutt BC: A model of evolutionarychange in proteins. In Atlas of Protein Sequence and Structure Volume5. Issue supplement 3 Edited by: Dayhoff MO. National BiomedicalResearch Foundation, Washington, DC; 1978:345-352.
14. Dempster AP, Laird NM, Rubin DB: Maximum likelihood fromincomplete data via the EM algorithm. Journal of the Royal Sta-tistical Society 1977, B39:1-38.
15. Dimmic MW, Mindell DP, Goldstein RA: Modeling evolution atthe protein level using an adjustable amino acid fitnessmodel. Proceedings of the Fifth Pacific Symposium on Biocomputing2000:18-29.
16. Durbin R, Eddy S, Krogh A, Mitchison G: Biological Sequence Analysis:Probabilistic Models of Proteins and Nucleic Acids Cambridge UniversityPress, Cambridge, UK; 1998.
17. Eddy SR: A memory-efficient dynamic programming algo-rithm for optimal alignment of a sequence to an RNA sec-ondary structure. BMC Bioinformatics 2002, 3(18):.
18. Eddy SR, Durbin R: RNA sequence analysis using covariancemodels. Nucleic Acids Research 1994, 22:2079-2088.
19. Eddy SR, Mitchison GJ, Durbin R: Maximum discrimination hid-den Markov models of sequence consensus. Journal of Compu-tational Biology 1995, 2:9-23.
20. Engelhardt BE, Jordan MI, Muratore KE, Brenner SE: Protein molec-ular function prediction by Bayesian phylogenomics. PLoSComputational Biology 2005, 1(5):.
21. Felsenstein J: Evolutionary trees from DNA sequences: a max-imum likelihood approach. Journal of Molecular Evolution 1981,17:368-376.
22. Felsenstein J: Inferring Phylogenies Sinauer Associates, Inc; 2003. ISBN0878931775.
23. Felsenstein J, Churchill GA: A hidden Markov model approachto variation among sites in rate of evolution. Molecular Biologyand Evolution 1996, 13:93-104.
24. Friedman N, Ninio M, Pe'er I, Pupko T: A structural EM algorithmfor phylogenetic inference. Journal of Computational Biology 2002,9:331-353.
25. Gilks W, Richardson S, Spiegelhalter D: Markov Chain Monte Carlo inPractice Chapman & Hall, London, UK; 1996.
26. Goldman N, Thorne JL, Jones DT: Using evolutionary trees inprotein secondary structure prediction and other compara-tive sequence analyses. Journal of Molecular Biology 1996,263(2):196-208.
27. Goldman N, Yang Z: A codon-based model of nucleotide sub-stitution for protein-coding DNA sequences. Molecular Biologyand Evolution 1994, 11:725-735.
28. Gonnet GH, Cohen MA, Benner SA: Exhaustive matching of theentire protein sequence database. Science 1992,256(5062):1443-1445.
29. Gribskov M, McLachlan AD, Eisenberg D: Profile analysis: detec-tion of distantly related proteins. Proceedings of the National Acad-emy of Sciences of the USA 1987, 84:4355-4358.
30. Griffiths-Jones S, Bateman A, Marshall M, Khanna A, Eddy SR: Rfam:an RNA family database. Nucleic Acids Research 2003,31(1):439-441.
31. Halpern AL, Bruno WJ: Evolutionary distances for protein-cod-ing sequences: modeling site-specific residue frequencies.Molecular Biology and Evolution 1998, 15(7):910-917.
32. Hasegawa M, Kishino H, Yano T: Dating the human-ape splittingby a molecular clock of mitochondrial DNA. Journal of Molecu-lar Evolution 1985, 22:160-174.
33. Hein J: An algorithm for statistical alignment of sequencesrelated by a binary tree. In Pacific Symposium on Biocomputing
Edited by: Altman RB, Dunker AK, Hunter L, Laud-erdale K, Klein TE.Singapore, World Scientific; 2001:179-190.
34. Hein J, Wiuf C, Knudsen B, Moller MB, Wibling G: Statistical align-ment: computational properties, homology testing andgoodness-of-fit. Journal of Molecular Biology 2000, 302:265-279.
35. Hobolth A, Jensen JL: Statistical inference in evolutionary mod-els of DNA sequences via the EM algorithm. Statistical applica-tions in Genetics and Molecular Biology 2005, 4(1):.
36. Holmes I: A probabilistic model for the evolution of RNAstructure. BMC Bioinformatics 2004, 5(166):.
37. Holmes I, Bruno WJ: Evolutionary HMMs: a Bayesian approachto multiple alignment. Bioinformatics 2001, 17(9):803-820.
38. Holmes I, Rubin GM: An Expectation Maximization algorithmfor training hidden substitution models. Journal of Molecular Biol-ogy 2002, 317(5):757-768.
39. Jojic V, Jojic N, Meek C, Geiger D, Siepel A, Haussler D, HeckermanD: Efficient approximations for learning phylogenetic HMMmodels from data. Bioinformatics 2004, 20(Supplement1):161-168.
40. Joshi A, Schabes Y: Tree-adjoining grammars. 1997.41. Jukes TH, Cantor C: Evolution of protein molecules. In Mamma-
lian Protein Metabolism Academic Press, New York; 1969:21-132. 42. Kall L, Krogh A, Sonnhammer EL: A combined transmembrane
topology and signal peptide prediction method. Journal ofMolecular Biology 2004, 338(5):1027-1036.
43. Karlin S, Taylor H: A First Course in Stochastic Processes Academic Press,San Diego, CA; 1975.
44. Kimura M: A simple method for estimating evolutionary ratesof base substitutions through comparative studies of nucleo-tide sequences. Journal of Molecular Evolution 1980, 16:111-120.
45. Klosterman PS, Tamura M, Holbrook SR, Brenner SE: SCOR: astructural classification of RNA database. Nucleic Acids Research2002, 30:392-394.
46. Knudsen B, Hein J: RNA secondary structure prediction usingstochastic context-free grammars and evolutionary history.Bioinformatics 1999, 15(6):446-454.
47. Knudsen B, Hein J: Pfold: RNA secondary structure predictionusing stochastic context-free grammars. Nucleic Acids ResearchEvaluation Studies 2003, 31(13):3423-3428.
48. Koshi JM, Goldstein RA: Context-dependent optimal substitu-tion matrices. Protein Engineering 1995, 8:641-645.
49. Krogh A, Brown M, Mian IS, Sjölander K, Haussler D: HiddenMarkov models in computational biology: applications toprotein modeling. Journal of Molecular Biology 1994,235:1501-1531.
50. Kschischang FR, Frey BJ, Loeliger H-A: Factor graphs and thesum-product algorithm. IEEE Transactions on Information Theory1998, 47(2):498-519.
51. Lari K, Young SJ: The estimation of stochastic context-freegrammars using the inside-outside algorithm. ComputerSpeech and Language 1990, 4:35-56.
52. Lichtarge O, Bourne HR, Cohen FE: An evolutionary tracemethod defines binding surfaces common to protein fami-lies. Journal of Molecular Biology 1996, 257:342-358.
53. Liò P, Goldman N: Using protein structural information in evo-lutionary inference: transmembrane proteins. Molecular Biol-ogy and Evolution 1999, 16:1696-1710.
54. Lunter G, Ponting CP, Hein J: Genome-wide identification ofhuman functional DNA using a neutral indel model. PLoSComputational Biology 2006, 2(1):.
55. Lunter GA, Hein J: A nucleotide substitution model with near-est-neighbour interactions. Bioinformatics 2004, 20(Suppl1):I216-I223.
56. McCarthy JL: Recursive functions of symbolic expressions andtheir computation by machine. Communications of the ACM 1960,3(4):184-195.
57. McLachlan GJ, Krishnan T: The EM Algorithm and Extensions WileyInterscience; 1996.
58. Meyer IM, Durbin R: Gene structure conservation aids similar-ity based gene prediction. Nucleic Acids Research 2004,32(2):776-783.
59. Michalek S, Timmer J: Estimating rate constants in hiddenMarkov models by the EM algorithm. IEEE Transactions in SignalProcessing 1999, 47:226-228.
Page 24 of 25(page number not for citation purposes)

BMC Bioinformatics 2006, 7:428 http://www.biomedcentral.com/1471-2105/7/428
Publish with BioMed Central and every scientist can read your work free of charge
"BioMed Central will be the most significant development for disseminating the results of biomedical research in our lifetime."
Sir Paul Nurse, Cancer Research UK
Your research papers will be:
available free of charge to the entire biomedical community
peer reviewed and published immediately upon acceptance
cited in PubMed and archived on PubMed Central
yours — you keep the copyright
Submit your manuscript here:http://www.biomedcentral.com/info/publishing_adv.asp
BioMedcentral
60. Miklós I, Lunter G, Holmes I: A long indel model for evolutionarysequence alignment. Molecular Biology and Evolution 2004,21(3):529-540.
61. Mizuguchi K, Deane CM, Blundell TL, Overington JP: HOMSTRAD:a database of protein structure alignments for homologousfamilies. Protein Science 1998, 7:2469-2471.
62. Moses AM, Chiang DY, Pollard DA, Iyer VN, Eisen MB: MONKEY:identifying conserved transcription-factor binding sites inmultiple alignments using a binding site-specific evolutionarymodel. Genome Biology 2004, 5(12):.
63. Muller T, Vingron M: Modeling amino acid replacement. Journalof Computational Biology 2000, 7(6):761-776.
64. Neyman J: Molecular studies of evolution: a source of novelstatistical problems. In Statistical Decision Theory and Related TopicsEdited by: Gupta SS, Yackel J. Academic Press, New York; 1971.
65. Ng PC, Henikoff S: SIFT: Predicting amino acid changes thataffect protein function. Nucleic Acids Research 2003,31(13):3812-3814.
66. Pearl J: Probabilistic Reasoning in Intelligent Systems Morgan KaufmannPublishers, San Mateo, California; 1988.
67. Pedersen JS, Bejerano G, Siepel A, Rosenbloom K, Lindblad-Toh K,Lander ES, Kent J, Miller W, Haussler D: Identification and classi-fication of conserved RNA secondary structures in thehuman genome. PLoS Computational Biology 2006, 2(4):e33.
68. Pedersen JS, Hein J: Gene finding with a hidden Markov modelof genome structure and evolution. Bioinformatics 2003,19(2):219-227.
69. Pedersen JS, Meyer IM, Forsberg R, Simmonds P, Hein J: A compar-ative method for finding and folding RNA secondary struc-tures within protein-coding regions. Nucleic Acids Research 2004,32(16):4925-4923.
70. Pollard Katherine S, Salama Sofle R, Lambert Nelle, Lambot Marie-Alexandra, Coppens Sandra, Pedersen Jakob S, Katzman Sol, KingBryan, Onodera Courtney, Siepel Adam, Kern Andrew D, DehayColette, Igel Haller, Ares Manuel Jr, Vanderhaeghen Pierre, HausslerDavid: An RNA gene expressed during cortical developmentevolved rapidly in humans. Nature 2006, 443(7108):167-172.
71. Pollock DD, Taylor WR, Goldman N: Coevolving protein resi-dues: maximum likelihood identification and relationship tostructure. Journal of Molecular Biology 1999, 287(1):187-198.
72. Rabiner LR, Juang BH: An introduction to hidden Markov mod-els. IEEE ASSP Magazine 1986, 3(1):4-16.
73. Rivas E, Eddy SR: The language of RNA: a formal grammar thatincludes pseudoknots. Bioinformatics 2000, 16(4):334-340.
74. Rivas E, Eddy SR: Noncoding RNA gene detection using com-parative sequence analysis. BMC Bioinformatics 2001, 2(8):.
75. Rivest R: S-expressions. Internet Draft. 1997 [http://theory.lcs.mit.edu/~rivest/sexp.txt].
76. Rohl CA, Strauss CE, Misura KM, Baker D: Protein structure pre-diction using Rosetta. Methods in Enzymology 2004, 383:66-93.
77. Saitou N, Nei M: The neighbor-joining method: a new methodfor reconstructing phylogenetic trees. Molecular Biology and Evo-lution 1987, 4:406-425.
78. Sakakibara Y, Brown M, Hughey R, Saira Mian I, Kimmen Sjölander,Underwood RC, Haussler D: Stochastic context-free grammarsfor tRNA modeling. Nucleic Acids Research 1994, 22:5112-5120.
79. Siepel A, Bejerano G, Pedersen JS, Hinrichs AS, Hou M, RosenbloomK, Clawson H, Spieth J, Hillier LW, Richards S, Weinstock GM, Wil-son RK, Gibbs RA, Kent WJ, Miller W, Haussler D: Evolutionarilyconserved elements in vertebrate, insect, worm, and yeastgenomes. Genome Research 2005, 15(8):1034-1050.
80. Siepel A, Haussler D: Combining phylogenetic and hiddenMarkov models in biosequence analysis. Journal of ComputationalBiology 2004, 11(2–3):413-428.
81. Siepel A, Haussler D: Phylogenetic estimation of context-dependent substitution rates by maximum likelihood. Molec-ular Biology and Evolution 2004, 21(3):468-488.
82. Soyer OS, Goldstein RA: Predicting functional sites in proteins:site-specific evolutionary models and their application toneurotransmitter transporters. Journal of Molecular Biology 2004,339(1):227-242.
83. Thorne JL, Goldman N, Jones DT: Combining protein evolutionand secondary structure. Molecular Biology and Evolution 1996,13:666-673.
84. Thorne JL, Kishino H, Felsenstein J: An evolutionary model formaximum likelihood alignment of DNA sequences. Journal ofMolecular Evolution 1991, 33:114-124.
85. Wasserman WW, Fickett JW: Identification of regulatoryregions which confer muscle-specific gene expression. Journalof Molecular Biology 1998, 278(1):167-181.
86. Whelan S, de Bakker PI, Goldman N: Pandit: a database of pro-tein and associated nucleotide domains with inferred trees.Bioinformatics 2003, 19(12):1556-1563.
87. Whelan S, Goldman N: A general empirical model of proteinevolution derived from multiple protein families using amaximum-likelihood approach. Molecular Biology and Evolution2001, 18(5):691-699.
88. The xgram file format [http://biowiki.org/XgramFormat]89. Information on xrate, xgram, xprot, xfold and related tools
[http://biowiki.org/XgramSoftware]90. Yang Z: Maximum-likelihood estimation of phylogeny from
DNA sequences when substitution rates differ over sites.Molecular Biology and Evolution 1993, 10:1396-1401.
91. Yang Z: Estimating the pattern of nucleotide substitution.Journal of Molecular Evolution 1994, 39:105-111.
92. Yang Z: Maximum likelihood phylogenetic estimation fromDNA sequences with variable rates over sites: approximatemethods. Journal of Molecular Evolution 1994, 39:306-314.
93. Yang Z, Nielsen R, Goldman N, Pedersen A-M: Codon-substitutionmodels for heterogeneous selection pressure at amino acidsites. Genetics 2000, 155:432-449.
94. Yap VB, Speed TP: Statistical Methods in Molecular Evolution, chapterEstimating substitution matrices Springer; 2005.
Page 25 of 25(page number not for citation purposes)