bmc bioinformatics biomed central - springer · biomed central page 1 of 10 ... bmc bioinformatics...
TRANSCRIPT

BioMed CentralBMC Bioinformatics
ss
Open AcceSoftwarePanGEA: Identification of allele specific gene expression using the 454 technologyRobert Kofler*1, Tatiana Teixeira Torres2, Tamas Lelley1 and Christian Schlötterer2Address: 1University of Natural Resources and Applied Life Sciences, Department for Agrobiotechnology, Institute for Plant Production Biotechnology Konrad Lorenz Str 20, A-3430 Tulln, Austria and 2Institut für Populationsgenetik, Veterinärmedizinische Universität Wien, Josef Baumann Gasse 1, 1210 Wien, Austria
Email: Robert Kofler* - [email protected]; Tatiana Teixeira Torres - [email protected]; Tamas Lelley - [email protected]; Christian Schlötterer - [email protected]
* Corresponding author
AbstractBackground: Next generation sequencing technologies hold great potential for many biologicalquestions. While mainly used for genomic sequencing, they are also very promising for geneexpression profiling. Sequencing of cDNA does not only provide an estimate of the absoluteexpression level, it can also be used for the identification of allele specific gene expression.
Results: We developed PanGEA, a tool which enables a fast and user-friendly analysis of allelespecific gene expression using the 454 technology. PanGEA allows mapping of 454-ESTs to genesor whole genomes, displaying gene expression profiles, identification of SNPs and the quantificationof allele specific gene expression. The intuitive GUI of PanGEA facilitates a flexible and interactiveanalysis of the data. PanGEA additionally implements a modification of the Smith-Watermanalgorithm which deals with incorrect estimates of homopolymer length as occuring in the 454technology
Conclusion: To our knowledge, PanGEA is the first tool which facilitates the identification of allelespecific gene expression. PanGEA is distributed under the Mozilla Public License and available at:http://www.kofler.or.at/bioinformatics/PanGEA
BackgroundNext generation sequencing technologies hold greatpromise for biology in general [1]. They may be used toidentify SNPs, pursue metagenomics, analyse DNA-pro-tein interactions, and to discover non-coding RNA [2].Furthermore, they may also be used for the analysis of thetranscriptome [3,4] supplementing the microarray tech-nology. Compared to microarrays, sequencing based anal-ysis of the transcriptome allows to tackle new biologicalproblems such as the identification of allele specific gene
expression, absolute measurement of gene expression,identification of structural variation, identification ofalternative splicing sites and cross species comparison ofgene expression.
We developed PanGEA – The Comprehensive (ancientgreek: pan) Gene Expression Analyzer – to enable a fastand user-friendly analysis of allele specific gene expres-sion using the 454 technology. PanGEA can be used forquantification of gene expression, the identification of
Published: 14 May 2009
BMC Bioinformatics 2009, 10:143 doi:10.1186/1471-2105-10-143
Received: 27 November 2008Accepted: 14 May 2009
This article is available from: http://www.biomedcentral.com/1471-2105/10/143
© 2009 Kofler et al; licensee BioMed Central Ltd. This is an Open Access article distributed under the terms of the Creative Commons Attribution License (http://creativecommons.org/licenses/by/2.0), which permits unrestricted use, distribution, and reproduction in any medium, provided the original work is properly cited.
Page 1 of 10(page number not for citation purposes)

BMC Bioinformatics 2009, 10:143 http://www.biomedcentral.com/1471-2105/10/143
SNPs and the quantification of allele specific gene expres-sion. Additionally, PanGEA implements a modification ofthe Smith-Waterman algorithm which deals with incor-rect estimates of homopolymer length as occuring in the454 technology.
PanGEA and the accompanying console applications havebeen mainly developed for Windows but also work inLinux and Mac OsX. PanGEA is distributed under theMozilla Public Licence and can be obtained from http://www.kofler.or.at/bioinformatics/PanGEA [see Additionalfile 1 for the executable and Additional file 2 for thesource code of PanGEA].
ImplementationPanGEA-BlastNTo map ESTs to genes or whole genomes we developed Pan-GEA-BlastN. Similarly to Blast [5], PanGEA-BlastN uses anheuristic algorithm to find approximate hits between thedatabase and the query sequence and then extends these hitswith dynamic programming. PanGEA-BlastN is well-suitedfor mapping of EST reads obtained from next-generationsequencing technologies for the following reasons:
• the seeding (heuristic search for approximate hits)has been optimized. Pairwise alignments will only be
created for the best seeds, which reduces the numberof dynamic programming steps and thus computationtime
• the necessity to map ESTs unambiguously is explic-itly addressed
• the dynamic programming algorithm has been mod-ified to deal with uncertainty of homopolymer lengthas occurring in the 454-technology or in the Helicossystem [6,7]
• several modifications have been implemented whichallow for introns in the EST sequences
The mapping algorithm of PanGEA-BlastN, initiallybuilds a hash-table of the database sequence and subse-quently scans for approximate hits between the query andthe database sequence (seeds). Computation time isreduced by the identification of the best candidates for thehighest scoring hit from the longest diagonals, i.e. longestsuccession of shared words between the query and thedatabase sequence. Only the longest diagonals will besubjected to dynamic programming. In addition to theclassic Smith-Waterman algorithm PanGEA-BlastN pro-vides a modified Smith-Waterman algorithm which is
Seeding during the two PanGEA-BlastN search modesFigure 1Seeding during the two PanGEA-BlastN search modes. Individual word positions are marked with an x. Length of each diagonal (n) is shown above whereas the longest diagonal is indicated by a star. Diagonals being passed as seeds to the dynamic programming algorithm are shown shaded (n ≥ nlongest - 1).
x
Normal mode: longest diagonal
x
x
x
x
x
x
x
x
x
Intron mode: longest cumulative diagonal
x
x
x
x
x
x
x
x
xn = 4
n = 2
n = 3
n = 3
n = 2
x
x
x
x
EST
a
EST
a
EST
a
EST
a
EST
a
EST
a
Database sequence A Database sequence B
Database sequence A
Database sequence C
Database sequence B Database sequence C
x
x
x
xn = 3
x
xn = 2
x
xn = 2
n = 5
xn = 6
Page 2 of 10(page number not for citation purposes)
BMC Bioinformatics 2009, 10:143 http://www.biomedcentral.com/1471-2105/10/143
especially adapted to uncertainty of homopolymer lengthestimates occurring in several next-generation sequencingtechnologies [6,7]. We also implemented improvementsin the dynamic programming algorithm to increase com-putation efficiency Gotoh [8]. Unambiguously mappedESTs are identified by comparing the scores of pairwisealignments. If the score difference between the best andthe second best hit exceeds a minimum threshold, a map-ping result is considered unambiguous. Ambiguousresults are reported into a separate output file. PanGEA-BlastN also offers an intron-mode in which introns arealready considered during seeding. Putative exons, sepa-rated by an intron, are individually aligned by dynamicprogramming (partial alignments) and subsequently
aggregated into a composite alignment. Partial align-ments, representing putative exons, are frequently over-lapping with respect to the query sequence. For example,'exon a' covering the bases 5 – 125 of a query sequenceoverlaps with 'exon b' which covers the bases 115 – 220.These overlaps are biologically not meaningful and haveto be resolved. Therefore, PanGEA-BlastN calculates thealignment scores for each overlap individually andremoves the overlap with the lowest score.
In contrast to other Blast-like approaches, insignificanthits cannot be filtered by specification of a minimumalignment score. Rather, spurious hits can be filtered aftera PanGEA-BlastN search with the option 'Manage Pairwise
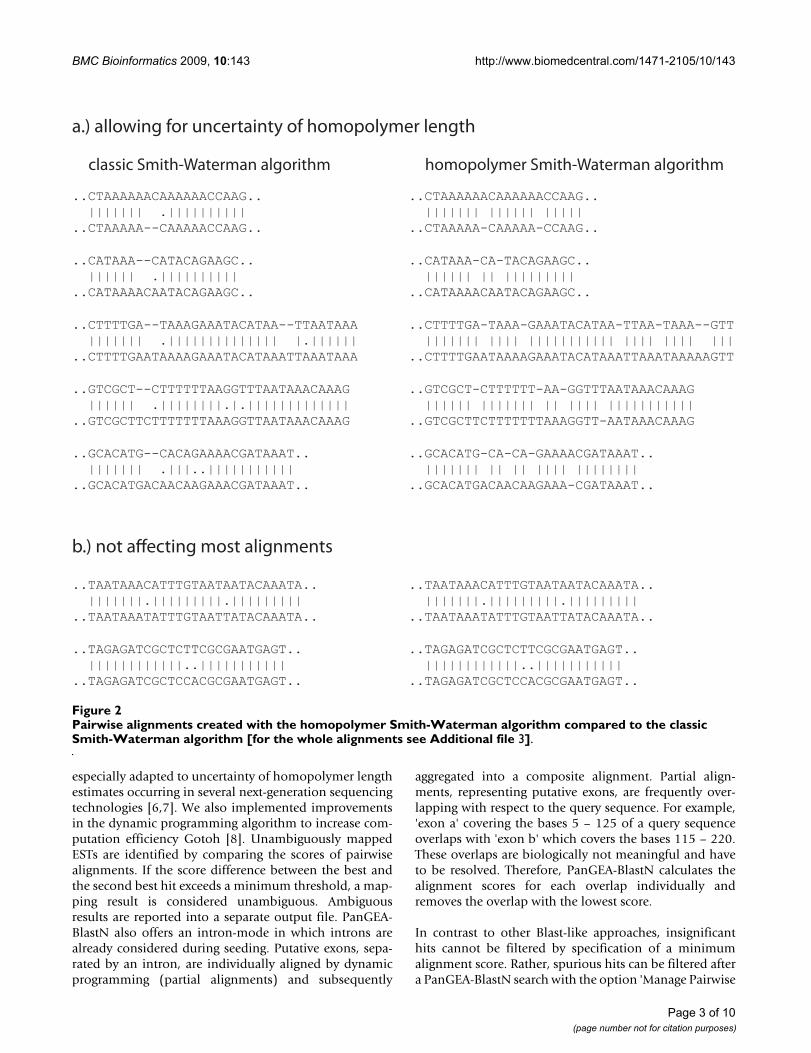
Pairwise alignments created with the homopolymer Smith-Waterman algorithm compared to the classic Smith-Waterman algorithm [for the whole alignments see Additional file 3]Figure 2Pairwise alignments created with the homopolymer Smith-Waterman algorithm compared to the classic Smith-Waterman algorithm [for the whole alignments see Additional file 3].
a.) allowing for uncertainty of homopolymer length
..CTTTTGA--TAAAGAAATACATAA--TTAATAAA ||||||| .|||||||||||||| |.||||||..CTTTTGAATAAAAGAAATACATAAATTAAATAAA
classic Smith-Waterman algorithm
..CATAAA--CATACAGAAGC.. |||||| .|||||||||| ..CATAAAACAATACAGAAGC..
..CTAAAAAACAAAAAACCAAG.. ||||||| .||||||||||..CTAAAAA--CAAAAACCAAG..
..GTCGCT--CTTTTTTAAGGTTTAATAAACAAAG |||||| .||||||||.|.|||||||||||||..GTCGCTTCTTTTTTTAAAGGTTAATAAACAAAG
b.) not affecting most alignments
homopolymer Smith-Waterman algorithm
..CTTTTGA-TAAA-GAAATACATAA-TTAA-TAAA--GTT ||||||| |||| ||||||||||| |||| |||| |||..CTTTTGAATAAAAGAAATACATAAATTAAATAAAAAGTT
..CATAAA-CA-TACAGAAGC.. |||||| || ||||||||| ..CATAAAACAATACAGAAGC..
..CTAAAAAACAAAAAACCAAG.. ||||||| |||||| ||||| ..CTAAAAA-CAAAAA-CCAAG..
..GTCGCT-CTTTTTT-AA-GGTTTAATAAACAAAG |||||| ||||||| || |||| |||||||||||..GTCGCTTCTTTTTTTAAAGGTT-AATAAACAAAG
..TAATAAACATTTGTAATAATACAAATA.. |||||||.|||||||||.||||||||| ..TAATAAATATTTGTAATTATACAAATA..
..TAATAAACATTTGTAATAATACAAATA.. |||||||.|||||||||.||||||||| ..TAATAAATATTTGTAATTATACAAATA..
..TAGAGATCGCTCTTCGCGAATGAGT.. ||||||||||||..||||||||||| ..TAGAGATCGCTCCACGCGAATGAGT..
..TAGAGATCGCTCTTCGCGAATGAGT.. ||||||||||||..||||||||||| ..TAGAGATCGCTCCACGCGAATGAGT..
..GCACATG--CACAGAAAACGATAAAT.. ||||||| .|||..||||||||||| ..GCACATGACAACAAGAAACGATAAAT..
..GCACATG-CA-CA-GAAAACGATAAAT.. ||||||| || || |||| ||||||||..GCACATGACAACAAGAAA-CGATAAAT..
Page 3 of 10(page number not for citation purposes)
BMC Bioinformatics 2009, 10:143 http://www.biomedcentral.com/1471-2105/10/143
alignments', by specifying a minimum similarity, align-ment length and read coverage (see below). This has theadvantage that performing a separate PanGEA-BlastNsearch for each different setting is not necessary. Instead,a PanGEA-BlastN search is conducted only once and theoptimal parameters can subsequently be quickly esti-mated. The total length of the database sequences is onlylimited by the amount of available RAM, an analysis usingthe D. melanogaster genome as database sequence (120Mbp) typically requires about 700 MB of RAM. No upperlimit exists for the number of query sequences as PanGEA-BlastN operates in batch mode. PanGEA-BlastN is availa-ble as a stand-alone console application and embeddedinto a user-friendly GUI in the software PanGEA.
SeedingIdentification of approximate hits between the databaseand the query sequence, i.e seeding, provides the startingpoint for subsequent dynamic programming steps. Sincethe most time consuming processes during mapping ofESTs is dynamic programming, minimizing the number
of dynamic programming steps could considerablyimprove computational efficiency. For EST mapping togenes or genomes the primary interest is the identificationof the corresponding genes, thus only a single best hit isexpected for each EST. This particular requirement can beused to design an efficient EST-mapping-algorithm bysearching, already during seeding, for best-hit-candidatesand subsequently aligning only those with dynamic pro-gramming. In contrast to Blast which aligns each approx-imate hit between a database and a query sequence [5],PanGEA-BlastN only aligns the best-hit-candidates. Best-hit-candidates are identified by searching for the longestdiagonals between a database and a query sequence[9,10]. Briefly, a hash table is built, containing each non-overlapping word of length k in the database sequences.Each word holds information about the index of the data-base sequence (i) and the position within the databasesequence (j). Words having a low information content,i.e. occur several-fold more often than expected by chance(n > nmax), are removed from the hash table. The maxi-mum number of occurrences nmax for words of length k in
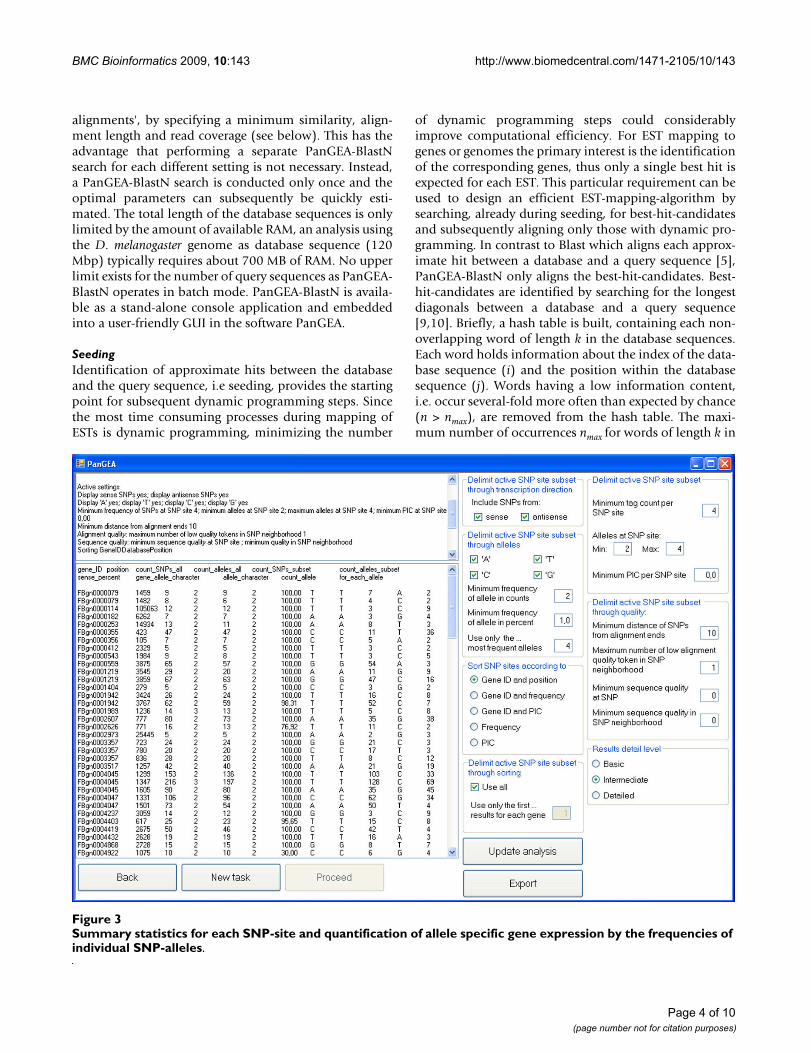
Summary statistics for each SNP-site and quantification of allele specific gene expression by the frequencies of individual SNP-allelesFigure 3Summary statistics for each SNP-site and quantification of allele specific gene expression by the frequencies of individual SNP-alleles.
Page 4 of 10(page number not for citation purposes)

BMC Bioinformatics 2009, 10:143 http://www.biomedcentral.com/1471-2105/10/143
database sequences having the total length ld can be calcu-lated as
Where c denotes the low complexity cutoff specified bythe user. After building a hash table, the query sequencesare scanned. For each overlapping word of length k in thequery sequence the corresponding matches in the hashtable are identified. For these words, a shift (s) is calcu-lated s = j - t where j is the position of the word in the data-base sequence and t the position in the query sequence.Subsequently, these words are sorted and parsed bysearching for consecutive words with identical index (i)and identical (or similar) shift (s) [10]. A consecutiveseries of n identical indexes and shifts form a diagonalwith length n. The algorithm searches for the longest diag-onal, having the length nlongest, and passes all diagonalswith a length n ≥ nlongest - 1 as seeds to the dynamic pro-gramming algorithm (Fig. 1). The main difference to thealgorithm of Ning et al. [10] is that PanGEA-BlastN usesthe diagonals merely as seeds for dynamic programming.In addition to this, PanGEA-BlastN provides an optionalmodification to account for the presence of introns in thereads being mapped against genomic sequences. Consec-
utive diagonals of length n ≥ 2 may be concatenated thusforming cumulative diagonals (Fig. 1). These cumulativediagonals allow for introns in the ESTs already duringseeding. A maximum distance between the individualdiagonals may be specified by the user.
Homopolymer adapted dynamic programmingSeveral next-generation sequencing technologies, forexample the 454-platform or the Helicos system intro-duce new types of sequencing errors [11-13]. Most nota-bly, the length of homopolymers is often estimatedincorrectly [11-13,7]. These sequencing errors frequentlycause the alignments of mismatching bases (Fig. 2), whichcan lead to wrong estimates of the evolutionary distancebetween two sequences or may complicate the identifica-tion of SNPs in downstream applications. We developeda novel Smith-Waterman algorithm, which accounts forthis uncertainty of homopolymer length by allowing forgaps preferentially in homopolymers.
The basic idea of the algorithm is to adjust the gap-intro-duction penalty (gap-opening penalty) dynamically to the"homopolymer-terrain" of a nucleotide sequence, i.e touse a position specific gap-introduction penalty, whichdecreases linearly within hompolymers. Additionally, areduced gap-introduction penalty should only be validwithin the tract of a homopolymer, if a gap is to be
n cldk k
max = **4
Effect of the most important parameters on the performance of PanGEA-BlastNFigure 4Effect of the most important parameters on the performance of PanGEA-BlastN. Values were calculated for map-ping of 1000 randomly generated 250 bp fragments from D. melanogaster transcripts to the corresponding genes. Benchmarks were calculated in triplicate for five (or more) datapoints [see Additional file 5]. If not stated otherwise the following parame-ters were used: word length 11; minimum diagonal 3; low complexity threshold 20; ambiguity 12.
20
0
wro
ng
[co
un
t]
10
com
p. t
ime
[sec
]
150
0
75
0 50 100low complexity cutoff
20
0
wro
ng
[co
un
t]
10
amb
igu
ou
s [c
ou
nt]
160
0
80
0 50 100ambiguity threshold
20
0
wro
ng
[co
un
t]
10
com
p. t
ime
[sec
]
150
0
75
9 11 13wordsize
20
0
wro
ng
[co
un
t]
10
com
p. t
ime
[sec
]
150
0
75
2 4 6minimum diagonal length
computation time
wrong hits
ambiguous hits
Page 5 of 10(page number not for citation purposes)

BMC Bioinformatics 2009, 10:143 http://www.biomedcentral.com/1471-2105/10/143
extended beyond, the default gap-introduction penaltyshould be used.
Let the two DNA sequences be D = d1d2...dn (database) andQ = q1q2...qm (query). Let Imax further be the default (max-imum) gap-introduction penalty, E the gap-extensionpenalty, S the hit score and Pmm the mismatch penalty,then the minimum gap-introduction penalty Imin can becalculated.
Gap introduction penalties I <Imin cause inconsistentalignments. Now two position specific gap introductionmatrices can be constructed ID = Id1Id2...Idn and IQ =Iq1Iq2...Iqm where each entry Idi, Iqk relates to an correspond-ing entry di, qk in D and Q respectively, where 1 ≤ i ≤ n and1 ≤ k ≤ m. The two matrices ID and IQ are instantiated withvalues for Idi, Iqk where Imin = Idi, Iqk = Imax. In the absence ofhomopolymers in sequences D and Q, the correspondingvalues Idi and Iqk respectively, are set to Imax whereas thesevalues decrease linearly to Imin within homopolymers.
For gaps of length t the affine gap penalty Pgt can be calcu-lated [14]:
The homopolymer Smith-Waterman algorithm describedhere, additionally uses the homopolymer gap penalty Phtfor gaps of length t.
To restrict the introduced low-penalty-gaps to homopoly-mers, we introduced the homopolymer-transgression-penalty T, where x denotes the number of homopolymertransgressions. A homopolymer is transgressed each timeqi ≠ qi+1 for insertions and di ≠ di+1 for deletions. A highvalue of T restricts low-penalty-gaps exclusively tohomopolymer tracts, whereas T = 0 allows an extension ofthese gaps without imposing any restrictions. Introduc-tion of the homopolymer transgression penalty addition-
ally has the advantage that this facilitates theimplementation of the homopolymer Smith-Watermanalgorithm in the important modification described byGotoh [8].
Let s(di, qk) be the similarity between the two bases di andqk then a two dimensional matrix H can be constructed,similar as described by Smith and Waterman [14].
Fig 2 shows some pairwise alignments generated with thehomopolymer Smith-Waterman algorithm compared toalignments generated by the classical Smith-Watermanimplementation [for the whole alignments see Additionalfile 3].
We implemented this homopolymer Smith-Watermanalgorithm together with the modification described byGotoh [8], which reduces the required computation timefrom O(m2n) to O(mn) where m and n is the length of thedatabase and the query sequence respectively [8]. We sim-ply used four one-dimensional arrays which keep track ofthe highest possible gap score (normal gaps andhomopolymer gaps, each in the database and the querysequence) instead of the two originally described. Animplementation of this homopolymer Smith-Watermanalgorithm is available as the stand-alone application 'Pan-GEA-SW'.
Mapping statistics and management of pairwise alignmentsThe mapped cDNA sequence reads can be managed usingthe user-friendly GUI of PanGEA. Summary statistics forall ESTs mapping to the same gene are provided, such asthe number of sense-ESTs mapping to the gene or thenumber of ESTs containing large gaps (putative introns).Subsets of the mapped reads can be displayed andexported by providing several quality criteria, such asambiguity, minimum length of the alignment, minimumsimilarity, minimum coverage of the EST, presence orabsence of large gaps (putative introns) or transcript ori-entation (sense, anti-sense). The subsets may be exportedand used for a subsequent analysis, for example SNP iden-tification.
SNP identificationSNPs are identified from the pairwise alignments. If a listof validated SNPs is available, PanGEA provides theoption to use only these SNPs for frequency estimatesfrom the sequence reads. If no validated SNPs are availa-
E I I P Smin max mm< = − −
P I E tgt max= + −*( )1
P min I I E t T xht di qk= + − +( , ) ( ) *1
H max
H s d q
max max H P max H Pik
i k i k
i t k gt i t k ht=
+− −
− −
− −
1 1,
, ,
( , )
( ( ), ( )))
( ( ), ( )), ,max max H P max H Pi k t gt i k t ht− −− −
⎧
⎨⎪⎪
⎩⎪⎪ 0
Table 1: Comparision of the performance of PanGEA-BlastN with NCBI-BlastN [5].
NCBI PanGEA P ∩ N1
Time 47 min 6 min -Hits 23 512 24 600 23 436
Ambiguous 1 787 1 887 1 615
More than 25,000 454-ESTs from D. melanogaster [4] were mapped to their genes. Ambiguity was reported if the score of the best hit differed from the score of the second best hit by less than 10.1PanGEA ∩ NCBI, i.e mapping results in which both tools agree
Page 6 of 10(page number not for citation purposes)

BMC Bioinformatics 2009, 10:143 http://www.biomedcentral.com/1471-2105/10/143
ble, PanGEA identifies SNPs from the sequence reads andprovides several options to minimize the number of mis-called SNPs. PanGEA can account for the quality scores ofthe sequences, determining the sequence quality at theSNP-site and its neighborhood.
The strategy for SNP-identification in PanGEA is to firstidentify SNPs using not-stringent parameters and to sub-sequently select a subset of these SNPs with the option'Manage SNPs' using stringent parameters. This has themain advantage that a separate SNP-identification foreach different parameters is not necessary, rather SNPs areidentified only once and subsets can be flexible selected.This approach allows for an interactive fine-tuning of the
selected SNPs and SNP-alleles. To test the SNP identifica-tion module we created extensive unit tests using NUnit[see Additional file 4].
The SNP identification module is available as stand-aloneconsole application 'PanGEA-SNP' and has been inte-grated into the software PanGEA.
Identification of allele specific gene expression and visualisation of SNPsPanGEA provides two options to display the identifiedSNPs. Either summary results are displayed for each SNP-site (Fig. 3) or for each database sequence (typically corre-sponding to a gene or transcript). The summary statistics
Table 2: Performance of PanGEA-BlastN with the 454-platform using the recommended settings.
tag-to-gene mapping1
normal mode Intron modeL2 s3 a4 c5 w6 n7 i8 t9 a4 c5 w6 n7 i8 t9
100 126 997 1 2 6 10 111 993 5 2 63 10100 95 95 932 6 62 0 11 104 952 6 42 11 11
90 42 408 13 579 0 4 35 450 10 540 0 5100 86 993 5 2 87 34 108 991 8 1 206 40
200 95 88 988 8 4 88 38 91 994 5 1 170 4190 90 953 5 42 44 37 78 885 13 102 75 36
100 114 986 10 4 211 84 94 996 3 1 407 90300 95 86 988 10 2 188 81 102 990 6 4 354 95
90 103 984 8 8 162 85 99 992 7 1 263 93100 74 994 4 2 312 128 85 988 7 5 574 153
400 95 87 986 12 2 300 137 79 981 13 6 499 15390 78 986 14 0 250 150 85 993 4 3 366 151
tag-to-genome mapping10
100 32 1000 0 0 11 11 21 998 1 1 42 10100 95 27 973 2 25 1 14 23 984 2 14 24 22
90 14 399 4 597 0 14 11 337 13 650 1 4100 31 997 3 0 93 59 25 994 6 0 190 55
200 95 31 993 7 0 82 49 20 995 5 0 154 5190 20 961 1 38 42 45 12 956 1 43 99 47
100 26 998 2 0 214 94 27 997 3 0 341 107300 95 16 998 2 0 178 96 21 995 5 0 285 113
90 23 972 9 19 151 99 21 989 10 1 250 102100 21 999 1 0 328 194 20 998 2 0 496 181
400 95 15 998 2 0 287 144 23 993 7 0 422 17890 19 996 4 0 260 168 20 992 8 0 400 168
Values were calculated for mapping 1000 randomly excised ESTs, either to the genes or to the whole genome of D. melanogaster1 settings: word length 11; minimum diagonal 3; low complexity threshold 10; homopolymer Smith-Waterman algorithm; no maximum intron length2 length of the tags in bp3 similarity of the tag with the target sequence in percent4 ambiguous mapping results; min score difference for unambiguous best hit 125 correctly mapped tags (including ambiguous results containing the correct hit)6 wrongly mapped tags (including ambiguous results not containing the correct hit)7 no hit identified8 number of long gaps (> 50 bp), putative introns9 mapping time in seconds, without the time required for constructing the word hash-table10 settings as above, only the maximum intron length was set to 5000 bp
Page 7 of 10(page number not for citation purposes)
BMC Bioinformatics 2009, 10:143 http://www.biomedcentral.com/1471-2105/10/143
for each SNP-site furthermore provide a convenient wayto quantify allele specific gene expression by displayingthe SNP-allele frequencies at each SNP-site (Fig. 3).Optionally, subsets of the SNP-alleles can be displayedaccording to quality, direction of transcription (sense andanti-sense) and minimum frequency. The quality of SNP-alleles can be assessed by several criteria such as the min-imum sequence quality of the SNP, the minimumsequence quality in the neighborhood of the SNP and theminimum distance from the alignment ends.
Methods for benchmarkingWe obtained the Drosophila melanogaster genome (release5.5), gene sequences (release 5.5) and the transcripts(release 5.5) from Flybase http://www.flybase.org/. Allbenchmarks were carried out on a standard desktop com-puter with 2 GB of RAM and an Intel™Core Duo®2 × 2.4GHz processor. For benchmarking, a set of 26 040 454-ESTs, with an average length of 106 bp, derived from the3'-end of D. melanogaster transcripts, were downloadedfrom GenBank [accession numbers: EV574767 –EV600806; [4]]. These 454-ESTs were mapped to thegenes of D. melanogaster using stand-alone BLAST 2.2.13and PanGEA-BlastN. Both programs used only one of thetwo available processors. The following PanGEA-BlastNsettings were used: word length 11; minimum diagonal 2;low complexity threshold 10; hit score 3; mismatch pen-alty 5; gap introduction penalty 11; gap extension penalty2; homopolymer transgression penalty 3; ambiguitythreshold 10; homopolymer Smith-Waterman; intronmode was off; The defaults settings were used for NCBI-BlastN, except the e-value was set to 10-10 and the tabularoutput format (-m 8) was used. The pairwise alignments,resulting from the mapping of these 26 000 454-ESTs tothe genes of D. melanogaster, were used for the subsequentidentification of SNPs.
To test the performance of PanGEA-BlastN with the 454-platform in detail, we developed a console applicationwhich randomly excises 1000 ESTs from the transcripts ofD. melanogaster, randomly introduces pseudo-sequencing-errors (0%, 5% and 10%) into these ESTs and maps themeither to the genes or the whole genome of D. melanogasterusing PanGEA-BlastN. An EST was considered correctlymapped to the genes, if the gene-ID (specified in headerof transcript) matched the mapping result, whereas an ESTwas considered correctly mapped to the whole genome, ifthe chromosome-ID as well as the position within thechromosome (specified in header of transcript) matchedthe mapping result.
ResultsInfluence of the mapping parameters used by PanGEA-BlastNWe evaluated the influence of the PanGEA-BlastN param-eters on the mapping accuracy and computation time by
mapping 1000 randomly generated 250 bp fragmentsfrom D. melanogaster transcripts (release 5.5) to the corre-sponding genes.
First, we determined the influence of the low complexitycutoff (c), which reflects the maximum frequency of aword in a hash-table. Words occurring c times more fre-quent than expected by chance were not considered. Asexpected the mapping accuracy increased with 'c' on theexpense of computation time (Fig. 4a). Nevertheless, thenumber of inaccurately mapped 454-ESTs was low (<1.20%) irrespective of the low complexity cutoff.
Next we calculated the influence of the ambiguity thresh-old, which measures the difference between the best andthe second best hit. Increasing the ambiguity thresholdresulted in a moderate reduction for incorrectly mapped454-ESTs. While < 1.0% were mapped incorrectly whenonly the best hit (ambiguity threshold = 0) was consid-ered, an ambiguity threshold of 100 had < 0.5% incor-rectly mapped 454-ESTs. The trade off of this increase inmapping accuracy was an increase of ambiguouslymapped 454-ESTs. Rather than 9% for the best hit, anambiguity threshold of 100 resulted in 13% ambiguoushits (Fig. 4b). The ambiguity threshold only has a minorinfluence on computation time [see Additional file 5]. Onthe other hand, increasing the word size dramaticallyreduces the computation time on the expense of the map-ping accuracy (Fig. 4c). The last parameter evaluated wasthe 'minimum diagonal length'. Similar to word size anincrease in minimum diagonal length reduced the com-putational time on the expense of mapping accuracy (Fig.4c).
These results illustrate that optimal parameters representa compromise between computation time, specificity andsensitivity.
Mapping performance of PanGEA-BlastNTo assess the performance PanGEA-BlastN we comparedPanGEA-BlastN with NCBI-BlastN. A set of more than25,000 454 ESTs [4], with an average length of 106 bpwere mapped to their gene sequences using PanGEA-BlastN and NCBI-BlastN. Despite a considerable reducedcomputation time, PanGEA-BlastN generated very similarresults as NCBI-BlastN (Table 1), suggesting that the sim-plified search did not compromise the mapping effi-ciency.
Nevertheless, we noted some differences between Pan-GEA-BlastN and NCBI-BlastN. To evaluate the mappingefficiency of PanGEA-BlastN, we computationally gener-ated 1000 454-EST-like sequences from D. melanogastertranscripts and mapped them either to gene sequences(including intronic sequences) or to the entire genome.
Page 8 of 10(page number not for citation purposes)
BMC Bioinformatics 2009, 10:143 http://www.biomedcentral.com/1471-2105/10/143
To account for sequencing errors, we also introduced 5%and 10% mutations prior to mapping.
The performance of PanGEA-BlastN was assessed usingthe following criteria: (i) the number of ambiguous hits(ii) the number of correct hits, including ambiguous hitscontaining the correct hit, (iii) the number of wrong hits,including ambiguous hits not containing the correct hit(iv) the number of not-mapped ESTs, (v) the number ofidentified large gaps (> 50 bp; putative introns) andfinally (vi) the required computation time.
A very high proportion (> 99.5%) of the ESTs was cor-rectly mapped irrespectively of the sequence divergence(Table 2). This mapping accuracy could be furtherimproved by changing some of the parameters, such asword size (see previous section). We noted a substantialdiscrepancy of unambiguously mapped reads for the genesequences and genomic sequences. Despite a higher com-plexity, fewer reads (2.5%) were ambiguously mapped tothe genome than to the gene sequences (10%). The reasonfor this discrepancy are ovelapping/nested genes (data notshown). Most importantly, the mapping accuracy was noteffected when the intron discovery mode was switched on.However, several large gaps (i.e.: introns) were discovered,emphasizing the need for the intron discovery mode.Increasing the length of the 454-ESTs beyond 100 bp didnot result in an increased mapping efficiency, suggestingthat this length is sufficient for reliable mapping.
However, considering the benchmarks of Table 2 we rec-ommend the following settings for mapping of 454-ESTs,which are an attempt to optimize the antagonisticdemands for efficiency, sensitivity and specificity: wordlength 11 (10–12), minimum diagonal length 3 (2–3),low complexity cutoff 10 (10–50); intron mode on. Thesesettings are used as defaults by PanGEA-BlastN.
Discussion and conclusionPanGEA provides an important step towards the use ofmassively parallel sequencing for gene expression analy-sis. While it is currently not apparent which of the newsequencing technologies will provide the most appropri-ate tool for gene expression analysis, the software toolPanGEA allows an accurate quantification of allele spe-cific gene expression.
Availability and requirementsProject name: PanGEA
Project home page: http://www.kofler.or.at/bioinformatics/PanGEA
Operating system(s): Windows, Linux and Mac Os X
Programming language: C#
Other requirements: .Net Framework 2.0 for Windows;Mono 2.0 for Mac Os X and Linux
License: Mozilla Public License
Any restrictions to use by non-academics: none
Authors' contributionsRK, TTT and CS conceived the project. RK did the pro-gramming. CS supervised the project. RK, TTT, TL and CSwrote the manuscript. All authors read and approved thefinal manuscript.
Additional material
AcknowledgementsThis work was financially supported by the Austrian Science Fund (P19467-B11 (CS), P18414-B14 (TL)) and a fellowship of the Brazilian National Council for Scientific and Technological Development (CNPq) to T.T.T. RK thanks Thomas Kofler for providing the web space and helpful comments on programming in C#.
Additional file 1PanGEA 1.04. A platform independent executable of PanGEA.Click here for file[http://www.biomedcentral.com/content/supplementary/1471-2105-10-143-S1.zip]
Additional file 2PanGEA source code. The source code of PanGEA.Click here for file[http://www.biomedcentral.com/content/supplementary/1471-2105-10-143-S2.rar]
Additional file 3Comparison of alignments. Compares the pairwise alignments created with the homopolymer Smith-Waterman algorithm to the classic Smith-Waterman algorithm.Click here for file[http://www.biomedcentral.com/content/supplementary/1471-2105-10-143-S3.txt]
Additional file 4NUnit test for the SNP identification module. A zip file containing the unit text for the SNP modification mudule as C# code.Click here for file[http://www.biomedcentral.com/content/supplementary/1471-2105-10-143-S4.zip]
Additional file 5Performance of PanGEA-BlastN. Provides detailed benchmarks for Pan-GEA-BlastN.Click here for file[http://www.biomedcentral.com/content/supplementary/1471-2105-10-143-S5.xls]
Page 9 of 10(page number not for citation purposes)
BMC Bioinformatics 2009, 10:143 http://www.biomedcentral.com/1471-2105/10/143
Publish with BioMed Central and every scientist can read your work free of charge
"BioMed Central will be the most significant development for disseminating the results of biomedical research in our lifetime."
Sir Paul Nurse, Cancer Research UK
Your research papers will be:
available free of charge to the entire biomedical community
peer reviewed and published immediately upon acceptance
cited in PubMed and archived on PubMed Central
yours — you keep the copyright
Submit your manuscript here:http://www.biomedcentral.com/info/publishing_adv.asp
BioMedcentral
References1. Schuster SC: Next-generation sequencing transforms today's
biology. Nat Methods 2008, 5(1):16-8.2. Mardis ER: The impact of next-generation sequencing tech-
nology on genetics. Trends Genet 2008, 24(3):.3. Weber AP, Weber KL, Carr K, Wilkerson C, Ohlrogge JB: Sampling
the Arabidopsis transcriptome with massively parallel pyro-sequencing. Plant Physiol 2007, 144:32-42.
4. Torres TT, Metta M, Ottenwalder B, Schlötterer C: Gene expres-sion profiling by massively parallel sequencing. Genome Res2008, 18:172-7.
5. Altschul SF, Gish W, Miller W, Myers EW, Lipman DJ: Basic localalignment search tool. J Mol Biol 1990, 215(3):403-10.
6. Margulies M, Egholm M, Altman WE, Attiya S, Bader JS, Bemben LA,Berka J, Braverman MS, Chen YJ, Chen Z, Dewell SB, Du L, Fierro JM,Gomes XV, Godwin BC, He W, Helgesen S, Ho CH, Irzyk GP, JandoSC, Alenquer ML, Jarvie TP, Jirage KB, Kim JB, Knight JR, Lanza JR,Leamon JH, Lefkowitz SM, Lei M, Li J, Lohman KL, Lu H, Makhijani VB,McDade KE, McKenna MP, Myers EW, Nickerson E, Nobile JR, PlantR, Puc BP, Ronan MT, Roth GT, Sarkis GJ, Simons JF, Simpson JW,Srinivasan M, Tartaro KR, Tomasz A, Vogt KA, Volkmer GA, WangSH, Wang Y, Weiner MP, Yu P, Begley RF, Rothberg JM: Genomesequencing in microfabricated high-density picolitre reac-tors. Nature 2005, 437(7057):376-80. Epub 2005 Jul 31
7. Harris TD, Buzby PR, Babcock H, Beer E, Bowers J, Braslavsky I, Cau-sey M, Colonell J, Dimeo J, Efcavitch JW, Giladi E, Gill J, Healy J, JaroszM, Lapen D, Moulton K, Quake SR, Steinmann K, Thayer E, TyurinaA, Ward R, Weiss H, Xie Z: Single-molecule DNA sequencingof a viral genome. Science 2008, 320(5872):106-9.
8. Gotoh O: An improved algorithm for matching biologicalsequences. J Mol Biol 1982, 162(3):705-8.
9. Pearson WR, Lipman DJ: Improved tools for biological sequencecomparison. Proc Natl Acad Sci USA 1988, 85(8):2444-8.
10. Ning Z, Cox AJ, Mullikin JC: a fast search method for large DNAdatabases. Genome Res 2001, 11(10):1725-9.
11. Huse SM, Huber JA, Morrison HG, Sogin ML, Welch DM: Accuracyand quality of massively parallel DNA pyrosequencing.Genome Biol 2007, 8(7):R143.
12. Brockman W, Alvarez P, Young S, Garber M, Giannoukos G, Lee WL,Russ C, Lander ES, Nusbaum C, Jaffe DB: Quality scores and SNPdetection in sequencing-by-synthesis systems. Genome Res2008, 22:22.
13. Pop M, Salzberg SL: Bioinformatics challenges of new sequenc-ing technology. Trends Genet 2008, 8:8.
14. Smith TF, Waterman MS: Identification of common molecularsubsequences. J Mol Biol 1981, 147:195-7.
Page 10 of 10(page number not for citation purposes)