bmc plant biology biomed central - core · bmc plant biology research article open ... the...
TRANSCRIPT

BioMed CentralBMC Plant Biology
ss
Open AcceResearch articleEST analysis of the scaly green flagellate Mesostigma viride (Streptophyta): Implications for the evolution of green plants (Viridiplantae)Andreas Simon†1, Gernot Glöckner†2, Marius Felder2, Michael Melkonian1 and Burkhard Becker*1Address: 1Botanical Institute, University of Cologne, Gyrhofstr. 15, 50931 Cologne, Germany and 2Genome Analysis, Leibniz Institute for Age Research – Fritz Lipmann Institute, Beutenbergstr. 11, 07745 Jena, Germany
Email: Andreas Simon - [email protected]; Gernot Glöckner - [email protected]; Marius Felder - [email protected]; Michael Melkonian - [email protected]; Burkhard Becker* - [email protected]
* Corresponding author †Equal contributors
AbstractBackground: The Viridiplantae (land plants and green algae) consist of two monophyletic lineages,the Chlorophyta and the Streptophyta. The Streptophyta include all embryophytes and a small butdiverse group of freshwater algae traditionally known as the Charophyceae (e.g. Charales,Coleochaete and the Zygnematales). The only flagellate currently included in the Streptophyta isMesostigma viride Lauterborn. To gain insight into the genome evolution in streptophytes, we havesequenced 10,395 ESTs from Mesostigma representing 3,300 independent contigs and comparedthe ESTs of Mesostigma with available plant genomes (Arabidopsis, Oryza, Chlamydomonas), with ESTsfrom the bryophyte Physcomitrella, the genome of the rhodophyte Cyanidioschyzon, the ESTs fromthe rhodophyte Porphyra, and the genome of the diatom Thalassiosira.
Results: The number of expressed genes shared by Mesostigma with the embryophytes (90.3 % ofthe expressed genes showing similarity to known proteins) is higher than with Chlamydomonas (76.1%). In general, cytosolic metabolic pathways, and proteins involved in vesicular transport,transcription, regulation, DNA-structure and replication, cell cycle control, and RNA-metabolismare more conserved between Mesostigma and the embryophytes than between Mesostigma andChlamydomonas. However, plastidic and mitochondrial metabolic pathways, cytoskeletal proteinsand proteins involved in protein folding are more conserved between Mesostigma andChlamydomonas than between Mesostigma and the embryophytes.
Conclusion: Our EST-analysis of Mesostigma supports the notion that this organism should be asuitable unicellular model for the last flagellate common ancestor of the streptophytes. Mesostigmashares more genes with the embryophytes than with the chlorophyte Chlamydomonas reinhardtii,although both organisms are flagellate unicells. Thus, it seems likely that several major physiologicalchanges (e.g. in the regulation of photosynthesis and photorespiration) took place early during theevolution of streptophytes, i.e. before the transition to land.
Published: 13 February 2006
BMC Plant Biology2006, 6:2 doi:10.1186/1471-2229-6-2
Received: 31 October 2005Accepted: 13 February 2006
This article is available from: http://www.biomedcentral.com/1471-2229/6/2
© 2006Simon et al; licensee BioMed Central Ltd.This is an Open Access article distributed under the terms of the Creative Commons Attribution License (http://creativecommons.org/licenses/by/2.0), which permits unrestricted use, distribution, and reproduction in any medium, provided the original work is properly cited.
Page 1 of 13(page number not for citation purposes)

BMC Plant Biology 2006, 6:2 http://www.biomedcentral.com/1471-2229/6/2
BackgroundThe Viridiplantae (literally meaning green plants) includeall green algae and embryophyte plants. They represent amonophyletic group of organisms, which display a sur-prising diversity with respect to their morphology, cellarchitecture, life histories and reproduction, and their bio-chemistry. The colonization of the terrestrial habitat bystreptophyte algae 450 – 470 million years ago [reviewedin [1]] was undoubtedly one of the most important stepsin the evolution of life on earth [2-4], which paved theway for the evolution of the various groups of land plants(embryophytes = bryophytes, pteridophytes and spermat-ophytes) resulting in our current terrestrial ecosystems [5].
A thorough understanding of the evolution of land plantsrequires knowledge about the phylogeny of green algaeand embryophytes as well as insight into the evolution ofplant genomes with special reference to developmentalprocesses. Whereas our knowledge about the phylogenyof the Viridiplantae has greatly increased over the lastyears, the latter has hardly been addressed to date.
The Viridiplantae are grouped into two divisions: theChlorophyta and the Streptophyta [6]. The Chlorophytacomprise the vast majority of green algae including mostscaly green flagellates (e.g. Pyramimonas, Tetraselmis), theUlvophyceae (e.g. Ulva, Acetabularia), Chlorophyceae (e.g.Chlamydomonas, Volvox) and Trebouxiophyceae (e.g. Chlo-rella) [7,8]. The Streptophyta include all embryophyteplants and a diverse paraphyletic assemblage of freshwatergreen algae, the Charales (stoneworts), Coleochaete, theZygnematophyceae and a few other taxa [9]. Currently,the Charales are thought to be the sister group of theembryophytes suggesting that the evolution of true landplants already started with a complex organism [10].Remarkably, only a single scaly green flagellate Mesostigmaviride Lauterborn, has been found to belong to the Strep-tophyta [10-13]. The exact phylogenetic position of Mes-ostigma viride, however, is still controversial [10-12,14-16]. Mesostigma has recently attracted much attention as aputative key organism for the understanding of the earlyevolution of the Streptophyta [17-20].
Two aspects in the evolution of land plants seem to beimportant in this respect. First, many key evolutionaryinventions of plants took already place within the strepto-phyte algae. According to Graham et al. [21] one can dis-tinguish several major transitions in the evolution of landplants starting with a Mesostigma-like flagellate ancestor:development of a cellulosic cell wall, multicellularity,cytokinesis by a phragmoplast, plasmodesmata, apicalmeristematic cell and apical cell proliferation leading tobranching, asymmetric cell division, cell differentiation,retention of zygotes, heteromorphic life history, and aroot meristem. Of these distinguishing features only thelatter two evolved not until the embryophytes emerged.Second, the colonization of the terrestrial habitat with itsexposure to air, increased solar radiation and life in a des-iccating environment led to adaptations of cell architec-ture, metabolism and body plan to survive in theterrestrial ecosystems [5]. The evolutionary history ofthese adaptations is currently not known. Important ques-tions are: How did the green algal progenitor adapt to theterrestrial habitat? Which genomic changes were associ-ated with this transition? And which of these genes arederived from streptophyte green algae? To gain insightinto these questions we have started to analyze ESTs fromvarious streptophyte algal lineages.
Here, we present an analysis of 10,395 ESTs representing3306 non-redundant expressed genes obtained from Mes-ostigma viride. We show that the number of genes shared ishigher between Mesostigma and the embryophytes thanbetween Mesostigma and Chlamydomonas. Comparison ofexpressed genes from Mesostigma with the genomes of Ara-bidopsis, Chlamydomonas, the red alga Cyanidioschyzon, andrice as well as ESTs from Physcomitrella and Porphyraallowed us to identify conserved and derived cellular func-tions within the different evolutionary lines and to obtaina first insight into the metabolic capabilities of the flagel-late ancestor of green plants.
ResultsPreparation and characterization of librariesTotal RNA was isolated from an axenic culture of Mes-ostigma viride during the light phase. The culture con-
Table 1: Mesostigma viride cDNA libraries used.
Name cDNA Number of primary clones
Percentage recombinant clones
size of inserts1 (bp) average size of inserts1 (bp)
number of ESTs sequenced
Meso1 small size fraction 310 000 90 250–2000 706 100Meso2 large size fraction 295 000 88 600–3200 1142 4954Meso3 total cDNA
normalized106 000 63 100–1100 650 535
Meso4 large size fraction normalized
304 000 56 400–6600 2025 2403 cDNAs = 4806 ESTs2
1 determined by agarose gel electrophoresis, 2sequenced from 3' and 5'end
Page 2 of 13(page number not for citation purposes)

BMC Plant Biology 2006, 6:2 http://www.biomedcentral.com/1471-2229/6/2
tained about 5 % cell division stages. The isolated RNAwas used for the construction of 4 different cDNA libraries(Meso 1 – Meso 4). Meso 1 and 2 differed in the size of thecloned inserts. For Meso 3 and 4 full-length enrichedcDNA was prepared and normalized prior to cloning.Meso 3 was obtained from the total normalized full-length enriched cDNA, whereas for Meso 4 the normal-ized full-length enriched cDNA was size-fractionated bygel permeation chromatography to remove small frag-ments. The basic characteristics of the four libraries aregiven in Table 1.
Initially, about 100–500 ESTs were sequenced from alllibraries and analyzed by BLASTX against the Swissprotand translated Genbank databases. Since the Meso 2 and4 libraries containing the larger inserts gave more promis-ing results, we subsequently sequenced about 4000 addi-tional ESTs from the Meso 2 and Meso 4 libraries,respectively yielding a total of 10,395 reads (5,527,413bp). Based on comparison with published sequences fromMesostigma viride the rate of sequencing error was deter-mined to be generally between 1% and 7 % (average 4 %)depending on the quality of the sequence.
ESTs were assembled using the PHRAP software yielding3300 contigs with an average size of 769 bases (57 – 4452bases) after manual curation. Further analysis based onsequence similarity searches revealed that 294 of thesecontigs were of plastidic, mitochondrial, or possibly bac-terial origin (sequences showing the highest similarity toorganellar or bacterial genomes, Table 2). These contigs
were excluded from the data set. 1315 of the 3006 contigsanalyzed (44%) showed significant similarity at the pro-tein level to sequences from the public databases (Table2). Hence, approximately 56% of the contigs representeither novel sequences with unknown function oruntranslated regions of a gene. However, when the 1691contigs with no significant similarity to known proteinswere searched against the Interpro protein motif database,574 (33.9%) of these contigs contained a recognizableprotein motif (Table 2). The most common protein motifsfound in all 3006 expressed gene sequences were bipartitenuclear localization signals (IPR001472, 197x), proline-rich regions (IPR000694, 150x) and cytochrome c heme-binding sites (IPR000345, 99x).
Table 3: Functional classification of 3006 Mesostigma viride contigs using the KOG system [43] and an expectation threshold of e = 10-7.
Functional Category No. of Contigs
INFORMATION STORAGE AND PROCESSING 236[J] Translation, ribosomal structure and biogenesis 168[A] RNA processing and modification 28[K] Transcription 26[L] Replication, recombination and repair 9[B] Chromatin structure and dynamics 5
CELLULAR PROCESSES AND SIGNALING 209[D] Cell cycle control, cell division, chromosome partitioning
7
[Y] Nuclear structure 0[V] Defense mechanisms 2[T] Signal transduction mechanisms 31[M] Cell wall/membrane/envelope biogenesis 9[N + Z] Cytoskeleton and cell motility 18[W] Extracellular structures 0[U] Intracellular trafficking, secretion, and vesicular transport
41
[O] Posttranslational modification, protein turnover, chaperones
101
METABOLISM 212[C] Energy production and conversion 87[G] Carbohydrate transport and metabolism 35[E] Amino acid transport and metabolism 24[F] Nucleotide transport and metabolism 9[H] Coenzyme transport and metabolism 13[I] Lipid transport and metabolism 21[P] Inorganic ion transport and metabolism 16[Q] Secondary metabolites biosynthesis, transport and catabolism
7
POORLY CHARACTERIZED 158[R] General function prediction only 55[S] Function unknown 37[X] Unnamed protein 66Unknown 2191
Table 2: Summary of Mesostigma viride expressed genes obtained from four cDNA libraries (Meso 1 – Meso 4).
Category No of contigs
Mitochondrial1 36Plastidic1 65Bacterial2 193Novel 1691
with recognizable protein motif 574no protein motifs 1117
Similarity 1315with known function3 574unknown function4 395low similarity5 346
Total Contigs 3300
1 sequences showing only similarity to organelle genomes. 2 sequences showing only similarity to bacterial sequences or the highest similarity to bacterial sequences; the origin of these putative bacterial contaminations is currently not clear, as bacteria-free cultures of Mesostigma were used. 3similarity to proteins with a well-defined function (BLAST score >100). 4similarity to conserved proteins with no established function (BLAST score >100). 5low similarity to proteins from a few organisms (BLAST score generally between 100 and 200); might reflect conserved protein domains.
Page 3 of 13(page number not for citation purposes)

BMC Plant Biology 2006, 6:2 http://www.biomedcentral.com/1471-2229/6/2
A functional catalogue was assembled using the 3006 Mes-ostigma contigs and the KOG-database and is presented inTable 3. As expected for an interphase cell, genes in thecategories (1) translation, ribosomal structure and bio-genesis (168), (2) posttranslational modification, proteinturnover, chaperones (101), and (3) energy productionand conversion (87) are represented by the largestnumber of contigs (Table 3). In the following, the assem-bled contigs are referred to as (expressed) genes.
Classification of Mesostigma ESTs according to homologous genes in other organismsEST data represent only a fraction of all genes of an organ-ism. Thus, comparisons of EST data alone cannot be usedto describe unique or shared genes of an organism. Forembryophytes, chlorophytes and red algae completegenome sequences of at least one organism exist. Thismakes it possible to find potential orthologous genes ifpresent. Moreover, the surplus of genes of an organism inrespect to a complete genome can be detected in EST data.In tBLASTX analyses of the 1315 expressed genes withsimilarity to known proteins 90.3 % matched proteinsfrom streptophytes, 76.1 % from chlorophytes and 61 %
from rhodophytes, respectively. In addition, 46 genesshowed similarity to known proteins, which have notbeen reported from plants or red algae to date. The over-lap of Mesostigma genes with different organisms can bevisualized in a Venn diagram (Figure 1). For 211 genes, wedetected similar proteins only within the streptophyte butnot in the chlorophyte or rhodophyte lineages. Con-versely, for 62 genes we detected similar proteins onlywithin the chlorophyte but not in the streptophyte or rho-dophyte lineages. Surprisingly, we also found 6 geneswhich showed significant similarity to rhodophyte pro-teins but for which we could not detect any similar pro-tein sequences within the Viridiplantae. Removal ofBLAST hits with significant but low similarity (see Table 2)reduced the overall numbers to 972 expressed genes, butgave similar results (Figure 1). A complete list of genesshowing only similarity to proteins with known functionspresent in specific subgroups of organisms can be foundin supplemental Table 1 [see Additional file 1]. We willdiscuss important differences below.
Overall protein similarities between various photoautotrophic organismsTo compare the overall similarity between Mesostigma andvarious photoautotrophic organisms with completedgenomes or large data sets of ESTs, we decided to calculatethe average identity of a protein between Mesostigma andthe various organisms. To compare Mesostigma genes withthe genomes or ESTs from different organisms, we calcu-lated the average identity (AI) between Mesostigma andanother organism as the mean value of all pair wise iden-tities of the BLAST-matches for each organism (Table 4).
The AI between Mesostigma and Chlamydomonas or theembryophytes are very similar. The highest AI valueobtained was for Physcomitrella/Mesostigma followed byArabidopsis/Mesostigma, Chlamydomonas/ Mesostigma andOryza/Mesostigma. The full data set includes many pro-teins, which we detected only in some species using Mes-ostigma expressed genes as a query. Therefore, weconstructed a constrained data set (314 expressed genes,including at least 46 nuclear encoded plastidic, 9 nuclearencoded mitochondrial, and 73 cytosolic ribosomal pro-teins), containing only Mesostigma genes which gavematches with all completed genomes from photoau-totrophic eukaryotic organisms (including the diatomThalassiosira). This constrained data set represents a con-served core set of nuclear encoded expressed proteinsfrom photoautotrophic eukaryote organisms. We calcu-lated AI values for the constrained data set using completegenomes and the available ESTs of Physcomitrella, Por-phyra, and Chlamydomonas. The results are included inTable 4. We obtained the highest AI-values in the con-strained data set for the three embryophytes, followed byChlamydomonas. The similar AI values for the three differ-
Classification of expressed genes from Mesostigma according to the presence of similar proteins in other organisms in a Venn diagramFigure 1Classification of expressed genes from Mesostigma according to the presence of similar proteins in other organisms in a Venn diagram. All non-redundant expressed genes were used as a query in (t)blastx similarity searches with the Swissprot, Genbank, Chlamydomonas, Cya-nidioschyzon, Porphyra, Physcomitrella, Arabidopsis and Oryza data sets. The outermost circle represents all Mesostigma expressed genes. The inner circles, which are labeled chloro-phyte, streptophyte and rhodophyte, represent genes, which have similarity to chlorophyte, streptophyte or rhodophyte sequences, respectively. The areas depicted are not propor-tional to the gene numbers and the number of Mesostigma expressed genes in each category is written in each segment. Numbers in brackets indicate the number of expressed genes in a category after removal of low similarity hits (see Table 2 for a definition of low similarity hits).
Page 4 of 13(page number not for citation purposes)

BMC Plant Biology 2006, 6:2 http://www.biomedcentral.com/1471-2229/6/2
ent embryophytes suggest that the overall evolutionaryrate was very similar for the embryophytes investigated,when compared with Mesostigma (see below).
To test whether the observed differences are significant apaired students t-test was performed, and the results areshown in Table 5. Applying a significance level of 0.0072[0.05/7 Bonferroni adjustment [22]] the differences in AIbetween Mesostigma/Chlamydomonas and Mesostigma/embryophytes are highly significant (Table 5), whereasthe differences in AI among the embryophytes are not sig-nificant (Table 5). Furthermore, when we varied the num-bers of expressed genes used for the calculation of the AI,we observed that when more than 100 ESTs were includedthe significance of the differences became very stable (Fig.2A). In addition, to evaluate the consistency of the data setwe calculated 8 times the AI for 150 randomly selected
expressed genes from the constrained data set. A clear dif-ference between the AI from the various organisms wasalways observed (Fig. 2B 1 – 8). The expression level of theexpressed genes (as revealed by the number ESTs in a con-tig) had no effect on the differences between the investi-gated organisms (Fig. 2B, compare 9 and 10), althoughhighly expressed genes are better conserved (Fig. 2B, 9 and10).
Two other results are remarkable. First, for the calculationof the AI it is possible to use large EST-data sets instead ofgenomes. We obtained the same result for Mesostigma/Chlamydomonas genome and for Mesostigma/Chlamydomonas ESTs (AI = 0.653 for both data sets; p =0,975, Table 5, using 244 expressed genes from Mes-ostigma). Similarly, when Mesostigma/Physcomitrella ESTswere compared with the Mesostigma/Arabidopsis genome
Table 5: Statistical significance of the obtained AI values. A paired students t-test was performed for the constrained data set to test whether the observed differences between the average identity of pair wise comparisons of Mesostigma expressed genes with the indicated organismal data set are significant. Differences are considered significant when p is < 0.0071 (0.05/8 Bonferroni adjustment [22]).
Variable1 No. of genes shared2
mean3 standard deviation4
t-value Degrees of freedom
ρ
1 Mesostigma/Chlamydomonas G Mesostigma/Chlamydomonas E
244 0.652992 0.652992
0.149868 0.151255
-0,03107 243 0.975239
2 Mesostigma/Chlamydomonas G Mesostigma/Physcomitrella E
301 0.649934 0.674618
0.149292 0.153641
-3.24578 300 0.001304
3 Mesostigma/Chlamydomonas G Mesostigma/Arabidopsis G
314 0.648057 0.677994
0.148512 0.140940
-4.44025 313 0.000012
4 Mesostigma/Chlamydomonas G Mesostigma./Oryza G
314 0.648057 0.670382
0.148512 0.148384
-3.15371 313 0.001768
5 Mesostigma/Physcomitrella E Mesostigma/Arabidopsis G
302 0.675364 0.681159
0.153933 0.140567
-135783 301 0.175535
6 Mesostigma/Physcomitrella E Mesostigma./Oryza G
302 0.675364 0.673311
0.153933 0.147624
0,43158 301 0.666355
7 Mesostigma/Arabidopsis G Mesostigma./Oryza G
314 0.678730 0.671175
0.141321 0.148813
2.480053 313 0.013660
1 Compared data sets E = ESTs, G = Genome. 2 No. of genes shared between the compared data sets. 3 AI recalculated on the basis of the genes shared between the compared datasets. 4 Standard deviation of 3.
Table 4: Comparison of the Mesostigma expressed genes with the genomes and ESTs from various organisms. Average identity (AI) of pair wise comparisons of Mesostigma expressed genes with the indicated organismal data set.
Data set (No. of contigs)
Chlamydomonas Cyanidioschyzon Porphyra Thalassiosira Physcomitrella Arabidopsis Oryza
Genome EST Genome EST Genome EST Genome Genome
All (969) 0.573 0.563 0.522 0.528 0.528 0.590 0.577 0.565Constrained (314) 0.648 0.653 (n = 244)1) 0.557 0.585 (n = 188)1) 0.569 0.675 (n = 301)1) 0.679 0.671Evolutionary distance D2)
0.473 0.463 0.658 0.597 0.631 0.425 0.418 0.432
The total data set contains all Mesostigma expressed genes with significant similarity to proteins from other organisms with known or unknown function (see Table 2). The constrained data set contains only Mesostigma expressed genes with significant similarity to proteins in all completely sequenced eukaryotic autotroph organisms.1) Number of ESTs showing similarity to Mesostigma expressed genes from the constrained data set in a tBLASTX analysis. 2) Evolutionary distances were calculated using the constrained data set and the approximation given by Kimura [28]: D = -ln (1 - p - 0.2 p2), where p is the fraction of amino acid that differs between the two species.
Page 5 of 13(page number not for citation purposes)

BMC Plant Biology 2006, 6:2 http://www.biomedcentral.com/1471-2229/6/2
and with the Mesostigma/Oryza genome only small differ-ences were observed (AI = 0,675/0,681; 0,675/0,673respectively, using 302 expressed genes from Mesostigma,Table 5). Statistical analysis (paired students t-test)showed that the observed differences are not significant.Furthermore, we note that the genome of the diatom Tha-lassiosira pseudonana shows a similar AI in respect to Mes-ostigma as the red algal genome and ESTs (Table 4). Thedifference values of these distantly related genomes repre-sent presumably an upper threshold for reasonable AIvalue calculations.
Analysis of metabolic pathwaysESTs have been widely used for the identification of met-abolic pathways [23]. A complete list of all metabolicpathways identified is presented in supplemental Table 2[see Additional file 2]. Indeed, many ESTs showed similar-ity to proteins required for photosynthesis (66 expressedgenes), nucleotide synthesis (6), nucleotide sugar conver-sion, the biosynthesis of precursors of scale polysaccha-rides (6), heme and chlorophyll biosynthesis (6), fattyacid and lipid biosynthesis (9), terpenoid biosynthesis(6), glycolysis (11) and the TCA-cycle including pyruvatedehydrogenase and respiration (12). The biosyntheticpathways for several amino acids were also well repre-sented in our ESTs (21 expressed genes for Ala, Arg, Gly,Ile, Leu, Lys, Pro, Ser, Thr, Trp and Val). However, for sev-eral other amino acids (Asn, Asp, Cys, Gln, Glu, His, Met,Phe, Tyr) we did not find a single EST which could bematched to the known biosynthetic pathways.
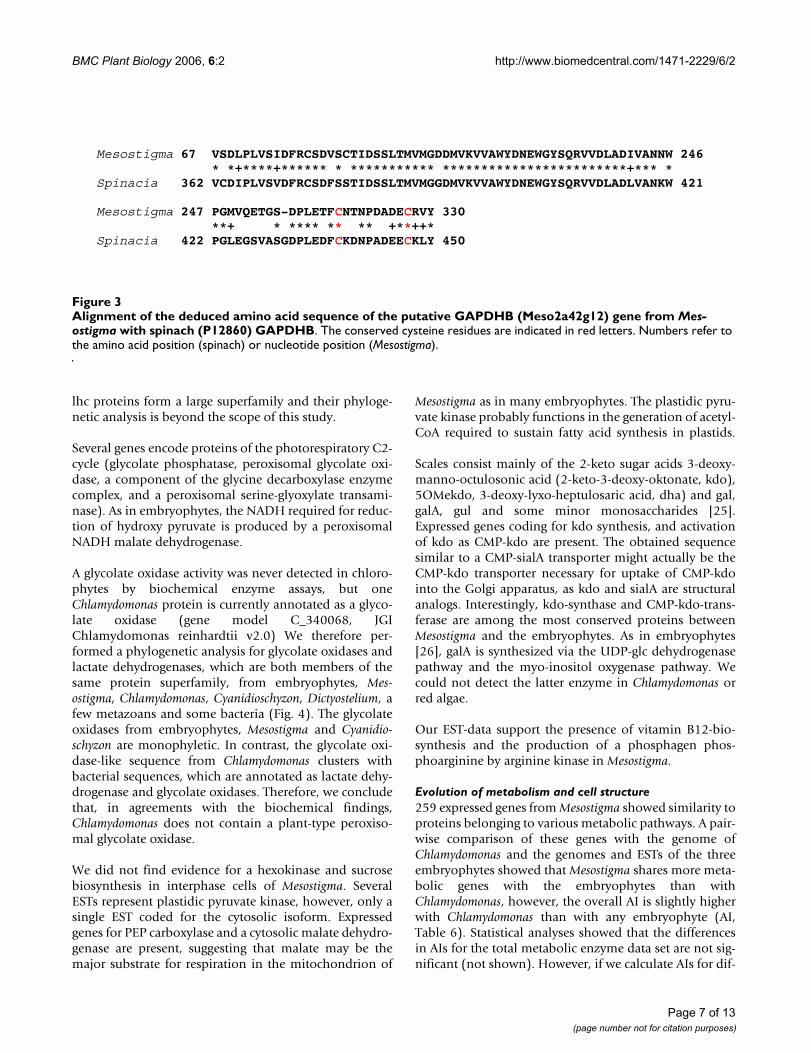
All enzymes except one (triose isomerase) of the Calvincycle are represented by at least one EST. Interestingly, wefound several genes coding for subunits of the plastidicGAPDH. In angiosperms the plastidic GAPDH consists ofan A2B2 heterotetramer [24]. Compared to GAPDH A,which is present in the plastids of all eukaryotic algae,GAPDH B has a C-terminal extension that contains thetwo conserved cysteine residues, which are required forregulation by the thioredoxin system. To our knowledge,GAPDH B has only been reported from streptophytes.Two genes of Mesostigma showed significant similarity toGAPDH B from angiosperms. We present an alignment ofthe C-terminus of Mesostigma GAPDH B with the C-termi-nus of spinach GAPDH B in Figure 3. The two sequencesare very similar and the two cysteines required for regula-tion by the thioredoxin system are conserved in Mes-ostigma indicating that the activity of plastidic GAPDHcame under the control of the thioredoxin system earlyduring the evolution of streptophytes. We found no evi-dence for a GAPDH B in Chlamydomonas or other chloro-phytes. Therefore, the evolution of a GAPDH B mightrepresent a molecular characteristic (synapomorphy) ofthe streptophytes.
A total of 25 expressed genes encode components of thelight-harvesting complex. There are some light-harvestingcomplex proteins, which Mesostigma shares only with thechlorophytes and red algae (e.g. so called fucoxanthin/chlorophyll a-binding proteins). For others, we detectedsimilar proteins only within embryophytes. However, the
Consistency of the constrained data set used to calculate AI valueFigure 2Consistency of the constrained data set used to calculate AI values. (A) The figure illustrates the effect of the number of genes included in the AI-values. The significant differences in the AI values are stable when more than 150 genes are included. (B) 150 genes were resampled randomly and the AIs calculated for the indicated organisms (1 – 8). AI values were calculated for the 150 most strongly (9, as revealed by the number of ESTs in a contig) and weakly (10, only single ESTs) expressed genes.
Page 6 of 13(page number not for citation purposes)
BMC Plant Biology 2006, 6:2 http://www.biomedcentral.com/1471-2229/6/2
lhc proteins form a large superfamily and their phyloge-netic analysis is beyond the scope of this study.
Several genes encode proteins of the photorespiratory C2-cycle (glycolate phosphatase, peroxisomal glycolate oxi-dase, a component of the glycine decarboxylase enzymecomplex, and a peroxisomal serine-glyoxylate transami-nase). As in embryophytes, the NADH required for reduc-tion of hydroxy pyruvate is produced by a peroxisomalNADH malate dehydrogenase.
A glycolate oxidase activity was never detected in chloro-phytes by biochemical enzyme assays, but oneChlamydomonas protein is currently annotated as a glyco-late oxidase (gene model C_340068, JGIChlamydomonas reinhardtii v2.0) We therefore per-formed a phylogenetic analysis for glycolate oxidases andlactate dehydrogenases, which are both members of thesame protein superfamily, from embryophytes, Mes-ostigma, Chlamydomonas, Cyanidioschyzon, Dictyostelium, afew metazoans and some bacteria (Fig. 4). The glycolateoxidases from embryophytes, Mesostigma and Cyanidio-schyzon are monophyletic. In contrast, the glycolate oxi-dase-like sequence from Chlamydomonas clusters withbacterial sequences, which are annotated as lactate dehy-drogenase and glycolate oxidases. Therefore, we concludethat, in agreements with the biochemical findings,Chlamydomonas does not contain a plant-type peroxiso-mal glycolate oxidase.
We did not find evidence for a hexokinase and sucrosebiosynthesis in interphase cells of Mesostigma. SeveralESTs represent plastidic pyruvate kinase, however, only asingle EST coded for the cytosolic isoform. Expressedgenes for PEP carboxylase and a cytosolic malate dehydro-genase are present, suggesting that malate may be themajor substrate for respiration in the mitochondrion of
Mesostigma as in many embryophytes. The plastidic pyru-vate kinase probably functions in the generation of acetyl-CoA required to sustain fatty acid synthesis in plastids.
Scales consist mainly of the 2-keto sugar acids 3-deoxy-manno-octulosonic acid (2-keto-3-deoxy-oktonate, kdo),5OMekdo, 3-deoxy-lyxo-heptulosaric acid, dha) and gal,galA, gul and some minor monosaccharides [25].Expressed genes coding for kdo synthesis, and activationof kdo as CMP-kdo are present. The obtained sequencesimilar to a CMP-sialA transporter might actually be theCMP-kdo transporter necessary for uptake of CMP-kdointo the Golgi apparatus, as kdo and sialA are structuralanalogs. Interestingly, kdo-synthase and CMP-kdo-trans-ferase are among the most conserved proteins betweenMesostigma and the embryophytes. As in embryophytes[26], galA is synthesized via the UDP-glc dehydrogenasepathway and the myo-inositol oxygenase pathway. Wecould not detect the latter enzyme in Chlamydomonas orred algae.
Our EST-data support the presence of vitamin B12-bio-synthesis and the production of a phosphagen phos-phoarginine by arginine kinase in Mesostigma.
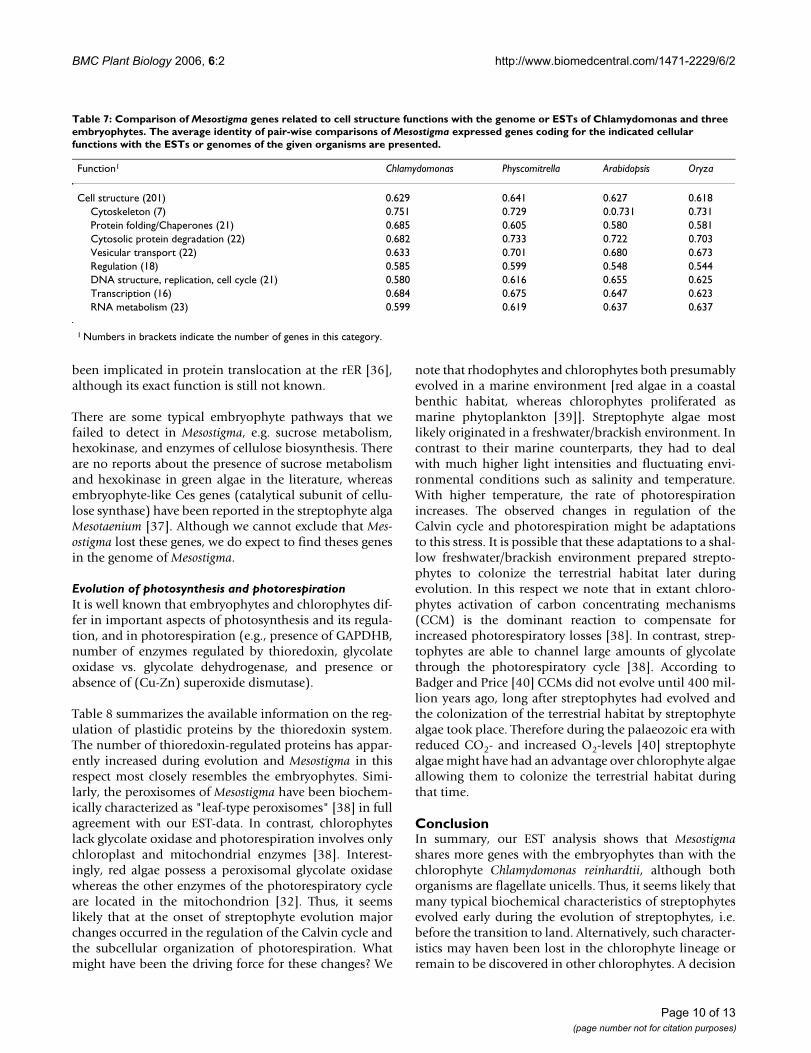
Evolution of metabolism and cell structure259 expressed genes from Mesostigma showed similarity toproteins belonging to various metabolic pathways. A pair-wise comparison of these genes with the genome ofChlamydomonas and the genomes and ESTs of the threeembryophytes showed that Mesostigma shares more meta-bolic genes with the embryophytes than withChlamydomonas, however, the overall AI is slightly higherwith Chlamydomonas than with any embryophyte (AI,Table 6). Statistical analyses showed that the differencesin AIs for the total metabolic enzyme data set are not sig-nificant (not shown). However, if we calculate AIs for dif-
Alignment of the deduced amino acid sequence of the putative GAPDHB (Meso2a42g12) gene from Mesostigma with spinach (P12860) GAPDHBFigure 3Alignment of the deduced amino acid sequence of the putative GAPDHB (Meso2a42g12) gene from Mes-ostigma with spinach (P12860) GAPDHB. The conserved cysteine residues are indicated in red letters. Numbers refer to the amino acid position (spinach) or nucleotide position (Mesostigma).
Mesostigma 67 VSDLPLVSIDFRCSDVSCTIDSSLTMVMGDDMVKVVAWYDNEWGYSQRVVDLADIVANNW 246 * *+****+****** * *********** ************************+*** * Spinacia 362 VCDIPLVSVDFRCSDFSSTIDSSLTMVMGGDMVKVVAWYDNEWGYSQRVVDLADLVANKW 421
Mesostigma 247 PGMVQETGS-DPLETFCNTNPDADECRVY 330 **+ * **** ** ** +**++*Spinacia 422 PGLEGSVASGDPLEDFCKDNPADEECKLY 450
Page 7 of 13(page number not for citation purposes)

BMC Plant Biology 2006, 6:2 http://www.biomedcentral.com/1471-2229/6/2
ferent functional categories separately, we see thatmetabolic enzymes of the chloroplasts and mitochondria(photosynthesis except the Calvin cycle enzymes, fattyacid synthesis, synthesis of some amino acids, citric acidcycle, and respiration) were generally more conservedbetween Mesostigma and Chlamydomonas than betweenMesostigma and the embryophytes (Table 6). In contrast,proteins of cytosolic pathways (nucleotide metabolism,NDP-sugar metabolism, and glycolysis) in Mesostigmawere more similar to embryophyte proteins (Table 6),
Genes coding for information storage and processing, andcellular processes and signaling (Table 3) were overallmore conserved between Mesostigma and the embryo-phytes than between Mesostigma and Chlamydomonas.Exceptions to this rule are proteins of the cytoskeleton(Table 7) and proteins involved in protein folding (chap-
erones, Table 7) and plastidic proteases (not shown),which show higher AI values with Chlamydomonas thanwith the embryophytes. If the cytoskeletal proteins areremoved from the data set, the differences between Mes-ostigma/Chlamydomonas genome and Mesostigma/embryo-phytes are statistical significant (p = 0.000109 forMesostigma/Chlamydomonas versus Mesostigma/Phys-comitrella; p = 0.000703 for Mesostigma/Chlamydomonasversus Mesostigma/Arabidopsis, p = 0.006937 for Mes-ostigma/Chlamydomonas versus Mesostigma/Oryza).Remarkably, the three embryophytes behave differently inour analysis. We obtained higher AI values with Phys-comitrella regarding the categories protein folding (chaper-ones), vesicular transport, transcription, and regulation(Table 7). In contrast, proteins related to DNA structure,replication, cell cycle and RNA-metabolism were moreconserved between Mesostigma and the angiosperms Ara-bidopsis and Oryza than between Mesostigma and Phys-comitrella (Table 7).
DiscussionIn this study, we have analyzed about 3000 expressedgenes from the scaly green flagellate Mesostigma viride. Wecompared the expressed genes with the completegenomes from the angiosperms Arabidopsis thaliana andOryza sativa, the chlorophyte Chlamydomonas reinhardtii,the red alga Cyanidioschyzon merolae and the diatom Tha-lassiosira pseudonana, as well as the ESTs from the mossPhyscomitrella patens, and the red alga Porphyra yezoensis.Altogether, the Mesostigma proteome is more similar tothe embryophytes than to Chlamydomonas, although Mes-ostigma and Chlamydomonas are both flagellate unicells.Mesostigma shares more genes with the embryophytesthan with Chlamydomonas, including several enzymes con-fined to the streptophytes (e.g. GAPDH B, [Cu-Zn] super-oxide dismutase), and the average identity of sharedproteins is higher between Mesostigma and the embryo-phytes than between Mesostigma and Chlamydomonas.Therefore, we consider Mesostigma to be a member of thestreptophytes, although Mesostigma clearly shares someancestral characters with chlorophytes. Plastidic (with theexception of the Calvin cycle) and mitochondrial func-tions e.g. seem to be more conserved between Mesostigmaand chlorophytes than between Mesostigma and embryo-phytes, i.e. these functions are more derived in embryo-phytes, probably due to adaptation of embryophytes tothe terrestrial habitat. In contrast, other cellular functionsexcept for the cytoskeleton are more conserved betweenMesostigma and embryophytes than between Mesostigmaand Chlamydomonas. Interestingly, in previous phyloge-netic analyses plastidic and mitochondrial genes failed toshow a clear relationship between Mesostigma and thestreptophytes [14,15], whereas actin and nuclear-encodedSSU rDNA phylogenies support the notion that Mes-ostigma is a member of the streptophytes [10-12]. The dif-
Phylogenetic tree of glycolate oxidase and glycolate oxidase-like genesFigure 4Phylogenetic tree of glycolate oxidase and glycolate oxidase-like genes. The tree shown was derived by Baye-sian inference analysis from 402 amino acid positions using a mixed model for amino acid substitutions and a gamma cor-rection for rate variation among sites. The Bayesian inference utilized MRBAYES, Ver. 3.0 * with posterior probabilities derived from 100000 generations and discarding a burnin of 1000. The tree obtained with a parsimony analysis using PHYLIP gave essentially the same topology.
Page 8 of 13(page number not for citation purposes)
BMC Plant Biology 2006, 6:2 http://www.biomedcentral.com/1471-2229/6/2
ferent evolutionary rates for different cellular functionsobserved in this study might explain this discrepancy.
We calculated the average identity (AI) values from auto-matically generated BLAST output alignments. Automati-cally derived alignments are prone to errors. However, webelieve that our approach is justified for the following rea-sons: (1) the BLAST alignments cover only the conservedparts of proteins and our calculated AI values indicate thatin most alignments more than half of the amino acids areidentical enhancing the quality of the automatically pro-duced alignments; (2) although small mistakes mayoccur, they are insignificant given the high number ofamino acids used to calculate the AI. On average theBLAST alignments contained about 150 amino acids andtherefore about 45,000 amino acid positions were used inthe constrained data set. In large data sets small unbiasederrors become irrelevant [27]. Our results indicate that atleast 100 (better are 150–200) expressed genes have to beused to obtain statistically significant results. It could beargued that our analysis uses only similarity values and noreal evolutionary distances. AI values can be easily con-verted into evolutionary distances using an approxima-tion given by Kimura [28], with the effect that thedifferences between the various organisms become largerbut no changes occur in the order of relatedness (includedin Table 4). We conclude that the AI of proteins sharedbetween different organisms represents a reasonablemeasure of evolutionary relatedness, if sufficiently largedata sets are used.
In the following, we briefly discuss some major differ-ences in coding potential observed between the differentphotosynthetic eukaryotic organisms.
11 of 18 proteins included in supplemental Table 1 [seeAdditional file 1] which are shared only by Mesostigmaand Chlamydomonas are associated with flagellar functionssuch as axonemal dyneins or components of the IFT(intra-flagellar transport) machinery. Most likely, theangiosperms lost these proteins during evolution togetherwith the ability to produce flagellate cells. The absence ofthese proteins in the ESTs from the moss Physcomitrella, is
presumably due to the fact that ESTs from developingspermatozoids are not available.
Proteins shared by Mesostigma and the embryophytes butnot present in chlorophytes perform diverse functions.There are some well known biochemical differencesbetween chlorophytes and streptophytes such as the pres-ence of (Cu-Zn) superoxide dismutase [29,30] and glyco-late oxidase in streptophytes [31,32] but not inchlorophytes. In addition, streptophytes use the DXP andmevalonate pathways for isoprene biosynthesis whereaschlorophytes posses only the DXP pathway [33]. For allthese functions, we find molecular support in ourexpressed gene data set except for the mevalonate pathwayof isoprene biosynthesis. Two genes matched two differ-ent enzymes of the DXP pathway; however, no matchesfor the MVA pathway were obtained, although the pres-ence of this pathway has been demonstrated biochemi-cally [33]. This could be due to the selective expression ofone or the other pathway under different environmentalconditions.
Remarkably, our list of proteins uniquely shared by Mes-ostigma and the embryophytes includes several proteinsinvolved in steroid biosynthesis (e.g. a 3-oxo-5-beta-ster-oid dehydrogenase and a C-4 sterol oxidase), a homeoboxprotein of the knox family and proteins of the F-box fam-ily. The latter protein family underwent a dramatic expan-sion in the embryophytes (Arabidopsis has more than 700members of this family).
Our expressed protein data set contains sequences similarto a protein involved in vitamin B-12 metabolism(present in rhodophytes and chlorophytes), an argininekinase and a ARL6 protein, the latter two are absent inchlorophytes, embryophytes and red algae. It has beenshown that arginine kinase is part of the ATP regenerationsystem in cilia of Paramecium [34]. Chlamydomonas lacksarginine kinase and recently Pazour et al. [35] showedthat enzymes of the late glycolytic pathway are present inthe flagella of Chlamydomonas, suggesting that the ATPrequired for flagellar function is produced by the glyco-lytic pathway in Chlamydomonas. The ARL6 protein has
Table 6: Comparison of Mesostigma genes related to metabolic functions with Chlamydomonas and three embryophytes. The average identity (AI) of pair-wise comparisons of Mesostigma expressed genes coding for the indicated metabolic function with the ESTs or genome of the given organisms are presented.
Function1 Chlamydomonas Physcomitrella Arabidopsis Oryza
Metabolism (259) 0.613 0.601 0.593 0.594Plastidic metabolism (107)2 0,595 0,572 0,567 0,572Mitochondrial metabolism (16)2 0,647 0,593 0,569 0,578cytosolic metabolism (glycolysis, NDP-sugar metabolism, nucleotide synthesis, 22)2 0,568 0,639 0,641 0,632
1 Numbers in brackets indicate the number of genes in this category.
Page 9 of 13(page number not for citation purposes)
BMC Plant Biology 2006, 6:2 http://www.biomedcentral.com/1471-2229/6/2
been implicated in protein translocation at the rER [36],although its exact function is still not known.
There are some typical embryophyte pathways that wefailed to detect in Mesostigma, e.g. sucrose metabolism,hexokinase, and enzymes of cellulose biosynthesis. Thereare no reports about the presence of sucrose metabolismand hexokinase in green algae in the literature, whereasembryophyte-like Ces genes (catalytical subunit of cellu-lose synthase) have been reported in the streptophyte algaMesotaenium [37]. Although we cannot exclude that Mes-ostigma lost these genes, we do expect to find theses genesin the genome of Mesostigma.
Evolution of photosynthesis and photorespirationIt is well known that embryophytes and chlorophytes dif-fer in important aspects of photosynthesis and its regula-tion, and in photorespiration (e.g., presence of GAPDHB,number of enzymes regulated by thioredoxin, glycolateoxidase vs. glycolate dehydrogenase, and presence orabsence of (Cu-Zn) superoxide dismutase).
Table 8 summarizes the available information on the reg-ulation of plastidic proteins by the thioredoxin system.The number of thioredoxin-regulated proteins has appar-ently increased during evolution and Mesostigma in thisrespect most closely resembles the embryophytes. Simi-larly, the peroxisomes of Mesostigma have been biochem-ically characterized as "leaf-type peroxisomes" [38] in fullagreement with our EST-data. In contrast, chlorophyteslack glycolate oxidase and photorespiration involves onlychloroplast and mitochondrial enzymes [38]. Interest-ingly, red algae possess a peroxisomal glycolate oxidasewhereas the other enzymes of the photorespiratory cycleare located in the mitochondrion [32]. Thus, it seemslikely that at the onset of streptophyte evolution majorchanges occurred in the regulation of the Calvin cycle andthe subcellular organization of photorespiration. Whatmight have been the driving force for these changes? We
note that rhodophytes and chlorophytes both presumablyevolved in a marine environment [red algae in a coastalbenthic habitat, whereas chlorophytes proliferated asmarine phytoplankton [39]]. Streptophyte algae mostlikely originated in a freshwater/brackish environment. Incontrast to their marine counterparts, they had to dealwith much higher light intensities and fluctuating envi-ronmental conditions such as salinity and temperature.With higher temperature, the rate of photorespirationincreases. The observed changes in regulation of theCalvin cycle and photorespiration might be adaptationsto this stress. It is possible that these adaptations to a shal-low freshwater/brackish environment prepared strepto-phytes to colonize the terrestrial habitat later duringevolution. In this respect we note that in extant chloro-phytes activation of carbon concentrating mechanisms(CCM) is the dominant reaction to compensate forincreased photorespiratory losses [38]. In contrast, strep-tophytes are able to channel large amounts of glycolatethrough the photorespiratory cycle [38]. According toBadger and Price [40] CCMs did not evolve until 400 mil-lion years ago, long after streptophytes had evolved andthe colonization of the terrestrial habitat by streptophytealgae took place. Therefore during the palaeozoic era withreduced CO2- and increased O2-levels [40] streptophytealgae might have had an advantage over chlorophyte algaeallowing them to colonize the terrestrial habitat duringthat time.
ConclusionIn summary, our EST analysis shows that Mesostigmashares more genes with the embryophytes than with thechlorophyte Chlamydomonas reinhardtii, although bothorganisms are flagellate unicells. Thus, it seems likely thatmany typical biochemical characteristics of streptophytesevolved early during the evolution of streptophytes, i.e.before the transition to land. Alternatively, such character-istics may haven been lost in the chlorophyte lineage orremain to be discovered in other chlorophytes. A decision
Table 7: Comparison of Mesostigma genes related to cell structure functions with the genome or ESTs of Chlamydomonas and three embryophytes. The average identity of pair-wise comparisons of Mesostigma expressed genes coding for the indicated cellular functions with the ESTs or genomes of the given organisms are presented.
Function1 Chlamydomonas Physcomitrella Arabidopsis Oryza
Cell structure (201) 0.629 0.641 0.627 0.618Cytoskeleton (7) 0.751 0.729 0.0.731 0.731Protein folding/Chaperones (21) 0.685 0.605 0.580 0.581Cytosolic protein degradation (22) 0.682 0.733 0.722 0.703Vesicular transport (22) 0.633 0.701 0.680 0.673Regulation (18) 0.585 0.599 0.548 0.544DNA structure, replication, cell cycle (21) 0.580 0.616 0.655 0.625Transcription (16) 0.684 0.675 0.647 0.623RNA metabolism (23) 0.599 0.619 0.637 0.637
1 Numbers in brackets indicate the number of genes in this category.
Page 10 of 13(page number not for citation purposes)

BMC Plant Biology 2006, 6:2 http://www.biomedcentral.com/1471-2229/6/2
between these alternatives requires further informationon the genomes of other preferentially early branchingchlorophytes such as Pyramimonas.
Our EST-analysis of Mesostigma supports the notion thatthis organism should be a suitable unicellular model forthe last flagellate common ancestor of the streptophytes.
MethodsPlant material, RNA preparation and construction of librariesTotal RNA was isolated from cultures of Mesostigma virideLauterborn (strain NIES 476, Tsukuba, Japan) and mRNAisolated using the mTRAP™ Total Kit (Active Motif). 5 µgof mRNA were converted into cDNA using the Super-Script™ Plasmid System (Invitrogen) and the cDNAobtained was fractionated by column chromatography. Alarge and a small size fraction were cloned into thepSPORT1 vector (Invitrogen).
Normalized full-length cDNA was prepared by EvrogenJSC (Moscow, Russia). cDNA was prepared from totalRNA using the SMART approach [41] normalized usingthe DSN normalization method [42] and then amplifiedby PCR. cDNAs were either directly cloned into a pPCR-Script Amp SK(+) Vector (PCR-Script Amp Cloning Kit,Stratagene) or a large size fraction was isolated by columnchromatography and then cloned into a pGEM-T Easy vec-tor (Promega). All libraries were transformed into TOP 10E. coli cells (Invitrogen) by electroporation.
Sequencing, contig assembly and data analysisClone preparation and sequencingIsolated plasmids were sequenced by the cycle sequencingmethod using an ABI3700 96 capillary sequencer. A min-
imal contig set was assembled using the phrap assemblerand all contigs were manually curated.
AnnotationEach contig was compared as 3-frame translations to theprotein databases Swissprot and genpept using blastx.Furthermore, all contigs were compared using thetBLASTX search algorithm to the genome sequence ofChlamydomonas reinhardtii, Cyanidioschyzon merolae, Tha-lassiosira pseudonana, Arabidopsis thaliana, Oryza sativa andto the EST databases of Physcomitrella patens and Porphyrayezoensis. The results were compiled to an Excel compati-ble file. Analyses of COG and KOG categories [43,44] andInterpro protein domains [45] for the contigs were alsoperformed.
Analysis of metabolic pathwaysUsing the metabolic pathways present at the AraCyc web-site [46], we identified all expressed genes with significantsimilarity to Arabidopsis genes present in AraCyc.Expressed genes that showed no significant similarity toArabidopsis genes but to enzymes from other organismswere assigned to a pathway using the MetaCyc database[47].
Phylogenetic analysis of glycolate oxidaseThirteen glycolate oxidase/lactate dehydrogenasesequences were obtained from public databases (Cyanidi-oschyzon merolae [KEGG:CMQ436C]; Chlamydomonas rein-hardtii [JGI:C_340068]; Spinacia oleracea [Swiss-Prot:P05414]; Nostoc punctiforme PCC 73102 [Gen-bank:ZP_00106740.1]; Nostoc sp. PCC 7120 [Gen-bank:BAB77694.1]; Anabaena variabilis ATCC 29413[Genbank:ZP_00160276.2]; Arabidopsis thaliana [Gen-bank:CAB78838], Oryza sativa [Genbank:AAB82143],
Table 8: Regulation of plastidic enzymes by the thioredoxin system. Proteins similar to embryophyte plastidic thioredoxin-regulated proteins were identified in the genomes of Cyanidioschyzon, Chlamydomonas, and the ESTs of Mesostigma using the BLASTP or BLASTX algorithms. A putative thioredoxin-regulated orthologue as revealed by the conserved cysteine residues is indicated with +. An asterisk indicates putative cyanobacterial/plastidic proteins, which do not contain the conserved cysteines required for thioredoxin-regulation. Missing enzymes are indicated with -.
Cyanobacteria Rhodophytes Cya-nidioschyzon
Chlorophytes Chlamydomonas
Mesostigma Embryophytes
PRK + + + + +SDPase * + + + +G6PDH * + + n.d. +FBPase * *1) + + +γ-ATPase * * + + +GABDHB - - - + +NADP-MDH - - +2) n.d. +Rubisco activase -3) - * * (+)4)
n.d. not detected in Mesostigma. 1) In Galdieria (Cyanidioschyzon) 2 (1) of the 3 conserved cysteines occurring in the Viridiplantae are present [48]. 2)
Chlorophyte NADP-malate dehydrogenase possesses a C- and N-terminal extension like the embryophyte enzyme, however only the C-terminal cysteines of the embryophyte enzyme are conserved [49, 50]. 3) A few cyanobacteria contain an unusual rubisco activase. Only the central AAA+
domain shows similarity to plant rubisco activases, whereas the N and C terminal domain are very different [51]. 4) Many angiosperms contain two forms of rubisco activase. Only the long form is regulated by the thioredoxin system [52].
Page 11 of 13(page number not for citation purposes)

BMC Plant Biology 2006, 6:2 http://www.biomedcentral.com/1471-2229/6/2
Nicotiana tabacum [Genbank:AAC33509], Homo sapiens[Genbank:CAC34364], Drosophila melanogaster [Gen-bank:AAO41411], Dictyostelium discoideum [Gen-bank:XP_629946], Lactobacillus johnsonii NCC 533[Genbank:NP_965805]). The nearly complete Mesostigmaglycolate oxidase sequence was obtained by completesequencing of EST clone Meso2b12b08. The sequenceswere aligned using Clustal X. The alignment was checkedmanually. Phylogenetic analyses were performed usingthe Phylip (neighbour joining and parsimony method)and MRBAYES software v 3.0 (Bayesian inference).
Data depositionSequence data from this article have been deposited withthe EMBL/Genbank data libraries under accession num-bers DN254242 to DN264595.
Authors' contributionsAS constructed the libraries and participated in the analy-sis of the EST-data. GG sequenced the ESTs, participated inthe analysis of the EST-data and helped to draft the man-uscript. MF participated in the analysis of the EST-data.MM participated in the design of the study, the analysis ofthe EST-data and helped to draft the manuscript. BB con-ceived the study, and participated in its design, coordina-tion and analysis of the EST-data, and helped to draft themanuscript. All authors read and approved the final man-uscript.
Additional material
AcknowledgementsThis work was supported by the DFG (Be1779/7-1).
References1. Sanderson MJ, Thorne JL, Wikstrom N, Bremer K: Molecular evi-
dence on plant divergence times. Am J Bot 2004, 91:1656-1665.2. Bateman RM, Crane PR, DiMichele WA, Kenrick PR, Rowe NP, Speck
T, Stein WE: Early evolution of land plants: Phylogeny, physi-ology, and ecology of the primary terrestrial radiation. AnnuRev Ecol Syst 1998, 29:263-292.
3. Kenrick P, Crane PR: The origin and early diversification of land plantsWashington, London: Smithsonian Institution Press; 1997.
4. Graham LE: Origin of Land Plants New York: John Wiley & Sons, Inc;1993.
5. Waters ER: Molecular adaptation and the origin of land plants.Molecular Phylogenetics and Evolution 2003, 29:456-463.
6. Bremer K: Summary of green plant phylogeny and classifica-tion. Cladistics 1985, 1:369-385.
7. Mattox KR, Stewart KD: Classification of green algae: A con-cept based on comparative cytology. In Systematics of the greenalgae Edited by: Irvine DEG, John DM. London: Academic Press;1984:29-72.
8. Nakayama T, Marin B, Kranz HD, Surek B, Huss VAR, Inouye I,Melkonian M: The basal position of scaly green flagellatesamong the green algae (Chlorophyta) is revealed by analysesof nuclear-encoded SSU rRNA sequences. Protist 1998,149:367-380.
9. Huss VAR, Kranz HD: Charophyte evolution and the origin ofland plants. Plant Syst Evol 1997:103-114.
10. Karol KG, McCourt RM, Cimino MT, Delwiche CF: The closest liv-ing relatives of land plants. Science 2001, 294:2351-2353.
11. Bhattacharya D, Weber K, An SS, Berning-Koch W: Actin phylog-eny identifies Mesostigma viride as a flagellate ancestor ofthe land plants. J Mol Evol 1998, 47:544-550.
12. Marin B, Melkonian M: Mesostigmatophyceae, a new class ofstreptophyte green algae revealed by SSU rRNA sequencecomparisons. Protist 1999, 150:399-417.
13. Melkonian M, Marin B, Surek B: Phylogeny and Evolution of theAlgae. In Biodiversity and Evolution Edited by: Arai R, Kato M, Doi Y.Tokyo: The National Science Museum Foundation; 1995:153-176.
14. Turmel M, Otis C, Lemieux C: The Complete MitochondrialDNA Sequence of Mesostigma viride Identifies This GreenAlga as the Earliest Green Plant Divergence and Predicts aHighly Compact Mitochondrial Genome in the Ancestor ofAll Green Plants. Mol Biol Evol 2002, 19:24-38.
15. Lemieux C, Otis C, Turmel M: Ancestral chloroplast genome inMesostigma viride reveals an early branch of green plantevolution. Nature 2000, 403:649-652.
16. Delwiche CF, Karol KG, Cimino MT, Sytsma KJ: Phylogeny of thegenus Coleochaete (Coleochaetales, Charophyta) andrelated taxa inferred by analysis of the chloroplast generbcL. J Phycol 2002, 38:394-403.
17. Poethig RS: Life with 25,000 genes. Genome Res 2001, 11:313-316.18. Palmer JD, Soltis DE, Chase MW: The plant tree of life: An over-
view and some points of view. Am J Bot 2004, 91:1437-1445.19. Lewis LA, McCourt RM: Green algae and the origin of land
plants. American Journal of Botany 2004, 91:1535-1556.20. McCourt RM, Delwiche CF, Karol KG: Charophyte algae and
land plant origins. Trends Ecol Evol 2004, 19:661-666.21. Graham LE, Cook ME, Busse JS: The origin of plants: Body plan
changes contributing to a major evolutionary radiation.PNAS 2000, 97:4535-4540.
22. Quinn GP, Keough MJ: Experimental design and data analysis for biolo-gists Cambridge: Cambridge University Press; 2002.
23. Ohlrogge J, Benning C: Unraveling plant metabolism by ESTanalysis. Curr Opin Plant Biol 2000, 3:224-228.
24. Cerff R, Chambers SE: Subunit Structure of Higher-Plant Glyc-eraldehyde-3-Phosphate Dehydrogenases (Ec 1.2.1.12 andEc 1.2.1.13). J Biol Chem 1979, 254:6094-6098.
25. Becker B, Becker D, Kamerling JP, Melkonian M: 2-keto-sugar acidsin green flagellates: A chemical marker for prasinophyceanscales. JPhycol 1991, 27:498-504.
26. Kanter U, Usadel B, Guerineau F, Li Y, Pauly M, Tenhaken R: Theinositol oxygenase gene family of Arabidopsis is involved inthe biosynthesis of nucleotide sugar precursors for cell-wallmatrix polysaccharides. Planta 2005, 221:243-254.
27. Delsuc F, Brinkmann H, Philippe H: Phylogenomics and thereconstruction of the tree of life. Nature Reviews Genetics 2005,6:361-375.
28. Kimura M: The Neutral Theory of Molecular Evolution Cambridge: Cam-bridge University Press; 1983.
29. Fink RC, Scandalios JG: Molecular evolution and structure-func-tion relationships of the superoxide dismutase gene familiesin angiosperms and their relationship to other eukaryoticand prokaryotic superoxide dismutases. Arch Biochem Biophys2002, 399:19-36.
30. Dejesus MD, Tabatabai F, Chapman DJ: Taxonomic Distributionof Copper-Zinc Superoxide-Dismutase in Green-Algae andIts Phylogenetic Importance. J Phycol 1989, 25:767-772.
Additional file 1Supplemental Table 1Click here for file[http://www.biomedcentral.com/content/supplementary/1471-2229-6-2-S1.doc]
Additional file 2Supplemental Table 2Click here for file[http://www.biomedcentral.com/content/supplementary/1471-2229-6-2-S2.doc]
Page 12 of 13(page number not for citation purposes)

BMC Plant Biology 2006, 6:2 http://www.biomedcentral.com/1471-2229/6/2
Publish with BioMed Central and every scientist can read your work free of charge
"BioMed Central will be the most significant development for disseminating the results of biomedical research in our lifetime."
Sir Paul Nurse, Cancer Research UK
Your research papers will be:
available free of charge to the entire biomedical community
peer reviewed and published immediately upon acceptance
cited in PubMed and archived on PubMed Central
yours — you keep the copyright
Submit your manuscript here:http://www.biomedcentral.com/info/publishing_adv.asp
BioMedcentral
31. Frederics E, Gruber PJ, Tolbert NE: Occurrence of GlycolateDehydrogenase and Glycolate Oxidase in Green Plants –Evolutionary Survey. Plant Physiol 1973, 52:318-323.
32. Igamberdiev AU, Lea PJ: The role of peroxisomes in the integra-tion of metabolism and evolutionary diversity of photosyn-thetic organisms. Phytochemistry 2002, 60:651-674.
33. Schwender J, Gemunden C, Lichtenthaler HK: Chlorophyta exclu-sively use the 1-deoxyxylulose 5-phosphate/2- C-methyler-ythritol 4-phosphate pathway for the biosynthesis ofisoprenoids. Planta 2001, 212:416-423.
34. Noguchi M, Sawadas T, Akazawa T: ATP-regenerating system inthe cilia of Paramecium caudatum. Journal of Experimental Biol-ogy 2001, 204:1063-1071.
35. Pazour GJ, Agrin N, Leszyk J, Witman GB: Proteomic analysis of aeukaryotic cilium. J Cell Biol 2005, 170:103-113.
36. Pasqualato S, Renault L, Cherfils J: Arf, Arl, Arp and Sar proteins:a family of GTP-binding proteins with a structural device for'front-back' communication. EMBO Rep 2002, 3:1035-1041.
37. Roberts AW, Roberts E: Cellulose synthase (CesA) genes inalgae and seedless plants. Cellulose 2004, 11:419-435.
38. Stabenau H, Winkler U: Glycolate metabolism in green algae.Physiol Plant 2005, 123:235-245.
39. Falkowski PG, Katz ME, Knoll AH, Quigg A, Raven JA, Schofield O,Taylor FJR: The evolution of modern eukaryotic phytoplank-ton. Science 2004, 305:354-360.
40. Badger MR, Price GD: CO2 concentrating mechanisms incyanobacteria: molecular components, their diversity andevolution. J Exp Bot 2003, 54:609-622.
41. Zhu YY, Machleder EM, Chenchik A, Li R, Siebert PD: Reverse tran-scriptase template switching: a SMART approach for full-length cDNA library construction. Biotechniques 2001,30:892-897.
42. Shagin DA, Rebrikov DV, Kozhemyako VB, Altshuler IM, ShcheglovAS, Zhulidov PA, Bogdanova EA, Staroverov DB, Rasskazov VA, Luky-anov S: A novel method for SNP detection using a newduplex-specific nuclease from crab hepatopancreas. GenomeRes 2002, 12:1935-1942.
43. Tatusov RL, Fedorova ND, Jackson JD, Jacobs AR, Kiryutin B, KooninEV, Krylov DM, Mazumder R, Mekhedov SL, Nikolskaya AN, Rao BS,Smirnov S, Sverdlov AV, Vasudevan S, Wolf YI, Yin JJ, Natale DA: TheCOG database: an updated version includes eukaryotes. BmcBioinformatics 2003, 4:41.
44. Tatusov RL, Galperin MY, Natale DA, Koonin EV: The COG data-base: a tool for genome-scale analysis of protein functionsand evolution. Nucleic Acids Res 2000, 28:33-36.
45. Apweiler R, Attwood TK, Bairoch A, Bateman A, Birney E, Biswas M,Bucher P, Cerutti T, Corpet F, Croning MDR, Durbin R, Falquet L,Fleischmann W, Gouzy J, Hermjakob H, Hulo N, Jonassen I, Kahn D,Kanapin A, Karavidopoulou Y, Lopez R, Marx B, Mulder NJ, Oinn TM,Pagni M, Servant F, Sigrist CJ, Zdobnov EM: The InterPro data-base, an integrated documentation resource for proteinfamilies, domains and functional sites. Nucleic Acids Res 2001,29:37-40.
46. [http://www.arabidopsis.org/tools/aracyc/].47. [http://metacyc.org/META/server.html].48. Ruelland E, Miginiac-Maslow M: Regulation of chloroplast
enzyme activities by thioredoxins: activation or relief frominhibition? Trends Plant Sci 1999, 4:136-141.
49. Ocheretina O, Haferkamp I, Tellioglu H, Scheibe R: Light-modu-lated NADP-malate dehydrogenases from mossfern andgreen algae: insights into evolution of the enzyme's regula-tion. Gene 2000, 258:147-154.
50. Lemaire SD, Quesada A, Merchan F, Corral JM, Igeno MI, Keryer E,Issakidis-Bourguet E, Hirasawa M, Knaff DB, Miginiac-Maslow M:NADP-malate dehydrogenase from unicellular green algaChlamydomonas reinhardtii. A first step toward redox reg-ulation. Plant Physiol 2005, 137:514-521.
51. Portis AR: Rubisco activase – Rubisco's catalytic chaperone.Photosynth Res 2003, 75:11-27.
52. Schurmann P, Jacquot JP: Plant thioredoxin systems revisited.Annu Rev Plant Physiol Plant Molec Biol 2000, 51:371-400.
Page 13 of 13(page number not for citation purposes)