bmm 3633 industrial engineering. learning objectives: define the meanings of product quality, cost...
TRANSCRIPT
BMM 3633Industrial Engineering
Learning Objectives:
Define the meanings of product quality, cost of quality and quality
conformance. Describe the tools for problem
solving and continuous improvement.
Develop a scatter diagram, pareto analysis, histogram, flowchart, and cause-and-effect diagram.
Contents:
Quality Quality Gurus Malcolm Baldrige National Quality Award International Quality Standard Total Quality Management (TQM) Tools of TQM Inspection
“Quality is never an accident; it is always the result of intelligent effort.” -John Ruskin-
There is one rule for the industrialist and that is: Make the best quality of goods possible at the lowest cost possible, paying the highest wages possible.
-Henry Ford (1863-1947) American industrialist-
Quality is remembered long after the price is forgotten.
Gucci Family Slogan
The bitterness of poor quality remains long after low pricing is forgotten!
Leon M. Cautillo
The quality, not the longevity, of one's life is what is important.
Martin Luther King, Jr.
Quality is the first priority!!!
Quality but not quantity!!!
QualityQuality is…
Judged by customer
Meeting and exceeding customer needs
Delighting the customer
Customer satisfactionExternal customers – who buy and use a product or service.
Internal customers – who are the next persons in the process
Definition of quality:Definition of quality:
Fitness for UseConformance to SpecificationsProducing the Very Best ProductsExcellence in Products and ServicesTotal Customer SatisfactionExceeding Customer Expectations
Quality (cont..)
Different Views of QualityDifferent Views of Quality
User-based – better performance, more features
Manufacturing-based – conformance to standards, making it right the first time
Product-based – specific and measurable attributes of the product
Quality (cont..)
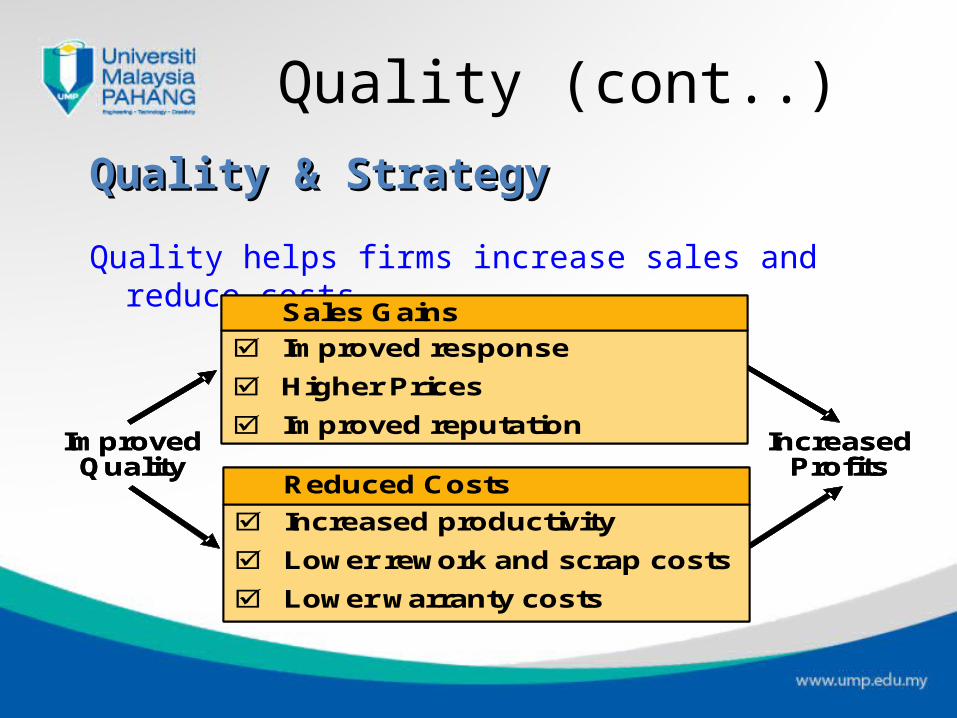
Quality & StrategyQuality & Strategy
Quality helps firms increase sales and reduce costs
Improved Quality
Improved Quality
Increased Profits
Increased Profits
Increased productivity
Lower rework and scrap costs
Lower warranty costs
Reduced Costs
Increased productivity
Lower rework and scrap costs
Lower warranty costs
Reduced Costs
Improved response
Higher Prices
Improved reputation
Sales Gains
Improved response
Higher Prices
Improved reputation
Sales Gains
Quality (cont..)
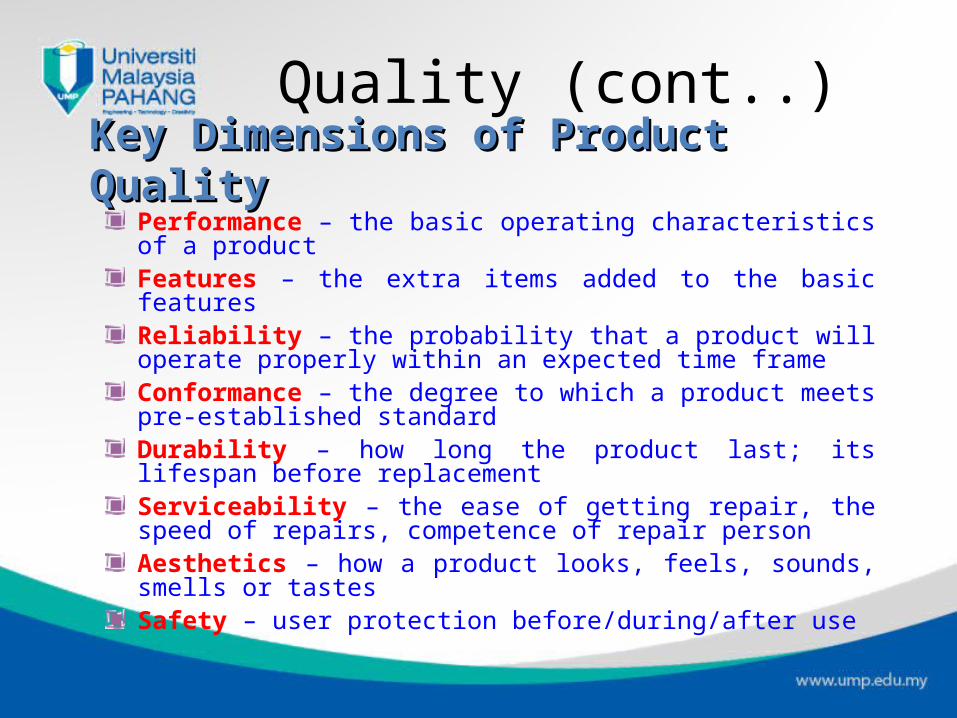
Key Dimensions of Product QualityKey Dimensions of Product QualityPerformance – the basic operating characteristics of a productFeatures – the extra items added to the basic featuresReliability – the probability that a product will operate properly within an expected time frameConformance – the degree to which a product meets pre-established standardDurability – how long the product last; its lifespan before replacementServiceability – the ease of getting repair, the speed of repairs, competence of repair person Aesthetics – how a product looks, feels, sounds, smells or tastesSafety – user protection before/during/after use
Quality (cont..)
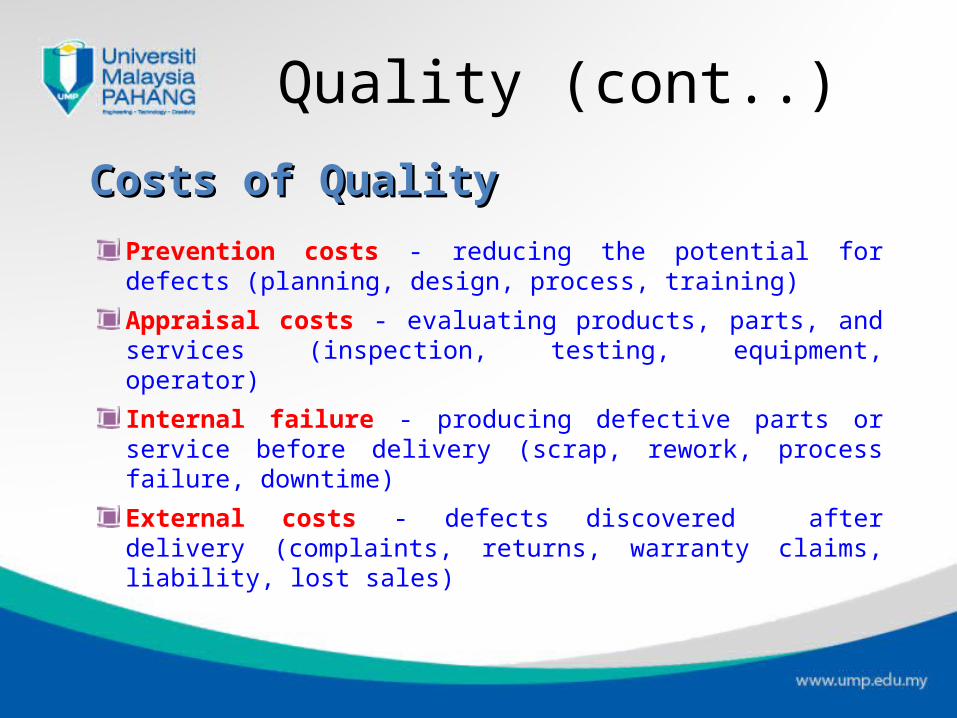
Costs of QualityCosts of Quality
Prevention costs - reducing the potential for defects (planning, design, process, training)
Appraisal costs - evaluating products, parts, and services (inspection, testing, equipment, operator)
Internal failure - producing defective parts or service before delivery (scrap, rework, process failure, downtime)
External costs - defects discovered after delivery (complaints, returns, warranty claims, liability, lost sales)
Quality (cont..)
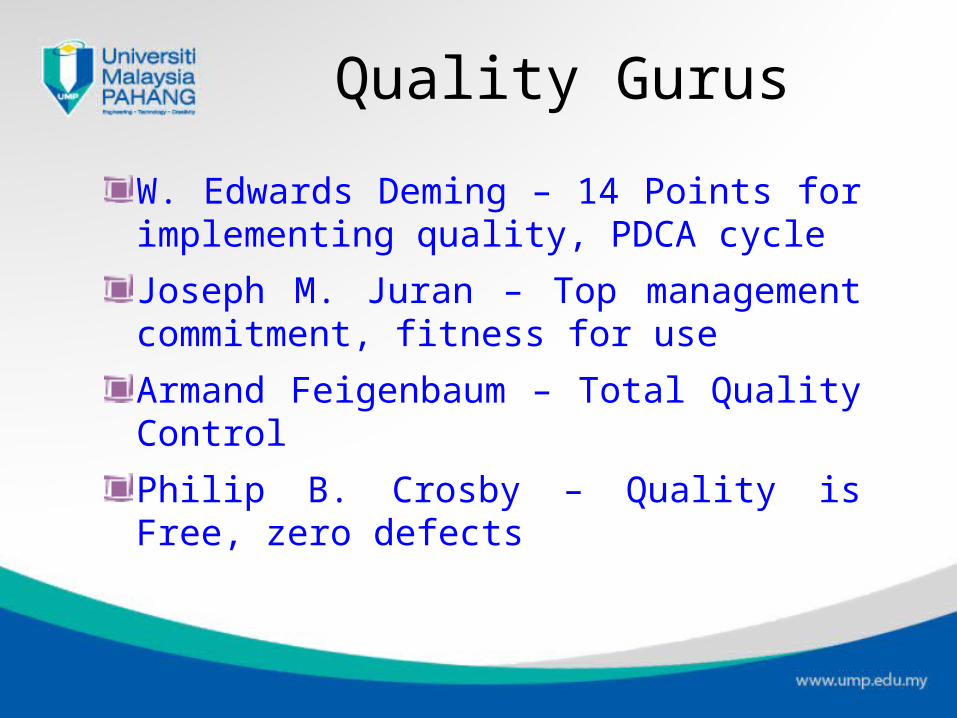
Quality Gurus
W. Edwards Deming – 14 Points for implementing quality, PDCA cycle
Joseph M. Juran – Top management commitment, fitness for use
Armand Feigenbaum – Total Quality Control
Philip B. Crosby – Quality is Free, zero defects
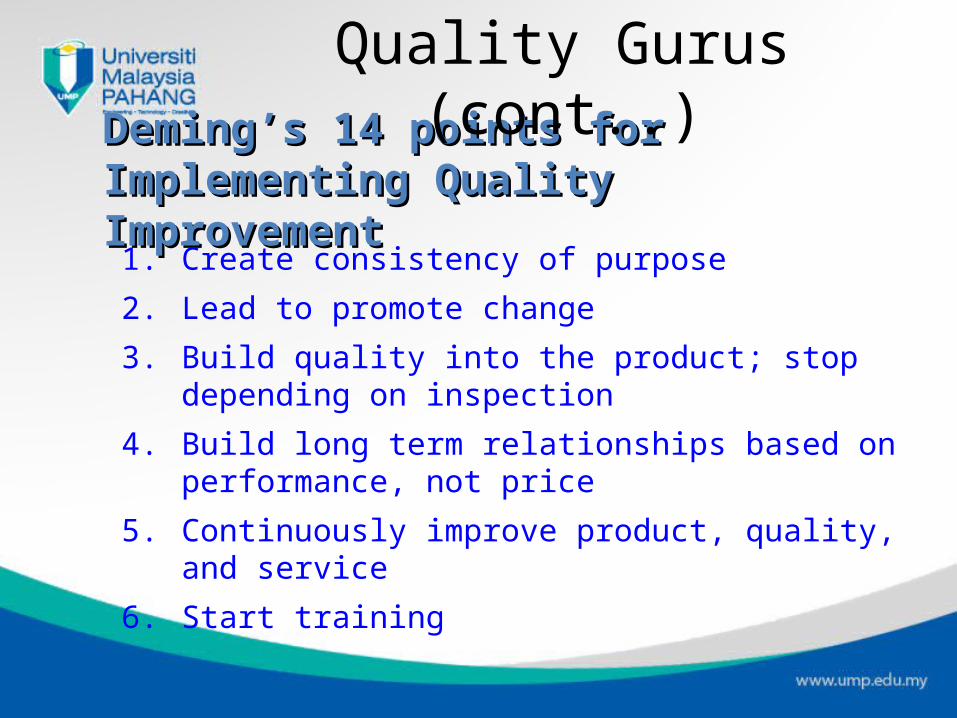
Deming’s 14 points for Implementing Quality Deming’s 14 points for Implementing Quality ImprovementImprovement
1. Create consistency of purpose
2. Lead to promote change
3. Build quality into the product; stop depending on inspection
4. Build long term relationships based on performance, not price
5. Continuously improve product, quality, and service
6. Start training
Quality Gurus (cont..)
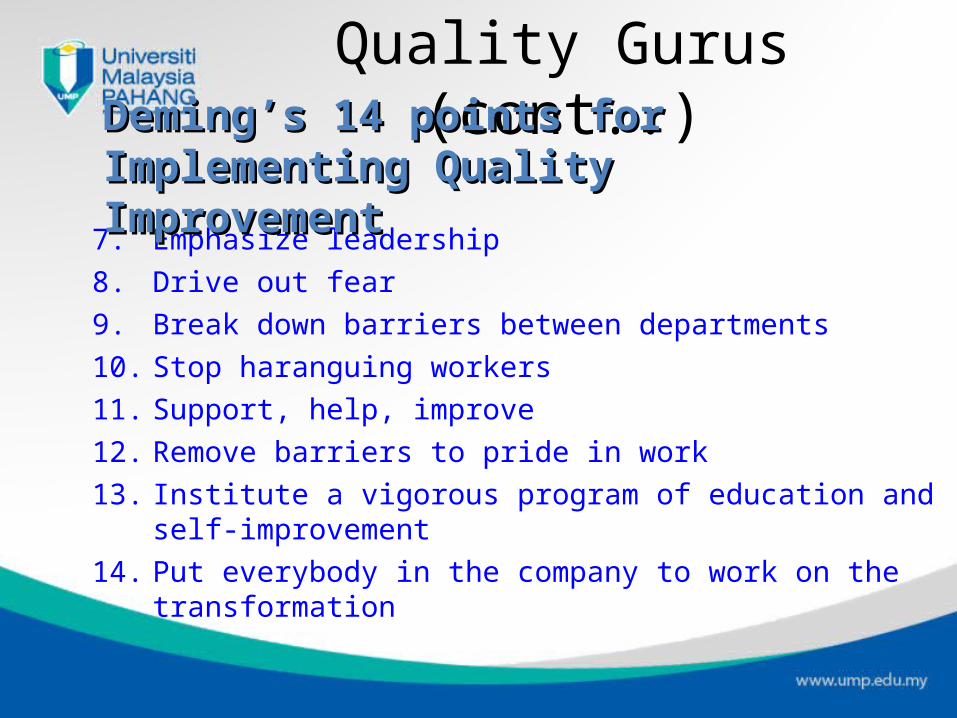
7. Emphasize leadership8. Drive out fear9. Break down barriers between departments10. Stop haranguing workers11. Support, help, improve12. Remove barriers to pride in work13. Institute a vigorous program of education and self-
improvement14. Put everybody in the company to work on the transformation
Quality Gurus (cont..)Deming’s 14 points for Implementing Quality Deming’s 14 points for Implementing Quality ImprovementImprovement
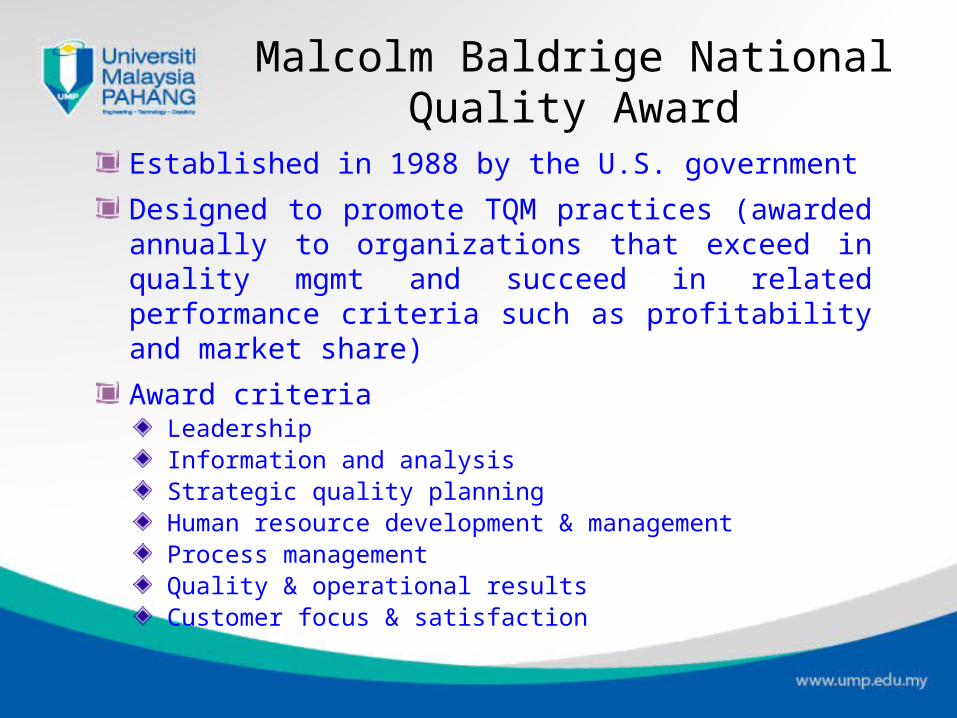
Malcolm Baldrige National Quality Award
Established in 1988 by the U.S. government
Designed to promote TQM practices (awarded annually to organizations that exceed in quality mgmt and succeed in related performance criteria such as profitability and market share)
Award criteriaLeadershipInformation and analysisStrategic quality planningHuman resource development & managementProcess managementQuality & operational results Customer focus & satisfaction
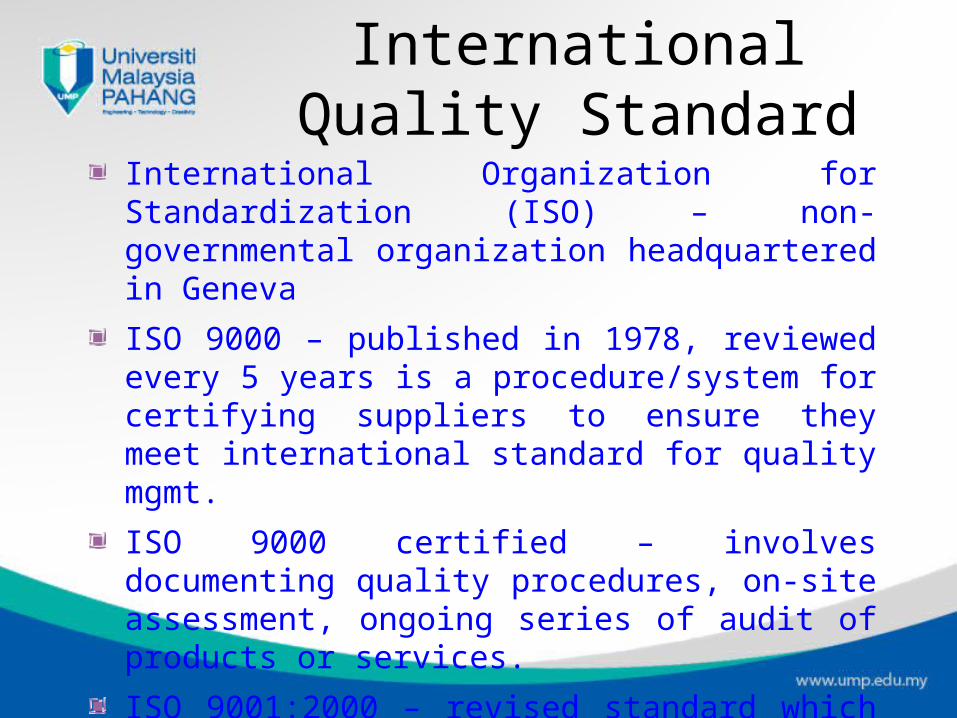
International Quality Standard
International Organization for Standardization (ISO) – non-governmental organization headquartered in Geneva
ISO 9000 – published in 1978, reviewed every 5 years is a procedure/system for certifying suppliers to ensure they meet international standard for quality mgmt.
ISO 9000 certified – involves documenting quality procedures, on-site assessment, ongoing series of audit of products or services.
ISO 9001:2000 – revised standard which emphasis on leadership by top management and customer satisfaction rather than documented procedures
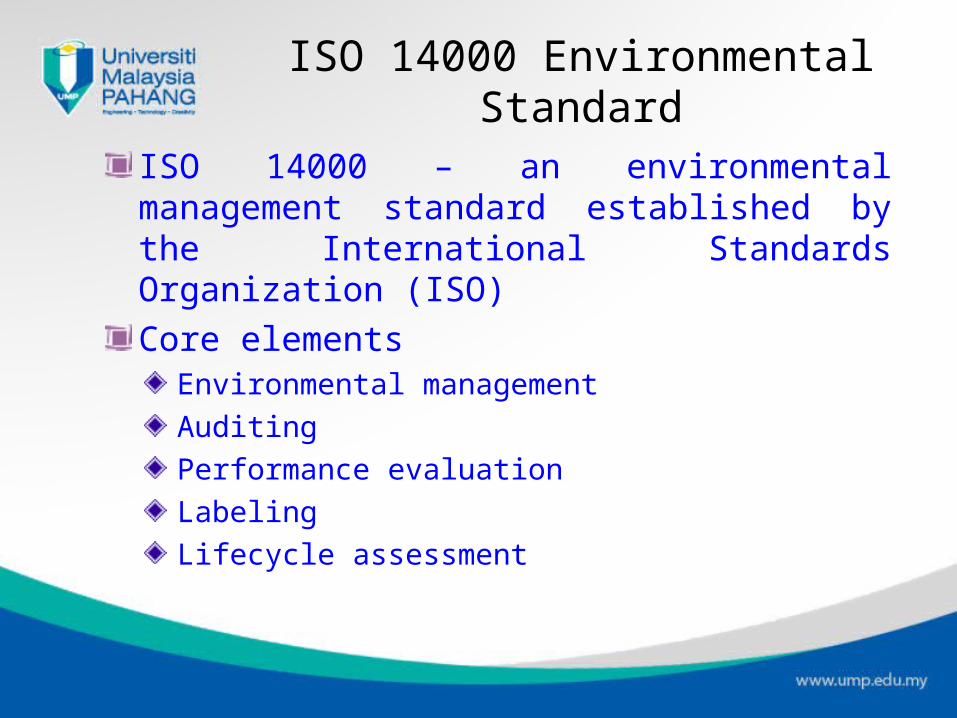
ISO 14000 Environmental Standard
ISO 14000 – an environmental management standard established by the International Standards Organization (ISO)Core elements
Environmental managementAuditingPerformance evaluationLabelingLifecycle assessment
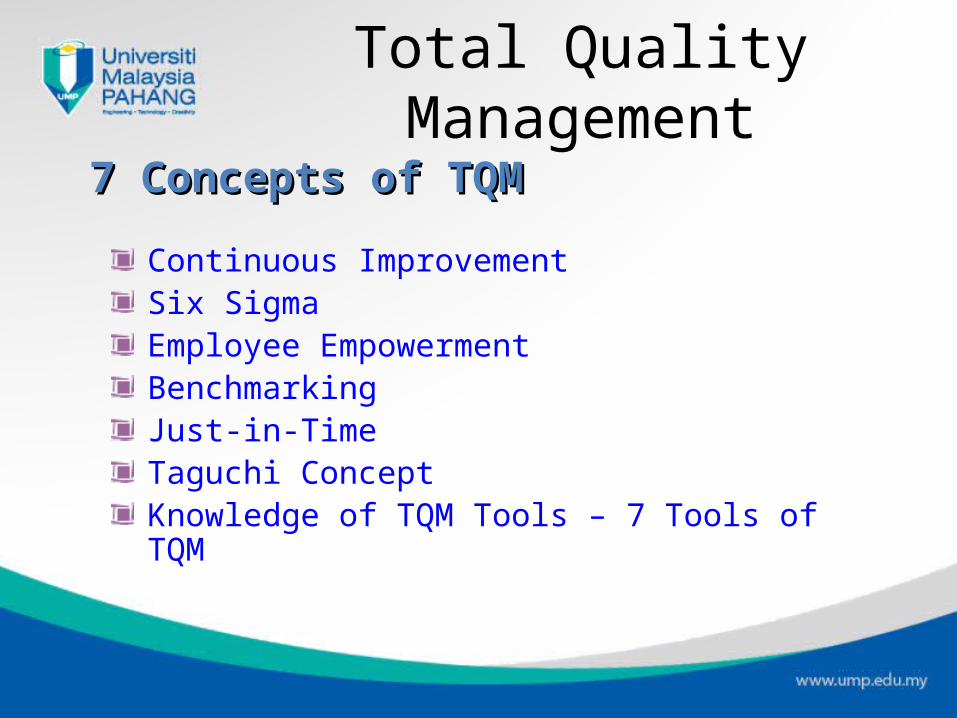
7 Concepts of TQM7 Concepts of TQM
Continuous ImprovementSix SigmaEmployee EmpowermentBenchmarkingJust-in-TimeTaguchi ConceptKnowledge of TQM Tools – 7 Tools of TQM
Total Quality Management
Continuous ImprovementContinuous Improvement
Represents continual improvement of all processes
Involves all operations including suppliers and customers that covers People, Equipment, Materials, and Procedures
Walter Shewhart develop a circular model known as PDCA to stress the continuous nature of the improvement process.
Japanese use the word ‘Kaizen’ to describe continuous or ongoing process improvement
Total Quality Management (cont..)
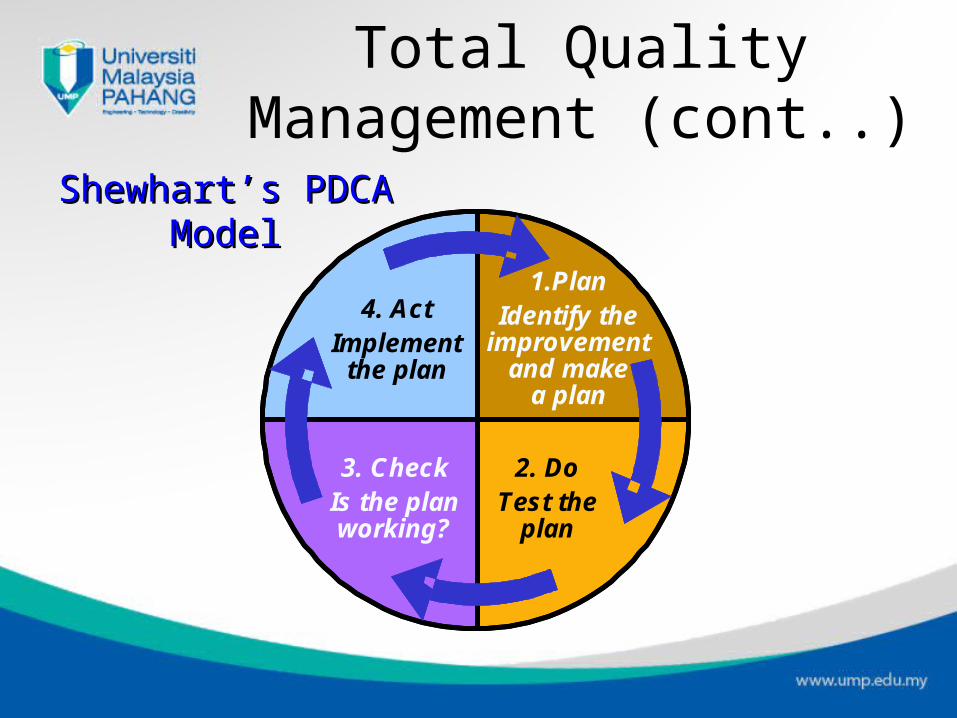
Shewhart’s PDCA Shewhart’s PDCA ModelModel
2. DoTest the
plan
2. DoTest the
plan
3. CheckIs the plan working?
3. CheckIs the plan working?
4. ActImplement
the plan
4. ActImplement
the plan
1.PlanIdentify the
improvement and make
a plan
1.PlanIdentify the
improvement and make
a plan
Total Quality Management (cont..)
Six SigmaSix SigmaOriginally developed by MotorolaIn statistical sense, Six Sigma refers to an extremely high measure of process capability (99.9997% accuracy)A Six Sigma capable process will return no more than 3.4 defects per million operations (DPMO)Highly structured approach to process improvement Six Sigma improvement model known as DMAIC
Total Quality Management (cont..)
Six Sigma is a program designed to reduce defects to help lower costs, save time, and improve customer satisfaction.3 key players in the Six Sigma program
Master Black Belts – full time teacher who have extensive training in statistics, quality tools, and leadershipBlack Belts – project team leadersGreen Belts – spend part of their time on team projects and the rest on their normal jobs.
Total Quality Management (cont..)
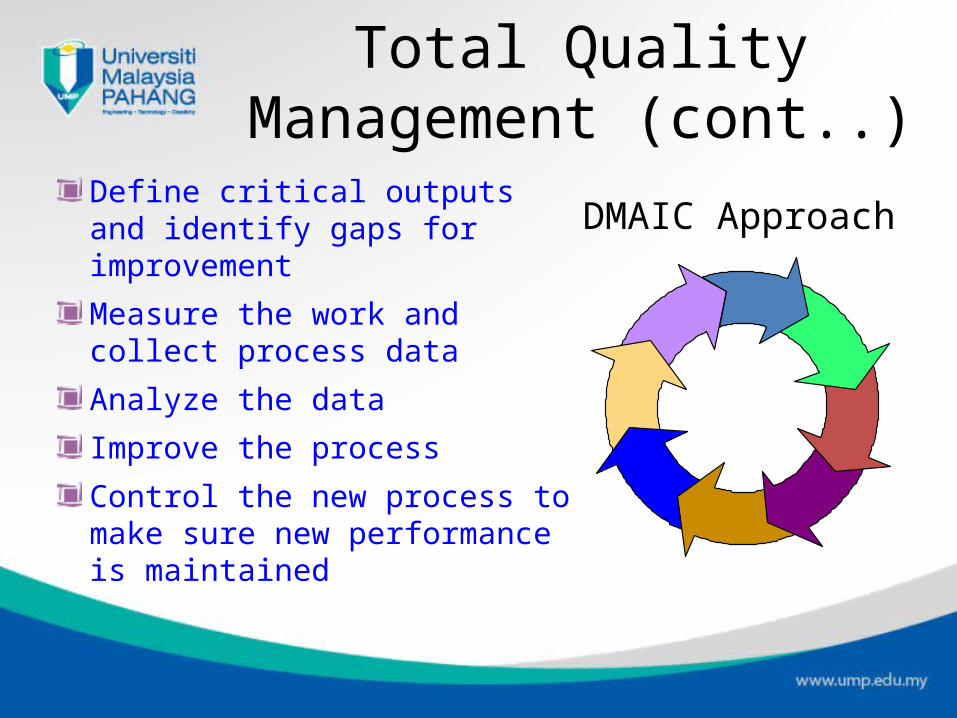
Define critical outputs and identify gaps for improvement
Measure the work and collect process data
Analyze the data
Improve the process
Control the new process to make sure new performance is maintained
DMAIC Approach
Total Quality Management (cont..)
Quality Circle / Employee EmpowermentQuality Circle / Employee Empowerment
Group of employees who meet regularly to solve problems
Trained in planning, problem solving, and statistical methods
Often led by a facilitator
Very effective when done properly
Total Quality Management (cont..)
BenchmarkingBenchmarkingSelecting best practices to use as a standard for performanceBenchmarking procedures/steps,
Determine what to benchmarkForm a benchmark teamIdentify benchmarking partnersCollect and analyze benchmarking informationTake action to match or exceed the benchmark
Use internal
benchmarking if
you’re big
enough
Total Quality Management (cont..)
Just-in-TimeJust-in-TimeJIT systems are designed to produce or deliver goods just as they are neededRelated to quality in three ways;
JIT cuts the cost of quality – scrap, rework, inventory investment, damage costs are directly related to inventory on handJIT improves quality – limits the number of potential sources of errorBetter quality means less inventory and better, easier-to-employ JIT system
Total Quality Management (cont..)
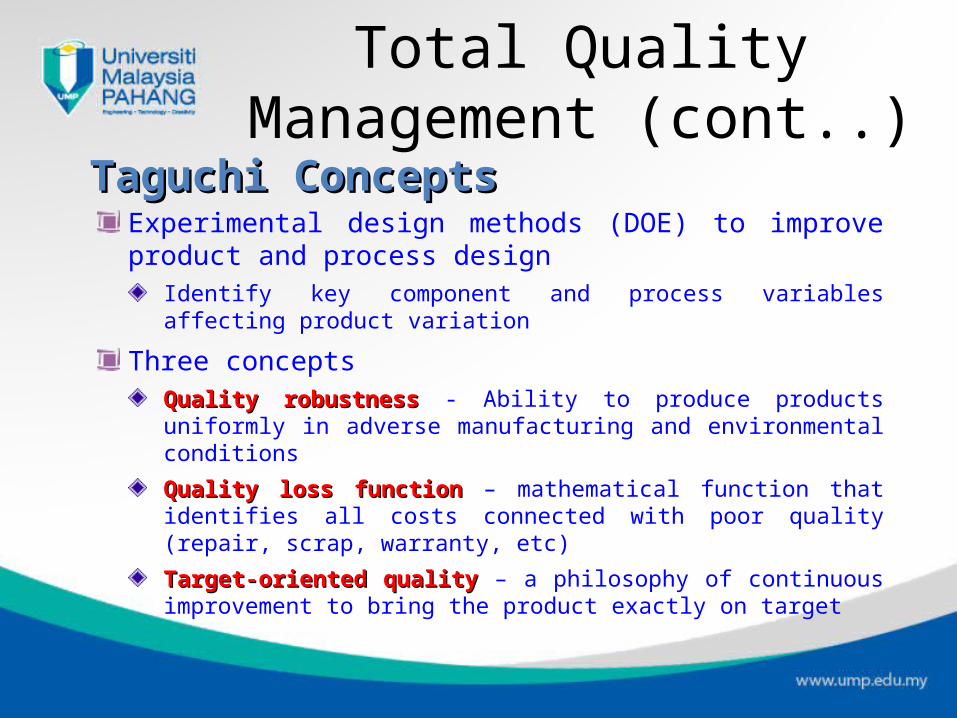
Taguchi ConceptsTaguchi ConceptsExperimental design methods (DOE) to improve product and process design
Identify key component and process variables affecting product variation
Three conceptsQuality robustnessQuality robustness - Ability to produce products uniformly in adverse manufacturing and environmental conditions
Quality loss functionQuality loss function – mathematical function that identifies all costs connected with poor quality (repair, scrap, warranty, etc)
Target-oriented qualityTarget-oriented quality – a philosophy of continuous improvement to bring the product exactly on target
Total Quality Management (cont..)
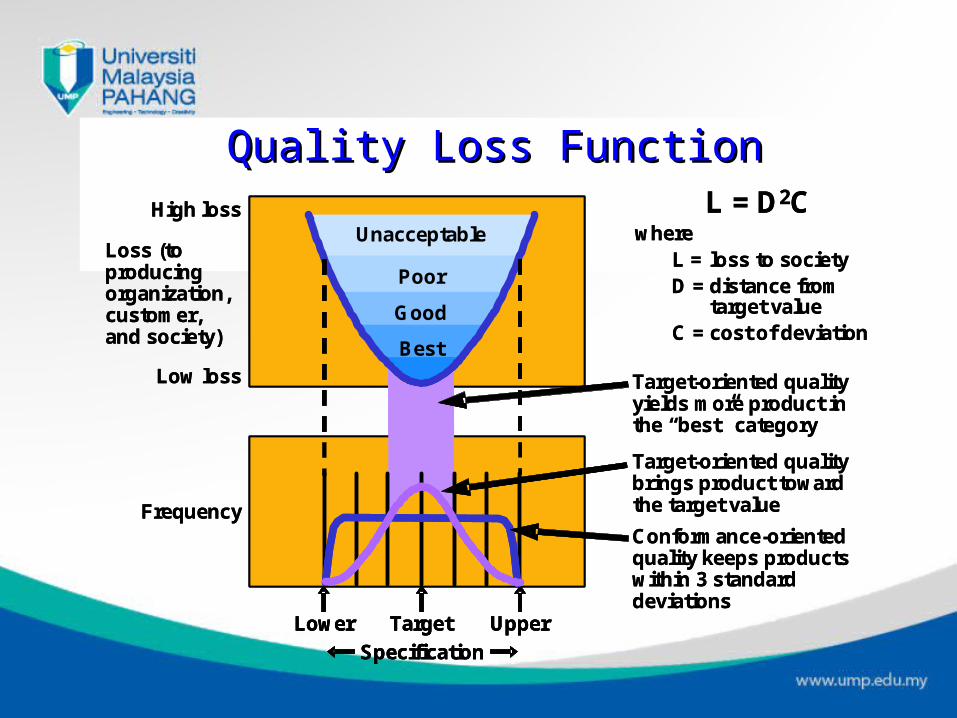
Quality Loss FunctionQuality Loss Function
Unacceptable
Poor
Good
Best
Unacceptable
Poor
Good
Best
High loss
Loss (to producing organization, customer, and society)
Low loss
High loss
Loss (to producing organization, customer, and society)
Low loss
Frequency
Lower Target Upper
Specification
Frequency
Lower Target Upper
Specification
Lower Target Upper
Specification
Target-oriented quality yields more product in the “best” category
Target-oriented quality yields more product in the “best” category
Target-oriented quality brings product toward the target value
Target-oriented quality brings product toward the target value
Conformance-oriented quality keeps products within 3 standard deviations
Conformance-oriented quality keeps products within 3 standard deviations
L = D2Cwhere
L = loss to societyD = distance from
target valueC = cost of deviation
L = D2Cwhere
L = loss to societyD = distance from
target valueC = cost of deviation
7 Tools of TQM7 Tools of TQMCheck SheetScatter DiagramCause-and-Effect DiagramPareto ChartFlow ChartHistogramStatistical Process Control Chart (SPC chart)
Tools of TQM
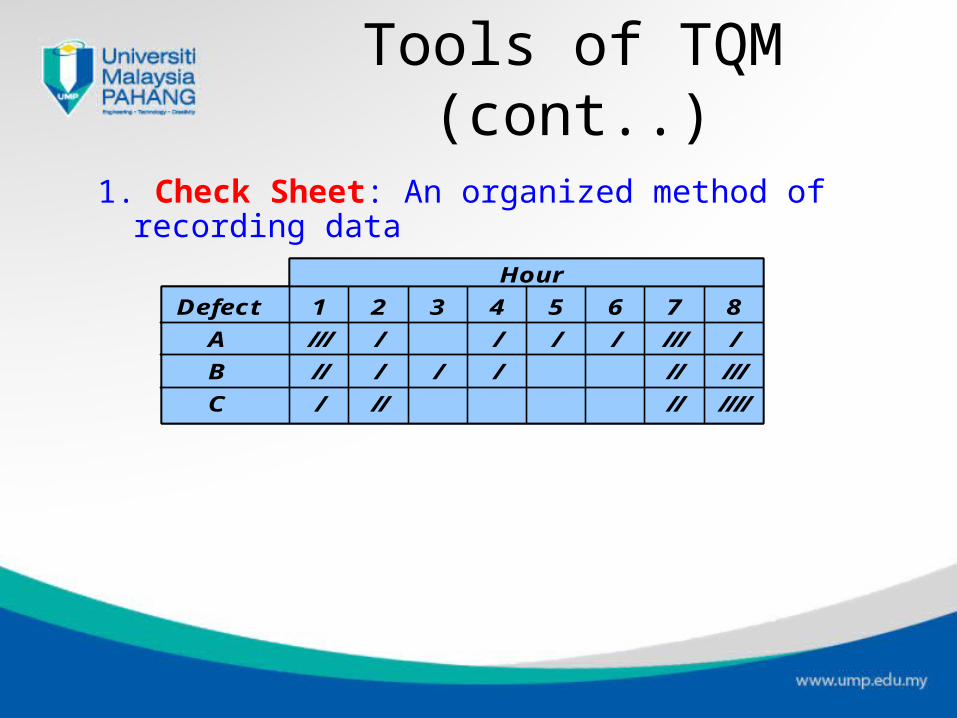
1. Check Sheet: An organized method of recording data
/
/
/ / /// /
// ///
// ////
///
//
/
Hour
Defect 1 2 3 4 5 6 7 8
A
B
C
/
/
//
/
Tools of TQM (cont..)
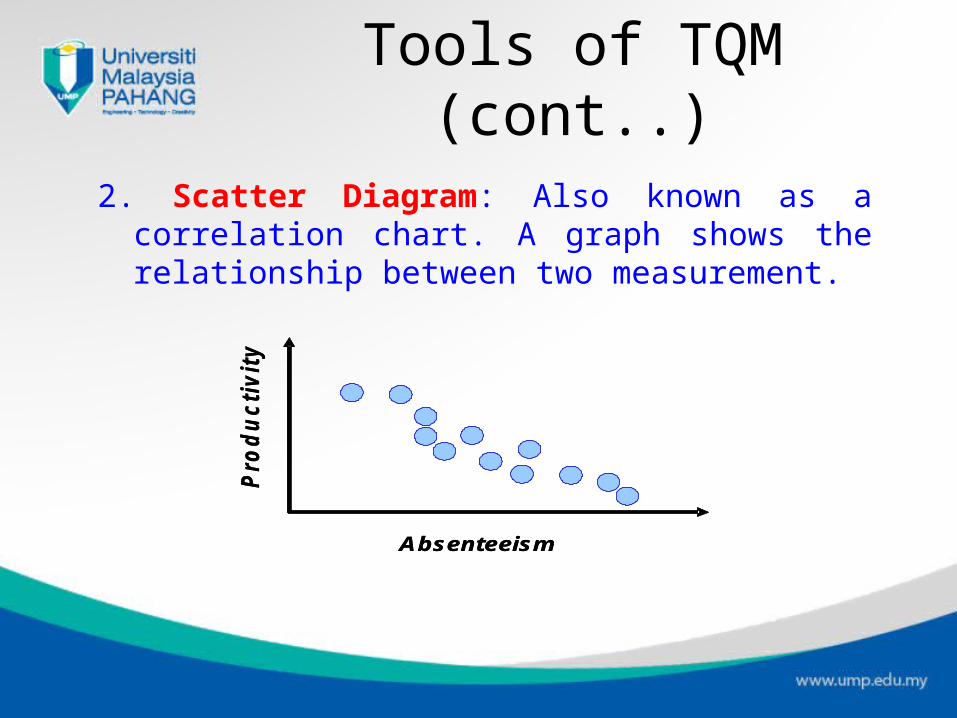
2. Scatter Diagram: Also known as a correlation chart. A graph shows the relationship between two measurement.
Absenteeism
Pro
du
cti
vit
y
Absenteeism
Pro
du
cti
vit
y
Tools of TQM (cont..)
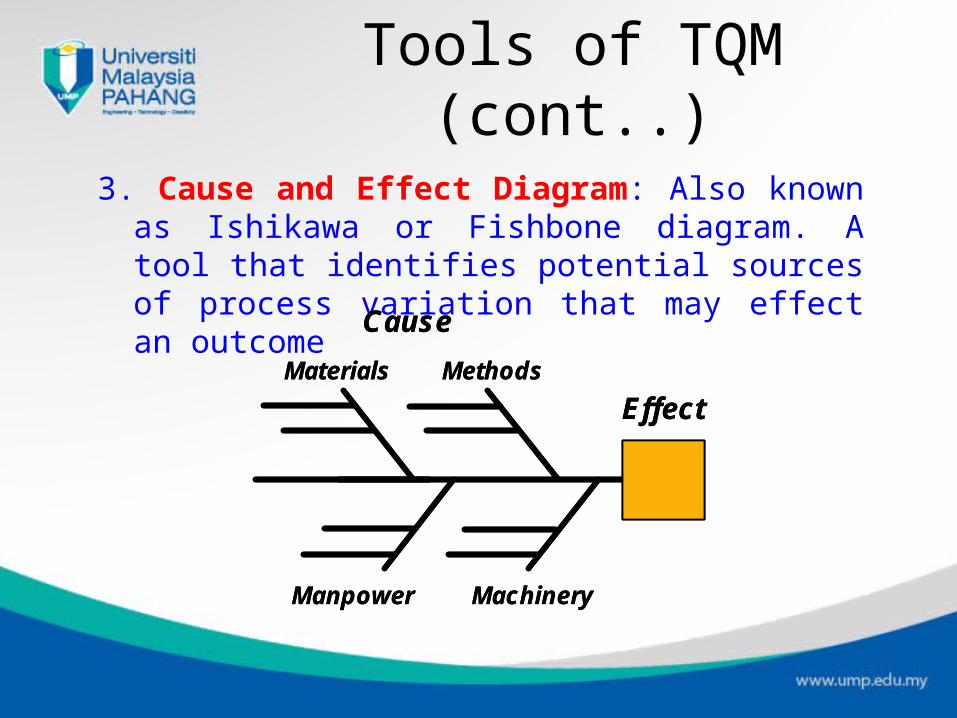
3. Cause and Effect Diagram: Also known as Ishikawa or Fishbone diagram. A tool that identifies potential sources of process variation that may effect an outcome
Cause
Materials Methods
Manpower Machinery
Effect
Cause
Materials Methods
Manpower Machinery
Effect
Tools of TQM (cont..)
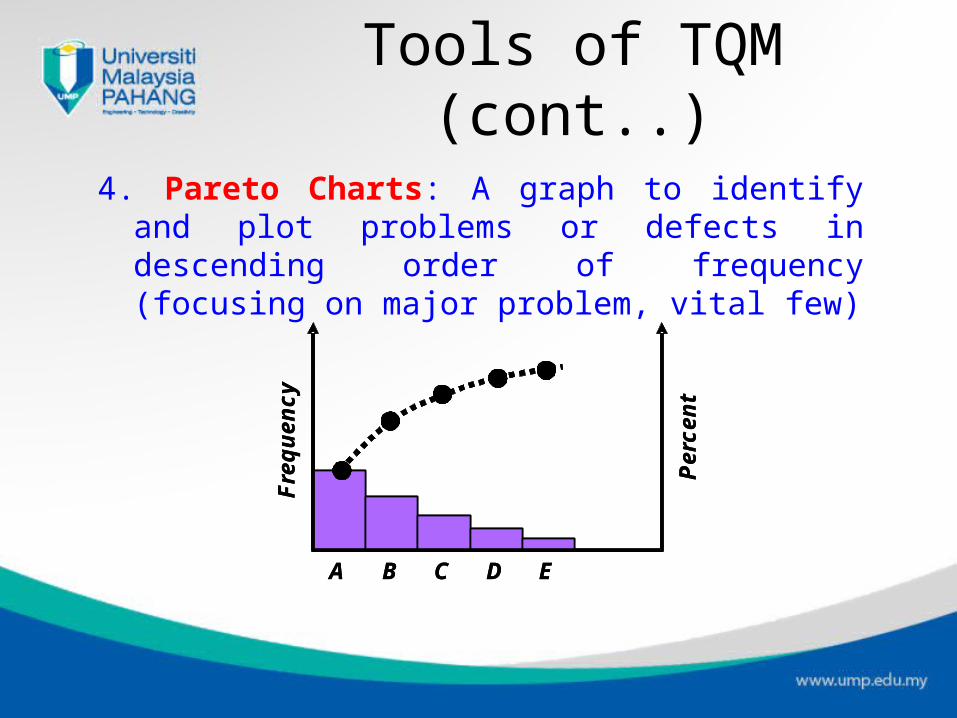
4. Pareto Charts: A graph to identify and plot problems or defects in descending order of frequency (focusing on major problem, vital few)
Fre
qu
ency
Per
cen
t
A B C D E
Fre
qu
ency
Per
cen
t
A B C D E
Tools of TQM (cont..)
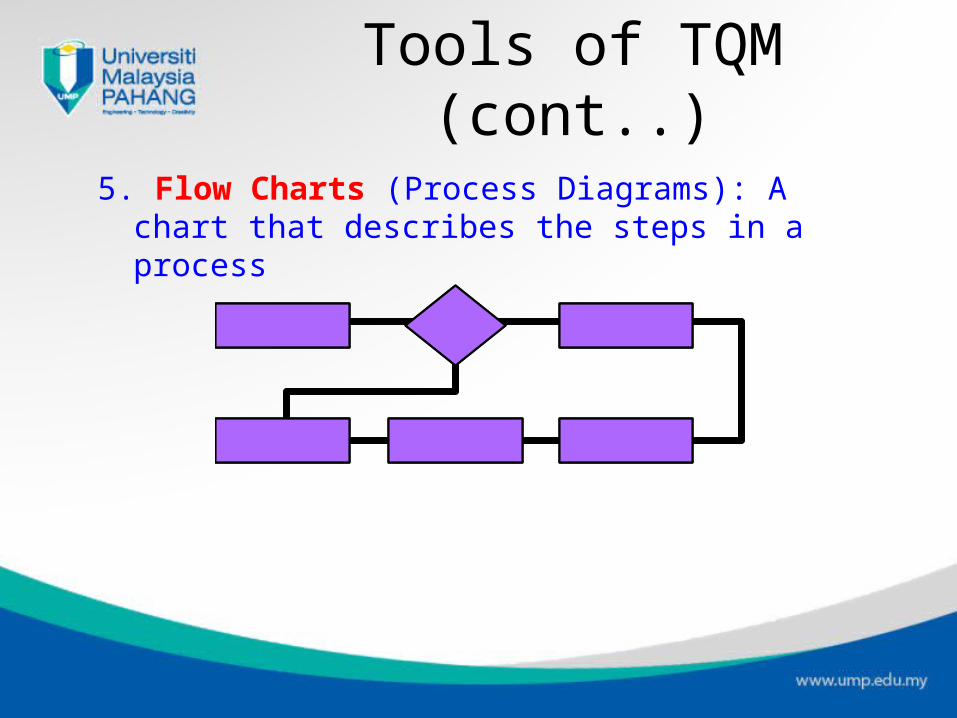
5. Flow Charts (Process Diagrams): A chart that describes the steps in a process
Tools of TQM (cont..)
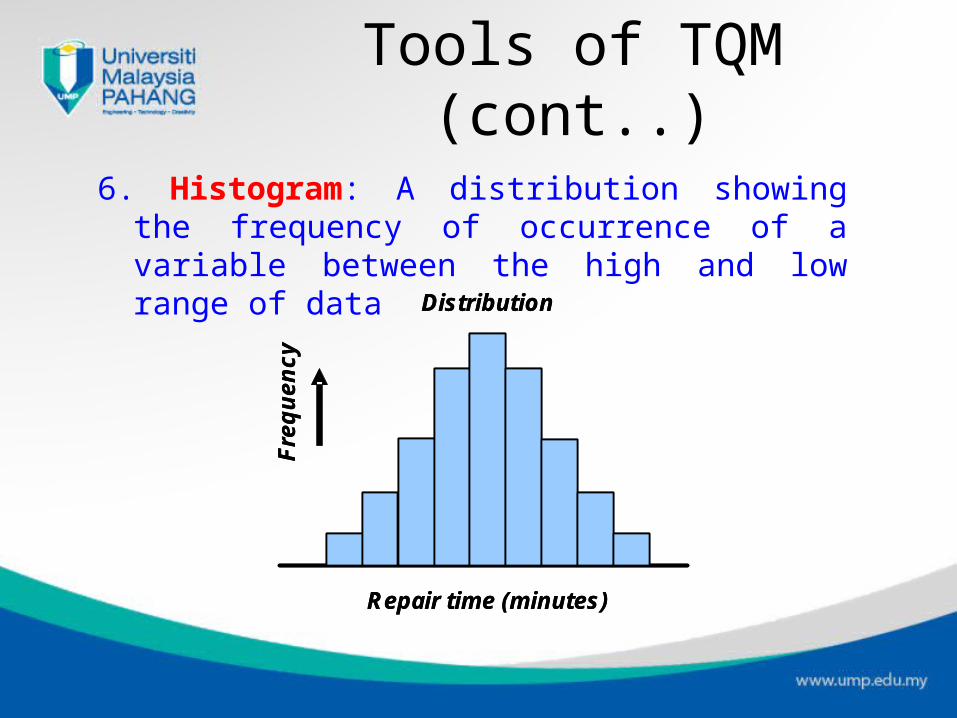
6. Histogram: A distribution showing the frequency of occurrence of a variable between the high and low range of data
Distribution
Repair time (minutes)
Fre
qu
ency
Distribution
Repair time (minutes)
Fre
qu
ency
Tools of TQM (cont..)
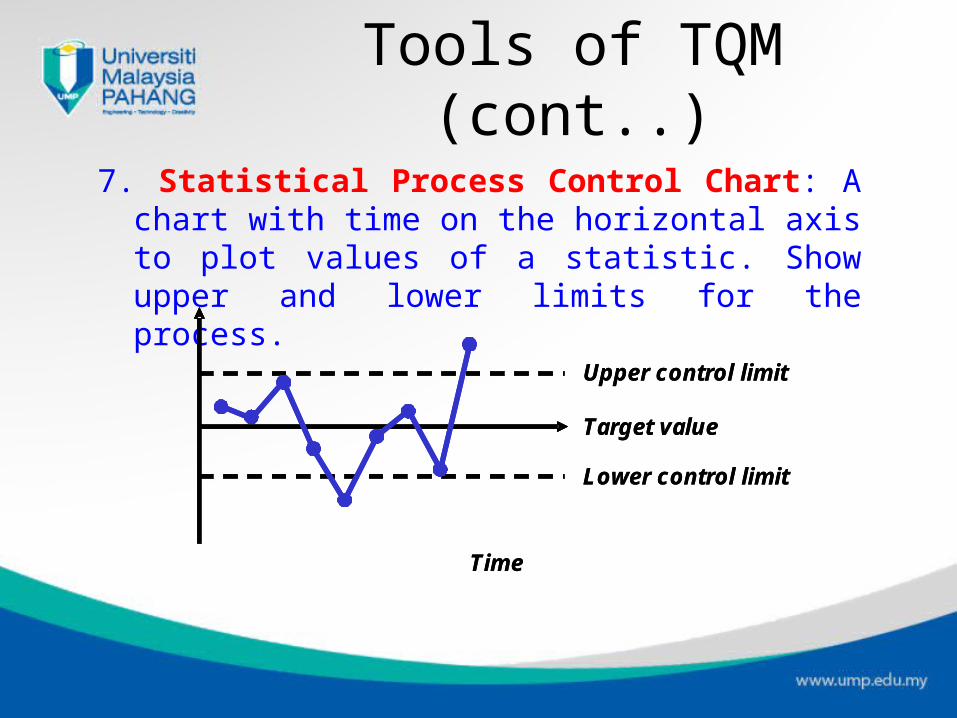
7. Statistical Process Control Chart: A chart with time on the horizontal axis to plot values of a statistic. Show upper and lower limits for the process.
Upper control limit
Target value
Lower control limit
Time
Upper control limit
Target value
Lower control limit
Time
Tools of TQM (cont..)
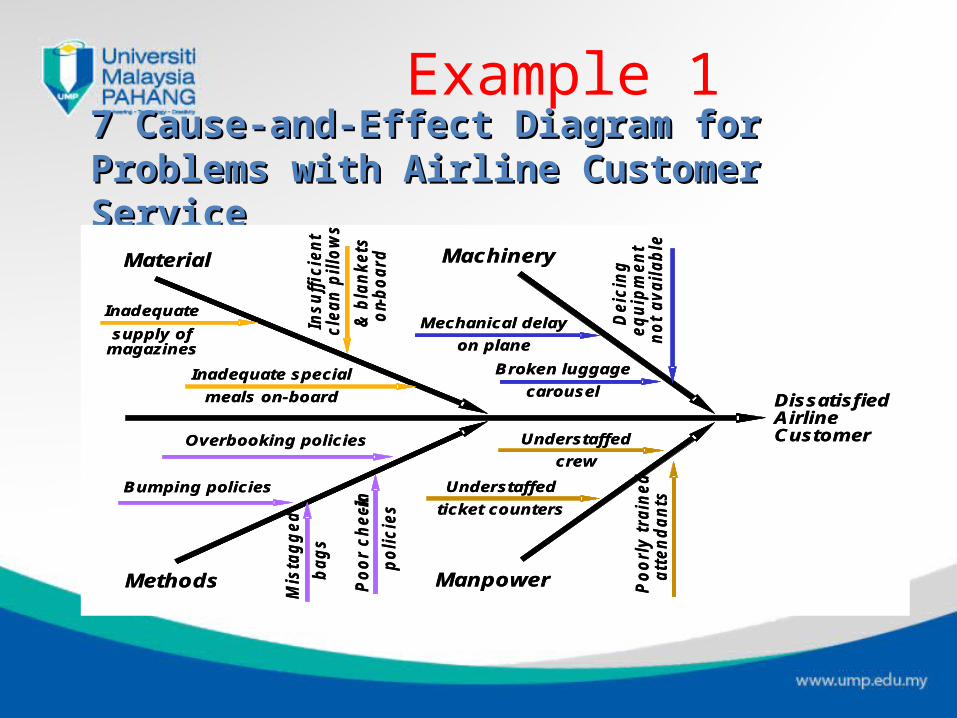
7 Cause-and-Effect Diagram for Problems with 7 Cause-and-Effect Diagram for Problems with Airline Customer ServiceAirline Customer Service
MaterialMaterial MachineryMachinery
MethodsMethods ManpowerManpower
Inadequate
supply of magazines
Inadequate special
meals on-board
Insu
ffic
ien
t cle
an
pillo
ws
& b
lan
kets
o
n-b
oard
Inadequate
supply of magazines
Inadequate special
meals on-board
Insu
ffic
ien
t cle
an
pillo
ws
& b
lan
kets
o
n-b
oard
Broken luggage
carousel
Mechanical delay
on plane
Deic
ing
eq
uip
men
t n
ot
avail
ab
le
Broken luggage
carousel
Mechanical delay
on plane
Deic
ing
eq
uip
men
t n
ot
avail
ab
le
Overbooking policies
Bumping policies
Mis
tag
ged
bag
s
Po
or
ch
ec
k-in
po
lic
ies
Overbooking policies
Bumping policies
Mis
tag
ged
bag
s
Po
or
ch
ec
k-in
po
lic
ies
Understaffed
ticket counters
Understaffed
crew
Po
orl
y t
rain
ed
att
en
da
nts
Understaffed
ticket counters
Understaffed
crew
Po
orl
y t
rain
ed
att
en
da
nts
Dissatisfied Airline Customer
Dissatisfied Airline Customer
Example 1
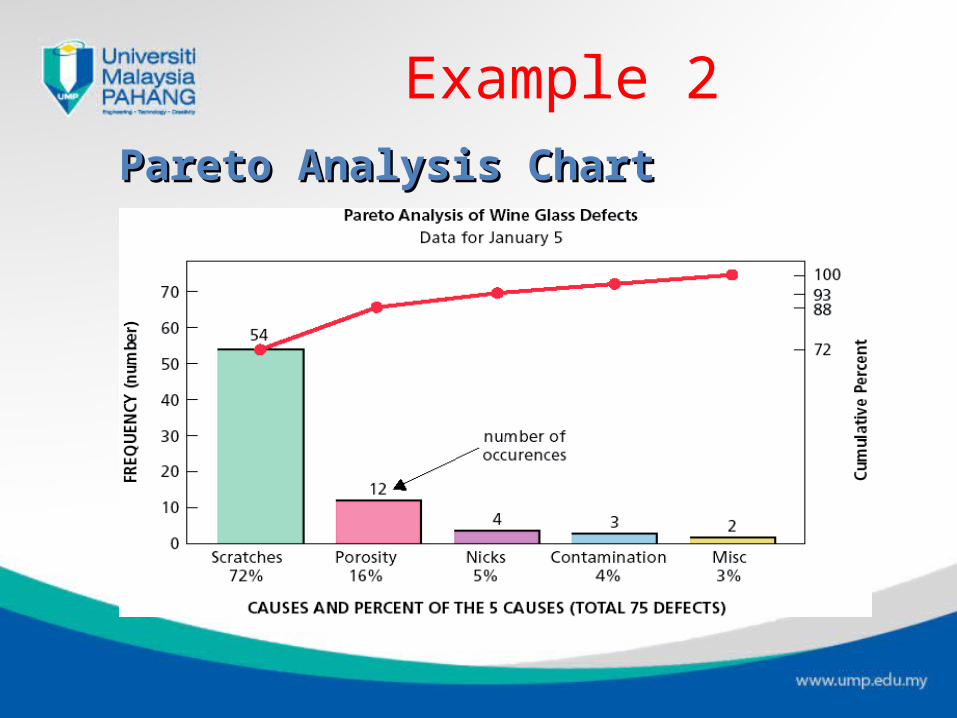
Example 2Pareto Analysis ChartPareto Analysis Chart
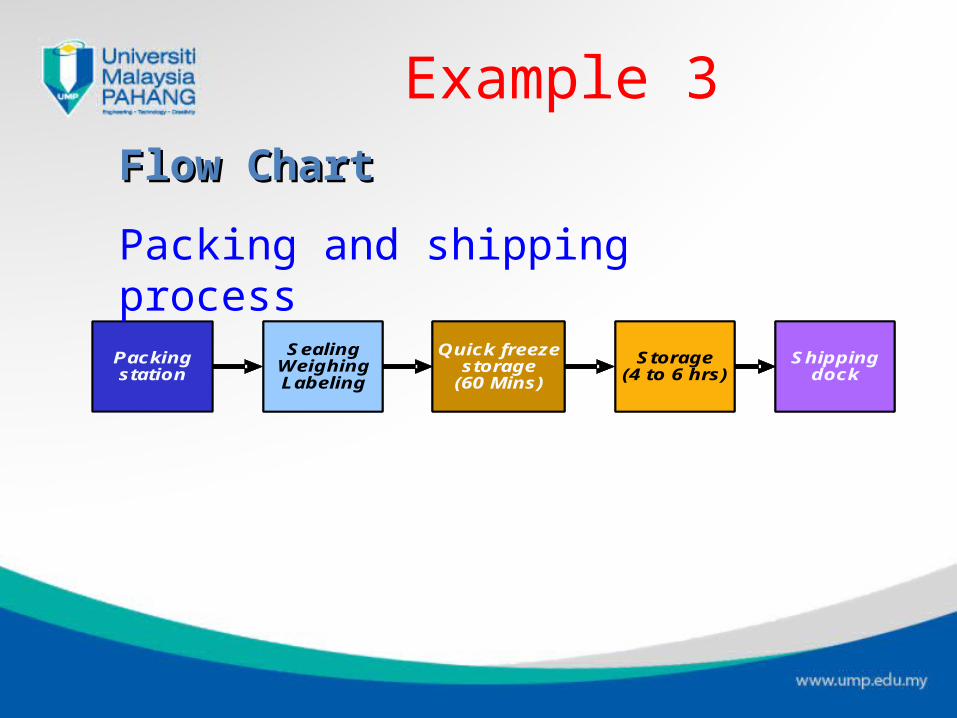
Shipping dock
Shipping dock
Shipping dock
Storage(4 to 6 hrs)
Storage(4 to 6 hrs)
Storage(4 to 6 hrs)
Quick freeze storage
(60 Mins)
Quick freeze storage
(60 Mins)
Quick freeze storage
(60 Mins)
Sealing Weighing Labeling
Sealing Weighing Labeling
Sealing Weighing Labeling
Packing station
Packing station
Packing and shipping process
Example 3Flow ChartFlow Chart
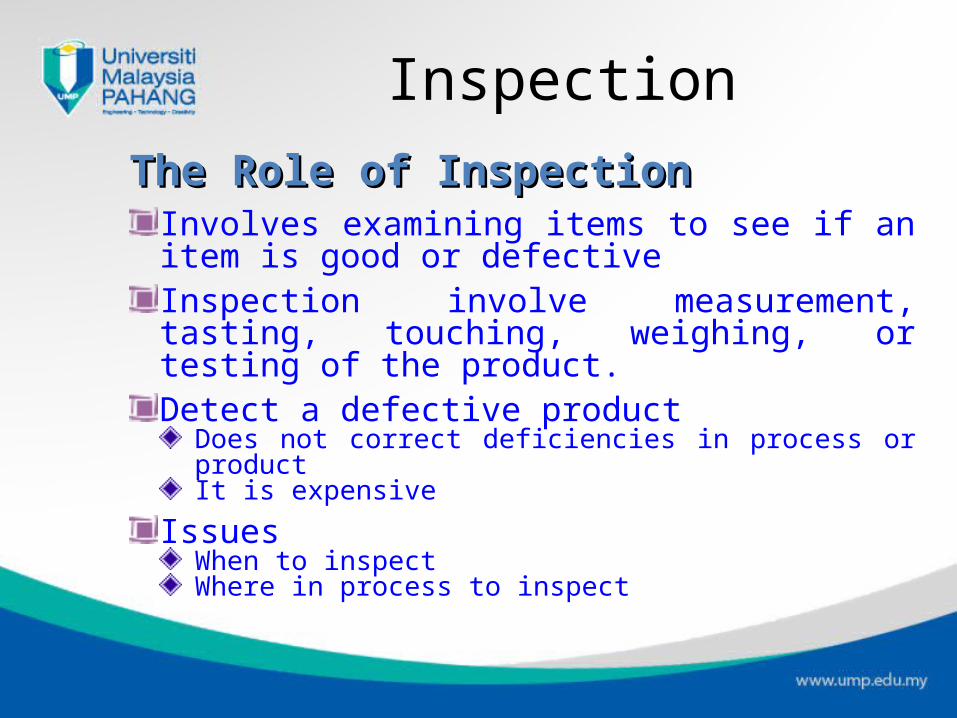
The Role of InspectionThe Role of InspectionInvolves examining items to see if an item is good or defectiveInspection involve measurement, tasting, touching, weighing, or testing of the product.Detect a defective product
Does not correct deficiencies in process or productIt is expensive
IssuesWhen to inspectWhere in process to inspect
Inspection
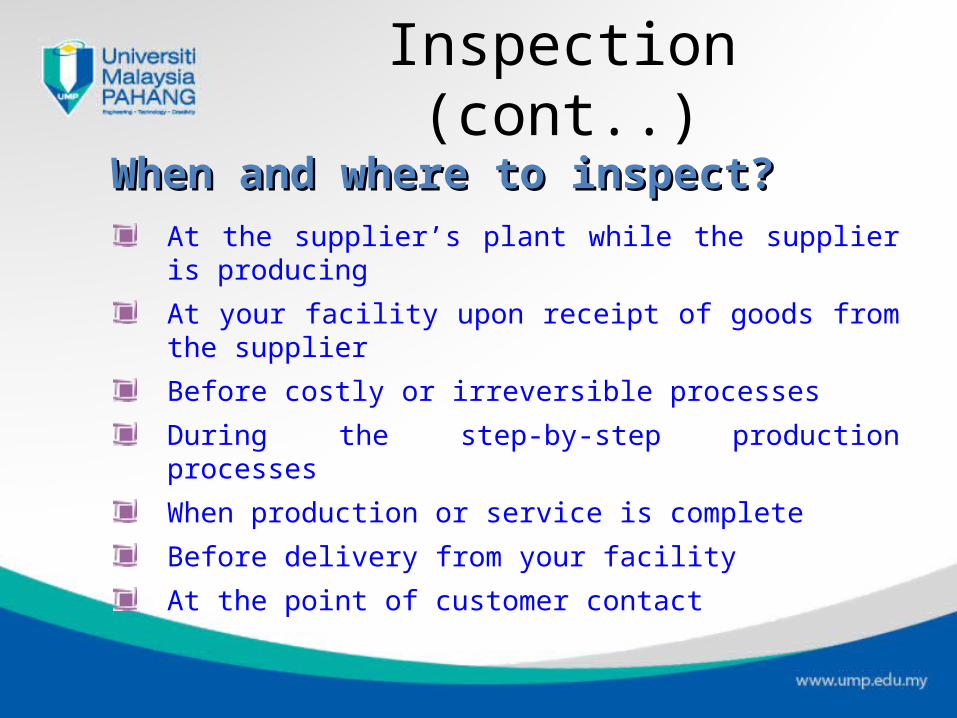
When and where to inspect?When and where to inspect?At the supplier’s plant while the supplier is producing
At your facility upon receipt of goods from the supplier
Before costly or irreversible processes
During the step-by-step production processes
When production or service is complete
Before delivery from your facility
At the point of customer contact
Inspection (cont..)
ProblemsProblems
Worker fatigue/abilityMeasurement errorProcess variability
Inspection (cont..)
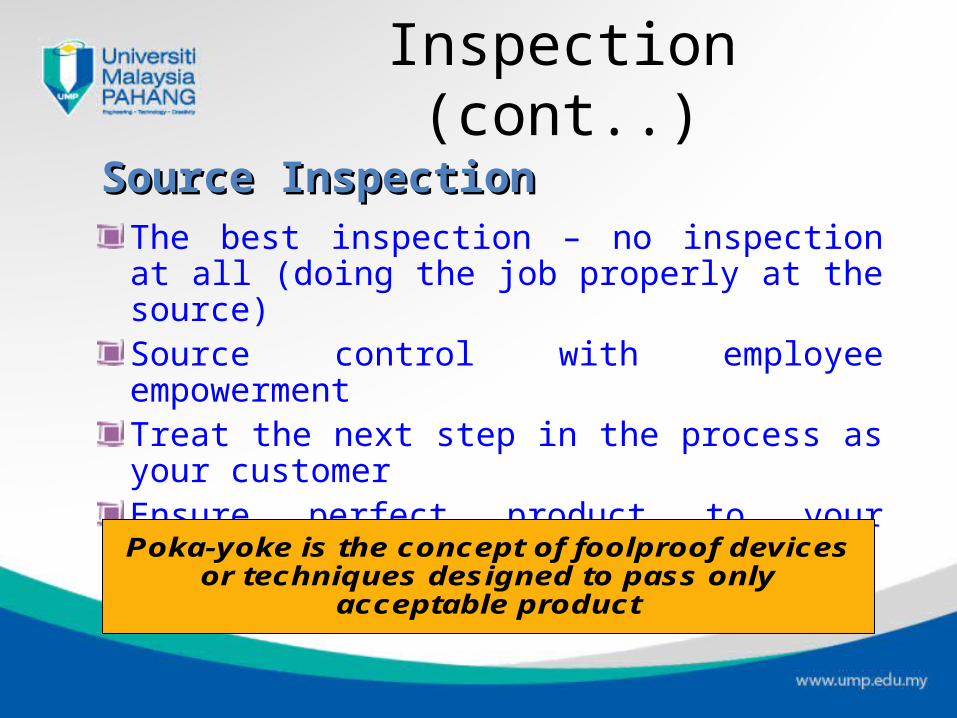
Source InspectionSource InspectionThe best inspection – no inspection at all (doing the job properly at the source) Source control with employee empowermentTreat the next step in the process as your customerEnsure perfect product to your customer
Poka-yoke is the concept of foolproof devices or techniques designed to pass only
acceptable product
Inspection (cont..)
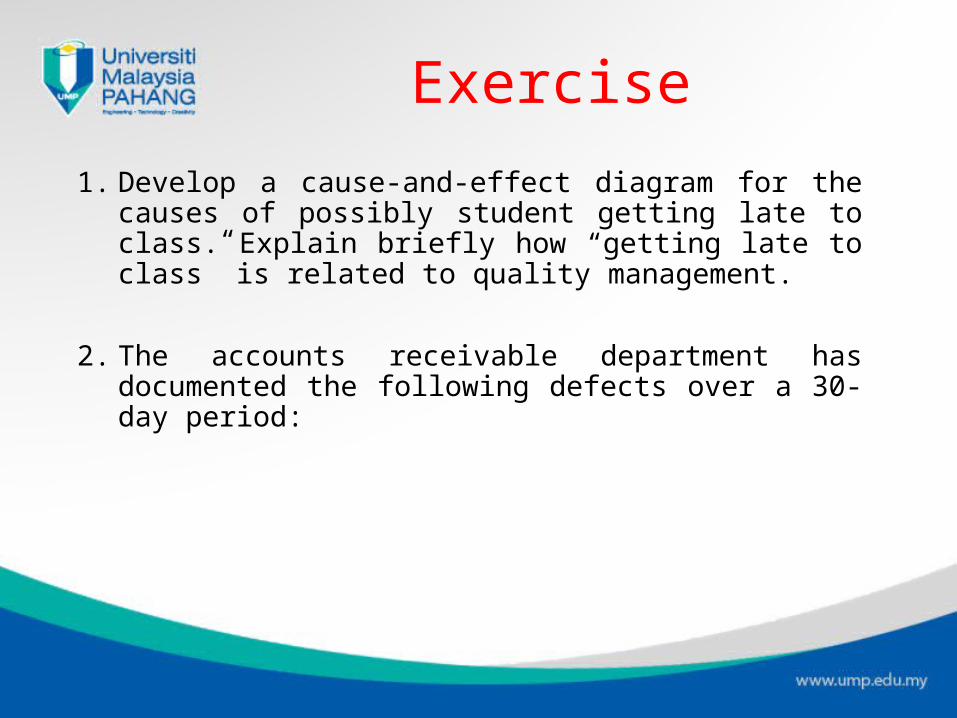
Exercise
1. Develop a cause-and-effect diagram for the causes of possibly student getting late to class. Explain briefly how “getting late to class” is related to quality management.
2. The accounts receivable department has documented the following defects over a 30-day period:
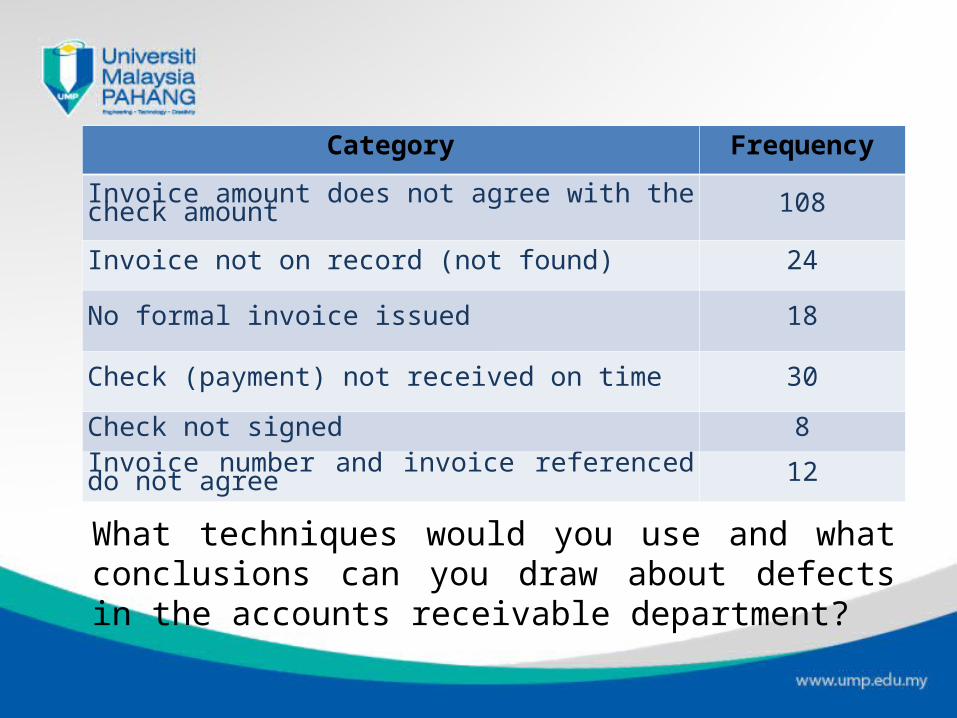
Category Frequency
Invoice amount does not agree with the check amount 108
Invoice not on record (not found) 24
No formal invoice issued 18
Check (payment) not received on time 30
Check not signed 8
Invoice number and invoice referenced do not agree 12
What techniques would you use and what conclusions can you draw about defects in the accounts receivable department?

Any Questions???

Thank You