bmo etf portfolio strategy report · portfolio strategy report second uarter 2016 3. changes to...
TRANSCRIPT
BMO ETF Portfolio Strategy Report
0
1
2
3
4
5
6
7
8
9
12/31 01/15 01/29 02/12 02/29 03/15
S&P /TSX Composite IndexS&P 500 Composite IndexDow Jones Industrial AverageNasdaq-100 Index
0%
10%
20%
30%
40%
50%
60%
70%
80%
90%
100%
% Stocks Above 50-Day MA % Stocks Above 200-Day MA
S&P/TSX Composite Index
S&P 500 Composite Index
In this report:
Recent Developments ............... 1
Things to Keep an Eye on ..........2
Changes to the Portfolio Strategy ....................3
Stats and Portfolio Holdings ...................................4
Portfolio Characteristics ..........5
The Good, the Bad, and the Ugly .............................6
All prices or returns as of market close on April 4, 2016, unless otherwise indicated.
Alfred Lee, CFA, CMT, DMS Vice President, BMO ETFsPortfolio Manager & Investment StrategistBMO Asset Management [email protected]
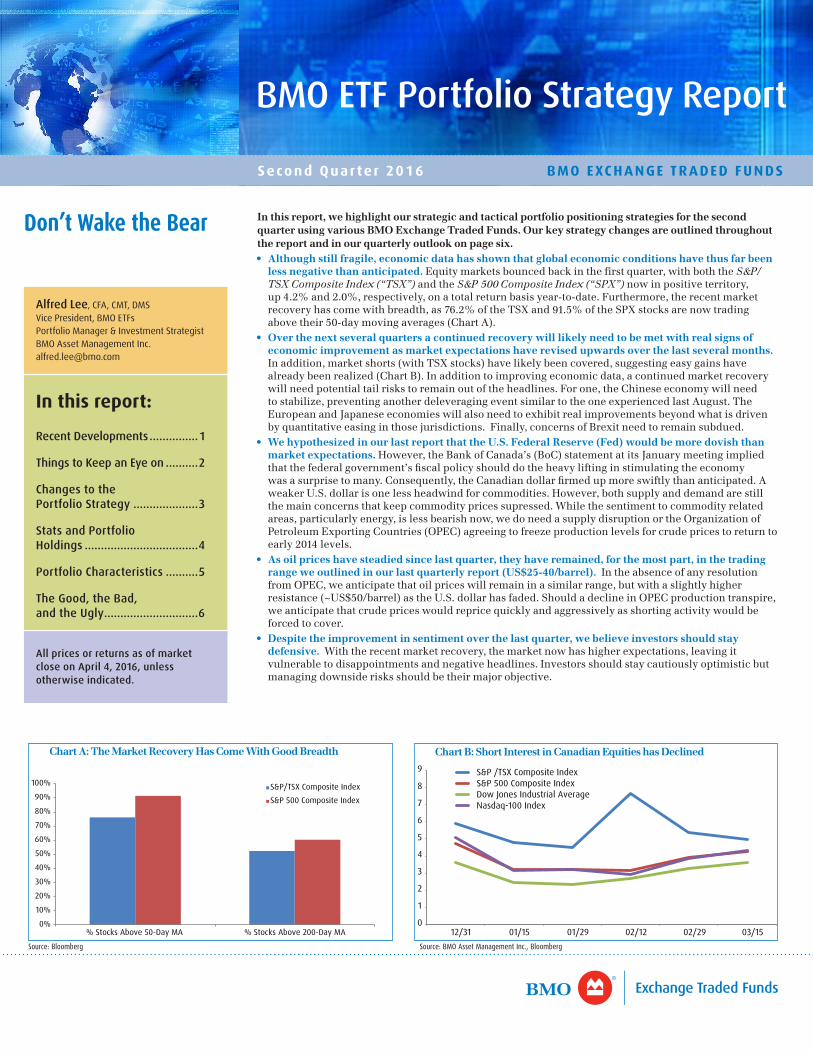
In this report, we highlight our strategic and tactical portfolio positioning strategies for the second quarter using various BMO Exchange Traded Funds. Our key strategy changes are outlined throughout the report and in our quarterly outlook on page six.• Although still fragile, economic data has shown that global economic conditions have thus far been
less negative than anticipated. Equitymarketsbouncedbackinthefirstquarter,withboththeS&P/TSX Composite Index (“TSX”)andtheS&P 500 Composite Index (“SPX”)nowinpositiveterritory,up4.2%and2.0%,respectively,onatotalreturnbasisyear-to-date.Furthermore,therecentmarketrecoveryhascomewithbreadth,as76.2%oftheTSXand91.5%oftheSPXstocksarenowtradingabovetheir50-daymovingaverages(ChartA).
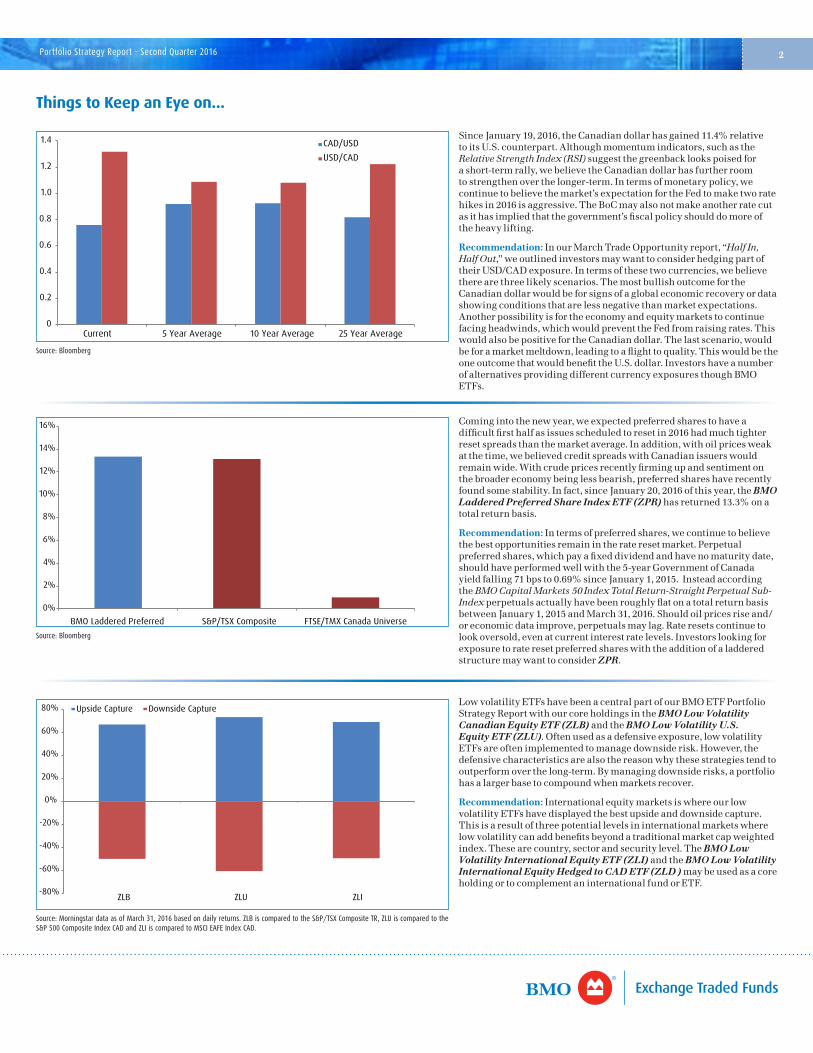
• Over the next several quarters a continued recovery will likely need to be met with real signs of economic improvement as market expectations have revised upwards over the last several months. Inaddition,marketshorts(withTSXstocks)havelikelybeencovered,suggestingeasygainshavealreadybeenrealized(ChartB).Inadditiontoimprovingeconomicdata,acontinuedmarketrecoverywillneedpotentialtailriskstoremainoutoftheheadlines.Forone,theChineseeconomywillneedtostabilize,preventinganotherdeleveragingeventsimilartotheoneexperiencedlastAugust.TheEuropeanandJapaneseeconomieswillalsoneedtoexhibitrealimprovementsbeyondwhatisdrivenbyquantitativeeasinginthosejurisdictions.Finally,concernsofBrexitneedtoremainsubdued.
• We hypothesized in our last report that the U.S. Federal Reserve (Fed) would be more dovish than market expectations. However,theBankofCanada’s(BoC)statementatitsJanuarymeetingimpliedthatthefederalgovernment’sfiscalpolicyshoulddotheheavyliftinginstimulatingtheeconomywasasurprisetomany.Consequently,theCanadiandollarfirmedupmoreswiftlythananticipated.AweakerU.S.dollarisonelessheadwindforcommodities.However,bothsupplyanddemandarestillthemainconcernsthatkeepcommoditypricessupressed.Whilethesentimenttocommodityrelatedareas,particularlyenergy,islessbearishnow,wedoneedasupplydisruptionortheOrganizationofPetroleumExportingCountries(OPEC)agreeingtofreezeproductionlevelsforcrudepricestoreturntoearly2014levels.
• As oil prices have steadied since last quarter, they have remained, for the most part, in the trading range we outlined in our last quarterly report (US$25-40/barrel). IntheabsenceofanyresolutionfromOPEC,weanticipatethatoilpriceswillremaininasimilarrange,butwithaslightlyhigherresistance(~US$50/barrel)astheU.S.dollarhasfaded.ShouldadeclineinOPECproductiontranspire,weanticipatethatcrudepriceswouldrepricequicklyandaggressivelyasshortingactivitywouldbeforcedtocover.
• Despite the improvement in sentiment over the last quarter, we believe investors should stay defensive. Withtherecentmarketrecovery,themarketnowhashigherexpectations,leavingitvulnerabletodisappointmentsandnegativeheadlines.Investorsshouldstaycautiouslyoptimisticbutmanagingdownsiderisksshouldbetheirmajorobjective.
Don’t Wake the Bear
Chart B: Short Interest in Canadian Equities has Declined
Source: Bloomberg Source: BMO Asset Management Inc., Bloomberg
Chart A: The Market Recovery Has Come With Good Breadth
BMO EXCHANGE TRADED FUNDSSecond Quar ter 2016
Portfolio Strategy Report – Second Quarter 2016 2
0
0.2
0.4
0.6
0.8
1.0
1.2
1.4
Current 5 Year Average 10 Year Average 25 Year Average
CAD/USDUSD/CAD
Things to Keep an Eye on...
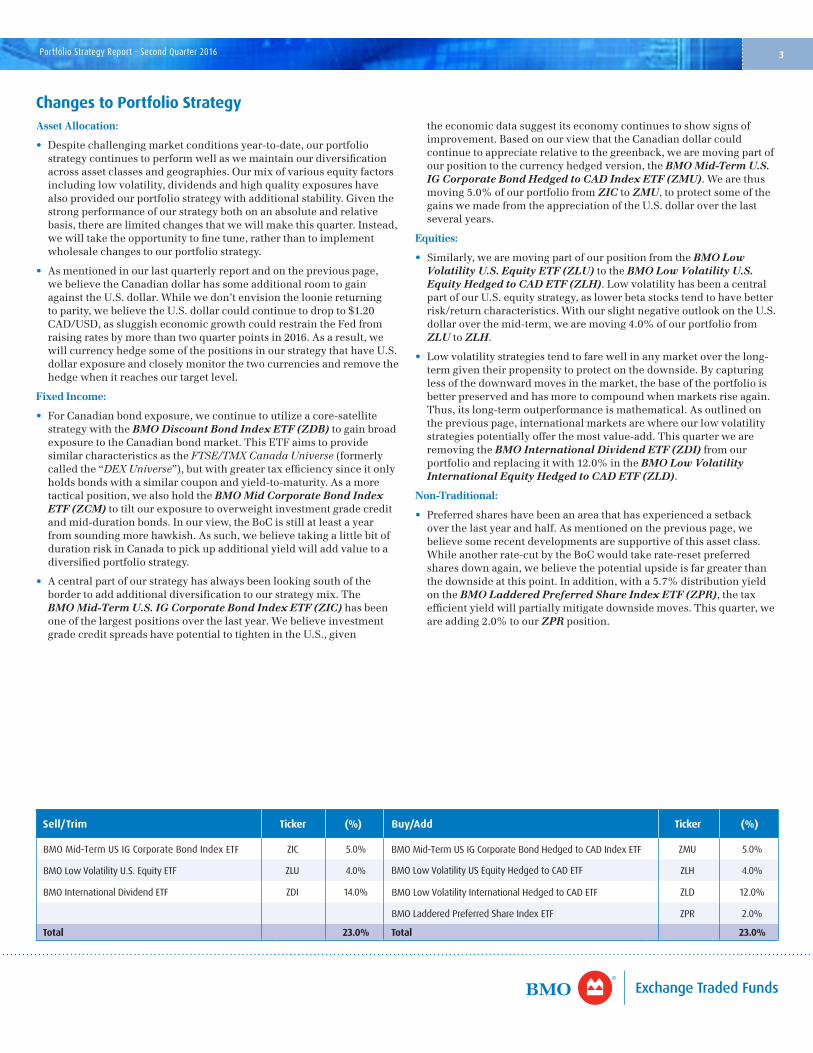
Comingintothenewyear,weexpectedpreferredsharestohaveadifficultfirsthalfasissuesscheduledtoresetin2016hadmuchtighterresetspreadsthanthemarketaverage.Inaddition,withoilpricesweakatthetime,webelievedcreditspreadswithCanadianissuerswouldremainwide.Withcrudepricesrecentlyfirmingupandsentimentonthebroadereconomybeinglessbearish,preferredshareshaverecentlyfoundsomestability.Infact,sinceJanuary20,2016ofthisyear,theBMO Laddered Preferred Share Index ETF (ZPR)hasreturned13.3%onatotalreturnbasis.
Recommendation:Intermsofpreferredshares,wecontinuetobelievethebestopportunitiesremainintherateresetmarket.Perpetualpreferredshares,whichpayafixeddividendandhavenomaturitydate,shouldhaveperformedwellwiththe5-yearGovernmentofCanadayieldfalling71bpsto0.69%sinceJanuary1,2015.InsteadaccordingtheBMO Capital Markets 50 Index Total Return-Straight Perpetual Sub-IndexperpetualsactuallyhavebeenroughlyflatonatotalreturnbasisbetweenJanuary1,2015andMarch31,2016.Shouldoilpricesriseand/oreconomicdataimprove,perpetualsmaylag.Rateresetscontinuetolookoversold,evenatcurrentinterestratelevels.InvestorslookingforexposuretorateresetpreferredshareswiththeadditionofaladderedstructuremaywanttoconsiderZPR.
SinceJanuary19,2016,theCanadiandollarhasgained11.4%relativetoitsU.S.counterpart.Althoughmomentumindicators,suchastheRelative Strength Index (RSI)suggestthegreenbacklookspoisedforashort-termrally,webelievetheCanadiandollarhasfurtherroomtostrengthenoverthelonger-term.Intermsofmonetarypolicy,wecontinuetobelievethemarket’sexpectationfortheFedtomaketworatehikesin2016isaggressive.TheBoCmayalsonotmakeanotherratecutasithasimpliedthatthegovernment’sfiscalpolicyshoulddomoreoftheheavylifting.
Recommendation:InourMarchTradeOpportunityreport,“Half In, Half Out,”weoutlinedinvestorsmaywanttoconsiderhedgingpartoftheirUSD/CADexposure.Intermsofthesetwocurrencies,webelievetherearethreelikelyscenarios.ThemostbullishoutcomefortheCanadiandollarwouldbeforsignsofaglobaleconomicrecoveryordatashowingconditionsthatarelessnegativethanmarketexpectations.Anotherpossibilityisfortheeconomyandequitymarketstocontinuefacingheadwinds,whichwouldpreventtheFedfromraisingrates.ThiswouldalsobepositivefortheCanadiandollar.Thelastscenario,wouldbeforamarketmeltdown,leadingtoaflighttoquality.ThiswouldbetheoneoutcomethatwouldbenefittheU.S.dollar.InvestorshaveanumberofalternativesprovidingdifferentcurrencyexposuresthoughBMOETFs.
Source: Bloomberg
LowvolatilityETFshavebeenacentralpartofourBMOETFPortfolioStrategyReportwithourcoreholdingsintheBMO Low Volatility Canadian Equity ETF (ZLB)andtheBMO Low Volatility U.S. Equity ETF (ZLU).Oftenusedasadefensiveexposure,lowvolatilityETFsareoftenimplementedtomanagedownsiderisk.However,thedefensivecharacteristicsarealsothereasonwhythesestrategiestendtooutperformoverthelong-term.Bymanagingdownsiderisks,aportfoliohasalargerbasetocompoundwhenmarketsrecover.
Recommendation:InternationalequitymarketsiswhereourlowvolatilityETFshavedisplayedthebestupsideanddownsidecapture.Thisisaresultofthreepotentiallevelsininternationalmarketswherelowvolatilitycanaddbenefitsbeyondatraditionalmarketcapweightedindex.Thesearecountry,sectorandsecuritylevel.TheBMO Low Volatility International Equity ETF (ZLI)andtheBMO Low Volatility International Equity Hedged to CAD ETF (ZLD )maybeusedasacoreholdingortocomplementaninternationalfundorETF.
Source: Morningstar data as of March 31, 2016 based on daily returns. ZLB is compared to the S&P/TSX Composite TR, ZLU is compared to the S&P 500 Composite Index CAD and ZLI is compared to MSCI EAFE Index CAD.
Source: Bloomberg
-80%
-60%
-40%
-20%
0%
20%
40%
60%
80%
ZLB ZLU ZLI
Upside Capture Downside Capture
0%
2%
4%
6%
8%
10%
12%
14%
16%
BMO Laddered Preferred Share Index ETF (ZPR)
S&P/TSX Composite FTSE/TMX Canada Universe
Portfolio Strategy Report – Second Quarter 2016 3
Changes to Portfolio StrategyAsset Allocation:
• Despitechallengingmarketconditionsyear-to-date,ourportfoliostrategycontinuestoperformwellaswemaintainourdiversificationacrossassetclassesandgeographies.Ourmixofvariousequityfactorsincludinglowvolatility,dividendsandhighqualityexposureshavealsoprovidedourportfoliostrategywithadditionalstability.Giventhestrongperformanceofourstrategybothonanabsoluteandrelativebasis,therearelimitedchangesthatwewillmakethisquarter.Instead,wewilltaketheopportunitytofinetune,ratherthantoimplementwholesalechangestoourportfoliostrategy.
• Asmentionedinourlastquarterlyreportandonthepreviouspage,webelievetheCanadiandollarhassomeadditionalroomtogainagainsttheU.S.dollar.Whilewedon’tenvisionthelooniereturningtoparity,webelievetheU.S.dollarcouldcontinuetodropto$1.20CAD/USD,assluggisheconomicgrowthcouldrestraintheFedfromraisingratesbymorethantwoquarterpointsin2016.Asaresult,wewillcurrencyhedgesomeofthepositionsinourstrategythathaveU.S.dollarexposureandcloselymonitorthetwocurrenciesandremovethehedgewhenitreachesourtargetlevel.
Fixed Income:
• ForCanadianbondexposure,wecontinuetoutilizeacore-satellitestrategywiththeBMO Discount Bond Index ETF (ZDB)togainbroadexposuretotheCanadianbondmarket.ThisETFaimstoprovidesimilarcharacteristicsastheFTSE/TMX Canada Universe(formerlycalledthe“DEX Universe”),butwithgreatertaxefficiencysinceitonlyholdsbondswithasimilarcouponandyield-to-maturity.Asamoretacticalposition,wealsoholdtheBMO Mid Corporate Bond Index ETF (ZCM)totiltourexposuretooverweightinvestmentgradecreditandmid-durationbonds.Inourview,theBoCisstillatleastayearfromsoundingmorehawkish.Assuch,webelievetakingalittlebitofdurationriskinCanadatopickupadditionalyieldwilladdvaluetoadiversifiedportfoliostrategy.
• Acentralpartofourstrategyhasalwaysbeenlookingsouthofthebordertoaddadditionaldiversificationtoourstrategymix.TheBMO Mid-Term U.S. IG Corporate Bond Index ETF (ZIC)hasbeenoneofthelargestpositionsoverthelastyear.WebelieveinvestmentgradecreditspreadshavepotentialtotightenintheU.S.,given
theeconomicdatasuggestitseconomycontinuestoshowsignsofimprovement.BasedonourviewthattheCanadiandollarcouldcontinuetoappreciaterelativetothegreenback,wearemovingpartofourpositiontothecurrencyhedgedversion,theBMO Mid-Term U.S. IG Corporate Bond Hedged to CAD Index ETF (ZMU).Wearethusmoving5.0%ofourportfoliofromZICtoZMU,toprotectsomeofthegainswemadefromtheappreciationoftheU.S.dollaroverthelastseveralyears.
Equities:
• Similarly,wearemovingpartofourpositionfromtheBMO Low Volatility U.S. Equity ETF (ZLU)totheBMO Low Volatility U.S. Equity Hedged to CAD ETF (ZLH).LowvolatilityhasbeenacentralpartofourU.S.equitystrategy,aslowerbetastockstendtohavebetterrisk/returncharacteristics.WithourslightnegativeoutlookontheU.S.dollaroverthemid-term,wearemoving4.0%ofourportfoliofromZLUtoZLH.
• Lowvolatilitystrategiestendtofarewellinanymarketoverthelong-termgiventheirpropensitytoprotectonthedownside.Bycapturinglessofthedownwardmovesinthemarket,thebaseoftheportfolioisbetterpreservedandhasmoretocompoundwhenmarketsriseagain.Thus,itslong-termoutperformanceismathematical.Asoutlinedonthepreviouspage,internationalmarketsarewhereourlowvolatilitystrategiespotentiallyofferthemostvalue-add.ThisquarterweareremovingtheBMO International Dividend ETF (ZDI)fromourportfolioandreplacingitwith12.0%intheBMO Low Volatility International Equity Hedged to CAD ETF (ZLD).
Non-Traditional:
• Preferredshareshavebeenanareathathasexperiencedasetbackoverthelastyearandhalf.Asmentionedonthepreviouspage,webelievesomerecentdevelopmentsaresupportiveofthisassetclass.Whileanotherrate-cutbytheBoCwouldtakerate-resetpreferredsharesdownagain,webelievethepotentialupsideisfargreaterthanthedownsideatthispoint.Inaddition,witha5.7%distributionyieldontheBMO Laddered Preferred Share Index ETF (ZPR),thetaxefficientyieldwillpartiallymitigatedownsidemoves.Thisquarter,weareadding2.0%toourZPRposition.
Sell/Trim Ticker (%) Buy/Add Ticker (%)
ZIC 5.0% ZMU 5.0%
ZLU 4.0%
BMO Mid-Term US IG Corporate Bond Hedged to CAD Index ETF
BMO Low Volatility US Equity Hedged to CAD ETF ZLH 4.0%
BMO Mid-Term US IG Corporate Bond Index ETF
BMO Low Volatility U.S. Equity ETF
BMO International Dividend ETF ZDI 14.0% BMO Low Volatility International Hedged to CAD ETF ZLD 12.0%
BMO Laddered Preferred Share Index ETF ZPR 2.0%
Total 23.0% Total 23.0%
Portfolio Strategy Report – Second Quarter 2016 4
Ticker ETF Name Position Price Management Fee1
Weight (%)
90-Day Vol
Volatility Contribution
Yield (%)*
Yield/Vol
Fixed Income
ZDB BMO DISCOUNT BOND INDEX ETF Fixed Income Core $16.13 0.20% 11.0% 4.1 3.3% 1.9% 0.46
ZIC BMO MID-TERM U.S. IG CORPORATE BOND INDEX ETF Fixed Income Tactical $18.95 0.25% 10.0% 12.9 9.6% 3.4% 0.26
ZMU BMO MID-TERM US IG CORPORATE BOND HEDGED TO CAD INDEX ETF Fixed Income Tactical $15.13 0.25% 5.0% 5.3 2.0% 3.3% 0.62
ZCM BMO MID CORPORATE BOND INDEX ETF Fixed Income Tactical $16.38 0.12% 9.0% 5.8 3.9% 3.2% 0.54
Total Fixed Income 35.0% 18.8%
Equities
ZLB BMO LOW VOLATILITY CANADIAN EQUITY ETF Equity Core $27.27 0.35% 11.5% 13.6 11.7% 2.3% 0.17
ZLU BMO LOW VOLATILITY U.S. EQUITY ETF Equity Core $29.34 0.30% 7.0% 13.9 7.3% 1.9% 0.13
ZLH BMO LOW VOLATILITY US EQUITY HEDGED TO CAD ETF Equity Core $21.47 0.30% 4.0% 9.0 2.7% 1.9% 0.21
ZLD BMO LOW VOLATILITY INTERNATIONAL EQUITY HEDGED TO CAD ETF Equity Core $20.12 0.40% 12.0% 13.1 11.7% 1.9% 0.14
ZEQ BMO MSCI EUROPE HIGH QUALITY HEDGED TO CAD ETF Equity Tactical $16.73 0.40% 10.0% 21.1 15.7% 2.1% 0.10
ZWB BMO COVERED CALL BANKS ETF Equity Tactical $15.87 0.65% 3.0% 20.1 4.5% 5.9% 0.29
ZWA BMO COVERED CALL DOW JONES INDUSTRIAL AVERAGE HEDGED TO C$ ETF Equity Tactical $18.59 0.65% 3.0% 16.7 3.7% 5.2% 0.31
ZBK BMO EQUAL WEIGHT U.S. BANKS INDEX ETF Equity Tactical $15.77 0.35% 4.0% 27.9 8.3% 1.8% 0.06
Total Equity 54.5% 65.6%
Non-Traditional/Hybrids
ZFH BMO FLOATING RATE HIGH YIELD ETF Equity Tactical $14.62 0.40% 3.5% 10.9 2.8% 4.9% 0.45
ZPR BMO S&P/TSX LADDERED PREFERRED INDEX ETF Fixed Income Tactical $9.57 0.45% 7.0% 24.4 12.7% 5.7% 0.23
Total Alternatives 10.5% 15.6%
Total Cash 0.0% 0.1 0.0% 0.0%
Portfolio 0.31% 100.0% 13.4 100.0% 2.9% 0.211 Management Fee as of January 11, 2016.
Ticker Top Holdings Weight
ZLD BMO LOW VOLATILITY INTERNATIONAL EQUITY HEDGED TO CAD ETF
12.0%
ZLB BMO LOW VOLATILITY CANADIAN EQUITY ETF 11.5%
ZDB BMO DISCOUNT BOND INDEX ETF 11.0%
ZIC BMO MID-TERM U.S. IG CORPORATE BOND INDEX ETF 10.0%
ZEQ BMO MSCI EUROPE HIGH QUALITY HEDGED TO CAD ETF 10.0%
ZCM BMO MID CORPORATE BOND INDEX ETF 9.0%
ZLU BMO LOW VOLATILITY U.S. EQUITY ETF 7.0%
ZPR BMO S&P/TSX LADDERED PREFERRED INDEX ETF 7.0%
ZMU BMO MID-TERM US IG CORPORATE BOND HEDGED TO CAD INDEX ETF 5.0%
ZLH BMO LOW VOLATILITY US EQUITY HEDGED TO CAD ETF 4.0%
ZBK BMO EQUAL WEIGHT U.S. BANKS INDEX ETF 4.0%
ZFH BMO FLOATING RATE HIGH YIELD ETF 3.5%
ZWB BMO COVERED CALL BANKS ETF 3.0%
ZWA BMO COVERED CALL DOW JONES INDUSTRIAL AVERAGE HEDGED TO C$ ETF 3.0%
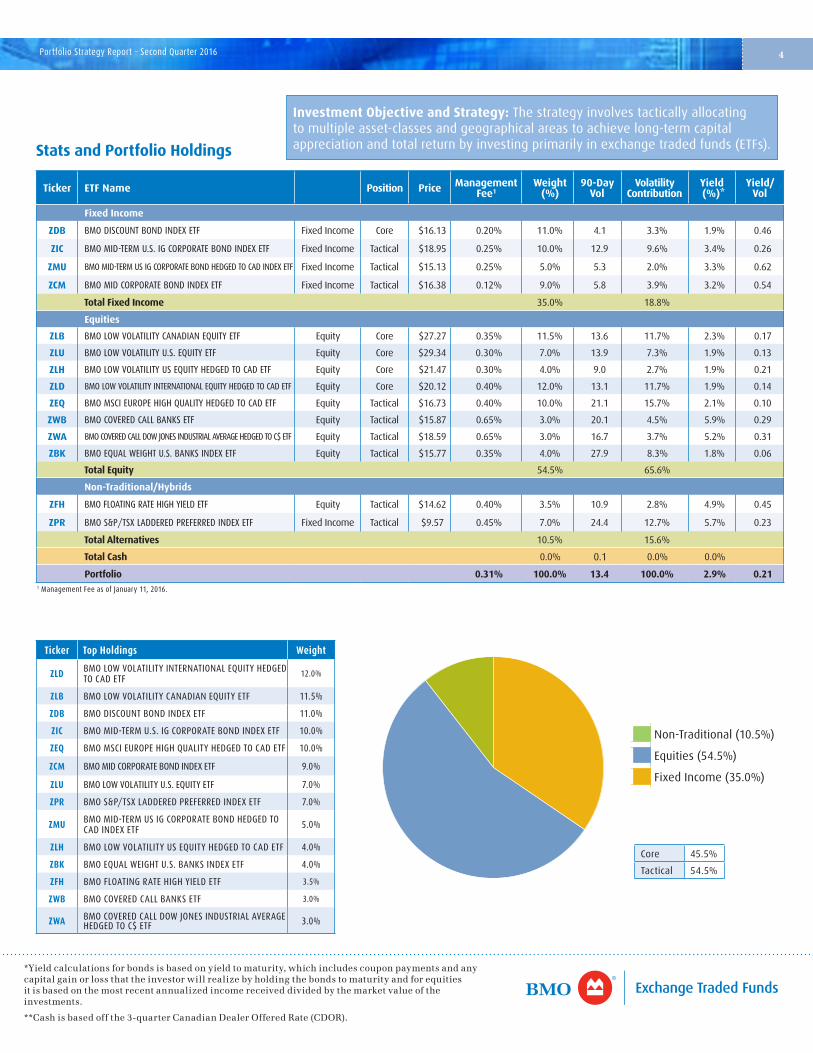
Core 45.5%
Tactical 54.5%
Cash
Alternatives
Equities
Fixed Income
Stats and Portfolio Holdings
Investment Objective and Strategy: The strategy involves tactically allocating to multiple asset-classes and geographical areas to achieve long-term capital appreciation and total return by investing primarily in exchange traded funds (ETFs).
Non-Traditional (10.5%)
Equities (54.5%)
Fixed Income (35.0%)
*Yieldcalculationsforbondsisbasedonyieldtomaturity,whichincludescouponpaymentsandanycapitalgainorlossthattheinvestorwillrealizebyholdingthebondstomaturityandforequitiesitisbasedonthemostrecentannualizedincomereceiveddividedbythemarketvalueoftheinvestments.
**Cashisbasedoffthe3-quarterCanadianDealerOfferedRate(CDOR).
Portfolio Strategy Report – Second Quarter 2016 5
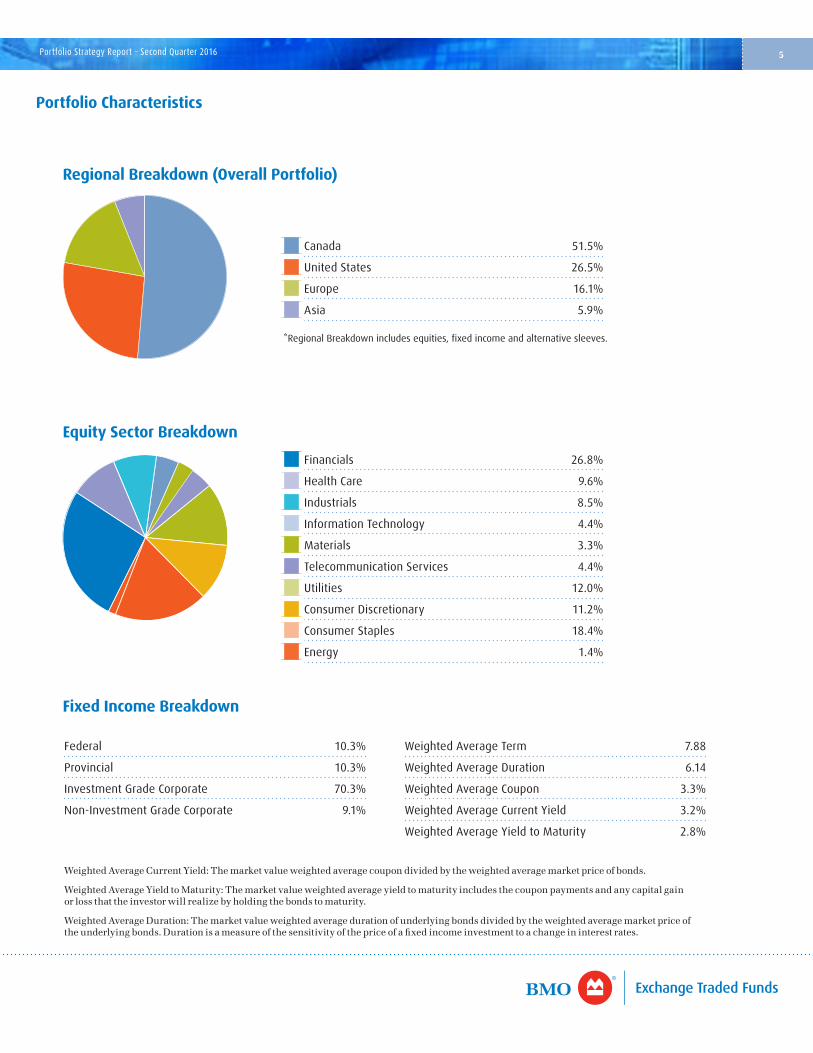
Portfolio Characteristics
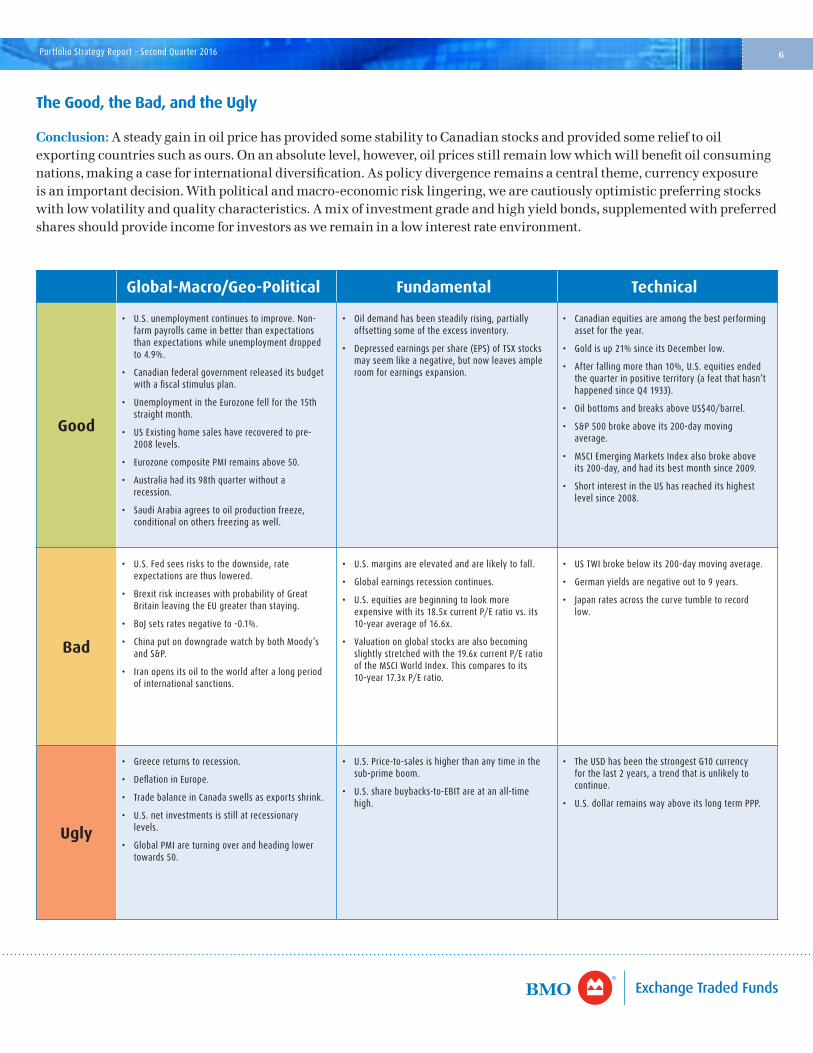
Financials 26.8%
Health Care 9.6%
Industrials 8.5%
Information Technology 4.4%
Materials 3.3%
Telecommunication Services 4.4%
Utilities 12.0%
Consumer Discretionary 11.2%
Consumer Staples 18.4%
Energy 1.4%
Canada 51.5%
United States 26.5%
Europe 16.1%
Asia 5.9%
Federal 10.3%
Provincial 10.3%
Investment Grade Corporate 70.3%
Non-Investment Grade Corporate 9.1%
Weighted Average Term 7.88
Weighted Average Duration 6.14
Weighted Average Coupon 3.3%
Weighted Average Current Yield 3.2%
Weighted Average Yield to Maturity 2.8%
Equity Sector Breakdown
Regional Breakdown (Overall Portfolio)
Fixed Income Breakdown
Utilities
Telecommunication Services
Materials
Information Technology
Industrials
Health Care
Financials
Energy
Consumer Staples
Consumer Discretionary
Cash
Emerging Markets
United States
Canada
WeightedAverageCurrentYield:Themarketvalueweightedaveragecoupondividedbytheweightedaveragemarketpriceofbonds.
WeightedAverageYieldtoMaturity:Themarketvalueweightedaverageyieldtomaturityincludesthecouponpaymentsandanycapitalgainorlossthattheinvestorwillrealizebyholdingthebondstomaturity.
WeightedAverageDuration:Themarketvalueweightedaveragedurationofunderlyingbondsdividedbytheweightedaveragemarketpriceoftheunderlyingbonds.Durationisameasureofthesensitivityofthepriceofafixedincomeinvestmenttoachangeininterestrates.
*Regional Breakdown includes equities, fixed income and alternative sleeves.
Portfolio Strategy Report – Second Quarter 2016 6
The Good, the Bad, and the Ugly
Conclusion: AsteadygaininoilpricehasprovidedsomestabilitytoCanadianstocksandprovidedsomerelieftooilexportingcountriessuchasours.Onanabsolutelevel,however,oilpricesstillremainlowwhichwillbenefitoilconsumingnations,makingacaseforinternationaldiversification.Aspolicydivergenceremainsacentraltheme,currencyexposureisanimportantdecision.Withpoliticalandmacro-economicrisklingering,wearecautiouslyoptimisticpreferringstockswithlowvolatilityandqualitycharacteristics.Amixofinvestmentgradeandhighyieldbonds,supplementedwithpreferredsharesshouldprovideincomeforinvestorsasweremaininalowinterestrateenvironment.
Global-Macro/Geo-Political Fundamental Technical
Good
• U.S.unemploymentcontinuestoimprove.Non-farm payrolls came in better than expectations than expectations while unemployment dropped to 4.9%.
• Canadianfederalgovernmentreleaseditsbudgetwith a fiscal stimulus plan.
• UnemploymentintheEurozonefellforthe15thstraight month.
• USExistinghomesaleshaverecoveredtopre-2008levels.
• EurozonecompositePMIremainsabove50.
• Australiahadits98thquarterwithoutarecession.
• SaudiArabiaagreestooilproductionfreeze,conditionalonothersfreezingaswell.
• Oildemandhasbeensteadilyrising,partiallyoffsettingsomeoftheexcessinventory.
• Depressedearningspershare(EPS)ofTSXstocksmayseemlikeanegative,butnowleavesampleroom for earnings expansion.
• Canadianequitiesareamongthebestperformingasset for the year.
• Goldisup21%sinceitsDecemberlow.
• Afterfallingmorethan10%,U.S.equitiesendedthequarterinpositiveterritory(afeatthathasn’thappenedsinceQ41933).
• OilbottomsandbreaksaboveUS$40/barrel.
• S&P500brokeaboveits200-daymovingaverage.
• MSCIEmergingMarketsIndexalsobrokeaboveits 200-day, and had its best month since 2009.
• ShortinterestintheUShasreacheditshighestlevelsince2008.
Bad
• U.S.Fedseesriskstothedownside,rateexpectations are thus lowered.
• BrexitriskincreaseswithprobabilityofGreatBritainleavingtheEUgreaterthanstaying.
• BoJsetsratesnegativeto-0.1%.
• ChinaputondowngradewatchbybothMoody’sand S&P.
• Iranopensitsoiltotheworldafteralongperiodof international sanctions.
• U.S.marginsareelevatedandarelikelytofall.
• Globalearningsrecessioncontinues.
• U.S.equitiesarebeginningtolookmoreexpensivewithits18.5xcurrentP/Eratiovs.its10-yearaverageof16.6x.
• Valuationonglobalstocksarealsobecomingslightly stretched with the 19.6x current P/E ratio of the MSCI World Index. This compares to its 10-year 17.3x P/E ratio.
• USTWIbrokebelowits200-daymovingaverage.
• Germanyieldsarenegativeoutto9years.
• Japanratesacrossthecurvetumbletorecordlow.
Ugly
• Greecereturnstorecession.
• DeflationinEurope.
• TradebalanceinCanadaswellsasexportsshrink.
• U.S.netinvestmentsisstillatrecessionarylevels.
• GlobalPMIareturningoverandheadinglowertowards 50.
• U.S.Price-to-salesishigherthananytimeinthesub-prime boom.
• U.S.sharebuybacks-to-EBITareatanall-timehigh.
• TheUSDhasbeenthestrongestG10currencyforthelast2years,atrendthatisunlikelytocontinue.
• U.S.dollarremainswayaboveitslongtermPPP.
”S&P®” and “S&P 500®” are trademarks of Standard & Poor’s Financial Services LLC (“S&P”) and “TSX” is a trademark of TSX Inc. These trademarks have been licensed for use by S&P Dow Jones Indices LLC and sublicensed to BMO Asset Management Inc. in connection with ZSP, ZIN, ZEO and ZPR. ZSP, ZIN , ZEO and ZPR are not sponsored, endorsed, sold or promoted by S&P Dow Jones LLC, S&P, TSX, or their respective affiliates and S&P Dow Jones Indices LLC, S&P, TSX and their affiliates make no representation regarding the advisability of trading or investing in such ETFs.
The Dow Jones Industrial Average Index is a product of S&P Dow Jones Indices LLC and has been licensed for use by the BMO Asset Management Inc. Dow Jones®, Dow Jones Industrial Average®, and DJIA® are registered trademarks of Dow Jones Trademark Holdings LLC (“Dow Jones”), and have been licensed to S&P Dow Jones Indices LLC and and sublicensed for use by BMO Asset Management Inc. in connection with ZWA. ZWA is not sponsored, endorsed, sold or promoted by S&P Dow Jones Indices LLC, Dow Jones, or their respective affiliates, and S&P Dow Jones Indices LLC, Dow Jones and their respective affiliates make no representation regarding the advisability of trading or investing in such ETF.
The exchange traded funds referred to herein are not sponsored, endorsed or promoted by MSCI, and MSCI bears no liability with respect to any such exchange traded funds or any index on which such exchange traded funds are based. The prospectus contains more detailed description of the limited relationship MSCI has with BMO Asset Management Inc. and any related exchanged traded fund.
This communication is intended for informational purposes only and is not, and should not be construed as, investment and/or tax advice to any individual. Particular investments and/or trading strategies should be evaluated relative to each individual’s circumstances. Individuals should seek the advice of professionals, as appropriate, regarding any particular investment.
BMO ETFs are managed and administered by BMO Asset Management Inc., an investment fund manager and portfolio manager, and separate legal entity from Bank of Montreal.
Commissions, management fees and expenses all may be associated with investments in exchange traded funds. The indicated rates of return are the historical annual compound total returns including changes in prices and reinvestment of all distributions and do not take into account commission charges or income taxes payable by any unitholder that would have reduced returns. Please read the prospectus before investing. Exchange traded funds are not guaranteed, their value change frequently and past performance may not be repeated.
® “BMO (M-bar roundel symbol)” is registered trade-mark of Bank of Montreal, used under licence.
Visit bmo.com/etfs or contact Client Services at 1-800-361-1392.
Portfolio Strategy Report – Second Quarter 2016 7