bmo mutual funds 2017 - personal banking mutual funds 2017 annual financial statements september 30,...
TRANSCRIPT

BMO Mutual Funds 2017Annual Financial Statements
September 30, 2017
BMO Global Strategic Bond Fund
Independent Auditor’s Report
To the Unitholders and Trustee of:BMO Canadian Equity FundBMO Canadian Small Cap Equity FundBMO Resource FundBMO Mortgage and Short-Term Income Fund BMO Money Market FundBMO Bond FundBMO Canadian Equity ETF FundBMO Asset Allocation FundBMO Dividend FundBMO Precious Metals FundBMO Monthly Income FundBMO Diversified Income PortfolioBMO Global Infrastructure FundBMO Laddered Corporate Bond FundBMO Emerging Markets Bond FundBMO Core Plus Bond FundBMO Core Bond FundBMO Target Education Income PortfolioBMO Target Education 2020 PortfolioBMO Target Education 2025 PortfolioBMO Target Education 2030 PortfolioBMO Target Education 2035 PortfolioBMO Tactical Global Bond ETF FundBMO Tactical Global Equity ETF FundBMO Global Balanced FundBMO U.S. Dividend FundBMO Retirement Income PortfolioBMO Retirement Conservative PortfolioBMO Retirement Balanced PortfolioBMO Ascent Income PortfolioBMO Ascent Conservative PortfolioBMO Ascent Balanced PortfolioBMO Ascent Growth PortfolioBMO Ascent Equity Growth PortfolioBMO LifeStage Plus 2020 Fund BMO LifeStage Plus 2025 Fund BMO LifeStage Plus 2030 Fund BMO LifeStage Plus 2022 Fund BMO LifeStage Plus 2026 FundBMO SelectTrust Fixed Income Portfolio BMO FundSelect Income PortfolioBMO FundSelect Balanced Portfolio BMO FundSelect Growth Portfolio BMO FundSelect Equity Growth Portfolio
BMO Fixed Income Yield Plus ETF PortfolioBMO Balanced Yield Plus ETF PortfolioBMO Fixed Income ETF PortfolioBMO Income ETF PortfolioBMO Conservative ETF PortfolioBMO Balanced ETF PortfolioBMO Growth ETF PortfolioBMO Equity Growth ETF PortfolioBMO World Bond FundBMO Emerging Markets FundBMO European FundBMO North American Dividend FundBMO U.S. Equity ETF FundBMO U.S. Equity FundBMO Global Dividend Fund BMO International Equity ETF FundBMO Global Monthly Income FundBMO Preferred Share FundBMO Tactical Dividend ETF FundBMO Global Strategic Bond FundBMO U.S. High Yield Bond FundBMO Tactical Balanced ETF FundBMO Growth Opportunities FundBMO Global Equity FundBMO U.S. Equity Plus FundBMO U.S. Dollar Money Market FundBMO U.S. Dollar Equity Index FundBMO U.S. Dollar Monthly Income FundBMO U.S. Dollar Dividend FundBMO U.S. Dollar Balanced FundBMO Risk Reduction Equity FundBMO Risk Reduction Fixed Income FundBMO Covered Call Canadian Banks ETF FundBMO Covered Call Europe High DividendETF FundBMO Fossil Fuel Free FundBMO Tactical Global Asset Allocation ETF FundBMO Tactical Global Growth ETF FundBMO Covered Call U.S. High Dividend ETF FundBMO Women in Leadership FundBMO International Equity FundBMO Japan Fund
To the Shareholders of BMO Global Tax Advantage Funds Inc.:BMO Global Dividend ClassBMO Canadian Equity ClassBMO Global Equity ClassBMO Global Energy ClassBMO Dividend ClassBMO Greater China ClassBMO International Value ClassBMO Global Low Volatility ETF Class(formerly BMO Global Tactical ETF Class)BMO SelectClass Income PortfolioBMO SelectClass Balanced Portfolio BMO SelectClass Growth Portfolio BMO SelectClass Equity Growth PortfolioBMO Income ETF Portfolio ClassBMO Balanced ETF Portfolio ClassBMO Growth ETF Portfolio ClassBMO Equity Growth ETF Portfolio Class BMO U.S. Equity ClassBMO Asian Growth and Income Class
(collectively, the Funds or individually the Fund)
Independent Auditor’s Report
We have audited the accompanying financial statements of each of the Funds, which comprise the statements of
financial position, comprehensive income, changes in net assets attributable to holders of redeemable units/shares
and cash flows as at and for the periods indicated in Note 1, and the related notes, which comprise a summary of
significant accounting policies and other explanatory information.
Management’s responsibility for the financial statements
Management is responsible for the preparation and fair presentation of the financial statements of each of
the Funds in accordance with International Financial Reporting Standards, and for such internal control as
management determines is necessary to enable the preparation of financial statements that are free from material
misstatement, whether due to fraud or error.
Auditor’s responsibility
Our responsibility is to express an opinion on the financial statements of each of the Funds based on our audits.
We conducted our audits in accordance with Canadian generally accepted auditing standards. Those standards
require that we comply with ethical requirements and plan and perform the audit to obtain reasonable assurance
about whether the financial statements are free from material misstatement.
An audit involves performing procedures to obtain audit evidence about the amounts and disclosures in the
financial statements. The procedures selected depend on the auditor’s judgment, including the assessment of
the risks of material misstatement of the financial statements, whether due to fraud or error. In making those risk
assessments, the auditor considers internal control relevant to the entity’s preparation and fair presentation of
the financial statements in order to design audit procedures that are appropriate in the circumstances, but not for
the purpose of expressing an opinion on the effectiveness of the entity’s internal control. An audit also includes
evaluating the appropriateness of accounting policies used and the reasonableness of accounting estimates made
by management, as well as evaluating the overall presentation of the financial statements.
We believe that the audit evidence we have obtained in each of our audits is sufficient and appropriate to provide a
basis for our audit opinion.
Opinion
In our opinion, the financial statements of each of the Funds present fairly, in all material respects, the financial
position, financial performance and cash flows of each of the Funds as at and for the periods indicated in Note 1 in
accordance with International Financial Reporting Standards.
Chartered Professional Accountants, Licensed Public Accountants
Toronto, Ontario
December 18, 2017
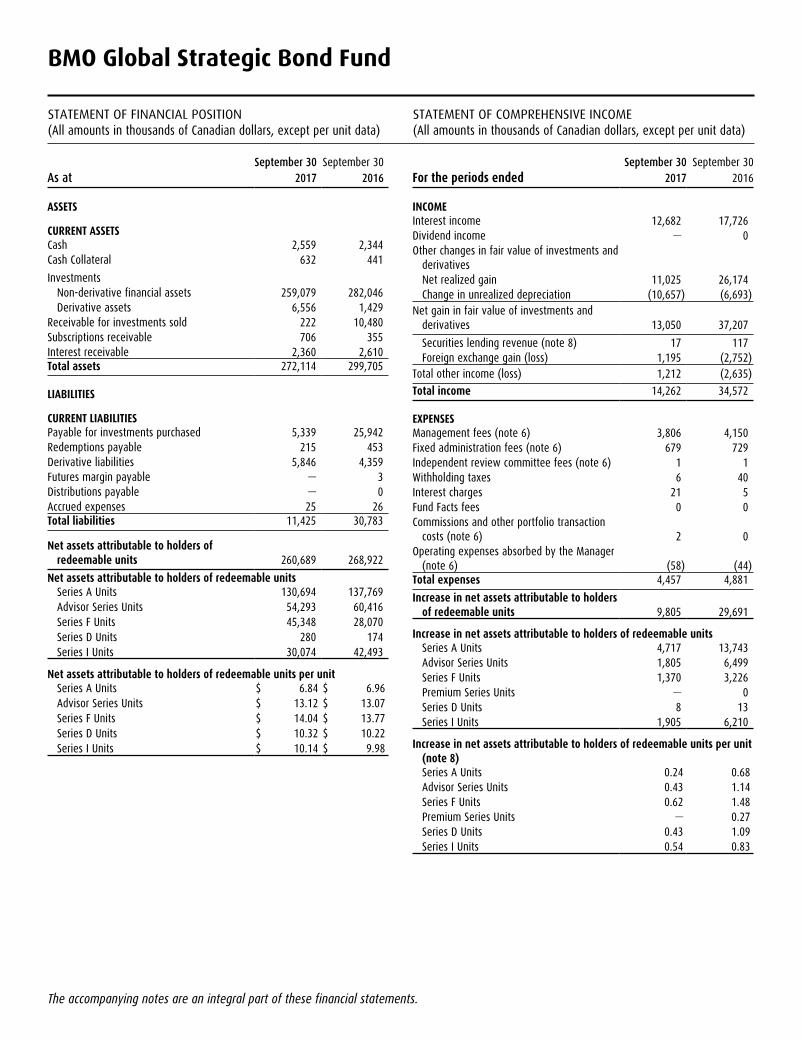
STATEMENT OF FINANCIAL POSITION(All amounts in thousands of Canadian dollars, except per unit data)
STATEMENT OF COMPREHENSIVE INCOME(All amounts in thousands of Canadian dollars, except per unit data)
The accompanying notes are an integral part of these financial statements.
BMO Global Strategic Bond Fund
September 30 September 30 As at 2017 2016
ASSETS
CURRENT ASSETSCash 2,559 2,344Cash Collateral 632 441
InvestmentsNon-derivative financial assets 259,079 282,046Derivative assets 6,556 1,429
Receivable for investments sold 222 10,480Subscriptions receivable 706 355Interest receivable 2,360 2,610Total assets 272,114 299,705
LIABILITIES
CURRENT LIABILITIESPayable for investments purchased 5,339 25,942Redemptions payable 215 453Derivative liabilities 5,846 4,359Futures margin payable — 3Distributions payable — 0Accrued expenses 25 26Total liabilities 11,425 30,783
Net assets attributable to holders of redeemable units 260,689 268,922
Net assets attributable to holders of redeemable unitsSeries A Units 130,694 137,769Advisor Series Units 54,293 60,416Series F Units 45,348 28,070Series D Units 280 174Series I Units 30,074 42,493
Net assets attributable to holders of redeemable units per unit Series A Units $ 6.84 $ 6.96Advisor Series Units $ 13.12 $ 13.07Series F Units $ 14.04 $ 13.77Series D Units $ 10.32 $ 10.22Series I Units $ 10.14 $ 9.98
September 30 September 30 For the periods ended 2017 2016
INCOMEInterest income 12,682 17,726Dividend income — 0Other changes in fair value of investments and
derivativesNet realized gain 11,025 26,174Change in unrealized depreciation (10,657) (6,693)
Net gain in fair value of investments and derivatives 13,050 37,207
Securities lending revenue (note 8) 17 117Foreign exchange gain (loss) 1,195 (2,752)
Total other income (loss) 1,212 (2,635)
Total income 14,262 34,572
EXPENSESManagement fees (note 6) 3,806 4,150Fixed administration fees (note 6) 679 729Independent review committee fees (note 6) 1 1Withholding taxes 6 40Interest charges 21 5Fund Facts fees 0 0Commissions and other portfolio transaction
costs (note 6) 2 0Operating expenses absorbed by the Manager
(note 6) (58) (44)Total expenses 4,457 4,881
Increase in net assets attributable to holders of redeemable units 9,805 29,691
Increase in net assets attributable to holders of redeemable unitsSeries A Units 4,717 13,743Advisor Series Units 1,805 6,499Series F Units 1,370 3,226Premium Series Units — 0Series D Units 8 13Series I Units 1,905 6,210
Increase in net assets attributable to holders of redeemable units per unit (note 8)Series A Units 0.24 0.68Advisor Series Units 0.43 1.14Series F Units 0.62 1.48Premium Series Units — 0.27Series D Units 0.43 1.09Series I Units 0.54 0.83
The accompanying notes are an integral part of these financial statements.
BMO Global Strategic Bond Fund
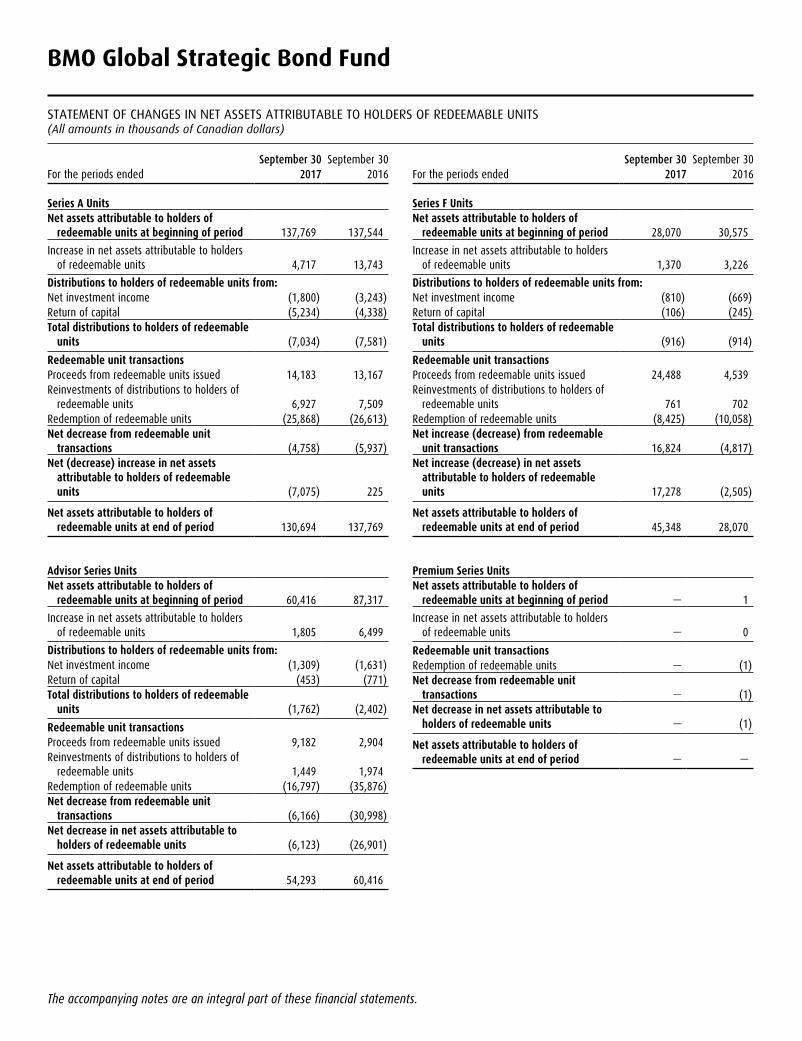
STATEMENT OF CHANGES IN NET ASSETS ATTRIBUTABLE TO HOLDERS OF REDEEMABLE UNITS(All amounts in thousands of Canadian dollars)
September 30 September 30 For the periods ended 2017 2016
Series A UnitsNet assets attributable to holders of
redeemable units at beginning of period 137,769 137,544
Increase in net assets attributable to holders of redeemable units 4,717 13,743
Distributions to holders of redeemable units from:Net investment income (1,800) (3,243)Return of capital (5,234) (4,338)Total distributions to holders of redeemable
units (7,034) (7,581)
Redeemable unit transactionsProceeds from redeemable units issued 14,183 13,167Reinvestments of distributions to holders of
redeemable units 6,927 7,509Redemption of redeemable units (25,868) (26,613)Net decrease from redeemable unit
transactions (4,758) (5,937)Net (decrease) increase in net assets
attributable to holders of redeemable units (7,075) 225
Net assets attributable to holders of redeemable units at end of period 130,694 137,769
Advisor Series UnitsNet assets attributable to holders of
redeemable units at beginning of period 60,416 87,317
Increase in net assets attributable to holders of redeemable units 1,805 6,499
Distributions to holders of redeemable units from:Net investment income (1,309) (1,631)Return of capital (453) (771)Total distributions to holders of redeemable
units (1,762) (2,402)
Redeemable unit transactionsProceeds from redeemable units issued 9,182 2,904Reinvestments of distributions to holders of
redeemable units 1,449 1,974Redemption of redeemable units (16,797) (35,876)Net decrease from redeemable unit
transactions (6,166) (30,998)Net decrease in net assets attributable to
holders of redeemable units (6,123) (26,901)
Net assets attributable to holders of redeemable units at end of period 54,293 60,416
September 30 September 30 For the periods ended 2017 2016
Series F UnitsNet assets attributable to holders of
redeemable units at beginning of period 28,070 30,575
Increase in net assets attributable to holders of redeemable units 1,370 3,226
Distributions to holders of redeemable units from:Net investment income (810) (669)Return of capital (106) (245)Total distributions to holders of redeemable
units (916) (914)
Redeemable unit transactionsProceeds from redeemable units issued 24,488 4,539Reinvestments of distributions to holders of
redeemable units 761 702Redemption of redeemable units (8,425) (10,058)Net increase (decrease) from redeemable
unit transactions 16,824 (4,817)Net increase (decrease) in net assets
attributable to holders of redeemable units 17,278 (2,505)
Net assets attributable to holders of redeemable units at end of period 45,348 28,070
Premium Series UnitsNet assets attributable to holders of
redeemable units at beginning of period — 1
Increase in net assets attributable to holders of redeemable units — 0
Redeemable unit transactionsRedemption of redeemable units — (1)Net decrease from redeemable unit
transactions — (1)Net decrease in net assets attributable to
holders of redeemable units — (1)
Net assets attributable to holders of redeemable units at end of period — —
The accompanying notes are an integral part of these financial statements.
BMO Global Strategic Bond Fund
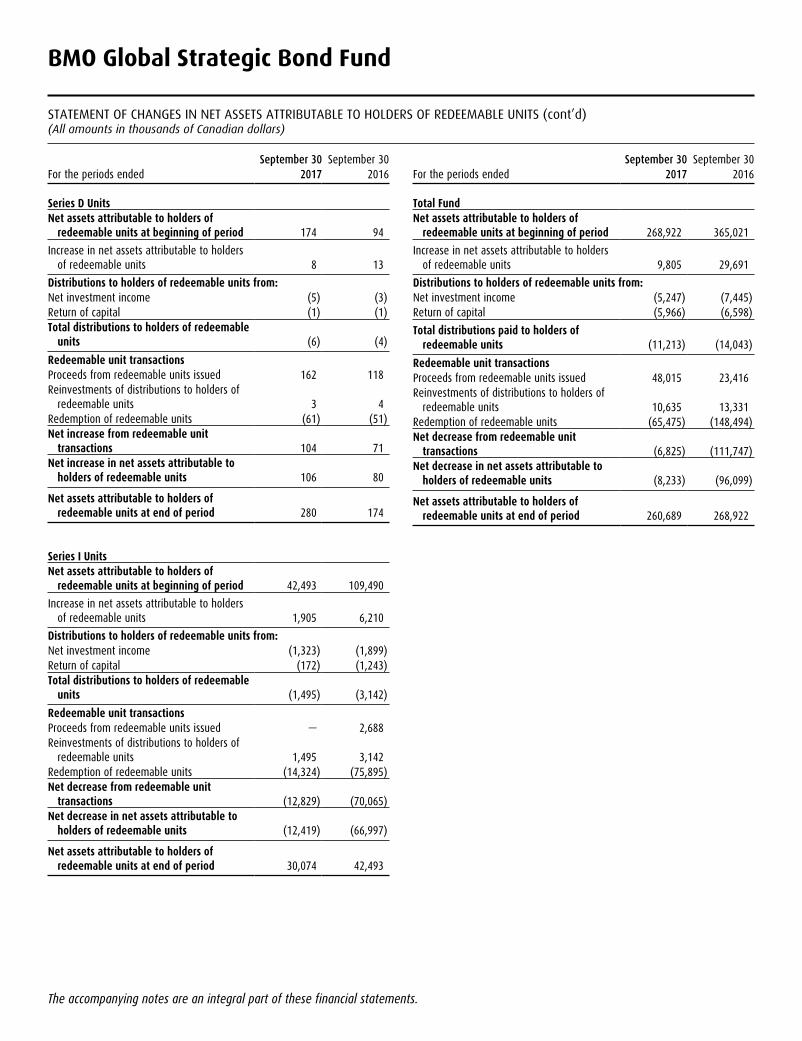
STATEMENT OF CHANGES IN NET ASSETS ATTRIBUTABLE TO HOLDERS OF REDEEMABLE UNITS (cont’d)(All amounts in thousands of Canadian dollars)
September 30 September 30 For the periods ended 2017 2016
Series D UnitsNet assets attributable to holders of
redeemable units at beginning of period 174 94
Increase in net assets attributable to holders of redeemable units 8 13
Distributions to holders of redeemable units from:Net investment income (5) (3)Return of capital (1) (1)Total distributions to holders of redeemable
units (6) (4)
Redeemable unit transactionsProceeds from redeemable units issued 162 118Reinvestments of distributions to holders of
redeemable units 3 4Redemption of redeemable units (61) (51)Net increase from redeemable unit
transactions 104 71Net increase in net assets attributable to
holders of redeemable units 106 80
Net assets attributable to holders of redeemable units at end of period 280 174
Series I UnitsNet assets attributable to holders of
redeemable units at beginning of period 42,493 109,490
Increase in net assets attributable to holders of redeemable units 1,905 6,210
Distributions to holders of redeemable units from:Net investment income (1,323) (1,899)Return of capital (172) (1,243)Total distributions to holders of redeemable
units (1,495) (3,142)
Redeemable unit transactionsProceeds from redeemable units issued — 2,688Reinvestments of distributions to holders of
redeemable units 1,495 3,142Redemption of redeemable units (14,324) (75,895)Net decrease from redeemable unit
transactions (12,829) (70,065)Net decrease in net assets attributable to
holders of redeemable units (12,419) (66,997)
Net assets attributable to holders of redeemable units at end of period 30,074 42,493
September 30 September 30 For the periods ended 2017 2016
Total FundNet assets attributable to holders of
redeemable units at beginning of period 268,922 365,021
Increase in net assets attributable to holders of redeemable units 9,805 29,691
Distributions to holders of redeemable units from:Net investment income (5,247) (7,445)Return of capital (5,966) (6,598)
Total distributions paid to holders of redeemable units (11,213) (14,043)
Redeemable unit transactionsProceeds from redeemable units issued 48,015 23,416Reinvestments of distributions to holders of
redeemable units 10,635 13,331Redemption of redeemable units (65,475) (148,494)Net decrease from redeemable unit
transactions (6,825) (111,747)Net decrease in net assets attributable to
holders of redeemable units (8,233) (96,099)
Net assets attributable to holders of redeemable units at end of period 260,689 268,922
The accompanying notes are an integral part of these financial statements.
BMO Global Strategic Bond Fund
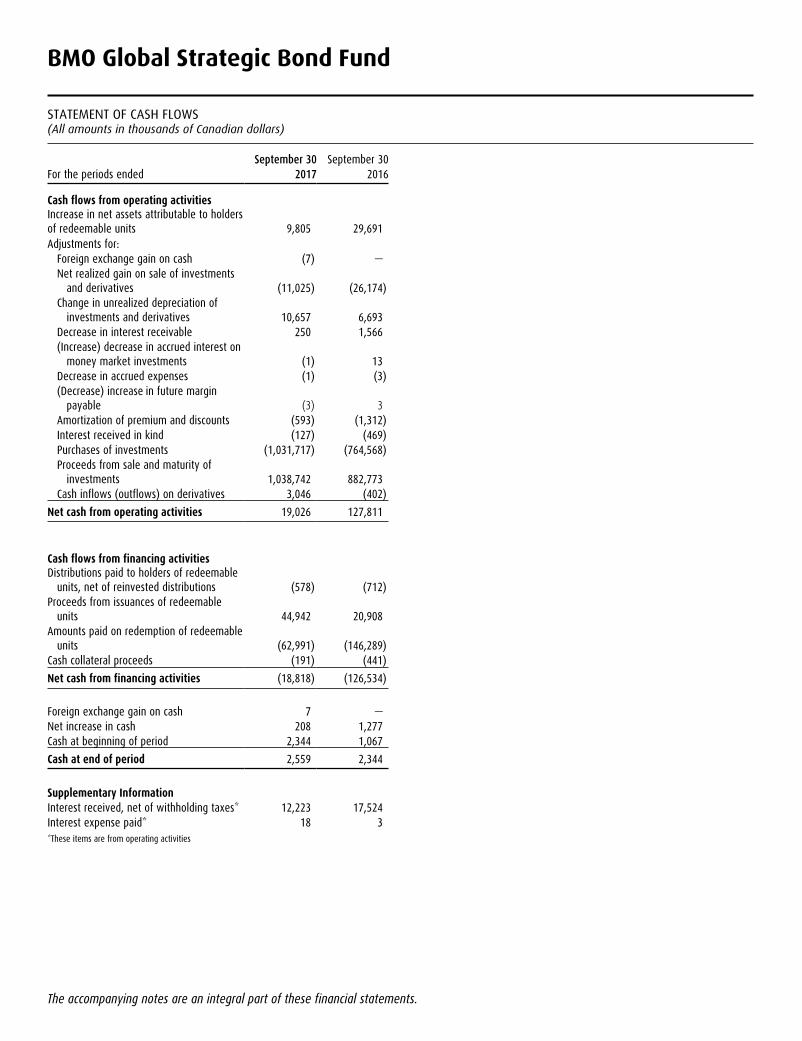
STATEMENT OF CASH FLOWS(All amounts in thousands of Canadian dollars)
September 30 September 30 For the periods ended 2017 2016
Cash flows from operating activitiesIncrease in net assets attributable to holders of redeemable units 9,805 29,691Adjustments for:
Foreign exchange gain on cash (7) —Net realized gain on sale of investments
and derivatives (11,025) (26,174)Change in unrealized depreciation of
investments and derivatives 10,657 6,693Decrease in interest receivable 250 1,566(Increase) decrease in accrued interest on
money market investments (1) 13Decrease in accrued expenses (1) (3)(Decrease) increase in future margin
payable (3) 3Amortization of premium and discounts (593) (1,312)Interest received in kind (127) (469)Purchases of investments (1,031,717) (764,568)Proceeds from sale and maturity of
investments 1,038,742 882,773Cash inflows (outflows) on derivatives 3,046 (402)
Net cash from operating activities 19,026 127,811
Cash flows from financing activitiesDistributions paid to holders of redeemable
units, net of reinvested distributions (578) (712)Proceeds from issuances of redeemable
units 44,942 20,908Amounts paid on redemption of redeemable
units (62,991) (146,289)Cash collateral proceeds (191) (441)
Net cash from financing activities (18,818) (126,534)
Foreign exchange gain on cash 7 —Net increase in cash 208 1,277Cash at beginning of period 2,344 1,067
Cash at end of period 2,559 2,344
Supplementary InformationInterest received, net of withholding taxes* 12,223 17,524Interest expense paid* 18 3*These items are from operating activities
BMO Global Strategic Bond Fund
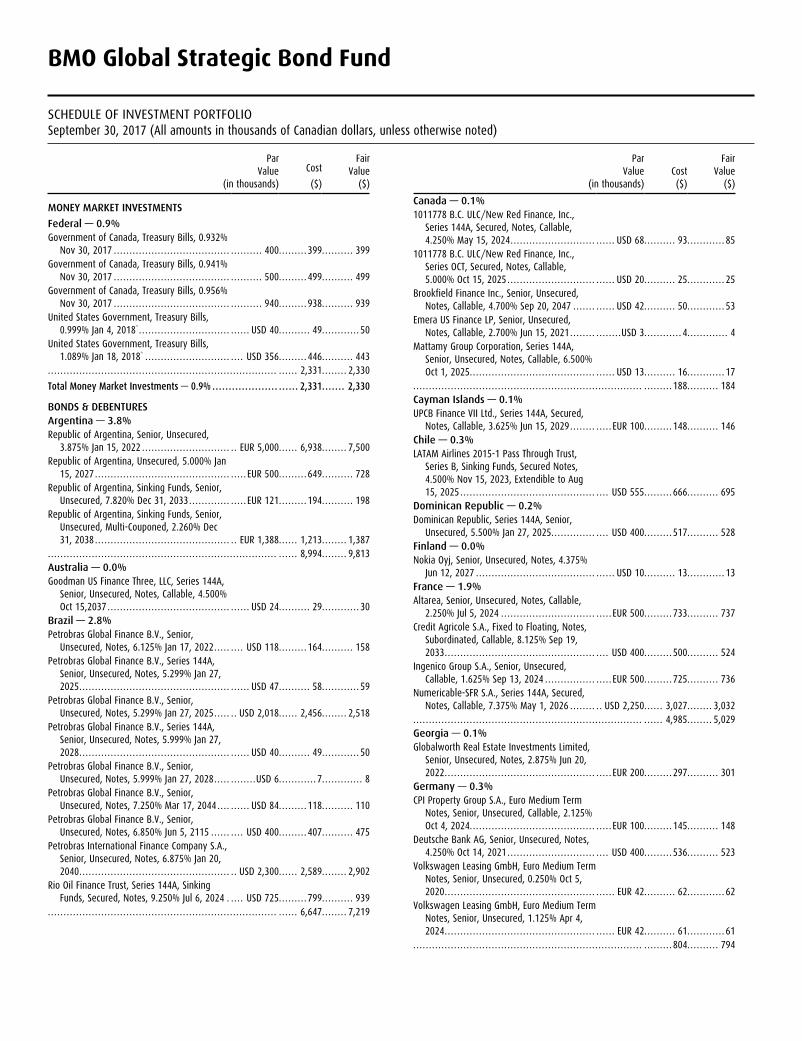
SCHEDULE OF INVESTMENT PORTFOLIO September 30, 2017 (All amounts in thousands of Canadian dollars, unless otherwise noted)
Par Value
(in thousands)
Cost
($)
Fair Value
($)
MONEY MARKET INVESTMENTS
Federal — 0.9%Government of Canada, Treasury Bills, 0.932%
Nov 30, 2017 .... . . . . . . . . . . . . . . . . . . . . . . . . . . . . . . . . . . . . . . . . . . . 400..... . . . . 399..... . . . . . 399Government of Canada, Treasury Bills, 0.941%
Nov 30, 2017 .... . . . . . . . . . . . . . . . . . . . . . . . . . . . . . . . . . . . . . . . . . . . 500..... . . . . 499..... . . . . . 499Government of Canada, Treasury Bills, 0.956%
Nov 30, 2017 .... . . . . . . . . . . . . . . . . . . . . . . . . . . . . . . . . . . . . . . . . . . . 940..... . . . . 938..... . . . . . 939United States Government, Treasury Bills,
0.999% Jan 4, 2018* .... . . . . . . . . . . . . . . . . . . . . . . . . . . . . . . . USD 40..... . . . . . 49..... . . . . . . . 50United States Government, Treasury Bills,
1.089% Jan 18, 2018* .... . . . . . . . . . . . . . . . . . . . . . . . . . . . USD 356..... . . . . 446..... . . . . . 443..... . . . . . . . . . . . . . . . . . . . . . . . . . . . . . . . . . . . . . . . . . . . . . . . . . . . . . . . . . . . . . . . . . . . . . . . . . . 2,331..... . . . 2,330
Total Money Market Investments — 0.9% .................... ...... 2,331....... 2,330
BONDS & DEBENTURESArgentina — 3.8%Republic of Argentina, Senior, Unsecured,
3.875% Jan 15, 2022 .... . . . . . . . . . . . . . . . . . . . . . . . . . . EUR 5,000..... . 6,938..... . . . 7,500Republic of Argentina, Unsecured, 5.000% Jan
15, 2027 .... . . . . . . . . . . . . . . . . . . . . . . . . . . . . . . . . . . . . . . . . . . . . EUR 500..... . . . . 649..... . . . . . 728Republic of Argentina, Sinking Funds, Senior,
Unsecured, 7.820% Dec 31, 2033 .... . . . . . . . . . . . . . . EUR 121..... . . . . 194..... . . . . . 198Republic of Argentina, Sinking Funds, Senior,
Unsecured, Multi-Couponed, 2.260% Dec 31, 2038 .... . . . . . . . . . . . . . . . . . . . . . . . . . . . . . . . . . . . . . . . . . EUR 1,388..... . 1,213..... . . . 1,387
..... . . . . . . . . . . . . . . . . . . . . . . . . . . . . . . . . . . . . . . . . . . . . . . . . . . . . . . . . . . . . . . . . . . . . . . . . . . 8,994..... . . . 9,813Australia — 0.0%Goodman US Finance Three, LLC, Series 144A,
Senior, Unsecured, Notes, Callable, 4.500% Oct 15,2037 .... . . . . . . . . . . . . . . . . . . . . . . . . . . . . . . . . . . . . . . . . . USD 24..... . . . . . 29..... . . . . . . . 30
Brazil — 2.8%Petrobras Global Finance B.V., Senior,
Unsecured, Notes, 6.125% Jan 17, 2022 .... . . . . . USD 118..... . . . . 164..... . . . . . 158Petrobras Global Finance B.V., Series 144A,
Senior, Unsecured, Notes, 5.299% Jan 27, 2025 .... . . . . . . . . . . . . . . . . . . . . . . . . . . . . . . . . . . . . . . . . . . . . . . . . . . USD 47..... . . . . . 58..... . . . . . . . 59
Petrobras Global Finance B.V., Senior, Unsecured, Notes, 5.299% Jan 27, 2025 .... . . . USD 2,018..... . 2,456..... . . . 2,518
Petrobras Global Finance B.V., Series 144A, Senior, Unsecured, Notes, 5.999% Jan 27, 2028 .... . . . . . . . . . . . . . . . . . . . . . . . . . . . . . . . . . . . . . . . . . . . . . . . . . . USD 40..... . . . . . 49..... . . . . . . . 50
Petrobras Global Finance B.V., Senior, Unsecured, Notes, 5.999% Jan 27, 2028 .... . . . . . . . . .USD 6..... . . . . . . . 7.... . . . . . . . . . 8
Petrobras Global Finance B.V., Senior, Unsecured, Notes, 7.250% Mar 17, 2044 .... . . . . . . USD 84..... . . . . 118..... . . . . . 110
Petrobras Global Finance B.V., Senior, Unsecured, Notes, 6.850% Jun 5, 2115 .... . . . . . . USD 400..... . . . . 407..... . . . . . 475
Petrobras International Finance Company S.A., Senior, Unsecured, Notes, 6.875% Jan 20, 2040 .... . . . . . . . . . . . . . . . . . . . . . . . . . . . . . . . . . . . . . . . . . . . . . . USD 2,300..... . 2,589..... . . . 2,902
Rio Oil Finance Trust, Series 144A, Sinking Funds, Secured, Notes, 9.250% Jul 6, 2024 . ... . USD 725..... . . . . 799..... . . . . . 939
..... . . . . . . . . . . . . . . . . . . . . . . . . . . . . . . . . . . . . . . . . . . . . . . . . . . . . . . . . . . . . . . . . . . . . . . . . . . 6,647..... . . . 7,219
Par Value
(in thousands)Cost
($)
Fair Value
($)
Canada — 0.1%1011778 B.C. ULC/New Red Finance, Inc.,
Series 144A, Secured, Notes, Callable, 4.250% May 15, 2024 .... . . . . . . . . . . . . . . . . . . . . . . . . . . . . . USD 68..... . . . . . 93..... . . . . . . . 85
1011778 B.C. ULC/New Red Finance, Inc., Series OCT, Secured, Notes, Callable, 5.000% Oct 15, 2025 .... . . . . . . . . . . . . . . . . . . . . . . . . . . . . . . USD 20..... . . . . . 25..... . . . . . . . 25
Brookfield Finance Inc., Senior, Unsecured, Notes, Callable, 4.700% Sep 20, 2047 .... . . . . . . . . . USD 42..... . . . . . 50..... . . . . . . . 53
Emera US Finance LP, Senior, Unsecured, Notes, Callable, 2.700% Jun 15, 2021 .... . . . . . . . . . . . .USD 3..... . . . . . . . 4.... . . . . . . . . . 4
Mattamy Group Corporation, Series 144A, Senior, Unsecured, Notes, Callable, 6.500% Oct 1, 2025..... . . . . . . . . . . . . . . . . . . . . . . . . . . . . . . . . . . . . . . . . . USD 13..... . . . . . 16..... . . . . . . . 17
..... . . . . . . . . . . . . . . . . . . . . . . . . . . . . . . . . . . . . . . . . . . . . . . . . . . . . . . . . . . . . . . . . . . . . . . . . . . . . . 188..... . . . . . 184Cayman Islands — 0.1%UPCB Finance VII Ltd., Series 144A, Secured,
Notes, Callable, 3.625% Jun 15, 2029 .... . . . . . . . . . EUR 100..... . . . . 148..... . . . . . 146Chile — 0.3%LATAM Airlines 2015-1 Pass Through Trust,
Series B, Sinking Funds, Secured Notes, 4.500% Nov 15, 2023, Extendible to Aug 15, 2025 .... . . . . . . . . . . . . . . . . . . . . . . . . . . . . . . . . . . . . . . . . . . . USD 555..... . . . . 666..... . . . . . 695
Dominican Republic — 0.2%Dominican Republic, Series 144A, Senior,
Unsecured, 5.500% Jan 27, 2025..... . . . . . . . . . . . . . USD 400..... . . . . 517..... . . . . . 528Finland — 0.0%Nokia Oyj, Senior, Unsecured, Notes, 4.375%
Jun 12, 2027 .... . . . . . . . . . . . . . . . . . . . . . . . . . . . . . . . . . . . . . . . . USD 10..... . . . . . 13..... . . . . . . . 13France — 1.9%Altarea, Senior, Unsecured, Notes, Callable,
2.250% Jul 5, 2024 .... . . . . . . . . . . . . . . . . . . . . . . . . . . . . . . . EUR 500..... . . . . 733..... . . . . . 737Credit Agricole S.A., Fixed to Floating, Notes,
Subordinated, Callable, 8.125% Sep 19, 2033 .... . . . . . . . . . . . . . . . . . . . . . . . . . . . . . . . . . . . . . . . . . . . . . . . . USD 400..... . . . . 500..... . . . . . 524
Ingenico Group S.A., Senior, Unsecured, Callable, 1.625% Sep 13, 2024 .... . . . . . . . . . . . . . . . . . EUR 500..... . . . . 725..... . . . . . 736
Numericable-SFR S.A., Series 144A, Secured, Notes, Callable, 7.375% May 1, 2026 .... . . . . . . USD 2,250..... . 3,027..... . . . 3,032
..... . . . . . . . . . . . . . . . . . . . . . . . . . . . . . . . . . . . . . . . . . . . . . . . . . . . . . . . . . . . . . . . . . . . . . . . . . . 4,985..... . . . 5,029Georgia — 0.1%Globalworth Real Estate Investments Limited,
Senior, Unsecured, Notes, 2.875% Jun 20, 2022 .... . . . . . . . . . . . . . . . . . . . . . . . . . . . . . . . . . . . . . . . . . . . . . . . . . EUR 200..... . . . . 297..... . . . . . 301
Germany — 0.3%CPI Property Group S.A., Euro Medium Term
Notes, Senior, Unsecured, Callable, 2.125% Oct 4, 2024..... . . . . . . . . . . . . . . . . . . . . . . . . . . . . . . . . . . . . . . . . EUR 100..... . . . . 145..... . . . . . 148
Deutsche Bank AG, Senior, Unsecured, Notes, 4.250% Oct 14, 2021 .... . . . . . . . . . . . . . . . . . . . . . . . . . . . . USD 400..... . . . . 536..... . . . . . 523
Volkswagen Leasing GmbH, Euro Medium Term Notes, Senior, Unsecured, 0.250% Oct 5, 2020 .... . . . . . . . . . . . . . . . . . . . . . . . . . . . . . . . . . . . . . . . . . . . . . . . . . . EUR 42..... . . . . . 62..... . . . . . . . 62
Volkswagen Leasing GmbH, Euro Medium Term Notes, Senior, Unsecured, 1.125% Apr 4, 2024 .... . . . . . . . . . . . . . . . . . . . . . . . . . . . . . . . . . . . . . . . . . . . . . . . . . . EUR 42..... . . . . . 61..... . . . . . . . 61
..... . . . . . . . . . . . . . . . . . . . . . . . . . . . . . . . . . . . . . . . . . . . . . . . . . . . . . . . . . . . . . . . . . . . . . . . . . . . . . 804..... . . . . . 794
BMO Global Strategic Bond Fund
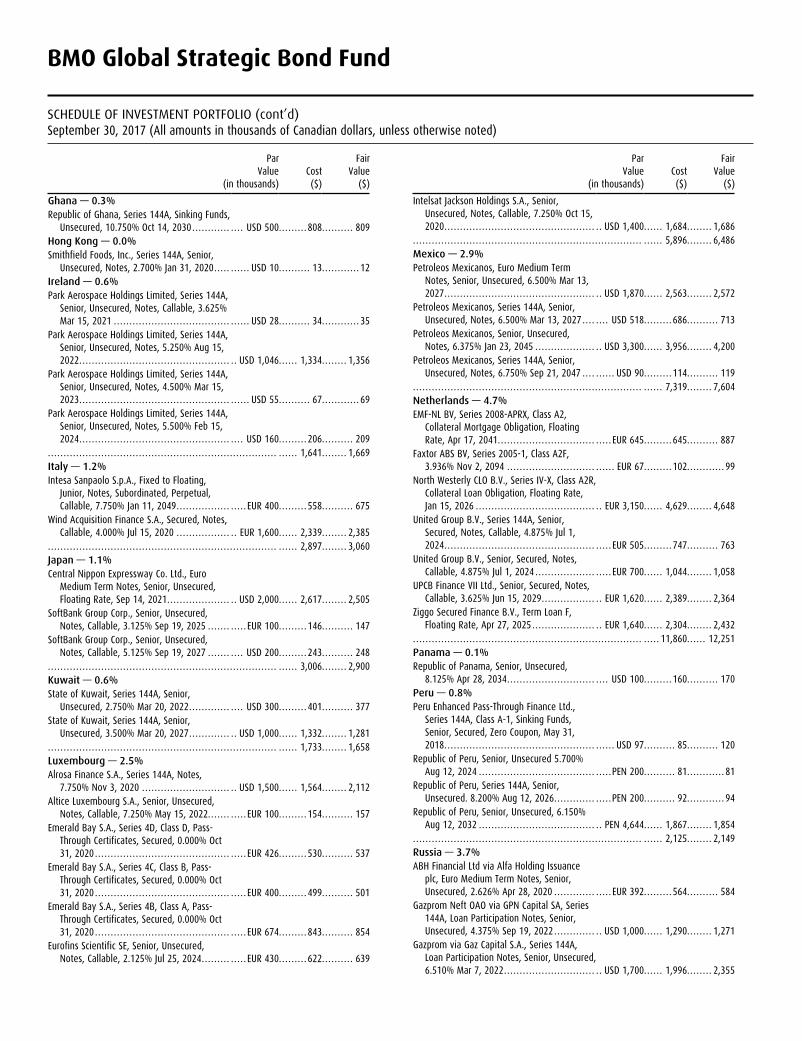
SCHEDULE OF INVESTMENT PORTFOLIO (cont’d)September 30, 2017 (All amounts in thousands of Canadian dollars, unless otherwise noted)
Par Value
(in thousands)Cost
($)
Fair Value
($)
Ghana — 0.3%Republic of Ghana, Series 144A, Sinking Funds,
Unsecured, 10.750% Oct 14, 2030 .... . . . . . . . . . . . . USD 500..... . . . . 808..... . . . . . 809Hong Kong — 0.0%Smithfield Foods, Inc., Series 144A, Senior,
Unsecured, Notes, 2.700% Jan 31, 2020 .... . . . . . . . USD 10..... . . . . . 13..... . . . . . . . 12Ireland — 0.6%Park Aerospace Holdings Limited, Series 144A,
Senior, Unsecured, Notes, Callable, 3.625% Mar 15, 2021 .... . . . . . . . . . . . . . . . . . . . . . . . . . . . . . . . . . . . . . . . USD 28..... . . . . . 34..... . . . . . . . 35
Park Aerospace Holdings Limited, Series 144A, Senior, Unsecured, Notes, 5.250% Aug 15, 2022 .... . . . . . . . . . . . . . . . . . . . . . . . . . . . . . . . . . . . . . . . . . . . . . . USD 1,046..... . 1,334..... . . . 1,356
Park Aerospace Holdings Limited, Series 144A, Senior, Unsecured, Notes, 4.500% Mar 15, 2023 .... . . . . . . . . . . . . . . . . . . . . . . . . . . . . . . . . . . . . . . . . . . . . . . . . . . USD 55..... . . . . . 67..... . . . . . . . 69
Park Aerospace Holdings Limited, Series 144A, Senior, Unsecured, Notes, 5.500% Feb 15, 2024 .... . . . . . . . . . . . . . . . . . . . . . . . . . . . . . . . . . . . . . . . . . . . . . . . . USD 160..... . . . . 206..... . . . . . 209
..... . . . . . . . . . . . . . . . . . . . . . . . . . . . . . . . . . . . . . . . . . . . . . . . . . . . . . . . . . . . . . . . . . . . . . . . . . . 1,641..... . . . 1,669Italy — 1.2%Intesa Sanpaolo S.p.A., Fixed to Floating,
Junior, Notes, Subordinated, Perpetual, Callable, 7.750% Jan 11, 2049 .... . . . . . . . . . . . . . . . . . . EUR 400..... . . . . 558..... . . . . . 675
Wind Acquisition Finance S.A., Secured, Notes, Callable, 4.000% Jul 15, 2020 .... . . . . . . . . . . . . . . . EUR 1,600..... . 2,339..... . . . 2,385
..... . . . . . . . . . . . . . . . . . . . . . . . . . . . . . . . . . . . . . . . . . . . . . . . . . . . . . . . . . . . . . . . . . . . . . . . . . . 2,897..... . . . 3,060Japan — 1.1%Central Nippon Expressway Co. Ltd., Euro
Medium Term Notes, Senior, Unsecured, Floating Rate, Sep 14, 2021 .... . . . . . . . . . . . . . . . . . . USD 2,000..... . 2,617..... . . . 2,505
SoftBank Group Corp., Senior, Unsecured, Notes, Callable, 3.125% Sep 19, 2025 .... . . . . . . . . EUR 100..... . . . . 146..... . . . . . 147
SoftBank Group Corp., Senior, Unsecured, Notes, Callable, 5.125% Sep 19, 2027 .... . . . . . . . USD 200..... . . . . 243..... . . . . . 248
..... . . . . . . . . . . . . . . . . . . . . . . . . . . . . . . . . . . . . . . . . . . . . . . . . . . . . . . . . . . . . . . . . . . . . . . . . . . 3,006..... . . . 2,900Kuwait — 0.6%State of Kuwait, Series 144A, Senior,
Unsecured, 2.750% Mar 20, 2022 .... . . . . . . . . . . . . . USD 300..... . . . . 401..... . . . . . 377State of Kuwait, Series 144A, Senior,
Unsecured, 3.500% Mar 20, 2027 .... . . . . . . . . . . . USD 1,000..... . 1,332..... . . . 1,281..... . . . . . . . . . . . . . . . . . . . . . . . . . . . . . . . . . . . . . . . . . . . . . . . . . . . . . . . . . . . . . . . . . . . . . . . . . . 1,733..... . . . 1,658Luxembourg — 2.5%Alrosa Finance S.A., Series 144A, Notes,
7.750% Nov 3, 2020 .... . . . . . . . . . . . . . . . . . . . . . . . . . . USD 1,500..... . 1,564..... . . . 2,112Altice Luxembourg S.A., Senior, Unsecured,
Notes, Callable, 7.250% May 15, 2022 .... . . . . . . . . EUR 100..... . . . . 154..... . . . . . 157Emerald Bay S.A., Series 4D, Class D, Pass-
Through Certificates, Secured, 0.000% Oct 31, 2020 .... . . . . . . . . . . . . . . . . . . . . . . . . . . . . . . . . . . . . . . . . . . . . EUR 426..... . . . . 530..... . . . . . 537
Emerald Bay S.A., Series 4C, Class B, Pass-Through Certificates, Secured, 0.000% Oct 31, 2020 .... . . . . . . . . . . . . . . . . . . . . . . . . . . . . . . . . . . . . . . . . . . . . EUR 400..... . . . . 499..... . . . . . 501
Emerald Bay S.A., Series 4B, Class A, Pass-Through Certificates, Secured, 0.000% Oct 31, 2020 .... . . . . . . . . . . . . . . . . . . . . . . . . . . . . . . . . . . . . . . . . . . . . EUR 674..... . . . . 843..... . . . . . 854
Eurofins Scientific SE, Senior, Unsecured, Notes, Callable, 2.125% Jul 25, 2024 .... . . . . . . . . . . EUR 430..... . . . . 622..... . . . . . 639
Par Value
(in thousands)Cost
($)
Fair Value
($)
Intelsat Jackson Holdings S.A., Senior, Unsecured, Notes, Callable, 7.250% Oct 15, 2020 .... . . . . . . . . . . . . . . . . . . . . . . . . . . . . . . . . . . . . . . . . . . . . . . USD 1,400..... . 1,684..... . . . 1,686
..... . . . . . . . . . . . . . . . . . . . . . . . . . . . . . . . . . . . . . . . . . . . . . . . . . . . . . . . . . . . . . . . . . . . . . . . . . . 5,896..... . . . 6,486Mexico — 2.9%Petroleos Mexicanos, Euro Medium Term
Notes, Senior, Unsecured, 6.500% Mar 13, 2027 .... . . . . . . . . . . . . . . . . . . . . . . . . . . . . . . . . . . . . . . . . . . . . . . USD 1,870..... . 2,563..... . . . 2,572
Petroleos Mexicanos, Series 144A, Senior, Unsecured, Notes, 6.500% Mar 13, 2027 .... . . . . USD 518..... . . . . 686..... . . . . . 713
Petroleos Mexicanos, Senior, Unsecured, Notes, 6.375% Jan 23, 2045 .... . . . . . . . . . . . . . . . . . USD 3,300..... . 3,956..... . . . 4,200
Petroleos Mexicanos, Series 144A, Senior, Unsecured, Notes, 6.750% Sep 21, 2047 .... . . . . . . USD 90..... . . . . 114..... . . . . . 119
..... . . . . . . . . . . . . . . . . . . . . . . . . . . . . . . . . . . . . . . . . . . . . . . . . . . . . . . . . . . . . . . . . . . . . . . . . . . 7,319..... . . . 7,604Netherlands — 4.7%EMF-NL BV, Series 2008-APRX, Class A2,
Collateral Mortgage Obligation, Floating Rate, Apr 17, 2041 .... . . . . . . . . . . . . . . . . . . . . . . . . . . . . . . . . EUR 645..... . . . . 645..... . . . . . 887
Faxtor ABS BV, Series 2005-1, Class A2F, 3.936% Nov 2, 2094 .... . . . . . . . . . . . . . . . . . . . . . . . . . . . . . . EUR 67..... . . . . 102..... . . . . . . . 99
North Westerly CLO B.V., Series IV-X, Class A2R, Collateral Loan Obligation, Floating Rate, Jan 15, 2026 .... . . . . . . . . . . . . . . . . . . . . . . . . . . . . . . . . . . . . EUR 3,150..... . 4,629..... . . . 4,648
United Group B.V., Series 144A, Senior, Secured, Notes, Callable, 4.875% Jul 1, 2024 .... . . . . . . . . . . . . . . . . . . . . . . . . . . . . . . . . . . . . . . . . . . . . . . . . . EUR 505..... . . . . 747..... . . . . . 763
United Group B.V., Senior, Secured, Notes, Callable, 4.875% Jul 1, 2024 .... . . . . . . . . . . . . . . . . . . . . EUR 700..... . 1,044..... . . . 1,058
UPCB Finance VII Ltd., Senior, Secured, Notes, Callable, 3.625% Jun 15, 2029 .... . . . . . . . . . . . . . . . EUR 1,620..... . 2,389..... . . . 2,364
Ziggo Secured Finance B.V., Term Loan F, Floating Rate, Apr 27, 2025 .... . . . . . . . . . . . . . . . . . . EUR 1,640..... . 2,304..... . . . 2,432
..... . . . . . . . . . . . . . . . . . . . . . . . . . . . . . . . . . . . . . . . . . . . . . . . . . . . . . . . . . . . . . . . . . . . . . . . . . 11,860..... . 12,251Panama — 0.1%Republic of Panama, Senior, Unsecured,
8.125% Apr 28, 2034 .... . . . . . . . . . . . . . . . . . . . . . . . . . . . . USD 100..... . . . . 160..... . . . . . 170Peru — 0.8%Peru Enhanced Pass-Through Finance Ltd.,
Series 144A, Class A-1, Sinking Funds, Senior, Secured, Zero Coupon, May 31, 2018 .... . . . . . . . . . . . . . . . . . . . . . . . . . . . . . . . . . . . . . . . . . . . . . . . . . . USD 97..... . . . . . 85..... . . . . . 120
Republic of Peru, Senior, Unsecured 5.700% Aug 12, 2024 .... . . . . . . . . . . . . . . . . . . . . . . . . . . . . . . . . . . . . . .PEN 200..... . . . . . 81..... . . . . . . . 81
Republic of Peru, Series 144A, Senior, Unsecured. 8.200% Aug 12, 2026 .... . . . . . . . . . . . . . .PEN 200..... . . . . . 92..... . . . . . . . 94
Republic of Peru, Senior, Unsecured, 6.150% Aug 12, 2032 .... . . . . . . . . . . . . . . . . . . . . . . . . . . . . . . . . . . . PEN 4,644..... . 1,867..... . . . 1,854
..... . . . . . . . . . . . . . . . . . . . . . . . . . . . . . . . . . . . . . . . . . . . . . . . . . . . . . . . . . . . . . . . . . . . . . . . . . . 2,125..... . . . 2,149Russia — 3.7%ABH Financial Ltd via Alfa Holding Issuance
plc, Euro Medium Term Notes, Senior, Unsecured, 2.626% Apr 28, 2020 .... . . . . . . . . . . . . . . EUR 392..... . . . . 564..... . . . . . 584
Gazprom Neft OAO via GPN Capital SA, Series 144A, Loan Participation Notes, Senior, Unsecured, 4.375% Sep 19, 2022 .... . . . . . . . . . . . USD 1,000..... . 1,290..... . . . 1,271
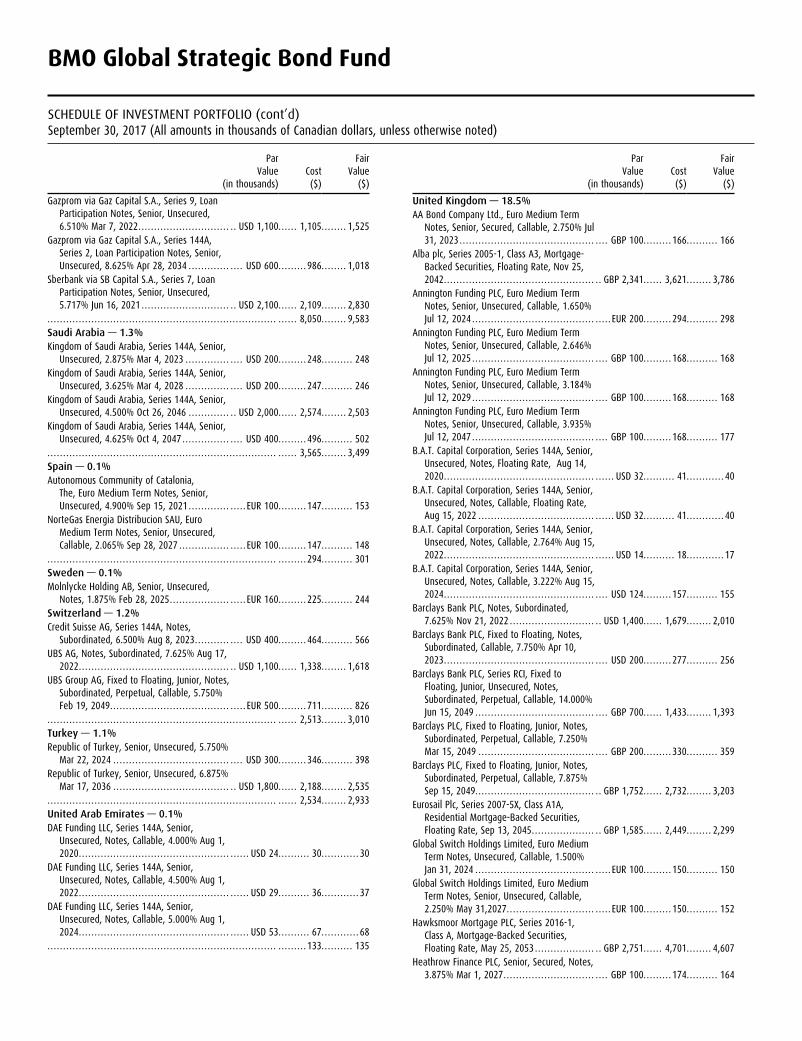
Gazprom via Gaz Capital S.A., Series 144A, Loan Participation Notes, Senior, Unsecured, 6.510% Mar 7, 2022 .... . . . . . . . . . . . . . . . . . . . . . . . . . . . USD 1,700..... . 1,996..... . . . 2,355
BMO Global Strategic Bond Fund
SCHEDULE OF INVESTMENT PORTFOLIO (cont’d)September 30, 2017 (All amounts in thousands of Canadian dollars, unless otherwise noted)
Par Value
(in thousands)Cost
($)
Fair Value
($)
Gazprom via Gaz Capital S.A., Series 9, Loan Participation Notes, Senior, Unsecured, 6.510% Mar 7, 2022 .... . . . . . . . . . . . . . . . . . . . . . . . . . . . USD 1,100..... . 1,105..... . . . 1,525
Gazprom via Gaz Capital S.A., Series 144A, Series 2, Loan Participation Notes, Senior, Unsecured, 8.625% Apr 28, 2034 .... . . . . . . . . . . . . . USD 600..... . . . . 986..... . . . 1,018
Sberbank via SB Capital S.A., Series 7, Loan Participation Notes, Senior, Unsecured, 5.717% Jun 16, 2021 .... . . . . . . . . . . . . . . . . . . . . . . . . . . USD 2,100..... . 2,109..... . . . 2,830
..... . . . . . . . . . . . . . . . . . . . . . . . . . . . . . . . . . . . . . . . . . . . . . . . . . . . . . . . . . . . . . . . . . . . . . . . . . . 8,050..... . . . 9,583Saudi Arabia — 1.3%Kingdom of Saudi Arabia, Series 144A, Senior,
Unsecured, 2.875% Mar 4, 2023 .... . . . . . . . . . . . . . . USD 200..... . . . . 248..... . . . . . 248Kingdom of Saudi Arabia, Series 144A, Senior,
Unsecured, 3.625% Mar 4, 2028 .... . . . . . . . . . . . . . . USD 200..... . . . . 247..... . . . . . 246Kingdom of Saudi Arabia, Series 144A, Senior,
Unsecured, 4.500% Oct 26, 2046 .... . . . . . . . . . . . USD 2,000..... . 2,574..... . . . 2,503Kingdom of Saudi Arabia, Series 144A, Senior,
Unsecured, 4.625% Oct 4, 2047 .... . . . . . . . . . . . . . . . USD 400..... . . . . 496..... . . . . . 502..... . . . . . . . . . . . . . . . . . . . . . . . . . . . . . . . . . . . . . . . . . . . . . . . . . . . . . . . . . . . . . . . . . . . . . . . . . . 3,565..... . . . 3,499Spain — 0.1%Autonomous Community of Catalonia,
The, Euro Medium Term Notes, Senior, Unsecured, 4.900% Sep 15, 2021 .... . . . . . . . . . . . . . . EUR 100..... . . . . 147..... . . . . . 153
NorteGas Energia Distribucion SAU, Euro Medium Term Notes, Senior, Unsecured, Callable, 2.065% Sep 28, 2027 .... . . . . . . . . . . . . . . . . . EUR 100..... . . . . 147..... . . . . . 148
..... . . . . . . . . . . . . . . . . . . . . . . . . . . . . . . . . . . . . . . . . . . . . . . . . . . . . . . . . . . . . . . . . . . . . . . . . . . . . . 294..... . . . . . 301Sweden — 0.1%Molnlycke Holding AB, Senior, Unsecured,
Notes, 1.875% Feb 28, 2025 .... . . . . . . . . . . . . . . . . . . . . EUR 160..... . . . . 225..... . . . . . 244Switzerland — 1.2%Credit Suisse AG, Series 144A, Notes,
Subordinated, 6.500% Aug 8, 2023 .... . . . . . . . . . . . USD 400..... . . . . 464..... . . . . . 566UBS AG, Notes, Subordinated, 7.625% Aug 17,
2022 .... . . . . . . . . . . . . . . . . . . . . . . . . . . . . . . . . . . . . . . . . . . . . . . USD 1,100..... . 1,338..... . . . 1,618UBS Group AG, Fixed to Floating, Junior, Notes,
Subordinated, Perpetual, Callable, 5.750% Feb 19, 2049 .... . . . . . . . . . . . . . . . . . . . . . . . . . . . . . . . . . . . . . . . EUR 500..... . . . . 711..... . . . . . 826
..... . . . . . . . . . . . . . . . . . . . . . . . . . . . . . . . . . . . . . . . . . . . . . . . . . . . . . . . . . . . . . . . . . . . . . . . . . . 2,513..... . . . 3,010Turkey — 1.1%Republic of Turkey, Senior, Unsecured, 5.750%
Mar 22, 2024 .... . . . . . . . . . . . . . . . . . . . . . . . . . . . . . . . . . . . . . USD 300..... . . . . 346..... . . . . . 398Republic of Turkey, Senior, Unsecured, 6.875%
Mar 17, 2036 .... . . . . . . . . . . . . . . . . . . . . . . . . . . . . . . . . . . . USD 1,800..... . 2,188..... . . . 2,535..... . . . . . . . . . . . . . . . . . . . . . . . . . . . . . . . . . . . . . . . . . . . . . . . . . . . . . . . . . . . . . . . . . . . . . . . . . . 2,534..... . . . 2,933United Arab Emirates — 0.1%DAE Funding LLC, Series 144A, Senior,
Unsecured, Notes, Callable, 4.000% Aug 1, 2020 .... . . . . . . . . . . . . . . . . . . . . . . . . . . . . . . . . . . . . . . . . . . . . . . . . . . USD 24..... . . . . . 30..... . . . . . . . 30
DAE Funding LLC, Series 144A, Senior, Unsecured, Notes, Callable, 4.500% Aug 1, 2022 .... . . . . . . . . . . . . . . . . . . . . . . . . . . . . . . . . . . . . . . . . . . . . . . . . . . USD 29..... . . . . . 36..... . . . . . . . 37
DAE Funding LLC, Series 144A, Senior, Unsecured, Notes, Callable, 5.000% Aug 1, 2024 .... . . . . . . . . . . . . . . . . . . . . . . . . . . . . . . . . . . . . . . . . . . . . . . . . . . USD 53..... . . . . . 67..... . . . . . . . 68
..... . . . . . . . . . . . . . . . . . . . . . . . . . . . . . . . . . . . . . . . . . . . . . . . . . . . . . . . . . . . . . . . . . . . . . . . . . . . . . 133..... . . . . . 135
Par Value
(in thousands)Cost
($)
Fair Value
($)
United Kingdom — 18.5%AA Bond Company Ltd., Euro Medium Term
Notes, Senior, Secured, Callable, 2.750% Jul 31, 2023 .... . . . . . . . . . . . . . . . . . . . . . . . . . . . . . . . . . . . . . . . . . . . GBP 100..... . . . . 166..... . . . . . 166
Alba plc, Series 2005-1, Class A3, Mortgage-Backed Securities, Floating Rate, Nov 25, 2042 .... . . . . . . . . . . . . . . . . . . . . . . . . . . . . . . . . . . . . . . . . . . . . . . GBP 2,341..... . 3,621..... . . . 3,786
Annington Funding PLC, Euro Medium Term Notes, Senior, Unsecured, Callable, 1.650% Jul 12, 2024 .... . . . . . . . . . . . . . . . . . . . . . . . . . . . . . . . . . . . . . . . . EUR 200..... . . . . 294..... . . . . . 298
Annington Funding PLC, Euro Medium Term Notes, Senior, Unsecured, Callable, 2.646% Jul 12, 2025 .... . . . . . . . . . . . . . . . . . . . . . . . . . . . . . . . . . . . . . . . GBP 100..... . . . . 168..... . . . . . 168
Annington Funding PLC, Euro Medium Term Notes, Senior, Unsecured, Callable, 3.184% Jul 12, 2029 .... . . . . . . . . . . . . . . . . . . . . . . . . . . . . . . . . . . . . . . . GBP 100..... . . . . 168..... . . . . . 168
Annington Funding PLC, Euro Medium Term Notes, Senior, Unsecured, Callable, 3.935% Jul 12, 2047 .... . . . . . . . . . . . . . . . . . . . . . . . . . . . . . . . . . . . . . . . GBP 100..... . . . . 168..... . . . . . 177
B.A.T. Capital Corporation, Series 144A, Senior, Unsecured, Notes, Floating Rate, Aug 14, 2020 .... . . . . . . . . . . . . . . . . . . . . . . . . . . . . . . . . . . . . . . . . . . . . . . . . . . USD 32..... . . . . . 41..... . . . . . . . 40
B.A.T. Capital Corporation, Series 144A, Senior, Unsecured, Notes, Callable, Floating Rate, Aug 15, 2022 .... . . . . . . . . . . . . . . . . . . . . . . . . . . . . . . . . . . . . . . . USD 32..... . . . . . 41..... . . . . . . . 40
B.A.T. Capital Corporation, Series 144A, Senior, Unsecured, Notes, Callable, 2.764% Aug 15, 2022 .... . . . . . . . . . . . . . . . . . . . . . . . . . . . . . . . . . . . . . . . . . . . . . . . . . . USD 14..... . . . . . 18..... . . . . . . . 17
B.A.T. Capital Corporation, Series 144A, Senior, Unsecured, Notes, Callable, 3.222% Aug 15, 2024 .... . . . . . . . . . . . . . . . . . . . . . . . . . . . . . . . . . . . . . . . . . . . . . . . . USD 124..... . . . . 157..... . . . . . 155
Barclays Bank PLC, Notes, Subordinated, 7.625% Nov 21, 2022 .... . . . . . . . . . . . . . . . . . . . . . . . . . USD 1,400..... . 1,679..... . . . 2,010
Barclays Bank PLC, Fixed to Floating, Notes, Subordinated, Callable, 7.750% Apr 10, 2023 .... . . . . . . . . . . . . . . . . . . . . . . . . . . . . . . . . . . . . . . . . . . . . . . . . USD 200..... . . . . 277..... . . . . . 256
Barclays Bank PLC, Series RCI, Fixed to Floating, Junior, Unsecured, Notes, Subordinated, Perpetual, Callable, 14.000% Jun 15, 2049 .... . . . . . . . . . . . . . . . . . . . . . . . . . . . . . . . . . . . . . . GBP 700..... . 1,433..... . . . 1,393
Barclays PLC, Fixed to Floating, Junior, Notes, Subordinated, Perpetual, Callable, 7.250% Mar 15, 2049 .... . . . . . . . . . . . . . . . . . . . . . . . . . . . . . . . . . . . . . GBP 200..... . . . . 330..... . . . . . 359
Barclays PLC, Fixed to Floating, Junior, Notes, Subordinated, Perpetual, Callable, 7.875% Sep 15, 2049..... . . . . . . . . . . . . . . . . . . . . . . . . . . . . . . . . . . . GBP 1,752..... . 2,732..... . . . 3,203
Eurosail Plc, Series 2007-5X, Class A1A, Residential Mortgage-Backed Securities, Floating Rate, Sep 13, 2045 .... . . . . . . . . . . . . . . . . . . GBP 1,585..... . 2,449..... . . . 2,299
Global Switch Holdings Limited, Euro Medium Term Notes, Unsecured, Callable, 1.500% Jan 31, 2024 .... . . . . . . . . . . . . . . . . . . . . . . . . . . . . . . . . . . . . . . . EUR 100..... . . . . 150..... . . . . . 150
Global Switch Holdings Limited, Euro Medium Term Notes, Senior, Unsecured, Callable, 2.250% May 31,2027 ..... . . . . . . . . . . . . . . . . . . . . . . . . . . . . EUR 100..... . . . . 150..... . . . . . 152
Hawksmoor Mortgage PLC, Series 2016-1, Class A, Mortgage-Backed Securities, Floating Rate, May 25, 2053 .... . . . . . . . . . . . . . . . . . GBP 2,751..... . 4,701..... . . . 4,607
Heathrow Finance PLC, Senior, Secured, Notes, 3.875% Mar 1, 2027 .... . . . . . . . . . . . . . . . . . . . . . . . . . . . . . GBP 100..... . . . . 174..... . . . . . 164
BMO Global Strategic Bond Fund
SCHEDULE OF INVESTMENT PORTFOLIO (cont’d)September 30, 2017 (All amounts in thousands of Canadian dollars, unless otherwise noted)
Par Value
(in thousands)Cost
($)
Fair Value
($)
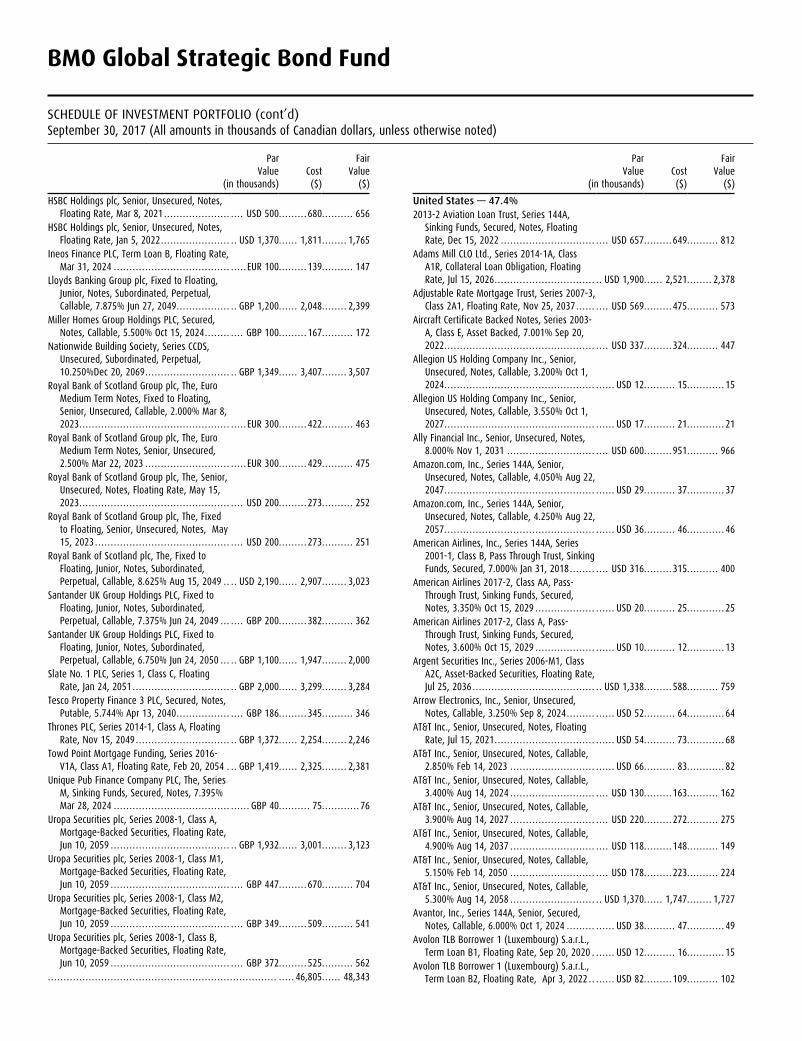
HSBC Holdings plc, Senior, Unsecured, Notes, Floating Rate, Mar 8, 2021 .... . . . . . . . . . . . . . . . . . . . . . USD 500..... . . . . 680..... . . . . . 656
HSBC Holdings plc, Senior, Unsecured, Notes, Floating Rate, Jan 5, 2022 .... . . . . . . . . . . . . . . . . . . . . USD 1,370..... . 1,811..... . . . 1,765
Ineos Finance PLC, Term Loan B, Floating Rate, Mar 31, 2024 .... . . . . . . . . . . . . . . . . . . . . . . . . . . . . . . . . . . . . . . EUR 100..... . . . . 139..... . . . . . 147
Lloyds Banking Group plc, Fixed to Floating, Junior, Notes, Subordinated, Perpetual, Callable, 7.875% Jun 27, 2049 .... . . . . . . . . . . . . . . . GBP 1,200..... . 2,048..... . . . 2,399
Miller Homes Group Holdings PLC, Secured, Notes, Callable, 5.500% Oct 15, 2024 .... . . . . . . . . GBP 100..... . . . . 167..... . . . . . 172
Nationwide Building Society, Series CCDS, Unsecured, Subordinated, Perpetual, 10.250%Dec 20, 2069 .... . . . . . . . . . . . . . . . . . . . . . . . . . GBP 1,349..... . 3,407..... . . . 3,507
Royal Bank of Scotland Group plc, The, Euro Medium Term Notes, Fixed to Floating, Senior, Unsecured, Callable, 2.000% Mar 8, 2023 .... . . . . . . . . . . . . . . . . . . . . . . . . . . . . . . . . . . . . . . . . . . . . . . . . . EUR 300..... . . . . 422..... . . . . . 463
Royal Bank of Scotland Group plc, The, Euro Medium Term Notes, Senior, Unsecured, 2.500% Mar 22, 2023 .... . . . . . . . . . . . . . . . . . . . . . . . . . . . . EUR 300..... . . . . 429..... . . . . . 475
Royal Bank of Scotland Group plc, The, Senior, Unsecured, Notes, Floating Rate, May 15, 2023 .... . . . . . . . . . . . . . . . . . . . . . . . . . . . . . . . . . . . . . . . . . . . . . . . . USD 200..... . . . . 273..... . . . . . 252
Royal Bank of Scotland Group plc, The, Fixed to Floating, Senior, Unsecured, Notes, May 15, 2023 .... . . . . . . . . . . . . . . . . . . . . . . . . . . . . . . . . . . . . . . . . . . . USD 200..... . . . . 273..... . . . . . 251
Royal Bank of Scotland plc, The, Fixed to Floating, Junior, Notes, Subordinated, Perpetual, Callable, 8.625% Aug 15, 2049 .. .. USD 2,190..... . 2,907..... . . . 3,023
Santander UK Group Holdings PLC, Fixed to Floating, Junior, Notes, Subordinated, Perpetual, Callable, 7.375% Jun 24, 2049 ... . . . . GBP 200..... . . . . 382..... . . . . . 362
Santander UK Group Holdings PLC, Fixed to Floating, Junior, Notes, Subordinated, Perpetual, Callable, 6.750% Jun 24, 2050 ... . . GBP 1,100..... . 1,947..... . . . 2,000
Slate No. 1 PLC, Series 1, Class C, Floating Rate, Jan 24, 2051 .... . . . . . . . . . . . . . . . . . . . . . . . . . . . . . GBP 2,000..... . 3,299..... . . . 3,284
Tesco Property Finance 3 PLC, Secured, Notes, Putable, 5.744% Apr 13, 2040 .... . . . . . . . . . . . . . . . . . GBP 186..... . . . . 345..... . . . . . 346
Thrones PLC, Series 2014-1, Class A, Floating Rate, Nov 15, 2049 .... . . . . . . . . . . . . . . . . . . . . . . . . . . . . GBP 1,372..... . 2,254..... . . . 2,246
Towd Point Mortgage Funding, Series 2016-V1A, Class A1, Floating Rate, Feb 20, 2054 . .. GBP 1,419..... . 2,325..... . . . 2,381
Unique Pub Finance Company PLC, The, Series M, Sinking Funds, Secured, Notes, 7.395% Mar 28, 2024 .... . . . . . . . . . . . . . . . . . . . . . . . . . . . . . . . . . . . . . . . GBP 40..... . . . . . 75..... . . . . . . . 76
Uropa Securities plc, Series 2008-1, Class A, Mortgage-Backed Securities, Floating Rate, Jun 10, 2059 .... . . . . . . . . . . . . . . . . . . . . . . . . . . . . . . . . . . . . GBP 1,932..... . 3,001..... . . . 3,123
Uropa Securities plc, Series 2008-1, Class M1, Mortgage-Backed Securities, Floating Rate, Jun 10, 2059 .... . . . . . . . . . . . . . . . . . . . . . . . . . . . . . . . . . . . . . . GBP 447..... . . . . 670..... . . . . . 704
Uropa Securities plc, Series 2008-1, Class M2, Mortgage-Backed Securities, Floating Rate, Jun 10, 2059 .... . . . . . . . . . . . . . . . . . . . . . . . . . . . . . . . . . . . . . . GBP 349..... . . . . 509..... . . . . . 541
Uropa Securities plc, Series 2008-1, Class B, Mortgage-Backed Securities, Floating Rate, Jun 10, 2059 .... . . . . . . . . . . . . . . . . . . . . . . . . . . . . . . . . . . . . . . GBP 372..... . . . . 525..... . . . . . 562
..... . . . . . . . . . . . . . . . . . . . . . . . . . . . . . . . . . . . . . . . . . . . . . . . . . . . . . . . . . . . . . . . . . . . . . . . . . 46,805..... . 48,343
Par Value
(in thousands)Cost
($)
Fair Value
($)
United States — 47.4%2013-2 Aviation Loan Trust, Series 144A,
Sinking Funds, Secured, Notes, Floating Rate, Dec 15, 2022 .... . . . . . . . . . . . . . . . . . . . . . . . . . . . . . . USD 657..... . . . . 649..... . . . . . 812
Adams Mill CLO Ltd., Series 2014-1A, Class A1R, Collateral Loan Obligation, Floating Rate, Jul 15, 2026 .... . . . . . . . . . . . . . . . . . . . . . . . . . . . . . . USD 1,900..... . 2,521..... . . . 2,378
Adjustable Rate Mortgage Trust, Series 2007-3, Class 2A1, Floating Rate, Nov 25, 2037 .... . . . . . . USD 569..... . . . . 475..... . . . . . 573
Aircraft Certificate Backed Notes, Series 2003-A, Class E, Asset Backed, 7.001% Sep 20, 2022 .... . . . . . . . . . . . . . . . . . . . . . . . . . . . . . . . . . . . . . . . . . . . . . . . . USD 337..... . . . . 324..... . . . . . 447
Allegion US Holding Company Inc., Senior, Unsecured, Notes, Callable, 3.200% Oct 1, 2024 .... . . . . . . . . . . . . . . . . . . . . . . . . . . . . . . . . . . . . . . . . . . . . . . . . . . USD 12..... . . . . . 15..... . . . . . . . 15
Allegion US Holding Company Inc., Senior, Unsecured, Notes, Callable, 3.550% Oct 1, 2027 .... . . . . . . . . . . . . . . . . . . . . . . . . . . . . . . . . . . . . . . . . . . . . . . . . . . USD 17..... . . . . . 21..... . . . . . . . 21
Ally Financial Inc., Senior, Unsecured, Notes, 8.000% Nov 1, 2031 .... . . . . . . . . . . . . . . . . . . . . . . . . . . . . USD 600..... . . . . 951..... . . . . . 966
Amazon.com, Inc., Series 144A, Senior, Unsecured, Notes, Callable, 4.050% Aug 22, 2047 .... . . . . . . . . . . . . . . . . . . . . . . . . . . . . . . . . . . . . . . . . . . . . . . . . . . USD 29..... . . . . . 37..... . . . . . . . 37
Amazon.com, Inc., Series 144A, Senior, Unsecured, Notes, Callable, 4.250% Aug 22, 2057 .... . . . . . . . . . . . . . . . . . . . . . . . . . . . . . . . . . . . . . . . . . . . . . . . . . . USD 36..... . . . . . 46..... . . . . . . . 46
American Airlines, Inc., Series 144A, Series 2001-1, Class B, Pass Through Trust, Sinking Funds, Secured, 7.000% Jan 31, 2018 .... . . . . . . . . USD 316..... . . . . 315..... . . . . . 400
American Airlines 2017-2, Class AA, Pass-Through Trust, Sinking Funds, Secured, Notes, 3.350% Oct 15, 2029 .... . . . . . . . . . . . . . . . . . . . . . USD 20..... . . . . . 25..... . . . . . . . 25
American Airlines 2017-2, Class A, Pass-Through Trust, Sinking Funds, Secured, Notes, 3.600% Oct 15, 2029 .... . . . . . . . . . . . . . . . . . . . . . USD 10..... . . . . . 12..... . . . . . . . 13
Argent Securities Inc., Series 2006-M1, Class A2C, Asset-Backed Securities, Floating Rate, Jul 25, 2036 .... . . . . . . . . . . . . . . . . . . . . . . . . . . . . . . . . . . . . . USD 1,338..... . . . . 588..... . . . . . 759
Arrow Electronics, Inc., Senior, Unsecured, Notes, Callable, 3.250% Sep 8, 2024 .... . . . . . . . . . . . USD 52..... . . . . . 64..... . . . . . . . 64
AT&T Inc., Senior, Unsecured, Notes, Floating Rate, Jul 15, 2021 .... . . . . . . . . . . . . . . . . . . . . . . . . . . . . . . . . . . USD 54..... . . . . . 73..... . . . . . . . 68
AT&T Inc., Senior, Unsecured, Notes, Callable, 2.850% Feb 14, 2023 .... . . . . . . . . . . . . . . . . . . . . . . . . . . . . . USD 66..... . . . . . 83..... . . . . . . . 82
AT&T Inc., Senior, Unsecured, Notes, Callable, 3.400% Aug 14, 2024 .... . . . . . . . . . . . . . . . . . . . . . . . . . . . USD 130..... . . . . 163..... . . . . . 162
AT&T Inc., Senior, Unsecured, Notes, Callable, 3.900% Aug 14, 2027 .... . . . . . . . . . . . . . . . . . . . . . . . . . . . USD 220..... . . . . 272..... . . . . . 275
AT&T Inc., Senior, Unsecured, Notes, Callable, 4.900% Aug 14, 2037 .... . . . . . . . . . . . . . . . . . . . . . . . . . . . USD 118..... . . . . 148..... . . . . . 149
AT&T Inc., Senior, Unsecured, Notes, Callable, 5.150% Feb 14, 2050 .... . . . . . . . . . . . . . . . . . . . . . . . . . . . USD 178..... . . . . 223..... . . . . . 224
AT&T Inc., Senior, Unsecured, Notes, Callable, 5.300% Aug 14, 2058 .... . . . . . . . . . . . . . . . . . . . . . . . . . USD 1,370..... . 1,747..... . . . 1,727
Avantor, Inc., Series 144A, Senior, Secured, Notes, Callable, 6.000% Oct 1, 2024 .... . . . . . . . . . . . USD 38..... . . . . . 47..... . . . . . . . 49
Avolon TLB Borrower 1 (Luxembourg) S.a.r.L., Term Loan B1, Floating Rate, Sep 20, 2020 . ... . . . USD 12..... . . . . . 16..... . . . . . . . 15
Avolon TLB Borrower 1 (Luxembourg) S.a.r.L., Term Loan B2, Floating Rate, Apr 3, 2022 .. .. . . . . USD 82..... . . . . 109..... . . . . . 102
BMO Global Strategic Bond Fund
SCHEDULE OF INVESTMENT PORTFOLIO (cont’d)September 30, 2017 (All amounts in thousands of Canadian dollars, unless otherwise noted)
Par Value
(in thousands)Cost
($)
Fair Value
($)
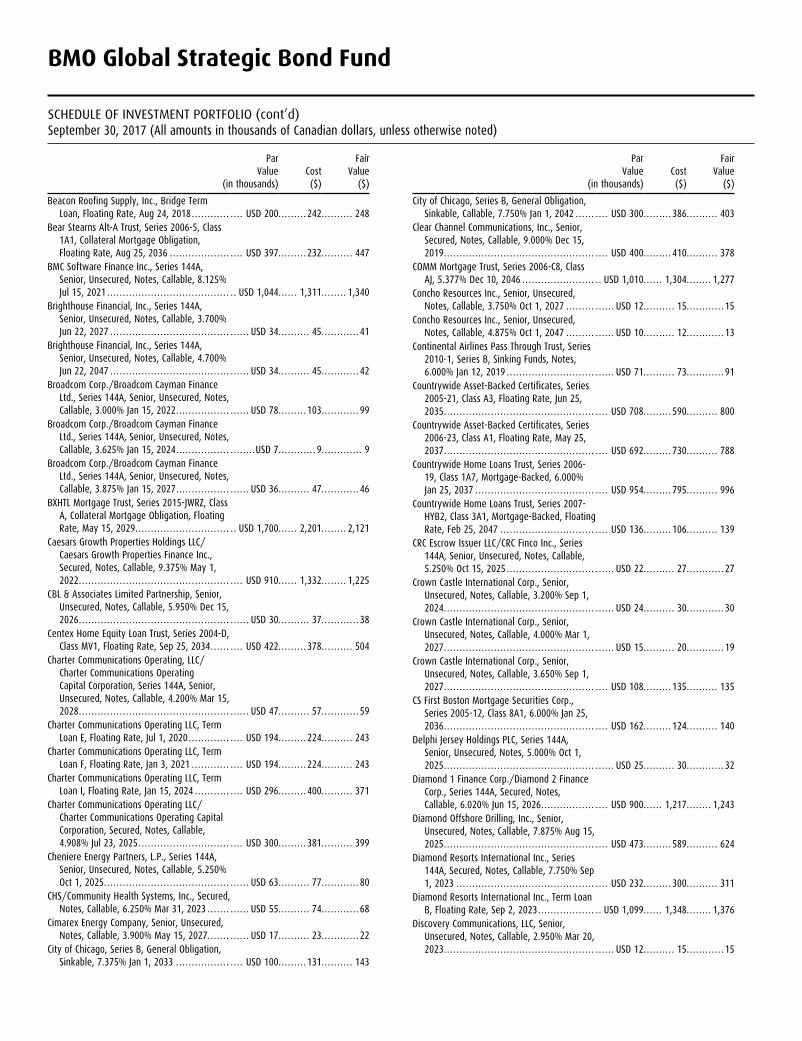
Beacon Roofing Supply, Inc., Bridge Term Loan, Floating Rate, Aug 24, 2018 .... . . . . . . . . . . . . USD 200..... . . . . 242..... . . . . . 248
Bear Stearns Alt-A Trust, Series 2006-5, Class 1A1, Collateral Mortgage Obligation, Floating Rate, Aug 25, 2036 .... . . . . . . . . . . . . . . . . . . . USD 397..... . . . . 232..... . . . . . 447
BMC Software Finance Inc., Series 144A, Senior, Unsecured, Notes, Callable, 8.125% Jul 15, 2021 .... . . . . . . . . . . . . . . . . . . . . . . . . . . . . . . . . . . . . . USD 1,044..... . 1,311..... . . . 1,340
Brighthouse Financial, Inc., Series 144A, Senior, Unsecured, Notes, Callable, 3.700% Jun 22, 2027 .... . . . . . . . . . . . . . . . . . . . . . . . . . . . . . . . . . . . . . . . . USD 34..... . . . . . 45..... . . . . . . . 41
Brighthouse Financial, Inc., Series 144A, Senior, Unsecured, Notes, Callable, 4.700% Jun 22, 2047 .... . . . . . . . . . . . . . . . . . . . . . . . . . . . . . . . . . . . . . . . . USD 34..... . . . . . 45..... . . . . . . . 42
Broadcom Corp./Broadcom Cayman Finance Ltd., Series 144A, Senior, Unsecured, Notes, Callable, 3.000% Jan 15, 2022 .... . . . . . . . . . . . . . . . . . . . USD 78..... . . . . 103..... . . . . . . . 99
Broadcom Corp./Broadcom Cayman Finance Ltd., Series 144A, Senior, Unsecured, Notes, Callable, 3.625% Jan 15, 2024 .... . . . . . . . . . . . . . . . . . . . . .USD 7..... . . . . . . . 9.... . . . . . . . . . 9
Broadcom Corp./Broadcom Cayman Finance Ltd., Series 144A, Senior, Unsecured, Notes, Callable, 3.875% Jan 15, 2027 .... . . . . . . . . . . . . . . . . . . . USD 36..... . . . . . 47..... . . . . . . . 46
BXHTL Mortgage Trust, Series 2015-JWRZ, Class A, Collateral Mortgage Obligation, Floating Rate, May 15, 2029 .... . . . . . . . . . . . . . . . . . . . . . . . . . . . . USD 1,700..... . 2,201..... . . . 2,121
Caesars Growth Properties Holdings LLC/Caesars Growth Properties Finance Inc., Secured, Notes, Callable, 9.375% May 1, 2022 .... . . . . . . . . . . . . . . . . . . . . . . . . . . . . . . . . . . . . . . . . . . . . . . . . USD 910..... . 1,332..... . . . 1,225
CBL & Associates Limited Partnership, Senior, Unsecured, Notes, Callable, 5.950% Dec 15, 2026 .... . . . . . . . . . . . . . . . . . . . . . . . . . . . . . . . . . . . . . . . . . . . . . . . . . . USD 30..... . . . . . 37..... . . . . . . . 38
Centex Home Equity Loan Trust, Series 2004-D, Class MV1, Floating Rate, Sep 25, 2034 .... . . . . . . USD 422..... . . . . 378..... . . . . . 504
Charter Communications Operating, LLC/Charter Communications Operating Capital Corporation, Series 144A, Senior, Unsecured, Notes, Callable, 4.200% Mar 15, 2028 .... . . . . . . . . . . . . . . . . . . . . . . . . . . . . . . . . . . . . . . . . . . . . . . . . . . USD 47..... . . . . . 57..... . . . . . . . 59
Charter Communications Operating LLC, Term Loan E, Floating Rate, Jul 1, 2020 .... . . . . . . . . . . . . . USD 194..... . . . . 224..... . . . . . 243
Charter Communications Operating LLC, Term Loan F, Floating Rate, Jan 3, 2021 .... . . . . . . . . . . . . USD 194..... . . . . 224..... . . . . . 243
Charter Communications Operating LLC, Term Loan I, Floating Rate, Jan 15, 2024 .... . . . . . . . . . . . USD 296..... . . . . 400..... . . . . . 371
Charter Communications Operating LLC/Charter Communications Operating Capital Corporation, Secured, Notes, Callable, 4.908% Jul 23, 2025 .... . . . . . . . . . . . . . . . . . . . . . . . . . . . . . USD 300..... . . . . 381..... . . . . . 399
Cheniere Energy Partners, L.P., Series 144A, Senior, Unsecured, Notes, Callable, 5.250% Oct 1, 2025..... . . . . . . . . . . . . . . . . . . . . . . . . . . . . . . . . . . . . . . . . . USD 63..... . . . . . 77..... . . . . . . . 80
CHS/Community Health Systems, Inc., Secured, Notes, Callable, 6.250% Mar 31, 2023 .... . . . . . . . . . USD 55..... . . . . . 74..... . . . . . . . 68
Cimarex Energy Company, Senior, Unsecured, Notes, Callable, 3.900% May 15, 2027 .... . . . . . . . . . USD 17..... . . . . . 23..... . . . . . . . 22
City of Chicago, Series B, General Obligation, Sinkable, 7.375% Jan 1, 2033 .... . . . . . . . . . . . . . . . . . USD 100..... . . . . 131..... . . . . . 143
Par Value
(in thousands)Cost
($)
Fair Value
($)
City of Chicago, Series B, General Obligation, Sinkable, Callable, 7.750% Jan 1, 2042 .... . . . . . . USD 300..... . . . . 386..... . . . . . 403
Clear Channel Communications, Inc., Senior, Secured, Notes, Callable, 9.000% Dec 15, 2019 .... . . . . . . . . . . . . . . . . . . . . . . . . . . . . . . . . . . . . . . . . . . . . . . . . USD 400..... . . . . 410..... . . . . . 378
COMM Mortgage Trust, Series 2006-C8, Class AJ, 5.377% Dec 10, 2046 .... . . . . . . . . . . . . . . . . . . . . . USD 1,010..... . 1,304..... . . . 1,277
Concho Resources Inc., Senior, Unsecured, Notes, Callable, 3.750% Oct 1, 2027 .... . . . . . . . . . . . USD 12..... . . . . . 15..... . . . . . . . 15
Concho Resources Inc., Senior, Unsecured, Notes, Callable, 4.875% Oct 1, 2047 .... . . . . . . . . . . . USD 10..... . . . . . 12..... . . . . . . . 13
Continental Airlines Pass Through Trust, Series 2010-1, Series B, Sinking Funds, Notes, 6.000% Jan 12, 2019 .... . . . . . . . . . . . . . . . . . . . . . . . . . . . . . . USD 71..... . . . . . 73..... . . . . . . . 91
Countrywide Asset-Backed Certificates, Series 2005-21, Class A3, Floating Rate, Jun 25, 2035 .... . . . . . . . . . . . . . . . . . . . . . . . . . . . . . . . . . . . . . . . . . . . . . . . . USD 708..... . . . . 590..... . . . . . 800
Countrywide Asset-Backed Certificates, Series 2006-23, Class A1, Floating Rate, May 25, 2037 .... . . . . . . . . . . . . . . . . . . . . . . . . . . . . . . . . . . . . . . . . . . . . . . . . USD 692..... . . . . 730..... . . . . . 788
Countrywide Home Loans Trust, Series 2006-19, Class 1A7, Mortgage-Backed, 6.000% Jan 25, 2037 .... . . . . . . . . . . . . . . . . . . . . . . . . . . . . . . . . . . . . . . USD 954..... . . . . 795..... . . . . . 996
Countrywide Home Loans Trust, Series 2007-HYB2, Class 3A1, Mortgage-Backed, Floating Rate, Feb 25, 2047 .... . . . . . . . . . . . . . . . . . . . . . . . . . . . . . . USD 136..... . . . . 106..... . . . . . 139
CRC Escrow Issuer LLC/CRC Finco Inc., Series 144A, Senior, Unsecured, Notes, Callable, 5.250% Oct 15, 2025 .... . . . . . . . . . . . . . . . . . . . . . . . . . . . . . . USD 22..... . . . . . 27..... . . . . . . . 27
Crown Castle International Corp., Senior, Unsecured, Notes, Callable, 3.200% Sep 1, 2024 .... . . . . . . . . . . . . . . . . . . . . . . . . . . . . . . . . . . . . . . . . . . . . . . . . . . USD 24..... . . . . . 30..... . . . . . . . 30
Crown Castle International Corp., Senior, Unsecured, Notes, Callable, 4.000% Mar 1, 2027 .... . . . . . . . . . . . . . . . . . . . . . . . . . . . . . . . . . . . . . . . . . . . . . . . . . . USD 15..... . . . . . 20..... . . . . . . . 19
Crown Castle International Corp., Senior, Unsecured, Notes, Callable, 3.650% Sep 1, 2027 .... . . . . . . . . . . . . . . . . . . . . . . . . . . . . . . . . . . . . . . . . . . . . . . . . USD 108..... . . . . 135..... . . . . . 135
CS First Boston Mortgage Securities Corp., Series 2005-12, Class 8A1, 6.000% Jan 25, 2036 .... . . . . . . . . . . . . . . . . . . . . . . . . . . . . . . . . . . . . . . . . . . . . . . . . USD 162..... . . . . 124..... . . . . . 140
Delphi Jersey Holdings PLC, Series 144A, Senior, Unsecured, Notes, 5.000% Oct 1, 2025 .... . . . . . . . . . . . . . . . . . . . . . . . . . . . . . . . . . . . . . . . . . . . . . . . . . . USD 25..... . . . . . 30..... . . . . . . . 32
Diamond 1 Finance Corp./Diamond 2 Finance Corp., Series 144A, Secured, Notes, Callable, 6.020% Jun 15, 2026 .... . . . . . . . . . . . . . . . . . USD 900..... . 1,217..... . . . 1,243
Diamond Offshore Drilling, Inc., Senior, Unsecured, Notes, Callable, 7.875% Aug 15, 2025 .... . . . . . . . . . . . . . . . . . . . . . . . . . . . . . . . . . . . . . . . . . . . . . . . . USD 473..... . . . . 589..... . . . . . 624
Diamond Resorts International Inc., Series 144A, Secured, Notes, Callable, 7.750% Sep 1, 2023 .... . . . . . . . . . . . . . . . . . . . . . . . . . . . . . . . . . . . . . . . . . . . . USD 232..... . . . . 300..... . . . . . 311
Diamond Resorts International Inc., Term Loan B, Floating Rate, Sep 2, 2023 .... . . . . . . . . . . . . . . . . USD 1,099..... . 1,348..... . . . 1,376
Discovery Communications, LLC, Senior, Unsecured, Notes, Callable, 2.950% Mar 20, 2023 .... . . . . . . . . . . . . . . . . . . . . . . . . . . . . . . . . . . . . . . . . . . . . . . . . . . USD 12..... . . . . . 15..... . . . . . . . 15

BMO Global Strategic Bond Fund
SCHEDULE OF INVESTMENT PORTFOLIO (cont’d)September 30, 2017 (All amounts in thousands of Canadian dollars, unless otherwise noted)
Par Value
(in thousands)Cost
($)
Fair Value
($)
Discovery Communications, LLC, Senior, Unsecured, Notes, Callable, 3.950% Mar 20, 2028 .... . . . . . . . . . . . . . . . . . . . . . . . . . . . . . . . . . . . . . . . . . . . . . . . . . . USD 15..... . . . . . 18..... . . . . . . . 19
DISH DBS Corporation, Senior, Unsecured, Notes, 7.875% Sep 1, 2019 .... . . . . . . . . . . . . . . . . . . . . USD 900..... . 1,198..... . . . 1,225
Doctors Company, The, Series 144A, Surplus Notes, Subordinated, 6.500% Oct 15, 2023 . ... . USD 500..... . . . . 518..... . . . . . 700
Dollar Tree, Inc., Senior, Unsecured, Notes, Callable, 5.250% Mar 1, 2020 .... . . . . . . . . . . . . . . . . . USD 100..... . . . . 125..... . . . . . 128
ECMC Group Student Loan Trust, Series 2017-2A, Class A, Floating Rate, May 25, 2067 .... . . USD 1,848..... . 2,325..... . . . 2,306
Eldorado Resorts, Inc., Senior, Unsecured, Notes, Callable, 6.000% Apr 1, 2025 .... . . . . . . . . . . . . .USD 8..... . . . . . 10..... . . . . . . . 10
Enable Midstream Partners, LP, Senior, Unsecured, Notes, Callable, Multi-Couponed, 3.900% May 15, 2024 .... . . . . . . . . . . . USD 1,200..... . 1,304..... . . . 1,496
Endo Finance LLC & Endo Finco Inc., Series 144A, Senior, Unsecured, Notes, Callable, 5.375% Jan 15, 2023 .... . . . . . . . . . . . . . . . . . . . . . . . . . . . . USD 380..... . . . . 420..... . . . . . 386
Endo Luxembourg Finance I Co. SarL, Term Loan B, Floating Rate, Apr 27, 2024 .... . . . . . . . . . . USD 129..... . . . . 170..... . . . . . 162
Energy Future Intermediate Holding Company LLC, DIP Term Loan, Floating Rate, Jun 28, 2018 .... . . . . . . . . . . . . . . . . . . . . . . . . . . . . . . . . . . . . . . . . . . . . . . USD 4,524..... . 5,923..... . . . 5,670
Energy Future Intermediate Holding Company LLC, DIP Delayed Draw Term Loan DD, Floating Rate, Jun 28, 2018 .... . . . . . . . . . . . . . . . . . . . . USD 560..... . . . . 740..... . . . . . 702
EQT Corporation, Senior, Unsecured, Notes, Floating Rate, Oct 1, 2020 .... . . . . . . . . . . . . . . . . . . . . . . . USD 39..... . . . . . 49..... . . . . . . . 49
EQT Corporation, Senior, Unsecured, Notes, Callable, 2.500% Oct 1, 2020 .... . . . . . . . . . . . . . . . . . . . . . .USD 6..... . . . . . . . 7.... . . . . . . . . . 8
ERP Operating Limited Partnership, Senior, Unsecured, Notes, Callable, 3.250% Aug 1, 2027 .... . . . . . . . . . . . . . . . . . . . . . . . . . . . . . . . . . . . . . . . . . . . . . . . . . . USD 10..... . . . . . 12..... . . . . . . . 12
ERP Operating Limited Partnership, Senior, Unsecured, Notes, Callable, 4.000% Aug 1, 2047 .... . . . . . . . . . . . . . . . . . . . . . . . . . . . . . . . . . . . . . . . . . . . . . . . . . . . .USD 6..... . . . . . . . 7.... . . . . . . . . . 7
Fort CRE LLC, Series 2016-1A, Class A1, Collateral Mortgage Obligation, Floating Rate, May 21, 2036 .... . . . . . . . . . . . . . . . . . . . . . . . . . . . . . . USD 855..... . 1,091..... . . . 1,068
Fortress Investment Group, Term Loan B, Floating Rate, Jun 12, 2022 .... . . . . . . . . . . . . . . . . . . . . USD 100..... . . . . 133..... . . . . . 126
Fortress Transportation and Infrastructure Investors LLC, Series 144A, Senior, Unsecured, Notes, Callable, 6.750% Mar 15, 2022 .... . . . . . . . . . . . . . . . . . . . . . . . . . . . . . . . . . . . . . . . . . . . . . . . . USD 100..... . . . . 129..... . . . . . 130
Gardner Denver, Inc., Term Loan B1, Floating Rate, Jul 30, 2024 .... . . . . . . . . . . . . . . . . . . . . . . . . . . . . . . . . USD 636..... . . . . 653..... . . . . . 794
GE Commercial Mortgage Corporation Trust, Series 2007-C1, Class AMFX, 5.540% Dec 10, 2049 .... . . . . . . . . . . . . . . . . . . . . . . . . . . . . . . . . . . . . . . . . . USD 2,100..... . 2,710..... . . . 2,667
General Motors Acceptance Corporation, Senior, Unsecured, Notes, Unsubordinated, 8.000% Nov 1, 2031 .... . . . . . . . . . . . . . . . . . . . . . . . . . . . . . . USD 50..... . . . . . 77..... . . . . . . . 80
Goodman US Finance Three, LLC, Series 144A, Senior, Unsecured, Notes, Callable, 3.700% Mar 15, 2028 .... . . . . . . . . . . . . . . . . . . . . . . . . . . . . . . . . . . . . . . . USD 48..... . . . . . 59..... . . . . . . . 60
GSAMP Trust, Series 04-OPT, Class M1, Floating Rate, Nov 25, 2034 .... . . . . . . . . . . . . . . . . . . . . . . . . . . . . . . USD 160..... . . . . 160..... . . . . . 191
Par Value
(in thousands)Cost
($)
Fair Value
($)
GSR Mortgage Loan Trust, Series 2005-AR3, Class 6A1, Mortgage-Backed, Floating Rate, May 25, 2035 .... . . . . . . . . . . . . . . . . . . . . . . . . . . . . . . . . . . . . . USD 972..... . . . . 822..... . . . 1,170
GSR Mortgage Loan Trust, Series 2005-AR7, Class 6A1, Collateral Mortgage Obligation, Floating Rate, Nov 25, 2035 .... . . . . . . . . . . . . . . . . . . . USD 681..... . . . . 656..... . . . . . 853
GSR Mortgage Loan Trust, Series 2005-AR7, Class 2A1, Collateral Mortgage Obligation, Floating Rate, Nov 25, 2035 .... . . . . . . . . . . . . . . . . . . . . . USD 39..... . . . . . 33..... . . . . . . . 48
Harrah's Operating Company, Inc., Senior, Secured, Notes, Callable, 10.000% Dec 15, 2018 .... . . . . . . . . . . . . . . . . . . . . . . . . . . . . . . . . . . . . . . . . . . . . . . . . USD 331..... . . . . 406..... . . . . . 425
HCA, Inc., Secured, Notes, Callable, 5.500% Jun 15, 2047 .... . . . . . . . . . . . . . . . . . . . . . . . . . . . . . . . . . . . . . . . . . . . . . USD 34..... . . . . . 46..... . . . . . . . 44
HD Supply Waterworks, Term Loan B, Floating Rate, Aug 1, 2024..... . . . . . . . . . . . . . . . . . . . . . . . . . . . . . . . . . USD 14..... . . . . . 18..... . . . . . . . 18
Hilton Worldwide Finance LLC, Term Loan B, Floating Rate, Oct 25, 2023 .... . . . . . . . . . . . . . . . . . . . . USD 846..... . 1,095..... . . . 1,060
Howard Hughes Corporation, The, Series 144A, Senior, Unsecured, Notes, Callable, 5.375% Mar 15, 2025 .... . . . . . . . . . . . . . . . . . . . . . . . . . . . . . . . . . . . . . . . USD 67..... . . . . . 90..... . . . . . . . 85
HSI Asset Securitization Corporation Trust, Series 2007-NC1, Class A3, Floating Rate, Apr 25, 2037 .... . . . . . . . . . . . . . . . . . . . . . . . . . . . . . . . . . . . . . . USD 441..... . . . . 409..... . . . . . 422
Hudson Pacific Properties, L.P., Senior, Unsecured, Notes, 3.950% Nov 1, 2027 .... . . . . . . . USD 11..... . . . . . 14..... . . . . . . . 14
iHeartCommunications, Inc., Secured, Notes, Callable, 9.000% Sep 15, 2022 .... . . . . . . . . . . . . . . . . USD 900..... . 1,097..... . . . . . 795
Indymac IMSC Mortgage Loan Trust, Series 2007- HOA1, Class A11, Floating Rate, Jul 25, 2047 .... . . . . . . . . . . . . . . . . . . . . . . . . . . . . . . . . . . . . . . . . . . . USD 445..... . . . . 229..... . . . . . 437
Indymac INDX Mortgage Loan Trust, Series 2005- AR23, Class 2A1, Floating Rate, Nov 25, 2035 .... . . . . . . . . . . . . . . . . . . . . . . . . . . . . . . . . . . . . . . . . . . . USD 183..... . . . . 149..... . . . . . 205
Internet Brands, Term Loan, Floating Rate, Sep 15, 2024 .... . . . . . . . . . . . . . . . . . . . . . . . . . . . . . . . . . . . . . . . . . . . . . USD 40..... . . . . . 50..... . . . . . . . 50
Iowa Tobacco Settlement Authority, Series 2005 A, Tobacco Settlement, Asset-Backed, Sinking Funds, Callable, 6.500% Jun 1, 2023 .... USD 990..... . . . . 889..... . . . 1,218
iStar Inc., Senior, Unsecured, Notes, Callable, 4.625% Sep 15, 2020 .... . . . . . . . . . . . . . . . . . . . . . . . . . . . . . . .USD 4..... . . . . . . . 5.... . . . . . . . . . 5
iStar Inc., Senior, Unsecured, Notes, Callable, 5.250% Sep 15, 2022 .... . . . . . . . . . . . . . . . . . . . . . . . . . . . . . USD 17..... . . . . . 21..... . . . . . . . 21
JP Morgan Chace Commercial Mortgage Security, Series 2005-CB13, Class AJ, Collateral Strip Interest, Floating Rate, Jan 12, 2043 .... . . . . . . . . . . . . . . . . . . . . . . . . . . . . . . . . . . . . . . . . . . . USD 863..... . 1,110..... . . . 1,091
JP Morgan Chase Commercial Mortgage Security Trust, Series 2016-FLRR, Class BFL, Collateral Mortgage Obligation, Floating Rate, Jan 15, 2033 .... . . . . . . . . . . . . . . . . . . . . . . . . . . . . . USD 2,000..... . 2,576..... . . . 2,495
JP Morgan Mortgage Trust, Series 2007-A4, Class 3A1, Collateral Mortgage Obligation, Floating Rate, Jun 25, 2037 .... . . . . . . . . . . . . . . . . . . . . USD 250..... . . . . 229..... . . . . . 286
Las Vegas Sands LLC, Term Loan B, Floating Rate, Mar 29, 2024 .... . . . . . . . . . . . . . . . . . . . . . . . . . . . . . . USD 292..... . . . . 351..... . . . . . 366
Lehman Brothers Holdings Inc., Series I, Medium Term Notes, Senior, Unsecured, Floating Rate, Apr 22, 2020 .... . . . . . . . . . . . . . . . . . . . . USD 700..... . . . . 616..... . . . . . . . 53

BMO Global Strategic Bond Fund
SCHEDULE OF INVESTMENT PORTFOLIO (cont’d)September 30, 2017 (All amounts in thousands of Canadian dollars, unless otherwise noted)
Par Value
(in thousands)Cost
($)
Fair Value
($)
Long Beach Mortgage Loan Trust, Series 2006-WL1, Asset-Backed Certificates, Class I-A3, Floating Rate, Jan 25, 2046 .... . . . . . . . . . . . . . . . . . . . . . . . .USD 8..... . . . . . . . 8.... . . . . . . . . 10
Mallinckrodt International Finance S.A., Senior, Unsecured, Notes, 4.750% Apr 15, 2023 .... . . USD 1,380..... . 1,618..... . . . 1,464
MGM Growth Properties Operating Partnership LP/ MGP Finance Co-Issuer Inc., Series 144A, Senior, Unsecured, Notes, Callable, 4.500% Jan 15, 2028 .... . . . . . . . . . . . . . . . . . . . . . . . . . . . . . . USD 40..... . . . . . 48..... . . . . . . . 50
Molina Healthcare, Inc., Series 144A, Senior, Unsecured, Notes, Callable, 4.875% Jun 15, 2025 .... . . . . . . . . . . . . . . . . . . . . . . . . . . . . . . . . . . . . . . . . . . . . . . . . . . . .USD 7..... . . . . . . . 9.... . . . . . . . . . 9
Morgan Stanley ABS Capital I Inc. Trust, Series 2007-HE1, Class A2C, Mortgage Pass-Through Certificates, Floating Rate, Nov 25, 2036 .... . . . . . . . . . . . . . . . . . . . . . . . . . . . . . . . . . . . . . . . . . . . . . . USD 1,347..... . . . . 784..... . . . 1,128
Mult-Color Corporation, Series 144A, Senior, Unsecured, Notes, Callable, 4.875% Nov 1, 2025 .... . . . . . . . . . . . . . . . . . . . . . . . . . . . . . . . . . . . . . . . . . . . . . . . . . . . .USD 8..... . . . . . 10..... . . . . . . . 10
Multi-Color Corporation, Term Loan B, Floating Rate, Sep 20, 2024 .... . . . . . . . . . . . . . . . . . . . . . . . . . . . . . . . . . .USD 5..... . . . . . . . 6.... . . . . . . . . . 6
Navient Corporation, Senior, Unsecured, Notes, 6.500% Jun 15, 2022 .... . . . . . . . . . . . . . . . . . . . . . . . . . . . . USD 113..... . . . . 151..... . . . . . 149
NetApp, Inc., Senior, Unsecured, Notes, 2.000% Sep 27, 2019 .... . . . . . . . . . . . . . . . . . . . . . . . . . . . . . . .USD 7..... . . . . . . . 9.... . . . . . . . . . 9
NetApp, Inc., Senior, Unsecured, Notes, Callable, 3.300% Sep 29, 2024 .... . . . . . . . . . . . . . . . . . . USD 16..... . . . . . 20..... . . . . . . . 20
Netflix Inc., Senior, Unsecured, Notes, 3.625% May 15, 2027 .... . . . . . . . . . . . . . . . . . . . . . . . . . . . . . . . . . . . . . . EUR 200..... . . . . 297..... . . . . . 299
NextEra Energy Partners, LP, Series 144A, Senior, Unsecured, Notes, Callable, 4.500% Sep 15, 2027..... . . . . . . . . . . . . . . . . . . . . . . . . . . . . . . . . . . . . . . . . .USD 1..... . . . . . . . 1.... . . . . . . . . . 1
Nielsen Company (Luxembourg) Sarl, The, Series 144A, Senior, Unsecured, Notes, Callable, 5.500% Oct 1, 2021 .... . . . . . . . . . . . . . . . . USD 1,200..... . 1,236..... . . . 1,538
Nielsen Company (Luxembourg) Sarl, The, Series 144A, Senior, Unsecured, Notes, Callable, 5.000% Feb 1, 2025 .... . . . . . . . . . . . . . . . . . . . . USD 13..... . . . . . 17..... . . . . . . . 17
OCP CLO Ltd, Series 2014-6A, Class A1B, Collateral Loan Obligation, Floating Rate, Jul 17, 2026 .... . . . . . . . . . . . . . . . . . . . . . . . . . . . . . . . . . . . . . . . . . USD 4,100..... . 5,293..... . . . 5,116
Old Republic International Corporation, Senior, Unsecured, Notes, Callable, 3.875% Aug 26, 2026 .... . . . . . . . . . . . . . . . . . . . . . . . . . . . . . . . . . . . . . . . . . . . . . . . . USD 280..... . . . . 361..... . . . . . 354
Omega Healthcare Investors, Inc., Senior, Unsecured, Notes, Callable, 4.950% Apr 1, 2024 .... . . . . . . . . . . . . . . . . . . . . . . . . . . . . . . . . . . . . . . . . . . . . . . . . USD 200..... . . . . 222..... . . . . . 263
Omega Healthcare Investors, Inc., Senior, Unsecured, Notes, Callable, 4.500% Jan 15, 2025 .... . . . . . . . . . . . . . . . . . . . . . . . . . . . . . . . . . . . . . . . . . . . . . . . . USD 140..... . . . . 180..... . . . . . 178
Omega Healthcare Investors, Inc., Senior, Unsecured, Notes, Callable, 5.250% Jan 15, 2026 .... . . . . . . . . . . . . . . . . . . . . . . . . . . . . . . . . . . . . . . . . . . . . . . . . USD 240..... . . . . 322..... . . . . . 317
Omega Healthcare Investors, Inc., Senior, Unsecured, Notes, Callable, 4.500% Apr 1, 2027 .... . . . . . . . . . . . . . . . . . . . . . . . . . . . . . . . . . . . . . . . . . . . . . . . . USD 140..... . . . . 178..... . . . . . 174
OneMain Financial Holdings, Inc., Series 144A, Senior, Unsecured, Notes, Callable, 6.750% Dec 15, 2019 .... . . . . . . . . . . . . . . . . . . . . . . . . . . . . . . . . . . . . . USD 710..... . . . . 818..... . . . . . 921
Par Value
(in thousands)Cost
($)
Fair Value
($)
OneMain Financial Holdings, Inc., Series 144A, Senior, Unsecured, Notes, Callable, 7.250% Dec 15, 2021 .... . . . . . . . . . . . . . . . . . . . . . . . . . . . . . . . . . . . . . USD 186..... . . . . 214..... . . . . . 242
Oppenheimer Holdings Inc., Secured, Notes, Callable, 6.75%, Jul 1, 2022 .... . . . . . . . . . . . . . . . . . . . . . . USD 16..... . . . . . 21..... . . . . . . . 20
Ortho-Clinical Diagnostics, Inc., Series 144A, Senior, Unsecured, Notes, Callable, 6.625% May 15, 2022 .... . . . . . . . . . . . . . . . . . . . . . . . . . . . . . . . . . . . . . USD 678..... . . . . 750..... . . . . . 831
Petroleo Global Trading BV, Term Loan, Floating Rate, Feb 19, 2020 .... . . . . . . . . . . . . . . . . . . . . USD 100..... . . . . 121..... . . . . . 121
PetSmart, Inc., Series 144A, Senior, Secured, Notes, Callable, 5.875% Jun 1, 2025 .... . . . . . . . . . . . USD 34..... . . . . . 46..... . . . . . . . 37
Pilgrim's Pride Corporation, Series 144A, Senior, Unsecured, Notes, Callable, 5.875% Sep 30, 2027..... . . . . . . . . . . . . . . . . . . . . . . . . . . . . . . . . . . . . . . . USD 14..... . . . . . 17..... . . . . . . . 18
Pitney Bowes Inc., Senior, Unsecured, Notes, 3.625% Sep 15, 2020 .... . . . . . . . . . . . . . . . . . . . . . . . . . . . . . USD 10..... . . . . . 12..... . . . . . . . 12
Pitney Bowes Inc., Senior, Unsecured, Notes, Callable, 4.700% Apr 1, 2023 .... . . . . . . . . . . . . . . . . . . . . USD 22..... . . . . . 27..... . . . . . . . 27
Post Holdings Inc., Term Loan B, Floating Rate, May 24, 2024 .... . . . . . . . . . . . . . . . . . . . . . . . . . . . . . . . . . . . . . . . USD 20..... . . . . . 27..... . . . . . . . 25
Provident Funding Associates LP/PFG Finance Corp., Series 144A, Senior, Unsecured, Notes, Callable, 6.375% Jun 15, 2025 .... . . . . . . . . . . USD 18..... . . . . . 24..... . . . . . . . 24
RBS Greenwich Capital Mortgage Loan Trust, Series 2008-A , Class A1, RBSGC Mortgage Pass-Through Certificates, Floating Rate, Nov 25, 2035 .... . . . . . . . . . . . . . . . . . . . . . . . . . . . . . . . . . . . USD 1,064..... . . . . 875..... . . . 1,297
Residential Funding Mortgage Securities I, Inc., Series 2005-SA2, Class 4A, Mortgage Pass-Through Certificates, Floating Rate, Jun 25, 2035 .... . . . . . . . . . . . . . . . . . . . . . . . . . . . . . . . . . . . . . . . . . . . . . . . . USD 407..... . . . . 374..... . . . . . 501
Rockies Express Pipeline LLC, Series 144A, Senior, Unsecured, Notes, 6.000% Jan 15, 2019 .... . . . . . . . . . . . . . . . . . . . . . . . . . . . . . . . . . . . . . . . . . . . . . . . . USD 300..... . . . . 390..... . . . . . 387
RPI Finance Trust, Term Loan B6, Floating Rate, Mar 27, 2023 .... . . . . . . . . . . . . . . . . . . . . . . . . . . . . . . . . . . . . . . . USD 35..... . . . . . 47..... . . . . . . . 44
SBA Communications Corporation, Series 144A, Senior, Unsecured, Notes, Callable, 4.000% Oct 1, 2022..... . . . . . . . . . . . . . . . . . . . . . . . . . . . . . . . . . . . . . . . . . USD 22..... . . . . . 27..... . . . . . . . 27
Sequa Mezzanine Holdings L.L.C., Term Loan B, Floating Rate, Nov 28, 2021 .... . . . . . . . . . . . . . . . . . . . USD 180..... . . . . 250..... . . . . . 226
SG Mortgage Securities Trust, Series 2006-FRE2, Class A2C, Floating Rate, Jul 25, 2036 .... USD 565..... . . . . 260..... . . . . . 252
SLM Corporation, Series A, Medium Term Notes, Senior, Unsecured, 5.500% Jan 15, 2019 .... . . . . . . . . . . . . . . . . . . . . . . . . . . . . . . . . . . . . . . . . . . . . . . USD 2,000..... . 2,203..... . . . 2,583
SLM Corporation, Series A, Medium Term Notes, Senior, Unsecured, 8.000% Mar 25, 2020 .... . . . . . . . . . . . . . . . . . . . . . . . . . . . . . . . . . . . . . . . . . . . . . . . . USD 129..... . . . . 191..... . . . . . 178
SMB Private Education Loan Trust, Series 2016-B, Class A1, Floating Rate, Nov 15, 2023 .... . . . . USD 350..... . . . . 454..... . . . . . 437
Springleaf Finance Corporation, Senior, Unsecured, Notes, 6.000% Jun 1, 2020 .... . . . . . . USD 950..... . 1,281..... . . . 1,249
Springleaf Finance Corporation, Senior, Unsecured, Notes, 8.250% Dec 15, 2020 .... . . . . USD 185..... . . . . 252..... . . . . . 261
Springleaf Finance Corporation, Senior, Unsecured, Notes, 6.125% May 15, 2022 ... . . . . USD 227..... . . . . 309..... . . . . . 299
Sprint Capital Corporation, Senior, Unsecured, Notes, 6.900% May 1, 2019 .... . . . . . . . . . . . . . . . . . USD 1,550..... . 2,009..... . . . 2,062

BMO Global Strategic Bond Fund
SCHEDULE OF INVESTMENT PORTFOLIO (cont’d)September 30, 2017 (All amounts in thousands of Canadian dollars, unless otherwise noted)
Par Value
(in thousands)Cost
($)
Fair Value
($)
Sprint Communications Inc., Senior, Unsecured, Notes, 7.000% Aug 15, 2020 .... . . . . . . . . . . . . . . . . . . USD 550..... . . . . 729..... . . . . . 750
Sprint Communications Inc., Term Loan B, Floating Rate, Feb 2, 2024 .... . . . . . . . . . . . . . . . . . . . . . USD 998..... . 1,298..... . . . 1,246
State of Illinois, General Obligation Unlimited, Sinkable, 5.100% Jun 1, 2033 .... . . . . . . . . . . . . . . . . . . . USD 80..... . . . . . 97..... . . . . . 101
State of Illinois, Build America Bonds, Series 3, General Obligation Unlimited, Sinkable, Callable, 6.725% Apr 1, 2035 .... . . . . . . . . . . . . . . . . . . . . USD 10..... . . . . . 14..... . . . . . . . 14
State of Illinois, Build America Bonds, General Obligation Unlimited, Sinkable, 7.35% Jul 1, 2035 .... . . . . . . . . . . . . . . . . . . . . . . . . . . . . . . . . . . . . . . . . . . . . . . . . . . USD 10..... . . . . . 14..... . . . . . . . 14
Station Casinos LLC, Series 144A, Senior, Unsecured, Notes, Callable, 5.000% Oct 1, 2025 .... . . . . . . . . . . . . . . . . . . . . . . . . . . . . . . . . . . . . . . . . . . . . . . . . . . USD 68..... . . . . . 82..... . . . . . . . 85
Symantec Corporation, Series 144A, Senior, Unsecured, Notes, Callable, 5.000% Apr 15, 2025 .... . . . . . . . . . . . . . . . . . . . . . . . . . . . . . . . . . . . . . . . . . . . . . . . . . . USD 10..... . . . . . 13..... . . . . . . . 13
Tech Data Corporation, Senior, Unsecured, Notes, Callable, 3.700% Feb 15, 2022 .... . . . . . . . . . . .USD 8..... . . . . . 11..... . . . . . . . 10
Tech Data Corporation, Senior, Unsecured, Notes, Callable, 4.950% Feb 15, 2027 .... . . . . . . . . . USD 21..... . . . . . 28..... . . . . . . . 27
Tenet Healthcare Corporation, Series 144A, Senior, Secured, Notes, Callable, 4.625% Jul 15, 2024 .... . . . . . . . . . . . . . . . . . . . . . . . . . . . . . . . . . . . . . . . . . . . . . USD 92..... . . . . 124..... . . . . . 114
TerraForm Global Operating, LLC, Series 144A, Senior, Unsecured, Notes, Callable, 9.750% Aug 15, 2022 .... . . . . . . . . . . . . . . . . . . . . . . . . . . . . . . . . . . . . . USD 800..... . 1,036..... . . . 1,108
Texas Public Finance Authority, Revenue Bonds, Sinkable, Callable, 8.250% Jul 1, 2024 .... . . . . . . . . . . . . . . . . . . . . . . . . . . . . . . . . . . . . . . . . . . . . . . USD 2,300..... . 2,580..... . . . 2,997
Time Warner Inc., Senior, Unsecured, Notes, Callable, 3.800% Feb 15, 2027 .... . . . . . . . . . . . . . . . . . . USD 36..... . . . . . 48..... . . . . . . . 45
Tobacco Settlement Finance Authority, West Virginia, Series 2007A, Taxable Tobacco Settlement, Asset-Backed Bonds, 7.467% Jun 1, 2047 .... . . . . . . . . . . . . . . . . . . . . . . . . . . . . . . . . . . . . . . USD 2,335..... . 1,689..... . . . 2,854
Transocean Phoenix 2 Limited, Series 144A, Sinking Funds, Secured, Notes, Callable, 7.750% Oct 15, 2024 .... . . . . . . . . . . . . . . . . . . . . . . . . . . . . . . USD 12..... . . . . . 17..... . . . . . . . 17
Transocean Proteus Limited, Series 144A, Sinking Funds, Secured, Notes, Callable, 6.250% Dec 1, 2024 .... . . . . . . . . . . . . . . . . . . . . . . . . . . . . . USD 125..... . . . . 169..... . . . . . 164
TTM Technologies, Inc., Series 144A, Senior, Unsecured, Notes, Callable, 5.625% Oct 1, 2025 .... . . . . . . . . . . . . . . . . . . . . . . . . . . . . . . . . . . . . . . . . . . . . . . . . . . USD 10..... . . . . . 12..... . . . . . . . 13
United Air Lines, Inc., Series 144A, Series 2007-1, Class B, Sinkable, Senior, Secured, Notes, Pass-Thru-Certificates, 7.336% Jul 2, 2019 .... . . . . . . . . . . . . . . . . . . . . . . . . . . . . . . . . . . . . . . . . . . . . . . . . USD 129..... . . . . 137..... . . . . . 170
United States Treasury Bonds, 3.750% Nov 15, 2043 .... . . . . . . . . . . . . . . . . . . . . . . . . . . . . . . . . . . . . . . . . . . . . . . USD 1,800..... . 2,827..... . . . 2,632
United States Treasury Bonds, 2.500% Feb 15, 2045 .... . . . . . . . . . . . . . . . . . . . . . . . . . . . . . . . . . . . . . . . . . . . . . . USD 7,800..... . 9,699..... . . . 9,072
United States Treasury Bonds, 2.875% Nov 15, 2046 .... . . . . . . . . . . . . . . . . . . . . . . . . . . . . . . . . . . . . . . . . . . . . . . USD 1,500..... . 1,867..... . . . 1,877
United States Treasury Notes, Floating Rate, Apr 30, 2018 .... . . . . . . . . . . . . . . . . . . . . . . . . . . . . . . . . . . . . . . USD 100..... . . . . 131..... . . . . . 125
United States Treasury Notes, 1.625% Feb 15, 2026 .... . . . . . . . . . . . . . . . . . . . . . . . . . . . . . . . . . . . . . . . . . . . . . . USD 9,200..... 11,518..... . 10,909
Par Value
(in thousands)Cost
($)
Fair Value
($)
United States Treasury Notes, 1.625% May 15, 2026 .... . . . . . . . . . . . . . . . . . . . . . . . . . . . . . . . . . . . . . . . . . . . . . . USD 2,800..... . 3,479..... . . . 3,312
UPC Financing Partnership, Term Loan AP, Floating Rate, Apr 15, 2025 .... . . . . . . . . . . . . . . . . . . . . USD 100..... . . . . 130..... . . . . . 125
Valeant Pharmaceuticals International, Inc., Series 144A, Secured, Notes, Callable, 6.500% Mar 15, 2022 .... . . . . . . . . . . . . . . . . . . . . . . . . . . . . . USD 30..... . . . . . 41..... . . . . . . . 40
Valeant Pharmaceuticals International, Inc., Term Loan BF1, Floating Rate, Apr 1, 2022 .. .. . . USD 280..... . . . . 358..... . . . . . 356
Valeant Pharmaceuticals International, Inc., Series 144A, Secured, Notes, Callable, 7.000% Mar 15, 2024 .... . . . . . . . . . . . . . . . . . . . . . . . . . . . . . USD 58..... . . . . . 78..... . . . . . . . 77
VEREIT Operating Partnership, L.P., Senior, Unsecured, Notes, Callable, 3.950% Aug 15, 2027 .... . . . . . . . . . . . . . . . . . . . . . . . . . . . . . . . . . . . . . . . . . . . . . . . . . . USD 14..... . . . . . 18..... . . . . . . . 17
Verizon Communications Inc., Senior, Unsecured, Notes, 4.125% Mar 16, 2027 .... . . . . USD 170..... . . . . 227..... . . . . . 221
Verizon Communications Inc., Senior, Unsecured, Notes, 5.250% Mar 16, 2037 .... . . . . USD 110..... . . . . 147..... . . . . . 151
Verizon Communications Inc., Senior, Unsecured, Notes, 5.500% Mar 16, 2047 .... . . . . . . USD 60..... . . . . . 81..... . . . . . . . 83
ViaSat, Inc., Series 144A, Senior, Unsecured, Notes, Callable, 5.625% Sep 15, 2025 .... . . . . . . . . . USD 84..... . . . . 102..... . . . . . 105
Viking Cruises Ltd., Series 144A, Senior, Unsecured, Notes, Callable, 5.875% Sep 15, 2027 .... . . . . . . . . . . . . . . . . . . . . . . . . . . . . . . . . . . . . . . . . . . . . . . . . . . . .USD 6..... . . . . . . . 7.... . . . . . . . . . 8
VMware, Inc., Senior, Unsecured, Notes, 2.300% Aug 21, 2020 .... . . . . . . . . . . . . . . . . . . . . . . . . . . . . . USD 30..... . . . . . 38..... . . . . . . . 38
VMware, Inc., Senior, Unsecured, Notes, Callable, 2.950% Aug 21, 2022 .... . . . . . . . . . . . . . . . . . . USD 20..... . . . . . 25..... . . . . . . . 25
VMware, Inc., Senior, Unsecured, Notes, Callable, 3.900% Aug 21, 2027 .... . . . . . . . . . . . . . . . . . . USD 20..... . . . . . 25..... . . . . . . . 25
VRX Escrow Corporation, Series 144A, Senior, Unsecured, Notes, Callable, 5.375% Mar 15, 2020 .... . . . . . . . . . . . . . . . . . . . . . . . . . . . . . . . . . . . . . . . . . . . . . . . . USD 800..... . 1,023..... . . . . . 996
Wachovia Bank Commercial Mortgage Trust, Series 2005-C16, Class H, Floating Rate, Oct 15, 2041 .... . . . . . . . . . . . . . . . . . . . . . . . . . . . . . . . . . . . . . . . . . USD 1,366..... . 1,825..... . . . 1,708
Wachovia Bank Commercial Mortgage Trust, Series 2007-C33, Class AJ, Collateral Strip Interest, Floating Rate, Feb 15, 2051 .... . . . . . . . . . USD 870..... . 1,178..... . . . 1,113
WaMu Mortgage Pass-Through Certificates, Series 2006-AR9, Class 1A, Collateral Mortgage Obligation, Floating Rate, Aug 25, 2046 .... . . . . . . . . . . . . . . . . . . . . . . . . . . . . . . . . . . . . . . . . . . . . . . . . USD 251..... . . . . 161..... . . . . . 283
Washington Prime Group, L.P., Senior, Unsecured, Notes, Callable, 5.950% Aug 15, 2024 .... . . . . . . . . . . . . . . . . . . . . . . . . . . . . . . . . . . . . . . . . . . . . . . . . USD 190..... . . . . 235..... . . . . . 242
Wells Fargo & Company, Euro Medium Term Notes, Senior, Unsecured, 2.125% Dec 20, 2023 .... . . . . . . . . . . . . . . . . . . . . . . . . . . . . . . . . . . . . . . . . . . . . . . . . GBP 230..... . . . . 377..... . . . . . 389
Wells Fargo Mortgage Backed Securities Trust, Series 2006-AR7, Class 2A4, Mortgage Pass- Through Certificates, Floating Rate, May 25, 2036 .... . . . . . . . . . . . . . . . . . . . . . . . . . . . . . . . . . . . . . . . . . . . . . . . . USD 158..... . . . . 142..... . . . . . 189
Wells Fargo Mortgage Backed Securities Trust, Series 2006-AR10, Class 4A1, Mortgage Pass- Through Certificates, Floating Rate, Jul 25, 2036 .... . . . . . . . . . . . . . . . . . . . . . . . . . . . . . . . . . . . . . . . . . . . USD 848..... . . . . 712..... . . . 1,066
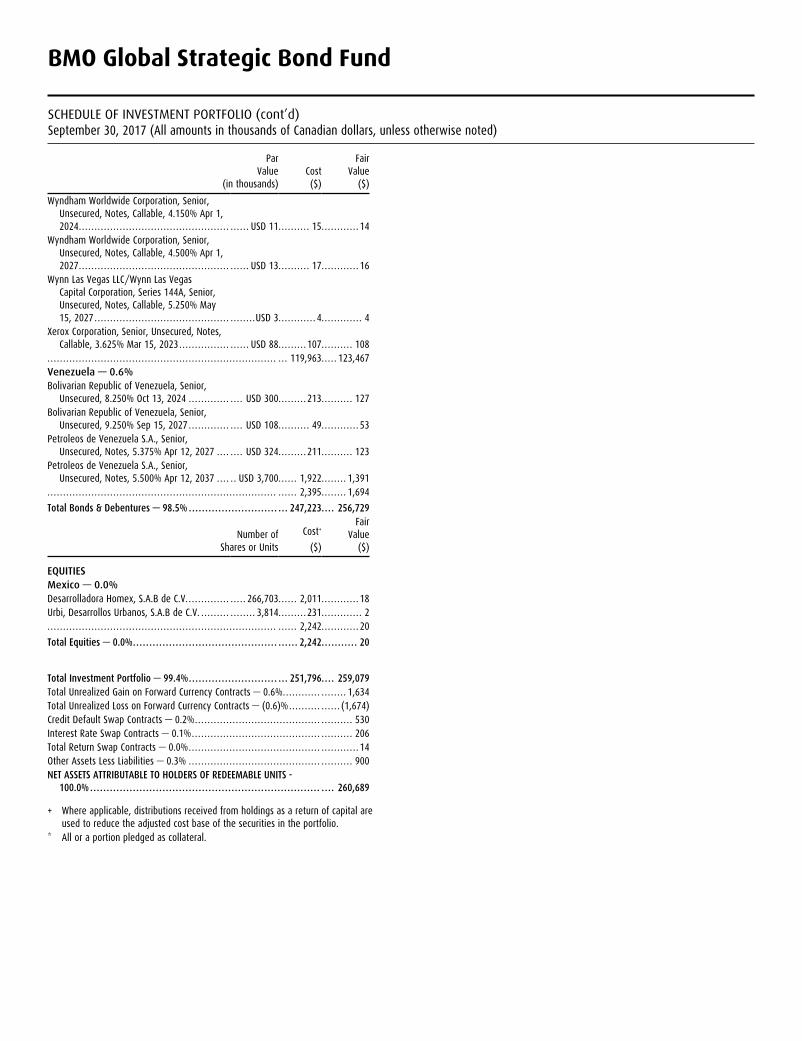
BMO Global Strategic Bond Fund
SCHEDULE OF INVESTMENT PORTFOLIO (cont’d)September 30, 2017 (All amounts in thousands of Canadian dollars, unless otherwise noted)
Par Value
(in thousands)Cost
($)
Fair Value
($)
Wyndham Worldwide Corporation, Senior, Unsecured, Notes, Callable, 4.150% Apr 1, 2024 .... . . . . . . . . . . . . . . . . . . . . . . . . . . . . . . . . . . . . . . . . . . . . . . . . . . USD 11..... . . . . . 15..... . . . . . . . 14
Wyndham Worldwide Corporation, Senior, Unsecured, Notes, Callable, 4.500% Apr 1, 2027 .... . . . . . . . . . . . . . . . . . . . . . . . . . . . . . . . . . . . . . . . . . . . . . . . . . . USD 13..... . . . . . 17..... . . . . . . . 16
Wynn Las Vegas LLC/Wynn Las Vegas Capital Corporation, Series 144A, Senior, Unsecured, Notes, Callable, 5.250% May 15, 2027 .... . . . . . . . . . . . . . . . . . . . . . . . . . . . . . . . . . . . . . . . . . . . . . . .USD 3..... . . . . . . . 4.... . . . . . . . . . 4
Xerox Corporation, Senior, Unsecured, Notes, Callable, 3.625% Mar 15, 2023 .... . . . . . . . . . . . . . . . . . . USD 88..... . . . . 107..... . . . . . 108
..... . . . . . . . . . . . . . . . . . . . . . . . . . . . . . . . . . . . . . . . . . . . . . . . . . . . . . . . . . . . . . . . . . . . . . . . 119,963..... 123,467Venezuela — 0.6%Bolivarian Republic of Venezuela, Senior,
Unsecured, 8.250% Oct 13, 2024 .... . . . . . . . . . . . . . USD 300..... . . . . 213..... . . . . . 127Bolivarian Republic of Venezuela, Senior,
Unsecured, 9.250% Sep 15, 2027 .... . . . . . . . . . . . . . USD 108..... . . . . . 49..... . . . . . . . 53Petroleos de Venezuela S.A., Senior,
Unsecured, Notes, 5.375% Apr 12, 2027 .... . . . . USD 324..... . . . . 211..... . . . . . 123Petroleos de Venezuela S.A., Senior,
Unsecured, Notes, 5.500% Apr 12, 2037 .... . . USD 3,700..... . 1,922..... . . . 1,391..... . . . . . . . . . . . . . . . . . . . . . . . . . . . . . . . . . . . . . . . . . . . . . . . . . . . . . . . . . . . . . . . . . . . . . . . . . . 2,395..... . . . 1,694
Total Bonds & Debentures — 98.5% ........................... ... 247,223.... 256,729
Number of Shares or Units
Cost+
($)
Fair Value
($)
EQUITIESMexico — 0.0%Desarrolladora Homex, S.A.B de C.V. ... . . . . . . . . . . . . . . . 266,703..... . 2,011..... . . . . . . . 18Urbi, Desarrollos Urbanos, S.A.B de C.V. ... . . . . . . . . . . . . . . 3,814..... . . . . 231..... . . . . . . . . 2.... . . . . . . . . . . . . . . . . . . . . . . . . . . . . . . . . . . . . . . . . . . . . . . . . . . . . . . . . . . . . . . . . . . . . . . . . . . . 2,242..... . . . . . . . 20
Total Equities — 0.0% ............................................ ...... 2,242........... 20
Total Investment Portfolio — 99.4% ........................... ... 251,796.... 259,079Total Unrealized Gain on Forward Currency Contracts — 0.6% ..... . . . . . . . . . . . . . . . 1,634Total Unrealized Loss on Forward Currency Contracts — (0.6)% ..... . . . . . . . . . . . (1,674)Credit Default Swap Contracts — 0.2% ..... . . . . . . . . . . . . . . . . . . . . . . . . . . . . . . . . . . . . . . . . . . . . . 530Interest Rate Swap Contracts — 0.1% ..... . . . . . . . . . . . . . . . . . . . . . . . . . . . . . . . . . . . . . . . . . . . . . . 206Total Return Swap Contracts — 0.0% ..... . . . . . . . . . . . . . . . . . . . . . . . . . . . . . . . . . . . . . . . . . . . . . . . . . 14Other Assets Less Liabilities — 0.3% ..... . . . . . . . . . . . . . . . . . . . . . . . . . . . . . . . . . . . . . . . . . . . . . . . 900NET ASSETS ATTRIBUTABLE TO HOLDERS OF REDEEMABLE UNITS -
100.0% ...................................................................... .... 260,689
+ Where applicable, distributions received from holdings as a return of capital are used to reduce the adjusted cost base of the securities in the portfolio.
* All or a portion pledged as collateral.

BMO Global Strategic Bond Fund
SCHEDULE OF INVESTMENT PORTFOLIO (cont’d)September 30, 2017 (All amounts in thousands of Canadian dollars, unless otherwise noted)
UNREALIZED GAIN ON FORWARD CURRENCY CONTRACTS
Settlement Date
Currency Buy
Position (000s)
Currency Sell
Position (000s)
Contract Rate Counterparty
Credit Rating*
Unrealized Gain
3-Oct-17 . . . . . . . . . . . . . . . . . . .CAD . . . . . . . . . . . . . 278. . . . . . . . . . . . EUR . . . . . . . . . . . (188). . . . . . . . . 1.4796. . . . . . Australia and New Zealand Banking Group Ltd. . . . . . A-1+ . . . . . . . . . . . . . . . . . . . . . . . . . . . 13-Oct-17 . . . . . . . . . . . . . . . . . . .CAD . . . . . . . . . . . 2,187. . . . . . . . . . . .USD . . . . . . . . . (1,752). . . . . . . . . 1.2482. . . . . . JPMorgan Chase Bank N.A. . . . . . . . . . . . . . . . . . . . . . . . . . . . . A-1 . . . . . . . . . . . . . . . . . . . . . . . . . . . . . 13-Oct-17 . . . . . . . . . . . . . . . . . . .CAD . . . . . . . . . . . 2,139. . . . . . . . . . . .USD . . . . . . . . . (1,703). . . . . . . . . 1.2558. . . . . . Australia and New Zealand Banking Group Ltd. . . . . . A-1+ . . . . . . . . . . . . . . . . . . . . . . . . . 143-Oct-17 . . . . . . . . . . . . . . . . . . .CAD . . . . . . . . . . . 1,949. . . . . . . . . . . .USD . . . . . . . . . (1,543). . . . . . . . . 1.2633. . . . . . JPMorgan Chase Bank N.A. . . . . . . . . . . . . . . . . . . . . . . . . . . . . A-1 . . . . . . . . . . . . . . . . . . . . . . . . . . . 243-Oct-17 . . . . . . . . . . . . . . . . . . .CAD . . . . . . . . . . . 2,144. . . . . . . . . . . .USD . . . . . . . . . (1,697). . . . . . . . . 1.2633. . . . . . JPMorgan Chase Bank N.A. . . . . . . . . . . . . . . . . . . . . . . . . . . . . A-1 . . . . . . . . . . . . . . . . . . . . . . . . . . . 263-Oct-17 . . . . . . . . . . . . . . . . . . .CAD . . . . . . . . . 33,704. . . . . . . . . . . . EUR . . . . . . . (22,638). . . . . . . . . 1.4888. . . . . . JPMorgan Chase Bank N.A. . . . . . . . . . . . . . . . . . . . . . . . . . . . . A-1 . . . . . . . . . . . . . . . . . . . . . . . . . . 3203-Oct-17 . . . . . . . . . . . . . . . . . . .CAD . . . . . . . . . 83,548. . . . . . . . . . . .USD . . . . . . . (66,679). . . . . . . . . 1.2530. . . . . . Goldman Sachs Bank USA . . . . . . . . . . . . . . . . . . . . . . . . . . . . . . A-1 . . . . . . . . . . . . . . . . . . . . . . . . . . 3503-Oct-17 . . . . . . . . . . . . . . . . . . .USD . . . . . . . . . . . . . 380. . . . . . . . . . . .CAD . . . . . . . . . . . (470). . . . . . . . . 0.8079. . . . . . Goldman Sachs Bank USA . . . . . . . . . . . . . . . . . . . . . . . . . . . . . . A-1 . . . . . . . . . . . . . . . . . . . . . . . . . . . . . 43-Oct-17 . . . . . . . . . . . . . . . . . . .USD . . . . . . . . . . . . . 253. . . . . . . . . . . .CAD . . . . . . . . . . . (311). . . . . . . . . 0.8148. . . . . . JPMorgan Chase Bank N.A. . . . . . . . . . . . . . . . . . . . . . . . . . . . . A-1 . . . . . . . . . . . . . . . . . . . . . . . . . . . . . 53-Oct-17 . . . . . . . . . . . . . . . . . . .USD . . . . . . . . . . . 2,466. . . . . . . . . . . .CAD . . . . . . . . . (3,059). . . . . . . . . 0.8062. . . . . . JPMorgan Chase Bank N.A. . . . . . . . . . . . . . . . . . . . . . . . . . . . . A-1 . . . . . . . . . . . . . . . . . . . . . . . . . . . 183-Oct-17 . . . . . . . . . . . . . . . . . . .USD . . . . . . . . . . . 5,731. . . . . . . . . . . .CAD . . . . . . . . . (7,130). . . . . . . . . 0.8038. . . . . . Citibank N.A. . . . . . . . . . . . . . . . . . . . . . . . . . . . . . . . . . . . . . . . . . . . . A-1 . . . . . . . . . . . . . . . . . . . . . . . . . . . 213-Oct-17 . . . . . . . . . . . . . . . . . . .USD . . . . . . . . . 69,643. . . . . . . . . . . .CAD . . . . . . . (86,211). . . . . . . . . 0.8078. . . . . . National Australia Bank Limited . . . . . . . . . . . . . . . . . . . . . . . A-1+ . . . . . . . . . . . . . . . . . . . . . . . . 6862-Nov-17 . . . . . . . . . . . . . . . . . .CAD . . . . . . . . . . . . . 527. . . . . . . . . . . .USD . . . . . . . . . . . (422). . . . . . . . . 1.2488. . . . . . BNP Paribas SA . . . . . . . . . . . . . . . . . . . . . . . . . . . . . . . . . . . . . . . . . A-1 . . . . . . . . . . . . . . . . . . . . . . . . . . . . . 02-Nov-17 . . . . . . . . . . . . . . . . . .CAD . . . . . . . . . 88,205. . . . . . . . . . . .USD . . . . . . . (70,694). . . . . . . . . 1.2477. . . . . . Bank of America N.A. . . . . . . . . . . . . . . . . . . . . . . . . . . . . . . . . . . A-1 . . . . . . . . . . . . . . . . . . . . . . . . . . . 1115-Nov-17 . . . . . . . . . . . . . . . . .CAD . . . . . . . . . . . . . 255. . . . . . . . . . . AUD . . . . . . . . . . . (258). . . . . . . . . 0.9878. . . . . . Australia and New Zealand Banking Group Ltd. . . . . . A-1+ . . . . . . . . . . . . . . . . . . . . . . . . . . . 315-Nov-17 . . . . . . . . . . . . . . . . GBP . . . . . . . . . . . . . 179. . . . . . . . . . . .CAD . . . . . . . . . . . (292). . . . . . . . . 0.6140. . . . . . Goldman Sachs Bank USA . . . . . . . . . . . . . . . . . . . . . . . . . . . . . . A-1 . . . . . . . . . . . . . . . . . . . . . . . . . . . . . 815-Nov-17 . . . . . . . . . . . . . . . . GBP . . . . . . . . . . . . . 201. . . . . . . . . . . .CAD . . . . . . . . . . . (324). . . . . . . . . 0.6212. . . . . . Citibank N.A. . . . . . . . . . . . . . . . . . . . . . . . . . . . . . . . . . . . . . . . . . . . . A-1 . . . . . . . . . . . . . . . . . . . . . . . . . . . 1315-Nov-17 . . . . . . . . . . . . . . . . GBP . . . . . . . . . . . . . 241. . . . . . . . . . . .CAD . . . . . . . . . . . (388). . . . . . . . . 0.6207. . . . . . JPMorgan Chase Bank N.A. . . . . . . . . . . . . . . . . . . . . . . . . . . . . A-1 . . . . . . . . . . . . . . . . . . . . . . . . . . . 1515-Nov-17 . . . . . . . . . . . . . . . . GBP . . . . . . . . . . . 1,555. . . . . . . . . . . .CAD . . . . . . . . . (2,491). . . . . . . . . 0.6243. . . . . . National Australia Bank Limited . . . . . . . . . . . . . . . . . . . . . . . A-1+ . . . . . . . . . . . . . . . . . . . . . . . . 11215-Nov-17 . . . . . . . . . . . . . . . . .USD . . . . . . . . . . . . . 129. . . . . . . . . . . GBP . . . . . . . . . . . . (95). . . . . . . . . 1.3582. . . . . . Goldman Sachs Bank USA . . . . . . . . . . . . . . . . . . . . . . . . . . . . . . A-1 . . . . . . . . . . . . . . . . . . . . . . . . . . . . . 2
Total Unrealized Gain on Forward Currency Contracts . . . . . . . . . . . . . . . . . . . . . . . . . . . . . . . . . . . . . . . . . . . . . . . . . . . . . . . . . . . . . . . . . . . . . . . . . . . . . . . . . . . . . . . . . . . . . . . . . . . . . . . . . . . . . . . . . . . . . . . . . . . . . . . . . . . . . 1,634
UNREALIZED LOSS ON FORWARD CURRENCY CONTRACTS
Settlement Date
Currency Buy
Position (000s)
Currency Sell
Position (000s)
Contract Rate Counterparty
Credit Rating*
Unrealized Loss
3-Oct-17 . . . . . . . . . . . . . . . . . . .CAD . . . . . . . . . . . . . 150. . . . . . . . . . . . EUR . . . . . . . . . . . (103). . . . . . . . . 1.4560. . . . . . Standard Chartered Bank . . . . . . . . . . . . . . . . . . . . . . . . . . . . . . A-1 . . . . . . . . . . . . . . . . . . . . . . . . . . . (2)3-Oct-17 . . . . . . . . . . . . . . . . . . .CAD . . . . . . . . . . . . . 120. . . . . . . . . . . . EUR . . . . . . . . . . . . (83). . . . . . . . . 1.4513. . . . . . JPMorgan Chase Bank N.A. . . . . . . . . . . . . . . . . . . . . . . . . . . . . A-1 . . . . . . . . . . . . . . . . . . . . . . . . . . . (2)3-Oct-17 . . . . . . . . . . . . . . . . . . .CAD . . . . . . . . . . . . . 327. . . . . . . . . . . . EUR . . . . . . . . . . . (224). . . . . . . . . 1.4580. . . . . . Australia and New Zealand Banking Group Ltd. . . . . . A-1+ . . . . . . . . . . . . . . . . . . . . . . . . . (4)3-Oct-17 . . . . . . . . . . . . . . . . . . .CAD . . . . . . . . . . . . . 618. . . . . . . . . . . .USD . . . . . . . . . . . (500). . . . . . . . . 1.2370. . . . . . Goldman Sachs Bank USA . . . . . . . . . . . . . . . . . . . . . . . . . . . . . . A-1 . . . . . . . . . . . . . . . . . . . . . . . . . . . (5)3-Oct-17 . . . . . . . . . . . . . . . . . . .CAD . . . . . . . . . . . 1,290. . . . . . . . . . . .USD . . . . . . . . . (1,041). . . . . . . . . 1.2388. . . . . . JPMorgan Chase Bank N.A. . . . . . . . . . . . . . . . . . . . . . . . . . . . . A-1 . . . . . . . . . . . . . . . . . . . . . . . . . . . (9)3-Oct-17 . . . . . . . . . . . . . . . . . . .CAD . . . . . . . . . . . . . 962. . . . . . . . . . . .USD . . . . . . . . . . . (779). . . . . . . . . 1.2350. . . . . . HSBC Bank USA . . . . . . . . . . . . . . . . . . . . . . . . . . . . . . . . . . . . . . . . . A-1+ . . . . . . . . . . . . . . . . . . . . . . . (10)3-Oct-17 . . . . . . . . . . . . . . . . . . .CAD . . . . . . . . . . . . . 680. . . . . . . . . . . .USD . . . . . . . . . . . (554). . . . . . . . . 1.2282. . . . . . Citibank N.A. . . . . . . . . . . . . . . . . . . . . . . . . . . . . . . . . . . . . . . . . . . . . A-1 . . . . . . . . . . . . . . . . . . . . . . . . . (11)3-Oct-17 . . . . . . . . . . . . . . . . . . .CAD . . . . . . . . . . . . . 599. . . . . . . . . . . .USD . . . . . . . . . . . (493). . . . . . . . . 1.2141. . . . . . BNP Paribas . . . . . . . . . . . . . . . . . . . . . . . . . . . . . . . . . . . . . . . . . . . . . A-1 . . . . . . . . . . . . . . . . . . . . . . . . . (17)3-Oct-17 . . . . . . . . . . . . . . . . . . .CAD . . . . . . . . . . . 1,022. . . . . . . . . . . .USD . . . . . . . . . . . (838). . . . . . . . . 1.2197. . . . . . Bank of America N.A. . . . . . . . . . . . . . . . . . . . . . . . . . . . . . . . . . . A-1 . . . . . . . . . . . . . . . . . . . . . . . . . (24)3-Oct-17 . . . . . . . . . . . . . . . . . . .CAD . . . . . . . . . . . 1,230. . . . . . . . . . . .USD . . . . . . . . . (1,014). . . . . . . . . 1.2127. . . . . . BNP Paribas . . . . . . . . . . . . . . . . . . . . . . . . . . . . . . . . . . . . . . . . . . . . . A-1 . . . . . . . . . . . . . . . . . . . . . . . . . (36)3-Oct-17 . . . . . . . . . . . . . . . . . . .CAD . . . . . . . . . . . 1,452. . . . . . . . . . . .USD . . . . . . . . . (1,195). . . . . . . . . 1.2152. . . . . . Citibank N.A. . . . . . . . . . . . . . . . . . . . . . . . . . . . . . . . . . . . . . . . . . . . . A-1 . . . . . . . . . . . . . . . . . . . . . . . . . (39)3-Oct-17 . . . . . . . . . . . . . . . . . . .CAD . . . . . . . . . 85,565. . . . . . . . . . . .USD . . . . . . . (68,631). . . . . . . . . 1.2468. . . . . . HSBC Bank USA . . . . . . . . . . . . . . . . . . . . . . . . . . . . . . . . . . . . . . . . . A-1+ . . . . . . . . . . . . . . . . . . . . . . . (68)3-Oct-17 . . . . . . . . . . . . . . . . . . .USD . . . . . . . . . 70,677. . . . . . . . . . . .CAD . . . . . . . (88,205). . . . . . . . . 0.8013. . . . . . Bank of America N.A. . . . . . . . . . . . . . . . . . . . . . . . . . . . . . . . . . . A-1 . . . . . . . . . . . . . . . . . . . . . . . . . (18)31-Oct-17 . . . . . . . . . . . . . . . . . PEN . . . . . . . . . . . 1,688. . . . . . . . . . . .USD . . . . . . . . . . . (520). . . . . . . . . 3.2465. . . . . . Citibank N.A. . . . . . . . . . . . . . . . . . . . . . . . . . . . . . . . . . . . . . . . . . . . . A-1 . . . . . . . . . . . . . . . . . . . . . . . . . . . (3)2-Nov-17 . . . . . . . . . . . . . . . . . .CAD . . . . . . . . . . . 7,130. . . . . . . . . . . .USD . . . . . . . . . (5,732). . . . . . . . . 1.2438. . . . . . Citibank N.A. . . . . . . . . . . . . . . . . . . . . . . . . . . . . . . . . . . . . . . . . . . . . A-1 . . . . . . . . . . . . . . . . . . . . . . . . . (21)2-Nov-17 . . . . . . . . . . . . . . . . . .CAD . . . . . . . . . 86,211. . . . . . . . . . . .USD . . . . . . . (69,659). . . . . . . . . 1.2376. . . . . . National Australia Bank Limited . . . . . . . . . . . . . . . . . . . . . . . A-1+ . . . . . . . . . . . . . . . . . . . . . . (691)15-Nov-17 . . . . . . . . . . . . . . . . AUD . . . . . . . . . . . . . 485. . . . . . . . . . . .USD . . . . . . . . . . . (380). . . . . . . . . 1.2756. . . . . . Goldman Sachs Bank USA . . . . . . . . . . . . . . . . . . . . . . . . . . . . . . A-1 . . . . . . . . . . . . . . . . . . . . . . . . . . . (0)15-Nov-17 . . . . . . . . . . . . . . . . .CAD . . . . . . . . . . . . . 238. . . . . . . . . . . AUD . . . . . . . . . . . (244). . . . . . . . . 0.9741. . . . . . Royal Bank of Canada . . . . . . . . . . . . . . . . . . . . . . . . . . . . . . . . . . A-1+ . . . . . . . . . . . . . . . . . . . . . . . . . (1)15-Nov-17 . . . . . . . . . . . . . . . . .CAD . . . . . . . . . . . . . 134. . . . . . . . . . . GBP . . . . . . . . . . . . (83). . . . . . . . . 1.6201. . . . . . National Australia Bank Limited . . . . . . . . . . . . . . . . . . . . . . . A-1+ . . . . . . . . . . . . . . . . . . . . . . . . . (4)15-Nov-17 . . . . . . . . . . . . . . . . .CAD . . . . . . . . . . . . . 311. . . . . . . . . . . GBP . . . . . . . . . . . (189). . . . . . . . . 1.6449. . . . . . Australia and New Zealand Banking Group Ltd. . . . . . A-1+ . . . . . . . . . . . . . . . . . . . . . . . . . (6)15-Nov-17 . . . . . . . . . . . . . . . . .CAD . . . . . . . . . . . 2,844. . . . . . . . . . . GBP . . . . . . . . . (1,762). . . . . . . . . 1.6143. . . . . . Bank of America N.A. . . . . . . . . . . . . . . . . . . . . . . . . . . . . . . . . . . A-1 . . . . . . . . . . . . . . . . . . . . . . . . (105)15-Nov-17 . . . . . . . . . . . . . . . . .CAD . . . . . . . . . 38,901. . . . . . . . . . . GBP . . . . . . . (23,557). . . . . . . . . 1.6513. . . . . . Bank of America N.A. . . . . . . . . . . . . . . . . . . . . . . . . . . . . . . . . . . A-1 . . . . . . . . . . . . . . . . . . . . . . . . (532)4-Dec-17 . . . . . . . . . . . . . . . . . . INR . . . . . . . . . . . 3,281. . . . . . . . . . . .USD . . . . . . . . . . . . (50). . . . . . . . 65.6100. . . . . . Bank of America N.A. . . . . . . . . . . . . . . . . . . . . . . . . . . . . . . . . . . A-1 . . . . . . . . . . . . . . . . . . . . . . . . . . . (0)4-Dec-17 . . . . . . . . . . . . . . . . . . INR . . . . . . . . . 67,063. . . . . . . . . . . .USD . . . . . . . . . (1,039). . . . . . . . 64.5460. . . . . . Morgan Stanley and Co. LLC . . . . . . . . . . . . . . . . . . . . . . . . . . . A-1 . . . . . . . . . . . . . . . . . . . . . . . . . (26)15-Dec-17 . . . . . . . . . . . . . . . . MXN . . . . . . . . . . . . . 771. . . . . . . . . . . .USD . . . . . . . . . . . . (42). . . . . . . . 18.3640. . . . . . Goldman Sachs Bank USA . . . . . . . . . . . . . . . . . . . . . . . . . . . . . . A-1 . . . . . . . . . . . . . . . . . . . . . . . . . . . (0)15-Dec-17 . . . . . . . . . . . . . . . . MXN . . . . . . . . . 26,539. . . . . . . . . . . .USD . . . . . . . . . (1,472). . . . . . . . 18.0290. . . . . . Goldman Sachs Bank USA . . . . . . . . . . . . . . . . . . . . . . . . . . . . . . A-1 . . . . . . . . . . . . . . . . . . . . . . . . . (40)
Total Unrealized Loss on Forward Currency Contracts . . . . . . . . . . . . . . . . . . . . . . . . . . . . . . . . . . . . . . . . . . . . . . . . . . . . . . . . . . . . . . . . . . . . . . . . . . . . . . . . . . . . . . . . . . . . . . . . . . . . . . . . . . . . . . . . . . . . . . . . . . . . . . . . . . . . (1,674)
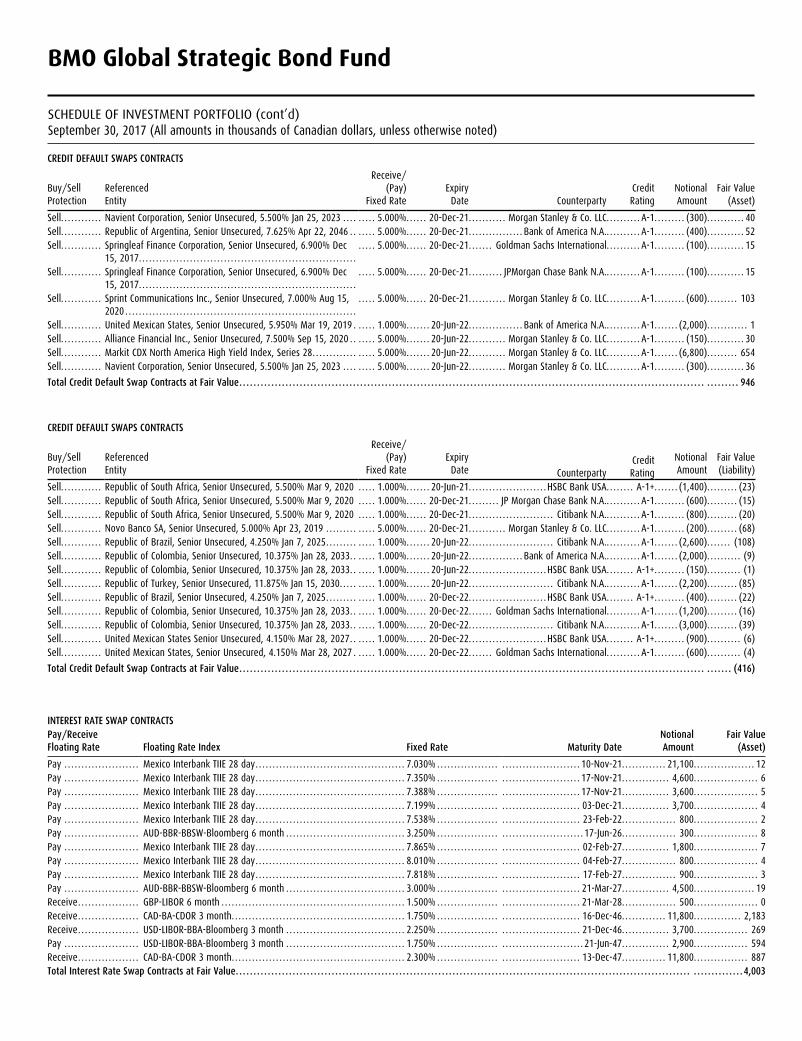
BMO Global Strategic Bond Fund
SCHEDULE OF INVESTMENT PORTFOLIO (cont’d)September 30, 2017 (All amounts in thousands of Canadian dollars, unless otherwise noted)
CREDIT DEFAULT SWAPS CONTRACTS
Buy/Sell Protection
Referenced Entity
Receive/(Pay)
Fixed RateExpiry Date Counterparty
Credit Rating
Notional Amount
Fair Value (Asset)
Sell. . . . . . . . . . . . Navient Corporation, Senior Unsecured, 5.500% Jan 25, 2023 . . . . . . . . . 5.000%. . . . . . 20-Dec-21. . . . . . . . . . . Morgan Stanley & Co. LLC. . . . . . . . . . A-1. . . . . . . . . (300). . . . . . . . . . . 40Sell. . . . . . . . . . . . Republic of Argentina, Senior Unsecured, 7.625% Apr 22, 2046 . . . . . . . 5.000%. . . . . . 20-Dec-21. . . . . . . . . . . . . . . . Bank of America N.A.. . . . . . . . . . A-1. . . . . . . . . (400). . . . . . . . . . . 52Sell. . . . . . . . . . . . Springleaf Finance Corporation, Senior Unsecured, 6.900% Dec
15, 2017 . . . . . . . . . . . . . . . . . . . . . . . . . . . . . . . . . . . . . . . . . . . . . . . . . . . . . . . . . . . . . . . .. . . . . 5.000%. . . . . . 20-Dec-21. . . . . . . Goldman Sachs International. . . . . . . . . . A-1. . . . . . . . . (100). . . . . . . . . . . 15
Sell. . . . . . . . . . . . Springleaf Finance Corporation, Senior Unsecured, 6.900% Dec 15, 2017 . . . . . . . . . . . . . . . . . . . . . . . . . . . . . . . . . . . . . . . . . . . . . . . . . . . . . . . . . . . . . . . .
. . . . . 5.000%. . . . . . 20-Dec-21. . . . . . . . . . JPMorgan Chase Bank N.A.. . . . . . . . . . A-1. . . . . . . . . (100). . . . . . . . . . . 15
Sell. . . . . . . . . . . . Sprint Communications Inc., Senior Unsecured, 7.000% Aug 15, 2020 . . . . . . . . . . . . . . . . . . . . . . . . . . . . . . . . . . . . . . . . . . . . . . . . . . . . . . . . . . . . . . . . . . . .
. . . . . 5.000%. . . . . . 20-Dec-21. . . . . . . . . . . Morgan Stanley & Co. LLC. . . . . . . . . . A-1. . . . . . . . . (600). . . . . . . . . 103
Sell. . . . . . . . . . . . United Mexican States, Senior Unsecured, 5.950% Mar 19, 2019 . . . . . . 1.000%. . . . . . . 20-Jun-22. . . . . . . . . . . . . . . . Bank of America N.A.. . . . . . . . . . A-1. . . . . . . (2,000). . . . . . . . . . . . 1Sell. . . . . . . . . . . . Alliance Financial Inc., Senior Unsecured, 7.500% Sep 15, 2020 . . . . . . . 5.000%. . . . . . . 20-Jun-22. . . . . . . . . . . Morgan Stanley & Co. LLC. . . . . . . . . . A-1. . . . . . . . . (150). . . . . . . . . . . 30Sell. . . . . . . . . . . . Markit CDX North America High Yield Index, Series 28 . . . . . . . . . . . . . . . . . . 5.000%. . . . . . . 20-Jun-22. . . . . . . . . . . Morgan Stanley & Co. LLC. . . . . . . . . . A-1. . . . . . . (6,800). . . . . . . . . 654Sell. . . . . . . . . . . . Navient Corporation, Senior Unsecured, 5.500% Jan 25, 2023 . . . . . . . . . 5.000%. . . . . . . 20-Jun-22. . . . . . . . . . . Morgan Stanley & Co. LLC. . . . . . . . . . A-1. . . . . . . . . (300). . . . . . . . . . . 36
Total Credit Default Swap Contracts at Fair Value . . . . . . . . . . . . . . . . . . . . . . . . . . . . . . . . . . . . . . . . . . . . . . . . . . . . . . . . . . . . . . . . . . . . . . . . . . . . . . . . . . . . . . . . . . . . . . . . . . . . . . . . . . . . . . . . . . . . . . . . . . . . . . . . . . . . . . . . . . . . 946
CREDIT DEFAULT SWAPS CONTRACTS
Buy/Sell Protection
Referenced Entity
Receive/(Pay)
Fixed RateExpiry Date Counterparty
Credit Rating
Notional Amount
Fair Value (Liability)
Sell. . . . . . . . . . . . Republic of South Africa, Senior Unsecured, 5.500% Mar 9, 2020 . . . . . 1.000%. . . . . . . 20-Jun-21. . . . . . . . . . . . . . . . . . . . . . .HSBC Bank USA. . . . . . . . A-1+. . . . . . . (1,400). . . . . . . . . (23)Sell. . . . . . . . . . . . Republic of South Africa, Senior Unsecured, 5.500% Mar 9, 2020 . . . . . 1.000%. . . . . . 20-Dec-21. . . . . . . . . JP Morgan Chase Bank N.A.. . . . . . . . . . A-1. . . . . . . . . (600). . . . . . . . . (15)Sell. . . . . . . . . . . . Republic of South Africa, Senior Unsecured, 5.500% Mar 9, 2020 . . . . . 1.000%. . . . . . 20-Dec-21. . . . . . . . . . . . . . . . . . . . . . . . . Citibank N.A.. . . . . . . . . . A-1. . . . . . . . . (800). . . . . . . . . (20)Sell. . . . . . . . . . . . Novo Banco SA, Senior Unsecured, 5.000% Apr 23, 2019 . . . . . . . . . . . . . . 5.000%. . . . . . 20-Dec-21. . . . . . . . . . . Morgan Stanley & Co. LLC. . . . . . . . . . A-1. . . . . . . . . (200). . . . . . . . . (68)Sell. . . . . . . . . . . . Republic of Brazil, Senior Unsecured, 4.250% Jan 7, 2025 . . . . . . . . . . . . . . 1.000%. . . . . . . 20-Jun-22. . . . . . . . . . . . . . . . . . . . . . . . . Citibank N.A.. . . . . . . . . . A-1. . . . . . . (2,600). . . . . . . (108)Sell. . . . . . . . . . . . Republic of Colombia, Senior Unsecured, 10.375% Jan 28, 2033 . . . . . . . 1.000%. . . . . . . 20-Jun-22. . . . . . . . . . . . . . . . Bank of America N.A.. . . . . . . . . . A-1. . . . . . . (2,000). . . . . . . . . . (9)Sell. . . . . . . . . . . . Republic of Colombia, Senior Unsecured, 10.375% Jan 28, 2033 . . . . . . . 1.000%. . . . . . . 20-Jun-22. . . . . . . . . . . . . . . . . . . . . . .HSBC Bank USA. . . . . . . . A-1+. . . . . . . . . (150). . . . . . . . . . (1)Sell. . . . . . . . . . . . Republic of Turkey, Senior Unsecured, 11.875% Jan 15, 2030 . . . . . . . . . . 1.000%. . . . . . . 20-Jun-22. . . . . . . . . . . . . . . . . . . . . . . . . Citibank N.A.. . . . . . . . . . A-1. . . . . . . (2,200). . . . . . . . . (85)Sell. . . . . . . . . . . . Republic of Brazil, Senior Unsecured, 4.250% Jan 7, 2025 . . . . . . . . . . . . . . 1.000%. . . . . . 20-Dec-22. . . . . . . . . . . . . . . . . . . . . . .HSBC Bank USA. . . . . . . . A-1+. . . . . . . . . (400). . . . . . . . . (22)Sell. . . . . . . . . . . . Republic of Colombia, Senior Unsecured, 10.375% Jan 28, 2033 . . . . . . . 1.000%. . . . . . 20-Dec-22. . . . . . . Goldman Sachs International. . . . . . . . . . A-1. . . . . . . (1,200). . . . . . . . . (16)Sell. . . . . . . . . . . . Republic of Colombia, Senior Unsecured, 10.375% Jan 28, 2033 . . . . . . . 1.000%. . . . . . 20-Dec-22. . . . . . . . . . . . . . . . . . . . . . . . . Citibank N.A.. . . . . . . . . . A-1. . . . . . . (3,000). . . . . . . . . (39)Sell. . . . . . . . . . . . United Mexican States Senior Unsecured, 4.150% Mar 28, 2027 . . . . . . . 1.000%. . . . . . 20-Dec-22. . . . . . . . . . . . . . . . . . . . . . .HSBC Bank USA. . . . . . . . A-1+. . . . . . . . . (900). . . . . . . . . . (6)Sell. . . . . . . . . . . . United Mexican States, Senior Unsecured, 4.150% Mar 28, 2027 . . . . . . 1.000%. . . . . . 20-Dec-22. . . . . . . Goldman Sachs International. . . . . . . . . . A-1. . . . . . . . . (600). . . . . . . . . . (4)
Total Credit Default Swap Contracts at Fair Value . . . . . . . . . . . . . . . . . . . . . . . . . . . . . . . . . . . . . . . . . . . . . . . . . . . . . . . . . . . . . . . . . . . . . . . . . . . . . . . . . . . . . . . . . . . . . . . . . . . . . . . . . . . . . . . . . . . . . . . . . . . . . . . . . . . . . . . . . . (416)
INTEREST RATE SWAP CONTRACTSPay/Receive Floating Rate Floating Rate Index Fixed Rate Maturity Date
Notional Amount
Fair Value (Asset)
Pay . . . . . . . . . . . . . . . . . . . . . . Mexico Interbank TIIE 28 day . . . . . . . . . . . . . . . . . . . . . . . . . . . . . . . . . . . . . . . . . . . . 7.030% . . . . . . . . . . . . . . . . . . . . . . . . . . . . . . . . . . . . . . . . . 10-Nov-21. . . . . . . . . . . . . 21,100. . . . . . . . . . . . . . . . . . 12Pay . . . . . . . . . . . . . . . . . . . . . . Mexico Interbank TIIE 28 day . . . . . . . . . . . . . . . . . . . . . . . . . . . . . . . . . . . . . . . . . . . . 7.350% . . . . . . . . . . . . . . . . . . . . . . . . . . . . . . . . . . . . . . . . . 17-Nov-21. . . . . . . . . . . . . . 4,600. . . . . . . . . . . . . . . . . . . 6Pay . . . . . . . . . . . . . . . . . . . . . . Mexico Interbank TIIE 28 day . . . . . . . . . . . . . . . . . . . . . . . . . . . . . . . . . . . . . . . . . . . . 7.388% . . . . . . . . . . . . . . . . . . . . . . . . . . . . . . . . . . . . . . . . . 17-Nov-21. . . . . . . . . . . . . . 3,600. . . . . . . . . . . . . . . . . . . 5Pay . . . . . . . . . . . . . . . . . . . . . . Mexico Interbank TIIE 28 day . . . . . . . . . . . . . . . . . . . . . . . . . . . . . . . . . . . . . . . . . . . . 7.199% . . . . . . . . . . . . . . . . . . . . . . . . . . . . . . . . . . . . . . . . . 03-Dec-21. . . . . . . . . . . . . . 3,700. . . . . . . . . . . . . . . . . . . 4Pay . . . . . . . . . . . . . . . . . . . . . . Mexico Interbank TIIE 28 day . . . . . . . . . . . . . . . . . . . . . . . . . . . . . . . . . . . . . . . . . . . . 7.538% . . . . . . . . . . . . . . . . . . . . . . . . . . . . . . . . . . . . . . . . . 23-Feb-22. . . . . . . . . . . . . . . . 800. . . . . . . . . . . . . . . . . . . 2Pay . . . . . . . . . . . . . . . . . . . . . . AUD-BBR-BBSW-Bloomberg 6 month . . . . . . . . . . . . . . . . . . . . . . . . . . . . . . . . . . . 3.250% . . . . . . . . . . . . . . . . . . . . . . . . . . . . . . . . . . . . . . . . . . 17-Jun-26. . . . . . . . . . . . . . . . 300. . . . . . . . . . . . . . . . . . . 8Pay . . . . . . . . . . . . . . . . . . . . . . Mexico Interbank TIIE 28 day . . . . . . . . . . . . . . . . . . . . . . . . . . . . . . . . . . . . . . . . . . . . 7.865% . . . . . . . . . . . . . . . . . . . . . . . . . . . . . . . . . . . . . . . . . 02-Feb-27. . . . . . . . . . . . . . 1,800. . . . . . . . . . . . . . . . . . . 7Pay . . . . . . . . . . . . . . . . . . . . . . Mexico Interbank TIIE 28 day . . . . . . . . . . . . . . . . . . . . . . . . . . . . . . . . . . . . . . . . . . . . 8.010% . . . . . . . . . . . . . . . . . . . . . . . . . . . . . . . . . . . . . . . . . 04-Feb-27. . . . . . . . . . . . . . . . 800. . . . . . . . . . . . . . . . . . . 4Pay . . . . . . . . . . . . . . . . . . . . . . Mexico Interbank TIIE 28 day . . . . . . . . . . . . . . . . . . . . . . . . . . . . . . . . . . . . . . . . . . . . 7.818% . . . . . . . . . . . . . . . . . . . . . . . . . . . . . . . . . . . . . . . . . 17-Feb-27. . . . . . . . . . . . . . . . 900. . . . . . . . . . . . . . . . . . . 3Pay . . . . . . . . . . . . . . . . . . . . . . AUD-BBR-BBSW-Bloomberg 6 month . . . . . . . . . . . . . . . . . . . . . . . . . . . . . . . . . . . 3.000% . . . . . . . . . . . . . . . . . . . . . . . . . . . . . . . . . . . . . . . . . 21-Mar-27. . . . . . . . . . . . . . 4,500. . . . . . . . . . . . . . . . . . 19Receive . . . . . . . . . . . . . . . . . . GBP-LIBOR 6 month . . . . . . . . . . . . . . . . . . . . . . . . . . . . . . . . . . . . . . . . . . . . . . . . . . . . . . 1.500% . . . . . . . . . . . . . . . . . . . . . . . . . . . . . . . . . . . . . . . . . 21-Mar-28. . . . . . . . . . . . . . . . 500. . . . . . . . . . . . . . . . . . . 0Receive . . . . . . . . . . . . . . . . . . CAD-BA-CDOR 3 month . . . . . . . . . . . . . . . . . . . . . . . . . . . . . . . . . . . . . . . . . . . . . . . . . . . 1.750% . . . . . . . . . . . . . . . . . . . . . . . . . . . . . . . . . . . . . . . . . 16-Dec-46. . . . . . . . . . . . . 11,800. . . . . . . . . . . . . . 2,183Receive . . . . . . . . . . . . . . . . . . USD-LIBOR-BBA-Bloomberg 3 month . . . . . . . . . . . . . . . . . . . . . . . . . . . . . . . . . . . 2.250% . . . . . . . . . . . . . . . . . . . . . . . . . . . . . . . . . . . . . . . . . 21-Dec-46. . . . . . . . . . . . . . 3,700. . . . . . . . . . . . . . . . 269Pay . . . . . . . . . . . . . . . . . . . . . . USD-LIBOR-BBA-Bloomberg 3 month . . . . . . . . . . . . . . . . . . . . . . . . . . . . . . . . . . . 1.750% . . . . . . . . . . . . . . . . . . . . . . . . . . . . . . . . . . . . . . . . . . 21-Jun-47. . . . . . . . . . . . . . 2,900. . . . . . . . . . . . . . . . 594Receive . . . . . . . . . . . . . . . . . . CAD-BA-CDOR 3 month . . . . . . . . . . . . . . . . . . . . . . . . . . . . . . . . . . . . . . . . . . . . . . . . . . . 2.300% . . . . . . . . . . . . . . . . . . . . . . . . . . . . . . . . . . . . . . . . . 13-Dec-47. . . . . . . . . . . . . 11,800. . . . . . . . . . . . . . . . 887Total Interest Rate Swap Contracts at Fair Value . . . . . . . . . . . . . . . . . . . . . . . . . . . . . . . . . . . . . . . . . . . . . . . . . . . . . . . . . . . . . . . . . . . . . . . . . . . . . . . . . . . . . . . . . . . . . . . . . . . . . . . . . . . . . . . . . . . . . . . . . . . . . . . . . . . . . . . . . . . . . .4,003
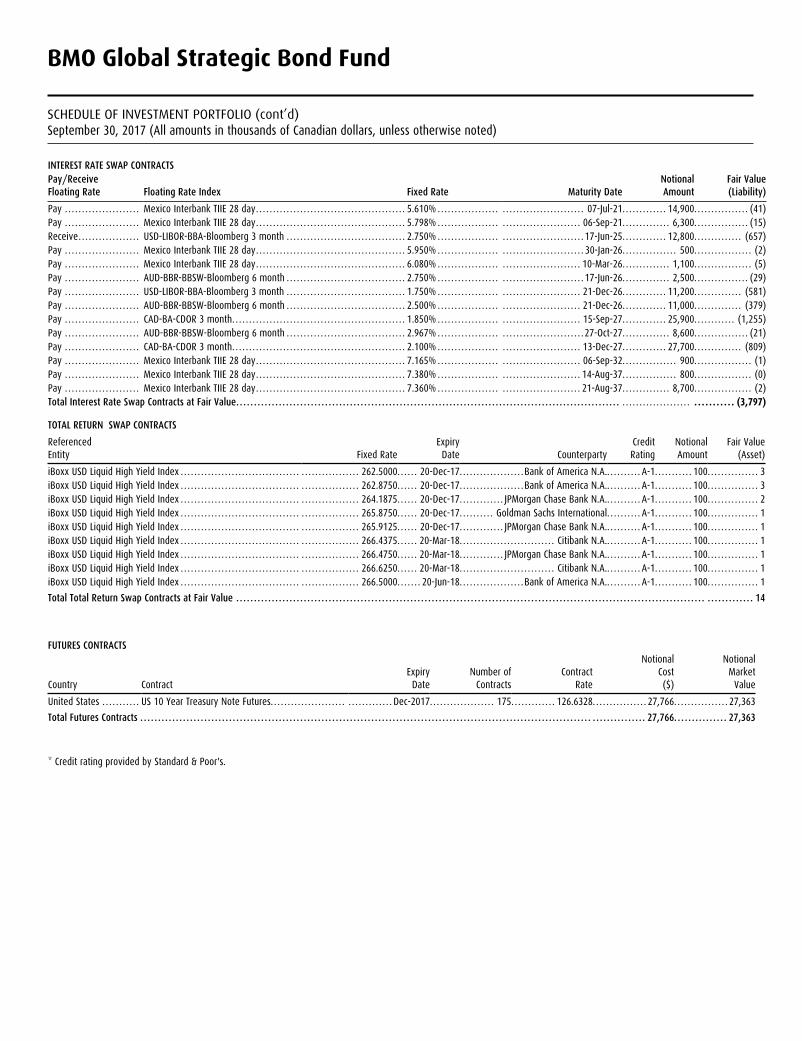
BMO Global Strategic Bond Fund
SCHEDULE OF INVESTMENT PORTFOLIO (cont’d)September 30, 2017 (All amounts in thousands of Canadian dollars, unless otherwise noted)
INTEREST RATE SWAP CONTRACTSPay/Receive Floating Rate Floating Rate Index Fixed Rate Maturity Date
Notional Amount
Fair Value (Liability)
Pay . . . . . . . . . . . . . . . . . . . . . . Mexico Interbank TIIE 28 day . . . . . . . . . . . . . . . . . . . . . . . . . . . . . . . . . . . . . . . . . . . . 5.610% . . . . . . . . . . . . . . . . . . . . . . . . . . . . . . . . . . . . . . . . . . 07-Jul-21. . . . . . . . . . . . . 14,900. . . . . . . . . . . . . . . . (41)Pay . . . . . . . . . . . . . . . . . . . . . . Mexico Interbank TIIE 28 day . . . . . . . . . . . . . . . . . . . . . . . . . . . . . . . . . . . . . . . . . . . . 5.798% . . . . . . . . . . . . . . . . . . . . . . . . . . . . . . . . . . . . . . . . . 06-Sep-21. . . . . . . . . . . . . . 6,300. . . . . . . . . . . . . . . . (15)Receive . . . . . . . . . . . . . . . . . . USD-LIBOR-BBA-Bloomberg 3 month . . . . . . . . . . . . . . . . . . . . . . . . . . . . . . . . . . . 2.750% . . . . . . . . . . . . . . . . . . . . . . . . . . . . . . . . . . . . . . . . . . 17-Jun-25. . . . . . . . . . . . . 12,800. . . . . . . . . . . . . . (657)Pay . . . . . . . . . . . . . . . . . . . . . . Mexico Interbank TIIE 28 day . . . . . . . . . . . . . . . . . . . . . . . . . . . . . . . . . . . . . . . . . . . . 5.950% . . . . . . . . . . . . . . . . . . . . . . . . . . . . . . . . . . . . . . . . . . 30-Jan-26. . . . . . . . . . . . . . . . 500. . . . . . . . . . . . . . . . . (2)Pay . . . . . . . . . . . . . . . . . . . . . . Mexico Interbank TIIE 28 day . . . . . . . . . . . . . . . . . . . . . . . . . . . . . . . . . . . . . . . . . . . . 6.080% . . . . . . . . . . . . . . . . . . . . . . . . . . . . . . . . . . . . . . . . . 10-Mar-26. . . . . . . . . . . . . . 1,100. . . . . . . . . . . . . . . . . (5)Pay . . . . . . . . . . . . . . . . . . . . . . AUD-BBR-BBSW-Bloomberg 6 month . . . . . . . . . . . . . . . . . . . . . . . . . . . . . . . . . . . 2.750% . . . . . . . . . . . . . . . . . . . . . . . . . . . . . . . . . . . . . . . . . . 17-Jun-26. . . . . . . . . . . . . . 2,500. . . . . . . . . . . . . . . . (29)Pay . . . . . . . . . . . . . . . . . . . . . . USD-LIBOR-BBA-Bloomberg 3 month . . . . . . . . . . . . . . . . . . . . . . . . . . . . . . . . . . . 1.750% . . . . . . . . . . . . . . . . . . . . . . . . . . . . . . . . . . . . . . . . . 21-Dec-26. . . . . . . . . . . . . 11,200. . . . . . . . . . . . . . (581)Pay . . . . . . . . . . . . . . . . . . . . . . AUD-BBR-BBSW-Bloomberg 6 month . . . . . . . . . . . . . . . . . . . . . . . . . . . . . . . . . . . 2.500% . . . . . . . . . . . . . . . . . . . . . . . . . . . . . . . . . . . . . . . . . 21-Dec-26. . . . . . . . . . . . . 11,000. . . . . . . . . . . . . . (379)Pay . . . . . . . . . . . . . . . . . . . . . . CAD-BA-CDOR 3 month . . . . . . . . . . . . . . . . . . . . . . . . . . . . . . . . . . . . . . . . . . . . . . . . . . . 1.850% . . . . . . . . . . . . . . . . . . . . . . . . . . . . . . . . . . . . . . . . . 15-Sep-27. . . . . . . . . . . . . 25,900. . . . . . . . . . . . (1,255)Pay . . . . . . . . . . . . . . . . . . . . . . AUD-BBR-BBSW-Bloomberg 6 month . . . . . . . . . . . . . . . . . . . . . . . . . . . . . . . . . . . 2.967% . . . . . . . . . . . . . . . . . . . . . . . . . . . . . . . . . . . . . . . . . .27-Oct-27. . . . . . . . . . . . . . 8,600. . . . . . . . . . . . . . . . (21)Pay . . . . . . . . . . . . . . . . . . . . . . CAD-BA-CDOR 3 month . . . . . . . . . . . . . . . . . . . . . . . . . . . . . . . . . . . . . . . . . . . . . . . . . . . 2.100% . . . . . . . . . . . . . . . . . . . . . . . . . . . . . . . . . . . . . . . . . 13-Dec-27. . . . . . . . . . . . . 27,700. . . . . . . . . . . . . . (809)Pay . . . . . . . . . . . . . . . . . . . . . . Mexico Interbank TIIE 28 day . . . . . . . . . . . . . . . . . . . . . . . . . . . . . . . . . . . . . . . . . . . . 7.165% . . . . . . . . . . . . . . . . . . . . . . . . . . . . . . . . . . . . . . . . . 06-Sep-32. . . . . . . . . . . . . . . . 900. . . . . . . . . . . . . . . . . (1)Pay . . . . . . . . . . . . . . . . . . . . . . Mexico Interbank TIIE 28 day . . . . . . . . . . . . . . . . . . . . . . . . . . . . . . . . . . . . . . . . . . . . 7.380% . . . . . . . . . . . . . . . . . . . . . . . . . . . . . . . . . . . . . . . . . 14-Aug-37. . . . . . . . . . . . . . . . 800. . . . . . . . . . . . . . . . . (0)Pay . . . . . . . . . . . . . . . . . . . . . . Mexico Interbank TIIE 28 day . . . . . . . . . . . . . . . . . . . . . . . . . . . . . . . . . . . . . . . . . . . . 7.360% . . . . . . . . . . . . . . . . . . . . . . . . . . . . . . . . . . . . . . . . . 21-Aug-37. . . . . . . . . . . . . . 8,700. . . . . . . . . . . . . . . . . (2)Total Interest Rate Swap Contracts at Fair Value . . . . . . . . . . . . . . . . . . . . . . . . . . . . . . . . . . . . . . . . . . . . . . . . . . . . . . . . . . . . . . . . . . . . . . . . . . . . . . . . . . . . . . . . . . . . . . . . . . . . . . . . . . . . . . . . . . . . . . . . . . . . . . . . (3,797)
TOTAL RETURN SWAP CONTRACTS
Referenced Entity Fixed Rate
Expiry Date Counterparty
Credit Rating
Notional Amount
Fair Value (Asset)
iBoxx USD Liquid High Yield Index . . . . . . . . . . . . . . . . . . . . . . . . . . . . . . . . . . . . . . . . . . . . . . . . . . . . 262.5000. . . . . . 20-Dec-17. . . . . . . . . . . . . . . . . . .Bank of America N.A.. . . . . . . . . . A-1. . . . . . . . . . . 100. . . . . . . . . . . . . . . 3iBoxx USD Liquid High Yield Index . . . . . . . . . . . . . . . . . . . . . . . . . . . . . . . . . . . . . . . . . . . . . . . . . . . . 262.8750. . . . . . 20-Dec-17. . . . . . . . . . . . . . . . . . .Bank of America N.A.. . . . . . . . . . A-1. . . . . . . . . . . 100. . . . . . . . . . . . . . . 3iBoxx USD Liquid High Yield Index . . . . . . . . . . . . . . . . . . . . . . . . . . . . . . . . . . . . . . . . . . . . . . . . . . . . 264.1875. . . . . . 20-Dec-17. . . . . . . . . . . . . JPMorgan Chase Bank N.A.. . . . . . . . . . A-1. . . . . . . . . . . 100. . . . . . . . . . . . . . . 2iBoxx USD Liquid High Yield Index . . . . . . . . . . . . . . . . . . . . . . . . . . . . . . . . . . . . . . . . . . . . . . . . . . . . 265.8750. . . . . . 20-Dec-17. . . . . . . . . . Goldman Sachs International. . . . . . . . . . A-1. . . . . . . . . . . 100. . . . . . . . . . . . . . . 1iBoxx USD Liquid High Yield Index . . . . . . . . . . . . . . . . . . . . . . . . . . . . . . . . . . . . . . . . . . . . . . . . . . . . 265.9125. . . . . . 20-Dec-17. . . . . . . . . . . . . JPMorgan Chase Bank N.A.. . . . . . . . . . A-1. . . . . . . . . . . 100. . . . . . . . . . . . . . . 1iBoxx USD Liquid High Yield Index . . . . . . . . . . . . . . . . . . . . . . . . . . . . . . . . . . . . . . . . . . . . . . . . . . . . 266.4375. . . . . . 20-Mar-18. . . . . . . . . . . . . . . . . . . . . . . . . . . . Citibank N.A.. . . . . . . . . . A-1. . . . . . . . . . . 100. . . . . . . . . . . . . . . 1iBoxx USD Liquid High Yield Index . . . . . . . . . . . . . . . . . . . . . . . . . . . . . . . . . . . . . . . . . . . . . . . . . . . . 266.4750. . . . . . 20-Mar-18. . . . . . . . . . . . . JPMorgan Chase Bank N.A.. . . . . . . . . . A-1. . . . . . . . . . . 100. . . . . . . . . . . . . . . 1iBoxx USD Liquid High Yield Index . . . . . . . . . . . . . . . . . . . . . . . . . . . . . . . . . . . . . . . . . . . . . . . . . . . . 266.6250. . . . . . 20-Mar-18. . . . . . . . . . . . . . . . . . . . . . . . . . . . Citibank N.A.. . . . . . . . . . A-1. . . . . . . . . . . 100. . . . . . . . . . . . . . . 1iBoxx USD Liquid High Yield Index . . . . . . . . . . . . . . . . . . . . . . . . . . . . . . . . . . . . . . . . . . . . . . . . . . . . 266.5000. . . . . . . 20-Jun-18. . . . . . . . . . . . . . . . . . .Bank of America N.A.. . . . . . . . . . A-1. . . . . . . . . . . 100. . . . . . . . . . . . . . . 1
Total Total Return Swap Contracts at Fair Value . . . . . . . . . . . . . . . . . . . . . . . . . . . . . . . . . . . . . . . . . . . . . . . . . . . . . . . . . . . . . . . . . . . . . . . . . . . . . . . . . . . . . . . . . . . . . . . . . . . . . . . . . . . . . . . . . . . . . . . . . . . . . . . . . . . . . . . . . . . . . . . . . 14
FUTURES CONTRACTS
Country ContractExpiry Date
Number of Contracts
Contract Rate
Notional Cost ($)
Notional Market Value
United States . . . . . . . . . . . US 10 Year Treasury Note Futures. . . . . . . . . . . . . . . . . . . . . . . . . . . . . . . . . . . Dec-2017. . . . . . . . . . . . . . . . . . . 175. . . . . . . . . . . . . 126.6328. . . . . . . . . . . . . . . . 27,766. . . . . . . . . . . . . . . . 27,363
Total Futures Contracts . . . . . . . . . . . . . . . . . . . . . . . . . . . . . . . . . . . . . . . . . . . . . . . . . . . . . . . . . . . . . . . . . . . . . . . . . . . . . . . . . . . . . . . . . . . . . . . . . . . . . . . . . . . . . . . . . . . . . . . . . . . . . . . . . . . . . . . . . . . . . . 27,766. . . . . . . . . . . . . . . 27,363
* Credit rating provided by Standard & Poor's.

BMO Global Strategic Bond Fund
NOTES TO THE FINANCIAL STATEMENTS (All amounts in thousands of Canadian dollars, except per unit data)September 30, 2017
1. The Mutual FundBMO Global Strategic Bond Fund (the “Fund”) is an open-ended mutual fund established under the laws of the province of Ontario by Declaration of Trust. The Master Declaration of Trust was amended on October 23, 2008 and November 3, 2009 to permit certain funds to offer a multi-series structure. In addition to the existing Series A units, certain Funds are permitted to offer Series A Hedged, Advisor Series, Advisor Series Hedged, Series T4, Series T5, Series T6, Series M, Series F, Series F Hedged, Series F2, Series F4, Series F6, Premium Series, Series D, Series H, Series I, Series N, Series NBA, Series NBF, Series O, Series L, Series R, Series S and/or Classic Series units. Each series is intended for different kinds of investors and has different management fees and fixed administration fees. Refer to Note 8 for the series issued for this Fund as well as the management and administration fee rates for each series.
BMO Investments Inc. (“the Manager”) is the Manager and Trustee of the Fund. The Manager is a wholly owned subsidiary of Bank of Montreal. The address of the Fund’s registered office is 100 King Street West, Toronto, Ontario, M5X 1A1.
The Statement of Financial Position of each of the Funds are as at September 30, 2017 and September 30, 2016. The Statement of Comprehensive Income, Statement of Changes Attributable to Holders of Redeemable Units, Statement of Cash Flows and related notes are for the periods ended September 30, 2017 and September 30, 2016. Financial information for a Fund established during the period(s) is presented from the date of inception as noted in Note 8. Financial information provided for a series established during the period(s) is presented from the inception date as noted in Note 8.
Certain comparative figures in the Statement of Cash Flows have been revised to appropriately reflect the exclusion of non-cash items from “Proceeds from issuances of redeemable units” and “Amounts paid on redemption of redeemable units” arising from switches between series within a Fund. There is no net impact on cash flows from financing activities within each Fund. The amounts revised are disclosed in Note 8, where applicable.
These financial statements were authorized for issuance by the Board of Directors of the Manager on December 5, 2017.
2. Basis of preparation and presentationThese audited financial statements have been prepared in accordance with International Financial Reporting Standards (“IFRS”) as issued by the International Accounting Standards Board (“IASB”).
Certain prior period balances have been reclassified to conform with the current period presentation.
3. Summary of significant accounting policiesFinancial instrumentsThe Fund records financial instruments at fair value. Investment transactions are accounted for on the trade date. The Fund’s investments are either designated at fair value through profit or loss (“FVTPL”) at inception or classified as held for trading. The changes in the investment fair values and related transaction costs are recorded in the Fund’s Statement of Comprehensive Income.
Financial assets and financial liabilities held for trading are those acquired or incurred principally for the purpose of selling or repurchasing in the near future, or on initial recognition, are part of a portfolio of identified financial instruments that the Fund manages together and that have a recent actual pattern of short-term profit taking. The Fund classifies all derivatives and short positions as held for trading. The Fund does not designate any derivatives as hedges in a hedging relationship.
The Fund designates all other investments at FVTPL, as they have reliably measurable fair values and are part of a group of financial assets or financial liabilities that are managed and have their performance evaluated on a fair value basis in accordance with the Fund’s investment strategy.
The Fund’s outstanding redeemable units, which are puttable instruments, are entitled to a contractual obligation of annual distribution of any net income and net realized capital gains by the Fund. This annual distribution can be in cash at the option of the unitholders, and therefore the ongoing redemption feature is not the redeemable units’ only contractual obligation. The Fund may issue multiple series of redeemable units, which are equally subordinated but are not identical. As a result, the Fund’s obligations for net assets attributable to holders of redeemable units are classified as financial liabilities and presented at the redemption amounts.

BMO Global Strategic Bond Fund
NOTES TO THE FINANCIAL STATEMENTS (cont’d)(All amounts in thousands of Canadian dollars, except per unit data)September 30, 2017
All other financial assets and financial liabilities are measured at amortized cost. Under this method, financial assets and financial liabilities reflect the amount required to be received, paid or discounted, when appropriate, at the contract’s effective interest rate.
The Manager has determined that the Fund meets the definition of “investment entity” and as a result, the Fund measures subsidiaries, if any, at FVTPL.
Cost of investmentsThe cost of investments represents the amount paid for each security and is determined on an average cost basis.
Fair value measurementInvestments are recorded at their fair value with the change between this amount and their average cost being recorded as “Change in unrealized appreciation (depreciation)” in the Statement of Comprehensive Income.
For exchange-traded securities, close prices are considered to be fair value if they fall within the bid-ask spread. In circumstances where the close price is not within the bid-ask spread, the Manager determines the point within the bid-ask spread that is most representative of fair value based on the specific facts and circumstances.
Procedures are in place to fair value securities traded in countries outside of North America daily, to avoid stale prices and to take into account, among other things, any significant events occurring after the close of a foreign market.
For bonds, debentures, asset-backed securities and other debt securities, fair value is represented by bid prices provided by independent security pricing services. Short-term investments, if any, are held at amortized cost which approximates fair value.
Unlisted warrants, if any, are valued based on a pricing model which considers factors such as the market value of the underlying security, strike price and terms of the warrant.
Mutual fund units held as investments are valued at their respective Net Asset Value (“NAV”) on each Valuation Date (the “Valuation Date” is each day on which the Toronto Stock Exchange is open for trading), as these values are the most readily and regularly available.
For securities where market quotes are not available, unreliable or not considered to reflect the current value, the Manager may determine another value which it considers to be fair and reasonable, or use a valuation technique that, to the extent possible, makes maximum use of inputs and assumptions based on observable market data including volatility, comparable companies, NAV (for exchange-traded funds) and other applicable rates or prices. These estimation techniques include discounted cash flows, internal models that utilize observable data or comparisons with other securities that are substantially similar. In limited circumstances, the Manager may use internal models where the inputs are not based on observable market data.
Derivative instrumentsDerivative instruments are financial contracts that derive their value from changes in the underlying interest rates, foreign exchange rates or other financial or commodity prices or indices.
Derivative instruments are either regulated exchange-traded contracts or negotiated over-the-counter contracts. The Fund may use these instruments for trading purposes, as well as to manage the Fund’s risk exposures.
Derivatives are measured at fair value. Realized gains and losses are included in “Net realized gain(loss)” in the Statement of Comprehensive Income and unrealized gains and losses are included in “Change in unrealized appreciation (depreciation)” in the Statement of Comprehensive Income.
Forward currency contractsA forward currency contract is an agreement between two parties (the Fund and the counterparty) to purchase or sell a currency against another currency at a set price on a future date. The Fund may enter into forward currency contracts for hedging purposes, which can include the economic hedging of all or a portion of the currency exposure of an investment or group of investments, either directly or indirectly. The Fund may also enter into these contracts for non-hedging purposes, which can include increasing the exposure to a foreign currency, or shifting the exposure to foreign currency fluctuations from one country to another. The value of forward currency contracts entered into by the Fund is recorded as the difference between the value of the contract on the Valuation Date and the value on the date the contract originated.
BMO Global Strategic Bond Fund
NOTES TO THE FINANCIAL STATEMENTS (cont’d)(All amounts in thousands of Canadian dollars, except per unit data)September 30, 2017
Option contractsThe Fund may engage in option contract transactions by purchasing (long positions) or writing (short positions) call or put option contracts. These contracts have different risk exposures for the Fund, whereas the risk for long positions will be limited to the premium paid to purchase the option contracts, the risk exposure for the short positions are potentially unlimited until closed or expired.
Purchased option contractsThe premium paid for purchasing an option is recorded as an asset in the Statement of Financial Position. The option contract is valued on each Valuation Date at an amount equal to the fair value of the option that would have the effect of closing the position. The change in the difference between the premium and the fair value is shown as “Change in unrealized appreciation (depreciation)” in the Statement of Comprehensive Income.
When a purchased option expires, the Fund will realize a loss equal to the premium paid. When a purchased option is closed, the gain or loss the Fund will realize will be the difference between the proceeds and the premium paid. When a purchased call option is exercised, the premium paid is added to the cost of acquiring the underlying security. When a purchased put option is exercised, the premium paid is subtracted from the proceeds from the sale of the underlying security that had to be sold.
Written option contractsThe premium received from writing a call or put option is recorded as a liability in the Statement of Financial Position.
When a written option expires, the Fund will realize a gain equal to the premium received. When a written option is closed, the Fund will realize a gain or loss equal to the difference between the cost at which the contract was closed and the premium received. When a written call option is exercised, the premium received is added to the proceeds from the sale of the underlying investments to determine the realized gain or loss. When a written put option is exercised, the premium received will be subtracted from the cost of the underlying investment the Fund had to purchase.
The gain or loss that the Fund realizes when a purchased or written option is expired or closed is
recorded as “Net realized gain (loss)” in the Statement of Comprehensive Income.
Futures contractsFutures contracts are financial agreements to purchase or sell a financial instrument at a contracted price on a specified future date. Futures contracts are valued at the gain or loss that would arise as a result of closing the position at the Valuation date. Any difference between the notional value on each Valuation Date is recorded as “Net realized gain (loss)” in the Statement of Comprehensive Income. Treasury bills or cash are held as margin against futures contracts.
Credit default swap contractsA credit default swap contract is an agreement to transfer credit risk from one party, a buyer of protection, to another party, a seller of protection. The Fund, as a seller of protection, would be required to pay a notional or other agreed upon value to the buyer of protection in the event of a default by a third-party. In return, the Fund would receive from the counterparty a periodic stream of payments over the term of the contract provided that no event of default occurs. If no default occurs, the Fund would keep the stream of payments and would have no payment obligations.
In connection with the agreement, securities or cash may be identified as collateral or margin in accordance with the terms of the agreement to provide assets of value in the event of default or bankruptcy/insolvency.
The Fund, as a buyer of protection, would receive a notional or other agreed upon value from the seller of protection in the event of a default by a third-party. In return, the Fund would be required to pay to the counterparty a periodic stream of payments over the term of the contract provided that no event of default occurs.
Credit default swap contracts are fair valued daily based upon quotations from independent security pricing sources. Premiums paid or received, if any, are included in “Net realized gain (loss)” in the Statement of Comprehensive Income. Net periodic payments are accrued daily and recorded as “Interest income” in the Statement of Comprehensive Income. When credit default swap contracts expire or are closed out, gains or losses are recorded as “Net realized gain (loss)” in the Statement of Comprehensive Income.
BMO Global Strategic Bond Fund
NOTES TO THE FINANCIAL STATEMENTS (cont’d)(All amounts in thousands of Canadian dollars, except per unit data)September 30, 2017
Interest rate swap contractsInterest rate swap contracts are agreements between two parties to exchange periodic interest payments based on a notional principal amount. The net periodic payments received or paid from interest rate swap contracts are recorded as “Interest income” in the Statement of Comprehensive Income. Payments received or paid when the Fund enters into the contract are recorded as a liability or asset in the Statement of Financial Position. When the contract is terminated or expires, the payments received or paid are recorded as “Net realized gain (loss)” in the Statement of Comprehensive Income. Payments received or paid upon early termination are recorded as “Net realized gain (loss)” in the Statement of Comprehensive Income.
Interest rate swap agreements are valued based upon quotations from independent sources. The change in value is shown as “Change in unrealized appreciation (depreciation)” in the Statement of Comprehensive Income.
The Fund enters into interest rate swap agreements to manage the exposure to interest rates.
Income recognitionDividend income and distribution from investment trusts are recognized on the ex-dividend and ex-distribution date, respectively.
Interest income from interest bearing investments is recognized in the Statement of Comprehensive Income using the effective interest rate. Interest receivable shown in the Statement of Financial Position is accrued based on the interest bearing investments’ stated rates of interest.
Interest on inflation-indexed bonds is paid based on a principal value, which is adjusted for inflation. The inflation adjustment of the principal value is recognized as part of interest income in the Statement of Comprehensive Income. If held to maturity, the Fund will receive, in addition to a coupon interest payment, a final payment equal to the sum of the par value and the inflation compensation accrued from the original issue date. Interest is accrued on each Valuation Date based on the inflation adjusted par
value at that time and is included in “Interest income” in the Statement of Comprehensive Income.
Foreign currency translationThe fair value of investments and other assets and liabilities in foreign currencies are translated into the Fund’s functional currency at the rates of exchange prevailing at the period-end date. Purchases and sales of investments, and income and expenses are translated at the rates of exchange prevailing on the respective dates of such transactions. Foreign exchange gains (losses) on completed transactions are included in “Net realized gain (loss)” in the Statement of Comprehensive Income and unrealized foreign exchange gains (losses) are included in “Change in unrealized appreciation (depreciation)” in the Statement of Comprehensive Income. Foreign exchange gains (losses) relating to cash, receivables and payables are included in "Foreign exchange gain (loss)" in the Statement of Comprehensive Income.
Securities lendingA Fund may engage in securities lending pursuant to the terms of an agreement with BNY Mellon (the “security lending agent”). The aggregate market value of all securities loaned by the Fund cannot exceed 50% of the NAV of the Fund. The Fund will receive collateral of at least 102% of the value of securities on loan. Collateral will generally be comprised of obligations of or guarantee by the Government of Canada or a province thereof, or by the United States government or its agencies, but it may include obligations of other governments with appropriate credit ratings. Further, the program entered into provides for 100% indemnification by the securities lending agent and parties related to the Fund’s custodian, to the Fund for any defaults by borrowers.
For those Funds participating in the program, aggregate values of securities on loan, the collateral held as at September 30, 2017 and September 30, 2016, and information about the security lending income earned by the Fund are disclosed in Note 8.
Income from securities lending, where applicable, is included in the Statement of Comprehensive Income and is recognized when earned. The breakdown of the securities lending income is disclosed in Note 8, where applicable.
BMO Global Strategic Bond Fund
NOTES TO THE FINANCIAL STATEMENTS (cont’d)(All amounts in thousands of Canadian dollars, except per unit data)September 30, 2017
Short-term trading penaltyTo discourage excessive trading, the Fund may, at the Manager’s sole discretion, charge a short-term trading penalty. This penalty is paid directly to the Fund and is included in “Short-term penalty fees” in the Statement of Comprehensive Income.
CashCash is comprised of cash and deposits with banks which include bankers’ acceptances and overnight demand deposits. Cash is recorded at fair value. The carrying amount of cash approximates its fair value because it is short-term in nature.
Other assets and other liabilitiesReceivable for investments sold, dividends receivable, distribution receivable from investment trusts, and subscriptions receivable are initially recorded at fair value and subsequently measured at amortized cost. Similarly, payable for investments purchased, redemptions payable, distributions payable and accrued expenses are measured at amortized cost. Other assets and liabilities are short-term in nature, and are carried at cost or amortized cost.
Increase or decrease in net assets attributable to holders of redeemable units“Increase (decrease) in net assets attributable to holders of redeemable units per unit” of a series in the Statement of Comprehensive Income represents the increase (decrease) in net assets attributable to holders of redeemable units (“Net Assets”) of the series divided by the weighted average number of units of the series outstanding during the period.
TaxationThe Fund qualifies as a unit trust under the provisions of the Income Tax Act (Canada). Distributions of all net taxable income and sufficient amounts of net realized capital gains for each taxation year will be paid to unitholders so that the Fund will not be subject to income tax. As a result, the Fund has determined that it is in substance not taxable and therefore does not record income taxes in the Statement of Comprehensive Income nor does it recognize any deferred tax assets or liabilities in the Statement of Financial Position.
The Fund may incur withholding taxes imposed by certain countries on investment income and capital gains. Such income and capital gains are recorded on a gross basis with the related withholding taxes shown as
a separate expense in the Statement of Comprehensive Income.
Investments in subsidiaries, joint ventures and associatesSubsidiaries are entities over which the Fund has control through its exposure or rights to variable returns from its investment and has the ability to affect those returns through its power over the entity. The Manager has determined that the Fund is an investment entity and as such, it accounts for subsidiaries, if any, at fair value. Joint ventures are those where the Fund exercises joint control through an agreement with other shareholders, and associates are investments in which the Fund exerts significant influence over operating, investing, and financing decisions (such as entities in which the Fund owns 20% - 50% of voting shares), all of which, if any, have been designated at FVTPL.
Unconsolidated structured entitiesDuring the periods, the Fund had no sponsored unconsolidated structured entities. The Manager has determined that the underlying funds in which the Fund may invest in are unconsolidated structured entities. This determination is based on the fact that decision making about the underlying funds is not governed by the voting right or other similar right held by the Fund. Similarly, investments in securitizations, asset-backed securities and mortgage-backed securities are determined to be interests in unconsolidated structured entities.
The Fund may invest in underlying funds whose investment objectives range from achieving short-term to long-term income and capital growth potential. Underlying funds may use leverage in a manner consistent with their respective investment objectives and as permitted by Canadian securities regulatory authorities. Underlying funds finance their operations by issuing redeemable units which are puttable at the holders’ option and entitles the holder to a proportionate stake in the respective fund’s Net Assets. The change in fair value of each of the underlying funds during the periods is included in “Change in unrealized appreciation (depreciation)” in the Statement of Comprehensive Income.
Mortgage-related securities are created from pools of residential or commercial mortgage loans, including mortgage loans made by savings and loan institutions, mortgage bankers, commercial banks and others. Asset-backed securities are created from many types
BMO Global Strategic Bond Fund
NOTES TO THE FINANCIAL STATEMENTS (cont’d)(All amounts in thousands of Canadian dollars, except per unit data)September 30, 2017
of assets, including auto loans, credit card receivables, home equity loans and student loans.
The Fund does not provide and has not committed to providing any additional significant financial or other support to the unconsolidated structured entities other than its investment in the unconsolidated structured entities.
Additional information on the Fund’s interest in unconsolidated structured entities, where applicable, is provided in Note 8.
Offsetting of financial assets and financial liabilitiesFinancial instruments are presented at net or gross amounts in the Statement of Financial Position depending on the existence of intention and legal right to offset opposite positions of such instruments held with the same counterparties. Amounts offset in the Statement of Financial Position are transactions for which the Fund has legally enforceable rights to offset and intends to settle the positions on a net basis. Amounts not offset in the Statement of Financial Position relate to transactions where a master netting arrangement or similar agreement is in place with a right to offset only in the event of default, insolvency or bankruptcy, or where the Fund has no intention of settling on a net basis.
Accounting standards issued but not yet adoptedIn July 2014, the IASB issued the final version of IFRS 9 Financial Instruments, which addresses classification and measurement, impairment and hedge accounting.
The new standard requires assets to be carried at amortized cost, FVTPL or fair value through other comprehensive income based on the entity’s business model for managing financial assets and the contractual cash flow characteristics of the financial asset. The classification and measurement of liabilities remains generally unchanged with the exception of liabilities recorded at FVTPL. For these liabilities, fair value changes attributable to changes in the entity’s own credit risk are to be presented in other comprehensive income unless they affect amounts recorded in income.
The new standard is effective for the Fund for its fiscal year beginning October 1, 2018. The Manager is in the process of assessing the impact of adopting this standard but does not expect that the adoption of this standard to have a significant impact to the Fund’s financial statements.
Fund mergersThe Manager has adopted the purchase method of accounting for certain fund mergers which occurred during the periods. Under this method, one of the Funds in each merger is identified as the acquiring fund, and is referred to as the “Continuing Fund”, and the other fund involved in the merger is referred to as the “Terminated Fund”. This identification is based on the comparison of the relative net asset values of the funds as well as consideration of the continuation of such aspects of the Continuing Fund as: investment advisors, investment objectives and practices, type of portfolio securities, and management fees and expenses. Where applicable, refer to Note 8 for the details of the merger transactions.
4. Critical accounting judgements and estimatesThe preparation of financial statements requires the use of judgement in applying the Fund’s accounting policies and to make estimates and assumptions about the future. The following discusses the most significant accounting judgements and estimates that the Manager has made in preparing the Fund’s financial statements:
Accounting judgements:Functional and presentation currencyThe Fund’s unitholders are mainly Canadian residents, with the subscriptions and redemptions of the redeemable units denominated in Canadian dollars. The Fund invests in Canadian and U.S. dollars and other foreign denominated securities, as applicable. The performance of the Fund is measured and reported to the investors in Canadian dollars. The Manager considers the Canadian dollar as the currency that most faithfully represents the economic effects of the underlying transactions, events and conditions. The financial statements are presented in Canadian dollars, which is the Fund's functional and presentation currency.
Classification and measurement of financial instruments and application of fair value optionIn classifying and measuring financial instruments held by the Fund, the Manager is required to make significant judgements about whether or not the business of the Fund is to invest on a total return basis for the purpose of applying the fair value options for financial assets.
BMO Global Strategic Bond Fund
NOTES TO THE FINANCIAL STATEMENTS (cont’d)(All amounts in thousands of Canadian dollars, except per unit data)September 30, 2017
Accounting estimates:Fair value measurement of securities not quoted in an active marketThe Fund has established policies and control procedures that are intended to ensure these estimates are well controlled, independently reviewed, and consistently applied from period to period. The estimates of the value of the Fund’s assets and liabilities are believed to be appropriate as at the reporting date.
The Fund may hold financial instruments that are not quoted in active markets. Note 3 discusses the policies used by the Fund for the estimates used in determining fair value.
5. Units and unit transactionsThe redeemable units of the Fund are classified as liabilities.
The units have no par value and are entitled to distributions, if any. Upon redemption, a unit is entitled to a proportionate share of the Fund’s NAV. The Fund is required to pay distributions in an amount not less than the amount necessary to ensure the Fund will not be liable for income taxes on realized capital gains, dividends and interest. The Fund has no restrictions or specific capital requirements on the subscriptions and redemptions of units except as disclosed in Note 8. The relevant movements in redeemable units are shown in the Statement of Changes in Net Assets Attributable to Holders of Redeemable Units.
In accordance with its investment objectives and strategies, and the risk management practices outlined in Note 7, the Fund endeavours to invest the subscriptions received in appropriate investments, while maintaining sufficient liquidity to meet redemptions, with such liquidity being augmented by short-term borrowings or disposal of investments where necessary.
Redeemable units of the Fund are offered for sale on a continuous basis and may be purchased or redeemed on any Valuation Date at the NAV per unit of a particular series. The NAV per unit of a series for the purposes of subscription or redemption is computed by dividing the NAV of the Fund attributable to the series (that is, the total fair value of the assets attributable to the series less the liabilities attributable to the series) by the total number of units of the series of the Fund outstanding at such time on each Valuation Date, in
accordance with Part 14 of National Instrument (“NI”) 81-106 Investment Fund Continuous Disclosure for the purpose of processing unitholder transactions. Net Assets are determined in accordance with IFRS and may differ to the Funds’ NAV. Where a Funds’ NAV is not equal to its Net Assets, a reconciliation is shown in Note 8.
Expenses directly attributable to a series are charged to that series. Other expenses, income, realized and unrealized gains and losses from investment transactions are allocated proportionately to each series based upon the relative NAV of each series. The gain (loss) of certain forwards in Funds with Hedged Series is allocated only to the hedged series.
6. Related party transactions(a) Management feesThe Manager is responsible for the day-to-day management of the Fund and its investment portfolio in compliance with the Fund’s constating documents. The Manager provides key management personnel to the Fund, monitors and evaluates the performance of the Fund, pays for the investment management services of the investment advisors and provides all related administrative services required by the Fund. As compensation for its services, the Manager is entitled to receive a fee payable monthly, calculated at the maximum annual rates included in Note 8.
(b) Fixed administration feesThe Manager pays certain operating expenses of each Fund except for BMO FundSelect Balanced Portfolio (Series NBA only), BMO FundSelect Growth Portfolio (Series NBA only), BMO FundSelect Equity Growth Portfolio (Series NBA only), BMO Covered Call Canadian Banks ETF Fund, BMO Covered Call U.S. High Dividend ETF Fund, BMO Covered Call Europe High Dividend ETF Fund, BMO Fossil Fuel Free Fund, BMO Tactical Global Asset Allocation ETF Fund, BMO Tactical Global Growth ETF Fund, BMO Women in Leadership Fund, BMO International Value Fund and BMO Japan Fund (the “Variable Operating Expense Series”), including audit and legal fees and expenses; custodian and transfer agency fees; costs attributable to the issue, redemption and change of securities, including the cost of the securityholder record keeping system; expenses incurred in respect of preparing and distributing prospectuses, financial reports and other types of reports, statements and communications to securityholders; fund accounting and valuation costs; filing fees, including those incurred by the Manager
BMO Global Strategic Bond Fund
NOTES TO THE FINANCIAL STATEMENTS (cont’d)(All amounts in thousands of Canadian dollars, except per unit data)September 30, 2017
(collectively the “Administration Expenses”). In return, the Fund pays a fixed administration fee to the Manager. The fixed administration fee is calculated daily as a fixed annual percentage of the average NAV of the Fund. Refer to Note 8 for the fixed administration fee rates charged to the Fund, where applicable.
(c) Fund expensesThe Fund also pays certain operating expenses directly ("Fund Expenses"), including expenses incurred in respect of preparing and distributing fund facts; interest or other borrowing expenses; all reasonable costs and expenses incurred in relation to compliance with NI 81-107, including compensation and expenses payable to Independent Review Committee ("IRC") members and any independent counsel or other advisors employed by the IRC, the costs of the orientation and continuing education of IRC members and the costs and expenses associated with IRC meetings; taxes of all kinds to which the Fund is or might be subject; and costs associated with compliance with any new governmental or regulatory requirement introduced after December 1, 2007.
The Manager may, in some years and in certain cases, absorb a portion of management fees, fixed administration fees or certain specified expenses of the Fund or series of the Fund. The decision to absorb these expenses is reviewed periodically and determined at the discretion of the Manager, without notice to unitholders.
(d) Variable administration feesThe Variable Operating Expense Series pay all of its operating expenses directly. These operating expenses include Administration Expenses and Fund Expenses.
(e) Commissions and other portfolio transaction costsThe Fund may execute trades with and through BMO Nesbitt Burns Inc., an affiliate of the Manager, based on established standard brokerage agreements at market prices. These fees are included in “Commissions and other portfolio transaction costs” in the Statement of Comprehensive Income. Refer to Note 8 for related party fees charged to the Fund during the period(s) ended September 30, 2017 and September 30, 2016, where applicable.
(f) Initial investmentsIn order to establish a new Fund, the Manager makes an initial investment in the Fund. Pursuant to the policies of the Canadian Securities Administrators, an initial investor cannot redeem its investments until an
additional $500 has been received from other investors with respect to the same class of units. Refer to Note 8 for the investment in units of the Fund held by the Manager as at September 30, 2017 and September 30, 2016, where applicable.
(g) Other related party transactionsFrom time to time, the Manager may on behalf of the Fund enter into transactions or arrangements with or involving subsidiaries and affiliates of Bank of Montreal or certain other persons or companies that are related or connected to the Manager of the Fund. These transactions or arrangements may include transactions or arrangements with or involving subsidiaries and affiliates of Bank of Montreal, BMO Investments Inc., BMO Nesbitt Burns Inc., BMO Asset Management Corp., BMO Private Investment Counsel Inc., BMO Asset Management Inc., BMO InvestorLine Inc., Pyrford International Limited, LGM Investments Limited, BMO Trust Company, F&C Management Limited, BMO Global Asset Management (Asia) Limited, Taplin, Canida & Habacht LLC, BMO Capital Markets Corp., or other investment funds offered by Bank of Montreal, and may involve the purchase or sale of portfolio securities through or from a subsidiary or affiliates of Bank of Montreal, the purchase or sale of securities issued or guaranteed by a subsidiary or affiliates of Bank of Montreal, the purchase or redemption of units or shares of other Bank of Montreal investment funds or the provision of services to the Manager.
7. Financial instruments risksThe Fund’s activities expose it to a variety of risks associated with the financial instruments, as follows: market risk (including currency risk, interest rate risk and other market risk), credit risk and liquidity risk. The concentration table groups securities by asset type, geographic location and/or market segment. The Fund’s risk management practice outlines the monitoring of compliance to investment guidelines.
The Manager manages the potential effects of these financial risks on the Fund’s performance by employing and overseeing professional and experienced portfolio managers that regularly monitor the Fund’s positions, market events and diversify investment portfolios within the constraints of the investment guidelines.
Where the Fund invests in other investment fund(s), it may be indirectly exposed to the financial instruments
BMO Global Strategic Bond Fund
NOTES TO THE FINANCIAL STATEMENTS (cont’d)(All amounts in thousands of Canadian dollars, except per unit data)September 30, 2017
risks of the underlying fund(s), depending on the investment objectives and the type of securities held by the underlying fund(s). The decision to buy or sell an underlying fund is based on the investment guidelines and positions, rather than the exposure of the underlying fund(s).
(a) Currency riskCurrency risk is the risk that the value of financial instruments denominated in currencies, other than the functional currency of the Fund, will fluctuate due to changes in foreign exchange rates. Investments in foreign markets are exposed to currency risk as the prices denominated in foreign currencies are converted to the Fund’s functional currency in determining fair value. The Fund may enter into forward currency contracts for hedging purposes to reduce foreign currency exposure or to establish exposure to foreign currencies. The Fund’s exposure to currency risk, if any, is further disclosed in Note 8.
(b) Interest rate riskInterest rate risk is the risk that the fair value of the Fund's interest bearing investments will fluctuate due to changes in market interest rates. The Fund's exposure to interest rate risk is concentrated in its investment in debt securities (such as bonds, money market investments, short-term investments and debentures) and interest rate derivative instruments, if any. Other assets and liabilities are short-term in nature and/or non-interest bearing. The Fund's exposure to interest rate risk, if any, is further discussed in Note 8.
(c) Other market riskOther market risk is the risk that the fair value of a financial instrument will fluctuate as a result of changes in market prices (other than those arising from interest rate risk or currency risk), whether those changes are caused by factors specific to the individual financial instrument or its issuer, or factors affecting all similar financial instruments traded in a market. Other assets and liabilities are monetary items that are short-term in nature, as such they are not subject to other
market risk. The Fund's exposure to other market risk, if any, is further discussed in Note 8.
(d) Credit riskCredit risk is the risk that a loss could arise from a security issuer or counterparty to a financial instrument not being able to meet its financial obligations. The fair value of debt securities includes consideration of the credit worthiness of the debt issuer. Credit risk exposure for over-the-counter derivative instruments is based on the Fund's unrealized gain of the contractual obligations with the counterparty as at the reporting date. The credit exposure of other assets is represented by its carrying amount. The Fund's exposure to credit risk, if any, is further discussed in Note 8.
The Fund may enter into securities lending transactions with approved counterparties. Credit risk associated with these transactions is considered minimal as all counterparties have a sufficient approved credit rating and the market value of collateral held by the Fund must be at least 102% of the fair value of securities loaned, as disclosed in Note 8.
(e) Liquidity riskThe Fund's exposure to liquidity risk is concentrated in the daily cash redemptions of units. The Fund primarily invests in securities that are traded in active markets and can be readily disposed. In addition, the Fund retains sufficient cash and cash equivalent positions to maintain liquidity. The Fund may, from time to time, enter into over-the-counter derivative contracts or invest in unlisted securities, which are not traded in an organized market and may be illiquid. Securities for which a market quotation could not be obtained and may be illiquid are identified on the Schedule of Investment Portfolio. The proportion of illiquid securities to the NAV of the Fund is monitored by the Manager to ensure it does not exceed the regulatory limit and does not significantly affect the liquidity required to meet the Fund's financial obligations.
BMO Global Strategic Bond Fund
NOTES TO THE FINANCIAL STATEMENTS (cont’d)(All amounts in thousands of Canadian dollars, except per unit data)September 30, 2017
8. Fund specific information(a) Fund and Series information and change in unitsThe Fund is authorized to issue an unlimited number of units in each of Series A Units, Advisor Series Units, Series F Units, Premium Series Units, Series D Units and Series I Units, which are redeemable at the unitholders’ option.
Series Inception date
Series A September 6, 2000
Advisor Series October 24, 2008
Series F October 24, 2008
Premium Series *
Series D April 7, 2014
Series I May 9, 2008
* This series was not offered for distribution and was terminated as at the close of business on October 30, 2015.
Series A Units are offered on a no-load basis and are available to all investors.
Advisor Series Units are available to all investors through authorized dealers and brokers.
Series F Units are available for purchase by investors who are enrolled in dealer-sponsored wrap programs or flat fee accounts. Instead of paying a commission on each transaction, these investors pay an annual fee to the Manager based on the value of their assets.
Premium Series Units are intended for investors who participate in the BMO Mutual Funds Premium Wealth Program. The minimum investment for Premium Series is $100 per Fund. No management fees are charged to the Fund with respect to Premium Series. Instead, each investor is charged a management fee directly by the Manager and payable to the Manager for providing general management services. Each investor would be eligible for management fee reductions depending on their account balance. In addition to the management fee, each investor may pay a dealer service fee, which is payable to their dealer. In certain circumstances, the minimum initial investment for Premium Series of each Fund may be reduced to $10.
Series D Units are available to investors who have an account with a discount brokerage. A reduced trailing commission is paid to discount brokerages in respect to Series D Units which means a lower management fee can be charged.
Series I Units are available only to institutional investors and other investment funds as determined by the Manager from time to time and on a case-by-case basis, and who have entered into an agreement with the Manager. No management fees and fixed administration fees are charged to the Fund in respect of the Series I Units as each investor or dealer negotiates a separate fee with the Manager.
The number of units of each series that have been issued and are outstanding are shown in the table below.
For the periods ended (in thousands of units)
Sep 30, 2017
Sep 30, 2016
Series A
Units issued and outstanding, beginning of period 19,805 20,693
Issued 2,076 1,977
Issued on reinvestment of distributions 1,017 1,130
Redeemed during the period (3,789) (3,995)Units issued and outstanding,
end of period 19,109 19,805
Advisor Series
Units issued and outstanding, beginning of period 4,622 7,149
Issued 702 233
Issued on reinvestment of distributions 112 160
Redeemed during the period (1,297) (2,920)Units issued and outstanding,
end of period 4,139 4,622
Series F
Units issued and outstanding, beginning of period 2,038 2,413
Issued 1,754 346
Issued on reinvestment of distributions 55 54
Redeemed during the period (618) (775)Units issued and outstanding,
end of period 3,229 2,038
BMO Global Strategic Bond Fund
NOTES TO THE FINANCIAL STATEMENTS (cont’d)(All amounts in thousands of Canadian dollars, except per unit data)September 30, 2017
For the periods ended (in thousands of units)
Sep 30, 2017
Sep 30, 2016
Premium Series
Units issued and outstanding, beginning of period — 0
Redeemed during the period — (0)Units issued and outstanding,
end of period — —
Series D
Units issued and outstanding, beginning of period 17 10
Issued 16 12
Issued on reinvestment of distributions 0 0
Redeemed during the period (6) (5)Units issued and outstanding,
end of period 27 17
Series I
Units issued and outstanding, beginning of period 4,257 11,877
Issued — 298
Issued on reinvestment of distributions 151 337
Redeemed during the period (1,443) (8,255)Units issued and outstanding,
end of period 2,965 4,257
Revision of comparative informationThe adjustment to exclude non-cash subscriptions and redemptions arising from switches between series within a Fund in the Statement of Cash Flows in the prior period amounted to $2,375.
(b) Reconciliation of NAV to net assetsAs at September 30, 2017 and September 30, 2016, there were no differences between the Fund’s NAV per unit and its net assets per unit calculated for each series in accordance with IFRS.
(c) Increase (decrease) in net assets attributable to holders of redeemable units per unitThe increase (decrease) in net assets attributable to holders of redeemable units per unit is calculated as follows:
Sep 30, Sep 30,For the periods ended 2017 2016Series A Units
Increase in net assets attributable to holders of redeemable units 4,717 13,743
Weighted average units outstanding during the period 19,578 20,251
Increase in net assets attributable to holders of redeemable units per unit 0.24 0.68
Advisor Series Units
Increase in net assets attributable to holders of redeemable units 1,805 6,499
Weighted average units outstanding during the period 4,199 5,721
Increase in net assets attributable to holders of redeemable units per unit 0.43 1.14
Series F Units
Increase in net assets attributable to holders of redeemable units 1,370 3,226
Weighted average units outstanding during the period 2,196 2,175
Increase in net assets attributable to holders of redeemable units per unit 0.62 1.48
Premium Series Units
Increase in net assets attributable to holders of redeemable units — 0
Weighted average units outstanding during the period — 0
Increase in net assets attributable to holders of redeemable units per unit — 0.27
Series D Units
Increase in net assets attributable to holders of redeemable units 8 13
Weighted average units outstanding during the period 18 12
Increase in net assets attributable to holders of redeemable units per unit 0.43 1.09

BMO Global Strategic Bond Fund
NOTES TO THE FINANCIAL STATEMENTS (cont’d)(All amounts in thousands of Canadian dollars, except per unit data)September 30, 2017
Sep 30, Sep 30,For the periods ended 2017 2016Series I Units
Increase in net assets attributable to holders of redeemable units 1,905 6,210
Weighted average units outstanding during the period 3,553 7,483
Increase in net assets attributable to holders of redeemable units per unit 0.54 0.83
(d) Income taxesAs at the tax year-ended December 2016, the Fund had the following capital and non-capital losses for income tax purposes:
Non-Capital Losses That Expire in
Total Capital Losses
($)
Total Non-Capital Losses
($)2027 ($)
2028 ($)
2029 and thereafter
($)
— 10,470 — — 10,470
(e) Related party transactionsManagement feesThe Manager is entitled to receive the following fees payable monthly, calculated at the following maximum annual rates:
SeriesManagement
Fees (%)
Fixed Administration
Fees (%)
Series A 1.750 0.280Advisor Series 1.750 0.280Series F 0.450+ 0.280Premium Series — 0.280Series D 0.850 0.280Series I * *
* Negotiated and paid by each Series I investor directly to the Manager.+ Effective October 30, 2015, the management fee rate was reducedfrom 0.650% to 0.450%.
The outstanding accrued management fees due to the Manager are included in “Accrued expenses” in the Statement of Financial Position and as at September 30, 2017 amounted to $21 (September 30, 2016 — $22).
ExpensesThe Manager pays the administration and operating expenses of the Series I Units.
Brokerage commissions and soft dollarsThere were no brokerage commissions charged to the Fund during the periods ended September 30, 2017 and September 30, 2016.
Units held by the ManagerThere were no units held by the Manager as at September 30, 2017 and September 30, 2016.
(f) Financial instruments risksThe Fund’s objective is to provide a fixed monthly distribution and capital appreciation potential by investing primarily in debt instruments issued by governments and corporations around the world. The Fund invested in a diversified pool of fixed income securities, which primarily includes investment grade securities with a credit rating of BBB or higher, high yield securities with a credit rating below BBB and emerging market debt.
No changes affecting the overall level of risk of investing in the Fund were made during the period.
Currency riskThe Fund’s exposure to currency risk is summarized in the tables below. Amounts shown are based on the carrying value of monetary and non-monetary assets (including derivatives and the underlying principle (notional) amount of forward currency contracts, if any).
As at Sep 30, 2017
Currencies
Cash and other
current receivables & payables
($)
Invest- ments
(monetary & non-
monetary) ($)
Forward currency contracts
($)
Net currency exposure
($)
As a % of Net Assets
(%)
Australian Dollar 482 (402) (17) 63 0.0
Brazilian Real 12 — — 12 0.0
Euro 207 34,089 (34,266) 30 0.0
Indian Rupee — — 1,332 1,332 0.5
Japanese Yen 1 — — 1 0.0
Mexican Peso 136 (3) 1,848 1,981 0.8
BMO Global Strategic Bond Fund
NOTES TO THE FINANCIAL STATEMENTS (cont’d)(All amounts in thousands of Canadian dollars, except per unit data)September 30, 2017
As at Sep 30, 2017
Currencies
Cash and other
current receivables & payables
($)
Invest- ments
(monetary & non-
monetary) ($)
Forward currency contracts
($)
Net currency exposure
($)
As a % of Net Assets
(%)
Peruvian Nuevo Sol (1,867) 2,030 645 808 0.3
Polish Zloty 2 — — 2 0.0
Pound Sterling 112 38,583 (39,354) (659) (0.3)
Singapore Dollar 8 — — 8 0.0
U.S. Dollar (1,433) 182,689 (186,070) (4,814) (1.8)
Total (2,340) 256,986 (255,882) (1,236) (0.5)
All amounts in Canadian dollars
As at Sep 30, 2016
Currencies
Cash and other
current receivables & payables
($)
Invest- ments
(monetary & non-
monetary) ($)
Forward currency contracts
($)
Net currency exposure
($)
As a % of Net Assets
(%)
Australian Dollar 586 439 (74) 951 0.4
Brazilian Real 13 — — 13 0.0
Euro (2,423) 22,152 (19,912) (183) (0.1)
Japanese Yen 1 — — 1 0.0
Mexican Peso — 35 — 35 0.0
Polish Zloty 2 — — 2 0.0
Pound Sterling (2,090) 23,976 (22,189) (303) (0.1)
Singapore Dollar — — 9 9 0.0
South Korean Won — — (16) (16) (0.0)
U.S. Dollar (10,342) 232,860 (222,958) (440) (0.2)
Total (14,253) 279,462 (265,140) 69 0.0
All amounts in Canadian dollars
As at September 30, 2017 and September 30, 2016, if the Canadian dollar had strengthened or weakened by 5% in relation to all foreign currencies, with all variables held constant, the Net Assets of the Fund could possibly have increased or decreased, respectively, by approximately $62 (September 30, 2016 — $3). In practice, actual results may differ from this sensitivity analysis and the difference could be material.
Interest rate riskThe Fund’s exposure to interest rate risk by remaining term to maturity is summarized in the following table:
Interest Rate Exposure as atSep 30, Sep 30,
Number of years 2017 2016
Less than one year 9,595 19,512
One to three years 15,093 16,652
Three to five years 40,694 32,045
Five to ten years 76,825 98,950
Greater than ten years 116,852 114,852
Total 259,059 282,011
All amounts in Canadian dollars
As at September 30, 2017 and September 30, 2016, if the prevailing interest rates had been raised or lowered by 1%, assuming a parallel shift in the yield curve, with all other variables held constant, the Net Assets of the Fund could possibly have increased or decreased, respectively, by approximately $11,784 (September 30, 2016 — $13,779). The Fund’s interest rate sensitivity was determined based on portfolio weighted duration. In practice, actual results may differ from this sensitivity analysis and the difference could be material.

BMO Global Strategic Bond Fund
NOTES TO THE FINANCIAL STATEMENTS (cont’d)(All amounts in thousands of Canadian dollars, except per unit data)September 30, 2017
Other market riskAs at September 30, 2017 and September 30, 2016, the Fund was not significantly exposed to other market risk as it was invested fully in fixed income securities.
Credit riskThe Fund’s exposure to credit risk, grouped by credit ratings is summarized in the following table:
As a % of Net Assets as atSep 30, Sep 30,
Credit Rating 2017 2016
R-1 High 0.9 —
R-1 Mid — 0.4
R-1 Low — 1.5
AAA 13.6 15.0
AA 14.1 15.1
A 5.0 2.9
BBB 13.5 14.6
BB 21.3 23.4
B 22.3 19.6
Below B 8.3 12.8
Unrated 1.3 —
Total 100.3 105.3
Securities lendingThe Fund had assets involved in securities lending transactions outstanding as at September 30, 2017 and September 30, 2016 as follows:
Aggregate value of securities on loan
($)
Aggregate value of collateral received for
the loan ($)
Sep 30, 2017 2,761 2,915Sep 30, 2016 4,822 5,068
The table below is a reconciliation of the gross amount generated from securities lending transactions to the security lending revenue for the periods ended September 30, 2017 and September 30, 2016:
For the periods ended Sep 30, 2017 Sep 30, 2016
Amount
% of Gross Securities Lending Revenue Amount
% of Gross Securities Lending Revenue
Gross securities lending revenue 22 100.0 150 100.0
Withholding taxes 6 26.6 39 26.3
16 73.4 111 73.7
Payment to securities lending agents 5 22.0 33 22.2
Net securities lending revenue* 11 51.4 78 51.5
* Amount shown on the Statement of Comprehensive Income is gross of withholding taxes of $6 (September 30, 2016 — $39).
Concentration riskThe Fund’s concentration risk is summarized in the following table:
As atSep. 30,
2017Sep. 30,
2016
Money Market InvestmentsFederal 0.9% 1.9%
Bonds & DebenturesArgentina 3.8% 0.6%Australia 0.0% —%Brazil 2.8% 4.3%Canada 0.1% —%Cayman Islands 0.1% —%Chile 0.3% 1.0%Colombia —% 0.7%Costa Rica —% 0.3%Dominican Republic 0.2% 0.5%Ecuador —% 0.1%El Salvador —% 0.4%Finland 0.0% —%France 1.9% 1.7%Georgia 0.1% —%Germany 0.3% 1.4%Ghana 0.3% 0.2%Hong Kong 0.0% —%India —% 0.1%Indonesia —% 2.4%Ireland 0.6% —%Italy 1.2% 1.0%Japan 1.1% 1.0%Kazakhstan —% 0.4%
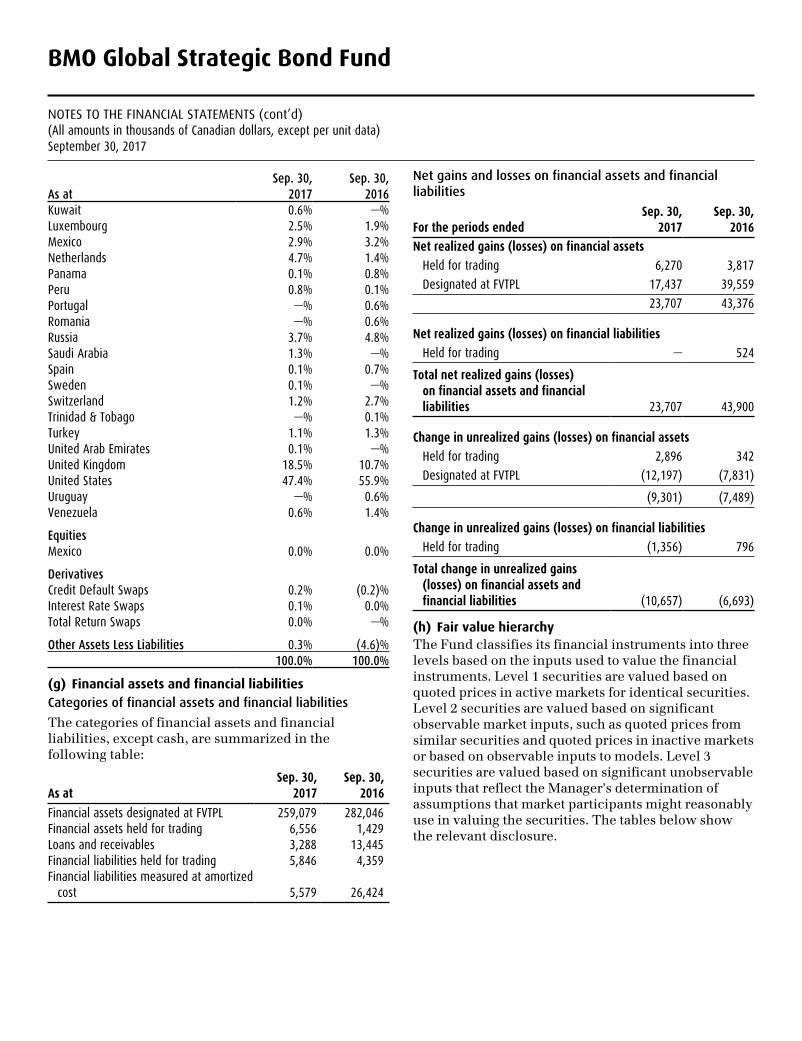
BMO Global Strategic Bond Fund
NOTES TO THE FINANCIAL STATEMENTS (cont’d)(All amounts in thousands of Canadian dollars, except per unit data)September 30, 2017
As atSep. 30,
2017Sep. 30,
2016Kuwait 0.6% —%Luxembourg 2.5% 1.9%Mexico 2.9% 3.2%Netherlands 4.7% 1.4%Panama 0.1% 0.8%Peru 0.8% 0.1%Portugal —% 0.6%Romania —% 0.6%Russia 3.7% 4.8%Saudi Arabia 1.3% —%Spain 0.1% 0.7%Sweden 0.1% —%Switzerland 1.2% 2.7%Trinidad & Tobago —% 0.1%Turkey 1.1% 1.3%United Arab Emirates 0.1% —%United Kingdom 18.5% 10.7%United States 47.4% 55.9%Uruguay —% 0.6%Venezuela 0.6% 1.4%
EquitiesMexico 0.0% 0.0%
DerivativesCredit Default Swaps 0.2% (0.2)%Interest Rate Swaps 0.1% 0.0%Total Return Swaps 0.0% —%
Other Assets Less Liabilities 0.3% (4.6)%100.0% 100.0%
(g) Financial assets and financial liabilitiesCategories of financial assets and financial liabilities
The categories of financial assets and financial liabilities, except cash, are summarized in the following table:
Sep 30, Sep 30,As at 2017 2016
Financial assets designated at FVTPL 259,079 282,046Financial assets held for trading 6,556 1,429Loans and receivables 3,288 13,445Financial liabilities held for trading 5,846 4,359Financial liabilities measured at amortized
cost 5,579 26,424
Net gains and losses on financial assets and financial liabilities
Sep 30, Sep 30,For the periods ended 2017 2016
Net realized gains (losses) on financial assets
Held for trading 6,270 3,817
Designated at FVTPL 17,437 39,559
23,707 43,376
Net realized gains (losses) on financial liabilities
Held for trading — 524
Total net realized gains (losses) on financial assets and financial liabilities 23,707 43,900
Change in unrealized gains (losses) on financial assets
Held for trading 2,896 342
Designated at FVTPL (12,197) (7,831)
(9,301) (7,489)
Change in unrealized gains (losses) on financial liabilities
Held for trading (1,356) 796
Total change in unrealized gains (losses) on financial assets and financial liabilities (10,657) (6,693)
(h) Fair value hierarchyThe Fund classifies its financial instruments into three levels based on the inputs used to value the financial instruments. Level 1 securities are valued based on quoted prices in active markets for identical securities. Level 2 securities are valued based on significant observable market inputs, such as quoted prices from similar securities and quoted prices in inactive markets or based on observable inputs to models. Level 3 securities are valued based on significant unobservable inputs that reflect the Manager's determination of assumptions that market participants might reasonably use in valuing the securities. The tables below show the relevant disclosure.
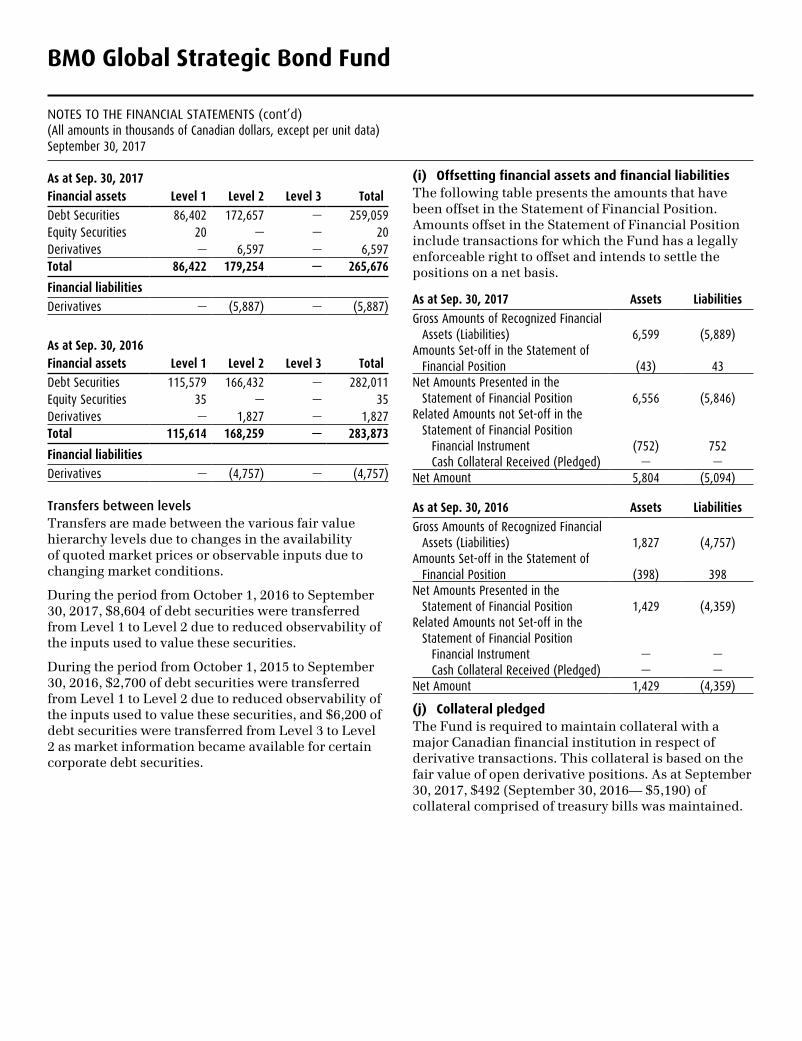
BMO Global Strategic Bond Fund
NOTES TO THE FINANCIAL STATEMENTS (cont’d)(All amounts in thousands of Canadian dollars, except per unit data)September 30, 2017
As at Sep 30, 2017Financial assets Level 1 Level 2 Level 3 Total
Debt Securities 86,402 172,657 — 259,059Equity Securities 20 — — 20Derivatives — 6,597 — 6,597Total 86,422 179,254 — 265,676
Financial liabilities
Derivatives — (5,887) — (5,887)
As at Sep 30, 2016Financial assets Level 1 Level 2 Level 3 Total
Debt Securities 115,579 166,432 — 282,011Equity Securities 35 — — 35Derivatives — 1,827 — 1,827Total 115,614 168,259 — 283,873
Financial liabilities
Derivatives — (4,757) — (4,757)
Transfers between levelsTransfers are made between the various fair value hierarchy levels due to changes in the availability of quoted market prices or observable inputs due to changing market conditions.
During the period from October 1, 2016 to September 30, 2017, $8,604 of debt securities were transferred from Level 1 to Level 2 due to reduced observability of the inputs used to value these securities.
During the period from October 1, 2015 to September 30, 2016, $2,700 of debt securities were transferred from Level 1 to Level 2 due to reduced observability of the inputs used to value these securities, and $6,200 of debt securities were transferred from Level 3 to Level 2 as market information became available for certain corporate debt securities.
(i) Offsetting financial assets and financial liabilitiesThe following table presents the amounts that have been offset in the Statement of Financial Position. Amounts offset in the Statement of Financial Position include transactions for which the Fund has a legally enforceable right to offset and intends to settle the positions on a net basis.
As at Sep 30, 2017 Assets Liabilities
Gross Amounts of Recognized Financial Assets (Liabilities) 6,599 (5,889)
Amounts Set-off in the Statement of Financial Position (43) 43
Net Amounts Presented in the Statement of Financial Position 6,556 (5,846)
Related Amounts not Set-off in the Statement of Financial Position
Financial Instrument (752) 752Cash Collateral Received (Pledged) — —
Net Amount 5,804 (5,094)
As at Sep 30, 2016 Assets Liabilities
Gross Amounts of Recognized Financial Assets (Liabilities) 1,827 (4,757)
Amounts Set-off in the Statement of Financial Position (398) 398
Net Amounts Presented in the Statement of Financial Position 1,429 (4,359)
Related Amounts not Set-off in the Statement of Financial Position
Financial Instrument — —Cash Collateral Received (Pledged) — —
Net Amount 1,429 (4,359)
(j) Collateral pledgedThe Fund is required to maintain collateral with a major Canadian financial institution in respect of derivative transactions. This collateral is based on the fair value of open derivative positions. As at September 30, 2017, $492 (September 30, 2016— $5,190) of collateral comprised of treasury bills was maintained.
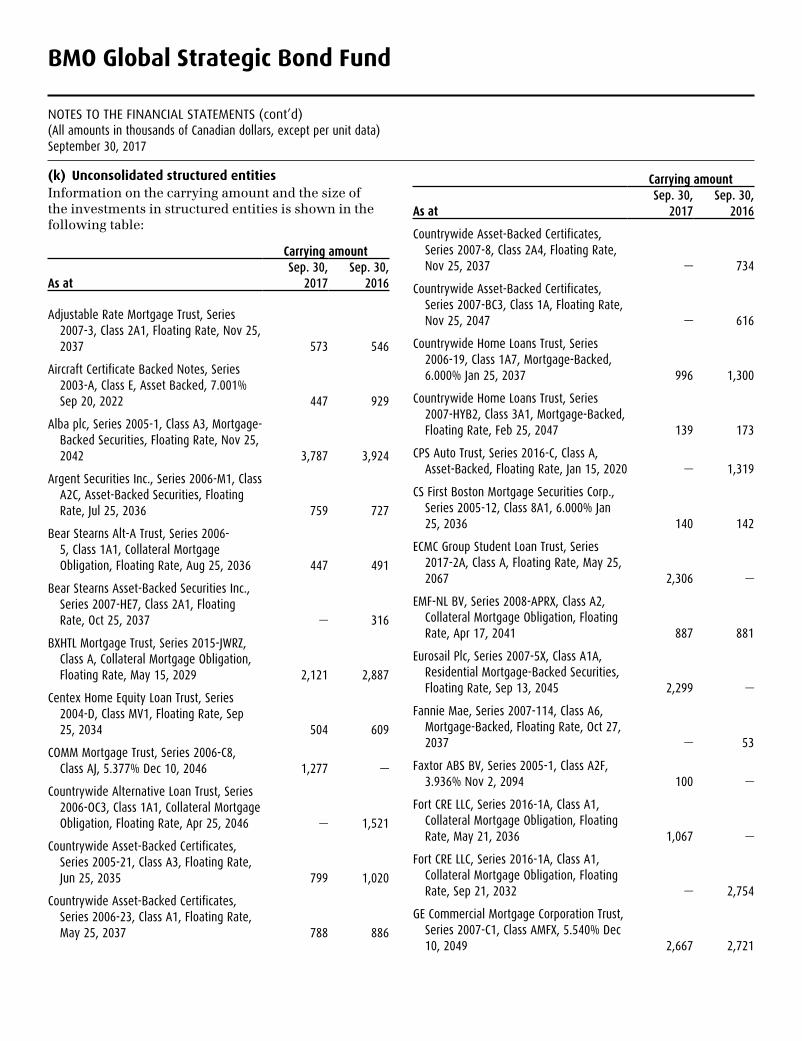
BMO Global Strategic Bond Fund
NOTES TO THE FINANCIAL STATEMENTS (cont’d)(All amounts in thousands of Canadian dollars, except per unit data)September 30, 2017
(k) Unconsolidated structured entitiesInformation on the carrying amount and the size of the investments in structured entities is shown in the following table:
Carrying amount
As at Sep. 30,
2017Sep. 30,
2016
Adjustable Rate Mortgage Trust, Series 2007-3, Class 2A1, Floating Rate, Nov 25, 2037 573 546
Aircraft Certificate Backed Notes, Series 2003-A, Class E, Asset Backed, 7.001% Sep 20, 2022 447 929
Alba plc, Series 2005-1, Class A3, Mortgage-Backed Securities, Floating Rate, Nov 25, 2042 3,787 3,924
Argent Securities Inc., Series 2006-M1, Class A2C, Asset-Backed Securities, Floating Rate, Jul 25, 2036 759 727
Bear Stearns Alt-A Trust, Series 2006-5, Class 1A1, Collateral Mortgage Obligation, Floating Rate, Aug 25, 2036 447 491
Bear Stearns Asset-Backed Securities Inc., Series 2007-HE7, Class 2A1, Floating Rate, Oct 25, 2037 — 316
BXHTL Mortgage Trust, Series 2015-JWRZ, Class A, Collateral Mortgage Obligation, Floating Rate, May 15, 2029 2,121 2,887
Centex Home Equity Loan Trust, Series 2004-D, Class MV1, Floating Rate, Sep 25, 2034 504 609
COMM Mortgage Trust, Series 2006-C8, Class AJ, 5.377% Dec 10, 2046 1,277 —
Countrywide Alternative Loan Trust, Series 2006-OC3, Class 1A1, Collateral Mortgage Obligation, Floating Rate, Apr 25, 2046 — 1,521
Countrywide Asset-Backed Certificates, Series 2005-21, Class A3, Floating Rate, Jun 25, 2035 799 1,020
Countrywide Asset-Backed Certificates, Series 2006-23, Class A1, Floating Rate, May 25, 2037 788 886
Carrying amount
As at Sep. 30,
2017Sep. 30,
2016
Countrywide Asset-Backed Certificates, Series 2007-8, Class 2A4, Floating Rate, Nov 25, 2037 — 734
Countrywide Asset-Backed Certificates, Series 2007-BC3, Class 1A, Floating Rate, Nov 25, 2047 — 616
Countrywide Home Loans Trust, Series 2006-19, Class 1A7, Mortgage-Backed, 6.000% Jan 25, 2037 996 1,300
Countrywide Home Loans Trust, Series 2007-HYB2, Class 3A1, Mortgage-Backed, Floating Rate, Feb 25, 2047 139 173
CPS Auto Trust, Series 2016-C, Class A, Asset-Backed, Floating Rate, Jan 15, 2020 — 1,319
CS First Boston Mortgage Securities Corp., Series 2005-12, Class 8A1, 6.000% Jan 25, 2036 140 142
ECMC Group Student Loan Trust, Series 2017-2A, Class A, Floating Rate, May 25, 2067 2,306 —
EMF-NL BV, Series 2008-APRX, Class A2, Collateral Mortgage Obligation, Floating Rate, Apr 17, 2041 887 881
Eurosail Plc, Series 2007-5X, Class A1A, Residential Mortgage-Backed Securities, Floating Rate, Sep 13, 2045 2,299 —
Fannie Mae, Series 2007-114, Class A6, Mortgage-Backed, Floating Rate, Oct 27, 2037 — 53
Faxtor ABS BV, Series 2005-1, Class A2F, 3.936% Nov 2, 2094 100 —
Fort CRE LLC, Series 2016-1A, Class A1, Collateral Mortgage Obligation, Floating Rate, May 21, 2036 1,067 —
Fort CRE LLC, Series 2016-1A, Class A1, Collateral Mortgage Obligation, Floating Rate, Sep 21, 2032 — 2,754
GE Commercial Mortgage Corporation Trust, Series 2007-C1, Class AMFX, 5.540% Dec 10, 2049 2,667 2,721
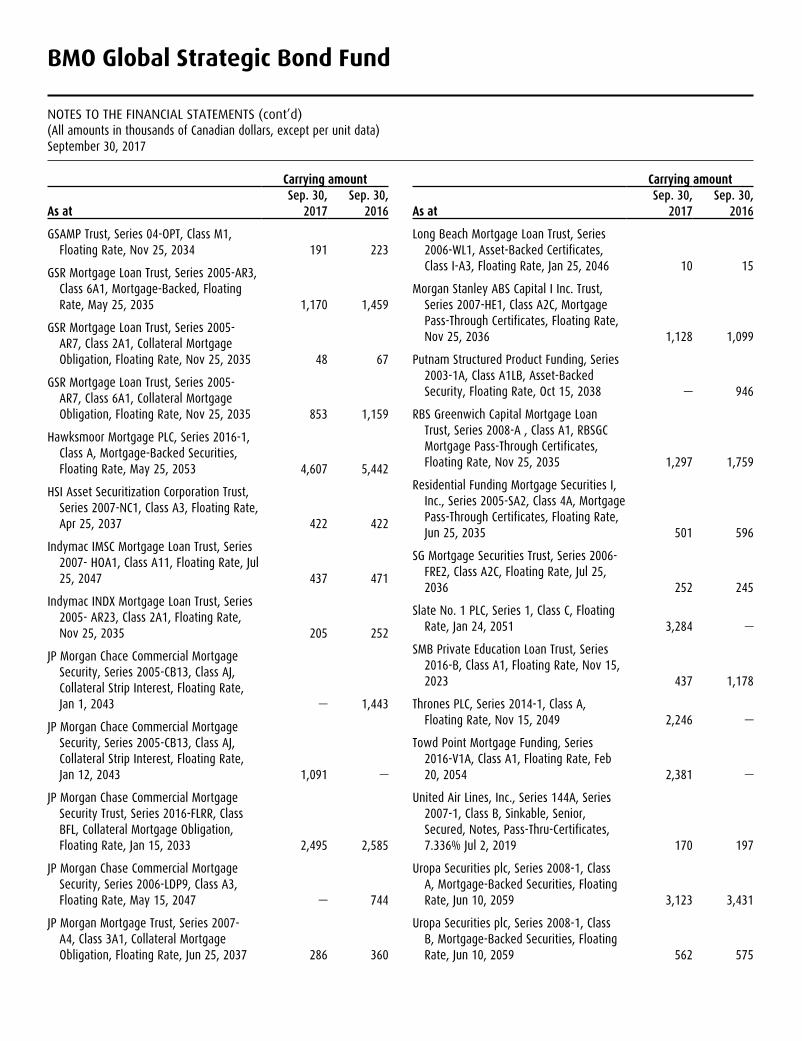
BMO Global Strategic Bond Fund
NOTES TO THE FINANCIAL STATEMENTS (cont’d)(All amounts in thousands of Canadian dollars, except per unit data)September 30, 2017
Carrying amount
As at Sep. 30,
2017Sep. 30,
2016
GSAMP Trust, Series 04-OPT, Class M1, Floating Rate, Nov 25, 2034 191 223
GSR Mortgage Loan Trust, Series 2005-AR3, Class 6A1, Mortgage-Backed, Floating Rate, May 25, 2035 1,170 1,459
GSR Mortgage Loan Trust, Series 2005-AR7, Class 2A1, Collateral Mortgage Obligation, Floating Rate, Nov 25, 2035 48 67
GSR Mortgage Loan Trust, Series 2005-AR7, Class 6A1, Collateral Mortgage Obligation, Floating Rate, Nov 25, 2035 853 1,159
Hawksmoor Mortgage PLC, Series 2016-1, Class A, Mortgage-Backed Securities, Floating Rate, May 25, 2053 4,607 5,442
HSI Asset Securitization Corporation Trust, Series 2007-NC1, Class A3, Floating Rate, Apr 25, 2037 422 422
Indymac IMSC Mortgage Loan Trust, Series 2007- HOA1, Class A11, Floating Rate, Jul 25, 2047 437 471
Indymac INDX Mortgage Loan Trust, Series 2005- AR23, Class 2A1, Floating Rate, Nov 25, 2035 205 252
JP Morgan Chace Commercial Mortgage Security, Series 2005-CB13, Class AJ, Collateral Strip Interest, Floating Rate, Jan 1, 2043 — 1,443
JP Morgan Chace Commercial Mortgage Security, Series 2005-CB13, Class AJ, Collateral Strip Interest, Floating Rate, Jan 12, 2043 1,091 —
JP Morgan Chase Commercial Mortgage Security Trust, Series 2016-FLRR, Class BFL, Collateral Mortgage Obligation, Floating Rate, Jan 15, 2033 2,495 2,585
JP Morgan Chase Commercial Mortgage Security, Series 2006-LDP9, Class A3, Floating Rate, May 15, 2047 — 744
JP Morgan Mortgage Trust, Series 2007-A4, Class 3A1, Collateral Mortgage Obligation, Floating Rate, Jun 25, 2037 286 360
Carrying amount
As at Sep. 30,
2017Sep. 30,
2016
Long Beach Mortgage Loan Trust, Series 2006-WL1, Asset-Backed Certificates, Class I-A3, Floating Rate, Jan 25, 2046 10 15
Morgan Stanley ABS Capital I Inc. Trust, Series 2007-HE1, Class A2C, Mortgage Pass-Through Certificates, Floating Rate, Nov 25, 2036 1,128 1,099
Putnam Structured Product Funding, Series 2003-1A, Class A1LB, Asset-Backed Security, Floating Rate, Oct 15, 2038 — 946
RBS Greenwich Capital Mortgage Loan Trust, Series 2008-A , Class A1, RBSGC Mortgage Pass-Through Certificates, Floating Rate, Nov 25, 2035 1,297 1,759
Residential Funding Mortgage Securities I, Inc., Series 2005-SA2, Class 4A, Mortgage Pass-Through Certificates, Floating Rate, Jun 25, 2035 501 596
SG Mortgage Securities Trust, Series 2006-FRE2, Class A2C, Floating Rate, Jul 25, 2036 252 245
Slate No. 1 PLC, Series 1, Class C, Floating Rate, Jan 24, 2051 3,284 —
SMB Private Education Loan Trust, Series 2016-B, Class A1, Floating Rate, Nov 15, 2023 437 1,178
Thrones PLC, Series 2014-1, Class A, Floating Rate, Nov 15, 2049 2,246 —
Towd Point Mortgage Funding, Series 2016-V1A, Class A1, Floating Rate, Feb 20, 2054 2,381 —
United Air Lines, Inc., Series 144A, Series 2007-1, Class B, Sinkable, Senior, Secured, Notes, Pass-Thru-Certificates, 7.336% Jul 2, 2019 170 197
Uropa Securities plc, Series 2008-1, Class A, Mortgage-Backed Securities, Floating Rate, Jun 10, 2059 3,123 3,431
Uropa Securities plc, Series 2008-1, Class B, Mortgage-Backed Securities, Floating Rate, Jun 10, 2059 562 575
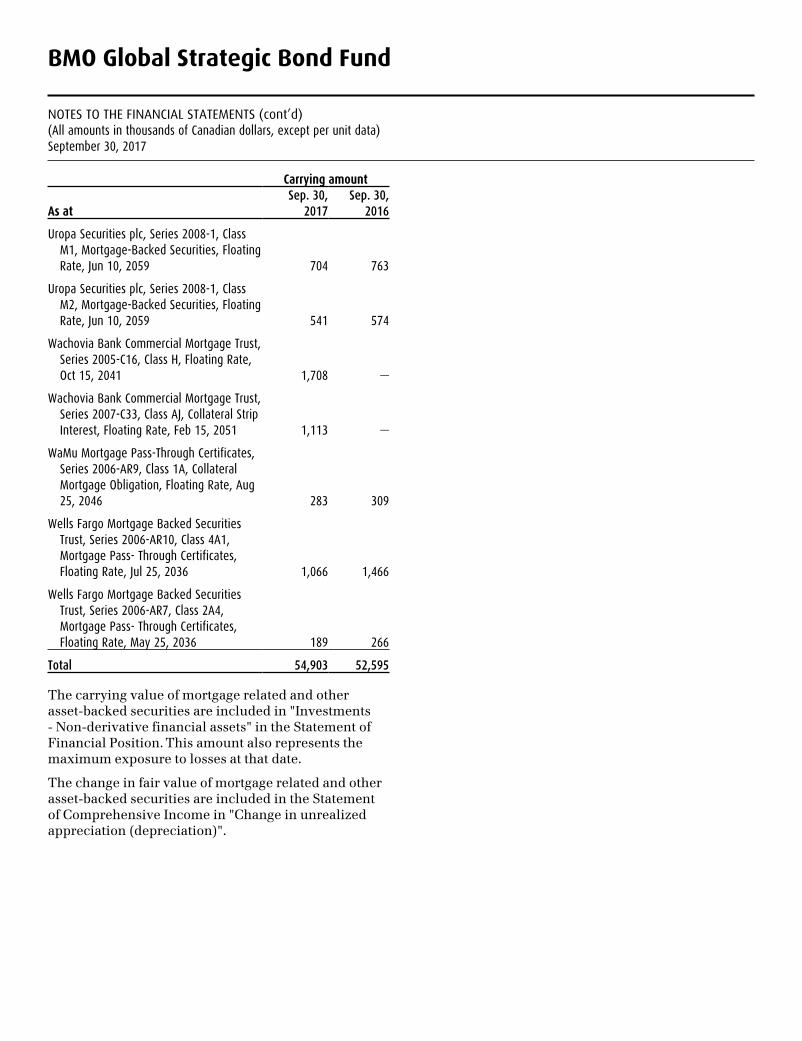
BMO Global Strategic Bond Fund
NOTES TO THE FINANCIAL STATEMENTS (cont’d)(All amounts in thousands of Canadian dollars, except per unit data)September 30, 2017
Carrying amount
As at Sep. 30,
2017Sep. 30,
2016
Uropa Securities plc, Series 2008-1, Class M1, Mortgage-Backed Securities, Floating Rate, Jun 10, 2059 704 763
Uropa Securities plc, Series 2008-1, Class M2, Mortgage-Backed Securities, Floating Rate, Jun 10, 2059 541 574
Wachovia Bank Commercial Mortgage Trust, Series 2005-C16, Class H, Floating Rate, Oct 15, 2041 1,708 —
Wachovia Bank Commercial Mortgage Trust, Series 2007-C33, Class AJ, Collateral Strip Interest, Floating Rate, Feb 15, 2051 1,113 —
WaMu Mortgage Pass-Through Certificates, Series 2006-AR9, Class 1A, Collateral Mortgage Obligation, Floating Rate, Aug 25, 2046 283 309
Wells Fargo Mortgage Backed Securities Trust, Series 2006-AR10, Class 4A1, Mortgage Pass- Through Certificates, Floating Rate, Jul 25, 2036 1,066 1,466
Wells Fargo Mortgage Backed Securities Trust, Series 2006-AR7, Class 2A4, Mortgage Pass- Through Certificates, Floating Rate, May 25, 2036 189 266
Total 54,903 52,595
The carrying value of mortgage related and other asset-backed securities are included in "Investments - Non-derivative financial assets" in the Statement of Financial Position. This amount also represents the maximum exposure to losses at that date.
The change in fair value of mortgage related and other asset-backed securities are included in the Statement of Comprehensive Income in "Change in unrealized appreciation (depreciation)".
Management’s Responsibility for Financial Reporting
The accompanying financial statements have been prepared by management of BMO Investments Inc.
Management is responsible for the information and representations made in these financial statements.
Management has maintained appropriate processes to ensure that relevant and reliable financial information is
produced. The financial statements have been produced in accordance with International Financial Reporting
Standards (IFRS) as issued by the International Accounting Standards Board (IASB) and include certain amounts
based on estimates and judgments. The significant accounting policies which management believes are
appropriate for the BMO Mutual Funds are described in Note 3 to the financial statements.
The Trustee of each of the Trusts is responsible for reviewing and approving the financial statements and
overseeing management’s performance of its financial reporting responsibilities. The Trustee reviews the financial
statements, adequacy of internal controls, the audit process and financial reporting with management and the
external auditors.
The Board of Directors of BMO Global Tax Advantage Funds Inc. is responsible for reviewing and approving the
financial statements and overseeing management’s performance of its financial reporting responsibilities. The
Audit Committee of the Board of Directors reviews the financial statements, adequacy of internal controls, the
audit process and financial reporting with management and the external auditors. The Audit Committee reports to
the Board of Directors prior to the Board approval of the financial statements.
PricewaterhouseCoopers LLP are the external auditors of the BMO Mutual Funds. The auditors have been
appointed by the respective Boards and cannot be changed without the prior approval of the Independent Review
Committee and 60 days notice to the Securityholders. They have audited the financial statements in accordance
with generally accepted auditing standards in Canada to enable them to express their opinion on the financial
statements. Their report is included as an integral part of the financial statements.
Kevin GopaulHead, BMO Global Asset Management Canada BMO Investments Inc. December 5, 2017
R.J. SchauerChief Financial Officer BMO Mutual Funds December 5, 2017

www.bmo.com/mutualfunds and www.bmo.com/gam/ca
BMO Investments Inc.First Canadian Place, 43rd Floor, 100 King Street WestToronto, ON M5X 1A1 If you have any questions, please give us a call as follows:
BMO (M-bar roundel symbol) registered trademark, and BMO (M-bar roundel symbol) Mutual Funds are owned by Bank of Montreal, used under license. BMO Mutual Funds are offered by BMO Investments Inc., a financial services firm and separate legal entity from Bank of Montreal.
Independent AuditorPricewaterhouseCoopers LLPPwC Tower18 York Street, Suite 2600Toronto, Ontario M5J 0B2
• If you purchased BMO Mutual Funds through a BMO Bank of Montreal branch or BMO Online Banking, please call 1-800-665-7700.• If you purchased BMO Mutual Funds through a full-service or discount broker, please call 1-800-668-7327 or email [email protected].