bo deng department of mathematics unl iit, 14 feb. 2011 bdeng1
TRANSCRIPT

Bo DengDepartment of Mathematics
UNL
IIT, 14 Feb. 2011http://www.math.unl.edu/~bdeng1
Working Hypothesis
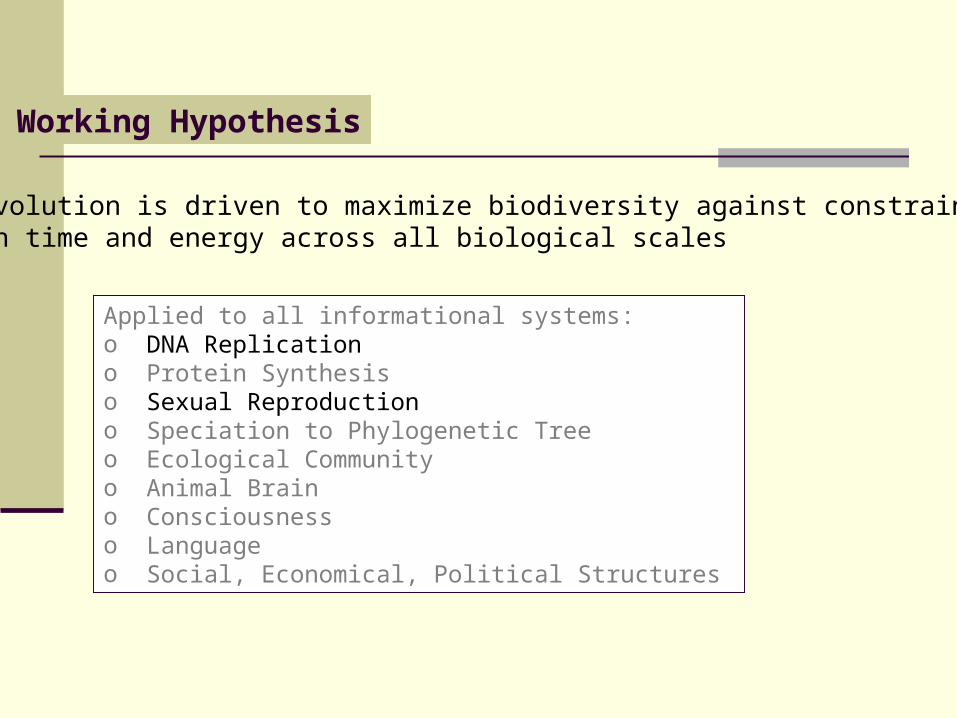
Evolution is driven to maximize biodiversity against constraints in time and energy across all biological scales
Applied to all informational systems: o DNA Replicationo Protein Synthesiso Sexual Reproductiono Speciation to Phylogenetic Treeo Ecological Communityo Animal Braino Consciousnesso Languageo Social, Economical, Political Structures
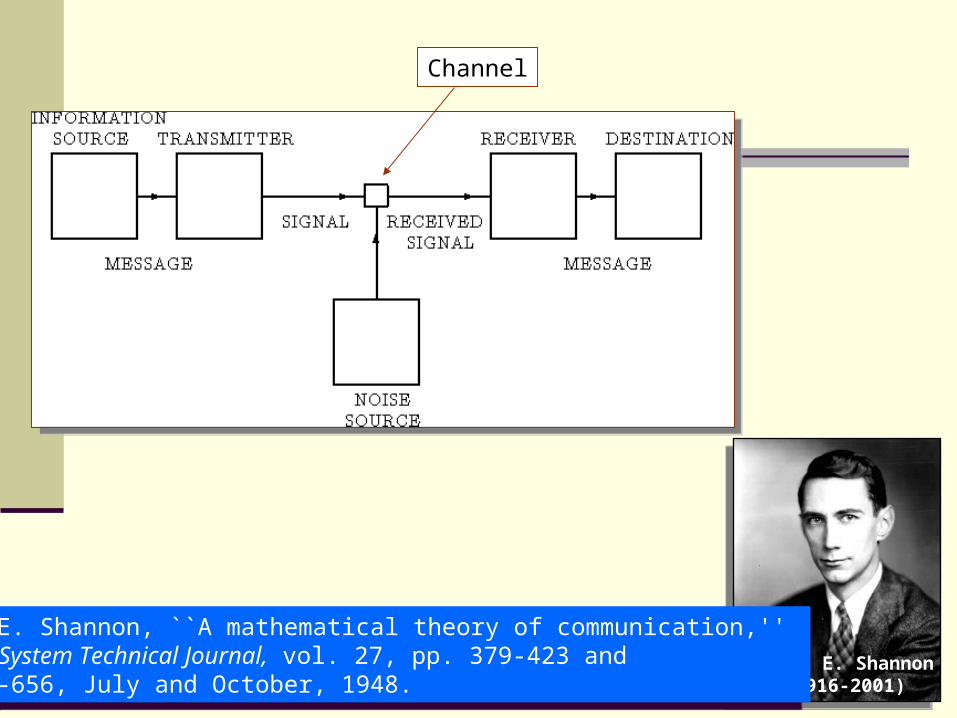
Claude E. Shannon (1916-2001)
C. E. Shannon, ``A mathematical theory of communication,'' Bell System Technical Journal, vol. 27, pp. 379-423 and 623-656, July and October, 1948.
C. E. Shannon, ``A mathematical theory of communication,'' Bell System Technical Journal, vol. 27, pp. 379-423 and 623-656, July and October, 1948.
Channel

Dial-up 2400 bps ~ 56Kbps
DSL 128 Kbps ~ 8 Mbps
Cable 512 Kbps ~ 20 Mbps
Satellite ~ 6 Mbps
Optic Fiber 45 Mbps ~ 150 Mbps
Transmission Speed Comparison
Internet
All about choices
What is Information? and What Matters the Most?
0 or 1 ……# of sequences of length log
2 n = # of choices n
Bit Unit:
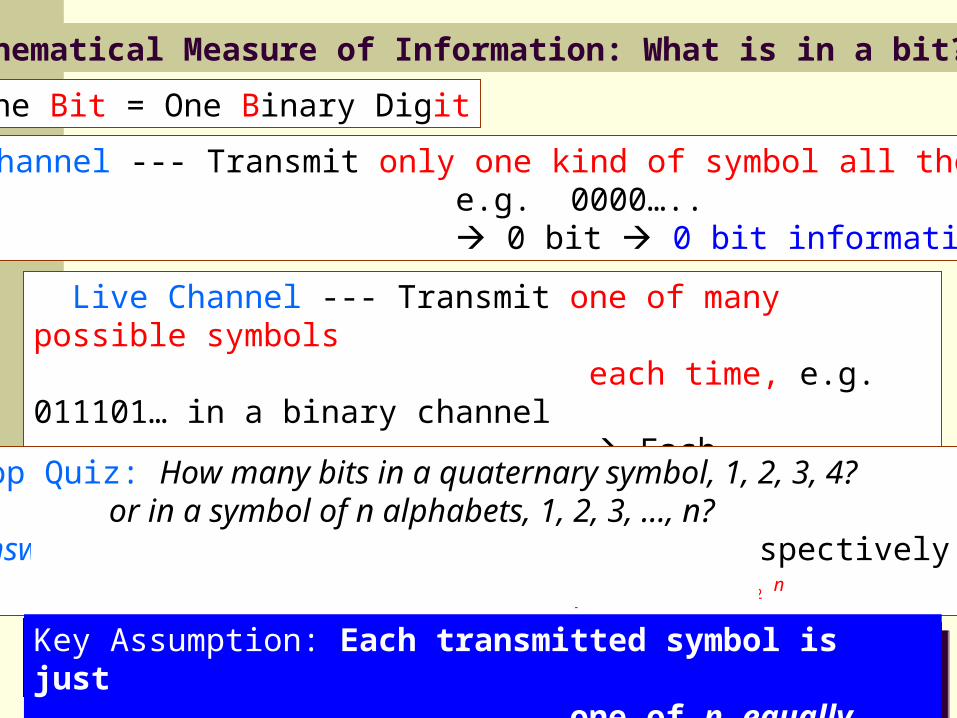
Mathematical Measure of Information: What is in a bit?
One Bit = One Binary Digit
Dead Channel --- Transmit only one kind of symbol all the times e.g. 0000….. 0 bit 0 bit information
Live Channel --- Transmit one of many possible symbols each time, e.g. 011101… in a binary channel Each transmitted symbol is either 0 or 1 Each symbol contains 1 bit informationPop Quiz: How many bits in a quaternary symbol, 1, 2, 3, 4? or in a symbol of n alphabets, 1, 2, 3, …, n?Answer: H4 = 2 bits, and Hn = log2 n bits respectively because 4 = 2 log
2 4, n = 2 log2 n
Ex: { a, b, c, d } = { 00, 01, 10, 11}
Ex: { a, b, c, d } = { 00, 01, 10, 11}
Key Assumption: Each transmitted symbol is just one of n equally probable choices
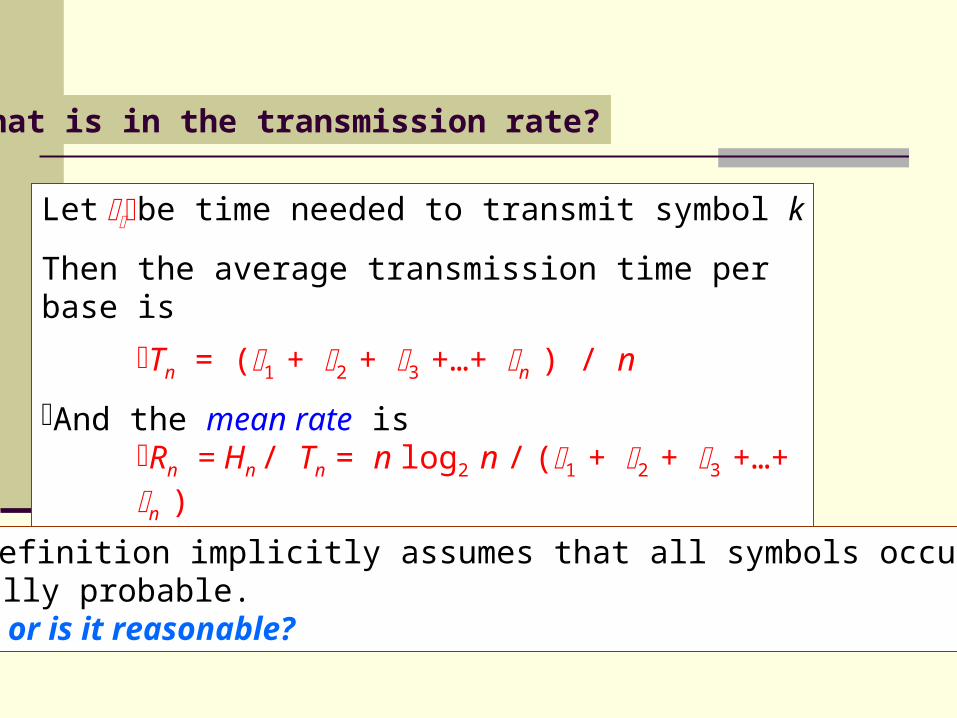
Let be time needed to transmit symbol k
Then the average transmission time per base is
Tn = (1 + 2 + 3 +…+ n ) / n
And the mean rate is Rn = Hn / Tn = n log2 n / (1 + 2 + 3 +…+ n )
What is in the transmission rate?
The definition implicitly assumes that all symbols occur equally probable. Why, or is it reasonable?
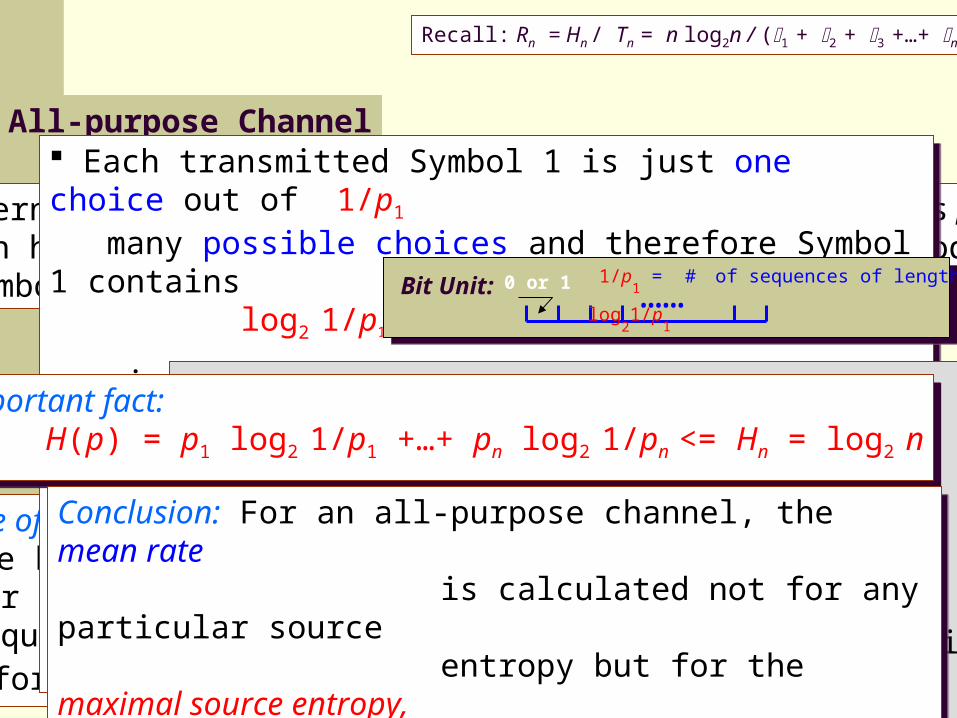
All-purpose Channel
Internet message types: video, audio, pictures, spams, …etc Each has different frequency distribution in the encoding symbols
Example of Possible Non-equiprobability: If we know all video files that have ever transmitted over the internet, then we can make an accurate frequency table: say p1 for Symbol 1, p2 for 2, etc, and pn for symbol n
Recall: Rn = Hn / Tn = n log2n / (1 + 2 + 3 +…+ n )
Equiprobability
Each transmitted Symbol 1 is just one choice out of 1/p1 many possible choices and therefore Symbol 1 contains
log2 1/p1 bits information
since 1/p1 = 2 log2 1/p
1
Similarly, Symbol k contains log2 1/pk bits information
The average bits per symbol for our video only source is H(p) = p1 log2 1/p1 +…+ pn log2 1/pn
Example: Pick a marble from a bag of 2 blue, and 5 read marbles
Probability for picking a blue marble:
pblue
= 2/7
Number of choices for each blue picked
1 / pblue
= 7/2 =3.5
Example: Pick a marble from a bag of 2 blue, and 5 read marbles
Probability for picking a blue marble:
pblue
= 2/7
Number of choices for each blue picked
1 / pblue
= 7/2 =3.5
Important fact: H(p) = p1 log2 1/p1 +…+ pn log2 1/pn <= Hn = log2 n
Important fact: H(p) = p1 log2 1/p1 +…+ pn log2 1/pn <= Hn = log2 n
Conclusion: For an all-purpose channel, the mean rate is calculated not for any particular source entropy but for the maximal source entropy, Hn , which is reached with equaprobability distribution of the transmitting symbols.
Conclusion: For an all-purpose channel, the mean rate is calculated not for any particular source entropy but for the maximal source entropy, Hn , which is reached with equaprobability distribution of the transmitting symbols.
0 or 1 …… 1/p
1 = # of sequences of length log
21/p
1 Bit Unit:
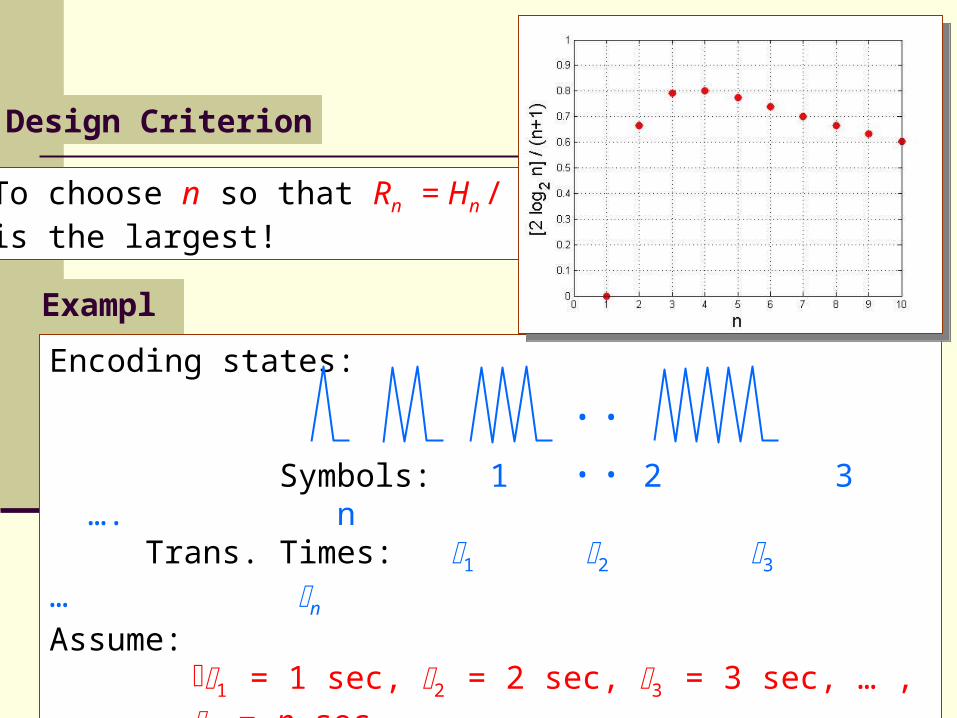
Design Criterion
To choose n so that Rn = Hn / Tn
is the largest!
Example
Encoding states:
Symbols: 1 2 3 …. n Trans. Times: 1 2 3 … n
Assume: 1 = 1 sec, 2 = 2 sec, 3 = 3 sec, … , n = n sec
Then Rn = Hn / Tn = n log2n / (1 + 2 + 3 +…+ n ) = 2 log2 n / (n+1)
....

http://www.mun.ca/biology/scarr/An11_01_DNA_replication.mov
James D. Watson (1928 -), Francis Crick (1916 - 2004), Molecular structure of nucleic acids, Nature, 171(1953), pp.737--738.
James D. Watson (1928 -), Francis Crick (1916 - 2004), Molecular structure of nucleic acids, Nature, 171(1953), pp.737--738.
DNA Replication

Fact: DNA replication is the same for all genomes Replication is a sequential process – one base a time
Observation: Each species genome is an information source Genome upon replication is a transmitted message
Conceptual Model:
DNA replication is an all-purpose channel
Questions: Why 4 bases: A, T , C , G?
Communication Model for DNA Replication
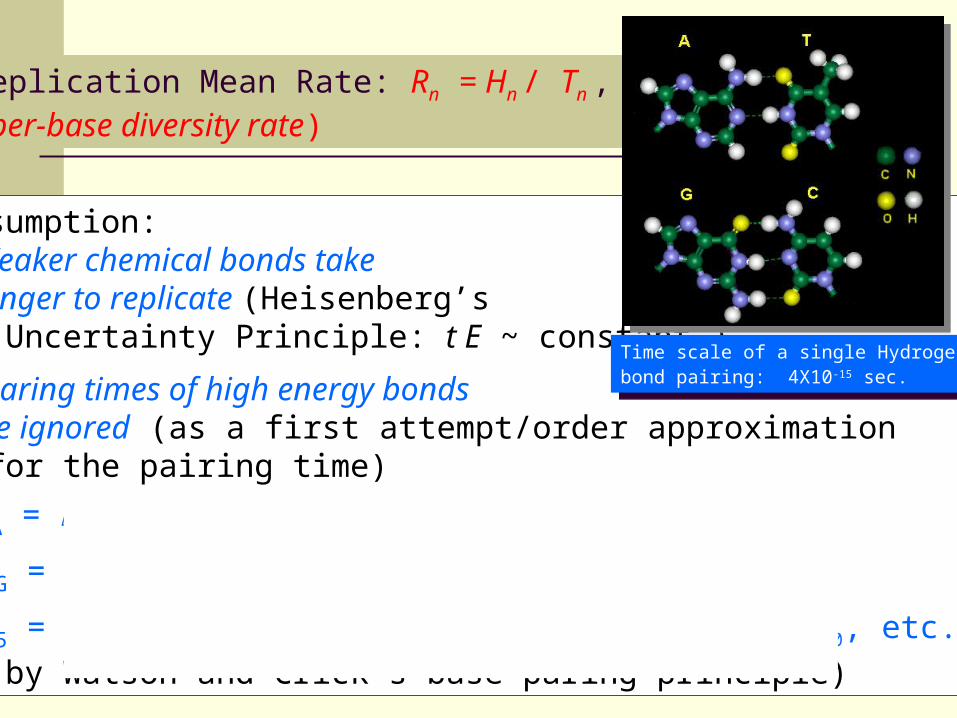
Replication Mean Rate: Rn = Hn / Tn , (per-base diversity rate)
Assumption: Weaker chemical bonds take longer to replicate (Heisenberg’s Uncertainty Principle: t E ~ constant )
Paring times of high energy bonds are ignored (as a first attempt/order approximation for the pairing time)A = T = pairing time of one H…O bond = t0
G = C = pairing time of two H…O bond = 2 t0
5 = 6 = pairing time of three H…O bond = 3 t0, etc.
(by Watson and Crick’s base paring principle)
Time scale of a single Hydrogen bond pairing: 4X10-15 sec.
Time scale of a single Hydrogen bond pairing: 4X10-15 sec.
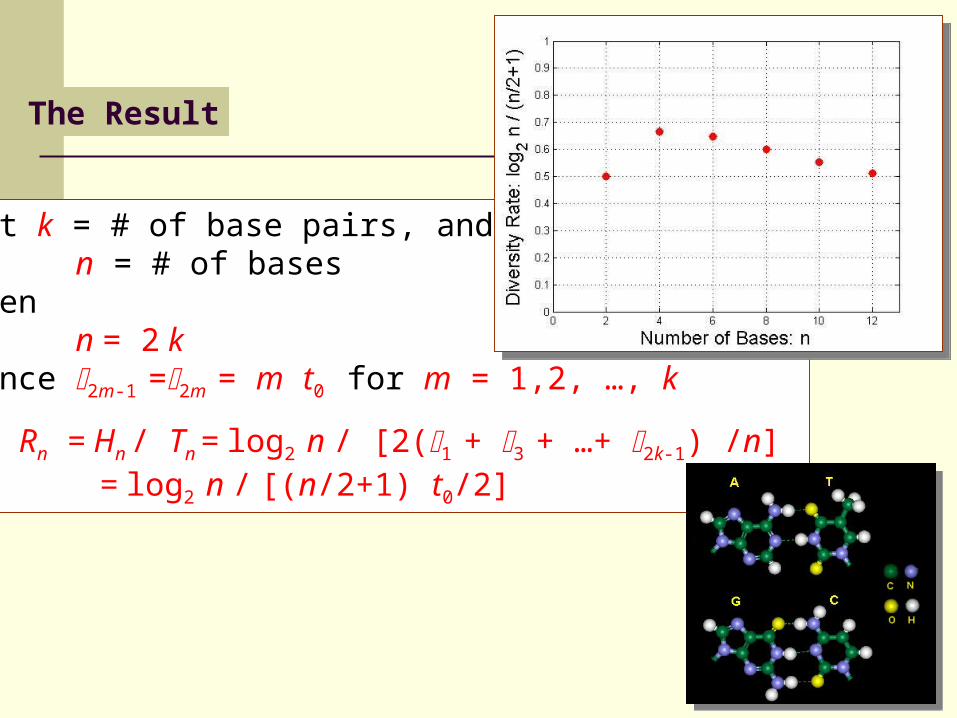
Let k = # of base pairs, and n = # of basesThen
n = 2 k Since 2m-1 =2m = m t0 for m = 1,2, …, k
Rn = Hn / Tn = log2 n / [2(1 + 3 + …+ 2k-1) /n]
= log2 n / [(n/2+1) t0/2]
The Result
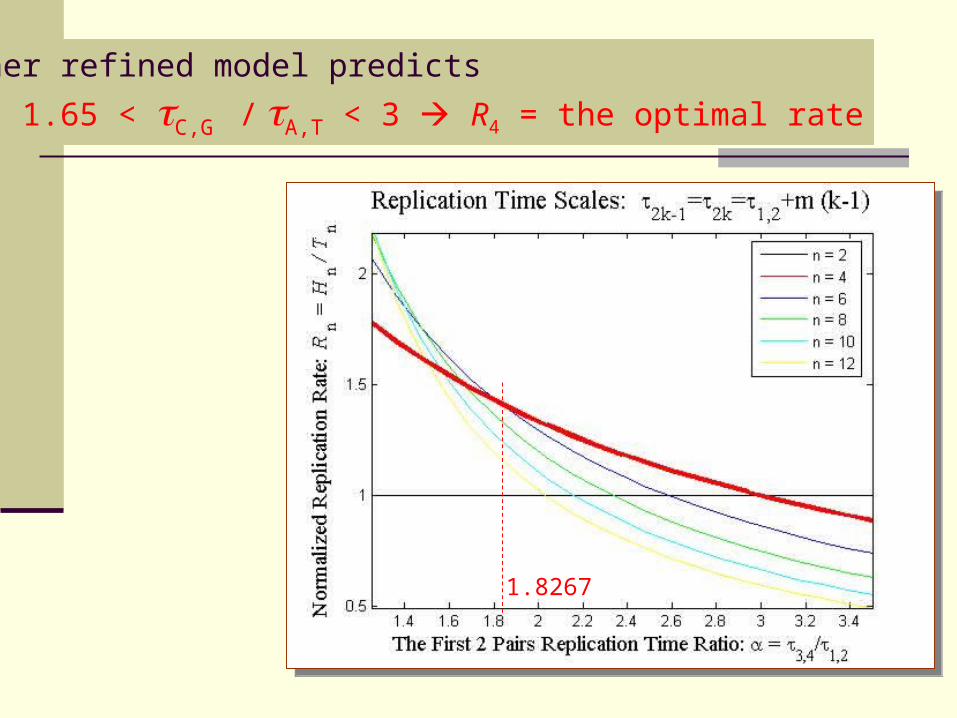
A further refined model predicts
1.65 < C,G / A,T < 3 R4 = the optimal rate
1.8267
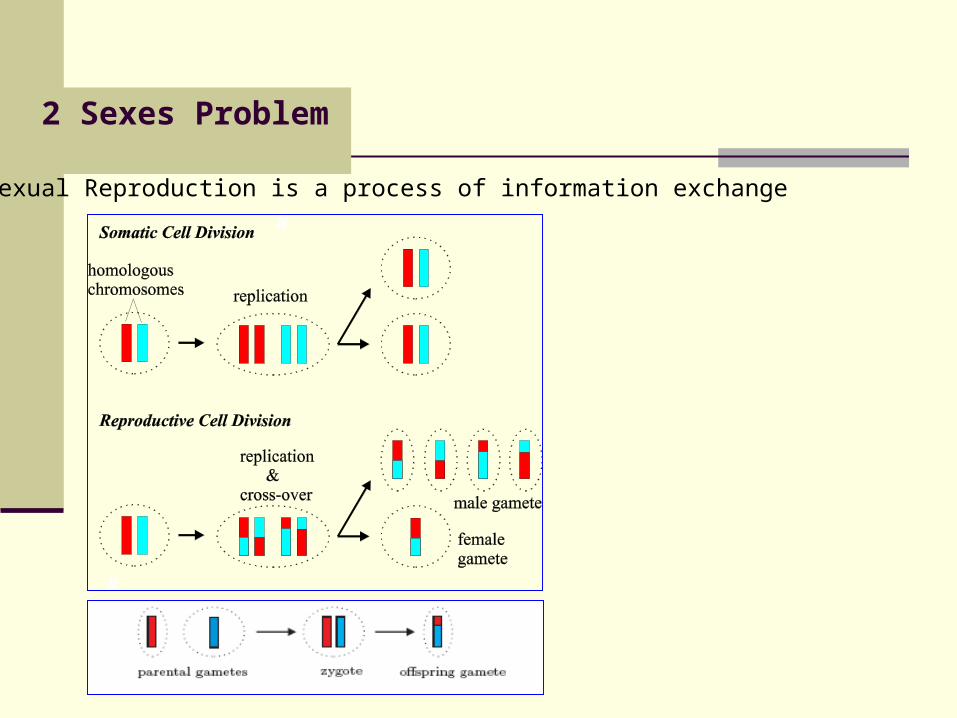
2 Sexes Problem
Sexual Reproduction is a process of information exchange

Reproduction Mean Ratio: Sn = Hn / En ,
Assumption: Information payoff per-crossover base for n sexes: Hn = log2 n
1:1 sex ratio with M members for each sex Cost to sexual reproduction in energy and time is inversely proportional to the probability of having a reproductive group of n members having exactly one sex each Reproductive group is formed by random encounter
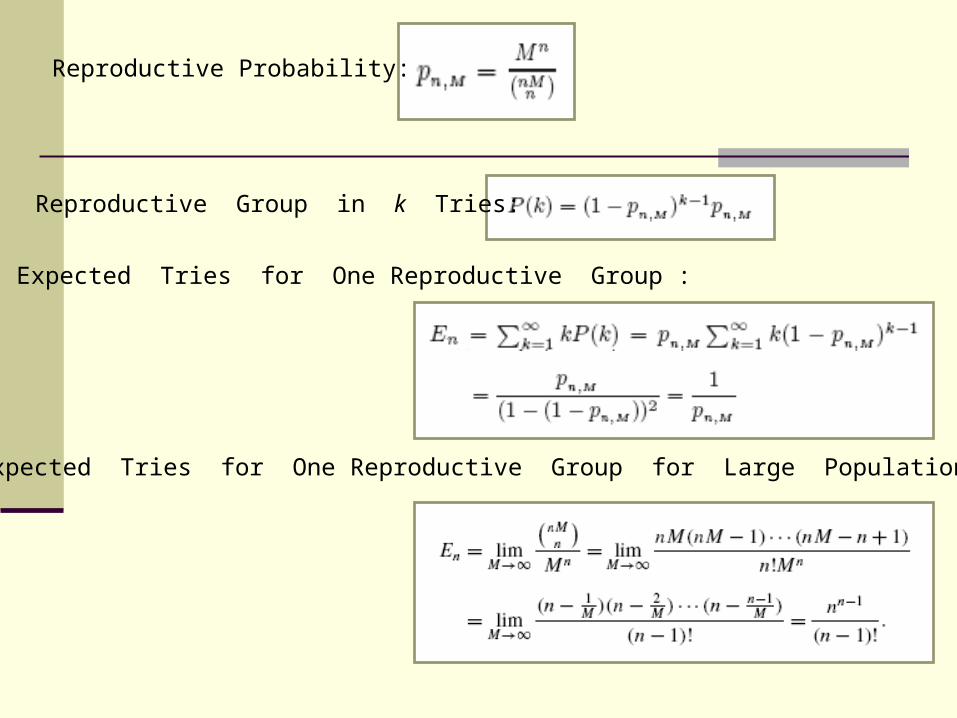
Reproductive Probability:
Reproductive Group in k Tries:
Expected Tries for One Reproductive Group :
Expected Tries for One Reproductive Group for Large Population :

The Result: Entropy-to-Cost Ratio: Sn = Hn / En ,
M = 10m
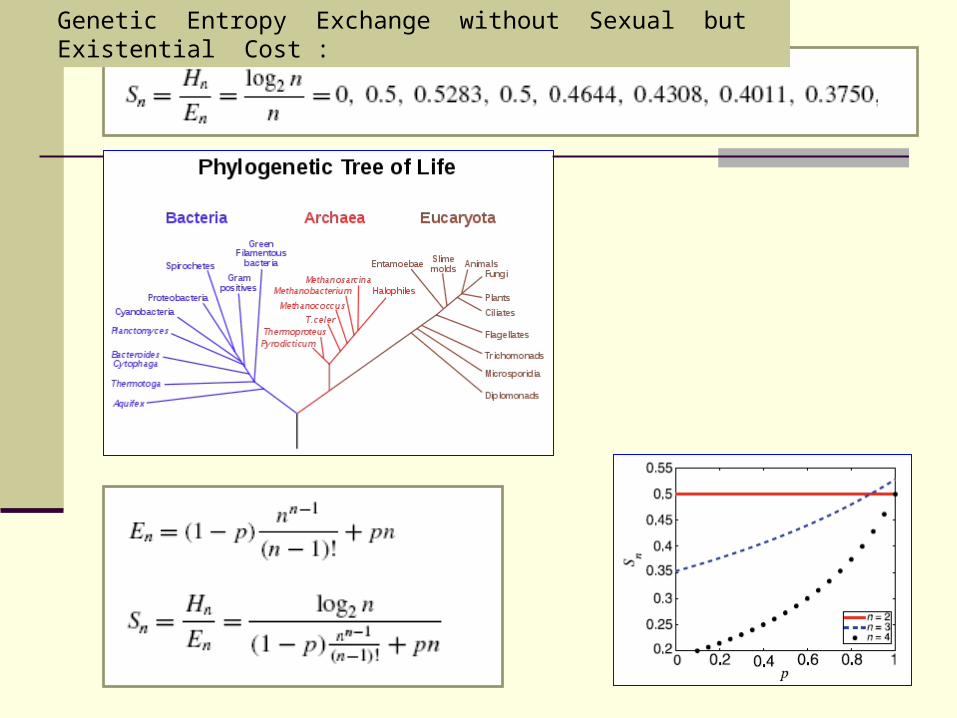
Genetic Entropy Exchange without Sexual but Existential Cost :
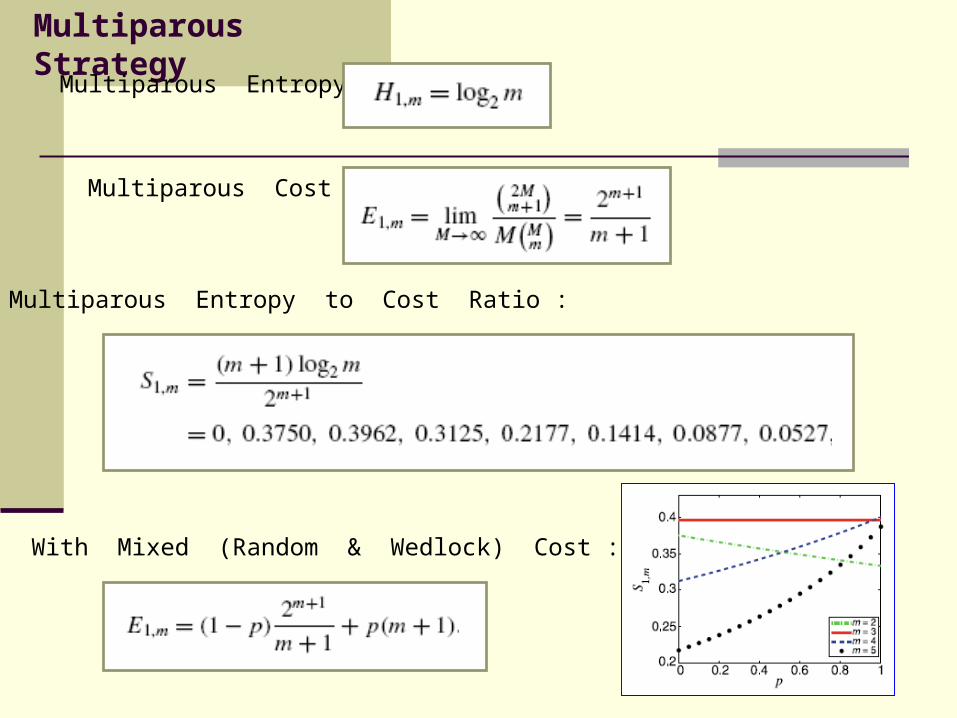
Multiparous Strategy
Multiparous Entropy:
Multiparous Cost :
Multiparous Entropy to Cost Ratio :
With Mixed (Random & Wedlock) Cost :
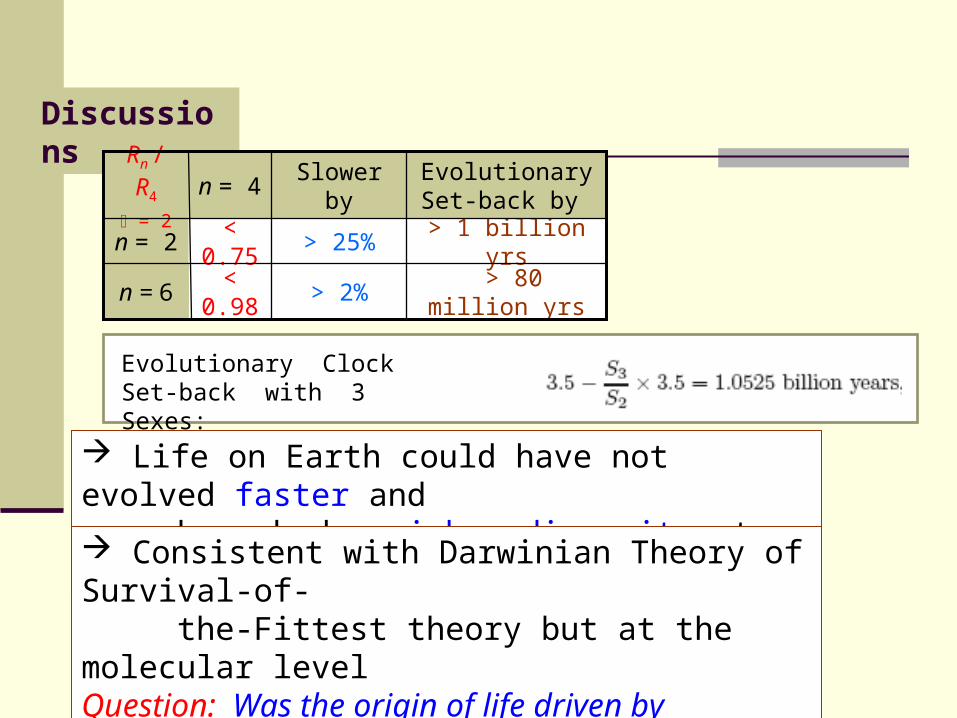
Discussions
> 80 million yrs> 2%< 0.98n = 6
> 1 billion yrs> 25%< 0.75n = 2
Evolutionary Set-back by
Slower byn = 4Rn / R4
= 2
Life on Earth could have not evolved faster and have had a richer diversity at the same time
Evolutionary Clock Set-back with 3 Sexes:
Consistent with Darwinian Theory of Survival-of- the-Fittest theory but at the molecular levelQuestion: Was the origin of life driven by informational selection?
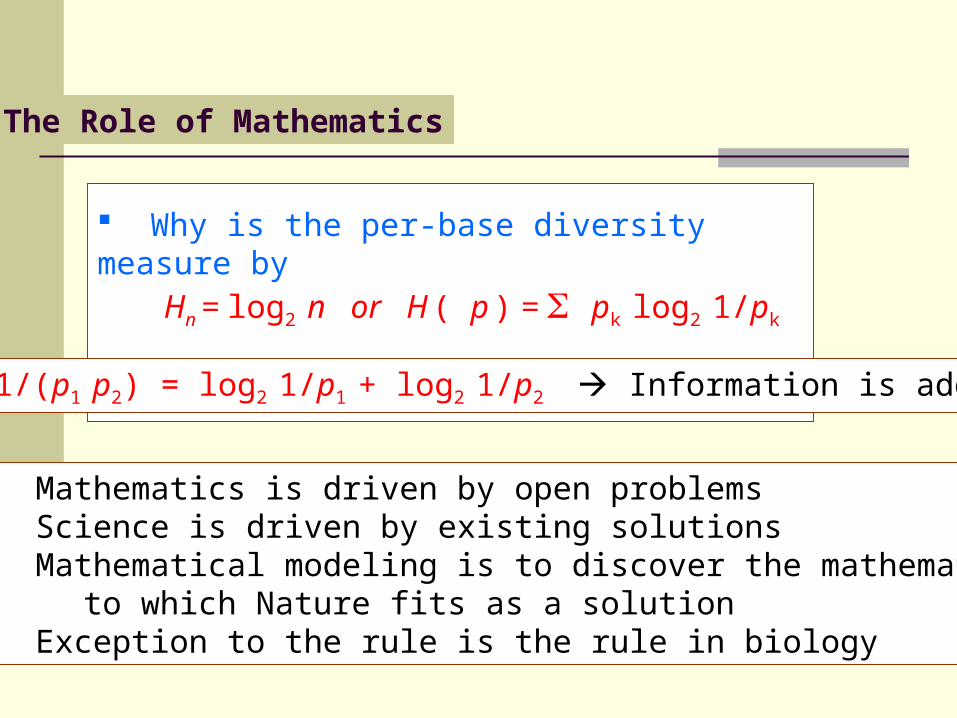
Why is the per-base diversity measure by Hn = log2 n or H ( p ) = pk log2 1/pk
log2 1/(p1 p2) = log2 1/p1 + log2 1/p2 Information is additive
The Role of Mathematics
Mathematics is driven by open problems Science is driven by existing solutions Mathematical modeling is to discover the mathematics to which Nature fits as a solution Exception to the rule is the rule in biology
Acknowledgements
Dr. Reg Garrett, Department of Biology, University of Virginia, regarding the GC transcription elongation problem
Dr. David Ussery, Center for Biological Sequence Analysis, Technical University of Denmark, on most base frequency data
Dr. Daniel Smith, Department of Biology, Oregon State University, regarding the base frequencies of P. ubique
Dr. Tony Joern, Department of Biology, UNL, Kansas State University
Dr. Etsuko Moriyama, the Beadle Center for Genetics Research, University of Nebraska-Lincoln
Dr. Hideaki Moriyama, Dr. Xiao-Cheng Zhen, Department of Chemistry, University of Nebraska-Lincoln
Irakli Loladze, David Logan, Department of Mathematics, UNL
The show of life is on your DNA channel
We are consumers of reproductive entropy

Genome
Base Frequency
A T G C
S. coelicolor 13.9 14.0 36.1 36.0 0.1% -44.2%
E. coli K-12 24.6 24.6 25.4 25.4 0.0% -1.6%
E. coli O15:H7 24.8 24.7 25.2 25.2 0.1% -1.0%
Human* 29.4 29.7 20.5 20.4 0.3% 18.2%
P.ubique 35.3 35.0 14.9 14.8 0.3% 40.6%
W. glossinidia 38.8 38.7 11.2 11.3 0.1% 55.0%
d
)()( CGTA pppp
|}| |,|max{ CGTA ppppd
* Base frequency for the chromosome 14 which has the largest d.
Genome
Base Frequency
A T G C
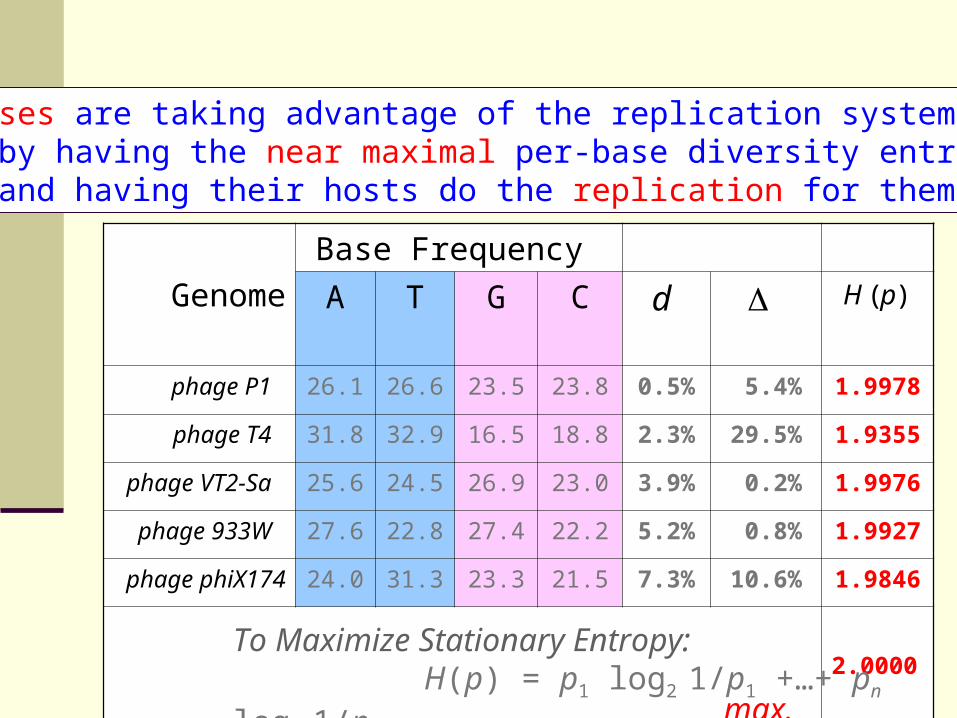
phage P1 26.1 26.6 23.5 23.8 0.5% 5.4% 1.9978
phage T4 31.8 32.9 16.5 18.8 2.3% 29.5% 1.9355
phage VT2-Sa 25.6 24.5 26.9 23.0 3.9% 0.2% 1.9976
phage 933W 27.6 22.8 27.4 22.2 5.2% 0.8% 1.9927
phage phiX174 24.0 31.3 23.3 21.5 7.3% 10.6% 1.9846
max. 2.0000
d )( pH
Viruses are taking advantage of the replication system by having the near maximal per-base diversity entropy and having their hosts do the replication for them.
To Maximize Stationary Entropy: H(p) = p1 log2 1/p1 +…+ pn log2 1/pn

Genome
Base Frequency
A T G C
S. coelicolor 13.9 14.0 36.1 36.0 0.1% -44.2% 1.8538 1.1623
E. coli K-12 24.6 24.6 25.4 25.4 0.0% -1.6% 1.9998 1.4093
E. coli O15:H7 24.8 24.7 25.2 25.2 0.1% -1.0% 1.9999 1.4122
Human* 29.4 29.7 20.5 20.4 0.3% 18.2% 1.9834 1.4005
P.ubique 35.3 35.0 14.9 14.8 0.3% 40.6% 1.8774 1.5081
W. glossinidia 38.8 38.7 11.2 11.3 0.1% 55.0% 1.7688 1.4921
d
8267.1 ** * Base frequency for the chromosome 14 which has the largest d.
)( pH**
, )( pRTA
1.82671.8267
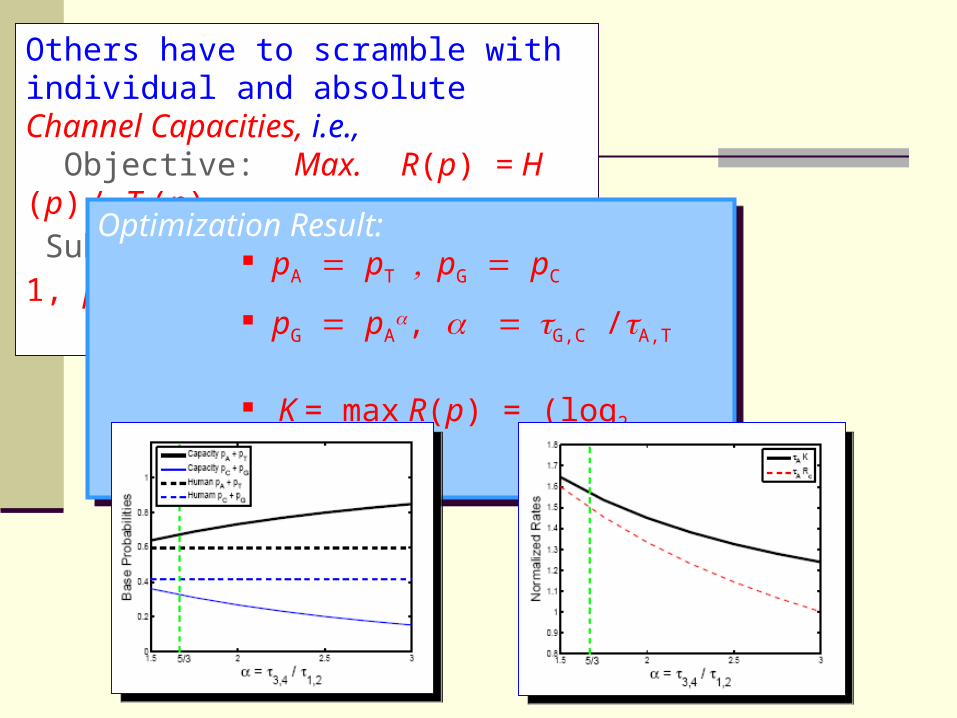
Others have to scramble with individual and absolute Channel Capacities, i.e., Objective: Max. R(p) = H (p) / T (p) Subject to: p1 + p2 + …+ pn = 1, pk > 0
Optimization Result:
pA pTpG pC
pG pA, G,C /A,T
K = max R(p) = (log2 1/pA) /A,T
Optimization Result:
pA pTpG pC
pG pA, G,C /A,T
K = max R(p) = (log2 1/pA) /A,T