boa merril lynch corporate days - probe stations€¦ · microsoft powerpoint - boa...
TRANSCRIPT
MPI Corporation.
(6223.TT)
BoA Merril Lynch Corporate Days
1
Corporation
The information herein contains forward-looking statements. We have based
these forward-looking statements on our current expectations and projections
about future events. Although we believe that these expectations and projections
are reasonable, such forward-looking statements are inherently subject to risks,
uncertainties and assumptions about us, including, among other things: the
intensely competitive Semi-conductor, and LED industries and markets;
Cyclical nature of the semiconductor industry; Risks associated with global
business activities; General economic and political conditions. All financial
figures discussed herein are prepared pursuant to ROC GAAP on an un-audited
unconsolidated basis. All audited figures will be publicly announced upon the
completion of our audited process.
2
Safe Harbor Notice
Corporation
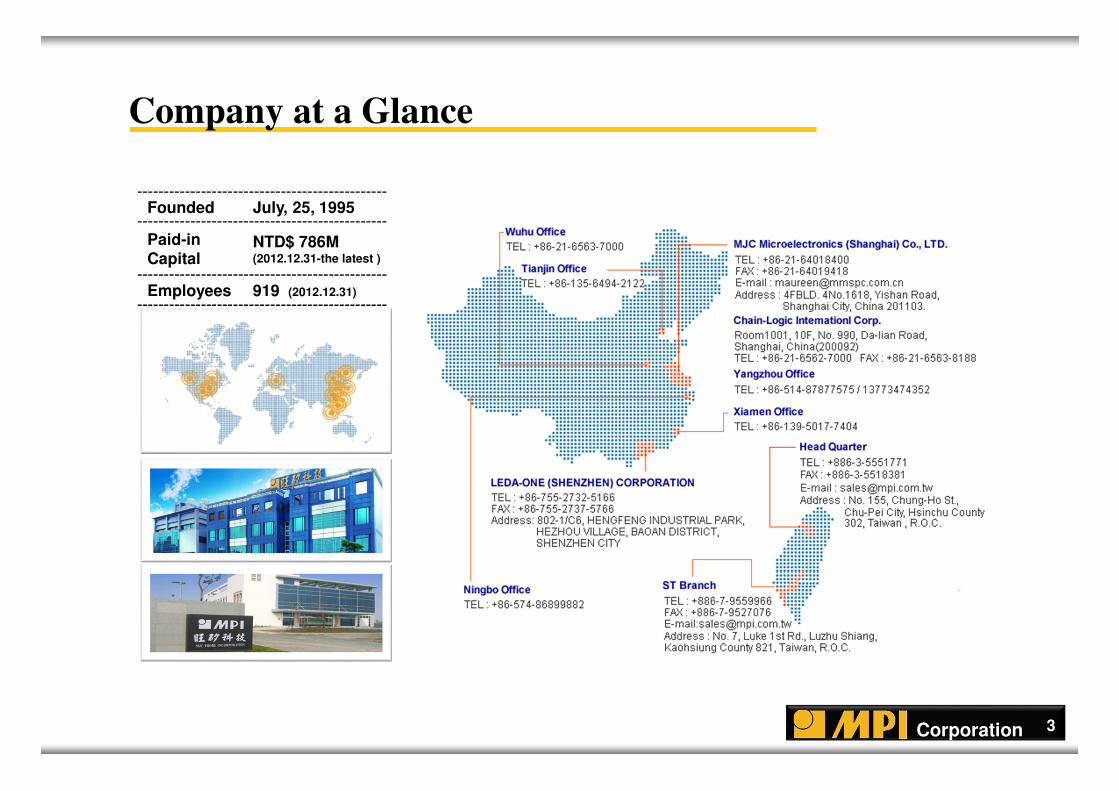
Company at a Glance
3
Founded July, 25, 1995
Paid-in Capital
NTD$ 786M (2012.12.31-the latest )
Employees 919 (2012.12.31)
Corporation
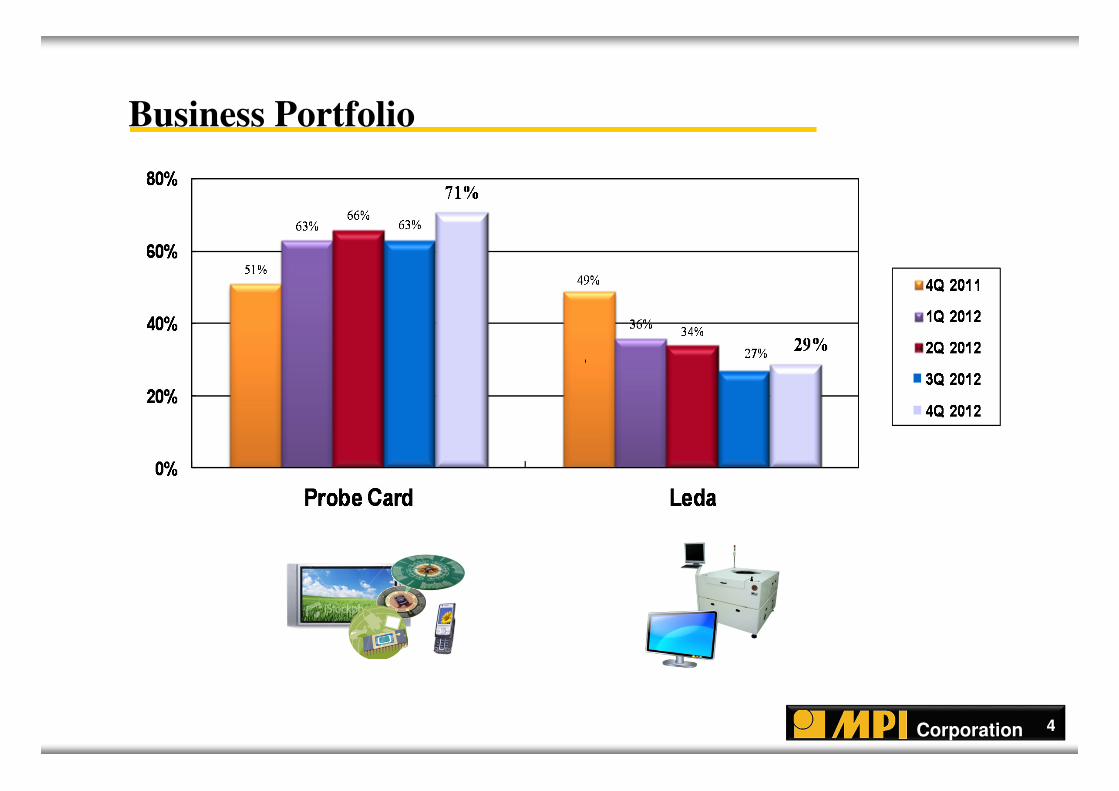
Business Portfolio
4
Corporation
1,001
14379
891 64
2,362
452
131
11
162
461
1,7491,645
131
18
158 126
1,412
737
142
22
319
47
0
500
1,000
1,500
2,000
2,500
Taiwan China Sigapore EU USA RoW
2009
2010
2011
2012
5
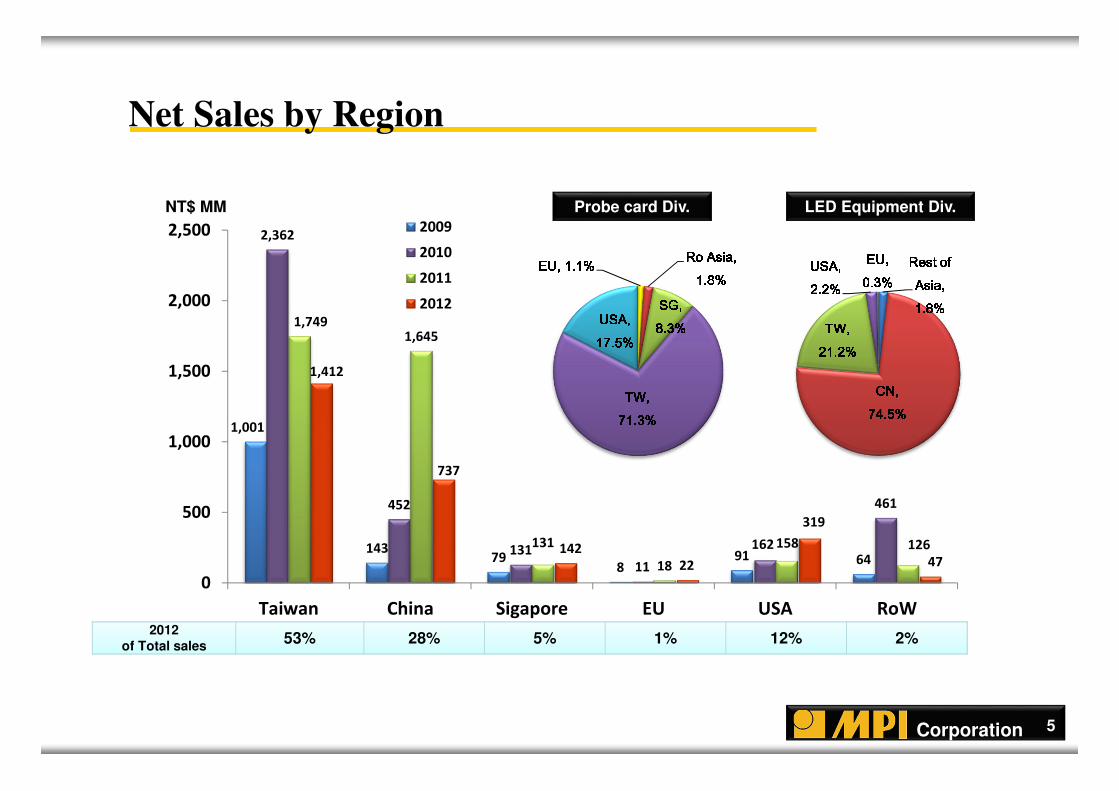
Net Sales by Region
Probe card Div. LED Equipment Div.NT$ MM
2012 of Total sales
53% 28% 5% 1% 12% 2%
Rest of Rest of Rest of Rest of Asia, Asia, Asia, Asia, 1.8%1.8%1.8%1.8%CN, CN, CN, CN, 74.5%74.5%74.5%74.5%
TW, TW, TW, TW, 21.2%21.2%21.2%21.2%USA, USA, USA, USA, 2.2%2.2%2.2%2.2% EU, EU, EU, EU, 0.3%0.3%0.3%0.3%EU, 1.1%EU, 1.1%EU, 1.1%EU, 1.1% Ro Ro Ro Ro Asia, Asia, Asia, Asia, 1.8%1.8%1.8%1.8%SG, SG, SG, SG, 8.38.38.38.3%%%%TW, TW, TW, TW, 71.3%71.3%71.3%71.3%
USA, USA, USA, USA, 17.5%17.5%17.5%17.5%
Corporation 6
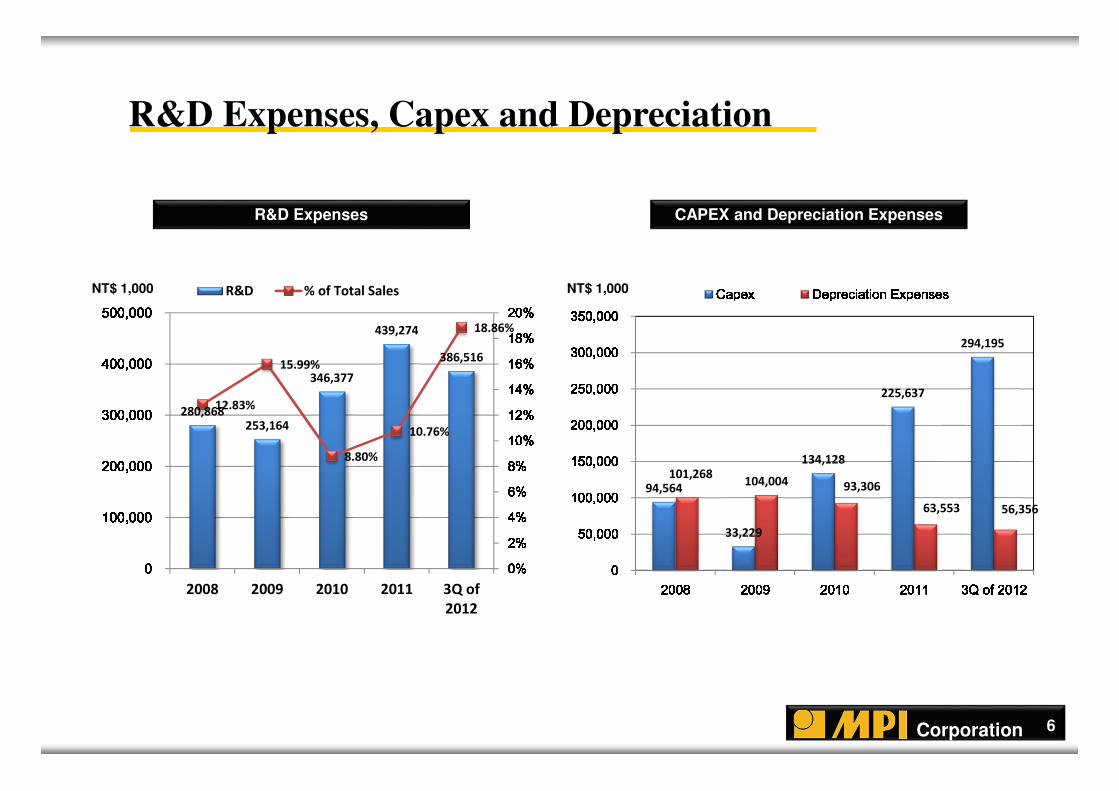
R&D Expenses, Capex and Depreciation
280,868 253,164
346,377
439,274
386,516
12.83%
15.99%
8.80%
10.76%
18.86%
0%0%0%0%2%2%2%2%4%4%4%4%6%6%6%6%8%8%8%8%10%10%10%10%12%12%12%12%14%14%14%14%16%16%16%16%18%18%18%18%20%20%20%20%
0000100,000100,000100,000100,000200,000200,000200,000200,000300,000300,000300,000300,000400,000400,000400,000400,000500,000500,000500,000500,000
2008 2009 2010 2011 3Q of
2012
R&D % of Total Sales
94,564
33,229
134,128
225,637
294,195
101,268 104,004 93,306
63,553 56,356 000050,00050,00050,00050,000100,000100,000100,000100,000150,000150,000150,000150,000200,000200,000200,000200,000250,000250,000250,000250,000300,000300,000300,000300,000350,000350,000350,000350,000
2008200820082008 2009200920092009 2010201020102010 2011201120112011 3Q of 20123Q of 20123Q of 20123Q of 2012
CapexCapexCapexCapex Depreciation ExpensesDepreciation ExpensesDepreciation ExpensesDepreciation ExpensesCAPEX and Depreciation ExpensesR&D Expenses
NT$ 1,000 NT$ 1,000

Probe Card
7
Corporation 8
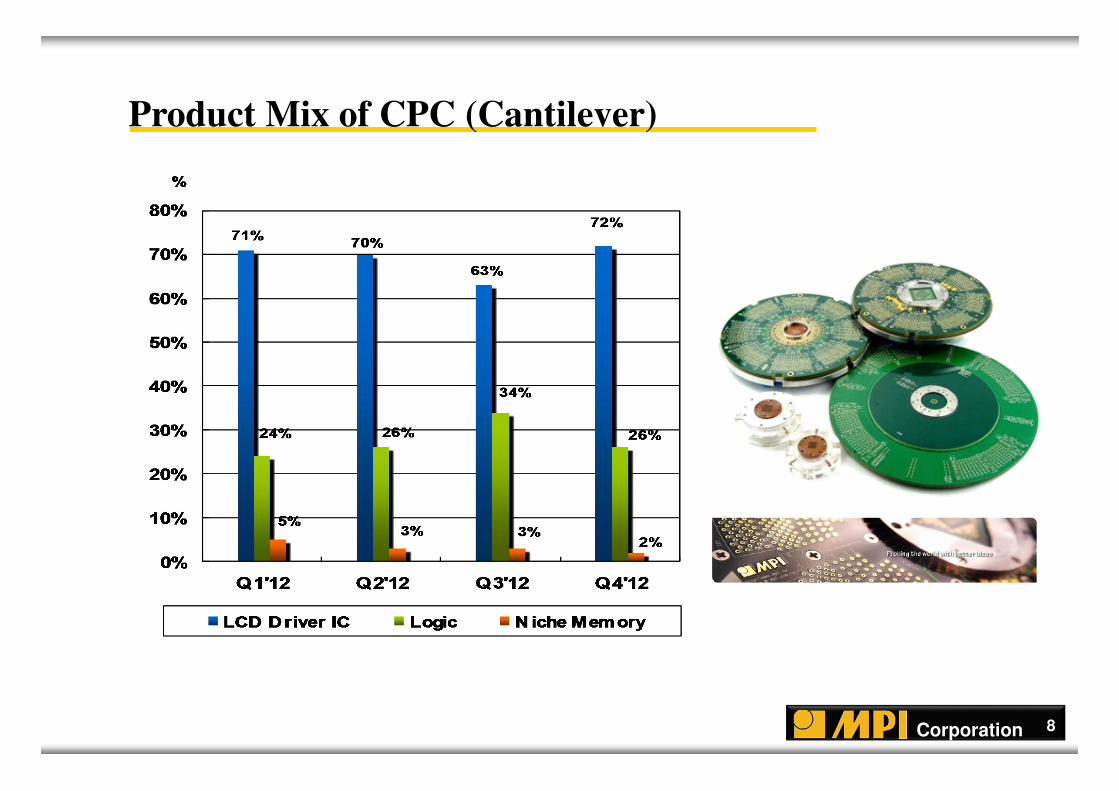
Product Mix of CPC (Cantilever)
Corporation
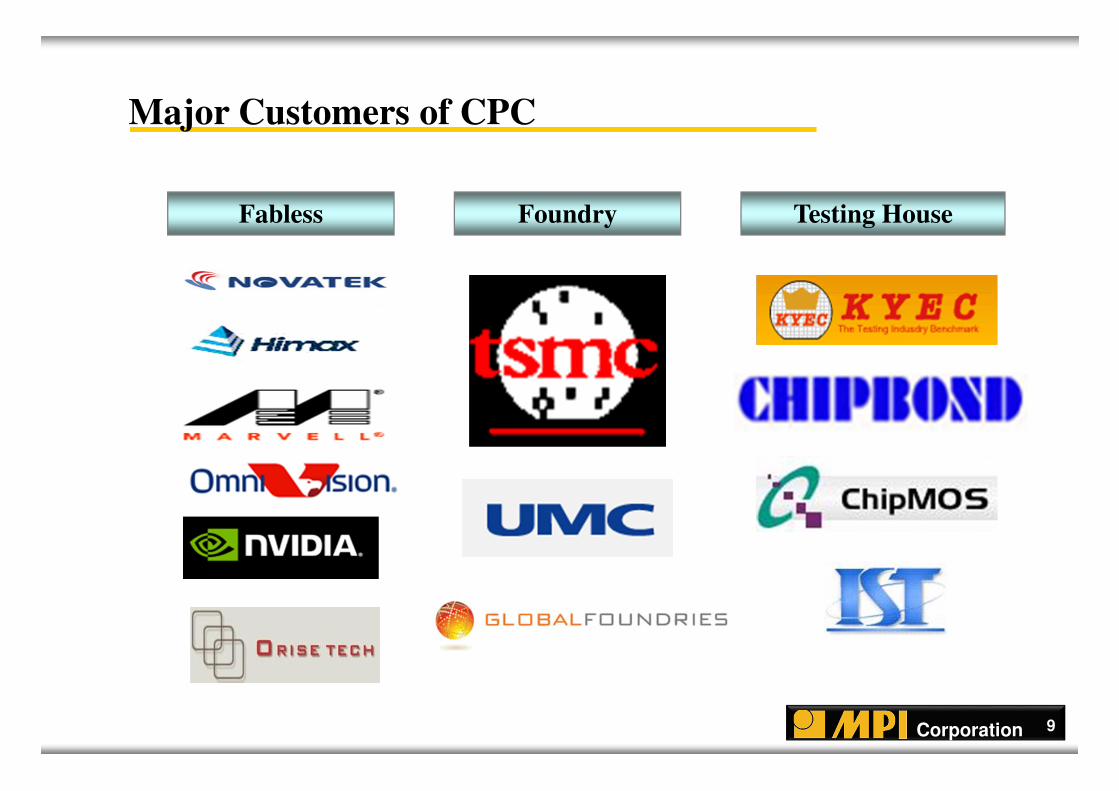
Major Customers of CPC
Fabless Foundry Testing House
9
Corporation
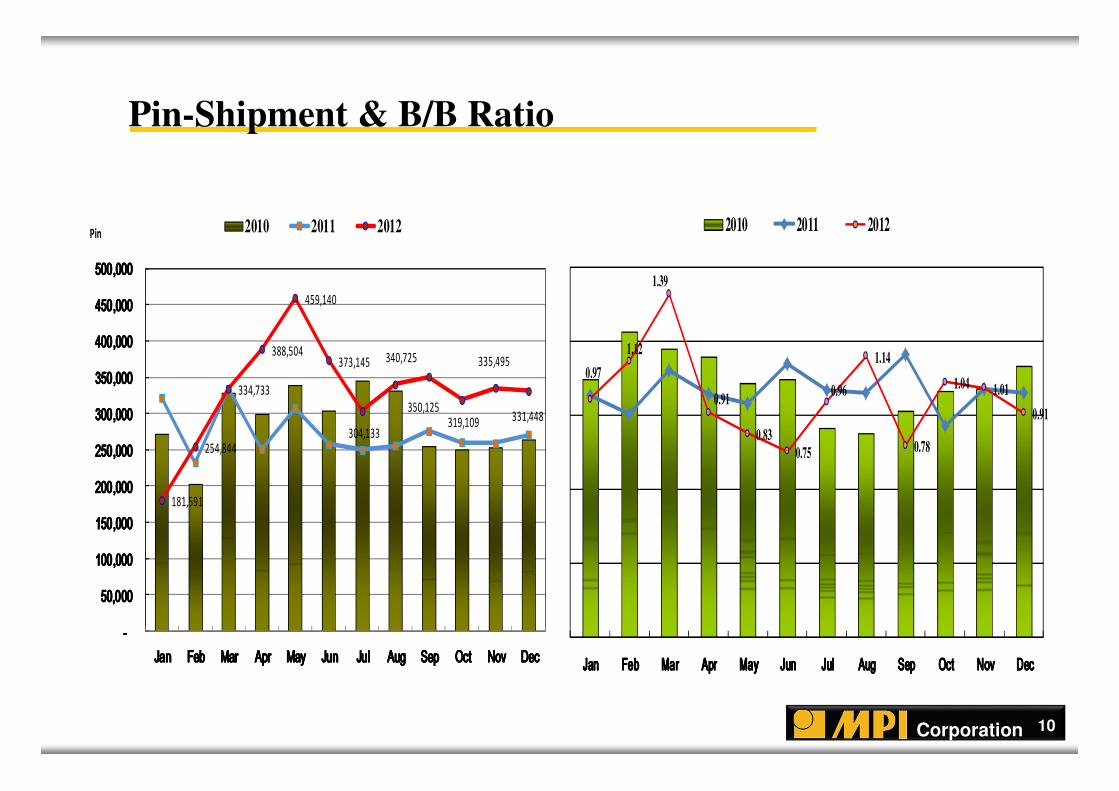
181,591
254,844
334,733
388,504
459,140
373,145
304,133
340,725
350,125
319,109
335,495
331,448
- - - - 50,000 50,000 50,000 50,000
100,000 100,000 100,000 100,000 150,000 150,000 150,000 150,000 200,000 200,000 200,000 200,000 250,000 250,000 250,000 250,000 300,000 300,000 300,000 300,000 350,000 350,000 350,000 350,000 400,000 400,000 400,000 400,000 450,000 450,000 450,000 450,000 500,000 500,000 500,000 500,000
JanJanJanJan FebFebFebFeb MarMarMarMar AprAprAprApr MayMayMayMay JunJunJunJun JulJulJulJul AugAugAugAug SepSepSepSep OctOctOctOct NovNovNovNov DecDecDecDec
Pin 2010 2011 2012
10
Pin-Shipment & B/B Ratio
0.97
1.12
1.39
0.91
0.83 0.75
0.96
1.14
0.78
1.04 1.01
0.91
JanJanJanJan FebFebFebFeb MarMarMarMar AprAprAprApr MayMayMayMay JunJunJunJun JulJulJulJul AugAugAugAug SepSepSepSep OctOctOctOct NovNovNovNov DecDecDecDec
2010 2011 2012
Corporation 11
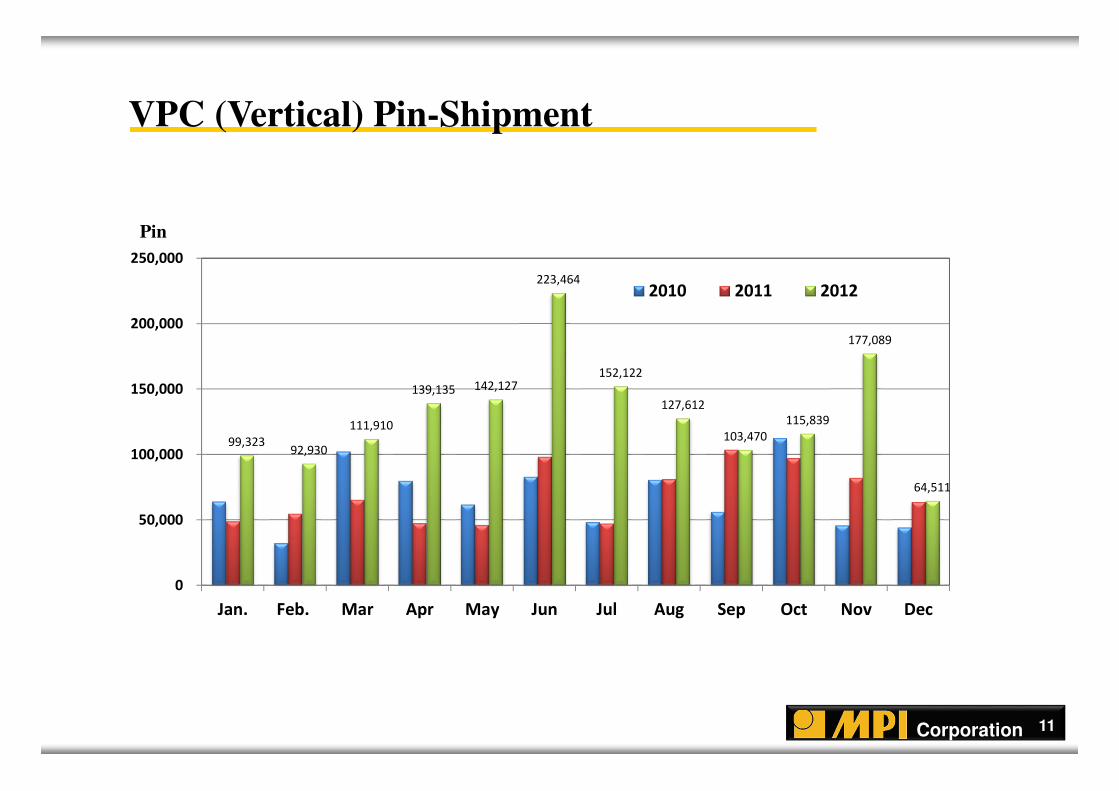
VPC (Vertical) Pin-Shipment
99,323 92,930
111,910
139,135 142,127
223,464
152,122
127,612
103,470
115,839
177,089
64,511
0
50,000
100,000
150,000
200,000
250,000
Jan. Feb. Mar Apr May Jun Jul Aug Sep Oct Nov Dec
2010 2011 2012
Pin
Corporation
Major Customers of VPC
12
Corporation 13
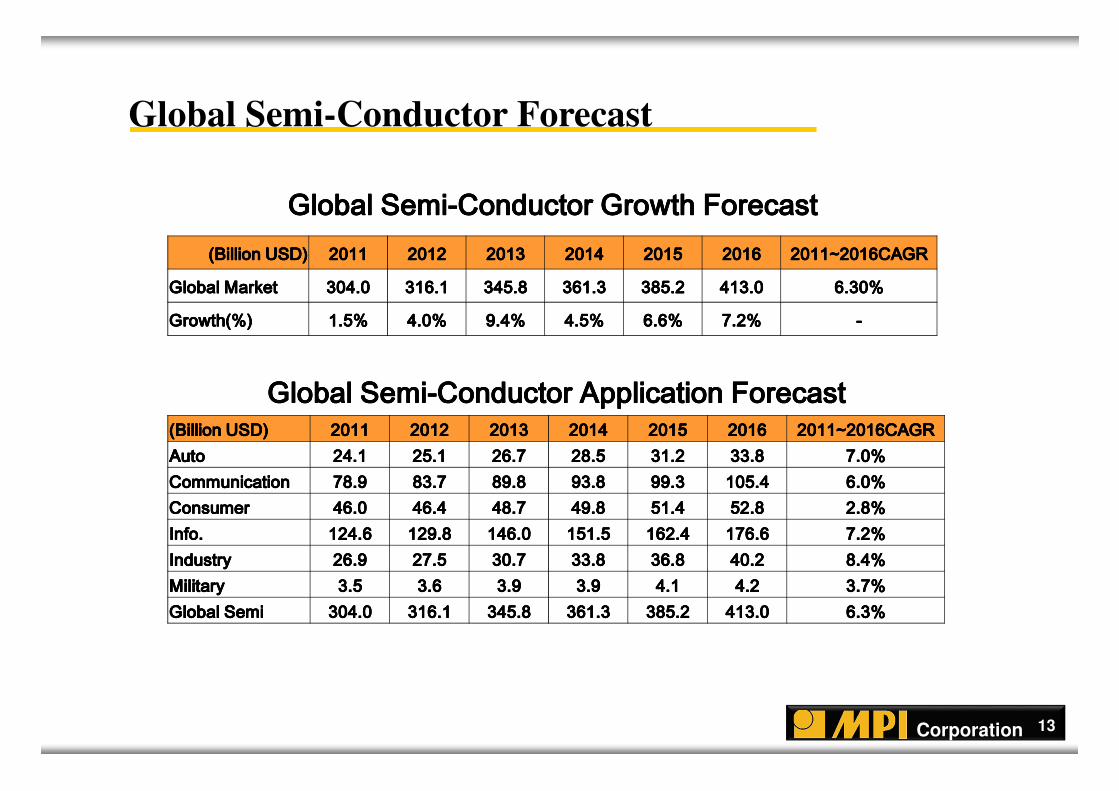
Global Semi-Conductor Forecast
Global SemiGlobal SemiGlobal SemiGlobal Semi----Conductor Growth ForecastConductor Growth ForecastConductor Growth ForecastConductor Growth Forecast(Billion USD)(Billion USD)(Billion USD)(Billion USD) 2011201120112011 2012201220122012 2013201320132013 2014201420142014 2015201520152015 2016201620162016 2011~2016CAGR2011~2016CAGR2011~2016CAGR2011~2016CAGR
Global MarketGlobal MarketGlobal MarketGlobal Market 304.0 304.0 304.0 304.0 316.1 316.1 316.1 316.1 345.8 345.8 345.8 345.8 361.3 361.3 361.3 361.3 385.2 385.2 385.2 385.2 413.0 413.0 413.0 413.0 6.30%6.30%6.30%6.30%Growth(%)Growth(%)Growth(%)Growth(%) 1.5%1.5%1.5%1.5% 4.0%4.0%4.0%4.0% 9.4%9.4%9.4%9.4% 4.5%4.5%4.5%4.5% 6.6%6.6%6.6%6.6% 7.2%7.2%7.2%7.2% ----
Global SemiGlobal SemiGlobal SemiGlobal Semi----Conductor Application ForecastConductor Application ForecastConductor Application ForecastConductor Application Forecast(Billion USD)(Billion USD)(Billion USD)(Billion USD) 2011201120112011 2012201220122012 2013201320132013 2014201420142014 2015201520152015 2016201620162016 2011~2016CAGR2011~2016CAGR2011~2016CAGR2011~2016CAGRAutoAutoAutoAuto 24.1 24.1 24.1 24.1 25.1 25.1 25.1 25.1 26.7 26.7 26.7 26.7 28.5 28.5 28.5 28.5 31.2 31.2 31.2 31.2 33.8 33.8 33.8 33.8 7.0%7.0%7.0%7.0%CommunicationCommunicationCommunicationCommunication 78.9 78.9 78.9 78.9 83.7 83.7 83.7 83.7 89.8 89.8 89.8 89.8 93.8 93.8 93.8 93.8 99.3 99.3 99.3 99.3 105.4 105.4 105.4 105.4 6.0%6.0%6.0%6.0%ConsumerConsumerConsumerConsumer 46.0 46.0 46.0 46.0 46.4 46.4 46.4 46.4 48.7 48.7 48.7 48.7 49.8 49.8 49.8 49.8 51.4 51.4 51.4 51.4 52.8 52.8 52.8 52.8 2.8%2.8%2.8%2.8%Info.Info.Info.Info. 124.6 124.6 124.6 124.6 129.8 129.8 129.8 129.8 146.0 146.0 146.0 146.0 151.5 151.5 151.5 151.5 162.4 162.4 162.4 162.4 176.6 176.6 176.6 176.6 7.2%7.2%7.2%7.2%IndustryIndustryIndustryIndustry 26.9 26.9 26.9 26.9 27.5 27.5 27.5 27.5 30.7 30.7 30.7 30.7 33.8 33.8 33.8 33.8 36.8 36.8 36.8 36.8 40.2 40.2 40.2 40.2 8.4%8.4%8.4%8.4%MilitaryMilitaryMilitaryMilitary 3.5 3.5 3.5 3.5 3.6 3.6 3.6 3.6 3.9 3.9 3.9 3.9 3.9 3.9 3.9 3.9 4.1 4.1 4.1 4.1 4.2 4.2 4.2 4.2 3.7%3.7%3.7%3.7%Global SemiGlobal SemiGlobal SemiGlobal Semi 304.0 304.0 304.0 304.0 316.1 316.1 316.1 316.1 345.8 345.8 345.8 345.8 361.3 361.3 361.3 361.3 385.2 385.2 385.2 385.2 413.0 413.0 413.0 413.0 6.3%6.3%6.3%6.3%
LED
14
Corporation
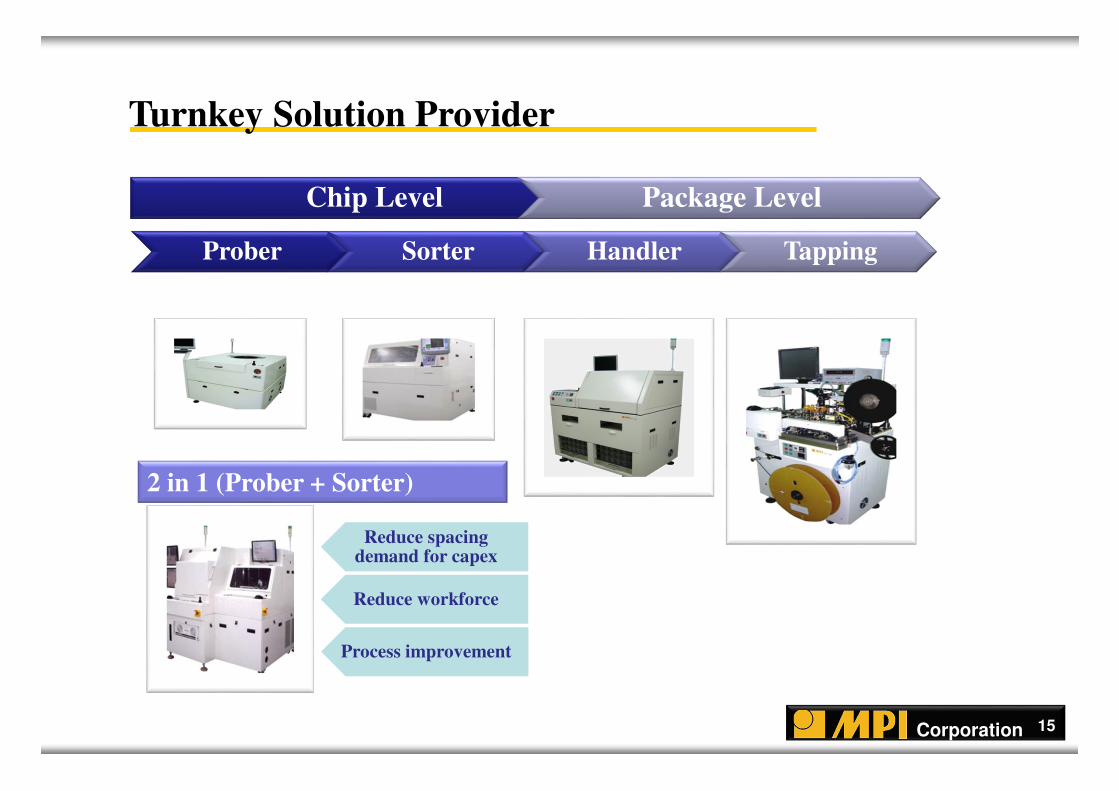
Turnkey Solution Provider
15
Prober Sorter Handler Tapping
Chip Level Package Level
2 in 1 (Prober + Sorter)
Reduce spacing demand for capex
Reduce workforce
Process improvement
Corporation 16
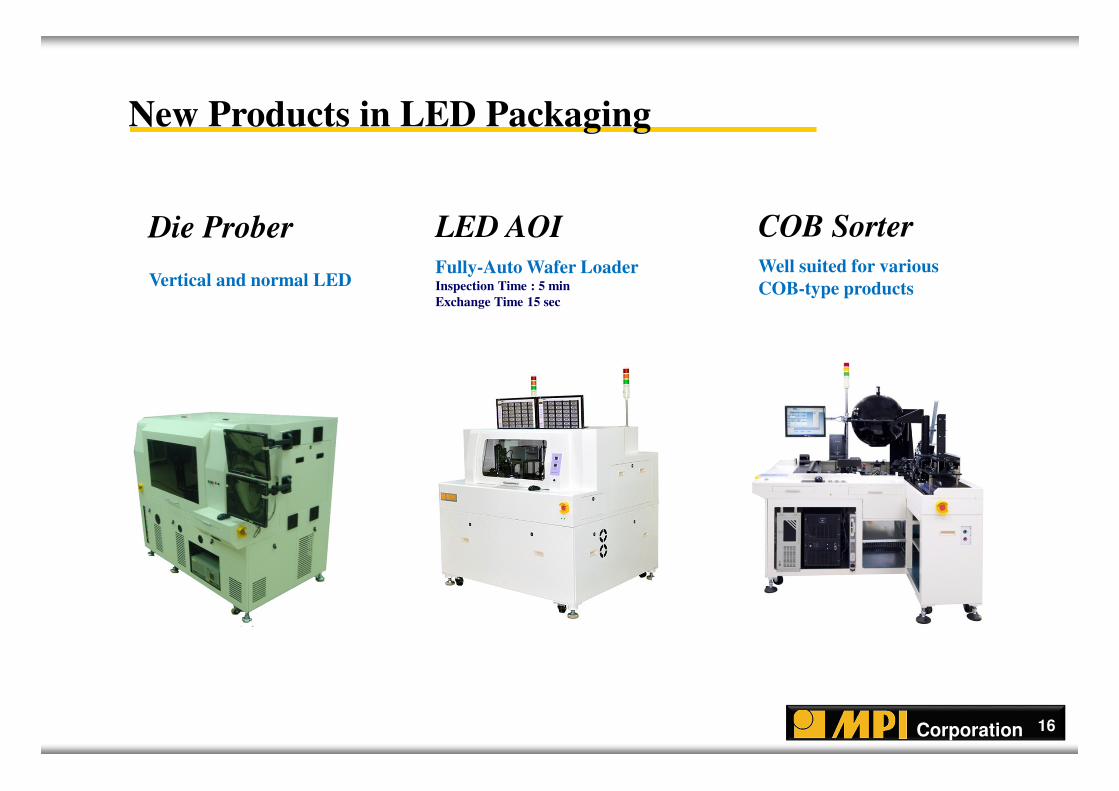
Die Prober
Vertical and normal LED
LED AOI
Fully-Auto Wafer LoaderInspection Time : 5 min
Exchange Time 15 sec
COB Sorter
New Products in LED Packaging
Well suited for various
COB-type products
Corporation 17
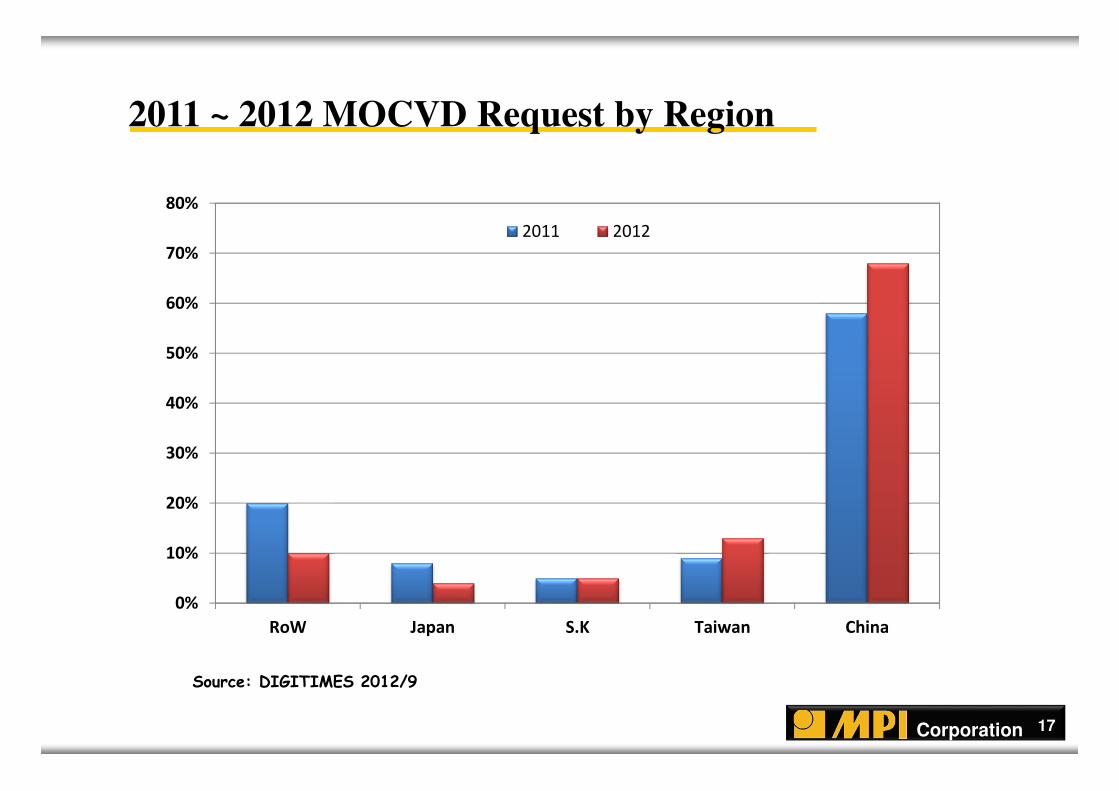
2011 ~ 2012 MOCVD Request by Region
Source: DIGITIMES 2012/9
0%
10%
20%
30%
40%
50%
60%
70%
80%
RoW Japan S.K Taiwan China
2011 2012
Corporation 18
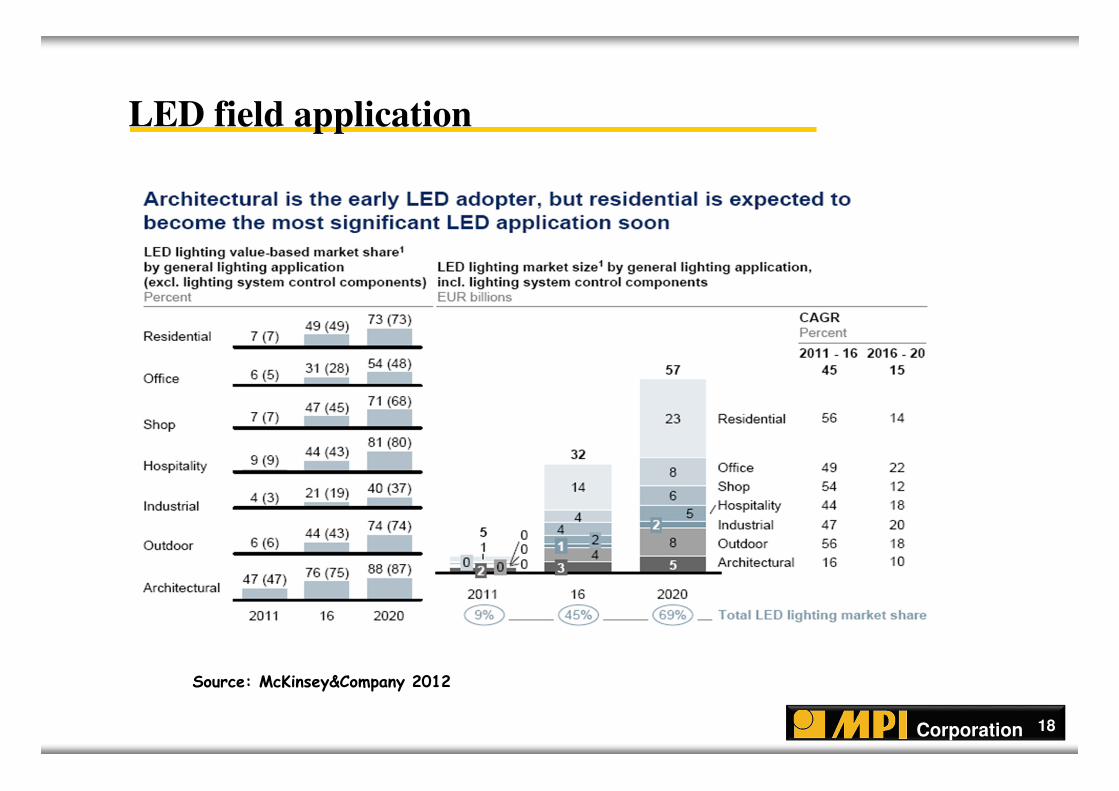
LED field application
Source: McKinsey&Company 2012
Corporation 19
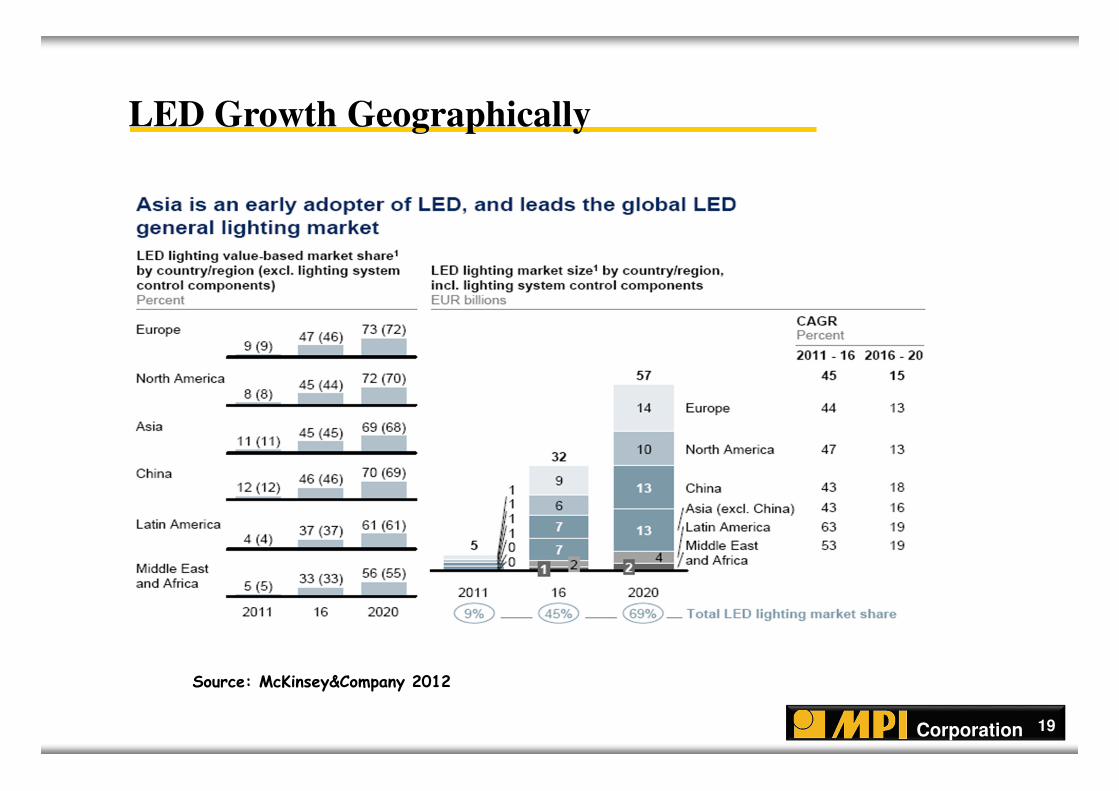
LED Growth Geographically
Source: McKinsey&Company 2012
Corporation 20
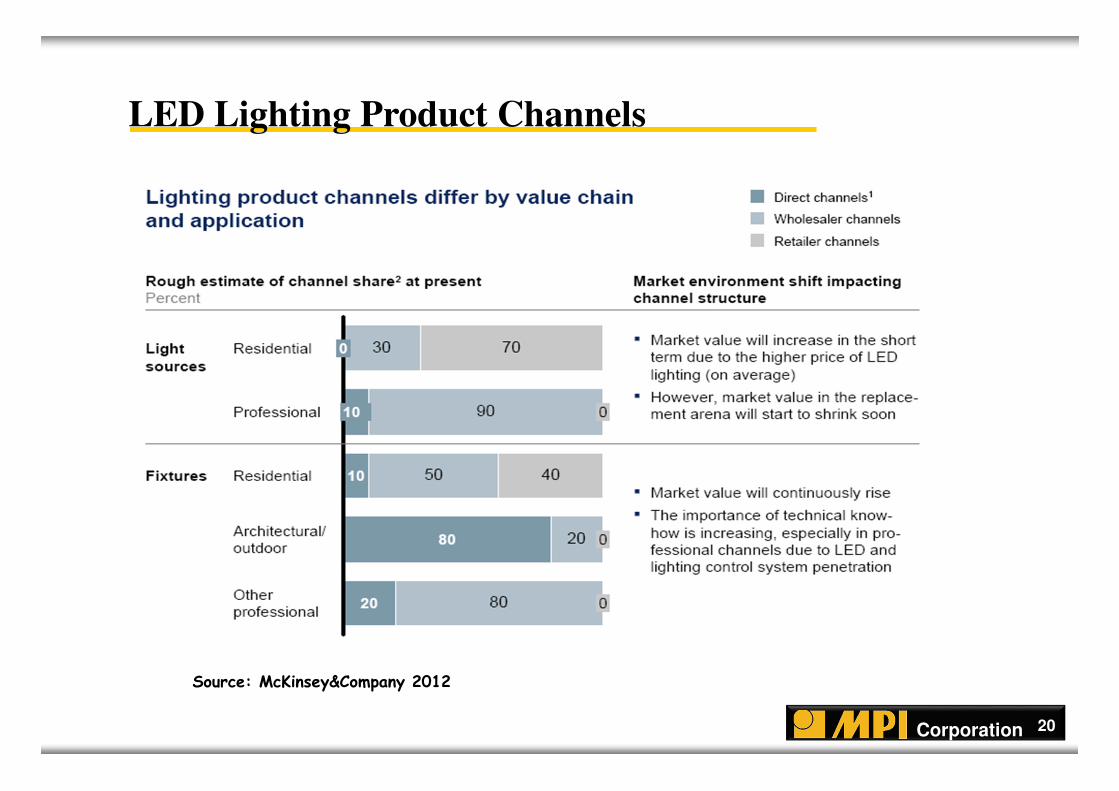
LED Lighting Product Channels
Source: McKinsey&Company 2012
Corporation
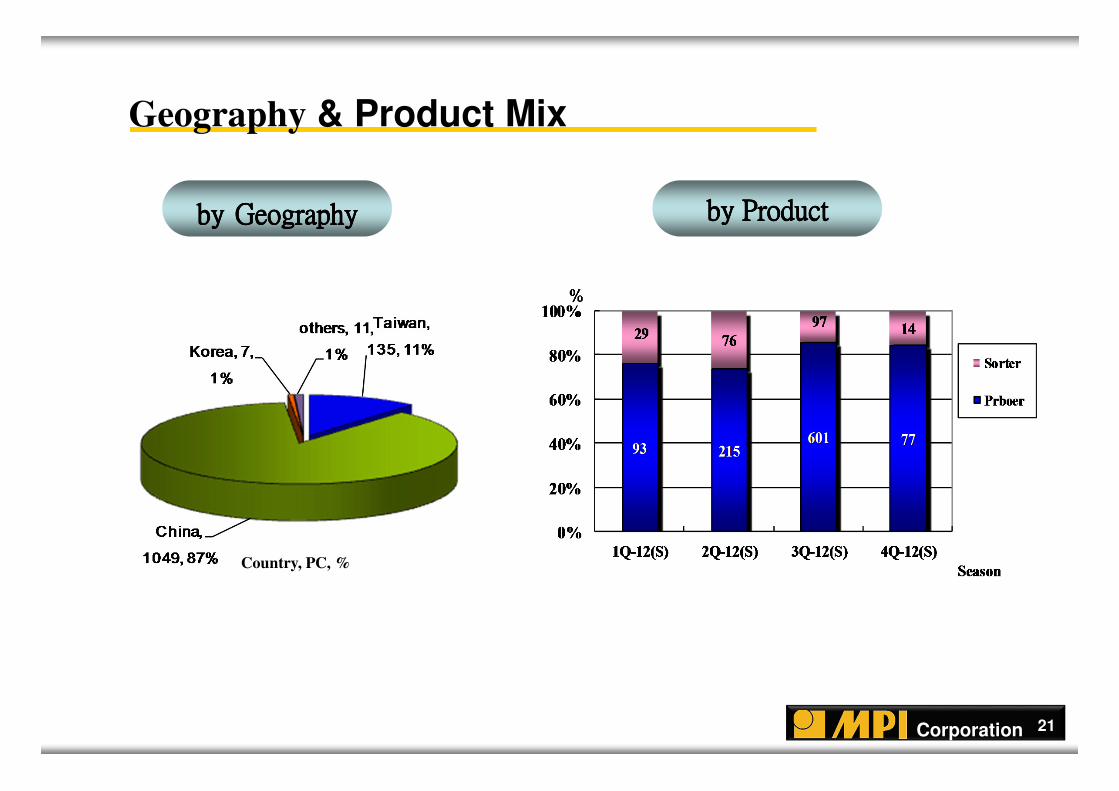
bybybyby GeographyGeographyGeographyGeography by Productby Productby Productby Product
Geography & Product Mix
Country, PC, %
21
Financial Statements
22
Corporation 23
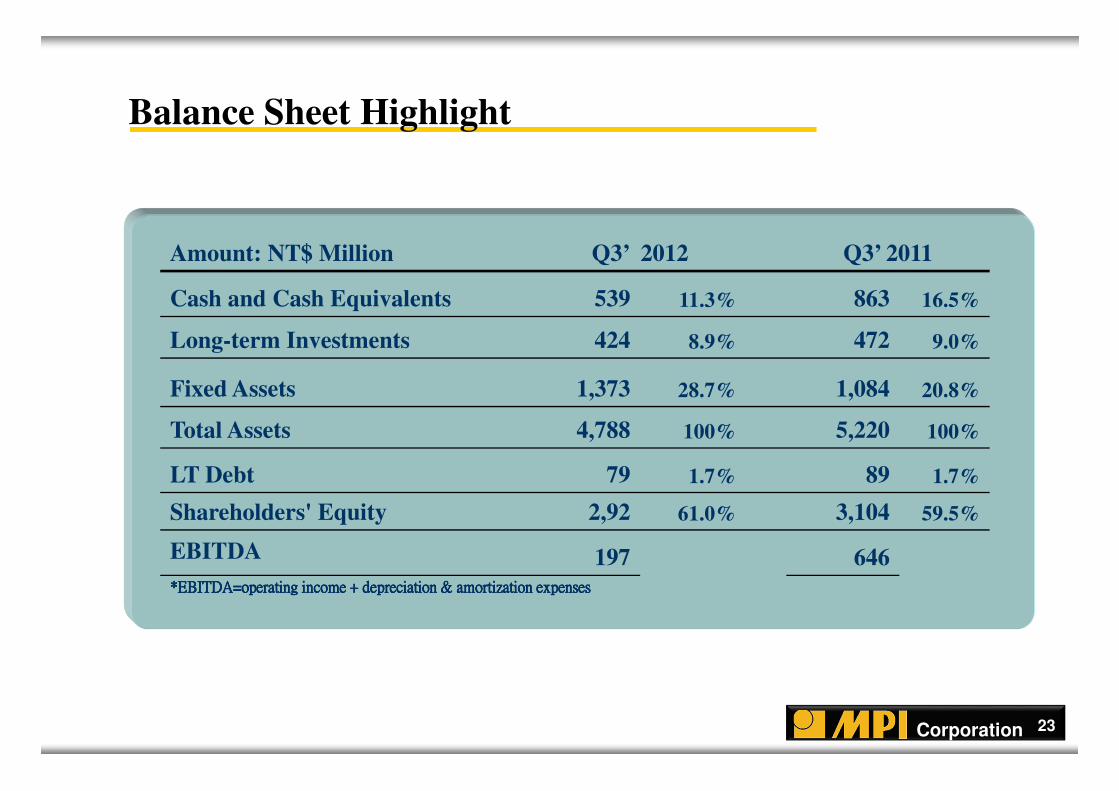
Balance Sheet Highlight
Amount: NT$ Million Q3’ 2012 Q3’ 2011
Cash and Cash Equivalents 539 11.3% 863 16.5%
Long-term Investments 424 8.9% 472 9.0%
Fixed Assets 1,373 28.7% 1,084 20.8%
Total Assets 4,788 100% 5,220 100%
LT Debt 79 1.7% 89 1.7%
Shareholders' Equity 2,92 61.0% 3,104 59.5%
EBITDA 197 646****EBITDA=operating income + depreciation & amortization expensesEBITDA=operating income + depreciation & amortization expensesEBITDA=operating income + depreciation & amortization expensesEBITDA=operating income + depreciation & amortization expenses
Corporation 24
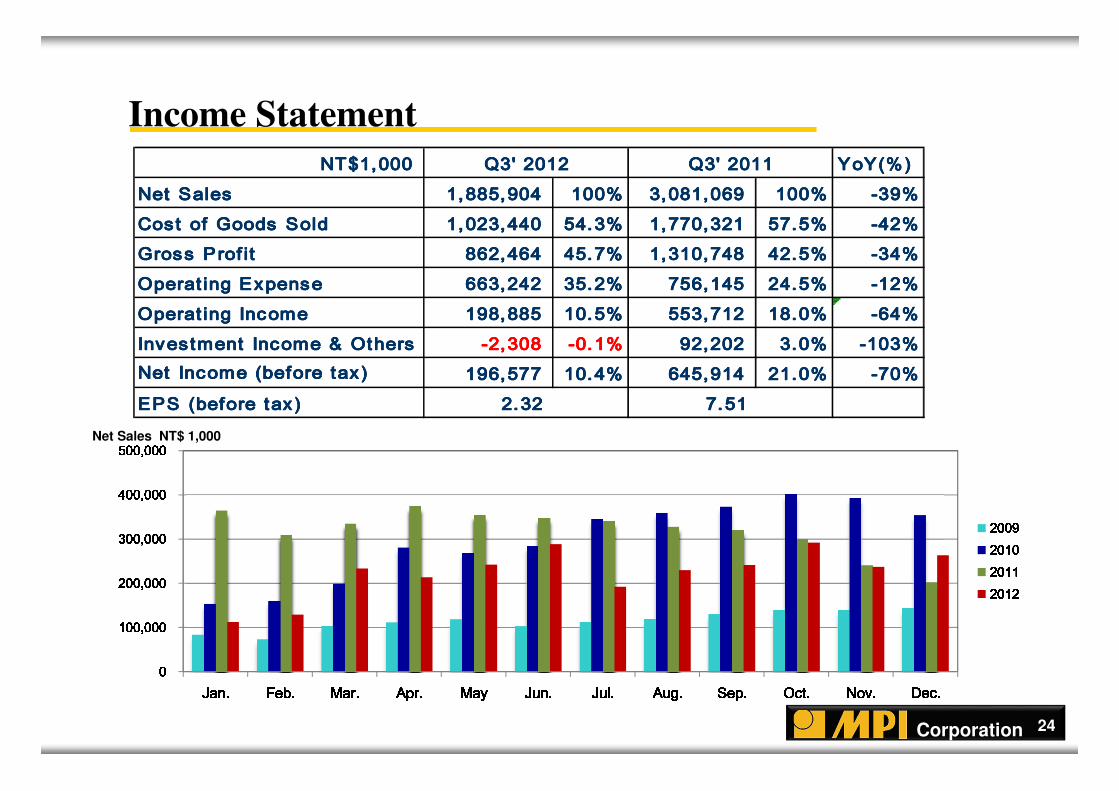
Income Statement
Net Sales NT$ 1,000
NT$1,000NT$1,000NT$1,000NT$1,000 YoY(%) YoY(%) YoY(%) YoY(%) Net Sales Net Sales Net Sales Net Sales 1,885,9041,885,9041,885,9041,885,904 100%100%100%100% 3,081,0693,081,0693,081,0693,081,069 100%100%100%100% -39%-39%-39%-39%Cost of Goods Sold Cost of Goods Sold Cost of Goods Sold Cost of Goods Sold 1,023,4401,023,4401,023,4401,023,440 54.3%54.3%54.3%54.3% 1,770,3211,770,3211,770,3211,770,321 57.5%57.5%57.5%57.5% -42%-42%-42%-42%Gross Profit Gross Profit Gross Profit Gross Profit 862,464862,464862,464862,464 45.7%45.7%45.7%45.7% 1,310,7481,310,7481,310,7481,310,748 42.5%42.5%42.5%42.5% -34%-34%-34%-34%Operating Expense Operating Expense Operating Expense Operating Expense 663,242663,242663,242663,242 35.2%35.2%35.2%35.2% 756,145756,145756,145756,145 24.5%24.5%24.5%24.5% -12%-12%-12%-12%Operating Income Operating Income Operating Income Operating Income 198,885198,885198,885198,885 10.5%10.5%10.5%10.5% 553,712553,712553,712553,712 18.0%18.0%18.0%18.0% -64%-64%-64%-64%Investment Income & OthersInvestment Income & OthersInvestment Income & OthersInvestment Income & Others -2,308-2,308-2,308-2,308 -0.1%-0.1%-0.1%-0.1% 92,20292,20292,20292,202 3.0%3.0%3.0%3.0% -103%-103%-103%-103%Net Income (before tax)Net Income (before tax)Net Income (before tax)Net Income (before tax) 196,577196,577196,577196,577 10.4%10.4%10.4%10.4% 645,914645,914645,914645,914 21.0%21.0%21.0%21.0% -70%-70%-70%-70%EPS (before tax)EPS (before tax)EPS (before tax)EPS (before tax)
Q3' 2012Q3' 2012Q3' 2012Q3' 2012 Q3' 2011Q3' 2011Q3' 2011Q3' 2011
2.322.322.322.32 7.517.517.517.51
0000100,000100,000100,000100,000200,000200,000200,000200,000300,000300,000300,000300,000400,000400,000400,000400,000500,000500,000500,000500,000
Jan.Jan.Jan.Jan. Feb.Feb.Feb.Feb. Mar.Mar.Mar.Mar. Apr.Apr.Apr.Apr. MayMayMayMay Jun.Jun.Jun.Jun. Jul.Jul.Jul.Jul. Aug.Aug.Aug.Aug. Sep.Sep.Sep.Sep. Oct.Oct.Oct.Oct. Nov.Nov.Nov.Nov. Dec.Dec.Dec.Dec.2009200920092009201020102010201020112011201120112012201220122012